home range size and movements of greater prairie-chickens
TRANSCRIPT
CHAPTER FOUR
Home Range Size and Movements of Greater Prairie-Chickens
Michael A. Patten, Christin L. Pruett, and Donald H. Wolfe
Abstract. Size of a home range is key to a species’ conservation and management. Estimates of home range size vary with movement patterns, which in turn vary with sex, age class, season, time of day, and habitat configuration, particularly extent of fragmentation. We describe variation in home range and movements in a grouse endemic to North American prairie, the Greater Prairie-Chicken (Tympanuchus cupido pinnatus). Our study area included a large, contiguous block of tall-grass prairie. We found that daylight movements varied with time of day: typically, birds were least active in the heat of midday and most active in the relative cool of morning and evening, a pattern consistent with sunrise and sunset, particularly in autumn, winter, and spring. The species’ lek and nesting biology predicted observed lulls in male movement in spring and female movement in summer; sexes are equally mobile at other seasons. Females had larger home ranges than
males, moved more frequently between activity centers, and moved greater maximum distances; therefore, females may be more susceptible to the negative effects of habitat fragmentation. Yearlings of both sexes tended to move more than adults. A synthesis of home range estimates from our work and past studies suggests there may be an inverse relationship between habitat continu-ity and home range sizes. Our results underscore the need to consider various environmental and other factors when estimating home range size. We also present preliminary evidence that habitat fragmentation may force prairie grouse to expand their home range, potentially decreasing survivor-ship through increased mortality from predation risk or energy expenditure.
Key Words: circadian rhythm, fragmentation, home range, movement, seasonality, Tympanu-chus cupido.
Patten, M. A., C. L. Pruett, and D. H. Wolfe. 2011. Home range size and movements of Greater Prairie-Chickens. Pp. 51–62 in B. K. Sandercock, K. Martin, and G. Segelbacher (editors). Ecology, conservation, and management of grouse. Studies in Avian Biology (no. 39), University of California Press, Berkeley, CA.
51
Sandercock_6480004_ch04.indd 51Sandercock_6480004_ch04.indd 51 6/24/11 5:28:03 PM6/24/11 5:28:03 PM
52
T he home range—the amount of physical space individuals need, on average, to sur-vive, grow, and reproduce—is a fundamen-
tal aspect of a species’ ecology and is crucial to an understanding of a species’ place in the ecosystem (i.e., its ecological niche). Moreover, it is difficult to develop meaningful management and conser-vation strategies for rare species if we lack a basic knowledge of their spatial needs (Belovsky 1987). Both movements and home ranges depend on a variety of endogenous and exogenous factors, including demographic status and local habitat and conditions ( Southwood 1977). From the organ-ism’s view, habitat can be continuous, patchy, or isolated, and large-bodied organisms generally require larger home ranges (Kelt and Van Vuren 1999, Peery 2000). Few habitats in North America are more fragmented and depleted than tallgrass prairie: Only ∼ 4% of this biome remains (Samson and Knopf 1996), with most remnants being small, widely scattered, and altered by human activity. As a result of this extensive alteration, the Greater Prairie-Chicken (Tympanuchus cupido pinnatus)—a species emblematic of tall-grass prairie—now survives on native grassland embedded in a matrix of pastures, cultivated fields, roads, fences, homesteads, and wood-lands. Most prairie chicken populations are of conservation concern, underscoring the need for a clear understanding of the species’ home range requirements and movement patterns (Niemuth, this volume, chapter 1). In this species, move-ment frequency and distance varies temporally with season or time of day (Robel et al. 1970, Hamerstrom and Hamerstrom 1973, Drobney and Sparrowe 1977); endogenously with demo-graphic factors such as sex, age, or breeding status (see Toepfer 1988); and exogenously with habitat extent and fragmentation. Early studies of movements and home ranges of birds relied on band recoveries, fortuitous sighting of marked individuals, or following individual flocks through a day (Hamerstrom and Hamerstrom 1949). These methods pro-duced important data but only allowed study of short-term, short-distance movement. The advent of lightweight radio transmitters in the 1960s greatly benefited the study of both the frequency and the distance of animal movement. Still, there have been relatively few telemetry studies on prairie grouse, most of them involving prairie
chickens in fragmented habitat or small blocks of prairie ( Hamerstrom and Hamerstrom 1949, Burger 1988, Toepfer 1988, Schroeder and Braun 1992a). Our objective was to estimate home range size for Greater Prairie-Chickens on a large block of unfragmented tallgrass prairie. We further sought to examine movement patterns at several time scales, ranging from within a day to among seasons to over the life span of an individual. This last effort allowed us to identify whether a prairie chicken’s center of activity—by which we mean the extent of the principal area used—was stable or changed over a bird’s life. We compared our findings to results from previous studies elsewhere in the species’ range, allowing us to postulate how home range size might be affected by habitat fragmentation. Given that our study area was a contiguous block of tallgrass prairie, we predicted our home range estimates would be smaller than in previous studies because in frag-mented areas energetic needs for maintenance, growth, and reproduction can be met equally in either a smaller contiguous block of suit-able habitat or in a larger mosaic of suitable and unsuitable habitats (Reiss 1988). We also exam-ined how movements vary with sex, age, season, and time of day, thus generating a better under-standing of the spatial ecology of the Greater Prairie-Chicken.
METHODS
Study Area
Our study area encompassed ∼ 450 km2 of tall-grass prairie in the Flint Hills of north-central Osage County, Oklahoma, its north edge abutting Kansas (36�46�–37�00� N, 96�22�–96�40� W). The Flint Hills ecoregion consists largely of unplowed tallgrass prairie, although much of this region is grazed heavily and burned annually ( Zimmerman 1997, With et al. 2008). Habitat in our study area was relatively homogenous prairie, with no culti-vation (�1% of the area has ever been cultivated), no significant development, and few fences. The few roads were primarily graded dirt or gravel without bordering ditches or embankments. Deciduous woodland (�5% of the area) occupied a small portion of the southeast corner of the area, chiefly occurring in narrow corridors along two creeks.
STUDIES IN AVIAN BIOLOGY NO. 39 Sandercock, Martin, and Segelbacher
Sandercock_6480004_ch04.indd 52Sandercock_6480004_ch04.indd 52 6/24/11 5:28:03 PM6/24/11 5:28:03 PM
HOME RANGE SIZE AND MOVEMENTS 53
Prescribed fires burned 60–80% of the area annually (Patten et al. 2007), generally in early spring (March–April). Cattle grazing usually fol-lowed burning, the predominant system being early intensive stocking: Steers are brought to the ranches for ∼ 100 days from April to July, allowing the range vegetation to recover in late summer and autumn (Smith and Owensby 1978). Cow–calf operations occupied ∼ 10% of the study area; such operations avoid annual burns and graze at a lower stocking rate through-out the year. A low density of American bison (Bison bison) grazed ∼ 5% of the study area year-round, all on the Nature Conservancy’s Tallgrass Prairie Preserve (in the southeastern quadrant), and blocks (�100 ha) of this preserve burned sporadically. A small fraction (1–5%) of the study area was hayed each year, chiefly in August. Rainfall during the study (1997–2000) exceeded (z � 0.44–1.42) the long-term (1949–2003) aver-age, but annual temperature centered on the average (z � –0.45–1.40).
Tracking
We radio-tagged and tracked Greater Prairie-Chickens year-round for a 3-year period, from April 1997 to July 2000. Birds were trapped at leks using walk-in funnel traps (Schroeder and Braun 1991) connected by 8-m zigzags of plas-tic drift fence. At first capture, birds were fitted with a bib-mounted radio transmitter and a loop antenna (AVM and Telemetry Solutions Inc.®) weighing 18 g, which was ∼ 2% of body mass (800–1000 g). We used feather wear and replace-ment to identify age classes (Wright and Hiatt 1943, Ammann 1944). Yearlings were birds �1 year old (we treated 1 July as the “birthday” for all birds), adults were birds �1 year old, some of which may have been 3–4 years old. Tracking equipment consisted of five-element, handheld Yagi antennas and ATS® model R-2000 or R-4000 receivers. We began tracking a bird the day it was captured; it was tracked thereafter as often as possible, averaging once every 3 days, at varying times of day. Over 99% of bird locations were from direct homing (�1% triangulation) and from �50 m distance. Roughly 17% of birds flushed, the majority during night trapping or being females at nests or with broods; no birds were pushed into new areas, and we have no rea-son to suspect that a flushed bird left its home
range. Two person-days per week were devoted to finding “lost” birds, defined as individuals not detected for two weeks, and we conducted study area–wide aerial transects for lost birds 5–6 times per year, extending 3–8 km beyond any tracked bird and often �25 km from previous locations. There are several sources of bias when esti-mating home range and maximum distances moved. Unless a marked bird is found dead, a bird’s life span is unknown, particularly if it is lost from the study area; range size and distance moved for lost birds may be larger than estimated (Sharp 2009). We determined if estimates of home ranges for birds eventu-ally found dead were systematically smaller than estimates for lost or dispersed birds, in each case using movement data up to our last confirmed location. Birds were also tracked for different durations. We evaluated sources of potential bias by regressing range size against two tracking measures: (1) the number of tracking records and (2) days elapsed between when a bird was first and last tracked. We log10-transformed home range estimates before per-forming each regression. We evaluated track-ing records versus home range by fitting a loess smooth (f � 0.5) to the data (see Cleveland and Devlin 1988).
Movements
We analyzed daily movement data from a sub-set of individuals tracked at 30-min intervals from within 1 hour of sunrise to within 1 hour of sunset. Because sunrise and sunset vary through the year, we obtained a variable number of locations—generally between 20 and 30—per bird-day of tracking. Of 185 tagged birds, we used only those 32 individuals with extensive data: 22 males (17 adult, 5 yearling) and 10 females (8 adult, 2 yearling). Linear distances were cal-culated between consecutive tracking locations. Maximum distance refers to the greatest distance between any two consecutive locations that a given individual moved. Because movement distances are not compara-ble when tracking intervals vary widely, we used only locations from nonoverlapping 3-day inter-vals. Our approach eliminates bias by restrict-ing data to equal intervals over which distances can be calculated between consecutive locations.
Sandercock_6480004_ch04.indd 53Sandercock_6480004_ch04.indd 53 6/24/11 5:28:03 PM6/24/11 5:28:03 PM
54 STUDIES IN AVIAN BIOLOGY NO. 39 Sandercock, Martin, and Segelbacher
Number of locations
Log 1
0 (h
ome
rang
e [h
a])
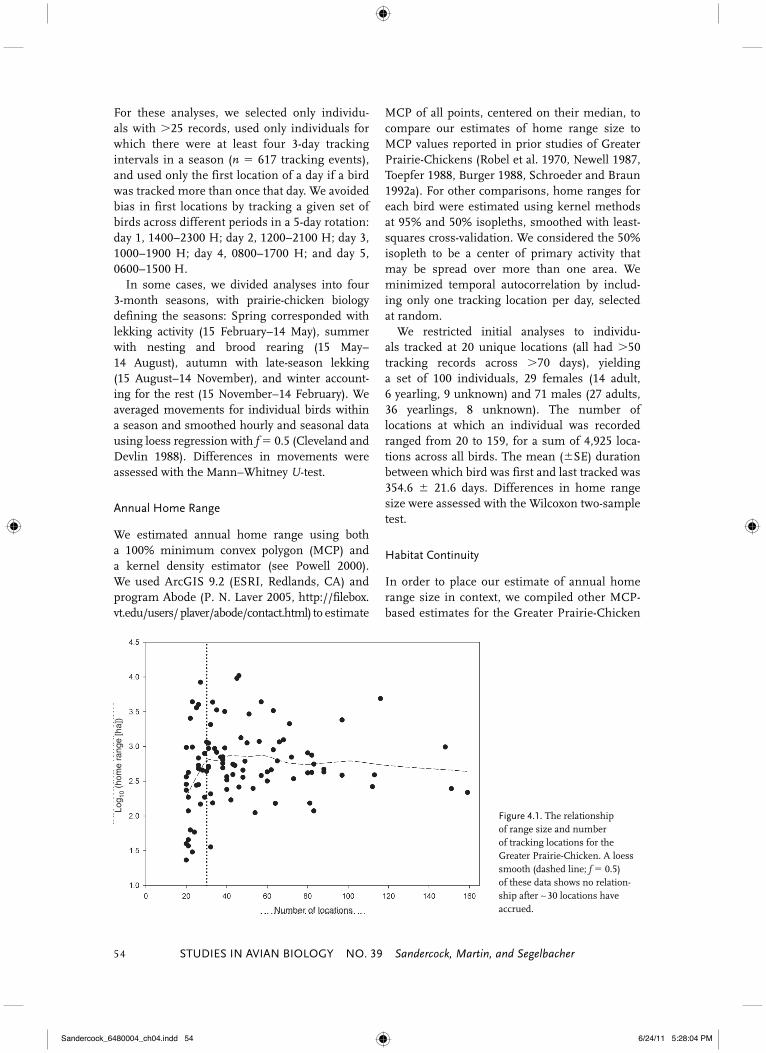
Figure 4.1. The relationship of range size and number of tracking locations for the Greater Prairie-Chicken. A loess smooth (dashed line; f � 0.5) of these data shows no relation-ship after ∼ 30 locations have accrued.
For these analyses, we selected only individu-als with �25 records, used only individuals for which there were at least four 3-day tracking intervals in a season (n � 617 tracking events), and used only the first location of a day if a bird was tracked more than once that day. We avoided bias in first locations by tracking a given set of birds across different periods in a 5-day rotation: day 1, 1400–2300 H; day 2, 1200–2100 H; day 3, 1000–1900 H; day 4, 0800–1700 H; and day 5, 0600–1500 H. In some cases, we divided analyses into four 3-month seasons, with prairie-chicken biology defining the seasons: Spring corresponded with lekking activity (15 February–14 May), summer with nesting and brood rearing (15 May–14 August), autumn with late-season lekking (15 August–14 November), and winter account-ing for the rest (15 November–14 February). We averaged movements for individual birds within a season and smoothed hourly and seasonal data using loess regression with f � 0.5 (Cleveland and Devlin 1988). Differences in movements were assessed with the Mann–Whitney U-test.
Annual Home Range
We estimated annual home range using both a 100% minimum convex polygon (MCP) and a kernel density estimator (see Powell 2000). We used ArcGIS 9.2 (ESRI, Redlands, CA) and program Abode (P. N. Laver 2005, http:// filebox.vt.edu/users/ plaver/abode/contact.html) to estimate
MCP of all points, centered on their median, to compare our estimates of home range size to MCP values reported in prior studies of Greater Prairie-Chickens (Robel et al. 1970, Newell 1987, Toepfer 1988, Burger 1988, Schroeder and Braun 1992a). For other comparisons, home ranges for each bird were estimated using kernel methods at 95% and 50% isopleths, smoothed with least-squares cross-validation. We considered the 50% isopleth to be a center of primary activity that may be spread over more than one area. We minimized temporal autocorrelation by includ-ing only one tracking location per day, selected at random. We restricted initial analyses to individu-als tracked at 20 unique locations (all had �50 tracking records across �70 days), yielding a set of 100 individuals, 29 females (14 adult, 6 yearling, 9 unknown) and 71 males (27 adults, 36 yearlings, 8 unknown). The number of locations at which an individual was recorded ranged from 20 to 159, for a sum of 4,925 loca-tions across all birds. The mean (�SE) duration between which bird was first and last tracked was 354.6 � 21.6 days. Differences in home range size were assessed with the Wilcoxon two-sample test.
Habitat Continuity
In order to place our estimate of annual home range size in context, we compiled other MCP-based estimates for the Greater Prairie-Chicken
Sandercock_6480004_ch04.indd 54Sandercock_6480004_ch04.indd 54 6/24/11 5:28:04 PM6/24/11 5:28:04 PM
HOME RANGE SIZE AND MOVEMENTS 55
(T. c. pinnatus subspecies only) from Newell (1987), Toepfer (1988), and Burger (1988); the last two studies present estimates from two sites each. Neither Robel et al. (1970) nor Schroeder and Braun (1992a) reported annual home range sizes, but we used their data on seasonal home range size. For each study site, we used the larg-est block of unbroken prairie-chicken habitat as an index for habitat continuity. We assumed that the relationship between this continuity index and home range size would be an inverse poly-nomial curve of the form f (x) � y0 � a/x, where y0 marks the inflection point and a the slope parameter.
RESULTS
Potential Sources of Bias
Estimated home range size, regardless of method, was not related to the number of track-ing locations (95% kernel: r 2 � 0.01, F1,98 � 0.85, P � 0.35; MCP: r2 � 0.001, F1,98 � 0.10, P � 0.70), although the slope flattened only after ∼30 loca-tions had accumulated (Fig. 4.1). Accordingly, our
SummerSpring
Autumn Winter
FemaleMale
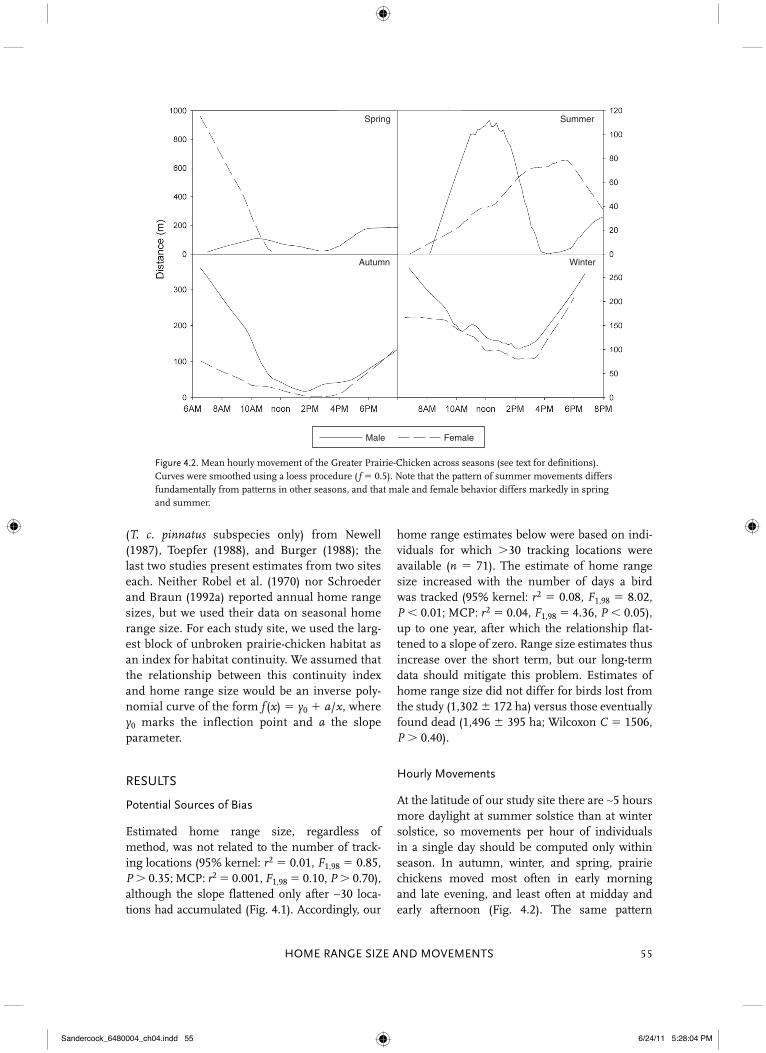
Figure 4.2. Mean hourly movement of the Greater Prairie-Chicken across seasons (see text for definitions). Curves were smoothed using a loess procedure ( f � 0.5). Note that the pattern of summer movements differs fundamentally from patterns in other seasons, and that male and female behavior differs markedly in spring and summer.
home range estimates below were based on indi-viduals for which �30 tracking locations were available (n � 71). The estimate of home range size increased with the number of days a bird was tracked (95% kernel: r 2 � 0.08, F1,98 � 8.02, P � 0.01; MCP: r 2 � 0.04, F1,98 � 4.36, P � 0.05), up to one year, after which the relationship flat-tened to a slope of zero. Range size estimates thus increase over the short term, but our long-term data should mitigate this problem. Estimates of home range size did not differ for birds lost from the study (1,302 � 172 ha) versus those eventually found dead (1,496 � 395 ha; Wilcoxon C � 1506, P � 0.40).
Hourly Movements
At the latitude of our study site there are ∼5 hours more daylight at summer solstice than at winter solstice, so movements per hour of individuals in a single day should be computed only within season. In autumn, winter, and spring, prairie chickens moved most often in early morning and late evening, and least often at midday and early afternoon (Fig. 4.2). The same pattern
Sandercock_6480004_ch04.indd 55Sandercock_6480004_ch04.indd 55 6/24/11 5:28:04 PM6/24/11 5:28:04 PM
STUDIES IN AVIAN BIOLOGY NO. 39 Sandercock, Martin, and Segelbacher56
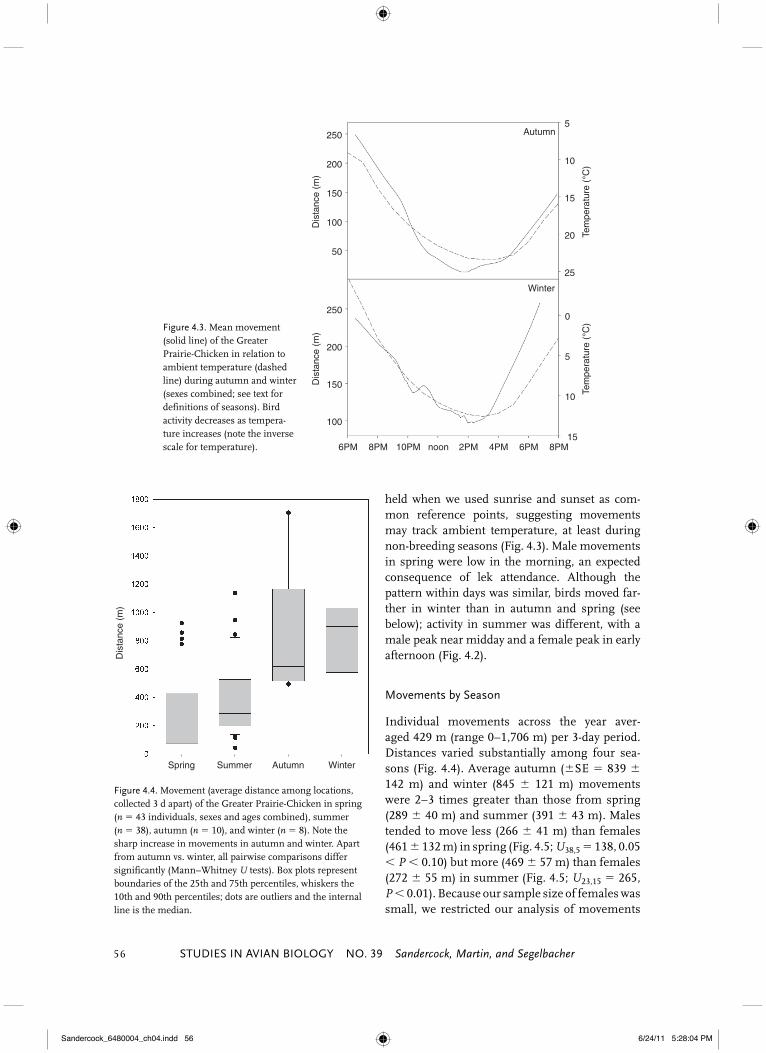
held when we used sunrise and sunset as com-mon reference points, suggesting movements may track ambient temperature, at least during non-breeding seasons (Fig. 4.3). Male movements in spring were low in the morning, an expected consequence of lek attendance. Although the pattern within days was similar, birds moved far-ther in winter than in autumn and spring (see below); activity in summer was different, with a male peak near midday and a female peak in early afternoon (Fig. 4.2).
Movements by Season
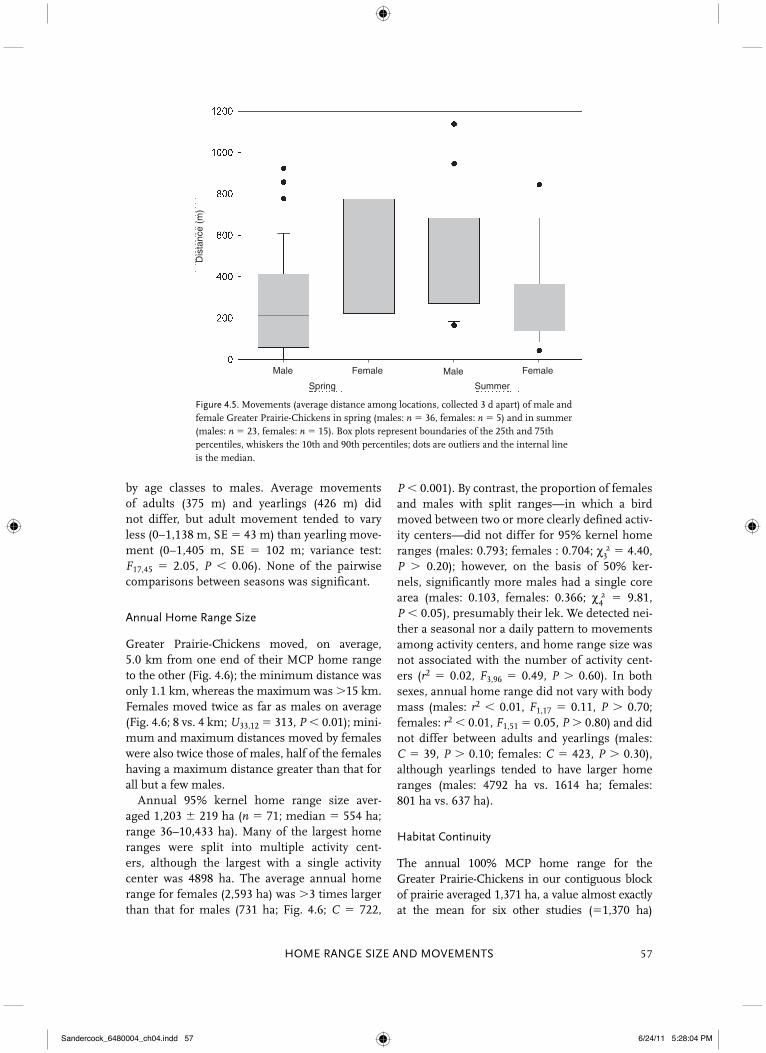
Individual movements across the year aver-aged 429 m (range 0–1,706 m) per 3-day period. Distances varied substantially among four sea-sons (Fig. 4.4). Average autumn (�SE � 839 � 142 m) and winter (845 � 121 m) movements were 2–3 times greater than those from spring (289 � 40 m) and summer (391 � 43 m). Males tended to move less (266 � 41 m) than females (461 � 132 m) in spring (Fig. 4.5; U38,5 � 138, 0.05 � P � 0.10) but more (469 � 57 m) than females (272 � 55 m) in summer (Fig. 4.5; U23,15 � 265, P � 0.01). Because our sample size of females was small, we restricted our analysis of movements
Autumn
Winter
25
20 Tem
pera
ture
(°C
)Te
mpe
ratu
re (
°C)
15
10
5
158PM6PM4PM2PMnoon10PM8PM6PM
250
250
200
150
Dis
tanc
e (m
)D
ista
nce
(m)
100
50
200
150
100
10
5
0Figure 4.3. Mean movement (solid line) of the Greater Prairie-Chicken in relation to ambient temperature (dashed line) during autumn and winter (sexes combined; see text for definitions of seasons). Bird activity decreases as tempera-ture increases (note the inverse scale for temperature).
Figure 4.4. Movement (average distance among locations, collected 3 d apart) of the Greater Prairie-Chicken in spring (n � 43 individuals, sexes and ages combined), summer (n � 38), autumn (n � 10), and winter (n � 8). Note the sharp increase in movements in autumn and winter. Apart from autumn vs. winter, all pairwise comparisons differ significantly (Mann–Whitney U tests). Box plots represent boundaries of the 25th and 75th percentiles, whiskers the 10th and 90th percentiles; dots are outliers and the internal line is the median.
Spring Summer Autumn Winter
Dis
tanc
e (m
)
Sandercock_6480004_ch04.indd 56Sandercock_6480004_ch04.indd 56 6/24/11 5:28:04 PM6/24/11 5:28:04 PM
HOME RANGE SIZE AND MOVEMENTS 57
by age classes to males. Average movements of adults (375 m) and yearlings (426 m) did not differ, but adult movement tended to vary less (0–1,138 m, SE � 43 m) than yearling move-ment (0–1,405 m, SE � 102 m; variance test: F17,45 � 2.05, P � 0.06). None of the pairwise comparisons between seasons was significant.
Annual Home Range Size
Greater Prairie-Chickens moved, on average, 5.0 km from one end of their MCP home range to the other (Fig. 4.6); the minimum distance was only 1.1 km, whereas the maximum was �15 km. Females moved twice as far as males on average (Fig. 4.6; 8 vs. 4 km; U33,12 � 313, P � 0.01); mini-mum and maximum distances moved by females were also twice those of males, half of the females having a maximum distance greater than that for all but a few males. Annual 95% kernel home range size aver-aged 1,203 � 219 ha (n � 71; median � 554 ha; range 36–10,433 ha). Many of the largest home ranges were split into multiple activity cent-ers, although the largest with a single activity center was 4898 ha. The average annual home range for females (2,593 ha) was �3 times larger than that for males (731 ha; Fig. 4.6; C � 722,
Figure 4.5. Movements (average distance among locations, collected 3 d apart) of male and female Greater Prairie-Chickens in spring (males: n � 36, females: n � 5) and in summer (males: n � 23, females: n � 15). Box plots represent boundaries of the 25th and 75th percentiles, whiskers the 10th and 90th percentiles; dots are outliers and the internal line is the median.
Spring Summer
Male MaleFemale Female
Dis
tanc
e (m
)
P � 0.001). By contrast, the proportion of females and males with split ranges—in which a bird moved between two or more clearly defined activ-ity centers—did not differ for 95% kernel home ranges (males: 0.793; females : 0.704; χ 3 2 � 4.40, P � 0.20); however, on the basis of 50% ker-nels, significantly more males had a single core area (males: 0.103, females: 0.366; χ 4 2 � 9.81, P � 0.05), presumably their lek. We detected nei-ther a seasonal nor a daily pattern to movements among activity centers, and home range size was not associated with the number of activity cent-ers (r2 � 0.02, F3,96 � 0.49, P � 0.60). In both sexes, annual home range did not vary with body mass (males: r2 � 0.01, F1,17 � 0.11, P � 0.70; females: r2 � 0.01, F1,51 � 0.05, P � 0.80) and did not differ between adults and yearlings (males: C � 39, P � 0.10; females: C � 423, P � 0.30), although yearlings tended to have larger home ranges (males: 4792 ha vs. 1614 ha; females: 801 ha vs. 637 ha).
Habitat Continuity
The annual 100% MCP home range for the Greater Prairie-Chickens in our contiguous block of prairie averaged 1,371 ha, a value almost exactly at the mean for six other studies (�1,370 ha)
Sandercock_6480004_ch04.indd 57Sandercock_6480004_ch04.indd 57 6/24/11 5:28:04 PM6/24/11 5:28:04 PM

STUDIES IN AVIAN BIOLOGY NO. 39 Sandercock, Martin, and Segelbacher58
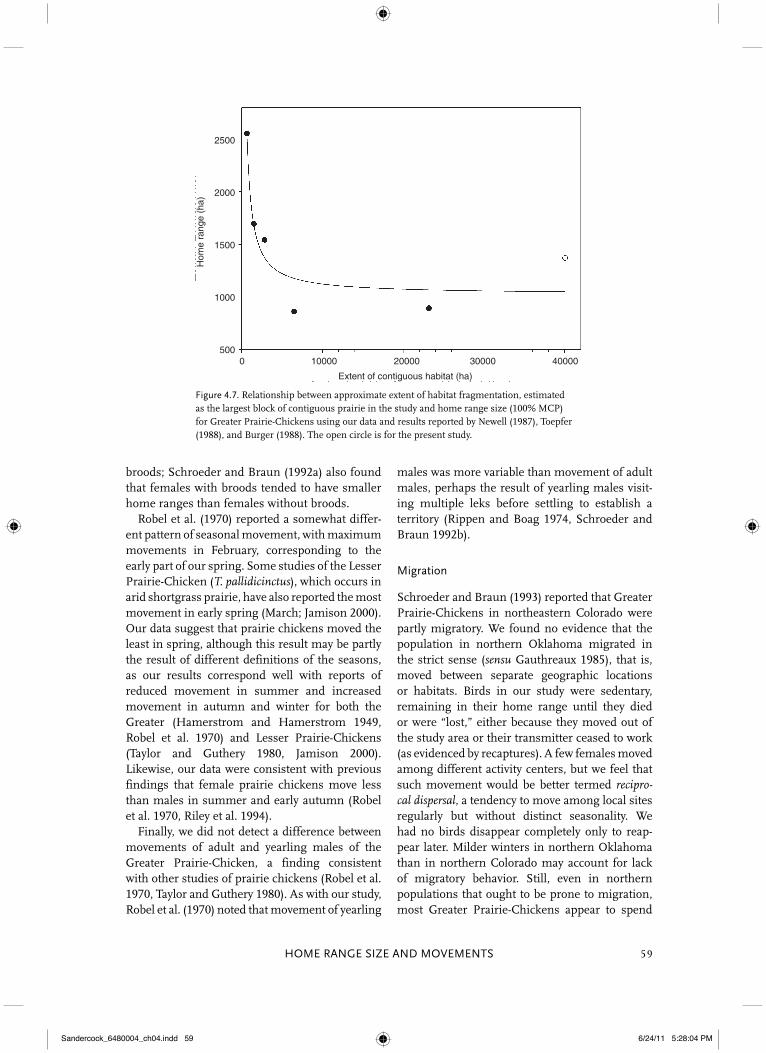
across a range of fragmented prairie (Fig. 4.7). An inverse polynomial (y0 � 1,025.4, a � 986,465.0) indicated that extent of fragmentation explained much of the variance in home range size (r2 � 0.83). The curve’s transition point implies that home range size is stable at �4,000 ha of contiguous hab-itat but increases sharply below ∼ 3,000 ha.
DISCUSSION
On average, the Greater Prairie-Chicken’s pat-tern of movements across a day is like that of most diurnal endotherms: extensive morning and evening activity bracketing a midday lull (Rensing
and Ruoff 2002). Hamerstrom and Hamerstrom (1949) noted a similar pattern, with movement in morning from the feeding area to a midday loafing area, then back to the feeding area in evening shortly before going to roost. We found diurnal patterns to be fairly consistent even when day length varied among seasons. Accordingly, it seems reasonable to conclude that, at least outside the breeding season, the movements are driven partly by thermoregulation and, if so, should track ambient temperature (Fig. 4.3), which climbs from dawn until early afternoon, then drops to a low in the middle of the night. Yet it is possible that the birds respond directly to photoperiod, meaning the association between temperature and move-ment is spurious—both measures simply vary with time of day. Still, we noted more movement in winter, perhaps because food is dispersed more widely and cold temperatures reduce the risk of heat stress.
Seasonal Movements
Variation in seasonal movements cannot be attributed solely to climate—it depends also on the Greater Prairie-Chicken’s biology and their environment. For example, movement by both sexes is reduced during the late summer molt of flight feathers (Schroeder and Braun 1992a). Burger (1988) noted that hourly movement peaked in autumn and winter, a pattern we also documented (Fig. 4.4). Between spring and sum-mer, males and females reverse their propensity to move (Fig. 4.5). A male prairie grouse spends most of his time at a lek in spring (Hamerstrom and Hamerstrom 1949, Giesen 1997), limiting his movement. Lekking male sage grouse lose a great deal of fat during the energetically demanding courtship period (Vehrencamp et al. 1989), so in summer they primarily forage. Females visit leks only briefly in spring, but by summer a female is tied to her nest or brood, limiting her movement at that season. Greater Prairie-Chickens have precocial young, but chicks cannot fly until two weeks of age, so even after completing incubation a female’s move-ments are restricted by the distance her chicks can walk safely. Burger (1988) reported a similar reduction in female movement in summer, about half as much as in autumn and winter. He fur-ther reported a significant difference in summer movement between females with and without
MaleFemale
Max
imum
dis
tanc
e m
oved
(km
)H
ome
rang
e si
ze (
ha)
6000
5000
4000
3000
2000
1000
0
15
10
5
0
Figure 4.6. Size of 95% kernel home range (males: n � 53, females: n � 18) and maximum distance moved (males: n � 33, females: n � 11) by Greater Prairie-Chickens with �30 tracking locations. Box plots represent the 25th and 75th percentiles, whiskers the 10th and 90th percentiles, and dots 5th and 95th percentiles; the internal line is the median.
Sandercock_6480004_ch04.indd 58Sandercock_6480004_ch04.indd 58 6/24/11 5:28:04 PM6/24/11 5:28:04 PM
HOME RANGE SIZE AND MOVEMENTS 59
broods; Schroeder and Braun (1992a) also found that females with broods tended to have smaller home ranges than females without broods. Robel et al. (1970) reported a somewhat differ-ent pattern of seasonal movement, with maximum movements in February, corresponding to the early part of our spring. Some studies of the Lesser Prairie-Chicken (T. pallidicinctus), which occurs in arid shortgrass prairie, have also reported the most movement in early spring (March; Jamison 2000). Our data suggest that prairie chickens moved the least in spring, although this result may be partly the result of different definitions of the seasons, as our results correspond well with reports of reduced movement in summer and increased movement in autumn and winter for both the Greater (Hamerstrom and Hamerstrom 1949, Robel et al. 1970) and Lesser Prairie-Chickens (Taylor and Guthery 1980, Jamison 2000). Likewise, our data were consistent with previous findings that female prairie chickens move less than males in summer and early autumn (Robel et al. 1970, Riley et al. 1994). Finally, we did not detect a difference between movements of adult and yearling males of the Greater Prairie-Chicken, a finding consistent with other studies of prairie chickens (Robel et al. 1970, Taylor and Guthery 1980). As with our study, Robel et al. (1970) noted that movement of yearling
Figure 4.7. Relationship between approximate extent of habitat fragmentation, estimated as the largest block of contiguous prairie in the study and home range size (100% MCP) for Greater Prairie-Chickens using our data and results reported by Newell (1987), Toepfer (1988), and Burger (1988). The open circle is for the present study.
Extent of contiguous habitat (ha)
Hom
e ra
nge
(ha)
2500
2000
1500
1000
5000 10000 20000 30000 40000
males was more variable than movement of adult males, perhaps the result of yearling males visit-ing multiple leks before settling to establish a territory ( Rippen and Boag 1974, Schroeder and Braun 1992b).
Migration
Schroeder and Braun (1993) reported that Greater Prairie-Chickens in northeastern Colorado were partly migratory. We found no evidence that the population in northern Oklahoma migrated in the strict sense (sensu Gauthreaux 1985), that is, moved between separate geographic locations or habitats. Birds in our study were sedentary, remaining in their home range until they died or were “lost,” either because they moved out of the study area or their transmitter ceased to work (as evidenced by recaptures). A few females moved among different activity centers, but we feel that such movement would be better termed recipro-cal dispersal, a tendency to move among local sites regularly but without distinct seasonality. We had no birds disappear completely only to reap-pear later. Milder winters in northern Oklahoma than in northern Colorado may account for lack of migratory behavior. Still, even in northern populations that ought to be prone to migration, most Greater Prairie-Chickens appear to spend
Sandercock_6480004_ch04.indd 59Sandercock_6480004_ch04.indd 59 6/24/11 5:28:04 PM6/24/11 5:28:04 PM
STUDIES IN AVIAN BIOLOGY NO. 39 Sandercock, Martin, and Segelbacher60
their entire lives in a small area ( Hamerstrom and Hamerstrom 1949).
Annual Home Range
In interspecific comparisons of lekking grouse, male territory size is inversely related to female home range size (Bradbury et al. 1986). If home range size is proportional to territory size, then this relationship may imply that a male’s home range is smaller than a female’s. In our study, female Greater Prairie-Chickens had larger home ranges than males. In Wisconsin and northeast-ern Colorado, female Greater Prairie-Chickens likewise tended to have larger home ranges than males (Toepfer 1988, Schroeder and Braun 1992a); however, Giesen (1997) found no differ-ence in home range size between sexes of the Sharp-tailed Grouse (T. phasianellus). Relative to males, female Greater Prairie- Chickens moved significantly farther and more often between activity centers, a finding in agreement with past research (Hamerstrom and Hamerstrom 1949, 1973; Toepfer 1988; Schroeder and Braun 1993). Increased movements may have both costs and ben-efits. Annual survival and reproductive success of female prairie chickens may be related negatively to their amount of movement (Burger 1988), although a female may place her nest farther from the lek where she was inseminated than from the nearest lek (Wakkinen et al. 1992, Aldridge and Brigham 2001). Neither we nor Schroeder and Braun (1992a, 1993) found significant differences in home range size among age classes, although in each case year-lings tended to have larger home ranges.
Habitat Continuity
Fragmentation depends on scale and on the organism under study. We follow Franklin et al. (2002) in defining habitat fragmentation as “the discontinuity, resulting from a given set of mecha-nisms, in the spatial distribution of resources and conditions present in an area at a given scale that affects occupancy, reproduction, or survival in a particular species.” Under this view, anthropogenic habitat alteration that results in discontinuity can have a profound effect on an animal’s home range requirements (Haskell et al. 2002). Habitat altera-tion and fragmentation may unduly influence an organism’s movements, either by restricting them or by forcing the organism to move farther to find food, shelter, or a mate (McNab 1963, Herfindal
et al. 2005). This restriction includes features that affect an organism’s perception of contiguity, such as erection of high-tension power lines across prairie (Pruett et al. 2009a, 2009b). We could only approximate extent of frag-mentation in other studies, but our survey sug-gests a negative relationship between extent of contiguous habitat and size of the home range (Fig. 4.7). Excepting when blocks become too small to sustain a population (Winter and Faaborg 1999), we posit that a prairie chicken requires a larger home range in fragmented habitat because it must move farther (see Ryan et al. 1998) and more often to locate food, suitable cover, and safe nesting and roosting sites. This pattern has been implied elsewhere for the Greater Prairie-Chicken: Toepfer (1988) noted that home range was smaller with a “closer year-round proximity of food and cover”; Schroeder and Braun (1992a) reported a tendency for increased home range with greater distance between cover and nests or leks; Svedarsky and Van Amburg (1996) attributed larger egg-laying ranges to wider spacing of cover, and Ryan et al. (1998) observed that “greater dis-persion of native prairie in the mosaic area was associated with . . . greater movement of broods.” Beyond energetic costs, extensive movement may increase mortality risk, whether from increased exposure to predators or increased probability of collision with fence lines or other anthropogenic structures (e.g., Patten et al. 2005a, Wolfe et al. 2007, McNew et al., this volume, chapter 19).
CONCLUSIONS
An apparent negative relationship between habi-tat continuity and home range size suggests a possible mechanism by which populations of the Greater Prairie-Chicken decline as habitat frag-mentation increases: It is an indirect result of increased mortality imposed on the birds because they must expand their home ranges. Females, the more peripatetic sex (Fig. 4.6), may be particu-larly susceptible. On the basis of seasonal and cir-cadian movements (Figs. 4.2–4.5; see also Robel et al. 1970), we predict that the dangers of increased movement in fragmented landscapes may be mag-nified in winter, in the morning and evening, and for females. A substantial increase in female mor-tality could doom a population to extinction ( Patten et al. 2005a). Indeed, a preliminary analysis of our data implies that survival probability decreases as home range increases (Cox regression: Wald
Sandercock_6480004_ch04.indd 60Sandercock_6480004_ch04.indd 60 6/24/11 5:28:04 PM6/24/11 5:28:04 PM
HOME RANGE SIZE AND MOVEMENTS 61
χ2 � 5.98, P � 0.02). Increasingly fragmented habitat could also impair a yearling male’s ability to locate leks with available territories, jeopard-izing long-term lek persistence, and may limit the extent to which a brooding female can locate enough food and shelter for growing chicks. Management strategies should focus on mini-mizing further fragmentation of the tallgrass prairie, including fragmentation from the birds’ perspective (e.g., Pruett et al. 2009b). Limiting direct loss of habitat is an obvious step, but con-tinuity may be reduced by other means, such as extensive spring burning or an increase in fences (Patten et al. 2005a, Reinking 2005). Our data also suggest a potential impact of reducing cover: Thermoregulation may play a key role in habitat selection by prairie grouse (figure 3 of Patten et al. 2005b). Habitat restoration may address these potential problems by ensuring that there is ade-quate vegetative cover, particularly at key seasons, for long-term survival and reproduction.
ACKNOWLEDGMENTS
Research was funded in part by Wildlife Restoration Program Grant W146R from the Oklahoma Depart-ment of Wildlife Conservation (ODWC) and a grant from the U.S. Fish and Wildlife Service. We received additional financial support from World Publishing, Conoco-Phillips, the Kenneth S. Adams Foundation, Arrow Trucking, and various private donors. We appreciate the efforts of the field technicians who col-lected data under difficult field conditions. We thank the land owners—especially The Nature Conservancy, ODWC, National Farms, Sooner Land Company, Paul Jones, and Lincoln Robinson Ranch—who allowed us to conduct research on their property. We thank David A. Wiedenfeld for preliminary analyses of some of the data and Robert J. Robel, Brett K. Sandercock, Michael A. Schroeder, and several referees for critical reviews of earlier drafts of this paper.
LITERATURE CITED
Aldridge, C. L., and R. M. Brigham. 2001. Nesting and reproductive activities of Greater Sage-Grouse in a declining northern fringe population. Condor 103:537–543.
Ammann, G. A. 1944. Determining age of Pinnated and Sharp-tailed Grouses. Journal of Wildlife Management 8:170–172.
Belovsky, G. E. 1987. Extinction models and mamma-lian persistence. Pp. 35–57 in M. E. Soulé (editor), Viable populations for conservation. Cambridge University Press, Cambridge, UK.
Bradbury, J., R. Gibson, and I. M. Tsai. 1986. Hotspots and the evolution of leks. Animal Behaviour 34:1694–1709.
Burger, L. W., Jr. 1988. Movements, home range, and survival of female Greater Prairie-Chickens in relation to habitat pattern. M.S. thesis, University of Missouri, Columbia, MO.
Cleveland, W. S., and S. J. Devlin. 1988. Locally weighted regression: an approach to regression analysis by local fitting. Journal of the American Statistical Association 83:596–610.
Drobney, R. D., and R. D. Sparrowe. 1977. Land use relationships and movements of Greater Prairie Chickens in Missouri. Transactions of the Missouri Academy of Science 10–11:146–160.
Franklin, A. B., B. R. Noon, and T. L. George. 2002. What is habitat fragmentation? Studies in Avian Biology 25:20–29.
Gauthreaux, S. A., Jr. 1985. Migration. Pp. 232–258 in O. S. Pettingill, Jr. (editor), Ornithology in labora-tory and field. Academic Press, San Diego, CA.
Giesen, K. M. 1997. Seasonal movements, home ranges, and habitat use by Columbian Sharp-tailed Grouse in Colorado. Colorado Division of Wildlife Special Report 72.
Hamerstrom, F. N., Jr., and F. Hamerstrom. 1949. Daily and seasonal movements of Wisconsin Prairie Chickens. Auk 66:313–337.
Hamerstrom, F. N., Jr., and F. Hamerstrom. 1973. The prairie chicken in Wisconsin: highlights of a 22-year study of counts, behavior, movements, turn-over and habitat. Wisconsin Department of Natural Resources Technical Bulletin 64.
Haskell, J. P., M. E. Ritchie, and H. Olff. 2002. Fractal geometry predicts varying body size scaling rela-tionships for mammal and bird home ranges. Nature 418:527–530.
Herfindal, I., J. D. C. Linnell, J. Odden, E. B. Nilsen, and R. Andersen. 2005. Prey density, environmental productivity and home-range size in the Eurasian lynx (Lynx lynx). Journal of Zoology 265:63–71.
Jamison, B. E. 2000. Lesser Prairie-Chicken chick survival, adult survival, and habitat selection and movements of males in fragmented rangelands of southwestern Kansas. M.S. thesis, Kansas State University, Manhattan, KS.
Kelt, D. A., and D. H. Van Vuren. 1999. Energetic con-straints and the relationship between body size and home range area in mammals. Ecology 80:337–340.
McNab, B. K. 1963. Bioenergetics and the determination of home range size. American Naturalist 97:133–140.
Newell, J. A. 1987. Nesting and brood rearing ecol-ogy of the Greater Prairie Chicken in the Sheyenne National Grasslands, North Dakota. M.S. thesis, Montana State University, Bozeman, MT.
Patten, M. A., D. H. Wolfe, E. Shochat, and S. K. Sherrod. 2005a. Habitat fragmentation, rapid
Sandercock_6480004_ch04.indd 61Sandercock_6480004_ch04.indd 61 6/24/11 5:28:05 PM6/24/11 5:28:05 PM
STUDIES IN AVIAN BIOLOGY NO. 39 Sandercock, Martin, and Segelbacher62
evolution and population persistence. Evolutionary Ecology Research 7:235–249.
Patten, M. A., D. H. Wolfe, E. Shochat, and S. K. Sherrod. 2005b. Effects of microhabitat and micro-climate selection on adult survivorship of the Lesser Prairie-Chicken. Journal of Wildlife Management 69:1270–1278.
Patten, M. A., E. Shochat, D. H. Wolfe, and S. K. Sherrod. 2007. Lekking and nesting response of the Greater Prairie-Chicken to burning of tallgrass prai-rie. Proceedings of the Tall Timbers Fire Ecology Conference 23:149–155.
Peery, M. Z. 2000. Factors affecting interspecies variation in home-range size of raptors. Auk 117:511–517.
Powell, R. A. 2000. Animal home ranges and territories and home range estimators. Pp. 65–110 in L. Boitani and T. K. Fuller (editors), Research techniques in animal ecology: controversies and consequences. Columbia University Press, New York, NY.
Pruett, C. L., M. A. Patten, and D. H. Wolfe. 2009a. It’s not easy being green: wind energy and a declining grassland bird. BioScience 59:257–262.
Pruett, C. L., M. A. Patten, and D. H. Wolfe. 2009b. Avoidance behavior by prairie grouse: implications for wind energy development. Conservation Biology 23:1253–1259.
Reinking, D. L. 2005. Fire regimes and avian responses in the central tallgrass prairie. Studies in Avian Biology 30:116–126.
Reiss, M. 1988. Scaling of home range size: body size, metabolic needs and ecology. Trends in Ecology and Evolution 3:85–88.
Rensing, L., and P. Ruoff. 2002. Temperature effect on entrainment, phase shifting, and amplitude of circa-dian clocks and its molecular bases. Chronobiology International 19:807–864.
Riley, T. Z., C. A. Davis, M. A. Candelaria, and H. R. Suminski. 1994. Lesser Prairie-Chicken movements and home ranges in New Mexico. Prairie Naturalist 26:183–186.
Rippen, A. B., and D. A. Boag. 1974. Recruitment to populations of male Sharp-tailed Grouse. Journal of Wildlife Management 38:616–621.
Robel, R. J., J. N. Briggs, J. J. Cebula, N. J. Silvy, C. E. Viers, and P. G. Watt. 1970. Greater Prairie Chicken ranges, movements, and habitat usage in Kansas. Journal of Wildlife Management 34:286–306.
Ryan, M. R., L. W. Burger, Jr., D. P. Jones, and A. P. Wywialowski. 1998. Breeding ecology of Greater Prairie-Chickens (Tympanuchus cupido) in rela-tion to prairie landscape configuration. American Midland Naturalist 140:111–121.
Samson, F. B., and F. L. Knopf (editors). 1996. Prairie conservation: preserving North America’s most endan-gered ecosystem. Island Press, Washington, DC.
Schroeder, M. A., and C. E. Braun. 1991. Walk-in traps for capturing Greater Prairie-Chickens on leks. Journal of Field Ornithology 62:378–385.
Schroeder, M. A., and C. E. Braun. 1992a. Seasonal movement and habitat use by Greater Prairie- Chickens in northeastern Colorado. Colorado Division of Wildlife Special Report 68.
Schroeder, M. A., and C. E. Braun. 1992b. Greater Prairie-Chicken attendance at leks and stability of leks in Colorado. Wilson Bulletin 104:273–284.
Schroeder, M. A., and C. E. Braun. 1993. Partial migra-tion in a population of Greater Prairie-Chickens in northeastern Colorado. Auk 110:21–28.
Sharp, S. P. 2009. Bird ringing as a tool for behavioural studies. Ringing & Migration 24:213–219.
Smith, E. F., and C. E. Owensby. 1978. Intensive early stocking and season-long stocking of Kansas Flint Hills range. Journal of Range Management 31:14–17.
Southwood, T. R. E. 1977. Habitat, the template for ecological strategies? Journal of Animal Ecology 46:337–365.
Svedarsky, W. D., and G. L. Van Amburg. 1996. Inte-grated management of the Greater Prairie Chicken and livestock on the Sheyenne National Grassland. Game and Fish Department, Bismark, ND.
Taylor, M. A., and F. S. Guthery. 1980. Fall-winter move-ments, ranges, and habitat use of Lesser Prairie-Chick-ens. Journal of Wildlife Management 44:521–524.
Toepfer, J. E. 1988. Ecology of the Greater Prairie-Chicken as related to reintroduction. Ph.D. disser-tation, Montana State University, Bozeman, MT.
Vehrencamp, S. L., J. W. Bradbury, and R. M. Gibson. 1989. The energetic cost of display in male sage grouse. Animal Behaviour 38:885–896.
Wakkinen, W. L., K. P. Reese, and J. W. Connelly. 1992. Sage grouse nest locations in relation to leks. Journal of Wildlife Management 56:381–383.
Winter, M., and J. Faaborg. 1999. Patterns of area sen-sitivity in grassland-nesting birds. Conservation Biology 13:1424–1436.
With, K. A., A. W. King, and W. E. Jensen. 2008. Remaining large grasslands may not be sufficient to prevent grassland bird declines. Biological Conservation 141:3152–3167.
Wolfe, D. H., M. A. Patten, E. Shochat, C. L. Pruett, and S. K. Sherrod. 2007. Causes and patterns of mortality in Lesser Prairie-Chickens and implications for man-agement. Wildlife Biology 13(Supplement 1):95–104.
Wright, P. L., and R. W. Hiatt. 1943. Outer prima-ries as age determiners in gallinaceous birds. Auk 60:265–266.
Zimmerman, J. L. 1997. Avian community responses to fire, grazing, and drought in the tallgrass prai-rie. Pp. 167–180 in F. L. Knopf and F. B. Samson (editors), Ecology and conservation of Great Plains vertebrates. Springer, New York, NY.
Sandercock_6480004_ch04.indd 62Sandercock_6480004_ch04.indd 62 6/24/11 5:28:05 PM6/24/11 5:28:05 PM