home range, habitat use, and activity of baird’s tapir in...
TRANSCRIPT
423
BIOTROPICA 34(3): 423–437 2002
Home Range, Habitat Use, and Activity of Baird’s Tapirin Costa Rica1
Charles R. Foerster2 and Christopher Vaughan3
Programa Regional en Manejo de Vida Silvestre para Mesoamerica y el Caribe, Universidad Nacional,P.O. Box 1350, Heredia, Costa Rica
ABSTRACTHome range size, habitat utilization, and activity patterns of five adult Baird’s tapirs (Tapirus bairdii) were studied viaradiotelemetry from June 1995 to May 1996 in Corcovado National Park, Costa Rica. Estimates of 4153 animallocations were made. Home range sizes (95% minimum convex polygon) for the entire study period (wet season anddry season) averaged 125.0 ha (SD 5 72.7), 94.9 ha (SD 5 47.6), and 96.8 ha (SD 5 51.2), respectively. Monthlyhome range sizes averaged 55.5 ha (SD 5 32.1) and did not vary between seasons. Across the entire study, secondaryforest, the most commonly used habitat type (61.3%) was utilized more than expected as predicted by availability(49.6%), while the second most used habitat, primary forest, was used (25.0%) less than expected (36.2%). The samegeneral habitat selection pattern was observed in the dry season. Wet season habitat utilization values showed tapirsusing both primary and secondary forest habitats in proportion to their availability. Diurnal and nocturnal activitylevels were estimated at 20.2 and 80.4 percent, respectively. More diurnal and less nocturnal activity was observedduring the wet season compared to the dry season.
RESUMENEl ambito hogareno, uso del habitat y los patrones de actividad de cinco tapires centroamericanos (Tapirus bairdii) seestudiaron por medio de radiotelemetrıa desde junio de 1995 hasta mayo de 1996 en el Parque Nacional Corcovado(PNC), Costa Rica. Nuestras estimaciones se basan en 4153 ubicaciones. Los ambitos hogarenos promedio (polıgonoconvexo mımimo del 95%) para todo el periodo de estudio, estacion humeda y seca fueron de 125.0 ha (DE 72.7),94.9 ha (DE 47.6) y 96.8 ha (DE 51.2) respectivamente. El promedio mensual del ambito hogareno fue de 55.5 ha.(DE 32.1) y no vario entre las estaciones. Durante el periodo de estudio, el bosque secundario fue el habitat masutilizado (61.3%) a pesar de tener una menor disponibilidad (49.6%); en segundo termino le siguio el bosque primario(25%) que fue utilizado menos de lo esperado (36.2%). El mismo patron de seleccion de habitat se observo durantela estacion de secas. Los valores de utilizacion en la estacion humeda indican que los tapires usan el bosque primarioy secundario de acuerdo a su disponibilidad. Los niveles de actividad diurna y nocturna fueron 20.2 y 80.4% respec-tivamente. Durante la temporada humeda se observo una mayor actividad diurna y una disminucion en la nocturna.
Key words: activity pattern; Baird’s tapir; Costa Rica; habitat use; home range; radiotelemetry; Tapirus bairdii; tropicalwet forest.
THE BAIRD’S TAPIR (TAPIRUS BAIRDII) is one of fourspecies in the genus Tapirus, family Tapiridae. Thetapir is an herbivore and the largest native terres-trial mammal in the Neotropics (Emmons & Feer1990). In addition to being an important foodsource for many people in rural areas (Freese &Saavedra 1991), the Baird’s tapir is an importantseed disperser (Janzen 1982, Naranjo 1995b, Fra-goso 1997) and a potentially important indicatorspecies regarding the health of Neotropical rain for-ests (Dirzo & Miranda 1991).
1 Received 1 July 2001; revision accepted 12 April 2002.2 Current address: 445 CR 221, Orange Grove, Texas78372, U.S.A.3 Current address: Milwaukee Public Museum, Milwaukee,Wisconsin 53233 and Institute for Environmental Studies,University of Wisconsin, Madison, Wisconsin 53706
Once common in most vegetation types be-tween sea level and subalpine paramo throughoutCentral America and northern South America, theBaird’s tapir is now extinct in El Salvador and en-dangered throughout the rest of its range (IUCN1994, March 1994). Habitat loss and overhuntingare cited as the principal causes for the decline innumbers (IUCN 1982, Vaughan 1983, Emmons& Feer 1990). Tapirus bairdii was classified as thetenth rarest Neotropical forest mammal by Dobsonand Jinping (1993) based on population densityand distribution.
Nevertheless, few detailed studies on the ecol-ogy of the Baird’s tapir exist. Their mostly noctur-nal activity, coupled with its secretive behavior indense tropical forests, make it difficult to study inthe wild. Accordingly, habitat use, diet, and abun-

424 Foerster and Vaughan
dance of T. bairdii have usually been estimated inshort-term studies using methods such as trackcounts, direct sightings, fecal analysis, and feedingtrials with captive animals. Without reliable infor-mation on habitat use, spatial requirements, anddemographics, developing a strategy for sustainingfree-ranging Baird’s tapir populations will be im-possible. For example, determining size and com-position of an area that fulfills critical life historyrequirements is an important first step in establish-ing conservation reserves. Disproportionate use ofavailable resources can indicate habitats and areaswhere conservation efforts should be focused. Here,we report results of the first major radiotelemetrystudy of space use and activity pattern of the en-dangered Baird’s tapir.
The main goal of this research was to describethe basic ecology of free-ranging Baird’s tapir in theforests of Corcovado National Park, Costa Rica.Toward this end, we conducted a radiotelemetrystudy from June 1995 to May 1996 to monitor themovements of five adult Baird’s tapirs. Specifically,our objectives were to determine annual and sea-sonal variations in (a) habitat use, (b) home rangesize, and (c) activity patterns.
STUDY AREA
We conducted research in Corcovado NationalPark (CNP; 41,789 ha; 88269–88399N, and838259–838459W) on the southwestern coast of theOsa Peninsula, Costa Rica (Fig. 1). Created in1975, CNP represents the largest remaining tractof lowland tropical rain forest in Central Americaand supports an estimated 500 tree species, 367bird species, 140 mammals, 51 amphibians, and64 reptiles (Hartshorn 1983, Boza 1992, Vaughan& Rodriguez 1997). Naranjo (1995a) estimated apopulation of between 155 and 249 Baird’s tapirsin the park. The mean annual temperature in CNPranges between 23 and 26.58C depending on ele-vation. The rainy season extends from May to No-vember (475 mm precipitation/mo), and the dryseason from December to April (130 mm/mo;Vaughan 1981).
Base camp was established at the Sirena rangerstation, located on the southwest coast of CNP.Two major rivers drain the region: the Rio Claroto the south and the Rio Sirena to the north. Theregion north and northwest of the Sirena stationhas alluvial, well-drained soils and vegetation cor-responding to tropical wet forest. Vaughan (1981)estimated that ca 1800 ha had been deforested inthe area (principally in 1 to 17 ha parcels) before
it was declared a national park in 1975. The re-sulting habitat now, 21 years later, is a mosaic ofprimary and regenerating secondary forests. Eastand southeast of the station is dominated by pri-mary forests on steep slopes rising to 145 m. Nu-merous intermittent streams are found throughoutthe study area.
Six habitat types were identified in the area us-ing a 1992 aerial photograph (scale 5 1:20000 Ins-tituto Geografico Nacional de Costa Rica): (a) pri-mary forest, (b) secondary forest, (c) freshwater, (d)beach, (e) coastal grassland, and (f ) airstrip/com-pound (Fig. 1). Phillips (1993) and Naranjo(1995a) have described the structure and dominantspecies in the primary and secondary habitats. Thefreshwater habitat included the Rio Claro, Rio Si-rena, and the Sirena lagoon, a shallow body of wa-ter running parallel to the coast north of the Sirenariver mouth. Beach habitats north of the Claro riv-er mouth are primarily sandy, while to the southrocky points separate sandy coves. The coastalgrassland is a thin strip of vegetation between thebeach and the Sirena lagoon dominated by a tall,coarse grass and interspersed with Terminalia sp.(Combretaceae), Cocos nucifera (Arecaceae), andHibiscus tilleaceus (Malvaceae). The airstrip/com-pound habitat included the grassy area of the Si-rena ranger station compound and the airstrip.
METHODS
CAPTURE AND MARKING. Areas used regularly bytapirs were baited in December 1994. A variety ofbaits were tested for acceptance (salt blocks, apples,bananas, and several local forest fruits). Ripe ba-nanas were found to be the most effective bait forattracting tapirs to capture sites. After three con-secutive nights of visitation by tapir(s), rope plat-forms were constructed 5—10 m high, in trees10—15 m from the bait site. Most capture siteswere located at least 200 m from deep bodies ofwater to avoid risk of an anesthetized animaldrowning. For one site located 100 m from the RioSirena, we built a bamboo corral (30 3 20 m) toenclose the bait area. A trip wire in the center ofthe corral activated two drop doors. Informationon darting and anesthetic protocol are documentedin Paras et al. (1996).
TELEMETRY DATA COLLECTION. We conducted athree-month pilot study from April to June 1995to test accuracy (Mean Error) and precision (SD)of bearing estimates on transmitters in known lo-cations using (a) fixed antenna array systems locat-

Space Use and Activity of Baird’s Tapir 425
FIGURE 1. Location of Corcovado National Park, habitat map of study area, and annual home range boundaries(95% convex polygon) of each study animal.

426 Foerster and Vaughan
ed on hilltops overlooking the study area, (b) fixedantenna sites located in canopy platforms, and (c)handheld antennas at receiving stations along trailstransecting the study area. Twenty-five replicateswere made on three transmitter locations for eachmethod. Estimates from handheld antennas result-ed in more accurate (2.4 ME) and precise (1.1 SD)data compared to antenna array systems (13.3 ME;4.4 SD) and canopy platforms (9.6 ME; 2.4 SD).Fixed antenna stations did not provide accuratebearing estimates probably due to interference fromdense, wet vegetation and the great distance be-tween the animal and receiver.
For the final telemetry sampling design, weused handheld, two-element H-antennas and TR-4 receivers (Telonics, Mesa, Arizona) to locate ta-pirs by triangulation from two stations along re-search trails. Bearings were taken either simulta-neously or within four minutes of each other.When a marked animal was observed directly, itsposition (bearing and distance) was recorded rela-tive to the closest telemetry station. The animal’scoordinates were estimated using the computerprogram Telem88 (Dept. of Fisheries and Wildlife,Virginia Polytechnic Institute and State University,Blacksburg, Virginia).
Each tapir was located hourly during diurnal(0600–1759 h) and nocturnal (1800–0559 h) datacollection periods. Five diurnal and five nocturnalcollection periods were conducted per animalmonthly. Mathematical independence of successivenocturnal observations was tested for each month-long data set with the ratio t2/r2, where t2 is themean squared distance between successive obser-vations and r2 is the mean squared distance fromthe center of activity (Swihart & Slade 1985). In-dependence was assumed when the ratio of t2/r2
was 2.0 or greater. Independent locations were usedto calculate habitat use and selection.
ACTIVITY PATTERNS. For estimation of animal ac-tivity (active or inactive), any pattern of receptionother than a consistent pulse intensity was consid-ered an observation of an active animal. We cal-culated the percentage of active observations(PAOs) for diurnal and nocturnal periods duringboth seasons and for the entire study period. PAOswere also calculated for each hour and totaled forwet and dry seasons and over the entire study pe-riod. The replicated G-test (William’s correction)was used to compare: (a) wet season diurnal ratiosof active observations against dry season diurnalratios, and (b) wet season nocturnal ratios of activeobservations against dry season nocturnal ratios.
HOME RANGE. Study-long, seasonal, and monthlyhome ranges (MHR) (95%) were estimated withthe minimum convex polygon method using thecomputer program Homerange (Ackerman et al.1990). A one-way ANOVA was used to test forseasonal variation in monthly home range size.Data subjected to ANOVA were tested for homo-geneity with the log-anova method (Sokal & Rohlf1995). The computer program Tracker was used tomeasure (a) seasonal home range overlap for eachtapir and (b) study-long and seasonal home rangeoverlap between individuals.
HABITAT USE. A habitat map was made using a1992 aerial photograph (scale 5 1:20000, InstitutoGeografico Nacional de Costa Rica) and digitalizedin the Idrisi computer program for geographic dataanalysis (Clark Labs for Cartographic Technologyand Geographic Analysis, Clark University, Wor-chester, Massachusetts). Availability of the six hab-itats (primary forest, secondary forest, freshwater,beach, coastal grassland, and airstrip/compound)was calculated by the percent coverage of each hab-itat type within each tapir’s 95 percent home rangeboundary using the Idrisi program. Percentage oftelemetry locations within each habitat type wascalculated to estimate habitat usage by each tapir.Habitat availability and use data for all tapirs werecombined to determine an overall habitat selectionpattern. The G-test (William’s correction) was usedto determine significant seasonal differences be-tween wet and dry season habitat use. Use of in-dividual habitats more than, less than, or equal toavailability estimated for the wet season, dry sea-son, and the entire study period was tested usingthe program Habuse (Manly et al. 1993) whichcalculates chi-square values and Bonferroni confi-dence intervals for use versus availability.
RESULTS
STUDY ANIMALS. Two subadult females (F1 andF2), one adult female (F3), and two adult males(M1 and M2) were immobilized and radio-collaredbetween 15 January and 4 March 1995. Althoughno established method for estimating tapir age wasavailable, the tapirs were placed in these general agecategories based on body size and dental character-istics (size and coloration). Tapirs F1 and F2 wereestimated to weigh between 180 and 220 kg. Theirincisors and canines were well developed but hadvery little staining that appears with aging. TapirsF3, M1, and M2 weighed ca 300 kg and had mod-erate to extreme staining of the incisors and ca-
Space Use and Activity of Baird’s Tapir 427
TA
BL
E1.
Info
rmat
ion
onag
ecl
ass
and
radi
otel
emet
rylo
cati
ons
colle
cted
onea
chstu
dyan
imal
.
Tap
irA
gecl
ass
Num
ber
oflo
cati
ons
Cal
cula
ted
Vis
ual
Err
or
Tota
llo
cati
ons
Diu
rnal
Noc
turn
al
Inde
pend
ent
loca
tion
s
Wet
seas
onD
ryse
ason
Stud
y-lo
ng
F1 F2 F3 M1
M2
Suba
dult
Adu
ltSu
badu
ltA
dult
Adu
lt
531
767
704
817
752
206
134
158 78 114
13 18 13 43 21
329
354
380
368
409
395
529
469
484
436
79 104 94 80 104
64 88 79 66 90
143
192
173
146
194
Tota
l35
7169
010
818
4023
1346
138
784
8
nines. Tapir F2 had a one-month-old (estimated)male calf by her side at the time of capture. Thiscalf disappeared at ca 4 months of age and waspresumed to have been predated because offspringnormally remain with their mother for 12 months(R. Barongi, pers. obs.).
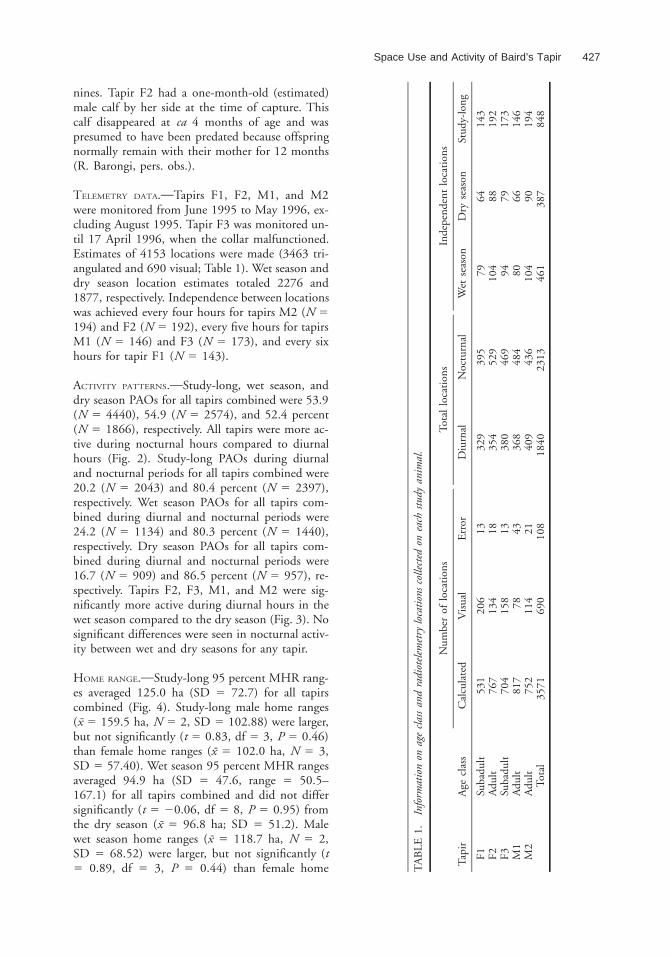
TELEMETRY DATA. Tapirs F1, F2, M1, and M2were monitored from June 1995 to May 1996, ex-cluding August 1995. Tapir F3 was monitored un-til 17 April 1996, when the collar malfunctioned.Estimates of 4153 locations were made (3463 tri-angulated and 690 visual; Table 1). Wet season anddry season location estimates totaled 2276 and1877, respectively. Independence between locationswas achieved every four hours for tapirs M2 (N 5194) and F2 (N 5 192), every five hours for tapirsM1 (N 5 146) and F3 (N 5 173), and every sixhours for tapir F1 (N 5 143).
ACTIVITY PATTERNS. Study-long, wet season, anddry season PAOs for all tapirs combined were 53.9(N 5 4440), 54.9 (N 5 2574), and 52.4 percent(N 5 1866), respectively. All tapirs were more ac-tive during nocturnal hours compared to diurnalhours (Fig. 2). Study-long PAOs during diurnaland nocturnal periods for all tapirs combined were20.2 (N 5 2043) and 80.4 percent (N 5 2397),respectively. Wet season PAOs for all tapirs com-bined during diurnal and nocturnal periods were24.2 (N 5 1134) and 80.3 percent (N 5 1440),respectively. Dry season PAOs for all tapirs com-bined during diurnal and nocturnal periods were16.7 (N 5 909) and 86.5 percent (N 5 957), re-spectively. Tapirs F2, F3, M1, and M2 were sig-nificantly more active during diurnal hours in thewet season compared to the dry season (Fig. 3). Nosignificant differences were seen in nocturnal activ-ity between wet and dry seasons for any tapir.
HOME RANGE. Study-long 95 percent MHR rang-es averaged 125.0 ha (SD 5 72.7) for all tapirscombined (Fig. 4). Study-long male home ranges(x 5 159.5 ha, N 5 2, SD 5 102.88) were larger,but not significantly (t 5 0.83, df 5 3, P 5 0.46)than female home ranges (x 5 102.0 ha, N 5 3,SD 5 57.40). Wet season 95 percent MHR rangesaveraged 94.9 ha (SD 5 47.6, range 5 50.5–167.1) for all tapirs combined and did not differsignificantly (t 5 20.06, df 5 8, P 5 0.95) fromthe dry season (x 5 96.8 ha; SD 5 51.2). Malewet season home ranges (x 5 118.7 ha, N 5 2,SD 5 68.52) were larger, but not significantly (t5 0.89, df 5 3, P 5 0.44) than female home

428 Foerster and Vaughan
FIGURE 2. Study-long activity pattern for each study animal. Percentage of active observations for each hour intervalwas calculated from June 1995 to May 1996.
ranges (x 5 79.1 ha, N 5 3, SD 5 35.19) in thewet season. Male dry season home ranges (x 5123.5 ha, N 5 2, SD 5 71.49) were also larger,but not significantly (t 5 0.93, df 5 3, P 5 0.42)than female dry season home ranges (x 5 79.1 ha,N 5 3, SD 5 38.91). Study-long monthly 95 per-cent MHR ranges averaged 27.1 ha, (N 5 54, SD5 18.4). Male monthly home range sizes (x 5 35.0ha, N 5 22, SD 5 20.2) were larger (t 5 2.79, df5 52, P 5 0.007) than female home ranges (x 521.6 ha, N 5 32, SD 5 15.1). Monthly homeranges in the wet season (x 5 26.7 ha, N 5 29,SD 5 19.6) were not significantly different (t 520.152, df 5 52, P 5 0.880) compared to the dryseason (x 5 27.5 ha, N 5 25, SD 5 17.2) for alltapirs combined. Based on incremental area plots,which show changes in range size as successive lo-cations are added, approximately four months ofdata are needed to obtain reasonably stable homerange sizes following this data collection schedule(Fig. 5). Tapir F1 required seven months to stabi-lize because of a slight shift in home range locationbetween September and October.
HOME RANGE OVERLAP. All tapirs shared a 32.5 haarea of overlap between study-long home ranges(Fig. 6). This represented 19.4, 42.5, 52.5, 14.0,and 37.4 percent of study-long home ranges for F1,F2, F3, M1, and M2, respectively. A 25.9 ha overlaparea represented 21.9, 37.9, 51.3, 15.5, and 36.9percent of wet season home ranges for F1, F2, F3,
M1, and M2, respectively. No area was commonlyshared among all tapirs in the dry season. All tapirsshowed a greater than 70 percent overlap betweentheir own wet and dry season home ranges (x 576.4%, N 5 5, SD 5 7.26; Fig. 7).
HABITAT USE. For all tapirs combined over the en-tire study period, secondary forest was the mostutilized habitat type (61.3%), while primary forest(25.0%) was the second most utilized habitat (Fig.8). Study-long habitat utilization was not as pre-dicted by habitat availability (Gadj 5 15.18, a 54, P , 0.05). Bonferroni confidence intervalsshowed that secondary forest and the airstrip/com-pound were used more than expected while theprimary forest, water, and beach habitats were usedless than expected based on availability. Wet seasonhabitat use values did not follow predicted ratios(Gadj 5 27.31, a 5 4, P , 0.001). The airstrip/compound was utilized more than expected duringthis period while the water and beach habitats wereused less than expected. Dry season habitat utili-zation also was not as predicted by habitat avail-ability (Gadj 5 32.53, a 5 4, P . 0.001). Duringthis period, primary forest and beach habitats wereutilized less than expected while secondary forestwas used more than expected. Wet season habitatuse ratios were significantly different from dry sea-son ratios (Gadj 5 122.89, a 5 4, P , 0.001).Tapirs used the primary forest and airstrip/com-pound habitats more during the wet season com-

Space Use and Activity of Baird’s Tapir 429
FIGURE 3. Seasonal activity pattern for each study animal. Percentage of active observations during each hourinterval was calculated for the wet season (June–November 1995 and May 1996) and dry season (December 1995–April 1996). G-test results are given comparing seasonal activity patterns for diurnal and nocturnal data sets.

430 Foerster and Vaughan
FIGURE 4. Annual (June 1995–May 1996), wet season (June–November 1995 and May 1996), dry season (De-cember 1995–April 1996), and average monthly home range size (95% convex polygon) for each tapir.
FIGURE 5. Cumulative area versus time plot of 95 per-cent home range for each tapir.
pared to the dry season while secondary forest,beach, water, and coastal grassland habitat hadhigher usage ratios in the dry season.
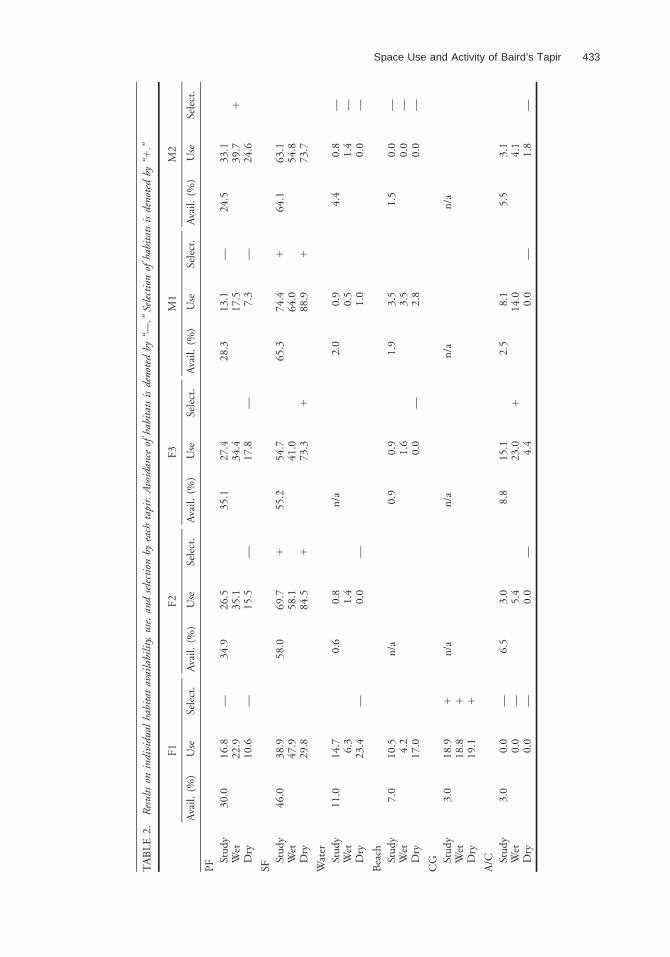
Individually, secondary forest was the most uti-lized habitat over the entire study period by all fivetapirs (Table 2). All five tapirs used the primaryforest habitat more during the wet season whencompared to the dry season. Bonferroni confidenceintervals showed tapirs F1, F2, F3, and M1 selectedagainst primary forest in the dry season. Only onetapir (M2) selected primary forest in the wet sea-son. Four of the five tapirs utilized the secondaryforest habitat more during the dry season than thewet. All tapirs used the secondary forest habitat inproportion to its availability during the wet season,while three tapirs (F2, F3, and M1) selected thishabitat in the dry season. The coastal grassland was
represented in only one tapir’s home range (F1)and it was selected during both seasons and overthe entire study period.
DISCUSSIONTELEMETRY DATA COLLECTION. We believe thisstudy demonstrates the feasibility of long-term te-lemetry studies for tapir species. The telemetry datagathering technique employed in this study, whilelabor intensive, resulted in very accurate data. Webelieve the transmitter bearings estimated fromground level resulted in very reliable animal loca-tions because (a) bearings were usually taken rela-tively close to the animal (usually ,100 m), (b)690 locations (16.6%) were determined by directobservations, and (c) our ability to choose betweenmany receiving stations allowed us to obtain closerto perpendicular readings.
Fixed antenna stations would probably havebeen much more desirable for many reasons. Wecould have constructed insect-free, weatherproofenclosures that would have allowed us to collectdata in relative comfort while subjecting our equip-ment to less damaging conditions. Data entry intocomputer programs would have also been im-mensely simplified. Given the right conditions, wewould recommend antenna stations to reduce theamount of work involved, but only if the data gath-ered is reliable.
CAPTURE AND IMMOBILIZATION. The capture andimmobilization of the study animals here was rel-

Space Use and Activity of Baird’s Tapir 431
FIGURE 6. Study-long and seasonal home range (95%) overlap between individuals showing areas in common withall study animals.
FIGURE 7. Seasonal home range (95%) overlaps for each tapir. Percentages correspond to the percent coverage ofdry season range by wet season range.

432 Foerster and Vaughan
FIGURE 8. Study-long, wet season, and dry season habitat use patterns as estimated by percentage of telemetrylocations for all tapirs combined. Habitat availability values represent percentage of coverage each habitat type in theentire study area.
atively easy once we discovered the appropriate baitand darting technique. Although at the time of thisstudy we were still using M-99, recent studies havedeveloped an immobilization protocol that doesnot involve narcotic agents and thus does not pre-sent the level of danger to either tapirs or humans(Foerster et al. 2000.).
ACTIVITY PATTERNS. Downer (1995, 1996) andAcosta et al. (1996) have stated that T. pinchaqueis crepuscular, while Terwilliger (1978) found nopattern in sleeping behavior during her study ofT. bairdii on Barro Colorado Island. In the trop-ical dry forest of Santa Rosa National Park, CostaRica, Williams (1984) reported significantly morenocturnal activity by Baird’s tapirs, with peaks be-tween 1800 and 2000 h and between 0400 and0700 h.
The predominant nocturnal behavior exhibitedby the tapirs in this study is probably an adaptationto avoid the hottest times of the day. Large animalssuch as tapirs (150–300 kg) have a difficult timedissipating excess body heat due to their low sur-face to volume ratio (Schmidt-Nielson 1990) andthus probably confine their activities to the cooler
nighttime hours. The greater diurnal activity dur-ing the rainy season is possibly due to an increasein frequency of daytime rains, which produceslightly lower ambient temperatures. The differenc-es in activity patterns between T. pinchaque and T.bairdii are probably due to temperature differencesbetween the two species distributions. Where T.pinchaque is inactive during the colder nocturnalhours of the high Andes (Downer 1996), theBaird’s tapir is less active during the hottest part ofthe day.
Eisenberg (1989) reported that tapirs will be-come completely nocturnal in regions where theyare frequently hunted. Although illegal hunting oc-curs within the park, it is uncommon near the Si-rena ranger station and probably had little effecton tapir activity there; however, human activity inthe form of tourists in the Sirena area may haveaffected seasonal differences in activity patterns ob-served. More tourists visit the Sirena station duringthe dry season, and increase human traffic in thestudy area, especially during the day. It is possiblethat during months of heavy tourist traffic throughSirena, the tapirs became more nocturnal to avoidconfrontations with humans.
Space Use and Activity of Baird’s Tapir 433
TA
BL
E2.
Res
ults
onin
divi
dual
habi
tat
avai
labi
lity,
use,
and
sele
ctio
nby
each
tapi
r.A
void
ance
ofha
bita
tsis
deno
ted
by‘‘—
.’’Se
lect
ion
ofha
bita
tsis
deno
ted
by‘‘1
.’’
F1
Ava
il.(%
)U
seSe
lect
.
F2
Ava
il.(%
)U
seSe
lect
.
F3
Ava
il.(%
)U
seSe
lect
.
M1
Ava
il.(%
)U
seSe
lect
.
M2
Ava
il.(%
)U
seSe
lect
.
PF St
udy
Wet
Dry
30.0
16.8
22.9
10.6
— —
34.9
26.5
35.1
15.5
—
35.1
27.4
34.4
17.8
—
28.3
13.1
17.5 7.3
— —
24.5
33.1
39.7
24.6
1
SFSt
udy
Wet
Dry
46.0
38.9
47.9
29.8
58.0
69.7
58.1
84.5
1 1
55.2
54.7
41.0
73.3
1
65.3
74.4
64.0
88.9
1 1
64.1
63.1
54.8
73.7
Wat
erSt
udy
Wet
Dry
11.0
14.7 6.3
23.4
—
0.6
0.8
1.4
0.0
—
n/a
2.0
0.9
0.5
1.0
4.4
0.8
1.4
0.0
— — —
Bea
chSt
udy
Wet
Dry
7.0
10.5 4.2
17.0
n/a
0.9
0.9
1.6
0.0
—
1.9
3.5
3.5
2.8
1.5
0.0
0.0
0.0
— — —
CG St
udy
Wet
Dry
3.0
18.9
18.8
19.1
1 1 1
n/a
n/a
n/a
n/a
A/C St
udy
Wet
Dry
3.0
0.0
0.0
0.0
— — —
6.5
3.0
5.4
0.0
—
8.8
15.1
23.0 4.4
12.
58.
114
.0 0.0
—
5.5
3.1
4.1
1.8
—

434 Foerster and Vaughan
HOME RANGE. Mean home range size in this studywas considerably smaller compared to T. bairdii ina Costa Rican dry tropical forest (1.70 km2; Wil-liams 1984) and the much smaller mountain tapirin Ecuador (8.8 km2; Downer 1996). Possibly, ta-pirs in the Sirena area require less space to fulfilltheir requirements of water and food. Presently,habitat conditions in the Sirena area appear to pro-vide an excellent balance of diversity to the residenttapir population, resulting in smaller home ranges.The fact that no significant difference in seasonalhome range size or location (as shown by seasonalhome range overlap) was observed suggests thatthese tapirs do not need to expand their ranges tomeet seasonal deficiencies in habitat quality.
HABITAT USE. Habitat use results in this study co-incide with other tapir research. Based on trackcounts, Naranjo (1995a) determined that T. bairdiiin CNP preferred lowland secondary forests andavoided primary forests. Baird’s tapirs in Belize pre-fer secondary forests and floodplains (Fragoso1990). Williams (1984) found most nocturnal ac-tivity of two Baird’s tapirs in Santa Rosa NationalPark, Costa Rica, centered in lowland riparian for-est and regenerating riparian forest. Tapirus terres-tris in Venezuela was found to forage preferentiallyin lower elevation gaps, keying in on higher bio-mass of palatable plant species and abundance ofcertain plants (Salas & Fuller 1996). These authorsagree that food and water availability are importantfactors in habitat selection by tapirs.
In this study, secondary forest was the mostutilized habitat during both seasons. We concurwith other researchers in that tapirs forage more insecondary forests because it contains high densitiesof understory plants. Tapirs are strict herbivores(browser/frugivore) and must obtain their foragebetween the forest floor and ca 1.5 m height. Inaddition to the higher density of plants available inthe secondary forest understory, the plant speciesfound there are usually fast-growing pioneer spe-cies, which are more palatable and digestible be-cause they tend to invest less energy to formingdefensive toxins. We believe the high percentage ofsecondary forest habitat in the area was a majorfactor in allowing the study animals to maintainsuch small home ranges. Based on this assumption,we would expect home range sizes for tapirs in theSirena area to increase as the regeneration processmodifies available habitat.
While we agree that water is an important con-sideration of diurnal resting site selection (Alger etal. 1998), our telemetry data and direct observa-
tions convinced us that water plays only a minorrole in nocturnal habitat selection. The study ani-mals rarely foraged or rested along creek sides, al-though streambeds were often utilized for easy trav-el between feeding sites and for defecation. Dryseason diurnal resting sites were almost exclusivelyin wallowing holes associated with freshwatersources. In the wet season, however, tapirs seldomslept in water, although they were usually less than20 m from a creek or river.
In this study, primary forest utilization was muchhigher in the wet season by all tapirs, probably be-cause of increased fruit availability. Tapirs were seeneating fallen fruits during the majority of our directobservations in primary forest, particularly Licaniaplatypus (Chrysobalanaceae). This species is found inonly two small patches of primary forest in the studyarea and produces fruit from May through July. Dur-ing this period, 97 percent of primary forest obser-vations were recorded in these two patches. In follow-ing radio-tagged tapirs in these forest patches, theyappeared to travel directly from one L. platypus toanother, circling the bases of the trees in search offruit while essentially ignoring the remaining vegeta-tion. In a similar manner, Bodmer (1990) reportedthat T. terrestris encountered fruits more frequentlywhen ranging in Maurita flexuosa palm forests thanin non-palm forests because they changed theirsearching behavior. The author observed that tapirtrails indicated the animals were going from one M.flexuosa palm swamp to another via non-palm forests.Naranjo (1995b) also found a disproportionatelyheavy use of monotypic stands of Raphia taedigera(Palmae) by T. bairdii in CNP, Costa Rica.
HOME RANGE OVERLAP. We feel the distributionpattern documented during this study reflects, tosome extent, the social behavior of Baird’s tapirs.Ecological and evolutionary models predict thattropical forest-dwelling ungulates should occupymonogamous-pair territories because of the season-al stability of the environment and closed habitat(Geist 1974, Jarman 1974). Tapirs F2, F3, and M2consistently shared the same area. Although no ge-netic evaluation of the relationship between the an-imals was possible, direct observations and subse-quent data collection lead us to believe tapirs F2and M2 represent an adult pair and F1 and F3were their offspring. During the second half of thestudy, tapir F2 became increasingly aggressive to-ward F3 and gave chase whenever they encounteredeach other, a behavior not observed in the first sixmonths of the study. Tapir F3 left the region twomonths after this study was completed.

Space Use and Activity of Baird’s Tapir 435
Our observations also indicate that tapir F1was probably the offspring of F2 and M2 from theprevious year. From the time of her capture in Jan-uary 1995 to September 1995 (2 mo into thestudy), F1 occupied this same territory with F2,F3, and M2. During this same time period, everyinteraction between F1 and F3 was hostile in na-ture, with F2 always the aggressor. In September,F1 shifted her home range 1 km to the north. Inaddition, prior to this shift, F1 and the other ju-venile (F3) spent a great deal of their time togetherboth resting during the day and foraging at night(CRF and CV, pers. obs). This behavior has beennoted between known siblings in the years follow-ing the study. Similar to tapir F3, tapir F1 dis-persed from the area soon after the study was com-pleted. This theory has been strengthened throughobservations in the five years following this studyduring which tapirs F2 and M2 have maintainedan exclusive territory with no other resident adults.In that time, F2 has produced four more offspring,which have occupied the same area for three to fouryears prior to dispersal (Foerster, pers. obs.).
The large overlap of all home ranges during thewet season was a function of two factors: (1) thefamily unit described above and (2) the attractionof the L. platypus fruit mentioned above. The wetseason included those months prior to the homerange shift of tapir F1. These months were also theonly time the fruits of L. platypus were available inthe primary forest patch near the airstrip. Duringthis time, tapir M1 (adult male to the south) madeseveral forays into this area in search of these fruits.At no other time did M1 penetrate the home rangeof F2 and M2 to any substantial degree.
MANAGEMENT IMPLICATIONS. Because tapirs inhab-it practically all ecosystems from sea level to thesubalpine paramo, broad conclusions should not bedrawn from individual studies within a restrictedarea. Several points, however, can be made fromthis study.
Any management strategy directed toward ta-pirs should include the protection of water sources.In the majority of areas where tapirs are found,water is not a scarce resource, but the quality ofthese rivers, creeks, and lakes are often influencedby human activities. Deforestation, pesticide use,and fertilizers can contaminate and/or reduce thequantity of available water. In the case of CNP,gold miners in and out of the park modify thecourse of waterways and contaminate water sourceswith mercury. Strict control needs to be enforced
on activities that can influence the quantity andquality of water resources.
This study reinforces the importance of ‘‘dis-turbed’’ habitats (riverbanks, gaps, and secondaryforest) for tapirs. This should be taken into accountwhen designating new protected areas. Regionswith deforested patches or those that have beenselectively logged should not be discounted whenconsidered for protective status. To the contrary, amixture of primary and secondary forests appearsto suit tapirs very well. We believe selective loggingmay actually benefit tapirs as long as it is not overlyextensive and hunting can be controlled. We realizethat wildlife managers and park officials rarely havethe luxury of making decisions based on the needsof a single species, but in the rare case that tapirsare of major importance to a region and there arefew naturally occurring disturbances, it may be avalid consideration to cut down a number of largetrees to form gaps. This obviously should be usedon a short-term basis, perhaps at the beginning ofa reintroduction project.
Finally, more intensive research into the pop-ulation dynamics is needed to improve our abilityto manage and conserve this species. Although ra-diotelemetry studies can be prohibitively expensiveand time-consuming, they offer a unique oppor-tunity to collect data otherwise unattainable withother techniques. Radiotelemetry is an excellentmethod for collecting data on movement patternsand space use. This can be used to measure thepopulation density in a given area that may be ap-plicable to a larger region. Data on movement pat-terns could also be combined with simultaneoustrack counts and direct sightings along transects toformulate correlation factors for these indices tomore accurately and reliably estimate populationdensities. Radiotelemetry can also be used to facil-itate direct observations for studies on diet, forag-ing behavior, social interaction, survival, mortality,and reproduction. Many demographic parameters(e.g., reproductive potential, dispersal, and survivalrates) are probably common to all tapir popula-tions, or would be if not for the influence of hu-man activities. Long-term studies of undisturbed,natural tapir populations could provide a databasewith which to evaluate the pressures exerted byhunting and habitat modification.
ACKNOWLEDGMENTSWe thank the personnel of CNP for their assistance. Thisproject was financially supported by the Lincon Park ZooScott Neotropical Fund, Wildlife Conservation Society,Idea Wild and Wildlife Preservation Trust International.

436 Foerster and Vaughan
Our thanks to doctors Sonia Hernandez, Alberto Paras,Don Janssen, and Danillo Leandro for their help in tapirimmobilizations. This project was the field study portionof a Master’s degree for the senior author in Wildlife
Management from the Programa Regional en Manejo deVida Silvestre para Mesoamerica y el Caribe, UniversidadNacional, Costa Rica.
LITERATURE CITED
ACKERMAN, B., F. LEBAN, M. SAMUAL, AND E. GARTON. 1990. User’s manual for program home range, 2nd edition.Technical report 15, no. 259. Forestry, Wildlife and Range Experiment Station, University of Idaho, Moscow,Idaho.
ACOSTA, H., J. CAVELIER, AND S. LONDONO. 1996. Aportes al conocimiento de la biologia de la danta de montana,Tapirus pinchaque, en los Andes Centrales de Colombia. Biotropica 28: 258–266.
ALGER, S. J., C. VAUGHAN, AND C. FOERSTER. 1998. Resting site microhabitat selection by Tapirus bairdii during thedry season in Corcovado National Park, Costa Rica. Vida Silv. Neotrop. 7: 136–138.
BODMER, R. E. 1990. Fruit patch size and frugivory in the lowland tapir (Tapirus terrestris). J. Zool. 222: 121–128.BOZA, M. A. 1992. Parques nacionales de Costa Rica. INCAFO, S. A., Madrid, Espana.DIRZO, R., AND A. MIRANDA. 1991. Altered patterns of herbivory and diversity in the forest understory: A case study
of the possible consequences of contemporary defaunation. In P. W. Price, T. M. Lewinson, G. W. Fernandes,and W. W. Benson (Eds.). Plant–animal interactions: evolutionary ecology in tropical and temperate regions,pp. 273–287. John Wiley and Sons, New York, New York.
DOBSON, F. S., AND Y. JINPING. 1993. Rarity in Neotropical forest mammals revisited. Conserv. Biol. 7: 586–591.DOWNER, C. C. 1995. The gentle botanist. Wildl. Conserv. 98: 30–35.———. 1996. The mountain tapir, endangered ‘‘flagship’’ species of the high Andes. Oryx 30: 45–58.EISENBERG, J. F. 1989. Mammals of the Neotropics. University of Chicago Press, Chicago, Illinois.EMMONS, L., AND F. FEER. 1990. Neotropical rainforest mammals, a field guide. University of Chicago Press, Chicago,
Illinois.FOERSTER, S. H., J. BAILEY, R. AGUILAR, D. LORIA, AND C. FOERSTER. 2000. Butorphanol/xylazine/ketamine immobi-
lization of free–ranging tapirs in Costa Rica. J. Wildl. Dis. 36: 335–341.FRAGOSO, J. M. V. 1990. The effect of hunting on tapirs in Belize. In J. G. Robinson and K. H. Redford (Eds.).
Neotropical wildlife use and conservation, pp. 154–162. University of Chicago Press, Chicago, Illinois.———. 1997. Tapir–generated seed shadows: scale–dependent patchiness in the Amazon rain forest. J. Ecol. 85:
519–529.FREESE, C. H., AND C. J. SAAVEDRA. 1991. Prospects for wildlife management in Latin America and the Caribbean.
In J. G. Robinson and K. H. Redford (Eds.). Neotropical wildlife use and conservation, pp. 430–444. Uni-versity of Chicago Press, Chicago, Illinois.
GEIST, V. 1974. On the relationship of social evolution and ecology of ungulates. Am. Zool. 14: 205–220.HARTSHORN, G. S. 1983. Plants. In D. H. Janzen (Ed.). Costa Rican natural history, pp. 119–160. University of
Chicago Press, Chicago, Illinois.IUCN. 1982. The IUCN mammal red data book, part 1. World Union for Nature, Gland, Switzerland.———. 1994. The IUCN mammal red data book, part 1. IUCN red list of threatened animals. World Union for
Nature, Gland, Switzerland.JANZEN, D. H. 1982. Seeds in tapir dung in Santa Rosa National Park, Costa Rica. Brenesia 19: 129–135.JARMAN, P. J. 1974. The social organization of antelope in relation to their ecology. Behavior 58: 215–268.MANLY, B. F. J., L. L. MCDONALD, AND D. L. THOMAS. 1993. Resource selectivity by animals: statistical design and
analysis for field studies. Chapman and Hall, London.MARCH, I. J. 1994. La situacion actual del tapir en Mexico. Centro de Investigacion Ecologicas del Sureste. Monograf
series, no. 1. San Cristobal de las Casas, Chiapas, Mexico.NARANJO, E. 1995a. Abundancia, uso de habitat y dieta del tapir (Tapirus bairdii) en un bosque tropical humedo de
Costa Rica. Vida Silv. Neotrop. 4: 20–31.———. 1995b. Habitos de alimentacion del tapir (Tapirus bairdii) en un bosque tropical humedo de Costa Rica.
Vida Silv. Neotrop. 4: 32–37.PARAS, A. G., C. R. FOERSTER, S. M. HERNANDEZ, AND D. LEANDRO. 1996. Immobilization of free-ranging Baird’s
tapir (Tapirus bairdii). American Association of Zoo Veterinarians’ Annual Conference Proceedings, pp. 12–17. Puerto Vallarta, Mexico.
PHILLIPS, P. R. 1993. Key to vegetation types for the Osa Peninsula, Costa Rica. Center for Space Research, Universityof Texas, Austin, Texas.
SALAS, L. A., AND T. K. FULLER. 1996. Diet of the lowland tapir (Tapirus terrestris L.) in the Tabaro river valley,southern Venezuela. Can. J. Zool. 74: 1444–1451.
SCHMIDT–NIELSON, K. 1990. Animal physiology: Adaptation and environment. Cambridge University Press, New York,New York.
SOKAL, R. R., AND F. J. ROHLF. 1995. Biometry, 3rd edition. W. H. Freeman, New York, New York.SWIHART, R. K., AND N. A. SLADE. 1985. Testing for independence of observations in animal movements. Popul. Ecol.
20: 281–325.

Space Use and Activity of Baird’s Tapir 437
TERWILLIGER, V. J. 1978. Natural history of Baird’s tapir on Barro Colorado Island, Panama Canal Zone. Biotropica10: 211–220.
VAUGHAN, C. 1981. Parque Nacional Corcovado. Plan de Manejo y Desarrollo. Universidad Nacional, Heredia, CostaRica.
———. 1983. A report on dense forest habitat for endangered species in Costa Rica. Editorial de la UniversidadNacional, Heredia, Costa Rica.
———, AND C. M. RODRIGUEZ. 1997. Managing beyond the borders: the Costa Rican National System of Conser-vation Areas (SINAC). In G. K. Meffe and C. R. Carroll (Eds.). Principles of conservation biology, 2ndedition, pp. 288–299. Sinauer Associates, Sunderland, Massachusetts.
WILLIAMS, K. 1984. The Central American tapir in northwestern Costa Rica. Ph.D. dissertation. Michigan StateUniversity, East Lansing, Michigan.