home health study report - home - centers for medicare & medicaid
TRANSCRIPT
Home Health Study Report HHSM-500-2010-00072C
Literature Review
January 11, 2011
Prepared for: Centers for Medicare and Medicaid Services (CMS) 7500 Security Boulevard Baltimore, MD 21244-1850 Prepared by: Judy Goldberg Dey, Ph.D. Margaret Johnson, MBA William Pajerowski Myra Tanamor, MPP Alyson Ward, RN, MPH L&M Policy Research, LLC 1033 31st St, NW, 2nd Floor Washington, DC 20007 Phone: (301) 758-5293 E-mail: [email protected]
HHSM-500-2010-00072C
i
TABLE OF CONTENTS
INTRODUCTION ............................................................................................................................................ 1
METHODOLOGY ........................................................................................................................................... 2
Define Search Terms and Criteria ............................................................................................................ 2
Develop Literature Search Process ........................................................................................................... 3
Retrieval and Abstraction ......................................................................................................................... 3
Review and Report ................................................................................................................................... 4
DEVELOPMENT OF THE HOME HEALTH PAYMENT SYSTEM ...................................................................... 4
OVERVIEW OF THE HOME HEALTH PROSPECTIVE PAYMENT SYSTEM ..................................................... 5
OASIS ...................................................................................................................................................... 7
Changes to the HH PPS since Implementation ........................................................................................ 7
2011 Proposed Rule ............................................................................................................................. 8
Section 3131 (d) of the ACA .................................................................................................................... 9
HOME HEALTH INDUSTRY STRUCTURE AND ORGANIZATION ............................................................... 10
Characteristics of Medicare home health patients .................................................................................. 10
Higher Need Patients ......................................................................................................................... 11
Home Health Care Agencies .................................................................................................................. 12
Ownership Status ................................................................................................................................ 12
Facility Size ........................................................................................................................................ 14
Practice Variation .............................................................................................................................. 14
Home Health Care’s Role in the Overall Delivery of Health Services .................................................. 15
Relationship Between Medicare and Medicaid Home Health Programs ........................................... 16
MEASUREMENT OF HOME HEALTH CARE ACCESS FOR VULNERABLE POPULATIONS ...................... 17
Measures of Availability ........................................................................................................................ 18
Measures of Realized Access ................................................................................................................. 18
Outcome Indicators ................................................................................................................................ 19
Access for Vulnerable Populations ......................................................................................................... 20
Access for Low-Income Beneficiaries ................................................................................................ 20
Access for Beneficiaries in Medically Underserved Areas ................................................................ 21
Access for Beneficiaries with Varying Levels of Severity of Illness ................................................... 21
COST ASSOCIATED WITH PROVIDING HOME HEALTH CARE AND ITS RELATIONSHIP WITH REIMBURSEMENT ....................................................................................................................................... 23
HHSM-500-2010-00072C
ii
Evidence of the Relationship Between Costs and Reimbursement - Margins ....................................... 24
The OASIS Instrument and Relationship to Home Health Costs ........................................................... 26
Payment Adequacy for Low-Income Beneficiaries ................................................................................ 27
Payment Adequacy for Beneficiaries in Medically Underserved Areas ................................................ 28
Payment Adequacy for Beneficiaries with High Severity of Illness ...................................................... 29
VULNERABILITIES IN THE CURRENT PAYMENT SYSTEM ....................................................................... 30
Incentives and Vulnerabilities Inherent in the Current HH PPS ............................................................ 30
Fraud and Abuse ..................................................................................................................................... 31
EVALUATION OF OTHER PAYMENT SYSTEMS/MODELS IN TERMS OF THEIR POTENTIAL INCENTIVES AND IMPACTS.............................................................................................................................................. 33
Medicare Payment Models ..................................................................................................................... 33
Sources of Other Home Care Coverage ................................................................................................. 33
Potential Strategies from Other Payment Systems ................................................................................. 35
Case Mix / Patient Severity ................................................................................................................ 35
Outlier Payments, Service Caps, and Risk Sharing ........................................................................... 37
Access to Care for Low-Income Beneficiaries and Beneficiaries in Medically Underserved Areas . 38
Case Management .............................................................................................................................. 39
Cost Sharing ....................................................................................................................................... 39
OPERATIONAL ISSUES AND CONSIDERATIONS ......................................................................................... 40
Case Mix / Patient Severity ................................................................................................................ 40
Outlier Payments, Service Caps, and Risk Sharing ........................................................................... 41
Access for Low Income Medicare Beneficiaries and Beneficiaries in Underserved Areas ............... 42
Case Management .............................................................................................................................. 42
Cost Sharing ....................................................................................................................................... 42
DISCUSSION ................................................................................................................................................ 43
Low-Income Beneficiaries ..................................................................................................................... 43
Beneficiaries Residing in Medically Underserved Areas ....................................................................... 44
Beneficiaries with High Severity of Illness ............................................................................................ 44
BIBLIOGRAPHY .......................................................................................................................................... 46
HHSM-500-2010-00072C
1
INTRODUCTION
The Medicare home health benefit provides care to homebound individuals who are ill or injured and require intermittent (part-time) skilled nursing services or skilled therapy (CMS, Medicare and Home Health Care, 2010), covering about 3.3 million beneficiaries and resulting in $16.5 billion in total Medicare payments in 2008 (CMS, Data Compendium, 2009). The intent of Congress in crafting the benefit was to provide skilled services to treat a patient’s illness or injury for a finite and predictable period of time. While delivering home care to individuals recovering from acute-setting injuries or illness may result in overall savings (McKnight, 2006), caring for the chronically sick – patients whose illnesses may last a long time and will not likely resolve – is expensive and has elicited debate regarding the role the government should play in financing such care (Buhler-Wilkerson, 2007). Medicare payment policy for home health services has changed several times in the last decade, underscoring concerns regarding both Medicare’s financial responsibility and the ability of home health agencies (HHAs) to respond to payment policy changes (FitzGerald, Boscardin, & Ettner, 2009). One such significant change occurred with the creation and implementation of the Home Health Prospective Payment System (HH PPS) on Oct. 1, 2000, which was designed to bundle Medicare payment on the basis of a national standardized 60-day episode of care for all covered home health services, including medical supplies, paid on a reasonable cost basis, adjusted for patient severity by a case mix that is based on a patient’s clinical, functional and service utilization as well as geographic variation in costs and unusually low utilization or high-cost outliers. Covered home health services include: skilled nursing services, home health aide services, physical therapy services, speech-language pathology services, occupational therapy services, medical social work, and routine (built into the visit rates) and non-routine medical supplies. Beneficiaries may receive an unlimited number of consecutive home health episodes as long as they meet the eligibility standards for the benefit. Section 3131(d) of the Patient Protection and Affordable Care Act (ACA) requires the Secretary to conduct a study on HHA costs. To that end, the Centers for Medicare & Medicaid Services (CMS) contracted L&M Policy Research, LLC (L&M), to develop an analytic plan and provide background to aid the development of a study and report on potential revisions to the HH PPS. The goal of the study and report is to ensure access to care and adequate payment for vulnerable populations. Specifically, the legislation requires CMS to conduct a study on HHA costs involved in providing ongoing care to Medicare beneficiaries with low income, living in medically underserved areas, and requiring treatment for varying levels of severe illness. Further, the legislation requires CMS to analyze potential revisions to the HH PPS that account for costs related to severity of illness and improvement of access to care; subsequently, CMS will submit a report to the U.S. Congress on the study with recommendations for legislative and administrative action as the agency deems appropriate. For this scope of work, CMS has requested L&M analyze methods to potentially revise the HH PPS that address such concerns. This literature review will contribute to the evidence base for the remainder of the project.
HHSM-500-2010-00072C
2
METHODOLOGY
The research team designed a targeted literature review using relevant search terms in the PubMED and Academic Search Premier databases, as well as relevant Medical Subject Headings (MeSH) searches in PubMED. The team also reviewed CMS-provided documents and reports related to the implementation of the HH PPS in addition to home health literature from other agencies, including the United States General Accountability Office (GAO), the Medicare Payment Advisory Commission (MedPAC), the Department of Health and Human Services (DHHS), the Assistant Secretary for Planning and Evaluation (ASPE), and the DHHS Office of the Inspector General (OIG). Further, we completed a search of the LexisNexis database in the categories of major newspapers, Wall Street Journal (WSJ) abstracts, U.S. newspapers & wires, and magazine stories as well as specific searches of the WSJ, Forbes, and Fortune sites to provide further information on aspects of the home health industry as reported in the news. The researchers developed a search to better understand HHA costs involved with providing ongoing access to care to the target populations outlined in the ACA and sought to provide background for and answer the following questions:
• Are there home health care access problems for vulnerable populations? • Are access problems related to possible discrepancies between payments for vulnerable
populations and actual costs? • Are there potential payment system revisions (changes in payment adjustments or outliers
payments) that could reduce access problems for vulnerable populations? • Are there potential revisions to the payment system that could reduce its vulnerabilities?
The following outlines the key literature review tasks the study team completed to produce this scan.
Define Search Terms and Crite ria
The L&M study team created a list of terms and/or relevant combinations of terms and inclusion/exclusion criteria based on the described aims of the project and any specific CMS requirements:
• Home health (care) and patient characteristics • Home health and referrals • Home health (care) and case mix • Home health (care) and gaming • Home health (care) and payment accuracy • Home health (care) and payment system vulnerabilities • Home health (care) and payment system • Home health (care) and billing accuracy • Home health (care) and history • Home health care and vulnerable populations • Home health prospective payment system and vulnerable populations • Home health (prospective payment system) and disparities • Home health payment and disparities • Home health care and access • Home health care and Medicare
HHSM-500-2010-00072C
3
Additionally, the researchers utilized appropriate MeSH searches within PubMED to develop the research topics, including the following terms:
• Home Care Agencies/economics • Prospective Payment System/economics • Home Care Services/utilization • Home Care Services/cost • Home Care Services/therapy cost • Home health expenditures • Home health care/Medicare expenditures • Home health care/cost of services • Ownership status/home health • Home Care Services/utilization combined with Medicaid • Home Care Services/economics combined with Health Services Accessibility • Home care Services/economics combined with Poverty • Home Care Agencies/economics combined with Medicaid • Home Care Agencies/organization combined with Administration commercial • Home Care Agencies/organization combined with Administration private • Home Care Agencies/organization combined with TRICARE • Home Care Agencies/economics combined with Champus • Home Care Agencies/organization combined with Veteran
The L&M team also searched relevant government agencies for information, using terms such as “Home Health,” including reports published by GAO, MedPAC, OIG, and ASPE.
Develop Lite rature Search Proces s
Using the search terms and criteria outlined above, L&M conducted literature searches through PubMed and Academic Search Premier. After conducting the initial search, the team categorized the articles into three pools: 1) citations that appeared directly relevant to the literature review’s objectives, 2) sources that appeared peripherally pertinent, and 3) those deemed irrelevant. The team flagged the first group for immediate review, retained the second group for consideration, and discarded the third, although the group maintained a list of citations to avoid duplicative searches. L&M team members also scanned the bibliographies of articles placed in the first pool to search for other relevant material not abstracted from the original search.
Retrieva l and Abs trac tion
L&M searched and obtained articles from the aforementioned databases via the company’s direct access to libraries, such as John Hopkins University, Georgetown University, and the Library of Congress. When possible, the study team obtained full-text articles in an electronic format, allowing for computerized storage and cataloging. The researchers also maintained a working bibliography throughout the process, included at the end of this review.
After completing the search, L&M identified 158 relevant documents, including articles, reports, and briefs from government agencies.
HHSM-500-2010-00072C
4
Review and Report
L&M subsequently read each article and gathered relevant content into an evidence table that highlighted the key findings within the article and the research questions(s) to which it pertained. In presenting the results, the team structured the report into topic areas that sought to broadly answer the research questions and also include background information related to the research questions. The following sections provide an overview of the home health care system and regulations, discusses access difficulties for vulnerable populations, enumerates on payment system vulnerabilities, and reviews potential payment model revisions to address access problems and weaknesses.
DEVELOPMENT OF THE HOME HEALTH PAYMENT SYSTEM
Throughout the history of its development, the home health system has endured a long-standing lack of consensus regarding the principle goals and target populations of the benefit – whether a post-acute service (e.g., care after a hospitalization) or a social and supportive service (Benjamin, 1993). For decades, the boundaries of the home health care system have proved elusive, as the type and level of care has consistently clashed with the associated costs. Although the initial impetus for establishing home health care was charitable, the Metropolitan Life Insurance Company (MetLife) discovered that by providing home health care, it could prolong life while collecting premiums and abstaining from death benefit payments. Yet the model experienced a requisite shift in focus in the 1920s stemming from a decrease in contagious diseases coupled with the proliferation of chronic illnesses, such as heart disease, diabetes, and stroke (Buhler-Wilkerson, 2007). MetLife and other insurers found that providing more care did not improve outcomes and sought to limit visits and eliminate the type of personal services offered. Ultimately, MetLife discontinued home nursing services, determining it unprofitable (Buhler-Wilkerson, 2007). The years following World War II witnessed an increase in chronic conditions that overwhelmed hospitals and institutions, which, in turn, renewed interest in home health as an alternative to institutional care (Benjamin, 1993). Still, the reductions in institutional care assumed to flow from home health care proved elusive to document, and it was difficult to identify the appropriate population requiring home health care. Enormous variation in services contributed to the Health Insurance Association of America’s conclusion in 1959 that home health care had not produced cost savings and, furthermore, home health services were appropriate in only limited cases (Buhler-Wilkerson, 2007). The Medicare and Medicaid programs included the home health benefit when they were established in 1965, but the Medicare benefit was limited primarily to post-acute care due to concern that a more expansive program would produce uncontrollable costs (Buhler-Wilkerson, 2007; Benjamin, 1993). Several legislative changes, judicial rulings, and general changes to the system as a whole expanded the provision of home health services. Specifically, the Omnibus Reconciliation Act of 1980 removed limits on the number of home health visits, prior hospitalization requirements, and deductibles, additionally permitting participation of for-profit HHAs. The Duggan v. Bowen (1988) class action suit brought against the DHHS (Liu, Long, & Dowling, 2003) also broadened eligibility, and the implementation of the hospital prospective
HHSM-500-2010-00072C
5
payment system yielded earlier patient discharges from hospitals (Murkofsky & Alston, 2009). As a whole, these changes increased utilization, length of stay, fraud and abuse, and overall expenditures for the Medicare program (Buhler-Wilkerson, 2007). Home health expenditures rose from approximately $4 billion in 1990 to $17 billion in 1997, driven by large increases in the number of visits per home health user as well as increases in the number of beneficiaries using the benefit. From 1990 to 1997, the number of beneficiaries served per 1,000 also grew from 57 to 108 (CMS, Medicare & Medicaid Statistical Supplement, 2009).
The runaway home health expenditures in the mid 1990’s provided the impetus for Congress to enact the home health provisions in the Balanced Budget Act (BBA) of 1997, which gave DHHS authority to implement a HH PPS as well as a temporary payment mechanism, the Interim Payment System (IPS), effective October 1997. The IPS – the precursor to the HH PPS – dramatically reduced payments for Medicare FFS home health providers (Buntin, Colla & Escarce, 2009; Buhler-Wilkerson, 2007) and instituted both a limit on the cost per visit and the cost per beneficiary (McCall, Komisar, Petersons, & Moore, 2001). In addition, the BBA clarified definitions for eligibility and excluded venipuncture as a basis for qualifying for home health care (McCall, Petersons, Moore, & Korb, 2003). The BBA resulted in a decrease in utilization of home care services, the number of Medicare beneficiaries receiving home care, beneficiary visit frequency, payments, and care duration (Murkofsky & Alston, 2009). Total expenditures declined dramatically, falling over 50 percent from $17 billion in 1997 to $8 billion in 1999. Implementation of the IPS resulted in a decline in visit use from 73 visits per person in 1997 to 37.3 visits per person in 1999 (CMS, Medicare & Medicaid Statistical Supplement, 2009).
It was into this environment that the HH PPS was implemented on Oct. 1, 2000 – a system meant to incentivize efficient care delivery while reflecting the health conditions and service needs for an episode of care (Buhler-Wilkerson, 2007). Developed to predict resource utilization of home health patients based on individual patient characteristics, the HH PPS is a prospective payment system that reimburses HHAs a rate based on the clinical conditions and service use for a beneficiary for each 60-day episode of home health care. The rate is adjusted to reflect market prices and may also be adjusted for low numbers of visits or unusually high-cost outliers (MedPAC, Payment Basics: Home Health, 2010). Since the implementation of the HH PPS in 2000, however, there has been a steady rise in Medicare home health expenditures, number of certified home health agencies, and beneficiaries using home health. Expenditures grew from $7.2 billion in 2000 to $18.3 billion in 2009, exceeding pre-IPS expenditures, and between 2000 and 2009, the number of Medicare beneficiaries using home health services has grown 25 percent (CMS, Medicare & Medicaid Statistical Supplement, 2009).
OVERVIEW OF THE HOME HEALTH PROSPECTIVE PAYMENT SYSTEM
To qualify for the Medicare home health benefit, the Social Security Act requires a Medicare beneficiary be confined to the home under the care of a physician; receiving services under a plan of care established, certified, and periodically reviewed by a physician; in need of skilled nursing care (other than solely venipuncture) on an intermittent basis; in need of physical therapy; in need of speech-language pathology; or in continuous need of occupational therapy. Accordingly, the Medicare Home Health benefit covers the following: part-time or intermittent skilled nursing services; part-time or intermittent home health aide services; physical therapy; speech-language pathology; occupational therapy; medical social services; medical supplies; and
HHSM-500-2010-00072C
6
durable medical equipment with a 20 percent coinsurance. The Medicare HH PPS reimburses certified HHAs for 60-day episode of care through a prospective payment founded on a base rate, which is $2,192.07 per episode in 2011. This base payment rate is updated annually based on expected changes to a home health market basket capturing the price of HHA-purchased goods and services (CMS, 2010). The base rate undergoes various payment adjustments driven by differences in the expected costs of care caused by several cost and beneficiary characteristics.
To account for differences in beneficiary resource use, each patient episode is assigned to one of 153 home health resource groups (HHRGs) that capture information on the beneficiary’s clinical status, functional status, therapy utilization, and number of past home health episodes at the time of the given episode. These HHRGs are constructed using information captured with the Outcome and Assessment Information Set (OASIS) instrument (CMS, 2010). Beneficiary clinical characteristics, such as primary home care diagnosis, vision limitations, existence of wounds or lesions, shortness of breath, and use of injectable drugs, as well as functional characteristics – including dressing, bathing, toileting, transferring, and locomotion – are respectively scored and each patient-episode is assigned a clinical and function score indicating health severity (MedPAC, Assessing Payment Adequacy, 2010).
These characteristics are then considered with respect to a five-tiered set of equations accounting for three therapy thresholds and whether the patient previously had two or more home health episodes. The first threshold reimburses differently for episodes delivering between six and 13 therapy visits, depending on whether the patient had two or more home health episodes. Reimbursement for the next threshold of episodes, containing between 14 and 19 therapy visits, is also dependent on whether the patient previously had two or more home health episodes. The highest threshold controls for patients with 20 or more therapy visits during the 60-day episode, regardless of the number of past episodes. Each respective combination of clinical, functional, and therapy levels (totaling 153 HHRGs) is assigned a weight relative to the average episode, which, in turn, is multiplied by the base payment to account for a given beneficiary’s relative resource use. Payment is also adjusted for the estimated use of non-routine medical supplies the beneficiary is expected to utilize based on collected OASIS clinical and functional characteristics. Episodes with four or fewer home health visits are reimbursed under the Low Utilization Payment Adjustment (LUPA) on a per-visit basis and payment varies depending on the type of health care professional making the visit (CMS, 2010). The HH PPS includes several other payment adjustments apart from those associated with patient characteristics and resource use. Seventy-seven percent of the base payment – the labor portion of the base rate – is multiplied by a wage index to account for geographic differences in wages across Core Based Statistical Areas (CBSAs). A temporary three percent increase in the base rate is also made for rural facilities as mandated by the ACA (CMS, 2010) for most of CY 2010 through CY 2016. Additional outlier payments are available to agencies when episode costs exceed an outlier threshold set by CMS equaling the prospective payment provided by the PPS in addition to a fixed-dollar loss (FDL) amount equaling 67 percent of the geographically adjusted base payment (CMS, 2010). If this threshold is met, Medicare reimburses 80 percent of the excess in estimated costs, although, beginning in 2010, there were limits at the agency level on outlier payments as a percentage of total HH PPS payments that an HHA may receive.
HHSM-500-2010-00072C
7
OASIS
The OASIS assessment tool is used to collect the key data elements used to adjust payment under the HH PPS. All Medicare-certified HHAs are required to collect and submit OASIS data to CMS through their respective state agencies for all patients receiving home care covered under Medicare or Medicaid. A nurse or therapist is responsible for collecting the information by observation of patient function as well as patient responses. OASIS-C, an updated version of the OASIS data set, is used for all assessments of Medicare and Medicaid patients on or after Jan. 1, 2010. Multiple CMS-promoted uses for the tool include: individual patient assessment and care planning, creation of agency-level case-mix reports aimed at internal quality improvement payment adjustment under the PPS, and comparison of care across HHAs over time (CMS, 2010). Each of the agency-level quality measures presented publicly for CMS’ Home Health Compare Web site also comes from OASIS-collected data. OASIS data elements encompass a wide range of socio-demographic, environmental, health status, health service utilization, and functional status characteristics of adult patients. The majority of these data elements were created through a project jointly funded by CMS and the Robert Wood Johnson Foundation that aimed to create a set of outcome measures for home health outcome-based quality improvement (Shaughnessy, Crisler, & Schlenker, 1994; Shaughnessy, Crisler, & Schlenker, 1998) Through several rounds of clinical testing, empirical analysis, and consultation with a panel of experts, the OASIS tool has been frequently refined since its implementation (CMS, 2010). While noting some increased burden for HHAs and concerns for the privacy of beneficiaries, the GAO has commented that the tool improves the consistency of HHA performance and provides useful documentation of home care patients (GAO, 2001). Existing conditions; improvements in the patient’s ability to complete activities of daily living (ADLs); and utilization outcomes, such as receipt of emergency care and admission to an acute care hospital, are all tracked using OASIS (CMS, 2010). OASIS was not developed as a comprehensive assessment tool, however; it was instead originally intended as a basic set of patient outcome measures essential for assessment of beneficiaries’ health and changes over time.
Changes to the HH PPS s ince Implementation
Since the implementation of the PPS for HHAs in the 2000 final rule, CMS has continued to update the system through the rule-making process. Since the roll out of the HH PPS, annual update notices have been published that have primarily revised the base rate due to changes in the home health market basket, including the labor share of payment adjusted for differences in geographic area wages (MedPAC, Payment Basics: Home Health, 2010). The fixed dollar loss ratio used in the calculation of outlier payments has also been occasionally revised (CMS, Final Rule, 2006).
Since its development, the payment model has experienced several other significant revisions. Beginning with the 2007 calendar year, CMS replaced use of Metropolitan Statistical Areas (MSAs) for geographic adjustment of the labor portion of payment with use of CBSAs (CMS, Final Rule, 2006). A one-year transition period blended 50 percent of the new area labor marker designations’ wage index with 50 percent of the MSA market designations’ wage index. The Deficit Reduction Act of 2005 mandated that HHAs that did not submit OASIS assessments would receive a two percent payment reduction beginning in 2007.
HHSM-500-2010-00072C
8
An analysis completed by CMS in coordination with Abt Associates, also presented in the 2007 final rule, found that approximately 92%of the case-mix increase since the HH PPS began resulted from changes in coding practices and documenting existing conditions rather than increased service utilization or more resource-intensive patients. In response, CMS took steps in the 2008 final rule to address the increased payments due to “nominal coding change” by reducing the base payment by 2.75 percent a year for three years, followed by a 2.71 reduction in the final year (CMS, Final Rule, 2008). Throughout the rule-making process, CMS has frequently commented that it would continue to monitor the growth of real versus nominal case-mix growth (CMS, Final Rule, 2008; CMS, Final Rule, 2009; CMS, Proposed Rule, 2010; CMS, Final Rule, 2010). An additional reduction of 3.79 percent was recently proposed for both the 2011 and 2012 calendar years (CMS, Proposed Rule, 2010), and will be implemented for calendar year 2011 (CMS, Final Rule, 2010). In the 2010 final rule, CMS excluded the 2012 reduction from the regulation, pending another round of rulemaking and further study of nominal case mix change.
Also in 2008, an original set of 80 HHRGs was increased to the current set of 153 as a result of public comments and CMS’ concerns regarding the original case-mix model’s ability to accurately predict service needs. The expanded set of case mix groups included an increased number of therapy thresholds, added scoring criteria for the clinical score component of the resource groups, and considered whether the patient had more than two prior home health episodes. These criteria included new diagnosis groups, comorbidities, and interactions that improved the model’s overall explanatory power. While inclusion of both dual-eligible and caretaker status were considered, CMS found that both measures did not have strong explanatory power and presented other problems, so they were not included as payment adjustments (CMS, Proposed Rule, 2007).
CY 2011 Rulemaking
The 2011 proposed rule was published in July 2010 and includes typical payment-rate updates as well as CMS’ response to several new legislative mandates for Medicare home health care. The final rule for 2011, updates the wage index used under the PPS and, in accordance with the ACA, modifies the existing outlier policy (CMS, Final Rule, 2010). As mandated, CMS finalized a 10 percent cap on total outlier payments per agency relative to total payments received under the PPS as well as a five percent reduction in the standard episode payment with 2.5 percent of those savings paid out as outlier payments. The rule updates the national standardized 60-day episode rates, the national per-visit rates, the non-routine medical supply (NRS) conversion factors, and the LUPA add-on payment amounts for the 2011 rate year. CMS also revised the capitalization requirements for HHAs, creating additional transparency as new agencies seek certification for Medicare reimbursement (CMS, Final Rule, 2010). Further, because ACA established a physician face-to-face encounter requirement for certification of eligibility for home health services, the final rule provided that the encounter must occur with the 90 days prior to start of care, or within the 30 days after. The law also allows certain non-physician practitioners to perform the encounter and inform the certifying physician regarding the clinical condition of the patient. The encounter requirement was recommended by MedPAC and later incorporated into the ACA as a means of increasing physician accountability and providing an additional check on beneficiaries’ eligibility for home health benefits (MedPAC, Report to Congress, 2010). The ACA also mandated, and CMS included, a three percent rural add-on through December 15,
HHSM-500-2010-00072C
9
2015 (CMS, Final Rule, 2010). CMS also noted its intent to move forward with remaining ACA mandates, such as the completion of a study and report to Congress on potential revisions to the HH PPS, in addition to pursuing work addressing ongoing internal concerns, such as the growth in real and nominal case mix. The 2011 final rule included a 3.79% reduction in payment rates, for CY 2011 only, to account for growth in nominal case mix (case mix increase that is unrelated to real changes in patient severity) and to defer finalizing a reduction for CY 2010 until further study of the case mix change data and/or methodology is completed (CMS, Final Rule, 2010).
Sec tion 3131 (d) of the ACA
When the president signed the ACA on March 23, 2010, the Secretary of Health and Human Services was directed to conduct a study of HHA costs to develop potential revisions to Medicare reimbursement for home health services. Motivated to maintain beneficiary access to care and reimburse at appropriate payment levels based on severity of illness and other factors, section 3131 (d) of the ACA mandates completion of a study with an accompanying report presenting recommended legislative and administrative action no later than March 1, 2014.
Although outside the scope of this project, section 3131 of the ACA mandated several other changes to home health reimbursement (Patient Protection and Affordable Care Act [PPACA], 2010). Section 3131 (a) mandates the DHHS rebase the home health base payment to account for trends related to the change in the typical number of visits, typical mix of services, level of intensity of services, average cost of providing care, and other factors per episode. Additionally, the section requires a MedPAC report that reviews the impact of changes on access to care, quality outcomes, and the number of HHAs in general and for subgroups, such as rural, urban, and non-profit providers. Section 3131 (b) made permanent an HHA-specific outlier cap such that these payments make up no more than 10 percent of each agency’s nonoutlier HH PPS program payments annually. Section 3131 (c) increases payment for rural facilities, with CMS implementing a three percent increase in payment for all episodes occurring at rural beneficiary residences between April 1, 2010, and before Jan. 1, 2016 (CMS, 2010).
Section 3131 (d) mandates the valuation of several factors affecting HHA costs. Primarily, the study (of which this literature review is a part) will evaluate costs associated with providing ongoing access to care for low-income beneficiaries, those in medically underserved areas, and those with varying levels of illness severity. Potential refinements to the HH PPS will be considered for payment adjustments for services requiring additional or fewer resources, including those with deviations in resource use for low-income beneficiaries or those residing in medically underserved areas. The review will also include the current use of outlier payments for the most seriously ill or resource-intensive beneficiaries in addition to operational challenges and repercussions arising from any revision to the home health payment system that could impact Medicare or HHAs.
Section 3131 (d) suggests that the study consider several potential measures for severity of illness and access to care. Such variables include, but are not limited to: population density and patients’ relative access to care, variations in service costs for dual-eligible beneficiaries, presence of severe or chronic illness, and poverty status (PPACA, 2010). Throughout the project, DHHS is mandated to consult with appropriate stakeholders, including advocacy groups for HHAs and beneficiaries. Following submission of the report, a demonstration project may be
HHSM-500-2010-00072C
10
initiated at the secretary’s discretion to further investigate the study’s results and explore potential refinements to HHA payment.
HOME HEALTH INDUSTRY STRUCTURE AND ORGANIZATION
The Medicare home health benefit has grown since the implementation of the HH PPS, with Medicare payments for home health rising from $8.5 billion in 2001 – the first full year under the PPS – to $16.9 billion in 2008 (CMS, Data Compendium, 2009), a trend stemming from both an increase in home health care patients and an increase in episodes per patient (MedPAC, Medicare Payment Policy, 2010). The number of home health users per 1,000 FFS beneficiaries rose from 71 to 90 between 2001 and 2008, and the average number of visits rose from 31 to 38 in the same time period (CMS, Data Compendium, 2009). During this period, Medicare-certified home health agencies grew in number – from 6,809 in 2001 (CMS, 2003) to 10,422 in 2008 (MedPAC, Medicare Payment Policy, 2010).
Despite growth in the number of available providers, policymakers have expressed concern that certain subgroups may have difficulty accessing Medicare-covered home health services. To evaluate this claim, it is important to understand when and for what reasons patients may use home health services, what may substitute for home health services, and the factors affecting the availability of services for a particular individual. The industry has proven to be responsive to payment incentives, and it is important to first understand the industry structure, organization, and labor force before evaluating potential impediments to access and determining how it may be improved through revisions to the payment system.
Charac te ris tics of Medicare home health pa tien ts
To qualify for the Medicare home health benefit, the Social Security Act requires a Medicare beneficiary to be confined to the home under the care of a physician; receiving services under a plan of care established, certified, and periodically reviewed by a physician; be in need of skilled nursing care (other than solely venipuncture) on an intermittent basis; or physical therapy; or speech-language pathology; or have a continuing need for occupational therapy. The Medicare Home Health benefit covers the following: part-time or intermittent skilled nursing services; part-time or intermittent home health aide services; physical therapy; speech-language pathology, occupational therapy; medical social services; medical supplies; and durable medical equipment with a 20 percent coinsurance. In 2008, over 10 percent of home health patients had a diagnosis of diabetes, followed by essential hypertension (7.0 percent), heart failure (6.7 percent), and chronic skin ulcer (4.3 percent). The profile of beneficiaries’ specific diagnoses has changed significantly since the implementation of the HH PPS, with particularly large growth in the diagnosis of diabetes and essential hypertension (CMS, Data Compendium, 2009; CMS, 2002).
Depending on the needs of the patient, there can be differences in the average number of visits per patient, length of visit, number of home health disciplines involved in home care, number of alternative services provided, and involvement of the referring physician with the patient’s care plan and discharge (Brega, et al., 2002). In 2008 the average home health patient with a principal diagnosis of diabetes received 84 visits per year, compared to 39 visits for chronic ulcer of skin, or 23 visits for heart failure (CMS, Data Compendium, 2009; CMS, 2002). No standards have been developed for practice patterns to identify the appropriate number of visits, length of visit,
HHSM-500-2010-00072C
11
or number of health disciplines involved in home care for any given condition needed (GAO, 2000; GAO, 2002), and the practice of home health care has responded rapidly to changes in payment policy (FitzGerald, Boscardin, & Ettner, 2009). Since the implementation of the HH PPS, patterns in the type of service utilized have shifted: Of the percentage of total home health visits, home health aide visits have fallen from 25 to 18 percent while skilled nursing and therapy visits have increased from 50 to 55 percent and 24 to 26 percent, respectively, from 2001 to 2008 (MedPAC, Data Book, 2010). Overall, physicians generally have limited involvement in developing the plan of care – except during major milestones, such as re-certifications and before discharge – and a larger number of disciplines tended to be involved in providing care for longer episodes (Brega, et al., August 2002).
High-Need Patients
The number of services some patients require may vastly exceed averages. For example, Cheh and Schurrer (2010) identified a subset of beneficiaries comprising 13 percent of the Medicare home health population with high home health care needs defined as requiring: 1) two or more consecutive episodes of care, 2) help with three or more ADLs, and 3) human or technological assistance to move. According to Cheh and Schurrer (2010), patients who were both financial outliers and in this high-needs group were the highest users of home health care; had the highest rates of diabetes and pressure ulcers; and required more visits than other patients, both in skilled nursing and home health aide visits (financial outlier-only patients also required high numbers of skilled nursing visits). They also required more disciplines and receive multiple visits per day (Cheh & Schurrer, 2010).
Even though the high-needs patients received more home health care than the nondisabled, non-outlier beneficiary population, those representing the financial outliers utilized services at an even higher rate. Financial outliers were more likely to: be functionally and cognitively independent; live on their own; be recovering from a surgical wound; receive shorter, more frequent nursing visits; and receive longer, more frequent home health aide visits. The average length of skilled nursing visits was shorter for outlier patients than for the other patient populations (on average 20 percent shorter), while the average length of a home health aide visit was longer by 30 percent (Cheh & Schurrer, 2010).
In creating meaningful categories of home health patients, Murtaugh, Peng, Moore, and Maduro (2008) looked at the source of referral – whether the patient needed post-acute care or was community referred – and whether the patient was clinically complex, defined as having not well-controlled chronic conditions (a severity rating of two or more according to OASIS) in two or more body systems. They found that the clinically complex group referred from the community was most likely to have diabetes and hypertension, whereas the group that required post-acute restorative care was more likely to have an orthopedic primary diagnosis. The average length of stay for the clinically complex community-referred group was over twice that of the post-acute restorative-care group – 90 days versus 40.1 days (Murtaugh, Peng, Moore, & Maduro, 2008).
In a DHHS OIG study published in 2001, the authors also found Medicare home health referrals coming from the community (defined as a referral for a beneficiary who had not been admitted to an overnight stay in a hospital or skilled nursing facility for 15 days prior to beginning a home
HHSM-500-2010-00072C
12
health care episode) were more likely to have chronic conditions than those referred from hospitals and were, therefore, more likely to require ongoing care. A study published by the Visiting Nurse Service of New York in 2008 found that 26.4 percent of all patients discharged from home health care in both 2004 and 2005 suffered from multiple chronic conditions (affecting two or more body systems) that were not well controlled (Murtaugh, Peng, Moore, & Maduro, 2008).
Home Health Care Agencies
The home health care delivery system is comprised of different types of service providers, including skilled nurses, nurses’ aides, homemakers, physical therapists, medical social service workers, occupational therapists, and suppliers of durable medical equipment and supplies (Shi & Singh, 2008). Medicare covers a subset of these services, including, skilled nursing, home health aide visits, speech-language therapy, occupational and physical therapy, medical social service work, and durable medical equipment as outlined in the 2011 HH PPS final rule. Only Medicare-certified agencies can provide care to Medicare patients and receive reimbursement for the services. In order to be Medicare-certified, HHAs must minimally comply with the conditions of participation as described in the Code of Federal Regulations (2009), which include standards for personnel qualifications, patient rights, plans of care, reviews of plans of care and compliance with physician’s orders, reports and submission of OASIS data, maintenance and protection of clinical records, and comprehensive assessments of patients.
During 2009, there were over 10,000 Medicare-certified agencies, of which approximately 85 percent were freestanding; the remaining were affiliated with a hospital, rehabilitation center, or a skilled nursing facility. Approximately 70 percent of the freestanding HHAs were classified as proprietary or for-profit, and the remaining freestanding HHAs were non-profit agencies, including Visiting Nursing Associations, government or voluntary agencies, public agencies (typically run by the state or local government), and private non-profits (National Association for Home Care and Hospice, 2010). There were large regional differences in ownership status: In the South, 41 percent of the agencies were for-profit and 21 percent non-profit, compared to the North, which was 22 percent for-profit and 42 percent non-profit. Of the for-profit agencies, some are held by publicly traded firms. These include Addus Homecare, Almost Family, Amedisys, Gentiva, and LHC Group. The market share of these companies by state remains low (mid-single digit as a percentage of all episodes) to up to 30% in some states (Mayo and Gillmor, 2010).
Ownership Status
The OIG found that beneficiaries with certain conditions were more likely to receive services from non-profit rather than for-profit agencies (the authors considered a five percent difference significant). Non-profits cared for a higher proportion of patients assigned a DRG of coronary bypass with cardiac catherization whereas for-profit agencies were more likely to care for patients assigned a DRG for rehabilitation (OIG, 2006). In addition, for-profit agencies were more likely to serve those admitted from the community, as opposed to post-acute patients (Murtaugh, Peng, Moore, & Maduro, 2008).
In responding to changes in reimbursement policy, for-profit agencies have generally decreased their service area or closed it entirely, and are less likely to expand service areas than their non-
HHSM-500-2010-00072C
13
profit counterparts. Generally, researchers have found that for-profit HHAs tended to react more quickly to changes in reimbursement policy than non-profit agencies (Porell, Liu, & Brungo, 2006; FitzGerald, Boscardin, & Ettner, 2009).
The WSJ recently reported that publicly traded for-profit home health agencies changed their practice patterns in response to changes to the 2008 changes to the HH PPS with regard to therapy visits. Analyzing data reflecting the number of therapy visits completed in episodes of care from 2005 – 2008, the WSJ reported that for four publicly traded home health care companies (Amedisys, LHC Group Inc, Genetiva Health Services, and Almost Family, Inc.) visit patterns shifted in response to the new therapy thresholds. Specifically, they found once the reimbursement threshold went from 10 visits to thresholds of six, 14, and 20 visits, that the percentage of episodes with therapy visits in the 10-13 range dropped by about a third, and new clusters of numbers of visits formed around the new thresholds of six, 14, and 20 visits (Martinez, 2010).
Robert W. Baird & Co, a private equity firm, recently published research which found that the behaviors of the public firms were similar to that of the entire industry, so the practice pattern changes noted in the WSJ analysis is not just limited to publicly traded firms (Mayo and Gillmore, 2010). The analysis also found wide variation in the number of therapy episodes provided across states that could not be explained by responses to the payment system. Their results suggested a less drastic change in therapy visits than the WSJ had reported, suggesting the article overestimated the change in therapy visits by only analyzing episodes with at least one therapy visit, and had used a percent change of a percent change, which they consider to be an inappropriate measure (Mayo & Gillmor, 2010). Further, they argue that contrary to the findings of the article, 59 percent of therapy episodes did not have key thresholds in 2007 or 2008, suggesting that HHAs are not gaming the reimbursement system as other researchers have suggested. Changes in patient case mix may also explain changes in numbers of visits, as HHAs can adjust patient mix easily (Mayo and Gillmor, 2010).
Investment Risk
Some HHAs may rely on the investment community’s providing capital to ensure continued financial viability and operations. Government regulatory changes have been shown to affect home health practice patterns for home health care providers as well as investor outlook on the future profitability of the home health industry and their willingness to continue to invest in the industry (Market Insight, 2010). Available research suggests that investors view the home health sector risky due to regulatory risks in the home health industry and a history of bankruptcies experienced in the home health industry (van Der Walde & Daniels, 2002, and van Der Walde & Lindstrom, 2003). In response to the 2011 Proposed Rule, Credit Suisse noted that the proposed rates were worse than expected and would likely lower share earnings estimates in both 2011 and 2012 (Market Insight, 2010). In addition, there have been continued concerns related to the risk of increasing costs due to skilled staffing shortages (van Der Walde & Daniels, 2002, and van Der Walde & Lindstrom, 2003). Current estimates from the Bureau of Labor Statistics (BLS) suggest that the home health care industry will continue to require more staffing: From 2008 to 2018, the home health sector will require a 46 percent increase in home health workers as compared to 22 percent in the health care sector as a whole (Career Guide to the Industries, 2010-11 Edition).
HHSM-500-2010-00072C
14
Despite these risks, investor reports suggest there are some positive economic drivers that should push the sector forward, including: demographics, patients’ desire to be at home, and the pursuit of the lowest cost alternative to providing care. As services are provided in the home, the industry incurs limited capital costs related to owning and maintaining facilities (van Der Walde & Daniels, 2002, and van Der Walde & Lindstrom, 2003). Investors may also expect cost containment activities in the industry (Shilling, 2004). For example, from 2001 to 2004, Amedisys controlled costs and cut the number of visits per episode by implementing disease management programs (Kroll, 2004).
Facility Size
As Murtaugh et al. (2008), showed, facility size, measured by the overall number of patients served, may also affect the type of patients served. As the size of the agency increased, the agency was more likely to admit post-acute patients rather than patients from the community, and larger facilities were less likely to admit clinically complex community-referred patients (Murtaugh, Peng, Moore, & Maduro, 2008).
Practice Variation
There can be wide practice variation in how a HHA treats patients with the same conditions (FitzGerald, Boscardin, & Ettner, 2009). Researchers have investigated patient, physician, agency, and market-regulatory factors to understand this variation and have found that for-profit agencies tend to provide more visits over shorter episodes of care than non-profit agencies. The 2008 CMS Medicare and Medicaid Statistical Supplement shows large differences in visit patterns based on ownership status. For-profit agencies on average provide more skilled nursing and home health aide visits (29) than voluntary non-profits (13) and government agencies (15). For-profit agencies also provide more home health aide visits, with an average of 35 per person served compared with 20 and 24 from voluntary non-profits and government agencies, respectively (CMS, Medicare & Medicaid Statistical Supplement, 2008). Even with these differences in the for-profit and non-profit agencies, Grabowski, Huskamp, Stevenson, & Keating (2009) found little statistical difference in outcomes based on ownership status, measured by whether the patient’s goals of care were met, the patient was transferred to an inpatient setting, or the patient died. Variations in practice patterns occur along other characteristic dimensions: Freestanding HHAs often provide more visits and have longer episodes of care than do hospital-based HHAs (Brega, et al., August 2002), and region of residence may also affect practice patterns. In 2007, there was wide variation by state in the average number of visits per home health beneficiary and average payment for home health episode. For example, the average reimbursement for patients in North Dakota was $2,396 versus $7,761 in Nevada. The average number of visits also varied – from an average of 18 visits per beneficiary to over 66 visits per beneficiary, depending on the state of residence (CMS, Medicare Fee For Service Parts A and B Overview, 2010). CMS has noted suspect billing practices in targeted areas of the country, and as such has instituted a cap on agency outlier payments that would limit outlier payments to no more than ten percent of an agency’s Medicare home health payments (CMS, Final Rule, 2010).
HHSM-500-2010-00072C
15
Home Health Care’s Role in the Overa ll Delivery of Health Services
HHAs are often responsible for care following an acute-care episode in a hospital and help avoid use of institutional care when a person can remain at home. While care received in different post-acute settings may vary by patient needs and characteristics, factors beyond merely patient characteristics may drive the decision to discharge a patient, including availability of beds, preferences of a physician or family, referral patterns of the facility, and other practice patterns (Kramer, Holthaus, Goodrish, & Epstein, 2006). Home health care following a hospitalization may promote earlier discharge, as skilled staff in the home may administer the type of recovery services usually performed in the hospital. For post-acute patients, home health care is one option among many. Of the beneficiaries discharged from post-acute care to use other services, a little over 40 percent go to skilled nursing facilities, and 37.4 percent are sent home with home health services. The rest of post-acute patients are discharged to outpatient therapy services, or they receive continued services at a specialized hospital, like an IRF or long-term care hospital (Gage, Morely, Spain, & Ingber, 2009). Whether these patients use home health services as opposed to other services depends not only on their conditions but also on the organizational relationships of the hospital. For example, if a hospital has a sub-provider that is an inpatient rehabilitation hospital or has a co-located inpatient rehabilitation hospital, the hospital is much more likely to discharge to an inpatient rehabilitation hospital, holding all else constant (Gage, Morely, Spain, & Ingber, 2009). In addition, changes in the reimbursement policy in other post-acute settings may impact the use of home health care. For example, Mayo and Gillmor (2010) speculated that recent changes to the IRF reimbursement policy enacted in 2008 may have lowered the percentage of joint replacement cases that IRFs were able to admit. Some of these patients may have still required therapy visits, so they may have been admitted to home care rather than IRFs. The analysts suggest that it is difficult to discern the exact impact of changes to IRF reimbursement policy on HHA therapy visits, but it is important to look at the entire Medicare reimbursement landscape to understand policy changes’ impacts on therapy visit utilization under the home health benefit (Mayo and Gillmor, 2010). Even though there are several post-acute services available (depending on condition), post-acute home health utilization has remained stable in recent years and is characterized by fewer episodes of care and likely condition improvement (Christman, November 4, 2010). Growth in home health utilization is coming disproportionately from the non-acute population, however. According to a recent MedPAC presentation, from 2001 to 2008, the number of referrals from the community increased by 48 percent (starting at approximately two million referrals in 2001) while from both the hospital and post-acute care setting, the growth was 12 percent (starting at about two millions referrals in 2001). Although home health was split evenly between post-hospital patients and those admitted from the community in 2001, eight years later, two-thirds of home health referrals came from the community (Christman, December 2, 2010). While researchers have measured community referral and post-acute care slightly differently (Murtaugh, Peng, Moore, & Maduro, 2008), it is likely that there has been growth in these types of referrals nonetheless.
HHSM-500-2010-00072C
16
Medicare requires placement of discharge planners in hospitals to assist individuals leaving the facility who require post-hospital care – including referring patients to home-based care (42CFR482.43) – but physicians usually refer beneficiaries coming from the community. Such beneficiaries may also rely on support networks of family and friends or aging networks to find care (OIG, 2001). Although some of these individuals may have had to rely on institutional care to meet their needs if they were not provided by formal home health care, such as nursing facilities, research has shown that decreases in formal home health care may also increase the use of informal care or private payment for care (Golberstein, Grabowski, Langa, & Chernew, 2009). When home health care is not provided either for community or hospital referrals, individuals may be more likely to rely on skilled nursing facilities and emergency rooms or the patients may end up being hospitalized or re-hospitalized (MedPAC, 2003).
Relationship Between Medicare and Medicaid Home Health Programs
Medicare beneficiaries receiving home health care may also be eligible for Medicaid, depending on their financial resources or disability status. Those dually eligible for Medicare and Medicaid are among the most expensive groups to cover for the Medicare program. Dual eligibles are more likely to use more Medicare-covered home health services than other Medicare home health patients. Medicaid provides wrap-around financing for the services that Medicare covers (Coughlin, Waidmann, & O'Malley Watts, 2009). Moreover, the primary benefit that Medicaid covers for dual-eligible beneficiaries is long-term care, with both Medicare and Medicaid covering home health care benefits.
While Medicaid or Medicaid waiver programs may pay for some services not covered by Medicare (e.g., personal or home health aides services in cases where a patient does not require skilled nursing services) (Kenney & Rajan, 2000), the overlap between the programs provides sufficient incentives to cost-shift from one program to another. In a 2004 study focusing on dual-eligible patients enrolled in Connecticut’s Medicaid home- and community-based waiver program, Fortinsky, Fenster and Judge (2004) found a relationship between personal care, ADL use and expenditures for both Medicare and Medicaid home health services (the authors looked at bathing, dressing, eating, toileting, and transferring). They found that a greater number of restricted ADLs correlated with increased use and expense for both Medicare and Medicaid. Cognitive impairment was correlated with higher home- and community-based service use but not with Medicare and Medicaid home health use. Overall, most medical conditions increased the likelihood of using Medicare-covered home health services; however, only congestive heart failure, urinary tract infections, and diabetes increased Medicare expenditures. Stroke was the only condition correlated with increased likelihood of Medicaid use and increased waiver expenses (Fortinsky, Fenster, & Judge, 2004).
Given the high degree of overlap in services between programs, some Medicaid programs have been known to employ “Medicare maximization” to shift dollars from Medicaid to Medicare. For example, states with low Medicaid spending tend to have higher Medicare home health spending. Medicaid programs will pay for the wrap-around services (e.g., patient cost sharing; however, there is no beneficiary liability for Medicare home health), but they have the incentive to limit benefits overall in order to maximize Medicare (Grabowski, 2007). Kenney and Rajan (2000) also found a negative relationship between Medicaid spending and the use of Medicare home health; in other words, as Medicaid home health spending decreases, Medicare home
HHSM-500-2010-00072C
17
health use increases and vice versa. This phenomenon is not universal, however; while some states practice Medicare maximization, other state Medicaid programs have expanded their home health benefits. The expansion in some states was due mainly to state efforts to contain nursing home expenses (Murkofsky & Alston, 2009).
Although there is financial overlap with Medicaid, Medicare carries the burden of home health expenditures for dual-eligible beneficiaries. According to a Kaiser Family Foundation (2009) report, for beneficiaries under the age of 65, Medicare covers 57 percent of home health costs, with average $200 per capita spending compared to $147 for Medicaid. For beneficiaries over the age of 65, Medicare covers over 75 percent of the expenditures, paying $797, versus $260 per capita in expenditures for Medicaid. Overall, for all dual eligibles, Medicare covers 72.7 percent of the costs of home health care (Coughlin, Waidmann, & O'Malley Watts, 2009).
MEASUREMENT OF HOME HEALTH CARE ACCESS FOR VULNERABLE POPULATIONS
The complexity of the home health care system, its historically rapid responses to any policy changes, lingering questions as to the appropriate structure of the benefit, and the need to reign in spending have all raised concerns among policymakers and health care professionals regarding access issues for vulnerable populations. But to assess whether access is a current or imminent issue requires meeting the challenge of defining what constitutes “access.” Since the late 1960s, health services researchers have worked to define and refine the meaning of access, depicting categories of factors and characteristics that determine whether and to what extent individuals can “obtain needed, affordable, convenient, acceptable, and effective personal health services in a timely manner (Shi & Singh, 2004).” While in the 1970s researchers focused on the characteristics of the health care system and at-risk populations to look at actual utilization of health care services and consumer satisfaction with these services (Aday & Anderson, 1974), more recent researchers have emphasized the importance of outcomes in assessing access to services (Committee on Monitoring Access to Personal Health Care Services, 1993). Researchers have also underscored the difference between availability of services – the relationship between the volume and type of existing services (and resources) to the client’s volume and type of needs – and factors that influence the ability to utilize these resources (Pechansky & Thomas, 1981). In general, access to care has been measured for specific populations, assessing whether there are systematic differences in use or outcomes by particular groups and the barriers they face in accessing care (Committee on Monitoring Access to Personal Health Care Services, 1993). Measuring access, particularly in the case of home health care, has been difficult, in part because of a lack of standards for what constitutes appropriate or necessary care (GAO, 2000; GAO, 2002). Furthermore, the number of available agencies may not be indicative of adequate access, as recent research has demonstrated that, historically, decreases in the number of agencies – and utilization of home health services – has not produced poorer outcomes (see, for example, McKnight, 2006 and Schlenker, Powell, & Goodrich, 2005). An assessment of the number of facilities and staffing levels alone may omit important case-mix or practice patterns that affect patient access for particular populations as well (Smith, Maloy, & Hawkins, 2000).
HHSM-500-2010-00072C
18
Although outcome measures have been developed to assess home health care (the OASIS, see Schlenker, Powell, & Goodrich, 2005), there is no consensus regarding the outcomes that should be considered in measuring the effectiveness of home health. In addition, OASIS assumes that an individual is receiving home health care and, therefore, cannot measure outcomes for those who do not receive home health care, a fact that makes it difficult to determine the relationship between lack of utilization and access to care. These difficulties have meant that there are no externally valid measures for understanding the number of agencies and staffing types or levels that are necessary for a given population type or geographic area. Nor has there been consensus generated on measuring home health access outcomes (or whether those services are reaching appropriate populations effectively).
Meas ures of Availab ility
Some researchers have looked directly at the number of home health agencies operating in a particular geographic areas to assess access or facility adequacy. In 2010, MedPAC found that 99 percent of beneficiaries lived in a ZIP code where a Medicare HHA operated and 97 percent lived in an area with two or more agencies – similar findings from analyses conducted in prior years that also included overall counts of the number of home health agencies in the country (MedPAC, Report to the Congress: Medicare Payment Policy, 2006-2009). In 2010, MedPAC reported that HHAs vary significantly in size or patient caseload and noted that the number of providers in an area is not the only measure of capacity. Even staffing may not measure actual capacity due to the possibility of contracted employment. In addition, this measure fails to compare the volume of individuals in a geographic area requiring home health services and the adequacy of supply in relation to the volume of individuals. In assessing adequacy of home health agencies, the literature has also explored the ability of agencies to continue to operate, as this is a prerequisite to access (Choi & Davitt, 2009). These studies may rely on interviews with facilities or investors to assess their access to capital and financial viability (see MedPAC, Medicare Payment Policy, 2010 and Lin & Meit, 2005). In general, these studies have included measures of financial performance and margins of facilities using cost-report data (MedPAC, Medicare Payment Policy, 2010). The assumption is that agencies with positive margins will remain open, and, in general, research has concluded that facility adequacy is a prerequisite for access. Still, facility numbers alone are a poor determinant of access, in part because of uncertainty as to what constitutes the “right” number and characteristics of facilities to ensure adequate services (Choi & Davitt, 2009).
Meas ures of Realized Acces s
Availability measures alone do not reveal the extent to which access has been achieved: Even if an agency serves a patient’s area, this does not necessarily imply that the individual has been accepted as a patient (Smith, Maloy, & Hawkins, 2000). A direct way to measure access is by examining overall service utilization. This exercise has been conducted in numerous studies of various subgroups (including diagnosis or geographic location) or time periods (for example, Sutton, 2005, Murtaugh, McCall, Moore, & Meadows, 2003, McCall, Komisar, Petersons, & Moore, 2001, FitzGerald, Boscardin, & Ettner, 2009, McCall, Petersons, Moore, & Korb, 2003). Researchers have additionally looked at the number of visits and types of staffing used for a given population (for example, McCall, Petersons, Moore, & Korb, 2003). Because ideal utilization is not known, several studies compared utilization at points in time, hypothesizing that
HHSM-500-2010-00072C
19
changes in utilization might indicate problems with access (for example, Grabowski, Stevenson, Huskamp, & Keating, 2006, FitzGerald, Boscardin, & Ettner, 2009). When combined with outcome indicators, researchers have pointed out that changes in utilization do not necessarily imply reductions in access to necessary care. For example, in evaluating the impacts of the BBA, McKnight (2006) found that while there were dramatic reductions in services after the BBA, there were not any associated adverse health consequences. By interviewing hospital discharge planners to assess barriers to access, researchers have avoided the problem of determining whether utilization is warranted, as hospital discharge planners are serving only clients with a known requirement for home health care. The DHHS OIG (2006) surveyed discharge planners to determine whether they face difficulties or delays in placing patients who need home health services for various conditions and for different urban or rural locations. These studies have not found significant access problems for these types of patients (OIG, 2006).; however, most individuals utilizing home health services are coming from the community, not a hospital (Christman, November 4, 2010). Parallel studies have been conducted to determine if community beneficiaries have experienced access problems. Such studies have relied on surveys of physicians, HHAs, aging networks, and beneficiaries and have found minimal access problems, with some exceptions for certain types of clients (OIG, 2001). In evaluating the Per-visit Prospective Payment Demonstration, researchers at MPR also looked at changes in admission patterns over time for individuals likely to need long admissions (Cheh, 2001). In addition, researchers have used survey data to determine if individuals with ADL limitations are receiving help (Komisar, Feder, & Kaspar, 2005). While this does not capture all access problems, it can indicate problems for specific populations.
Outcome Indicators
While appropriate utilization of home health resources may not be clearly defined, researchers have postulated that if services are inadequate, observable negative outcomes should be noted. The literature points to several measures that may be suitable to include. Decreases in necessary home health services would correspond to observable increases in nursing home placement, hospitalization, hospital readmission, or emergency department use (D'Souza, James, Szafara, & Fries, 2009). On the other hand, other researchers have looked at utilization or all other medical services by number of events and overall expenditures (McKnight, 2006). Depending on the data source, researchers have also looked at whether an individual with an ADL receives help, and whether there is a shift to informal care providers if access to formal home health services is limited (Golberstein, Grabowski, Langa, & Chernew, 2009). Other researchers have analyzed outcomes such as mortality or survival rates in conjunction with utilization patterns (Kilgore, Grabowski, Morrisey, Ritchie, Yun, & Locher, 2009), while others have looked at the effect various measures of improvement or deterioration of condition have had on home health care utilization (Grabowski, Stevenson, Huskamp, & Keating, 2006; Schlenker, Powell, & Goodrich, 2005). Depending on the data source, this could include improvements in ADLs, IADLs, physiologic, or cognitive and emotional/behavioral measures. Deteriorating conditions coupled with lower numbers of visits or types of staffing might indicate access difficulties, while, taken alone, these might be considered quality problems.
HHSM-500-2010-00072C
20
Acces s for Vulnerable Popula tions
Most researchers have focused on particular populations in assessing whether individuals have access to home health care. There have historically been concerns with particular populations receiving adequate home health care, including the elderly, women, individuals with Medicaid, non-whites, and individuals with particular medical conditions (McCall, Petersons, Moore, & Korb, 2003). In keeping with the mandate expressed in the ACA, this study focused on individuals with high medical severity, individuals in medically underserved areas, and low-income individuals.
Access for Low-Income Beneficiaries Having low income may influence a beneficiary’s utilization of home health services. Low-income beneficiaries may have higher utilization rates because they have more severe medical conditions than the general population; differences in home ownership and living arrangements, which may impact the desirability of home care; and differences in educational status, which may influence the beneficiary’s ability to navigate the health care system. Additionally, lower income, itself, may affect an individual’s ability to pay for substitutes to Medicare-covered home health services (Freedman, Rogowski, Wickstrom, Adams, Marainen, & Escarce, 2004). Research has shown that when low-income beneficiaries face reductions in services, these beneficiaries tend to compensate through informal care (Golberstein, Grabowski, Langa, & Chernew, 2009; McKnight, 2006). Still, within the group of low-income beneficiaries, those with Medicaid status possess greater protection from utilization cuts than individuals with slightly higher incomes (Zhu, 2004). In fact, research has shown that individuals with Medicaid are more likely to receive home health services than those without, in part because of their higher-than-average need but also because they may use the case-management functions provided through Medicaid, which tend to increase access to home health services (Kenney & Rajan, 2000, McAuley W., Spector, Van Nostrand, & Shaffer, 2004). States that provide more generous Medicaid home health benefits have fewer dual eligibles with unmet needs (Kemper, P, Weaver, Short, Shea, & Kang, 2008). And because there exists overlap in the services Medicare and Medicaid provide, cost shifting may occur between the programs (Anderson, Norton, & Kenney, 2003). Even though low-income individuals with both Medicaid and Medicare coverage are more likely to be protected from utilization cuts, using 1999 survey data, Komisar, Feder, and Kaspar (2005) found that dual eligibles had significant unmet needs for assistance in ADLs (58 percent of those with ADL limitations reported having an unmet need). Furthermore, they found that state policies played a role in determining the extent of unmet needs, as higher home health expeditures correlated with lower rates of unmet needs. While researchers have identified dual-eligible enrollees using survey data that records both receipt of Medicare and Medicaid as well as income status, information on income may be unavailable from administrative records (see McAuley, Spector, Van Nostrand, & Shaffer, 2004 and Liu, Long, & Dowling, 2003 for examples of using different survey data to explore the relationship between income and home health utilization). It may be possible to identify low-income beneficiaries by using census data to examine geographic areas with low income levels;; claims data may not be used to identify dual eligible beneficiaries, however, and must, instead, use the Medicaid data files (Barosso, 2006). If a beneficiary has been admitted to an HHA, then the OASIS assessment includes a variable indicating whether the beneficiary has Medicaid as a
HHSM-500-2010-00072C
21
payment source (CMS, OASIS C Home Health Quality Initiatives, 2010). Still, this data source would not identify populations that may have needed care but did not receive it.
Access for Beneficiaries in Medically Underserved Areas The Health Resources and Services Administration (HRSA) Shortage Designation Branch develops criteria to decide whether a geographic region is a Medically Underserved Area (MUA). MUAs do not have to correspond to a whole county and can be more than one county or a group of urban census tracts. What matters is that the residents in the area have a shortage of personal health services (HRSA, 2010). While the literature does not address whether individuals in such areas have problems accessing care, it discusses access issues for rural residents, who may also be in a MUA. Because, to some extent, home health care can substitute for nursing home care, and in particularly rural areas, beds may be limited, there may be more need for and higher utilization of home health services in rural areas (McAuley W. , Spector, Van Nostrand, & Shaffer, 2004). Looking at narrower urban and rural categories (zip codes vs. counties), other researchers found that rural elders were more likely to reside in zip codes with low utilization of home health services per beneficiary (Hartman L., Jarosek, Virnig, & Durham, 2007). Researchers may use survey data to identify beneficiaries living in rural areas or the Medicare Denominator file, which contains the beneficiary’s county and zip code of residence. When the original HH PPS system was implemented, it included an add-on payment for HHAs treating rural residents – resulting from potentially higher travel and overhead costs – which, though initially intended to expire, was included in the ACA. While researchers have noted decreased utilization in rural areas, this does not necessarily imply a problem with accessing services (Sutton, 2005). Recent research has demonstrated that rural beneficiaries, conditional on receiving home health care services, receive fewer services, potentially the result of staffing shortages or large travel distances (Vanderboom & Madigan, 2008). Still, research has not yet shown whether the reduction in services corresponds to poorer outcomes or represents access problems (OIG, 2006).
Access for Beneficiaries with Varying Levels of Severity of Illness As each Medicare beneficiary is evaluated prior to using Medicare home health care using OASIS and classified into an HHRG, there is a system in place that could potentially allow researchers to define level of severity using the HHRG or OASIS elements. As discussed previously, OASIS covers three basic domains: clinical, functional, and service (Schlenker, Powell, & Goodrich, 2005). High severity can refer to a higher number of points in the HHRG system, indicating more clinical, functional, and service needs (Coleman, Wu, Goldberg, Deitz, & White, 2008). Many researchers have used diagnosis alone to track severity (see, for example, McCall, Komisar, Petersons, & Moore, 2001), while others have used various combinations of measures of chronic conditions, functional limitations, or overall expenditures to measure severity. Using the Medical Expenditure Panel Survey (MEPS) data, Alecxih et al. (2010), looked at the combination of functional limitations, presence of a chronic condition, and overall medical expenditures to understand severity of illness. Gage et al. (2009) focused on the acute-setting DRG to measure severity among post-acute care users coming from an acute setting. Other researchers combined the presence of chronic conditions and referral source to look at severity.
HHSM-500-2010-00072C
22
Murtaugh et al. (2008) developed a classification system of home health patients comprised of five exhaustive and mutually exclusive groups, including two clinically complex groups – one from a community admission, and the other post-acute1
. Clinical complexity was related to possessing two or more chronic conditions with a severity level (measured on OASIS) of two or more (Murtaugh, Peng, Moore, & Maduro, 2008). Additionally, Coleman et al. (2008) noted that an increased number of episodes of care was related to the presence of a chronic condition. Some researchers have used other measures of severity, including Hierarchical Condition Category (HCC) risk scores (MedPAC, Medicare Payment Policy, 2010).
Much of the research on the effect of varying levels of severity of illness on access to home health services has come from interviews and surveys using different classifications for severity (or not specifying severity levels at all). Using survey methods, some discharge planners reported that beneficiaries who need intravenous (IV) antibiotics and/or expensive drugs, those who have complex wound care needs, and those who need rehabilitation therapy most often experience delays before being placed in home health care. According to discharge planners, the delay occurred because the cost of providing these types of services was greater than Medicare reimbursement (OIG, 2006). For those individuals referred from the community, where individuals are more likely to have chronic conditions, some interviewed reported access concerns for diabetes, wound care, and Alzheimer’s disease (OIG, 2001). In reviewing changes after the BBA, Smith, Maloy, and Hawkins (2000) found that agencies developed screening methods to avoid high-cost patients (those under the payment system that would have costs the agency felt would exceed their payment). At the time of the study, agencies tended to avoid individuals who required long duration of care or two or more visits per day. These agencies instead found orthopedic rehabilitation patients, coronary artery bypass graft patients, non-diabetic post-operative wound care, and non-complex infectious disease patients. Researchers reported that complex diabetic patients were most affected by the lack of access to care, followed by those with congestive heart failure and chronic obstructive pulmonary disease (COPD) patients. In addition, the provision of mental health services was avoided (Smith, Maloy, & Hawkins, 2000). McCall, Petersons, Moore and Korb (2003) reinforced the survey results with a statistical analysis using primary and secondary diagnosis codes. They found that in response to the BBA, there were service reductions for diabetics, hypertensive disease patients, heart failure patients, cardiac disrythmia patients, and cerebrovascular disease patients. But because of payment policy changes, these results should be interpreted with caution. More research is needed to understand if there are particular conditions or a level of illness severity presently correlated with access problems.
1The categories included: Community Admission: Clinically Complex – 8.8 percent of all admissions and average LOS of 90.0 days. Community Admission: Other – 21.7 percent of all admissions and average LOS of 66.0 days. Post Acute: Clinically Complex – 17.6 percent of all admissions and average LOS of 58.7 days. Post Acute: Restorative Care – 41.2 percent of all admissions and average LOS of 40.1 days. Post Acute: Other – 10.7 percent of all admissions and average LOS of 55.4 days.
HHSM-500-2010-00072C
23
Historical evidence suggests that access may be difficult for beneficiaries for whom costs of care exceed Medicare payments (Smith, Maloy, & Hawkins, 2000). The next section reviews the differential costs for providing home health care for the populations discussed above.
COST ASSOCIATED WITH PROVIDING HOME HEALTH CARE AND ITS RELATIONSHIP WITH REIMBURSEMENT
In 2008, total payments for Medicare home health care totaled $16.9 billion with just over 10,000 agencies supplying care. These payments were based on 117.8 million visits – 55 percent for skilled nursing, 18 percent for home health aide, and 26 percent for therapy (physical, occupational, and speech-language), averaging $5,337 per episode (MedPAC, Data Book, 2010). Such reimbursements have been significantly higher than average costs, however: That year, margins for freestanding facilities averaged 17.8 percent (MedPAC, Medicare Payment Policy, 2010). Still, reimbursements are not necessarily higher for costs representing every patient or facility. In fact, in cases where the cost of treating certain types of patients exceeds the reimbursement, there is no incentive to admit these patient types. Likewise, if there are certain types of facilities where reimbursement is below cost, these agencies may be unable to continue providing care – an issue if these HHAs serve vulnerable populations (Cheh, 2001).
The general costs of running a home care agency can be divided into two primary categories: patient care and overhead (GAO, 2004). Most of the variable costs HHAs face are related directly to patient care and usually arise on a per-visit basis, such as transportation, non-reusable medical supplies, and wages for nurses or other professionals associated with a visit (Doherty & Thal, 1995). These variable costs depend largely on the treatment provided to the patient, including the number and length of visits and the staff used to perform the visits (Coleman, Wu, Goldberg, Deitz, & White, 2008). While, on average, a patient’s clinical and functional characteristics, as well as his or her therapy needs, may affect services used, the relationship between these characteristics and the actual service an HHA provides can vary substantially (HCFA, 1999). While the model for the HH PPS has an explanatory power of approximately 45 percent, this relies heavily on the actual use of therapy services (Christman, November 4, 2010).
The per-visit cost of home health care is an important factor in determining an agency’s profitability. According to MedPAC, financially better-performing agencies tended to provide fewer visits per episode, suggesting that agencies have a financial incentive to provide fewer visits, perhaps because the costs associated with more frequent visits – or the conditions of patients requiring more visits – outweighs the financial benefit to the agency (MedPAC, Medicare Payment Policy, 2010). Lowing variable costs may increase fixed costs if an agency has to provide more supervision or monitoring of cases to ensure visit reductions (Cheh, 2001).
Among variable costs, nursing care on average accounts for the vast majority – approximately 55 percent – of Medicare home health visits. The following table (Table 1) shows the mix of visits, the distribution of visit charges, and the average number of visits per Medicare home health beneficiaries in 2008.
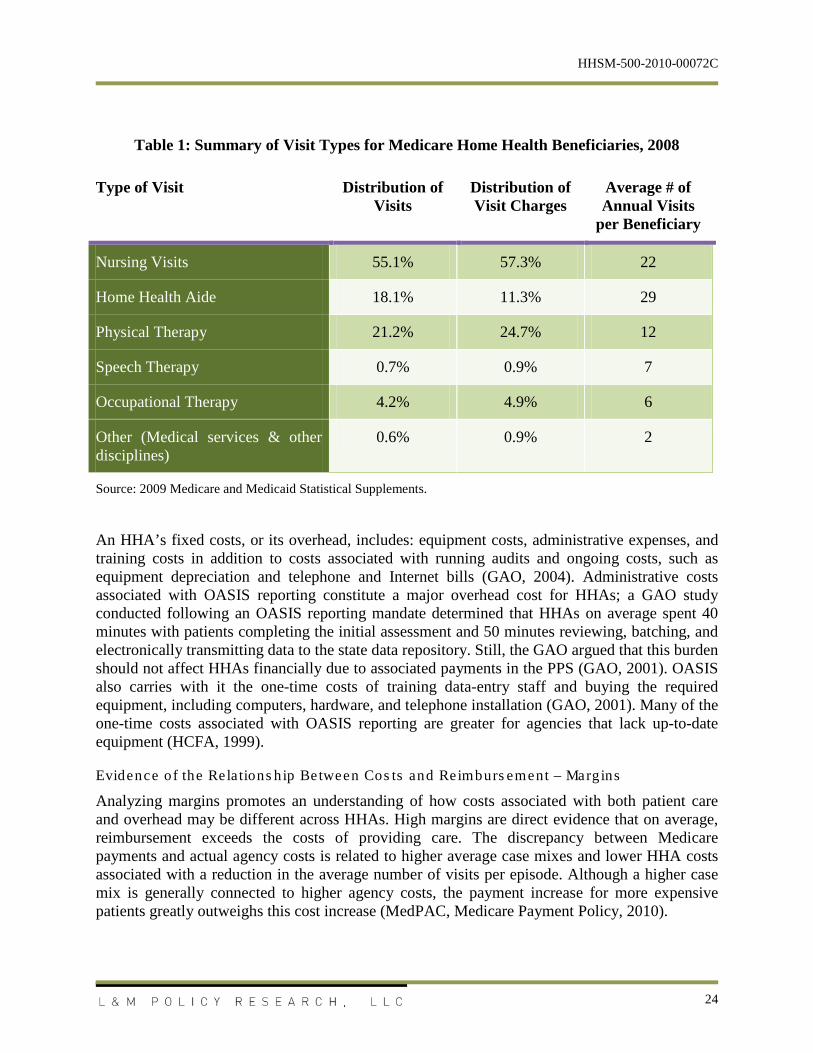
HHSM-500-2010-00072C
24
Table 1: Summary of Visit Types for Medicare Home Health Beneficiaries, 2008
Type of Visit Distribution of Visits
Distribution of Visit Charges
Average # of Annual Visits
per Beneficiary
Nursing Visits 55.1% 57.3% 22
Home Health Aide 18.1% 11.3% 29
Physical Therapy 21.2% 24.7% 12
Speech Therapy 0.7% 0.9% 7
Occupational Therapy 4.2% 4.9% 6
Other (Medical services & other disciplines)
0.6% 0.9% 2
Source: 2009 Medicare and Medicaid Statistical Supplements.
An HHA’s fixed costs, or its overhead, includes: equipment costs, administrative expenses, and training costs in addition to costs associated with running audits and ongoing costs, such as equipment depreciation and telephone and Internet bills (GAO, 2004). Administrative costs associated with OASIS reporting constitute a major overhead cost for HHAs; a GAO study conducted following an OASIS reporting mandate determined that HHAs on average spent 40 minutes with patients completing the initial assessment and 50 minutes reviewing, batching, and electronically transmitting data to the state data repository. Still, the GAO argued that this burden should not affect HHAs financially due to associated payments in the PPS (GAO, 2001). OASIS also carries with it the one-time costs of training data-entry staff and buying the required equipment, including computers, hardware, and telephone installation (GAO, 2001). Many of the one-time costs associated with OASIS reporting are greater for agencies that lack up-to-date equipment (HCFA, 1999).
Evidence of the Relations hip Between Cos ts and Reimburs ement – Margins
Analyzing margins promotes an understanding of how costs associated with both patient care and overhead may be different across HHAs. High margins are direct evidence that on average, reimbursement exceeds the costs of providing care. The discrepancy between Medicare payments and actual agency costs is related to higher average case mixes and lower HHA costs associated with a reduction in the average number of visits per episode. Although a higher case mix is generally connected to higher agency costs, the payment increase for more expensive patients greatly outweighs this cost increase (MedPAC, Medicare Payment Policy, 2010).
HHSM-500-2010-00072C
25
Due to these variables, agencies differ greatly in profit margins. MedPAC reported that the average margin for freestanding HHAs in 2008 was 17.4 percent, an increase over 2007 from 16.5 percent. The margins varied by both geography (urban HHA margins were 17.8 percent and rural HHA margins were 15.7 percent) and by ownership (for-profit HHA margins were 18.3 percent and non-profit HHA margins were 14.3 percent). MedPAC also reported that HHAs with higher volumes of patients experienced higher profit margins, ranging in volume from 7.9 percent to 19.5 percent profit margins (MedPAC, Data Book, 2010). In another report, MedPAC found that agencies with high margins also tended to have higher case-mix values and more therapy visits. For example, MedPAC reported that agencies with a case-mix index of 1.23 had average margins of negative nine percent, and 25 percent of the episodes of care were therapy-related. On the other hand, agencies with an average case-mix index of 1.32 had average margins of 37 percent, and 30 percent of the episodes of care were therapy-related (Christman, November 4, 2010).
The GAO reported that HHAs with low margins tended to have the highest per-episode costs, driven primarily by high costs (and specifically overhead) and secondarily by the differences in the number of visits provided per episode. For example, HHAs with margins less than zero reported a per-episode cost of $2,865 versus HHAs with margins of zero to 30 percent, and HHAs with margins of over 30 percent each reported costs of $2,066 and $1,515, respectively. The differences in visits per episode were minimal with 2.1 more visits in the lowest margin group (23.3 visits) than the highest margin group (21.2 visits). Overhead accounted for approximately two-thirds of the cost difference between the HHAs when comparing costs per visit (the lowest margin group was reported to have a cost of $130 per visit and the highest margin group $75 per visit). The GAO found that there were both high- and low-margin facilities in the same areas, so geographic variation, related to such factors as transportation costs and security services, did not seem to cause the change costs. The difference in cost per visit could be attributed to both the size of the HHAs – as with lower patient volumes, there are fewer visits to spread the overhead costs – and to higher direct patient-care costs, however (GAO, 2004).
HHAs do not entirely agree with MedPAC’s findings and recommendations, however. Some have argued that the market basket used to determine payments should reflect costs associated with the implementation of OASIS-C and other policy initiatives (CMS, 2010). Others have argued against the planned reductions to case-mix reimbursements, noting that these reductions will cause financial distress to many HHAs. Such reductions would be especially damaging to “safety-net” agencies that tend to take on expensive patients other agencies reject. Policymakers, on the other hand, perceive these reductions as a necessary step in fighting agencies’ over-reporting of costs, which results in Medicare’s overpayment (CMS, 2010). This disagreement has led to congressional concerns regarding the adequacy of payments for treating vulnerable Medicare populations, including low-income beneficiaries, those in medically underserved areas, and patients with a high severity of illness, as outlined in the ACA.
Despite evidence that payment has covered the cost of most home health episodes and perhaps exceeded actual costs for certain high case-mix episodes (MedPAC, Medicare Payment Policy, 2010), concerns still remain about the adequacy of reimbursement related to costs of providing care specifically to those beneficiaries highlighted in the ACA. While the current system considers geographic factors and patients whose condition require more costly services in an outlier payment, there may be insufficiencies for specific populations under the newly revised system.
HHSM-500-2010-00072C
26
The OASIS Ins trument and Rela tions hip to Home Health Cos ts
As the reimbursement of home care directly relates to the HHRG score derived from OASIS collection, attention to the instrument is warranted when considering how well the OASIS instrument captures variations in the costs of home health care under the HH PPS. Several researchers have also questioned both the reliability (the consistency of collected results across different episodes, facilities, and raters) and validity (the ability of the measures to reflect actual patient conditions) of the OASIS collection tool (Kinatukara, Rosati & Huang., 2010). While no findings significantly call into question the tool’s basic integrity, many studies point to a need for continued refinement of the tool and the policies surrounding its use.
Tullai-McGuinness, Madigan, and Fortinsky (2009) tested the instrument’s validity to accurately capture ADLs, IADLs, cognitive functioning, and depression by comparing OASIS items for 203 patients across five HHAs to patient self-reported data collected using credible, interview-based instruments. Correlations ranged from .20 to .69 for ADLs, IADLs, and cognitive functioning measures, and the researchers found the data elements for ADLs and cognitive functioning to be “sufficiently valid.” Yet OASIS collection of depression underestimated the prevalence of such conditions, and its findings on the validity of IADLs were mixed (Tullai-McGuinness, Madigan & Fortinsky, 2009). The same authors earlier reported in a similar study that home health patients self-reported to nurses greater levels of independence than what clinicians had documented using OASIS (Fortinsky et al., 2001).
Furthermore, there is concern regarding inter-rater reliability – or the consistency of evaluations different persons, specifically health care professionals, complete. One recent project compared OASIS evaluations completed separately by a registered nurse and a physical therapist for the same cohort of 52 patients, and only 54 percent of responses were identical, although the mean difference in reimbursement per patient of only $16.43 did not result in significantly higher reimbursement for either profession (Shew et al., 2010). Controlling for facility characteristics, one MedPAC report found little to no relationship between beneficiary characteristics captured by OASIS and HHAs’ profit margins. Only one of the patient characteristics added to the model (patients who received no informal support and had many limitations on ADLs) had a statistically significant relationship to the profit margin, but its direction was counterintuitive. This caused MedPAC (2005) to question this OASIS element’s reliability given that the parameter estimate suggested that agencies with larger shares of high-resource-use patients had higher margins than those that did not. Additionally, a 2001 GAO report called into question staff training and its impact on the reliability of the assessment tool to adequately capture costs. A more recent study by Teenier (2005), examining the clinician’s role with the HH PPS, suggested that close attention by the home health administrative personnel regarding variation in visits from staff person to staff person is an important step in ensuring accuracy. Kinatakura, Rosati, and Huang (2010) argued that questionable reliability and validity of the OASIS instrument impacts the quality of the HHRG reimbursement measures derived from its data elements. Further, available PPS calculators or pricers allow HHAs to potentially enter OASIS data elements in order to maximize profit (HealthCare Strategies, 2010; NAHC, 2010). MedPAC (2005) has noted that further research is needed to determine whether certain HHRGs are more profitable than others and whether HHAs can game these inconsistencies to increase profits. CMS has attempted to alleviate concerns over OASIS through increased training via
HHSM-500-2010-00072C
27
Web-based resources, the OASIS user’s manual, and state-level OASIS education representatives (Kinatukara, Rosati, & Huang 2010). The OASIS manual language instructs HHAs to encode diagnoses only when the beneficiary’s condition is persistent and only when the condition affects home health care delivery (CMS, 2010).
MedPAC has recommended that additional clinical and socio-demographic factors from data sources outside OASIS be considered to improve the case-mix groupings composing the HHRGs, such as the Chronic Condition Warehouse and the CMS-Hierarchical Cost Conditions (CMS-HCCs) (MedPAC, Comment Letter, 2010). Yet in conducting an analysis for CMS’ refinements to the HH PPS in 2008, researchers considered additional clinical factors and found little improved explanatory power, with the exception of variables for ostomy care, diabetic ulcers, and select other variables added to the model (Coleman, Wu, Goldberg, Deitz, & White, 2008). Nonetheless, the regression model utilizing OASIS data used to develop the payment weights of the refined 2008 PPS had an R^2 of only 0.4516 and explained only 45.16 percent of the variation in episode costs (Coleman, Wu, Goldberg, Deitz, & White, 2008).
The possible under-reporting of medical conditions in OASIS – which limits the number of diagnoses that can be reported – is an important limitation to consider in evaluating whether the inclusion of additional factors increases explanatory power. In addition, HHAs may have an incentive to prioritize codes that indicate a need for therapy rather than an underlying medical condition (Murtaugh, Peng, Moore, & Maduro, 2008).
Payment Adequacy for Low-Income Benefic ia ries
Dual eligibles are more likely to be sick and have chronic conditions, which translates into higher health care costs – the subpopulation accounts for 16 percent of Medicare enrollees but uses 40 percent of Medicare-covered home care visits (Kenney & Rajan, 2000). The average total health care spending on duals is about $21,000 per beneficiary compared to approximately $5,000 for non-dual-eligible Medicare beneficiaries (Coughlin, Waidmann, & O'Malley Watts, 2009). Duals may also disproportionately use home health care due to unmet health needs or delays in receiving care under Medicare (Moon, 2006). Such high cost factors, including higher risk for chronic conditions (Buhler-Wilkerson, 2007) and increased utilization of home health care (Cheh & Schurrer, 2010), make duals more costly patients for home health agencies.
The possibly higher-than-average home health care needs should be accounted for under the payment system as a higher payment category; however, Coleman, Wu, Goldberg, Deitz, and White (2008) found that Medicaid eligibility was significantly and positively associated with higher treatment costs. Still, this variable was not included as a payment adjuster due to a few concerns: It did little to increase the model’s overall explanatory power, there were questions surrounding the appropriateness of using such an adjustment from a public policy perspective, and there were concerns regarding the accuracy of the Medicaid eligibility information (Coleman, Wu, Goldberg, Deitz, & White, 2008). Dual eligibility is also associated with greater administrative costs for health care providers due to the coordination of coverage for services (MedPAC, 2004). Confusion can arise over which payer covers which service, leaving opportunities for gaps in reimbursement and increases in administrative costs (MedPAC, 2004). Additionally, agencies serving a disproportionate share of low-income beneficiaries may also provide undercompensated and uncompensated care, producing agency costs that exceed reimbursement (VNAA, 2009).
HHSM-500-2010-00072C
28
Payment Adequacy for Benefic iaries in Medically Unders erved Areas
While the literature does not specifically address the cost of providing home health in medically underserved areas, it reports on potential cost issues in rural areas, which may overlap to some extent with medically underserved areas. There are certain characteristics of rural patient populations that may increase costs for home health providers. MedPAC (2001) suggests several factors that may differentiate costs of care in these areas from standard costs – most notable, higher-than-usual travel expenses. HHA staff members generally have to travel further in rural areas to reach a client, which can be exacerbated by staffing county shortages. Prior to the BBA of 1997, rural HHAs had smaller staff than did urban facilities, and many have remained understaffed since (McAuley et. al., 2008). Conditions in these areas may make it harder to attract health professionals – there are, generally, fewer HHA staff members and fewer physicians and specialists per capita, and rural HHAs have difficulty attracting skilled staff compared to other HHAs in the area due largely to low operating margins (Nelson, 2010). This shortage may encourage rural counties to utilize HHA staff from larger nearby counties, which requires staff to drive longer distances to patients’ homes, contributing to higher transportation costs (MedPAC, Medicare Payment Policy, 2010).
Rural areas may also be associated with increased costs due to their smaller population and, thus, smaller patient volume. (MedPAC, 2001). This results in a higher cost per episode because there are fewer patients over which to spread the fixed cost (McAuley et. al., 2008). Rural HHAs may generally carry a heavier burden of overhead costs than other agencies, as they are likely to be affiliated with a hospital, which, in some cases, means the HHA is carrying hospital-allocated costs (Nelson, 2010). While rural areas have fewer patients, these patients may require more services: Rural elders are more likely than the general population to have chronic conditions, leading to longer lengths of stay and more total visits (McAuley et. al., 2008).
Finally, significantly fewer patients in rural settings use therapy during their treatment, potentially due to limited skilled staff, resources, or population characteristics. Use of therapy greatly increases the total reimbursement for an episode, and, in fact, the case mix for a given patient who receives therapy may be twice that of an identical patient who does not receive such care (MedPAC, 2001). This would result in lower compensation for comparable patients, especially if staffing shortages meant that many patients who would normally receive therapy are not doing so due to the higher costs associated with locating and bringing therapists into these areas.
Medicare policy to some extent addresses cost concerns associated with rural areas. The HH PPS applies a three percent price add-on to the standardized episode rate for HHAs operating in rural settings (CMS, Proposed Rule, 2010). Although rural margins were slightly lower than urban margins in 2010, HHAs from both settings performed well on average, and agencies in both areas boasted positive average margins (MedPAC, Medicare Payment Policy, 2010). One concern of isolated and rural HHAs is poor access to therapy, for which reimbursement is particularly high. MedPAC confirmed that therapy episodes were generally overpaid in 2010 compared to other kinds of home care visits (MedPAC, Medicare Payment Policy, 2010), confirming that therapy reimbursement may have been a cost issue for rural areas. An adjustment to the payment for therapy visits would help alleviate this problem.
HHSM-500-2010-00072C
29
Payment Adequacy for Benefic iaries with High Severity of Illnes s
Home health patients with high levels of illness severity have been defined in various ways, leading to confusion as to whether or not these patients are adequately compensated for under the HH PPS. One standard way to capture severity is through the HHRG categories, which compensate more for individuals with severe clinical and functional characteristics (MedPAC, Payment Basics: Home Health, 2010). Since there has been some concern that case mix under the payment system may be subject to gaming and HHRGs do not adequately capture all the costs of care, some researchers have used other measures of severity, including risk scores, number of episodes of care, measures of number of chronic conditions, and deficits in ADLs or IADLs (please see Measurement of Home Health Care Access section for a description of alternative measures of severity).
In theory, patients with exceptionally high costs of care would be compensated under the outlier payment system; however, Meadow, Wrobel, and Goldberg (2004) found that only 17 percent of outlier patients were considered high severity. Using profitability as a proxy for understanding the adequacy of payments, Livesay, Hanson, Anderson, and Oelschlaeger (2003) reviewed the characteristics of patients based on the expected profitability – either projected gain group or the projected loss group – as defined by the HHA that provided the study sample. The author found little variation in the profit status of patients based on demographics (gender, age, race, or marital status) but found variations based on admissions status, discharge status, and medical diagnoses. All outlier patients in the sample fell into the projected loss group, and the outliers had higher percentages of re-certifications, more co-morbid conditions and longer length of service, and more skilled nursing visits (Livesay, Hanson, Anderson, & Oelschlaeger, 2003).
A recent Cheh & Shurrer (2010) study also analyzed costs for HHAs with a large proportion of outlier patients. The researchers determined that, for these agencies, the costs per visit for both skilled nursing and home health aide services were generally lower than competing agencies. Specifically, the cost of a skilled nursing visit was $107 for the agencies who had larger proportions of outlier patients and $144 for other agencies. The costs per home health aide visit were 25 percent lower for the agencies with higher proportions of outlier patients than for other agencies. The researchers suggest that because of their lower-than-average costs per visit, the agencies compensated for some of the financial loss of providing care to outlier patients since the outlier payment formula reward lower average costs (Cheh & Schurrer, 2010).
Some agencies have also argued that outlier adjustments should vary by urban vs. rural location of the HHA, an argument based on the idea that HHAs in rural areas may not have other nearby agencies to share the burden of costly clients. It has also been suggested that outliers in rural areas might receive home care treatment because they lack access to more appropriate post-acute care settings. Exempting rural HHAs from the cap on outlier payments would help address these concerns, others argue (CMS, Proposed Rule, 2010).
Counter to these findings, in investigating whether chronically ill or outlier patients were properly reimbursed, MedPAC found that in 2010 low-margin agencies did not serve significantly more chronically ill patients or financial outlier payments than other agencies. It furthermore suggested that Medicare actually overpays for high case-mix episodes but noted that the case-mix adjuster might not accurately measure the severity of patients’ conditions (MedPAC, Medicare Payment Policy, 2010).
HHSM-500-2010-00072C
30
VULNERABILITIES IN THE CURRENT PAYMENT SYSTEM
While intended to pay HHAs appropriately for the costs of care, the HH PPS may nonetheless incentivize certain provider behaviors, which may both inhibit access to the benefit for vulnerable beneficiaries and also make the system vulnerable to inaccurate payments. There are some indications that areas of the HH PPS system are particularly vulnerable to abusive billing practices.
Incentives and Vulnerabilities Inherent in the Current HH PPS
The current HH PPS contains various incentives for HHAs to try to maximize payments. The clinical, functional, and service-utilization scores composing the current 153 HHRGs were designed to appropriately compensate facilities for treating a more resource-intensive beneficiary case mix. Yet, the components of each score incentivize treatment of certain beneficiaries, as well as the use of certain treatments, while failing to compensate HHAs for use of other treatments or admission of other beneficiaries. For example, recent analysis of HHA profit margins by MedPAC suggests that high case mix episodes may be overpaid and low case mix episodes may be underpaid (MedPAC, Medicare Payment Policy, 2010).
CMS originally intended to use delivered therapy services as a proxy for total resource use under the service utilization component of the HHRG. The 1999 proposed rule’s public comment period yielded recommendations for other utilized services, such as the number of skilled nursing hours, but they were not ultimately included. CMS responded that it would not consider such services under the service-use component as they are captured by OASIS clinical scoring measures like the existence of wounds, lesions, and pressure ulcers, a desire by CMS to move away from the cost-based approach to payment, and a belief that a statute requiring services to be “finite and predictable” discouraged extended wound care through home health services (HCFA, Final Rule, 2000). Measurement of service utilization through the number of therapy visits clearly incentivizes HHAs to provide therapy services, however. While therapy visits have increased under the PPS, skilled nursing, medical social work, and use of home health aides have all decreased (MedPAC, Medicare Payment Policy, 2010). MedPAC has noted that therapy visits were the most important factor in the growth of home health episodes; growth trends directly reflected distortions associated with therapy payment thresholds. For example, between 2002 and 2007, episodes that qualified for therapy bump-up payments grew from 22 to 27 percent, and in 2007 therapy episodes represented approximately 40 percent of all new home health care episodes in that year while clinical or patient characteristics explained little of this utilization growth (MedPAC, Medicare Payment Policy, 2010).
In 2002 Hubbert and Hays found that regardless of the differences in the admissions and discharge status of patients, the level of service provided to the patients did not vary significantly, underlining the point that home care agency services are not responding to variances in patient health but to the reimbursement system itself. Specifically, the authors described the need for home health at both the time of admission and discharge across three groups of beneficiaries: 1) those who required acute care from an inpatient setting following home health discharge, 2) chronic patients, those requiring ongoing care (e.g., adult day care services, hospice, home health care, nursing home, etc.), and 3) stable home health patients who required no further care. Each of the groups had varying intensity of need for care throughout their length of stay in home care, but interestingly, regardless of the group that each of the
HHSM-500-2010-00072C
31
patients fell into, there were not many differences in the level of services given to the patients, underscoring that agencies are incentivized to practice based on reimbursement (Hubbert & Hays, 2002).
MedPAC has expressed concern that growth in the number of home health episodes per beneficiary since implementation of the PPS may reflect incentives inherent in a payment system based on a fixed episode length (MedPAC, Medicare Payment Policy 2010), however the ACA mandates that CMS study ways to further bundle Medicare payments. As noted above, CMS itself has noted that through the rulemaking process there have been significant increases in coding and HHA reporting of case-mix since implementation.
Fraud and Abus e
Beyond the incentives described earlier, the Visiting Nurse Associations of America (VNAA, 2009) has described HHA activities that have kick-started fraud and abuse investigations over the past few years. These abusive and sometimes fraudulent activities include: billing Medicare for home care services not provided, inducing referral sources; encouraging patients to ask for unnecessary care; encouraging admissions of patients with the lowest care needs (including limiting or providing inadequate care to patients with lower payment potential), and billing for unnecessary services (VNAA, 2009). In this same report, the VNAA recommended changes to the payment system that could help reduce or eliminate fraud and abuse, including capping the outlier payments and determining how to eliminate the therapy thresholds. They also recommend changes to the case-mix adjustment that better reflect the high-resource utilization of patients who are on Medicaid, have no caregiver, are high supply users, require wound care services, and are monitored through telemonitoring systems. In another report on improper payments in home health, the GAO (2009) reported that Medicare is vulnerable to the overstatement of patient’s severity of illness in the billing process (commonly referred to as upcoding), which occurs when patients are incorrectly billed as an outlier and the level of care is not necessary. In addition, the GAO found instances where claims were submitted for unnecessary services as well as for patients who were not homebound (one of the requirements to receive Medicare home health reimbursement) (GAO, 2009). In coordination with CMS, Abt Associates recently evaluated this issue and found significant evidence of both nominal and real increases in reported case mix. While growth in case mix may be real, due to actual increases in patient severity, it may also be nominal, due to improved coding practices, or to changes resulting from agency upcoding, gaming, or fraud. Nominal change in case mix is change that is not related to real change in the essential underlying health status of the home health user population. Between the period just before implementation of the PPS until 2007, Abt found a 13.27 percent nominal increase in reported case mix between the IPS period and 2007 relative to an actual increase of only 1.76 percent. Consistent with previous Abt findings, this amounts to 89.93 percent of changes in reported case mix attributable to changes in agency coding practices (White, Plotzke, Golberg, & Robinson, 2010). In addition to upcoding, there may be instances where Medicare and Medicaid are billed for the same service. In a recent OIG report (2008), it found that in five states Medicaid paid approximately 84,000 claims for services covered by the Medicare PPS, possibly resulting in duplicative payments. These potentially duplicative claims were primarily for non-routine medical supplies (98 percent of the claims) and often had incomplete Medicare eligibility – if
HHSM-500-2010-00072C
32
Medicare eligibility data was available, there was a possibility that it was not accurate due to retroactive Medicare eligibility. The OIG (2008) noted that the Medicaid payment system often lack payment edits and the state information systems often do not allow states to note Medicare eligibility (OIG, 2008). Although these billing practices may not have been intentional, they have helped identify potential payment system vulnerabilities. In another similar study, the OIG also identified potential duplicative Medicaid payments for services covered under the HH PPS for both skilled nursing and home health aide visits. Similar to the non-routine and therapeutic analysis, the OIG looked at five states and found that issues related to coordination of care between providers and a general lack of clarity in Medicare coverage policies led to nearly $2 million in possible duplicative payments. Similar to the non-routine medical supplies and therapeutic analysis, the OIG found that the vulnerability in the system that allowed for the possible duplicative payment was related to limited information about Medicare eligibility on the claim, which made it difficult for states to prevent overpayment for services (OIG, Aberrant Medicare Home Health Outlier Payment Patterns in Miami-Dade County and Other Geographic Areas in 2008, 2009).
The GAO has also identified additional vulnerabilities in the payment system, including improper screening of agencies entering the Medicare market, inadequate claims review, and difficulty investigating and enforcing penalties for fraud (for example, the ability to revoke billing rights). In particular, it noted weaknesses in CMS’ ability to verify the criminal history of key personnel listed on new HHA Medicare applications in addition to a lack of feedback for physicians regarding fraudulent billing. The GAO also pointed out that there was no requirement that contractors complete medical reviews of HHAs with high rates of improper billing (GAO, 2009).
MedPAC also recently identified areas related to staffing within the payment system that are vulnerable to billing abuses, which involve using differing levels of staffing resources, including licensed practical nurses (LPNs) rather than registered nurses (RNs) and a therapist in place of a nurse for wound care. Substituting LPNs for RNs may help HHAs reduce operating costs. Currently, there is no information given to CMS that reports the level of nurse providing services, so this substitution raises the possibility that CMS is using the higher RN costs in its assumptions when developing the base rate. In addition, the current payment system provides a higher payment for an episode if a therapist completes the wound care visits, which incentivizes the HHA to send a more highly compensated individual when the RN is capable of providing the service. MedPAC recommended that CMS require agencies to report not only the provider but also the specific qualifications of the provider (e.g., RN, LPN, therapist, non-certified therapy assistant, etc.) (MedPAC, Comment Letter, 2010). MedPAC has also raised concerns that the provision of therapy visits is influenced by payment policy (MedPAC, Comment Letter, 2010). CMS has addressed some of these concerns by creating stricter standards for documenting the need for, the amount of and nature of therapy required. They have required that the plan of care specify measurable treatment goals for the functional impairments requiring therapy. In addition, therapists, and not therapy assistants, will be required to re-assess the patient for longer lengths of stays before additional visits would be covered. These reassessments would verify that the patient’s condition requires additional therapy before the significant payment increases that occur at the 14th and 20th therapy visit. These changes will take effect April 1, 2011 (CMS, Final Rule, 2010). As discussed in the 2010
HHSM-500-2010-00072C
33
proposed rule, in their March 2010 report, MedPAC suggested that the HH PPS case-mix weights needed adjustment, as the current therapy weights are calibrated assuming that 79 percent of the time home health therapy is provided by qualified therapists. CMS believes that the current mix of therapy services may have changed, and that therapy assistants are now providing a larger percentage of home health therapy services (CMS, Proposed Rule, 2010). As such, CMS will require the use of G-codes to reflect greater detail in the reporting of skilled nursing and therapy (CMS, Final Rule, 2010).
The provision of outlier payments is another payment area vulnerable to fraud and abuse. In a 2009 report, the OIG analyzed large variations in outlier payments and found that Miami Dade County had high payments for outlier cases. For example, in 2008, it had more outlier payments in terms of total dollars than anywhere else in the United States: The average outlier payment per beneficiary exceeded $11,000, while the national average was $378. As a result of this investigation, the OIG recommended: 1) establishing a cap on outlier payments by agency, 2) reviewing HHAs that showed strange behavior, and 3) strengthening standards for entry into the home health market (Office of Inspector General, Aberrant Outlier Patterns, 2009).
EVALUATION OF OTHER PAYMENT SYSTEMS/MODELS IN TERMS OF THEIR POTENTIAL INCENTIVES AND IMPACTS
To evaluate potential revisions to the HH PPS, evaluation of other health services financing models is helpful in highlighting potentially adaptable features of such systems. Two categories of payment models are especially pertinent to this project – reimbursement of other specialty services under various Medicare payment systems and reimbursement of home health services by other payers aside from Medicare. Designs of prospective payment and other payment systems falling under these two categories are important to consider due to the current payment adjustments used under the HH PPS. Payment strategies for other publically funded home health services outside Medicare, such as state Medicaid agencies or the Veteran’s Administration, are equally pertinent.
Medicare Payment Models
Prospective payment systems were introduced in 1983 as a reimbursement mechanism in the Medicare fee-for-service program to encourage cost containment by placing providers at financial risk (Mitchell et al., 1987). A review of Medicare approaches to payment for several outpatient services, medical expenses, and care provided across other specialty reveals beneficial features currently in use by other payment systems that may be applicable to the HH PPS. Common features of such payment systems include adjustments for facility and patient characteristics, including health severity as measured through the use of both DRGs and add-on payments per treatment, the use of cost-sharing with beneficiaries, limits on beneficiary eligibility and covered services, the use of outlier payments for extreme cases, and geographic as well as annual adjustments.
Sources of Other Home Care Coverage
Funding sources for home health outside the Medicare program include Medicaid, the Older Americans Act, Title XX Social Services Block Grants, the Veterans’ Administration, and
HHSM-500-2010-00072C
34
Civilian Health and Medical Program of the Uniformed Services (CHAMPUS), workers’ compensation benefits, private insurance, social services block grant programs, and community organizations (Grabowski, Stevenson, Huskamp, & Keating, 2006; National Association for Home Care and Hospice, 2010). Private insurers, whether commercial health plans, manage care organizations, Medigap plans, or long-term care insurance providers, typically offer home health services but can vary significantly in the types of services covered (Grabowski, Stevenson, Huskamp, & Keating, 2006).
Medicaid has offered mandatory home health benefits following a congressional amendment to the law in 1967 (Benjamin, 1993). Each state Medicaid program is required to offer home health services to individuals qualifying for federal income maintenance payments, such as SSI and AFDC, as well as any individuals who are “categorically needy” (Grabowski, Stevenson, Huskamp, & Keating, 2006). Twenty-five state Medicaid programs require explicit physician or health professional approval for covered home health services (Kaiser Family Foundation, 2008), which include visits by registered nurses and certified home health aides, as well as reimbursement for medical supplies and equipment. Some states offer optional services, including physical, occupational, and speech therapy, as well as audiology services (Grabowski, Stevenson, Huskamp, & Keating, 2006). States use varying methods – including fee-for-service, prospective payment, cost-based reimbursement, and percent of charge – to reimburse HHAs for Medicaid patients (Kaiser Family Foundation, 2008), and states may have a “Medicare maximization” strategy where Medicaid serves as the secondary payer for dual-eligible beneficiaries (Grabowski, Stevenson, Huskamp, & Keating, 2006).
States also provide low-income individuals access to home health care through home- and community-based service (HCBS) waivers and the personal care option (National Association for Home Care and Hospice, 2010). Programs specifically designed to transfer care to home- and community-based services (HCBS) from the institutional setting have certainly impacted Medicaid home care utilization (Payne, 2002). Medicaid provides such services in the form of HCBS waivers that allow enrollees the opportunity to receive appropriate services and support in home or community-based settings instead of institutionalization. Established under Section 1915(c) of the Social Security Act, each state, with the exception of Arizona, has at least one HCBS waiver (Kaiser Family Foundation, 2008; Engquist, Johnson, & Johnson, 2010). The last decade has witness an expansion in such Medicaid-covered HCBS over the past decade (Grabowski, Stevenson, Huskamp, & Keating, 2006), a trend that will likely continue with new incentives and mandates included in the ACA (Justice, 2010). Each waiver is aimed at specific sub-populations, including the elderly and individuals with brain injury, mental illness, HIV-AIDS, physical disabilities, and severe chronic illness. Most state Medicaid agencies cover aged enrollees under an HCBS waiver (Kaiser Family Foundation, 2008). Additionally, 31 states offer personal care services under their Medicaid program for enrollees requiring assistance with ADLs and IADLs (Engquist, Johnson, & Johnson, 2010).
With passage of the Veterans Millennium Health Care and Benefits Act in 1999, the Department of Veterans Affairs (VA) currently provides all eligible veterans access to long-term care, including home care benefits (Miller & Rosenheck, 2007). The VA provides home health services mainly through its Home-Based Primary Care (HBPC) benefit in which interdisciplinary provider teams of physicians, nurses, social workers, dieticians, therapists, pharmacists and medical aides work in coordination to provide appropriate levels of care to each eligible veteran across settings and based in the home (Miller & Rosenheck, 2007). Although all veterans are
HHSM-500-2010-00072C
35
eligible to utilize the HBPC, prioritization for use is based on clinical grounds in light of available resources (Miller & Rosenheck, 2007). A wide range of services are covered under this benefit, including primary care, palliative care, rehabilitation, chronic-disease management, and coordination of all necessary medical, social, and ancillary services available within the Veteran’s Health Administration, including personal assistance, home adaptations, and other non-health supportive care (What is Home Based Primary Care?, 2010; Miller & Rosenheck, 2007). In addition to the HBPC, the VA offers a Professional Home Care Services benefit to cover commercial nursing services when VA staff cannot fill a given medical need and the Veteran-Directed Home and Community Based Services benefit that assists veterans in choosing and utilizing the mix of services to best meet their needs (What is Home Based Primary Care?, 2010).
TRICARE, formerly known as the Civilian Health and Medical Program of the Uniformed Services (CHAMPUS), offers similar home care services to Medicare to active duty military personnel and families through two benefits. The first benefit, covered through the TRICARE Home Health Care PPS, was finalized in a 2005 final rule and is modeled directly on the Medicare HH PPS to include 60-day episodes, use of OASIS data, and the same 80 HH RGs originally used by CMS (U.S. Department of Defense, 2005). The second benefit, ECHO Home Health Care (EHHC), provides homebound enrollees in need of medically necessary skilled services in addition to those provided by the prospective payment, typically for those requiring between 28 to 35 hours per week of home health services or respite care (ECHO Home Health Care, 2010).
Potential Strateg ies from Other Payment Sys tems
The home health setting, in addition to various others, is unique in that costs for services rendered in these settings vary considerably. Thus, applying a prospective payment tied to an average cost can yield distinct “winners” and “losers” in terms of reimbursement. In order to develop an efficient payment system that covers medically necessary care without creating adverse incentives relies upon appropriately reimbursing costs of care, which means accounting for both facility and patient characteristics, as the HH PPS currently attempts to do. Facility characteristics considered in other prospective payment systems try to account for cost differences beyond the control of facility management. Medicare adjusts payment for several of its benefits, including DME, outpatient services, SNF services, and LTCH services to account for geographic differences in costs and wages (MedPAC, DME Payment Basics, 2010; MedPAC, Outpatient Hospital Services Payment Basics, 2010; MedPAC, Skilled Nursing Facility Services Payment Basics, 2010; MedPAC, Long-term Care Hospitals Payment Basics, 2010). Likewise, three state Medicaid programs – Maryland, Virginia, and Washington – make geographic adjustments within the state for payment of home health services (Kaiser Family Foundation, 2008). Additionally, other costs for which it may be appropriate to pay include adjustments for area wage differentials, urban, rural or other unique cost location, the indirect costs of graduate education, and facilities that disproportionately serve low-income patients (Carter et al., 2000).
Case Mix / Patient Severity
An HHA’s case mix and the corresponding health status of a beneficiary at the time of a home health episode has demonstrable effects on costs and resource use. As such, the HH PPS attempts to control for such variations through the clinical and functional scoring criteria of the HHRGs.
HHSM-500-2010-00072C
36
Other payment strategies have accounted for differences in patient health severity in a variety of ways. In one Urban Institute review of potential revisions to the inpatient psychiatric facility PPS, the authors argued that patients should be appropriately classified to “account for a reasonably high proportion of the predictable variation in a provider’s patient care costs due to clinically meaningful differences in patient characteristics requiring more resources and care” (Garrett et. al, 2009). To accomplish this, costs of care and their corresponding causes must be well understood. As noted previously, this can be particularly difficult in the home care setting where several factors complicate this effort.
Many Medicare prospective payment systems account for variations in patient health in some way. Noticeably different to the HH PPS, in some other Medicare payment systems payment is adjusted not only for the principal diagnosis but also coexisting comorbidities that increase a beneficiary’s medical complexity and resource use. Although HHRGs capture some information on beneficiary comorbidities through clinical-scoring criteria, such as the use of injectable drugs, comorbidities – such as diabetes, cancer, and mental disorders – are not directly adjusted for if they are not the principal diagnosis. Notably, Abt Associates has shown that inclusion of such characteristics in the payment model in most case does not increase explanatory power or result in a statistically significant coefficient (Coleman, Wu, Goldberg, Deitz, & White, 2008).
Other Medicare prospective payments account variations in cost resulting from beneficiary comorbidities. Such is the case for IRFs, where the primary reason for intensive rehabilitation care, beneficiary age, levels of functional and cognitive impairment, and types of present comorbidities are all accounted for in Case Mix Groups (CMGs), tiered depending on the number of coexisting conditions (MedPAC, Inpatient Rehabilitation Facility Payment Basics, 2010). LTCHs also receive adjusted reimbursement based on long-term care DRGs that account for up to eight secondary diagnoses and six procedures performed, in addition to age, sex, discharge status, and principal diagnosis (MedPAC, Long Term Care Hospital Payment Basics, 2010). Outpatient dialysis services receive increased payment to account for costs associated with treatment of beneficiaries with six specific acute and chronic comorbidities outside chronic renal failure (MedPAC, Outpatient Dialysis Services Payment Basics, 2010). As of 2008, across all state Medicaid agencies, only Connecticut’s program adjusted payment for medically complex patients (Kaiser Family Foundation, 2008).
There is long-standing literature that documents how a DRG-based PPS can yield systematic overpayments as well as significant transfer payments across facility types due to an inability to capture patients’ treatment needs and corresponding costs (Rosko and Broyles, 1984). Treatment approaches, which directly determine costs, do not necessarily square with diagnoses. This mismatch between DRGs and resource use may render DRGs inadequate predictors of cost, particularly for specialty facilities and services that often encompass various components of care, in addition to more developed treatment approaches and differing goals compared to a general hospital. It is thus crucial that HHRGs account for utilization in the HH PPS, although, the HH PPS may not adequately account for costs related to all received services, with payment not adjusted specifically for receipt of specialty services outside therapy or utilization of non-routine medical supplies. For example, most prospective payments including the HH PPS do not reimburse the additional costs of providing specialty mental health services to beneficiaries with a primary diagnosis that is medical or surgical (Miller and Rosenheck, 2007).
HHSM-500-2010-00072C
37
Several Medicare payment systems continue to tie payment to actual costs of treatment. In reimbursing hospice care, Medicare sets a base payment per day depending on one of four levels of care, from routine home care to inpatient care, provided to the beneficiary (MedPAC, Hospice Services Payment Basics, 2010). Similarly, patients undergoing SNF services are assigned to Resource Utilization Groups (RUGs) that account primarily for treatment delivered as well as clinical complexity to determine payment adjustment (MedPAC, SNF Services Payment Basics, 2010). The outpatient prospective payment system and outpatient therapy services both utilize fee schedules with payments set for each delivered service. Products associated with specific treatments are also reimbursed individually (MedPAC, Outpatient Hospital Services Payment Basics, 2010). The payment system for oxygen and oxygen equipment as well as that for DME reimburse sets amounts based on numerous product groups (MedPAC, Oxygen and Oxygen Equipment Payment Basics, 2010), and the prospective payment for outpatient dialysis is currently supplemented with separate, add-on payments for drugs, laboratory services, and other items used for specific treatments (MedPAC, Outpatient Dialysis Services Payment Basics, 2010). While the HH PPS reimburses differently for varying levels of therapy use, utilization of other treatments may also deserve adjusted payment.
Outlier Payments, Service Caps, and Risk Sharing
For many payment systems, episodes or cases with costs highly unassociated with the projected payment under the PPS are instead provided as outlier payments to either increase or decrease payment and better match associated costs. Caps on certain services are also used in some cases to restrict overutilization and inappropriate payment. Such strategies are principally aimed at promoting appropriate levels of risk-sharing between payer and provider. MedPAC (Home Health Services: Assessing Payment Adequacy and Updating Systems (Chapter 3B), 2010) has repeatedly noted that payments to HHAs under the HH PPS are consistently greater than the costs of providing home health services. While it is appropriate to review payment adequacy for high-cost home health outlier episodes, refinements to the HH PPS to reduce Medicare’s financial burden or provide improved care at the same payment levels should also be considered.
Outlier payments for home health include increased payments for episodes with high costs. The outlier payment for high-cost episodes is supported by limits to the percentage of payments a given HHA may receive. Similar outlier payments are utilized by other Medicare payment systems, although they differ depending on each policy’s intent to either adequately compensate facilities for high resource beneficiaries or limit overpayment. Hospitals may receive additional payment through outlier adjustments for particularly high-cost services in addition to pass-through payments for some new technologies (MedPAC, Outpatient Hospital Services Payment Basics, 2010). For payment of LTCHs, the high-cost outlier payment identifies cases with high costs relative to a DRG-specific threshold plus a maximum loss amount, and Medicare covers 80 percent of costs for the stay incurred above this limit. A similar adjustment is made for high-cost, outpatient dialysis treatments as well as stays in IRFs (MedPAC, Outpatient Dialysis Services Payment Basics, 2010; MedPAC, Inpatient Rehabilitation Facility Payment Basics, 2010).
While the HH PPS and some other Medicare payment systems increase payment for outlying cases, other payment models seek to limit maximum payments to providers. Eight state Medicaid programs utilize Medicare-regulated policies, such as cost ceilings, to determine payment limits for home health (Kaiser Family Foundation, 2008). Twenty-four state Medicaid programs cap the number of covered home health services in some way, including weekly time limits and caps
HHSM-500-2010-00072C
38
on the number of annual or lifetime services received (Kaiser Family Foundation, 2008). Medicare HMOs have in the past also sharply restricted the number and types of home health visits a beneficiary receives (OIG, How HMOs Manage Home Health Services, 1997).
Under traditional Medicare, two payment caps limit the amount of reimbursement available to hospice agencies. First, the number of days of payable inpatient care provided is limited to 20 percent of each hospice agency’s total provided patient care days. Next, a claw-back mechanism requires hospice agencies to return all payments received over a maximum per-patient average payment (MedPAC, Hospice Services Payment Basics, 2010). Similarly, reimbursement for all Medicare-covered therapy services, outside those provided in outpatient hospital departments or through a home health episode, is capped for each beneficiary at two annual maximums for physical therapy/speech language pathology and another for occupational therapy (MedPAC, Outpatient Therapy Services Payment Basics, 2010). In addition to setting limits on the availability of home health benefits, some payers outside Medicare control costs by moving more resource-intensive patients to targeted programs (OIG, 1995), including, for example, the TRICARE-offered EHHC benefit (ECHO Home Health Care, 2010) and several HCBS waiver programs offered through state Medicaid agencies (Justice, 2010).
Some home health programs limit reimbursable costs through the use of payment caps corresponding to equivalent facility-based care. Two state Medicaid programs limit payment for home health services to the cost of treatment in comparable inpatient settings. In New York, home health services are covered by Medicaid only if they are provided instead of hospitalization. Similarly, in New Jersey, the cost of care for six months must be less than similar services provided in a nursing facility setting (Kaiser Family Foundation, 2008). Payment of TRICARE’s EHHC benefit is capped on an annual basis at the maximum fiscal year amount the program would pay if the beneficiary resided in a skilled nursing facility (ECHO Home Health Care, 2010). These approaches are just some of the payment strategies used by other systems to patients with abnormal resource use.
Similarly to the separate LUPA payment for episodes with less than five visits under the HH PPS, some Medicare PPS have short-stay outliers designed to lower payment for less-resource intensive, shorter stays. LTCHs are reimbursed for short stays in which the total length of stay is up to or equal to five-sixths of the geometric mean length of stay for all beneficiaries with the same DRG. Cases considered ‘short stays’ are reimbursed at minimum for either the cost of the case, 120 percent of the DRG-specific base payment times the length of stay, the full DRG-specific base payment, or a blend of both DRG-specific payment options, depending on whichever is less (MedPAC, Long Term Care Hospital Payment Basics, 2010). IRFs with short stays equal to or less than three days are paid at a lower base payment rate for such stays (MedPAC, Inpatient Rehabilitation Facility Payment Basics, 2010). The LUPA payment differs from other Medicare short stay policies in that episodes with less than five visits are paid a set rate per visit by visit specialty type – it is not the length of stay that matters, but the low levels of resources (4 or fewer visits) utilized over the course of an episode.
Access to Care for Low-Income Beneficiaries and Beneficiaries in Medically Underserved Areas
Similar to the HH PPS, other Medicare payment models do not adjust payment for care of low-income patients or those living in medically underserved areas. One exception is for
HHSM-500-2010-00072C
39
reimbursement to IRFs, which increases payment for treatment of low-income patients – defined as those eligible for SSI benefits or those with Medicaid as the primary payer – and rural facilities, which have fewer cases and increased costs (MedPAC, Inpatient Rehabilitation Facility Payment Basics, 2010). Some home health programs supplement treatment through the use of case managers and care plans to promote access for at-risk populations. In addition to reimbursement, Medicaid programs typically provide access to case management, which may facilitate access to formal home care, potentially through other payment sources (McAuley et. al., 2004). Some programs, like New Jersey’s, require a plan of care be developed for all Medicaid enrollees receiving home health services (Kaiser Family Foundation, 2008). In lieu of payment incentives to provide care specifically to medically underserved areas, some payment systems instead include rural payment adjustments.
Similar to the HH PPS, many Medicare payment systems include rural add-on payments with the partial motivation of encouraging access to potentially underserved areas. In some cases, these add-ons can be substantially larger than the three percent payment-rate increase mandated for HHAs by the ACA. For example, payments are increased by 7.1 percent for rural sole community hospitals (SCHs) under the OPPS and by 18.4 percent for IRFs located in rural markets (MedPAC, Inpatient Rehabilitation Facility Payment Basics, 2010). Base payment rates for SNFs are computed separately for urban and rural facilities (MedPAC, Skilled Nursing Facility Services Payment Basics, 2010).
Case Management
Case management may also be used as a part of the payment system to ensure that only appropriate care is paid for, as OIG has suggested as early as 1995 (OIG, 1995). Payers outside Medicare have long used case management, utilization reviews post payment, and clear explanations of benefits to enrollees to increase efficiencies, improve care delivery, and detect fraud and abuse (OIG, 1995). The EHHC benefit requires the patient have a case manager periodically assess needs and required services in addition to a physician-approved plan of care (ECHO Home Health Care, 2010). Nine out of 10 Medicare HMOs OIG interviewed used case managers to approve, coordinate, and monitor home health visits(OIG, How HMOs Manage Home Health Services, 1997). Due to the VA’s singular funding and service-delivery mechanisms, Miller and Rosenheck (2007) have argued that the HBPC benefit offered to veterans is most similar to other comprehensive medical programs like the Program for All-Inclusive Care for the Elderly (PACE). The authors complement the program on its ability to provide access to the complete array of health and social services necessary to meet the complex needs of the veteran population (Miller and Rosenheck, 2007). Researchers have noted the importance of independent, “conflict-free” case management for long-term services and supports under the Medicaid program (Engquist, Johnson, & Johnson, 2010), and new incentives under the ACA will encourage all state agencies to adopt such practices (Justice, 2010).
Cost Sharing
Although absent from the HH PPS outside of the outlier policy, payment systems associated with home health services covered outside Medicare – as well as other Medicare-covered health services outside the HH PPS – commonly share costs with the patient. Commercial health plans typically use cost sharing for home health services through coinsurance or copayment (Grabowski, Stevenson, Huskamp, & Keating, 2006). Of the 51 state Medicaid programs, 12
HHSM-500-2010-00072C
40
require a copayment for home health services. These copayments are typically fairly low given the low-income Medicaid population, costing between $1 and $7 per day or service (Kaiser Family Foundation, 2008). Medicare-covered hospice services charge a maximum copayment of $5 per drug in addition to a five percent coinsurance for inpatient care (MedPAC, Hospice Services Payment Basics, 2010). Beneficiaries receiving DME or oxygen and oxygen equipment through Medicare are responsible for 20 percent of such products’ costs (MedPAC, DME Payment Basics, 2010; MedPAC, Oxygen and Oxygen Equipment Payment Basics, 2010). Outpatient hospital services, which previously forced copayments approaching 50 percent of all payments to hospitals, are declining annually and will also eventually equate to a 20 percent coinsurance rate (MedPAC, Outpatient Hospital Services Payment Basics, 2010). Likewise, beneficiaries admitted directly to a LTCH or IRF from the community must pay a deductible, $1,100 in 2010, while all beneficiaries in these settings face copayments, $275 per day in 2010, between the 61st and the 90th day of treatment (MedPAC, LTCH Payment Basics, 2010; MedPAC, Rehabilitation Facilities (inpatient) Payment Basics, 2010). Private payers have a history of requiring financial participation by their enrollees for utilization of home health services. Furthermore, many payers outside Medicare have noted that such practices encourage appropriate levels of care and assist in detection of fraud and abuse (OIG, 1995). Given the relationship between Medicare and Medicaid for home health, any cost sharing approaches would have to be evaluated in light of their impact on Medicaid programs, as these programs would likely pick up cost sharing for Medicare services (Kenney & Rajan, 2000).
OPERATIONAL ISSUES AND CONSIDERATIONS
The ACA legislation contains language that directs CMS to consider operational issues for both CMS and HHAs related to implementing potential revisions to the HH PPS. This literature review provides insights that allow the research team to hypothesize high-level operational impacts. Still the team will also rely on other research activities planned under this contract to provide additional input on these possible operational issues. Specifically, the team anticipates convening a Technical Expert Panel (TEP), conducting stakeholder interviews, and working closely with CMS to gather more information on this topic.
Case Mix / Patient Severity
Changes to the patient case mix or patient severity methodologies might take on multiple forms, including better use of existing data collected both in and outside OASIS, and an expansion of current data collection. Abt Associates reviewed such changes and found that no substantial variable additions were necessary (Coleman, Wu, Goldberg, Deitz, & White, 2008). MedPAC has recently recommended case mix and socio-demographic variables be considered – including focusing on patient characteristics, ADLs, several diagnoses, source of admission and demographic factors – for inclusion under the PPS (Christman, November 4, 2010).
Any of these potential case-mix changes would have an impact for both CMS and HHAs operations. From a CMS perspective, possible operational impacts may include:
• Testing the new case-mix adjustments. In order to understand the impact of a case-mix methodology change, CMS would need to test the new method (e.g., using a demonstration) before rolling it out. The impact to CMS would include both the cost and time spent testing a new methodology.
HHSM-500-2010-00072C
41
• Changing data-collection tools. As a result of a new case-mix methodology, CMS may need to make changes to its data forms and internal systems for collecting relevant patient information. This would include, for example, changes to the current OASIS instrument to gather the new case-mix information. Making changes to the data-collection forms may increase costs due both to the time required to test the tools and for possible information system release changes.
• Implementing changes to billing systems. Based on the types of changes to the reporting requirements for billing, there may be changes in Medicare Administrative Contractor (MACs) costs due to required system changes.
• Monitoring for gaming and unintended consequences. Although CMS already monitors for both fraudulent and abusive behaviors, CMS would need to highlight the possibility of gaming related to a change in home health case-mix methodology. CMS might also wish to monitor the home health system for any unintended consequences resulting from revisions to the case-mix adjustments.
The impacts of potential case-mix refinements are not limited to CMS alone. There are possible impacts to HHAs’ operations due to changes in case mix, possibly causing HHAs to implement changes to current data-reporting systems. A change in required reporting of patient data for billing purposes will trigger HHAs to change their internal systems, which could include information technology systems or other operations activities (e.g., training of affected staff). HHAs could also change their admissions operations by revising their admissions criteria – perhaps in favor of patients where payments are more favorable in order to maximize profitability.
Outlier Payments, Service Caps, and Risk Sharing
Changes to the current outlier payments, service caps, and the improvement of risk sharing could be ways to alter the current payment system in order to improve access to vulnerable populations. With any change to outlier payments, services caps, and the addition of risk sharing, there would be changes to CMS operations. The impact to CMS would be similar to those discussed under revisions to case mix/patient severity above, as there would likely be changes to forms and/or data-collection methods. The research team anticipates that the impact to CMS would likely include testing costs and time spent on revised methodologies, changes to data-collection forms, changes to billing systems, increased monitoring for gaming, and monitoring of unintended consequences immediately following the implementation of new policies.
Such changes might have impacts on HHAs as well. Similar to potential changes in the case mix/patient severity, HHAs could respond with tighter admissions criteria to limit the number of outlier payment patients they accept in order to maximize profits. There is some evidence that certain types of HHAs tend to take more outlier payment patients than other agencies, however. Such agencies are more likely to be urban and serve fewer Medicare beneficiaries; they are also less likely to have hospice services and both lower skilled nursing and home health aide costs than other agencies (Cheh, 2010). These agencies could see an impact on their profitability if more limits are placed on outlier payments; however, MedPAC continues to find in its analyses that payments exceed costs, and for free-standing agencies, Medicare margins have remained around 17.4 percent between 2001 and 2008 (MedPAC, Medicare Payment Policy, 2010).
HHSM-500-2010-00072C
42
Access for Low Income Medicare Beneficiaries and Beneficiaries in Underserved Areas
Based on the literature, there are few payment systems that make adjustments for low-income beneficiaries and those who reside in underserved areas. One possible change that could impact vulnerable populations would be to make adjustments to the payments for beneficiaries who meet certain income thresholds, much like in the IRF PPS as discussed earlier. This type of adjustment could potentially have a negative impact on Medicare costs or could potentially shift places of service for low-income beneficiaries, depending on how attractive the incentive made it to treat low-income beneficiaries.
Any changes that would impact low-income Medicare beneficiaries or those living in underserved areas may also impact HHAs – concerns similar to those reported in the cost discussion earlier, including staffing concerns related to long-distance travel in rural areas. Possible operational and system issues could occur if an adjustment for low-income beneficiaries was included in the payment policy. The impact would be visible through both the reporting requirements of HHAs and their billing practices.
Case Management
Policies aimed at improved case management across the home health care system could have a large impact on Medicare home health. Case management helps control costs and the use of health care services by independently reviewing patient cases and ensuring care is provided in the most appropriate setting and in accordance with care plans (including doctors’ prescribed plans). An independent review is particularly important as it reduces the influence of specific care settings’ economic interests, as previously described. A Medicare-led case management system would have a potentially large financial impact on CMS, as there would be high initial administrative costs, including additional case-management systems, staffing, and oversight. This initial investment could offer long-term benefits to CMS, for example, potentially lowering costs through utilization reviews and improved transparency of home health costs. Also, a case-management system may have downstream outcome and patient satisfaction improvements for beneficiaries due to improved coordination of care.
The addition of case management to Medicare home health could increase administrative costs at HHAs, although the system design would determine the degree. Case-management systems often require authorization to provide care to a patient. The HHAs would potentially need to determine how best to implement a system to manage authorizations for Medicare home health. This may not be a burden for those HHAs that work with commercial payers, since they are likely to have a system in place to manage authorizations. Additionally, HHAs would incur some start-up and then ongoing costs of reporting expectations related to case management.
Cost Sharing
Cost sharing would allow beneficiaries to take responsibility for some of the costs of home care, theoretically encouraging more appropriate use of care. The level and form of cost sharing would directly impact Medicare home health beneficiaries. One risk is that fewer beneficiaries may decide to use home health care under a cost-sharing arrangement, which could put a strain on the patient’s informal care network. Also, if the financial burden is too high, there is risk that beneficiaries could forgo treatment or end up in the hospital, re-hospitalized, or in a skilled nursing facilities (MedPAC, 2003). These beneficiary impacts also would clearly impact CMS
HHSM-500-2010-00072C
43
through shifts away from home health to other, more costly care settings (Christman, November 4, 2010). Another possible impact is cost shifting, which, in the case of dual eligibles, would save the Medicare program some of the costs of home care at the expense of state Medicaid budgets.
Implementing a cost-sharing component to the home health benefit would also introduce challenges for home health agencies. One impact on HHAs would be the need to implement a system for collecting copayments from Medicare beneficiaries, which could impact both cash flow and revenue depending on how the copayment system is implemented at the home health agency; regardless, it would effect administrative costs, as this would be a new component of the payment system. Another possible impact on HHAs would be increased billing for copayment collection, which could result in billing patients directly (unless the home care staff collects directly from the patient, which creates a burden on the staff) and billing other payers, such as Medicaid for dual-eligible patients.
DISCUSSION
The ACA requires CMS evaluate costs associated with providing appropriate access to care to low-income beneficiaries, those residing in medically underserved areas, and those with varying severity levels illness. As part of this mandate, CMS has contracted L&M to conduct the initial research, including this literature review, which will ultimately support development of a study to understand the costs of providing care to these beneficiary groups and propose changes to the HH PPS that will ensure increased access to home health care for these beneficiaries. The literature addresses varying definitions of vulnerable populations and their associated barriers to care as well as potentially uncompensated costs. Still, several questions remain.
Low-Income Benefic ia ries
Low-income beneficiaries, particularly dual-eligible, are generally sicker and have more chronic conditions than the overall Medicare population, resulting in increased use of home health care services. Medicaid-eligible beneficiaries also tend to be costlier home health patients, controlling for health severity and other characteristics (Coleman, Wu, Goldberg, Deitz, & White, 2008). The literature suggests that issues of home health access may be of less concern for some low-income beneficiaries than for other beneficiaries due in part to Medicaid coverage for dual-eligibles and access to state-provided case-management services (McAuley, Spector, Van Nostrand, & Shaffer, 2004). Research still points to unmet health needs of low-income beneficiaries who do not meet Medicaid eligibility requirements, however. While, theoretically, HHAs should be compensated for beneficiaries who are sicker or have more chronic conditions than other beneficiaries, there may be additional administrative burdens associated with the care of low-income beneficiaries.
HHSM-500-2010-00072C
44
This literature review did not address several issues, including:
• How to best define low-income beneficiaries, particularly those not eligible for Medicaid benefits;
• How to best identify Medicaid participation or eligibility in the data; • Identifying the aspects of low-income beneficiaries’ home health care that might not be
compensated for under HH PPS; • How to account for the absence of a caregiver, or an inadequate caregiver; and • Whether low-income beneficiaries have higher administrative or care-coordination costs
than other beneficiaries that are uncompensated.
Benefic iaries Res iding in Medically Unders erved Areas
This literature review found limited research on home health access for beneficiaries living in medically underserved areas. As a proxy, the research team reviewed literature for beneficiaries living in rural areas, as these geographic regions may be part of a medically underserved area. Rural areas often experience a greater need for home care services coupled with lower utilization rates than urban areas. Although utilization is not necessarily an ideal proxy for access, it suggests barriers to care.
Although the literature review provided some insights, some questions have been left unanswered, including:
• Do Medicare beneficiaries living in non-rural areas have significant access problems or concerns?
• Which definition of rural best captures potential access problems for beneficiaries (e.g., zip code, urban-rural codes or alternative specifications)?
• If there are non-rural beneficiaries in medically underserved areas, what are the differential costs of providing these beneficiaries home health care?
• Are there shortages of certain types of staff leading to a gap between care provided and care needed?
Benefic iaries with High Severity of Illnes s
Researchers have not reached a consensus regarding the best way to define beneficiaries with high severity of illness, which makes it difficult to understand the cost of providing care to these beneficiaries. Generally, patients who are covered by the outlier payment, those with high scores based on HHRGs, beneficiaries with limited IADLs and ADLs, and those with multiple chronic conditions have been used to measure cost of care for high-severity patients. But due to the varying definitions and lack of research on the costs of care for these particular populations, it is difficult to definitively conclude whether the HH PPS reimbursement is adequate in this regard.
Still, the literature points to some access concerns for high-severity patients – most of which are anecdotal rather than supported by data analysis or formal survey research.
Several issues remain unaddressed by the literature review, including:
• Appropriately defining beneficiaries with high severity of illness,
HHSM-500-2010-00072C
45
• Understanding why such patients are not reimbursed under the outlier payment system, and
• Determining whether or not the HH PPS adequately compensates HHAs for these patients.
And finally, as it relates to all the vulnerable groups studied here, the literature review did not fully address how to measure those beneficiaries who did not receive home health care but who are eligible and should have had access to services.
This literature review identified several alternative payment approaches used in reimbursement of other Medicare benefits and home health care financing by other payers such as Medicaid, TRICARE, and the VA. These alternative approaches highlight some ways the HH PPS might be refined. Revisiting the system’s use of HHRGs to evaluate their effectiveness in capturing case mix, health severity, and utilized services might assist in improving access for populations of interest. Improved risk-sharing between Medicare and HHAs through refinement of outlier and service utilization policies could potentially aid the system’s efficiency and integrity in meeting key goals. Cost sharing with beneficiaries could be worth considering, as in other settings, it has reduced provider incentives for fraud and gaming while promoting beneficiary involvement. Finally, an improved case-management system to assist in comprehensive care coordination could have large impacts on beneficiaries. The design and impact of such potential refinements to the HH PPS will require the team to conduct additional research and coordinate with CMS, however.
In conclusion, the literature provided some insights into the access of care and costs for providing care for the ACA-defined populations; however, there remain significant gaps in the research. This literature scan offers hints about many areas requiring special consideration during the PPS adjustment process though it does not suggest a definitive approach. The already-identified areas of concern include – but are not limited to – the potential for under- and over-utilization, the impact on access to home health care for specific vulnerable patients and the possible impact on other parts of the health care delivery system, and the impact of PPS changes on operational costs for CMS and HHAs. To more fully understand the issues related to adjusting payment policy with consideration for access and cost of care for the ACA-defined vulnerable populations, L&M will continue researching these topics, in conjunction with feedback from CMS, TEP members, and stakeholders in the home health community.
HHSM-500-2010-00072C
46
BIBLIOGRAPHY
Aday, L., & Anderson, R. (1974). A framework for the study of access to medical care. Health Services Research , 9 (3), 208-220.
Alecxih, L., Shen, S., Chan, I., Taylor, D., & Drabek, J. (2010). Individuals Living in the Community with Chronic Conditions and Functional Limitations: A Closer Look. Lewin Group. Washington, D.C.: ASPE.
Anderson, W., Norton, E., & Dow, H. (2003). Medicare Maximization by State Medicaid Programs: Effects on Medicare Home Care Utilization. Medical Care Research and Review , 201-222.
Anderson, W., Norton, E., & Kenney, G. (2003). Effects of State Medicaid Home Care Medicare Maximization Programs on Medicare Expenditures. Home Health Care Services Quarterly , 22 (3), 19-40.
Barosso, G. (2006). Dual Medicare-Medicaid Enrollees and the Medicare Denominator File. Minneapolis: Research Data Assistance Center, University of Minnesota.
Benjamin, A. (1993). An Historical Perspective on Home Care Policy. Milbank Quarterly , 129-156.
Brega, A., Schlenker , R., Hijjazi, K., Neal, S., Belansky, E., Talkington, S., et al. (August 2002). Study of Medicare Home Health Practice Variations: Final Report. Final Report, University of Colorado, Center for Health Policy Research.
Buhler-Wilkerson, K. (2007). Care of the Chronically Ill at Home: An Unresolved Dilemna in Health Policy for the United States. The Milbank Quarterly , 85 (4), 611-639.
Buntin, B., Colla, C. H., & Escarce, J. J. (2009). Effects of Payment Changes on Trends in Post-Acute Care. Health Research and Educational Trust .
Career Guide to Industries, 2010-11 Edition. (n.d.). Retrieved Dec 27, 2010, from Bureau of Labor Statistics: http://www.bls.gov/oco/cg/cgs035.htm
Carter, G., Relles, D., Wynn, B., Kawata, J., Paddock, S., Sood, N., et al. (2000). Interim Report on an Inpatient Rehabilitation Facility Prospective Payment System. Rand Institute.
Cheh, V. (2001). The Final Evaluation Report on the National Home Health Prospective Payment Demonstration: Agencies Reduce Visits While Preserving Quality. Mathematica Policy Research.
Cheh, V., & Schurrer, J. (2010). Home Health Independence Patients: High Use, but Not Financial Outliers. Final Report, Mathematica Policy Research, Centers for Medicare & Medicaid Office of Research, Development, and Information.
Choi, S., & Davitt, J. (2009). Changes in the Medicare home health care market: the impact of reimbursement policy. Medical Care , 47 (3), 302-309.
Christman, E. (2010, November 4). Improving the incentives and safeguards for the home health benefit. Retrieved November 19, 2010, from MedPAC: http://www.medpac.gov/transcripts/Home%20health%20slides.pdf
Christman, E. (2010, December 2). MedPAC Public Meetings December 2-3. Retrieved December 5, 2010, from MedPAC: http://www.medpac.gov/transcripts/HHA%20pay%20adq_public%20dec2010.pdf
CMS. (2002). Data Compendium. Retrieved October 27, 2010 from Centers for Medicare & Medicaid Studies: https://www.cms.gov/DataCompendium/
CMS. (2003). Medicare and Medicaid Statistical Supplement. Retrieved November 30, 2010 from Centers for Medicare & Medicaid Studies: https://www.cms.gov/MedicareMedicaidStatSupp/
HHSM-500-2010-00072C
47
CMS. (2004). 42 CFR Part 484. Medicare Program; Home Health Payment System Rate Update for Calendar Year 2005; Proposed Rule. Federal Register. Vol. 69, No. 106.
CMS. (2004). 43 CFR Part 484. Medicare Program; Home Health Prospective Payment System Rate Update for Calendar Year 2005; Final Rule. Federal Register. Vol. 69, No. 204.
CMS. (2004). 43 CFR Part 484. Medicare Program; Home Health Prospective Payment System Rate Update for Calendar Year 2005; Correction; Final Rule. Federal Register.
CMS. (2005). 42 CFR Part 484. Medicare Program; Home Health Prospective Payment System Rate Update for Calendar Year 2006; Proposed Rule. Federal Register. Vol. 70, No. 134.
CMS. (2006). 42 CFR Parts 414 and 484. Medicare Program; Home Health Prospective Payment System Rate Update for Calendar Year 2007 and Deficit Reduction Act of 2005 Changes to Medicare Payment for Oxygen Equipment and Capped Rental Durable Medical Equipment; Proposed. Federal Register.
CMS. (2006). 42 CFR Parts 414 and 484 Medicare Program; Home Health Prospective Payment System Rate Update for Calendar Year 2007 and Deficit Reduction Act of 2005 Changes to Medicare Payment for Oxygen Equipment and Capped Rental Durable Medical Equipment; Final Rule. Federal Register. Vol. 71, No. 217.
CMS. (2007). 42 CFR Part 484. Medicare Program; Home Health Prospective Payment System Refinement and Rate Update for Calendar Year 2008; Proposed Rule . Federal Reserve. Vol. 72, No. 86.
CMS. (2007). 42 CFR Part 484. Medicare Program; Home Health Prospective Payment System Refinement and Rate Update for Calendar Year 2008; Correction; Final Rule. Federal Register.
CMS. (2008). 42 CFR Part 484. Medicare Program; Home Health Prospective Payment System Refinement and Rate Update for Calendar Year 2008; Final Rule. Federal Register.
CMS. (2008). Medicare Program; Home Health Prospective Payment System Rate Update for Calendar Year 2009; Corrections. Federal Register. Vol. 73, No. 213.
CMS. (2008). Medicare & Medicaid Statistical Supplement. Retrieved November 10, 2010 from Centers for Medicare & Medicaid Studies: http://www.cms.gov/MedicareMedicaidStatSupp/
CMS. (2009). 42 CFR Parts 409, 424, 484, and 489 Medicare Program; Home Health Prospective Payment System Rate Update for Calendar Year 2010; Proposed Rule. Federal Register. Vol. 74, No. 150.
CMS. (2009). 42 CFR Parts 409, 424, 484, and 489 Medicare Program; Home Health Prospective Payment System Rate Update for Calendar Year 2010; Proposed Rule; Republication. Federal Register. Vol. 74, No. 155.
CMS. (2009). 42 CFR Parts 409, 424, 484, and 489 Medicare Program; Home Health Prospective Payment System Rate Update for Calendar Year 2010; Final Rule. Federal Register. Vol. 74, No. 216 .
CMS. (2009). Data Compendium. Retrieved October 27, 2010 from Centers for Medicare & Medicaid Studies: https://www.cms.gov/DataCompendium/
CMS. (2009). Medicare & Medicaid Statistical Supplement. Retrieved November 30, 2010 from Centers for Medicare & Medicaid Studies: http://www.cms.gov/MedicareMedicaidStatSupp/
CMS. (2010). 42 CFR Parts 409, 418, 424, et al. Medicare Program; Home Health Prospective Payment System Rate Update for Calendar Year 2011; Changes in Certification Requirements for Home Health Agencies and Hospices; Proposed Rule. Federal Register. Vol. 75, No. 141.
HHSM-500-2010-00072C
48
CMS. (2010). 42 CFR Parts 409, 418, 424, et al. Medicare Program; Home Health Prospective Payment System Rate Update for Calendar Year 2011; Changes in Certification Requirements for Home Health Agencies and Hospices; Final Rule. Federal Register. Vol. 75, No. 221.
CMS. (2010). Medicare and Home Health Care. Retrieved September 10, 2010 from Medicare: http://www.medicare.gov/publications/pubs/pdf/10969.pdf
CMS. (2010). Medicare Fee For Service Parts A and B Overview. Retrieved December 6, 2010 from Centers for Medicare and Medicaid Services: http://www.cms.gov/MedicareFeeforSvcPartsAB/Downloads/HHAst07.pdf
CMS. (2010). OASIS C Home Health Quality Initiatives. Retrieved December 8, 2010, from Centers for Medicare & Medicaid Services: https://www.cms.gov/HomeHealthQualityInits/06_OASISC.asp
Cohen, B. (2007). Can Home Care Agencies Find their own Medicaid Balance? Caring , 58-62.
Coleman, K., Wu, N., Goldberg, H., Deitz, D., & White, A. (2008). Refinement of Medicare's Home Health Prospective Payment System: Final Report. Cambridge, MA: Abt Associates.
Committee on Monitoring Access to Personal Health Care Services, I. o. (1993). Access to Health Care in America. (M. Millman, Ed.) National Academies Press.
Coughlin, T., Waidmann, T., & O'Malley Watts, M. (2009). Where Does the Burden Lie? Medicaid and Medicare Spending for Dual Eligible Beneficiaries. Henry J. Kaiser Family Foundation, Kaiser Commission on Medicaid and the Uninsured.
Doherty, N., & Thal, S. (1995). The Home Health Agency as a Cost Center. Home Health Care Services Quarterly , 83-96.
D'Souza, J., James, M., Szafara, K., & Fries, B. (2009). Hard times: the effects of financial strain on home care services use and participant outcomes in Michigan. The Gerontologist , 49 (2), 154-165.
ECHO Home Health Care. (2010). Retrieved November 27, 2010 from TRICARE: http://www.tricare.mil/mybenefit/home/overview/SpecialPrograms/ECHO/HomeHealthCare
Engquist, G., Johnson, C., & Johnson, W. (2010). Systems of Care: Environmental Scan of Medicaid-Funded Long-Term Supports and Services. Center for Health Care Strategies, Inc.
FitzGerald, J., Boscardin, J., & Ettner, S. (2009). Changes in Regional Variation of Medicare Home Health Care Utilization and Service Mix for Patients Undergoing Major Orthopedic Procedures in Response to Changes in Reimbursement Policy. Health Services Research, 44 (4), 1232-1252.
Fitzgerald, J., Mangione, C., Boscardin, J., Kominski, G., Hahn, B., & Ettner, S. (2006). Impact of Changes in Medicare Home Health Care Reimbursement on Month-to-Month Home Health Utilization between 1996 and 2001 for a National Sample of Patients Undergoing Orthopedic Procedures. Health Care Serivces Research , 870-878.
Fortinsky, R., Madigan, E., & Tullai-McGuinness, S. (2001). How to Obtain Meaningful and Reliable Results with OASIS Data. Las Vegas, NV: Presented at the 20th Annual Meeting of the National Association for Home Care.
Fortinsky, R., Fenster, J., & Judge, J. (2004). Medicare and Medicaid Home Health and Medicaid Waiver Services for Dually Eligible Older Adults: Risk Factors for Use and Correlates of Expenditures. The Gerontologist, 44 (6), 739-749.
Freedman, V., Rogowski, J., Wickstrom, S., Adams, J., Marainen, J., & Escarce, J. (2004). Socioeconomic Disparities in the Use of Home Health Services in a Medicare Managed Care Population. HSR: Health Services Research 39:5 (October 2004), 39 (5), 1277-1298.
HHSM-500-2010-00072C
49
Gage, B., Morely, M., Spain, P., & Ingber, M. (2009). Examining Post Acute Care Relationships in an Integrated Hospital System: Final Report. RTI International. Washington, D.C.: ASPE.
GAO. (2000). Medicare Home Health Care: Prospective Payment System Will Need Refinement as Data Become Available.
GAO. (2001). Medicare Home Health Care: OASIS Data Use, Cost, and Privacy Implications.
GAO. (2002). Medicare Home Health Care: Payments to Home Health Agencies are Considerably Higher Than Costs.
GAO. (2004). Medicare Home Health: Payments to Most Freestanding Home Health Agencies More Than Covered Their Costs.
GAO. (2009). Medicare: Improvements Needed to Address Improper Payments in Home Health.
Garrett, B., Luque, A., Liu, K., & Lewin, N. (2009). Medicare Payment Adjustment for Inpatient Psychiatric Facilities: A Review and Potential Refinements. Washington, DC: The Urban Institute CMS Contract No. 500-00-0025/Task Order#0002, Mod 11.
Golberstein, E., Grabowski, D., Langa, K., & Chernew, M. (2009). Effect of Medicare home health care payment on informal care. Inquiry , 46 (1), 58-71.
Gonzales, T. I. (1997). An Empirical Study of Economies of Scope in Home Healthcare. Health Services Research, 313-324.
Grabowski, D., Stevenson, D., Huskamp, H., & Keating, N. (2006). The Influence of Medicare Home Health Payment Incentives: Does Payer Source Matter? Inquiry, 135.
Grabowski, D. (2007). Medicare and Medicaid: Conflicting Incentives for Long-Term Care. Milbank Quarterly, 85 (4), 579-610.
Grabowski, D., Huskamp, H., Stevenson, D., & Keating, N. (2009). Ownership Status and Home Health Care Performance. Journal of Aging Social Policy, 21 (2), 130-143.Hartman, L., Jarosek, S., Virnig, B., & Durham, S. (2007). Medicare-Certified Home Health Care: Urban-Rural Differences in Utilization. The Journal of Rural Health, 23 (3), 254-257.
HCFA. (1999). 42 CFR Parts 409, 410, 411, etc. Medicare Program; Prospective Payment System for Home Health Agencies; Proposed Rule. Federal Register. Vol. 64, No. 208.
HCFA. (2000). 42 CFR Parts 409, 410, 411, etc. Medicare Program; Prospective Payment System for Home Health Agencies; Final Rule. Federal Register. Vol. 65, No. 128 .
HealthCare Strategies. (2010). HCS Connect- Home Care Management Software. Retrieved December 1, 2010, from HealthCare Strategies PPS Calculator: http://www.hcstrategies.com/www/docs/2/home-health-software-hcs-connect
Hood, F. (2001). Medicare's Home Health Prospective Payment System. Southern Medical Journal , 986-989.
HRSA. (2010). Shortage Designation: HPSAs, MUAs & MUPs. Retrieved November 19, 2010 from Health Resources and Services Administration: http://bhpr.hrsa.gov/shortage/
Hubbert, A., & Hays, B. (2002). Seniors' Need for and Use of Medicare Home Health Services. Home Health Care Services Quarterly , 21 (2), 19-34.
Institute of Medicine, Committee on Monitoring Access to Personal Health Care Services. (1993). Access to Healthcare in America. (M. Millman, Ed.) Washington, DC: National Academy Press.
HHSM-500-2010-00072C
50
Justice, D. (2010). Implementing the Affordable Care Act: New Options for Medicaid Home and Community Based Services. National Academy for State Health Policy .
Kaiser Family Foundation. (2008). Medicaid Benefits: Online Database. Retrieved November 27, 2010, from Benefits by Services: Home Health Services, Includes Nursing Services, Home Health Aides, and Medical Supplies/Equipment: http://medicaidbenefits.kff.org/service.jsp?yr=4& cat=1&nt=on&sv=12&so=0&tg=0
Kaiser Family Foundation. (2009). Kaiser Family Foundation Report: Kaiser Commission on Medicaid and the Uninsured- Where Does the Buden Lie? Medicaid and Medicare Spending for Dual Eligible Beneficiaries.
Kemper, P, Weaver, F., Short, P., Shea, D., & Kang, H. (2008). Meeting the need for personal care among the elderly: does Medicaid home care spending matter? Health Services Research, 43 (1 Part 2), 344-362.
Kenney, G., & Rajan, S. (2000). Understanding Dual Enrollees' Use of Medicare Home Health Services: The Effects of Differences in Medicaid Home Care Programs. Medical Care, 38 (1), 90-98.
Kilgore, M., Grabowski, D., Morrisey, M., Ritchie, C., Yun, H., & Locher, J. (2009). The effects of the Balanced Budget Act of 1997 on home health and hospice in older adult cancer patients. Medical Care, 47 (3), 279–285.
Kinatukara, S., Rosati, R., & Huang, L. (2010). Assessment of OASIS Reliability and Validity Using Several Methodological Approaches. Home Health Care Services Quarterly, 25 (3), 23-38.
Komisar, H., Feder, J., & Kaspar, J. (2005). Unmet long-term care needs: an analysis of Medicare-Medicaid dual eligibles. Inquiry, 42 (2), 171-182.
Kramer, A., Holthaus, D., Goodrish, G., & Epstein, A. (2006). A Study of Stroke Post-Acute Costs and Outcomes: Final Report. Washington, D.C.: ASPE.
Kroll, L. (2004, Nov 1). At Death's Door. Forbes, 174 (9), p. 140.
Lin, C., & Meit, M. (2005). Changes in Medicare Home Health Use and Practices in Rural Communities 1997-2001. Journal of Aging and Health , 17 (3), 351-362.
Liu, K., Long, S., & Dowling, K. (2003). Medicare Interim Payment System's Impact on Medicare Home Health Utilization. Health Care Financing Review, 25 (1), 81-97.
Livesay, J. L., Hanson, K. S., Anderson, M. A., & Oelschlaeger, M. (2003). Client Characteristics and the Cost of Home Care in the Prospective Payment System. Public Health Nursing, (4), 287-296.
Lund, S. (2008). The Experience of Selected States with Home Health Care under Medicaid. Caring: National Association for Home Care Magazine, 27 (3), 24-29.
Market Insight (2010). Market Insight: July 2010. Provided to L&M by CMS without citation.
Martinez, B. (2010, April 26). Home Care Yields Medicare Bounty. Wall Street Journal, retrieved 11/27/2010 from http://online.wsj.com/article/SB10001424052748703625304575116040870004462.html
Mayo, W., & Gillmor, M. (2010). Home Health: Analyzing Therapy - Probably a Lot Different than you Would Think. Robert W. Baird & Co.
McAuley, W., Spector, W., Van Nostrand, J., & Shaffer, T. (2004). The Influence of Rural Location on Utilization of Formal Home Care: The Role of Medicaid. The Gerontologist, 44 (5), 655–664.
McAuley, W., Spector, W., & Van Nostrand, J. (2008). Home Health Care Agency Staffing Patterns Before and After the Balanced Budget Act of 1997, by Rural and Urban Location. The Journal of Rural Health , 12-23.
HHSM-500-2010-00072C
51
McCall, N., Komisar, H., Petersons, A., & Moore, S. (2001). Medicare home health before and after the BBA. Health Affairs, 20 (3), 189-198.
McCall, N., Petersons, A., Moore, S., & Korb, J. (2003). Utilization of home health services before and after the Balanced Budget Act of 1997: what were the initial effects? Health Services Research, 38 (1), 85-106.
McKnight, R. (2006). Home Care Reimbursement, Long-Term Care Utilization, and Health Outcomes. Journal of Public Economics, 90, 293-323.
Meadow, A., & Cotterill, P. (2005). Financial Incentives in Outlier Utilization Early in the Medicare Home Health Prospective Payment System. Academy Health Meeting.
Meadow, A., Wrobel, M., & Goldberg, H. (2004). Who are the outliers? Characteristics of outlier episodes under Medicare's home health prospective payment system. Public Health and the Environment. APHA.
MedPAC. (2001). Medicare in Rural America. 105-111.
MedPAC. (2003). MedPAC, Report to the Congress: Medicare Payment Policy. Washington, D.C.
MedPAC. (2004). Home Health Services: Assessing Payment Adequacy and Updating Payments (Chapter 3 D).
MedPAC. (2005). Report to the Congress: Home Health Agency Case Mix and Financial Performance. 1-32.
MedPAC. (2008). Home Health Care Services Payment System. MedPAC.
MedPAC. (2010). A Data Book: Healthcare Spending and the Medicare Program. Medicare Payment Advisory Commission.
MedPAC. (2010). Coordinating the Care of Dual Eligible Beneficiaries. 1-22.
MedPAC. (2010). Home Health Services: Assessing Payment Adequacy and Updating Systems (Chapter 3B).
MedPAC. (2010). Hospital Acute Inpatient Services Payment System.
MedPAC. (2010). Medicare Payment Basics: Clinical Laboratory Services Payment System.
MedPAC. (2010). Medicare Payment Basics: Durable Medical Equipment Payment System.
MedPAC. (2010). Medicare Payment Basics: Home Health Care Services Payment System.
MedPAC. (2010). Medicare Payment Basics: Hospice Services Payment System.
MedPAC. (2010). Medicare Payment Basics: Long-term Care Hospitals Payment System.
MedPAC. (2010). Medicare Payment Basics: Outpatient Dialysis Services Payment System.
MedPAC. (2010). Medicare Payment Basics: Outpatient Hospital Services Payment System.
MedPAC. (2010). Medicare Payment Basics: Outpatient Therapy Services Payment System.
MedPAC. (2010). Medicare Payment Basics: Oxygen and Oxygen Equipment Payment System.
MedPAC. (2010). Medicare Payment Basics: Part D Payment System.
MedPAC. (2010). Medicare Payment Basics: Physician Services Payment System.
MedPAC. (2010). Medicare Payment Basics: Psychiatric Hospital Services Payment System.
MedPAC. (2010). Medicare Payment Basics: Rehabilitation Facilities (inpatient) Payment System.
HHSM-500-2010-00072C
52
MedPAC. (2010). Medicare Payment Basics: Skilled Nursing Facility Services Payment System.
MedPAC. (2010). Medicare Payment Basics: Ambulatory Surgical Centers Payment System.
MedPAC. (2010). Medicare Payment Basics: Critical Access Hospitals Payment System.
MedPAC. (2010). Medicare Payment Basics: Medicare Advantage Program Payment System.
MedPAC. (2010). MedPAC Comment Letter: 2011 Proposed Rule.
MedPAC. (2010). MedPAC, Report to the Congress: Medicare Payment Policy. Washington, D.C.
Miller, E., & Rosenheck, R. (2007). Mental Illness and Use of Home Care Nationally in the US Department of Veteran's Affairs. American Journal of Geriatric Psychiatry, 1046-1056.
Milligan, C., & Woodcock, C. (2008). Medicare Advantage Special Needs Plans for Dual Eligibles: A Primer. The Commonwealth Fund, 1-12.
Mitchell, J., Dickey, B., Liptzin, B. et al. (1987). Bringing psychiatric patients into the Medicare prospective payment system: Alternatives to DRGs. Am J Psychiatry, 144(5), 610-615.
Moon, S., & Shin, J. (2006). Health Care Utilization Among Medicare-Medicaid Dual Eligibles: A Count Data Analysis. BMC Public Health (6), 88.
Murkofsky, R., & Alston, K. (2009). The Past, Present, and Future of Skilled Home Health Care Agency Care. Clinics in Geriatric Medicine, 25, 1-17.
Murtaugh, C., McCall, N., Moore, S., & Meadows, A. (2003). Trends In Medicare Home Health Care Use: 1997-2001. Health Affairs, 22 (5), 146-156.
Murtaugh, C., Peng, T., Moore, S., & Maduro, G. (2008). Assessing Home Health Care Quality for Post-Acute and Chronically Ill Patients: Final Report. Visiting Nurse Service of New York, Center for Home Care Policy and Research.
National Association for Home Care and Hospice. (2010). 2010 PPS Payment Calculator- Urban. Retrieved December 1, 2010, from Regulatory Affairs Clinician's Corner: http://www.nahc.org/Regulatory/
National Association for Home Care and Hospice. (2010). Basic Statistics About Home Care Updated 2010. Retrieved November 17, 2010, from National Association for Home Care and Hospice: www.nahc.org
Nelson, J., & Gingerich, B.S. (2010). Rural Health: Access to Care and Services. Home Health Care Management & Practice, 22(5), 339-343.
OIG. (1995). Home Health Agencies: Alternative Coverage and Payment Policies. (OEI-12-94-00180). DHHS, Office of Inspector General.
OIG. (1997). How HMOs Manage Home Health Services. (OEI-04-9S00080). DHHS, Office of Inspector General.
OIG. (1997). Operating Practices of Low-Cost Home Health Agencies: Seven Case Studies. (OEI-04-93-00263). DHHS, Office of Inspector General.
OIG. (2001). Medicare Home Health Care-Community Beneficiaries. (OEI-02-01-00070). DHHS, Office of Inspector General.
OIG. (2006). Medicare Beneficiary Access to Home Health Agencies: 2004. (OEI-02-04-00260). DHHS, Office of Inspector General.
HHSM-500-2010-00072C
53
OIG. (2008). Duplicate Medicaid and Medicare Home Health Payments: Medical Supplies and Therapeutics. (OEI-07-06-00640). DHHS, Office of Inspector General.
OIG. (2009). Aberrant Medicare Home Health Outlier Payment Patterns in Miami-Dade County and Other Geographic Areas in 2008. (OEI-04-08-00570). DHHS, Office of Inspector General.
OIG. (2009). Medicaid and Medicare Home Health Payments for Skilled Nursing and Home Health Aide Services. (OEI-07-06-00641). DHHS, Office of Inspector General.
Patient Protection and Affordable Care Act and Health Care and Education Reconciliation Act of 2010, Pub .L. N. 111-148, 111-152.
Payne, S., DiGiuseppe, D., & Tilahun, N. (2002). The Relationship of Post-Acute Home Care Use to Medicaid Utilization and Expenditures. Health Services Research , 683-710.
Pechansky, R., & Thomas, W. (1981). The Concept of Access: Definition and Relationship to Consumer Satisfaction. Medical Care, 19 (2), 127-140.
Porell, F., Liu, K., & Brungo, D. (2006). Agency and Market Area Factors Affecting Home Health Agency Supply Changes. Health Services Research, 41 (5), 1847-75.
Public Health, Title 42 Code of Federal Regulations, Pt. 484. (2009).
Rosko, M.D., R.W. Broyles (1984). Unintended consequences of prospective payment: Erosion of hospital financial position and cost shifting. HCM Review. Summer, 35-43.
Schlenker, R., Powell, M., & Goodrich, G. (2005). Initial Home Health Outcomes Under Prospective Payment. Health Services Research, 40 (1), 177-193.
Shaughnessy, P., Crisler, K., & Schlenker, R. (1994). Measuring Outcomes of Home Health Care, Vol. 1: Final Report, Study to Develop Outcome-based Quality Measures for Home Health Services. Center for Health Policy Research and Center for Health Services Research.
Shaughnessy, P., Crisler, K., & Schlenker, R. (1998). Outcome-Based Quality Improvement in Home Health Care: The OASIS Indicators. Quality Management in Health Care, 58-67.
Shew, P., Sheryl, S., Arthur, N., & Bush, K. (2010). OASIS Inter-Rater Reliability and Reimbursement: A Study of Inter-Rater Reliability of the Outcome and Assessment Information Set (OASIS): Its Effects on the Home Health Resource Group (HHRG) and Reimbursement. Home Healthcare Nurse, 31-36.
Shi, L., & Singh, D. (2004). Delivering Health Care in America. A Systems Approach. (3 ed.). Jones and Bartlett Publishers.
Shi, L., & Singh, D. (2008). Delivering Health Care in America: A Systems Approach. Sudbury, MA: Jones and Bartlett Publishers.
Shilling, A. (2004, Dec 27). Open Bar for Health Costs. Forbes, 17 (13), p. 192.
Smith, B., Maloy, K., & Hawkins, D. (2000). An examination of Medicare home health services. A descriptive study of the effects of the Balanced Budget Act interim payment system on access to and quality of care. Care Management Journals, 2 (4), 238-247.
Spector, W., Cohen, J., & Pesis-Katz, I. (2004). Home Care Before and After the Balanced Budget Act of 1997: Shifts in Financing and Services. The Gerentologist, 39-47.
Sutton, J. (2005). Utilization of Home Health Services Among Rural Beneficiaries Before and After the PPS. NORC Walsh Center for Rural Health Analysis.
Teenier, P. (2005). The Clinician's Role in Medicare Prospective Payment. Home Health Care Nurse, 256-259.
HHSM-500-2010-00072C
54
Tullai-McGuinness, S., Madigan, E., & Fortinsky, R. (2009). Validity Testing the Outcomes and Assessment Information Set (OASIS). Home Health Care Services Quarterly, 45-57.
U.S. Department of Defense. (2005). 32 CFR Part 199, TRICARE; Sub-Acute Care Program; Uniform Skilled Nursing Facility Benefit; Home Health Care Benefit; Adopting Medicare Payment Methods for Skilled Nursing Facilities and Home Health Care Providers. Federal Register. Vol. 70, No. 204
van Der Walde, L., & Daniels, T. (2002). Health Care Industry Update. Centers for Medicare & Medicaid Studies.
van Der Walde, L., & Lindstrom, L. (2003). Health Care Industry Market Update. Centers for Medicare & Medicaid Studies.
Vanderboom, C. & Madigan, E. (2008). Relationships of Rurality, Home Health Care Use, and Outcomes. Western Journal of Nursing Research, 30 (3), 365-378.
Visiting Nurse Associations of America. (2009). Medicare Home Health: Encouraging Quality and Discouraging Abuse. Washington, DC.
Visiting Nurse Associations of America. (2009). Preserving Equitable Access to Community-based Home Health (PEACH). Visiting Nurse Associations of America.
What is Home Based Primary Care? (2010). Retrieved November 27, 2010 from US Department of Veterans Affairs: http://www1.va.gov/geriatrics/HCBC/
White, W., Plotzke, M., Goldberg, H., & Robinson, C. (2010). Analysis of 2000-2008 Home Health Case-mix Change. Cambridge, MA:. Abt Associates.Zhu, C. (2004). Effects of the Balanced Budget Act on Medicare Home Health Utilization. Journal of the American Geriatrics Society, 52 (6), 989-984.
Zhu, C. (2004). Effects of the Balanced Budget Act on Medicare Home Health Utilization. Journal of the American Geriatrics Society , 52 (6), 989-984.