home care referral registry activity summary€¦ · home care referral registry activity summary...
TRANSCRIPT
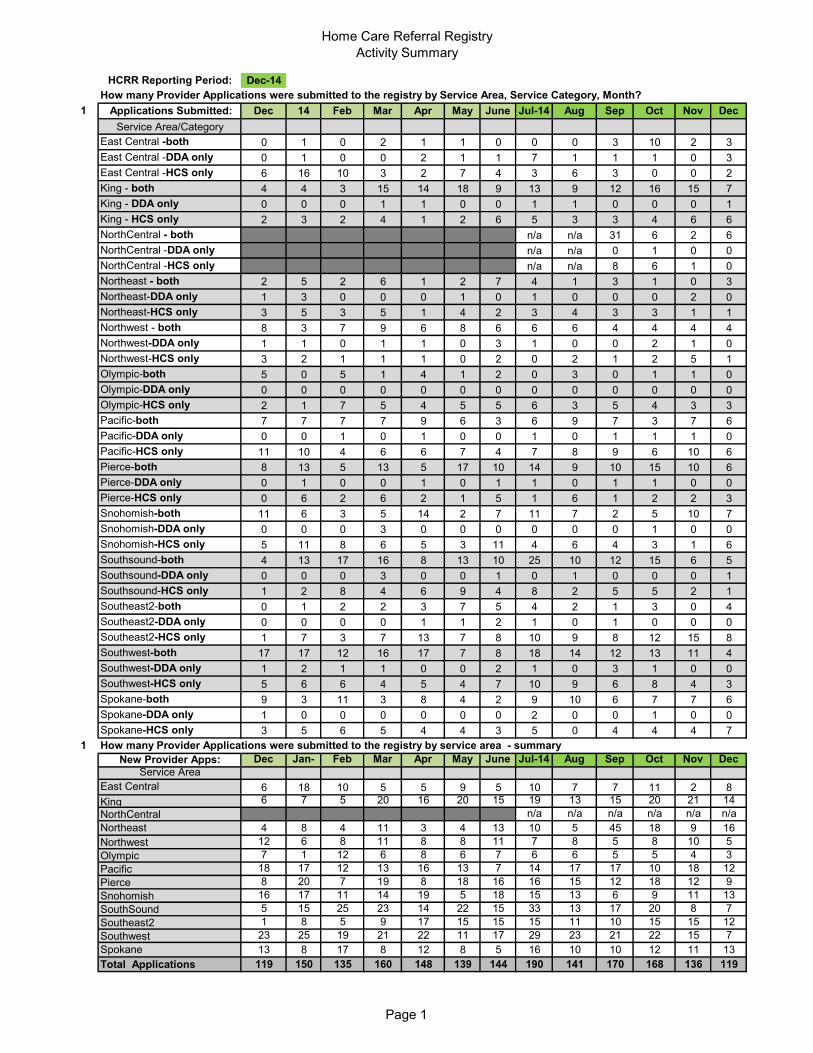
Home Care Referral Registry
Activity Summary
HCRR Reporting Period: Dec-14
How many Provider Applications were submitted to the registry by Service Area, Service Category, Month?
1 Applications Submitted: Dec
Jan-
14 Feb Mar Apr May June Jul-14 Aug Sep Oct Nov Dec
Service Area/Category
East Central -both 0 1 0 2 1 1 0 0 0 3 10 2 3
East Central -DDA only 0 1 0 0 2 1 1 7 1 1 1 0 3
East Central -HCS only 6 16 10 3 2 7 4 3 6 3 0 0 2
King - both 4 4 3 15 14 18 9 13 9 12 16 15 7
King - DDA only 0 0 0 1 1 0 0 1 1 0 0 0 1
King - HCS only 2 3 2 4 1 2 6 5 3 3 4 6 6
NorthCentral - both n/a n/a 31 6 2 6
NorthCentral -DDA only n/a n/a 0 1 0 0
NorthCentral -HCS only n/a n/a 8 6 1 0
Northeast - both 2 5 2 6 1 2 7 4 1 3 1 0 3
Northeast-DDA only 1 3 0 0 0 1 0 1 0 0 0 2 0
Northeast-HCS only 3 5 3 5 1 4 2 3 4 3 3 1 1
Northwest - both 8 3 7 9 6 8 6 6 6 4 4 4 4
Northwest-DDA only 1 1 0 1 1 0 3 1 0 0 2 1 0
Northwest-HCS only 3 2 1 1 1 0 2 0 2 1 2 5 1
Olympic-both 5 0 5 1 4 1 2 0 3 0 1 1 0
Olympic-DDA only 0 0 0 0 0 0 0 0 0 0 0 0 0
Olympic-HCS only 2 1 7 5 4 5 5 6 3 5 4 3 3
Pacific-both 7 7 7 7 9 6 3 6 9 7 3 7 6
Pacific-DDA only 0 0 1 0 1 0 0 1 0 1 1 1 0
Pacific-HCS only 11 10 4 6 6 7 4 7 8 9 6 10 6
Pierce-both 8 13 5 13 5 17 10 14 9 10 15 10 6
Pierce-DDA only 0 1 0 0 1 0 1 1 0 1 1 0 0
Pierce-HCS only 0 6 2 6 2 1 5 1 6 1 2 2 3
Snohomish-both 11 6 3 5 14 2 7 11 7 2 5 10 7
Snohomish-DDA only 0 0 0 3 0 0 0 0 0 0 1 0 0
Snohomish-HCS only 5 11 8 6 5 3 11 4 6 4 3 1 6
Southsound-both 4 13 17 16 8 13 10 25 10 12 15 6 5
Southsound-DDA only 0 0 0 3 0 0 1 0 1 0 0 0 1
Southsound-HCS only 1 2 8 4 6 9 4 8 2 5 5 2 1
Southeast2-both 0 1 2 2 3 7 5 4 2 1 3 0 4
Southeast2-DDA only 0 0 0 0 1 1 2 1 0 1 0 0 0
Southeast2-HCS only 1 7 3 7 13 7 8 10 9 8 12 15 8
Southwest-both 17 17 12 16 17 7 8 18 14 12 13 11 4
Southwest-DDA only 1 2 1 1 0 0 2 1 0 3 1 0 0
Southwest-HCS only 5 6 6 4 5 4 7 10 9 6 8 4 3
Spokane-both 9 3 11 3 8 4 2 9 10 6 7 7 6
Spokane-DDA only 1 0 0 0 0 0 0 2 0 0 1 0 0
Spokane-HCS only 3 5 6 5 4 4 3 5 0 4 4 4 7
1 How many Provider Applications were submitted to the registry by service area - summary
New Provider Apps: Dec Jan- Feb Mar Apr May June Jul-14 Aug Sep Oct Nov Dec
Service Area
East Central 6 18 10 5 5 9 5 10 7 7 11 2 8
King 6 7 5 20 16 20 15 19 13 15 20 21 14
NorthCentral n/a n/a n/a n/a n/a n/a
Northeast 4 8 4 11 3 4 13 10 5 45 18 9 16
Northwest 12 6 8 11 8 8 11 7 8 5 8 10 5
Olympic 7 1 12 6 8 6 7 6 6 5 5 4 3
Pacific 18 17 12 13 16 13 7 14 17 17 10 18 12
Pierce 8 20 7 19 8 18 16 16 15 12 18 12 9
Snohomish 16 17 11 14 19 5 18 15 13 6 9 11 13
SouthSound 5 15 25 23 14 22 15 33 13 17 20 8 7
Southeast2 1 8 5 9 17 15 15 15 11 10 15 15 12
Southwest 23 25 19 21 22 11 17 29 23 21 22 15 7
Spokane 13 8 17 8 12 8 5 16 10 10 12 11 13
Total Applications 119 150 135 160 148 139 144 190 141 170 168 136 119
Page 1
Home Care Referral Registry
Activity Summary
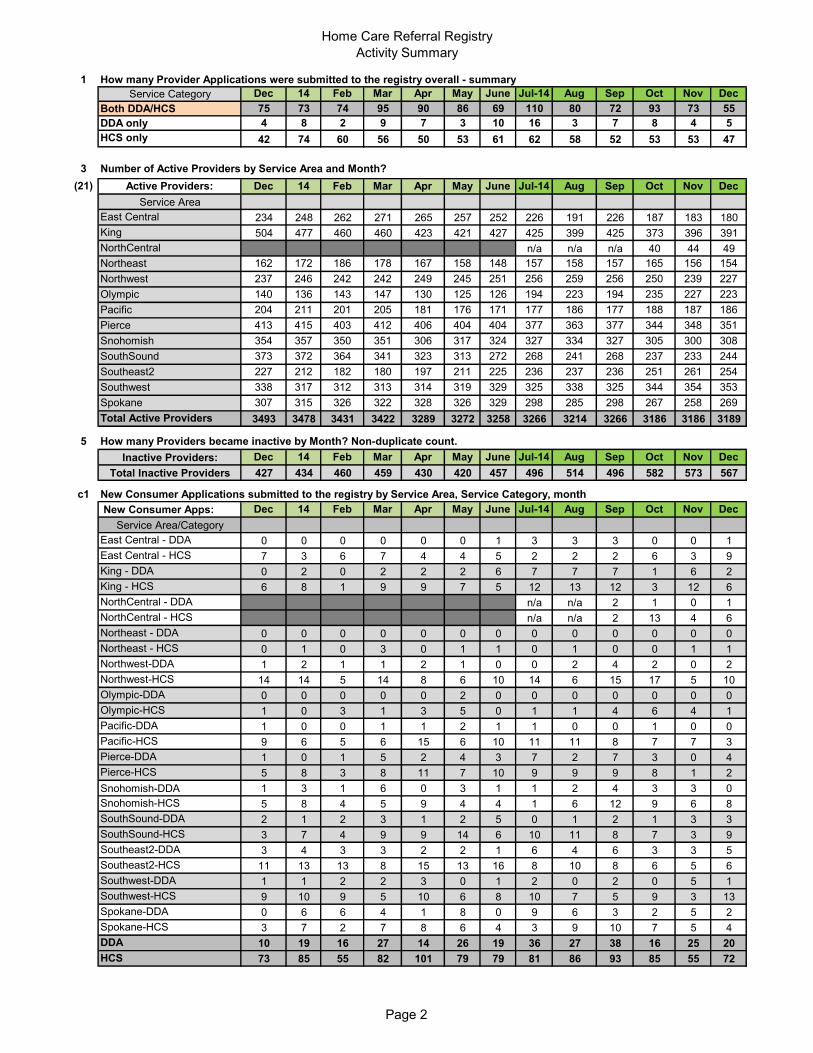
1 How many Provider Applications were submitted to the registry overall - summary
Service Category Dec
Jan-
14 Feb Mar Apr May June Jul-14 Aug Sep Oct Nov Dec
Both DDA/HCS 75 73 74 95 90 86 69 110 80 72 93 73 55
DDA only 4 8 2 9 7 3 10 16 3 7 8 4 5
HCS only 42 74 60 56 50 53 61 62 58 52 53 53 47
3 Number of Active Providers by Service Area and Month?
(21) Active Providers: Dec
Jan-
14 Feb Mar Apr May June Jul-14 Aug Sep Oct Nov Dec
Service Area
East Central 234 248 262 271 265 257 252 226 191 226 187 183 180
King 504 477 460 460 423 421 427 425 399 425 373 396 391
NorthCentral n/a n/a n/a 40 44 49
Northeast 162 172 186 178 167 158 148 157 158 157 165 156 154
Northwest 237 246 242 242 249 245 251 256 259 256 250 239 227
Olympic 140 136 143 147 130 125 126 194 223 194 235 227 223
Pacific 204 211 201 205 181 176 171 177 186 177 188 187 186
Pierce 413 415 403 412 406 404 404 377 363 377 344 348 351
Snohomish 354 357 350 351 306 317 324 327 334 327 305 300 308
SouthSound 373 372 364 341 323 313 272 268 241 268 237 233 244
Southeast2 227 212 182 180 197 211 225 236 237 236 251 261 254
Southwest 338 317 312 313 314 319 329 325 338 325 344 354 353
Spokane 307 315 326 322 328 326 329 298 285 298 267 258 269
Total Active Providers 3493 3478 3431 3422 3289 3272 3258 3266 3214 3266 3186 3186 3189
5 How many Providers became inactive by Month? Non-duplicate count.
Inactive Providers: Dec
Jan-
14 Feb Mar Apr May June Jul-14 Aug Sep Oct Nov Dec
Total Inactive Providers 427 434 460 459 430 420 457 496 514 496 582 573 567
c1 New Consumer Applications submitted to the registry by Service Area, Service Category, month
New Consumer Apps: Dec
Jan-
14 Feb Mar Apr May June Jul-14 Aug Sep Oct Nov Dec
Service Area/Category
East Central - DDA 0 0 0 0 0 0 1 3 3 3 0 0 1
East Central - HCS 7 3 6 7 4 4 5 2 2 2 6 3 9
King - DDA 0 2 0 2 2 2 6 7 7 7 1 6 2
King - HCS 6 8 1 9 9 7 5 12 13 12 3 12 6
NorthCentral - DDA n/a n/a 2 1 0 1
NorthCentral - HCS n/a n/a 2 13 4 6
Northeast - DDA 0 0 0 0 0 0 0 0 0 0 0 0 0
Northeast - HCS 0 1 0 3 0 1 1 0 1 0 0 1 1
Northwest-DDA 1 2 1 1 2 1 0 0 2 4 2 0 2
Northwest-HCS 14 14 5 14 8 6 10 14 6 15 17 5 10
Olympic-DDA 0 0 0 0 0 2 0 0 0 0 0 0 0
Olympic-HCS 1 0 3 1 3 5 0 1 1 4 6 4 1
Pacific-DDA 1 0 0 1 1 2 1 1 0 0 1 0 0
Pacific-HCS 9 6 5 6 15 6 10 11 11 8 7 7 3
Pierce-DDA 1 0 1 5 2 4 3 7 2 7 3 0 4
Pierce-HCS 5 8 3 8 11 7 10 9 9 9 8 1 2
Snohomish-DDA 1 3 1 6 0 3 1 1 2 4 3 3 0
Snohomish-HCS 5 8 4 5 9 4 4 1 6 12 9 6 8
SouthSound-DDA 2 1 2 3 1 2 5 0 1 2 1 3 3
SouthSound-HCS 3 7 4 9 9 14 6 10 11 8 7 3 9
Southeast2-DDA 3 4 3 3 2 2 1 6 4 6 3 3 5
Southeast2-HCS 11 13 13 8 15 13 16 8 10 8 6 5 6
Southwest-DDA 1 1 2 2 3 0 1 2 0 2 0 5 1
Southwest-HCS 9 10 9 5 10 6 8 10 7 5 9 3 13
Spokane-DDA 0 6 6 4 1 8 0 9 6 3 2 5 2
Spokane-HCS 3 7 2 7 8 6 4 3 9 10 7 5 4
DDA 10 19 16 27 14 26 19 36 27 38 16 25 20
HCS 73 85 55 82 101 79 79 81 86 93 85 55 72
Page 2

Home Care Referral Registry
Activity Summary
c1 New consumer apps - summary
East Central 7 3 6 7 4 4 6 5 5 5 6 3 10
King 6 10 1 11 11 9 11 19 20 19 4 18 8
NorthCentral n/a n/a n/a n/a n/a n/a
Northeast 0 1 0 3 0 1 1 0 1 0 0 1 1
Northwest 15 16 6 15 10 7 10 14 8 19 19 5 12
Olympic 1 0 3 1 3 7 0 1 1 4 6 4 1
Pacific 10 6 5 7 16 8 11 12 11 8 8 7 3
Pierce 6 8 4 13 13 11 13 16 11 16 11 1 6
Snohomish 6 11 5 11 9 7 5 2 8 16 12 9 8
Southsound 5 8 6 12 10 16 11 10 12 10 8 6 12
Southeast2 14 17 16 11 17 15 17 14 14 14 9 8 11
Southwest 10 11 11 7 13 6 9 12 7 7 9 8 14
Spokane 3 13 8 11 9 14 4 12 15 13 9 10 6
Total-statewide 83 104 71 109 115 105 98 117 113 131 101 80 92
c2 How many times have Consumers used the Registry by Service Area and Month? Duplicate count
Active Consumers Count: Dec
Jan-
14 Feb Mar Apr May June Jul-14 Aug Sep Oct Nov Dec
Service Area/Category
East Central-DDA 54 54 53 53 53 53 54 57 60 62 62 62 63
East Central -HCS 379 382 388 394 398 403 408 410 412 411 417 420 429
King-DDA 99 101 101 103 105 106 113 119 125 126 127 133 135
King-HCS 606 614 615 624 633 639 643 655 663 672 674 684 688
NorthCentral - DDA n/a n/a 10 11 11 12
NorthCentral - HCS n/a n/a 63 76 80 86
Northeast-DDA 17 17 17 17 17 17 17 17 17 17 17 17 17
Northeast-HCS 344 345 345 348 348 349 350 350 350 350 350 351 352
Northwest-DDA 117 119 120 121 123 124 125 125 127 131 133 133 135
Northwest-HCS 618 632 637 649 658 663 674 686 692 707 724 728 738
Olympic-DDA 32 32 32 32 32 34 34 34 34 34 34 34 34
Olympic-HCS 285 285 288 289 292 296 296 297 298 302 306 311 312
Pacific-DDA 27 27 27 28 29 31 32 33 33 33 34 34 34
Pacific-HCS 451 457 462 468 483 489 499 510 520 528 535 542 545
Pierce-DDA 337 337 338 343 346 350 353 361 363 365 368 368 372
Pierce-HCS 655 663 665 673 684 691 700 709 717 725 731 734 736
Snohomish-DDA 96 99 100 106 106 109 110 111 113 117 120 123 123
Snohomish-HCS 509 517 521 526 535 539 543 544 550 561 570 577 585
SouthSound-DDA 193 194 196 199 200 202 206 206 207 209 210 213 216
SouthSound-HCS 693 700 705 714 723 734 742 751 764 770 776 779 787
Southeast2-DDA 193 197 201 203 205 207 208 213 217 219 222 225 230
Southeast2-HCS 1584 1596 1609 1617 1633 1645 1661 1669 1679 1684 1690 1695 1701
Southwest-DDA 126 127 129 131 134 134 135 137 137 140 140 145 146
Southwest-HCS 492 503 511 517 525 532 540 550 559 565 574 577 591
Spokane-DDA 225 231 237 241 242 250 250 259 265 268 270 275 277
Spokane-HCS 745 752 755 762 769 775 779 781 791 802 809 814 818
DDA 1516 1535 1551 1577 1592 1617 1637 1672 1698 1721 1737 1762 1782
HCS 7361 7446 7501 7581 7681 7755 7835 7912 7995 8077 8156 8212 8282
c3 How many Referral lists were generated by Service Category and Month?
Referral List count: Dec
Jan-
14 Feb Mar Apr May June Jul-14 Aug Sep Oct Nov Dec
Service Area/Category
East Central- DDA 1 0 0 0 0 0 2 2 5 3 1 3 1
East Central -HCS 13 22 27 17 17 16 20 19 20 15 24 11 26
King-DDA 4 2 4 0 9 3 3 9 11 3 8 8 8
King-HCS 38 31 24 15 54 44 30 25 21 28 16 29 24
NorthCentral - DDA n/a n/a n/a 2 0 1
NorthCentral - HCS n/a n/a n/a 18 11 11
Northeast-DDA 2 3 0 0 0 0 0 0 0 2 0 0
Northeast-HCS 1 0 2 1 3 5 3 3 2 3 3 2 3
Northwest-DDA 27 2 6 9 10 7 7 8 5 13 3 2 12
Northwest-HCS 1 41 41 29 29 29 23 25 36 37 37 40 54
Page 3

Home Care Referral Registry
Activity Summary
Olympic-DDA 31 5 2 0 0 0 3 0 4 0 0 1
Olympic-HCS 25 33 14 15 22 16 31 22 30 26 34 34 17
Pacific-DDA 9 1 1 2 2 1 2 4 0 0 1 0
Pacific-HCS 21 30 37 24 37 46 28 46 35 46 37 38 27
Pierce-DDA 4 5 9 5 12 22 11 15 14 13 7 17 14
Pierce-HCS 28 29 29 15 32 36 33 33 32 34 25 33 25
Snohomish-DDA 8 3 5 1 9 2 5 1 4 7 7 5 2
Snohomish-HCS 48 26 21 30 29 27 24 35 26 34 37 16 35
Southsound-DDA 5 4 16 12 10 8 7 11 10 10 10 6 12
Southsound-HCS 31 48 60 46 63 69 71 70 73 75 57 32 49
Southeast2-DDA 5 5 2 2 3 1 4 5 7 3 5 4 4
Southeast2-HCS 32 24 26 25 24 29 31 31 23 17 18 20 17
Southwest-DDA 12 1 8 4 4 7 4 12 3 10 5 9 5
Southwest-HCS 10 24 31 38 31 23 29 33 27 40 41 20 39
Spokane-DDA 22 2 10 13 8 10 13 2 18 8 19 10 12
Spokane-HCS 35 27 18 31 34 39 31 29 40 41 45 33 32
DDA 130 33 63 48 67 61 61 69 81 72 66 65 70
HCS 283 335 330 286 375 379 354 371 365 396 374 308 348
c3 Referral list summary: Dec Jan- Feb Mar Apr May June Jul-14 Aug Sep Oct Nov Dec
East Central 14 22 27 17 17 16 22 21 25 18 25 14 27
King 42 33 28 15 63 47 33 34 32 31 24 37 32
NorthCentral n/a n/a n/a n/a n/a n/a
Northeast 3 3 2 1 3 5 3 3 2 5 3 2 3Northwest 28 43 47 38 39 36 30 33 41 50 40 42 66
Olympic 56 38 16 15 22 16 34 22 34 26 34 35 17
Pacific 30 31 38 26 39 47 30 50 35 46 38 38 27
Pierce 32 34 38 20 44 58 44 48 46 47 32 50 39
Snohomish 56 29 26 31 38 29 29 36 30 41 44 21 37
Southsound 36 52 76 58 73 77 78 81 83 85 67 38 61
Southeast2 37 29 28 27 27 30 35 36 30 20 23 24 21
Southwest 22 25 39 42 35 30 33 45 30 50 46 29 44
Spokane 57 29 28 44 42 49 44 31 58 49 64 43 44
referrals statewide 413 368 393 334 442 440 415 440 446 468 440 373 418
c4 How many Referrals were performed by Service Type and Month?
Number of Referrals Dec
Jan-
14 Feb Mar Apr May June Jul-14 Aug Sep Oct Nov Dec
Service Type
Routine care 337 365 306 390 398 398 399 399 401 438 417 334 385
Backup care 7 8 12 17 15 15 17 17 12 11 18 20 14
Relief care 24 20 16 35 27 27 24 24 33 23 25 30 31
Referrals: (Duplicate count) 368 393 334 442 440 440 440 440 446 472 460 384 430
c9 Number of consumers served (requesting a referral) by Service Category and Service Area
(c17) # Consumers Served Dec
Jan-
14 Feb Mar Apr May June Jul-14 Aug Sep Oct Nov Dec
Service Area/Category
East Central-DDA 0 0 0 0 0 1 1 1 5 3 1 2 1
East Central-HCS 19 19 19 16 14 33 34 34 16 13 21 10 22
King-DDA 2 4 4 4 3 3 6 6 10 3 7 7 5
King-HCS 24 21 21 27 29 22 18 18 20 23 12 21 18
NorthCentral - DDA 0 0 1
NorthCentral - HCS 0 0 9
Northeast-DDA 2 0 0 0 0 0 0 0 0 0 0 0 0
Northeast-HCS 0 2 2 9 10 3 3 3 2 2 2 2 3
Northwest-DDA 2 6 6 8 6 3 6 6 8 10 3 2 10
Northwest-HCS 31 34 34 25 25 21 24 24 31 33 36 31 40
Olympic-DDA 2 1 1 0 0 3 0 0 2 0 0 1 0
Olympic-HCS 21 13 13 12 13 25 22 22 19 19 25 22 13
Pacific-DDA 1 1 1 2 1 3 4 4 0 0 1 0 0
Pacific-HCS 25 32 32 34 38 44 58 58 32 34 34 31 23
Pierce-DDA 5 6 6 11 16 12 16 16 12 10 5 8 9
Page 4

Home Care Referral Registry
Activity Summary
Pierce-HCS 27 25 25 27 33 32 32 32 27 30 15 22 18
Snohomish-DDA 3 5 5 8 2 4 1 1 4 6 7 5 2
Snohomish-HCS 23 20 20 24 25 47 52 52 27 31 31 15 35
Southsound-DDA 4 11 11 9 8 9 11 11 5 7 8 6 9
Southsound-HCS 27 39 39 51 52 62 60 60 54 52 42 25 42
Southeast2-DDA 5 4 4 4 2 4 6 6 7 3 5 5 5
Southeast2-HCS 30 29 29 24 30 32 32 32 20 17 17 17 15
Southwest-DDA 1 7 7 4 5 6 11 11 2 9 5 6 4
Southwest-HCS 22 29 29 27 20 50 53 53 25 30 33 16 33
Spokane-DDA 1 8 8 7 6 13 5 5 10 7 9 7 7
Spokane-HCS 17 14 14 21 24 45 41 41 26 28 22 18 16
DDA 28 53 53 57 49 61 67 67 65 58 51 49 53
HCS 266 277 277 297 313 416 429 429 299 312 290 230 287
c9 Number of unique consumers served by service area - summary
# Consumers served Dec
Jan-
14 Feb Mar Apr May June Jul-14 Aug Sep Oct Nov Dec
East Central 19 19 15 16 14 14 16 16 22 16 22 12 23
King 26 25 14 31 32 25 22 22 29 26 19 28 23
NorthCentral n/a n/a 0 0 0 10
Northeast 2 2 1 9 10 3 1 1 2 2 2 2 3
Northwest 33 40 33 33 31 24 20 20 39 43 39 33 50
Olympic 23 14 13 12 13 18 8 8 21 19 25 23 13
Pacific 26 31 23 36 39 23 27 27 32 34 35 31 23
Pierce 32 31 17 38 49 38 28 28 39 40 20 30 27
Snohomish 26 25 29 32 27 21 23 23 31 37 38 20 37
Southsound 31 50 38 60 60 56 40 40 59 59 50 31 51
Southeast2 35 33 31 28 32 25 29 29 27 20 22 22 20
Southwest 24 36 37 31 25 32 25 25 27 39 38 22 37
Spokane 18 22 25 28 30 21 13 13 36 35 31 25 23
Referrals statewide 295 328 276 354 362 300 252 252 364 370 341 279 340
7 Employment by SA/SC
# employed Dec
Jan-
14 Feb Mar Apr May June Jul-14 Aug Sep Oct Nov Dec
Service Area/Category
East Central-DDA 0 0 0 0 0 1 0 1 1 1 1 1 1
East Central-HCS 7 19 14 13 5 14 12 12 17 13 15 19 11
King-DDA 0 0 0 0 0 1 1 1 3 0 1 0 2
King-HCS 6 3 2 4 4 12 7 10 15 14 6 14 13
NorthCentral - DDA n/a n/a 0 3 1 0
NorthCentral - HCS n/a n/a 0 8 3 1
Northeast-DDA 0 0 0 0 0 0 0 0 0 0 0 0 0
Northeast-HCS 1 2 3 7 0 3 8 4 3 4 4 1 2
Northwest-DDA 4 5 2 8 3 8 5 5 1 3 2 1 6
Northwest-HCS 28 26 20 24 38 21 18 29 30 19 20 27 29
Olympic-DDA 0 0 0 0 1 0 1 0 0 0 0 0 0
Olympic-HCS 22 11 10 14 11 12 16 16 18 17 13 19 20
Pacific-DDA 0 0 1 1 1 0 0 2 1 0 0 1 0
Pacific-HCS 21 26 26 28 38 31 29 33 16 31 30 29 24
Pierce-DDA 1 2 0 1 5 5 5 4 6 3 4 1 2
Pierce-HCS 10 11 7 5 16 16 8 10 9 10 9 13 13
Snohomish-DDA 1 3 2 1 5 1 2 1 3 2 7 2 5
Snohomish-HCS 28 24 25 19 20 17 30 33 32 35 32 29 24
Southsound-DDA 2 2 1 3 0 0 0 2 0 1 0 1 3
Southsound-HCS 18 13 9 14 18 18 19 16 21 27 25 16 10
Southeast2-DDA 1 1 1 2 0 0 1 0 0 2 0 0 0
Southeast2-HCS 15 10 7 6 6 11 7 3 3 10 5 6 5
Southwest-DDA 3 0 1 0 1 1 0 2 3 2 0 0 0
Southwest-HCS 8 15 15 15 12 7 9 6 5 10 8 8 13
Spokane-DDA 0 0 2 0 1 2 3 2 2 2 0 2 2
Spokane-HCS 8 3 7 9 18 8 17 13 7 13 11 6 12
DDA 12 13 10 16 17 19 18 20 20 16 15 9 21
HCS 172 163 145 158 186 170 180 185 176 203 178 187 176
Page 5

Home Care Referral Registry
Activity Summary
addition to original count. reduction from original count.
7 Employment Summary Dec Jan- Feb Mar Apr May June Jul-14 Aug Sep Oct Nov Dec
East Central 7 19 14 13 5 15 12 13 18 14 16 20 12
King 6 3 2 4 4 13 8 11 18 14 7 14 15
NorthCentral n/a 0 0 0 0 0
Northeast 1 2 3 7 0 3 8 4 3 4 4 1 2
Northwest 32 31 22 32 41 29 23 34 31 22 22 28 35
Olympic 22 11 10 14 12 12 17 16 18 17 13 19 20
Pacific 21 26 27 29 39 31 29 35 17 31 30 30 24
Pierce 11 13 7 6 21 21 13 14 15 13 13 14 15
Snohomish 29 27 27 20 25 17 32 34 35 37 39 31 29
Southsound 20 15 10 17 18 18 19 18 21 28 25 17 13
Southeast2 16 11 8 8 6 11 8 3 3 12 5 6 5
Southwest 11 15 16 15 13 8 9 8 8 12 8 8 13
Spokane 8 3 9 9 19 10 20 15 9 15 11 8 14
Total employment 184 176 155 174 203 188 198 205 196 219 193 196 197active providersactive providersactive providersactive providersactive providersactive providersactive providersactive providersactive providersactive providersactive providers
11 New and reactivated IPs(unduplicated count)
# New and reactivated Dec
Jan-
14 Feb Mar Apr May June Jul-14 Aug Sep Oct Nov Dec
Service area
East Central 10 16 20 13 4 11 7 16 11 5 8 10 7
King 20 2 1 19 11 24 18 17 10 23 23 39 15
NorthCentral n/a n/a 8 32 6 5
Northeast 5 14 16 9 8 8 6 12 10 6 12 6 2
Northwest 4 15 4 8 15 6 13 14 10 8 9 8 7
Olympic 17 4 11 15 20 11 11 81 32 15 9 5 7
Pacific 20 37 32 18 21 27 23 25 21 36 22 20 22
Pierce 21 24 12 27 27 28 24 19 36 16 25 31 29
Snohomish 18 14 13 14 14 17 16 20 22 7 13 13 16
Southsound 8 14 18 31 7 20 12 28 18 19 24 16 16
Southeast2 6 12 10 12 27 16 18 19 9 11 18 21 21
Southwest 14 21 14 18 22 14 22 29 29 25 21 24 16
Spokane 18 16 22 13 15 7 13 16 17 12 20 15 22
Totals 161 189 173 197 191 189 183 296 225 191 236 214 185
11 Number of IPs activated or re-activated by Service Category and Service area
22 IPs New and reactivated Dec
Jan-
14 Feb Mar Apr May June Jul-14 Aug Sep Oct Nov Dec
Service Area/Category
East Central - both 2 1 0 0 0 2 0 0 3 1 4 9 3
East Central - DDA 1 0 2 2 2 2 2 2 2 0 2 0 1
East Central - HCS 9 15 18 18 3 9 8 8 7 4 2 1 3
King - both 14 1 0 0 8 11 12 12 7 21 17 28 8
King - DDA 1 1 0 0 1 2 7 7 0 5 0 1 0
King - HCS 6 3 1 1 4 11 9 9 4 2 6 10 7
NorthCentral - both n/a n/a 8 14 2 2
NorthCentral -DDA only n/a n/a 0 0 0 0
NorthCentral -HCS only n/a n/a 0 18 4 3
Northeast - both 2 4 6 6 4 2 2 2 5 2 7 1 1
Northeast-DDA 0 0 0 0 0 0 0 0 0 0 0 0 0
Northeast-HCS 3 11 10 10 4 6 4 4 6 4 5 5 1
Northwest - both 2 9 2 2 14 5 11 11 8 7 4 5 6
Northwest - DDA 0 0 1 1 1 1 1 1 0 1 1 0 0
Northwest-HCS 3 6 2 2 2 1 2 2 2 1 4 3 1
Olympic - both 8 1 1 1 3 1 1 1 4 0 0 1 0
Olympic-DDA 1 0 0 0 0 0 0 0 3 0 0 0 0
Olympic-HCS 9 3 10 10 17 10 10 10 26 15 9 4 7
Pacific - both 4 10 10 10 6 7 5 5 10 8 9 8 8
Pacific - DDA 0 1 1 1 0 0 0 0 0 1 0 0 0
Pacific - HCS 16 26 22 22 15 20 18 18 11 27 13 12 14
Pierce - both 19 13 10 10 18 25 21 21 29 10 20 29 21
Pierce - DDA 0 1 0 0 0 0 0 0 2 0 2 0 0
Pierce - HCS 2 11 2 2 11 3 3 3 5 6 3 2 8
Page 6

Home Care Referral Registry
Activity Summary
Snohomish - both 10 4 4 4 7 5 2 2 10 3 6 9 10
Snohomish - DDA 3 0 3 3 1 3 2 2 4 1 1 1 0
Snohomish - HCS 8 11 11 11 9 12 14 14 14 4 6 3 6
SouthSound- both 5 10 11 11 2 13 10 10 15 15 16 12 10
SouthSound - DDA 0 0 1 1 0 0 0 0 0 0 0 0 1
SouthSound - HCS 3 4 7 7 5 8 5 5 3 4 8 4 5
Southeast2 - both 0 2 1 1 5 10 6 6 3 1 3 1 4
Southeast2 - DDA 0 0 1 1 0 1 1 1 0 1 0 0 1
Southeast2 - HCS 6 10 9 9 22 6 11 11 6 10 15 20 16
Southwest - both 7 16 9 9 17 7 15 15 19 18 16 14 10
Southwest - DDA 0 1 0 0 0 0 1 1 0 0 0 0 0
Southwest - HCS 7 4 5 5 5 7 6 6 10 7 5 10 6
Spokane - both 11 6 13 13 11 4 8 8 12 5 10 8 8
Spokane - DDA 1 1 1 1 1 0 0 0 0 0 0 1 1
Spokane - HCS 7 10 9 9 4 3 5 5 5 7 10 6 13
Both 84 77 67 67 95 92 93 93 125 91 144 131 94
DDA 7 5 10 10 6 9 14 14 11 9 6 3 4
HCS 79 114 106 106 101 96 95 95 99 91 86 80 87
c10 Monthly percentage of referral requests resulting in a list of names
Dec
Jan-
14 Feb Mar Apr May June Jul-14 Aug Sep Oct Nov Dec
Match results 99% 99% 98% 99% 99% 99% 99% 99% 99% 100% 100% 100% 100%
c11 Number of CM hires by service area
No. of CM Hires Dec
Jan-
14 Feb Mar Apr May June Jul-14 Aug Sep Oct Nov Dec
Service area
East Central 2 2 1 0 0 3 2 4 2 3 3 1 2
King 0 0 0 0 0 0 0 0 0 0 0 0 1
NorthCentral 0 0 0 0 2 0
Northeast 1 1 3 6 0 2 4 1 5 0 2 1 1
Northwest 5 1 1 1 2 2 1 2 1 2 1 1 5
Olympic 2 0 1 1 1 1 2 2 2 2 2 3 0
Pacific 3 4 2 6 2 4 0 3 2 1 2 1 3
Pierce 2 2 1 1 2 3 0 3 1 0 2 5 1
Snohomish 6 3 2 4 2 7 6 8 4 6 7 6 7
Southsound 0 0 1 1 0 1 0 0 1 0 0 1 0
Southeast2 0 0 0 0 0 0 0 0 0 0 0 0 0
Southwest 0 1 3 3 3 0 2 2 1 0 1 0 1
Spokane 0 0 2 3 3 0 5 4 0 1 2 1 0
Totals 21 14 17 26 15 23 22 29 19 15 22 22 21
% Emp'd by cm search 11% 8% 11% 15% 7% 12% 11% 14% 10% 7% 11% 11% 11%
17 Count of "How You Heard about RR"
Referral Source Dec
Jan-
14 Feb Mar Apr May June Jul-14 Aug Sep Oct Nov Dec
Word of mouth/other 42 50 52 60 53 50 59 91 90 97 85 73 56
Web site 5 8 8 6 9 8 4 6 6 12 13 9 7
Case manager - AAA 32 40 37 30 29 27 36 40 35 29 36 34 33
Case manager- HCS 1 2 0 2 0 2 2 1 0 3 3 2 0
Case resource mngr - DDA 2 2 2 2 3 3 1 9 3 5 1 2 4
Union/Training partnership 1 2 1 0 0 0 0 0 1 4 0 1 1
Employment
Office/recruitment 1 10 12 15 20 23 14 28 28 16 15 6 12
Total Tracked 84 114 112 115 114 113 116 175 163 166 153 127 113
Other COUNTS:
Rate of unique referral requests that converted to employment by SA
% referral to employment Dec
Jan-
14 Feb Mar Apr May June Jul-14 Aug Sep Oct Nov Dec
Service area
East Central 37% 100% 93% 81% 36% 107% 75% 81% 82% 88% 73% 167% 52%
King 23% 12% 14% 13% 13% 52% 36% 50% 62% 54% 37% 50% 65%
Page 7

Home Care Referral Registry
Activity Summary
NorthCentral n/a n/a n/a n/a n/a n/a
Northeast 50% 100% 300% 78% 0% 100% 800% 400% 150% 200% 200% 50% 67%
Northwest 97% 78% 67% 97% 132% 121% 115% 170% 79% 51% 56% 85% 70%
Olympic 96% 79% 77% 117% 92% 67% 213% 200% 86% 89% 52% 83% 154%
Pacific 81% 84% 117% 81% 100% 135% 107% 130% 53% 91% 86% 97% 104%
Pierce 34% 42% 41% 16% 43% 55% 46% 50% 38% 33% 65% 47% 56%
Snohomish 112% 108% 93% 63% 93% 81% 139% 148% 113% 100% 103% 155% 78%
Southsound 65% 30% 26% 28% 30% 32% 48% 45% 36% 47% 50% 55% 25%
Southeast2 46% 33% 26% 29% 19% 44% 28% 10% 11% 60% 23% 27% 25%
Southwest 46% 42% 43% 48% 52% 25% 36% 32% 30% 31% 21% 36% 35%
Spokane 44% 14% 36% 32% 63% 48% 154% 115% 25% 43% 35% 32% 61%
Number of consumers served that converted to employment - Summary
Referrals to Employments Dec
Jan-
14 Feb Mar Apr May June Jul-14 Aug Sep Oct Nov Dec
Providers Employed 184 176 155 174 203 188 198 205 196 219 193 196 197
Number of Cons Served. 295 328 276 354 362 300 252 252 364 370 341 279 340
Conversion rate 62% 54% 56% 49% 56% 63% 79% 81% 54% 59% 57% 70% 58%
Page 8

Home Care Referral Registry
Activity Summary
Page 9

Home Care Referral Registry
Activity Summary
Page 10

Home Care Referral Registry
Activity Summary
Page 11

Home Care Referral Registry
Activity Summary
Page 12

Home Care Referral Registry
Activity Summary
Page 13

Home Care Referral Registry
Activity Summary
active providers
Page 14