home building compensation scheme report - home - sira€¦ · sydney nsw 2000 dear carmel, review...
TRANSCRIPT

Home Building Compensation Scheme report
30 June 2017
P:\SIRA\Corres\L231117_HBCF_Review_Jun17.docx
23 November 2017 Ms Carmel Donnelly Acting Chief Executive Officer State Insurance Regulatory Authority Department of Finance, Services and Innovation 2-24 Rawson Place Sydney NSW 2000
Dear Carmel,
Review of June 2017 HBCF Scheme Report
Taylor Fry Consulting Actuaries (Taylor Fry) has been requested by the State Insurance Regulatory Authority (SIRA) to undertake a review of the NSW Home Building Compensation Fund (HBCF) Scheme Report as at 30 June 2017 and the underlying data contained within the report.
We have been provided with a copy of the draft and final reports, along with a claims database containing details of all individual scheme claims and aggregated information on the types and values of projects covered.
While we have not reviewed the accuracy of the data provided, we have reviewed it for reasonableness and used it to replicate the tables within the report. We also reconciled the tables and graphs with those used in the March 2017 report.
We found the information prepared by SIRA and the commentary contained within both the draft and final reports to be a fair and accurate representation of the HBCF.
I trust that this letter covers the information you require. Please do not hesitate to contact me if you have any questions or would like any further details to be provided.
Yours sincerely, Daniel Smith Fellow of the Institute of Actuaries of Australia
Contents Introduction.......................................................................................................................................................... 4
Preamble .......................................................................................................................................................... 4
HBC Scheme data ........................................................................................................................................ 4
Caution in interpreting the information .............................................................................................. 5
Part 1 Information about licensed builders ............................................................................................. 6
1. Eligibility information .............................................................................................................................. 6
2. Securities and indemnities information ......................................................................................... 7
3. Builder project certificate information ........................................................................................... 8
4. Builders’ premium information .........................................................................................................12
5. Builder claims information ................................................................................................................. 16
Part 2 Owner-builder information .............................................................................................................21
1. Owner-builder project certificate information............................................................................21
2. Owner-builder premium information ............................................................................................22
3. Owner-builder claims information ................................................................................................ 23
Home Building Compensation Scheme report – 30 June 2017 3
Introduction
Preamble
The Home Building Compensation (HBC) Scheme, formerly known as the home warranty insurance scheme, provides a last-resort safety net for consumers under the Home Building Act 1989, where builders fail to complete residential building work or rectify defects.
From 1 September 2015, the State Insurance Regulatory Authority (SIRA) assumed the regulatory functions of HBC, which were previously undertaken by NSW Fair Trading.
In New South Wales, HBC insurance may only be offered by licensed insurers approved by the Minister under the Act. icare (Insurance and Care NSW) hbcf became the sole provider of insurance under the HBC Scheme on 1 July 2010, replacing the former private insurers from that date. The approved insurers from the private sector all ceased writing business on or before 30 June 2010. However, all approved insurers will continue to manage and settle claims on policies written up until that date.
HBC Scheme data
One of the roles of SIRA, as provided under the market practice guidelines, is to collect data in relation to the HBC Scheme on policies, premiums and claims from insurers in order to be able to monitor the operation of the scheme. The following information on the operation of the scheme applies only to the version of the scheme in operation since 1 July 2002, in which the protection offered applies only in the event of the death, disappearance or insolvency of a builder. For policies issued from 19 May 2009, cover extends to situations where a builder’s licence is suspended for a failure to comply with a mandatory monetary order of the NSW Civil and Administrative Tribunal or a court in favour of the homeowner.
This publication summarises the data that has been provided quarterly since June 2006 for the insurance period 1 July 2002 to 30 June 2017. The information provided has been aggregated across insurers. Data provided by individual insurers is commercially confidential and has not been disclosed.
Further information on the operation of, or the current reforms by the NSW Government to the scheme, is available through the following links:
http://www.sira.nsw.gov.au/home-building-compensation
https://www.hbcf.nsw.gov.au/portal/server.pt/community/homeowners/351
http://www.fairtrading.nsw.gov.au/ftw/Tradespeople/Home_warranty_insurance/Home_Warranty_Insurance_Scheme_Board.page?
4 State Insurance Regulatory Authority
Caution in interpreting the information
Home building compensation is a ‘long tail’ class of insurance business, which means:
• there may be significant delay between the date a project certificate is issued and the commencement of the project
• the duration of building projects may range from a few weeks to several years • coverage remains in place for six years after project completion, and • it may take some time for homeowners to identify a loss, lodge a claim with an
insurer and for the insurer to assess the claim and arrange rectification.
Claims experience within the HBC Scheme can vary greatly from year to year depending on economic conditions in both the home building market and in the community generally. Since the adoption of the single insurer model from 1 July 2010, insurance market cycles are only likely to impact the scheme to the extent that the insurer seeks to obtain reinsurance cover from the commercial insurance market.
For the first few years after the current HBC Scheme commenced in 2002, the NSW economy performed reasonably well, and conditions were generally favourable for home builders. As over 90 per cent of the insurance claims arise from the insolvency of the builder, the downturn in the economy in 2008 drove a significant increase in claims on the scheme as even some larger builders failed. Poor business decisions are also more likely to convert into business failure if additional financing is unexpectedly required or existing loans need to be renegotiated or rolled over when lending or investing conditions are tight. Any serious assessment of the scheme should place substantial weight not only on the long tail nature of the scheme, but also that different economic circumstances can yield significantly different claims results.
As the cover provided by HBC Scheme insurers extends over at least six years from completion of work, the downturn in the building industry between 2008 and 2012 has given rise to claims because major defects now emerging may involve builders that have become insolvent since then. As a consequence, the claim experience of even early underwriting years has continued to deteriorate. During the 12 months to 30 June 2017, there was an increase of $93 million, or 14 per cent, in the overall estimated net incurred claims cost reported by the scheme insurers.
Home Building Compensation Scheme report – 30 June 2017 5
Part 1 Information about licensed builders
1. Eligibility information
‘Eligibility’ is the term used to describe the entitlement that a builder has to apply for a certificate of insurance for home building projects, and the conditions under which the certificate of insurance may be granted. From 1 July 2010, eligibility application may be made via an insurance broker to one of icare hbcf’s insurance agents.
Builder eligibilities
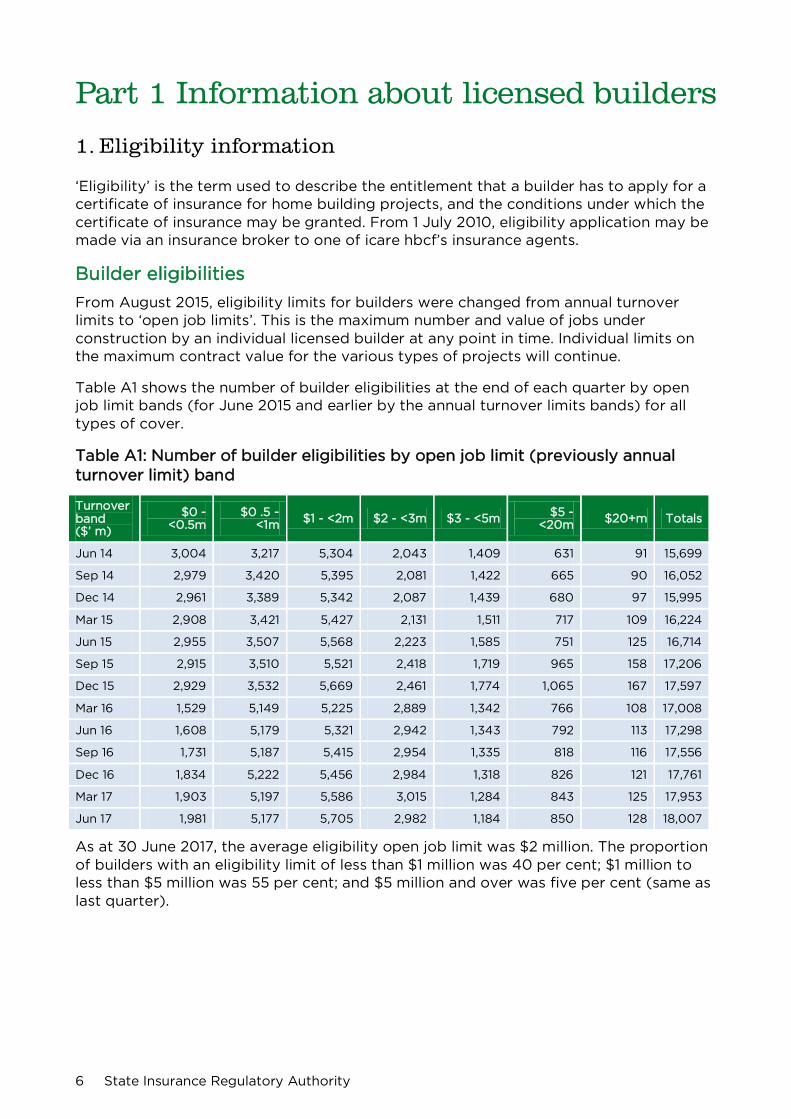
From August 2015, eligibility limits for builders were changed from annual turnover limits to ‘open job limits’. This is the maximum number and value of jobs under construction by an individual licensed builder at any point in time. Individual limits on the maximum contract value for the various types of projects will continue.
Table A1 shows the number of builder eligibilities at the end of each quarter by open job limit bands (for June 2015 and earlier by the annual turnover limits bands) for all types of cover.
Table A1: Number of builder eligibilities by open job limit (previously annual turnover limit) band
Turnover band ($’ m)
$0 - <0.5m
$0 .5 - <1m $1 - <2m $2 - <3m $3 - <5m $5 -
<20m $20+m Totals
Jun 14 3,004 3,217 5,304 2,043 1,409 631 91 15,699
Sep 14 2,979 3,420 5,395 2,081 1,422 665 90 16,052
Dec 14 2,961 3,389 5,342 2,087 1,439 680 97 15,995
Mar 15 2,908 3,421 5,427 2,131 1,511 717 109 16,224
Jun 15 2,955 3,507 5,568 2,223 1,585 751 125 16,714
Sep 15 2,915 3,510 5,521 2,418 1,719 965 158 17,206
Dec 15 2,929 3,532 5,669 2,461 1,774 1,065 167 17,597
Mar 16 1,529 5,149 5,225 2,889 1,342 766 108 17,008
Jun 16 1,608 5,179 5,321 2,942 1,343 792 113 17,298
Sep 16 1,731 5,187 5,415 2,954 1,335 818 116 17,556
Dec 16 1,834 5,222 5,456 2,984 1,318 826 121 17,761
Mar 17 1,903 5,197 5,586 3,015 1,284 843 125 17,953
Jun 17 1,981 5,177 5,705 2,982 1,184 850 128 18,007
As at 30 June 2017, the average eligibility open job limit was $2 million. The proportion of builders with an eligibility limit of less than $1 million was 40 per cent; $1 million to less than $5 million was 55 per cent; and $5 million and over was five per cent (same as last quarter).
6 State Insurance Regulatory Authority
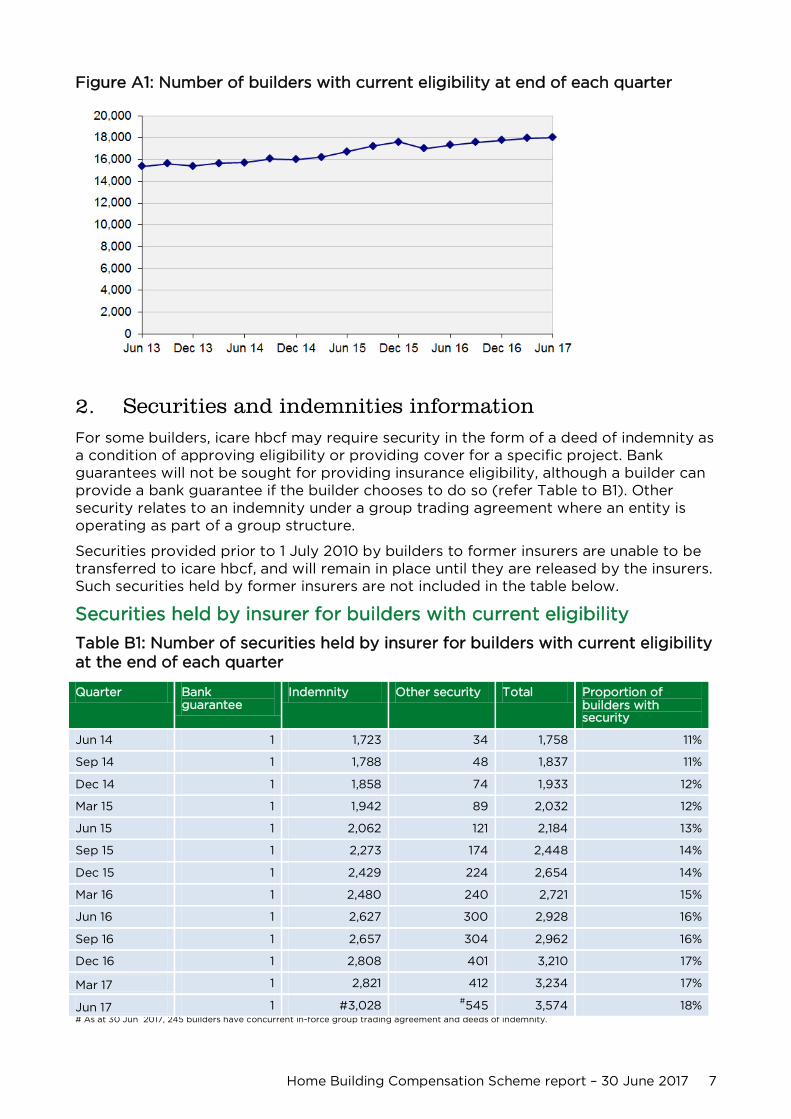
Figure A1: Number of builders with current eligibility at end of each quarter
2. Securities and indemnities information For some builders, icare hbcf may require security in the form of a deed of indemnity as a condition of approving eligibility or providing cover for a specific project. Bank guarantees will not be sought for providing insurance eligibility, although a builder can provide a bank guarantee if the builder chooses to do so (refer Table to B1). Other security relates to an indemnity under a group trading agreement where an entity is operating as part of a group structure.
Securities provided prior to 1 July 2010 by builders to former insurers are unable to be transferred to icare hbcf, and will remain in place until they are released by the insurers. Such securities held by former insurers are not included in the table below.
Securities held by insurer for builders with current eligibility
Table B1: Number of securities held by insurer for builders with current eligibility at the end of each quarter
Quarter Bank guarantee
Indemnity Other security Total Proportion of builders with security
Jun 14 1 1,723 34 1,758 11%
Sep 14 1 1,788 48 1,837 11%
Dec 14 1 1,858 74 1,933 12%
Mar 15 1 1,942 89 2,032 12%
Jun 15 1 2,062 121 2,184 13%
Sep 15 1 2,273 174 2,448 14%
Dec 15 1 2,429 224 2,654 14%
Mar 16 1 2,480 240 2,721 15%
Jun 16 1 2,627 300 2,928 16%
Sep 16 1 2,657 304 2,962 16%
Dec 16 1 2,808 401 3,210 17%
Mar 17 1 2,821 412 3,234 17%
Jun 17 1 #3,028 #545 3,574 18% # As at 30 Jun 2017, 245 builders have concurrent in-force group trading agreement and deeds of indemnity.
Home Building Compensation Scheme report – 30 June 2017 7
3. Builder project certificate information
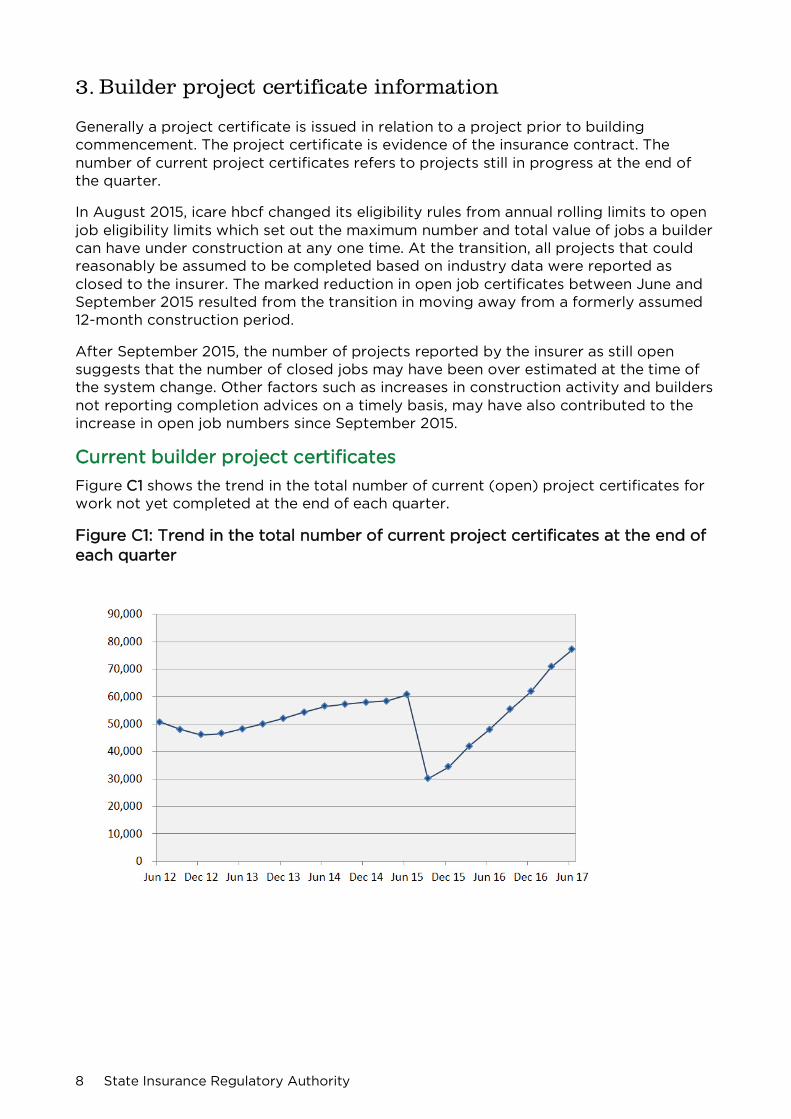
Generally a project certificate is issued in relation to a project prior to building commencement. The project certificate is evidence of the insurance contract. The number of current project certificates refers to projects still in progress at the end of the quarter.
In August 2015, icare hbcf changed its eligibility rules from annual rolling limits to open job eligibility limits which set out the maximum number and total value of jobs a builder can have under construction at any one time. At the transition, all projects that could reasonably be assumed to be completed based on industry data were reported as closed to the insurer. The marked reduction in open job certificates between June and September 2015 resulted from the transition in moving away from a formerly assumed 12-month construction period.
After September 2015, the number of projects reported by the insurer as still open suggests that the number of closed jobs may have been over estimated at the time of the system change. Other factors such as increases in construction activity and builders not reporting completion advices on a timely basis, may have also contributed to the increase in open job numbers since September 2015.
Current builder project certificates
Figure C1 shows the trend in the total number of current (open) project certificates for work not yet completed at the end of each quarter.
Figure C1: Trend in the total number of current project certificates at the end of each quarter
8 State Insurance Regulatory Authority

New project certificates issued to builders
Tables C1, C2.1 and figure C2.1 show the number and value of new project certificates issued during the quarter, reduced by the number (or value) of project certificates cancelled in the quarter. A cancellation occurs when a project certificate is terminated because the project did not commence. If a project certificate applies to more than one type of cover, then it is classified under the type of cover that represents the greatest value under the contract.
Table C1: Number of project certificates issued by type of cover
Quarter /Type of cover
New single dwelling construction
New multi dwelling
(3 storeys or less) *
Alterations /Additions #
Swimming Pools
Renovations (including kitchens and bathrooms) ^
Other Totals
Jun 14 5,507 2,020 3,670 946 3,001 10 15,154
Sep 14 5,457 1,345 4,005 1,189 3,016 8 15,020
Dec 14 5,008 1,906 3,239 1,125 2,510 9 13,797
Mar 15 5,151 1,786 3,773 1,118 2,496 8 14,332
Jun 15 6,371 2,260 4,342 1,214 3,334 7 17,528
Sep 15 5,757 2,320 5,042 1,423 3,830 22 18,394
Dec 15 5,196 2,476 3,886 1,242 3,299 36 16,135
Mar 16 5,454 2,131 4,210 1,162 3,572 18 16,547
Jun 16 6,077 2,218 4,812 1,418 3,798 11 18,334
Sep 16 5,976 2,463 5,059 1,430 3,707 13 18,648
Dec 16 5,693 2,862 4,076 1,299 3,435 8 17,373
Mar 17 6,267 3,247 4,536 1,349 3,863 9 19,271
Jun 17 6,470 2,241 4,736 1,400 4,343 17 19,207 * A project certificate is issued for each unit in a multi-unit development.
# Alterations and additions - structural (i.e. the majority of the work is structural), including work on existing multi-units.
^ Renovations - non-structural (i.e. the majority of the contract is non-structural), including e.g. kitchen/bathroom renovations and trade work,
including work on existing multi-units
The total number of certificates issued (19,207) fell marginally in the June quarter but up 5 per cent compared with the same quarter last year. In June 2017, the number of certificates issued for new multi dwellings has fallen for the first time since March 2016.
The proportions of project certificates issued during the last 12 months are: new single and new multi dwellings (47 per cent), alterations and renovations (45 per cent) and swimming pools/others (8 per cent).
Home Building Compensation Scheme report – 30 June 2017 9
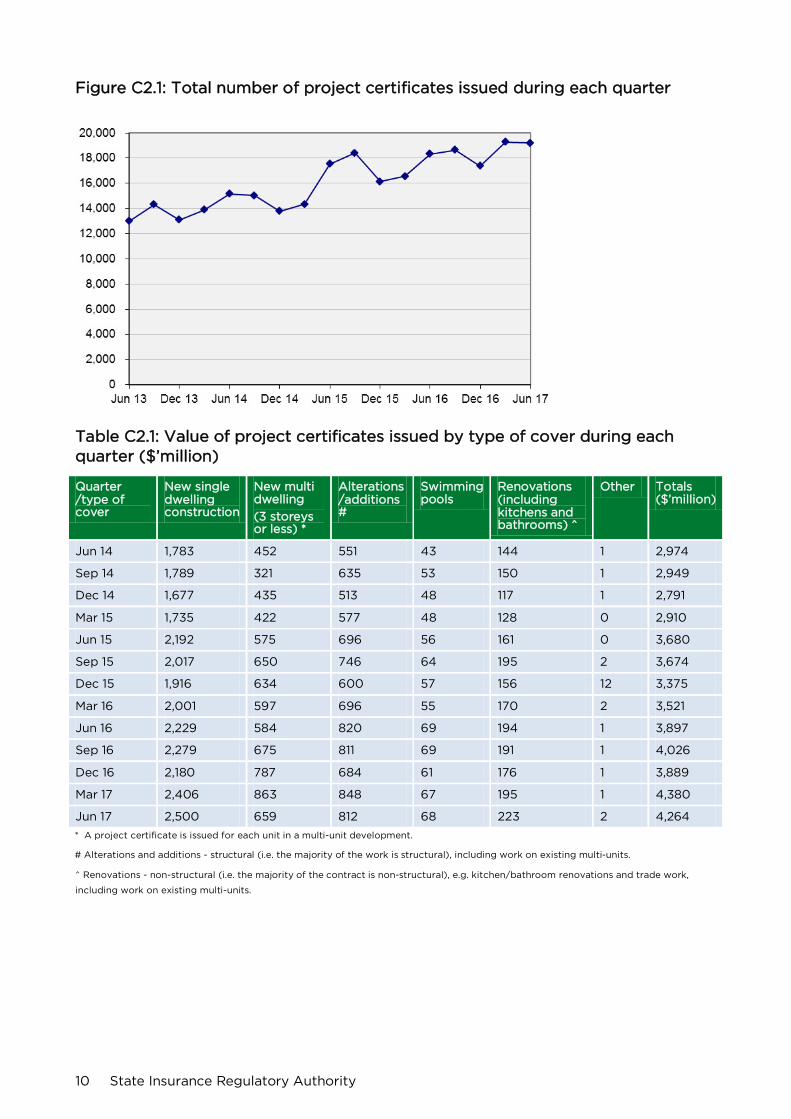
Figure C2.1: Total number of project certificates issued during each quarter
Table C2.1: Value of project certificates issued by type of cover during each quarter ($’million)
Quarter /type of cover
New single dwelling construction
New multi dwelling
(3 storeys or less) *
Alterations /additions #
Swimming pools
Renovations (including kitchens and bathrooms) ^
Other Totals ($’million)
Jun 14 1,783 452 551 43 144 1 2,974
Sep 14 1,789 321 635 53 150 1 2,949
Dec 14 1,677 435 513 48 117 1 2,791
Mar 15 1,735 422 577 48 128 0 2,910
Jun 15 2,192 575 696 56 161 0 3,680
Sep 15 2,017 650 746 64 195 2 3,674
Dec 15 1,916 634 600 57 156 12 3,375
Mar 16 2,001 597 696 55 170 2 3,521
Jun 16 2,229 584 820 69 194 1 3,897
Sep 16 2,279 675 811 69 191 1 4,026
Dec 16 2,180 787 684 61 176 1 3,889
Mar 17 2,406 863 848 67 195 1 4,380
Jun 17 2,500 659 812 68 223 2 4,264
* A project certificate is issued for each unit in a multi-unit development.
# Alterations and additions - structural (i.e. the majority of the work is structural), including work on existing multi-units.
^ Renovations - non-structural (i.e. the majority of the contract is non-structural), e.g. kitchen/bathroom renovations and trade work,
including work on existing multi-units.
10 State Insurance Regulatory Authority
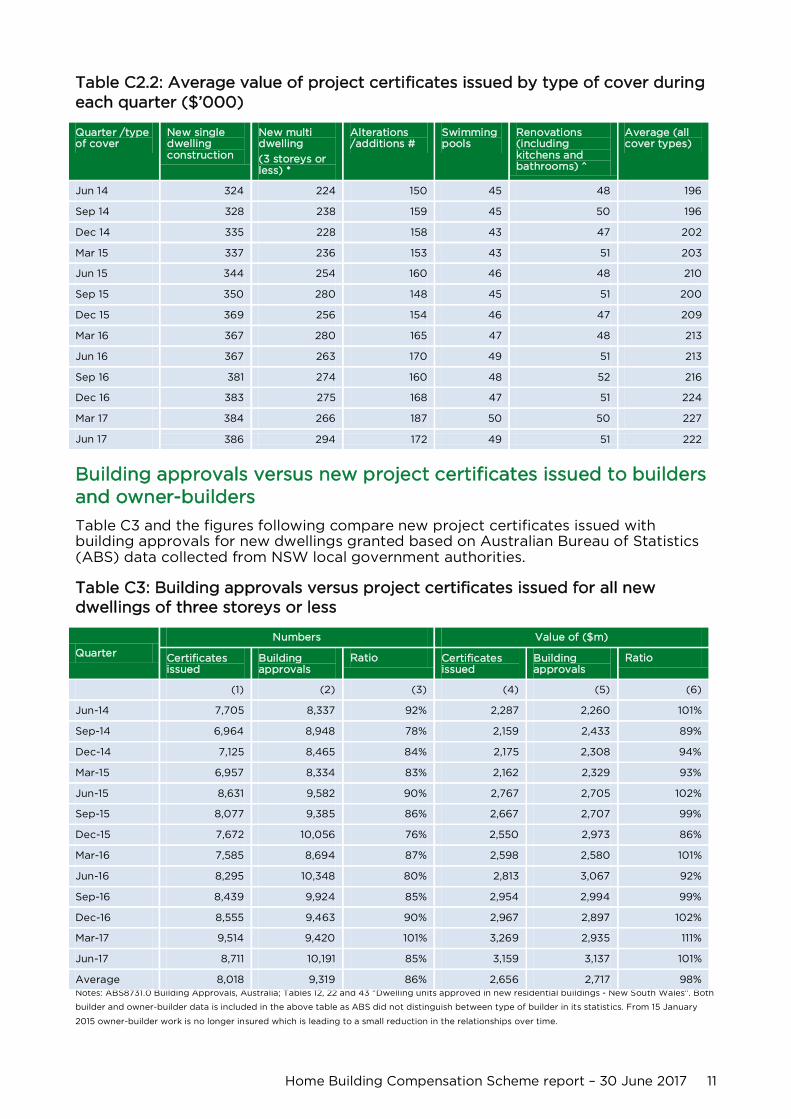
Table C2.2: Average value of project certificates issued by type of cover during each quarter ($’000)
Quarter /type of cover
New single dwelling construction
New multi dwelling
(3 storeys or less) *
Alterations /additions #
Swimming pools
Renovations (including kitchens and bathrooms) ^
Average (all cover types)
Jun 14 324 224 150 45 48 196
Sep 14 328 238 159 45 50 196
Dec 14 335 228 158 43 47 202
Mar 15 337 236 153 43 51 203
Jun 15 344 254 160 46 48 210
Sep 15 350 280 148 45 51 200
Dec 15 369 256 154 46 47 209
Mar 16 367 280 165 47 48 213
Jun 16 367 263 170 49 51 213
Sep 16 381 274 160 48 52 216
Dec 16 383 275 168 47 51 224
Mar 17 384 266 187 50 50 227
Jun 17 386 294 172 49 51 222
Building approvals versus new project certificates issued to builders and owner-builders
Table C3 and the figures following compare new project certificates issued with building approvals for new dwellings granted based on Australian Bureau of Statistics (ABS) data collected from NSW local government authorities.
Table C3: Building approvals versus project certificates issued for all new dwellings of three storeys or less
Quarter
Numbers Value of ($m)
Certificates issued
Building approvals
Ratio Certificates issued
Building approvals
Ratio
(1) (2) (3) (4) (5) (6)
Jun-14 7,705 8,337 92% 2,287 2,260 101%
Sep-14 6,964 8,948 78% 2,159 2,433 89%
Dec-14 7,125 8,465 84% 2,175 2,308 94%
Mar-15 6,957 8,334 83% 2,162 2,329 93%
Jun-15 8,631 9,582 90% 2,767 2,705 102%
Sep-15 8,077 9,385 86% 2,667 2,707 99%
Dec-15 7,672 10,056 76% 2,550 2,973 86%
Mar-16 7,585 8,694 87% 2,598 2,580 101%
Jun-16 8,295 10,348 80% 2,813 3,067 92%
Sep-16 8,439 9,924 85% 2,954 2,994 99%
Dec-16 8,555 9,463 90% 2,967 2,897 102%
Mar-17 9,514 9,420 101% 3,269 2,935 111%
Jun-17 8,711 10,191 85% 3,159 3,137 101%
Average 8,018 9,319 86% 2,656 2,717 98% Notes: ABS8731.0 Building Approvals, Australia; Tables 12, 22 and 43 "Dwelling units approved in new residential buildings - New South Wales". Both
builder and owner-builder data is included in the above table as ABS did not distinguish between type of builder in its statistics. From 15 January
2015 owner-builder work is no longer insured which is leading to a small reduction in the relationships over time.
Home Building Compensation Scheme report – 30 June 2017 11
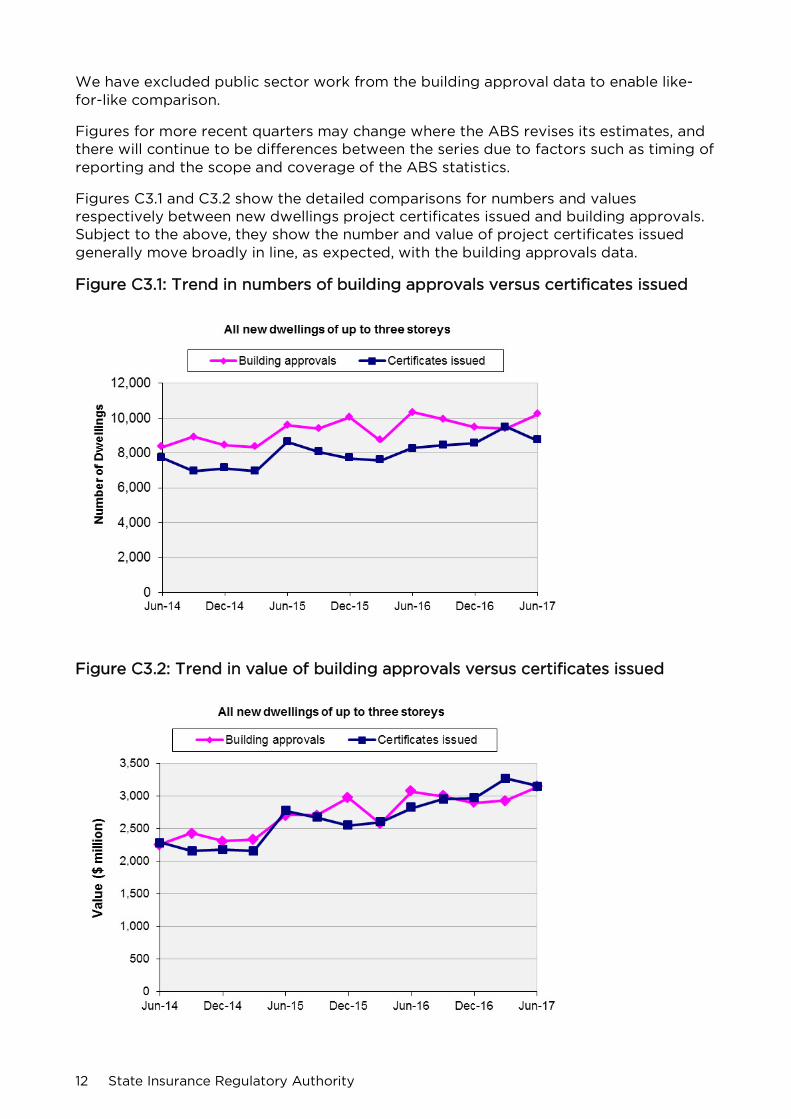
We have excluded public sector work from the building approval data to enable like-for-like comparison.
Figures for more recent quarters may change where the ABS revises its estimates, and there will continue to be differences between the series due to factors such as timing of reporting and the scope and coverage of the ABS statistics.
Figures C3.1 and C3.2 show the detailed comparisons for numbers and values respectively between new dwellings project certificates issued and building approvals. Subject to the above, they show the number and value of project certificates issued generally move broadly in line, as expected, with the building approvals data.
Figure C3.1: Trend in numbers of building approvals versus certificates issued
Figure C3.2: Trend in value of building approvals versus certificates issued
12 State Insurance Regulatory Authority

4. Builders’ premium information
Insurers provide information to SIRA on the premium charged for project certificates issued to builders during the quarter. For the reports below, premium is shown on two bases: including charges and excluding charges. ‘Charges’ refer to all commissions, government and other charges (i.e. GST, stamp duty, government levies and credit card surcharges) as reported by insurer to SIRA.
Premium including charges is intended to represent the amount paid by the builder including statutory charges such as GST and stamp duty. However, it excludes any fees charged by brokers or intermediaries in addition to the insurer’s premium. Any margin added by the builder in on-charging the premium to consumers is also not captured in the insurers’ data and is therefore not reported in the figures below. Premium excluding charges is the amount retained by the insurer to pay claims and the insurer’s expenses.
Effective from 3 April 2017, icare hbcf has: • introduced new base premium rates and builder risk-based pricing • ceased paying commissions to broker distributors who have since adopted a fee-
for-service model.
Builders’ total premiums by project type
Table D1.1: Written premium for project certificates issued, including charges ($’000)
Quarter /Type of cover
New single dwelling construction
New multi dwelling
(3 storeys or less) *
Alterations /Additions#
Swimming Pools
Renovations (including kitchens and bathrooms) ^
Other Totals ($’000)
Jun 14 11,343 4,704 3,938 429 931 3 21,348
Sep 14 11,566 3,318 4,515 531 938 5 20,873
Dec 14 10,798 4,604 3,686 472 743 6 20,309
Mar 15 11,050 4,287 4,120 477 805 3 20,742
Jun 15 14,033 5,897 5,016 557 973 2 26,478
Sep 15 13,080 6,030 5,278 669 1,174 16 26,247
Dec 15 12,352 6,463 4,238 575 954 132 24,714
Mar 16 12,709 5,985 4,926 556 1,046 14 25,236
Jun 16 14,368 5,919 5,686 699 1,191 11 27,874
Sep 16 14,805 6,873 5,715 701 1,152 7 29,253
Dec 16 14,337 8,108 4,833 621 1,064 4 28,967
Mar 17 15,650 8,838 5,875 674 1,162 5 32,204
Jun 17 15,810 10,019 5,768 540 1,264 6 33,407
Home Building Compensation Scheme report – 30 June 2017 13
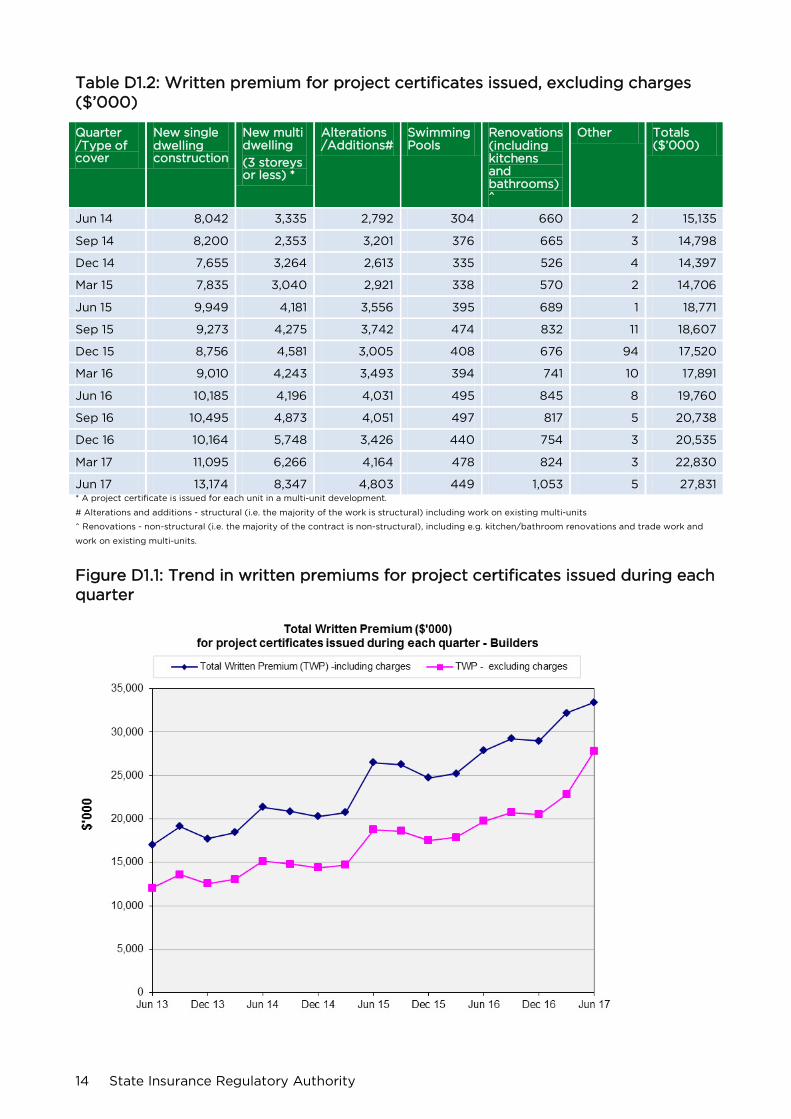
Table D1.2: Written premium for project certificates issued, excluding charges ($’000)
Quarter /Type of cover
New single dwelling construction
New multi dwelling
(3 storeys or less) *
Alterations /Additions#
Swimming Pools
Renovations (including kitchens and bathrooms) ^
Other Totals ($’000)
Jun 14 8,042 3,335 2,792 304 660 2 15,135
Sep 14 8,200 2,353 3,201 376 665 3 14,798
Dec 14 7,655 3,264 2,613 335 526 4 14,397
Mar 15 7,835 3,040 2,921 338 570 2 14,706
Jun 15 9,949 4,181 3,556 395 689 1 18,771
Sep 15 9,273 4,275 3,742 474 832 11 18,607
Dec 15 8,756 4,581 3,005 408 676 94 17,520
Mar 16 9,010 4,243 3,493 394 741 10 17,891
Jun 16 10,185 4,196 4,031 495 845 8 19,760
Sep 16 10,495 4,873 4,051 497 817 5 20,738
Dec 16 10,164 5,748 3,426 440 754 3 20,535
Mar 17 11,095 6,266 4,164 478 824 3 22,830
Jun 17 13,174 8,347 4,803 449 1,053 5 27,831 * A project certificate is issued for each unit in a multi-unit development.
# Alterations and additions - structural (i.e. the majority of the work is structural) including work on existing multi-units
^ Renovations - non-structural (i.e. the majority of the contract is non-structural), including e.g. kitchen/bathroom renovations and trade work and
work on existing multi-units.
Figure D1.1: Trend in written premiums for project certificates issued during each quarter
14 State Insurance Regulatory Authority
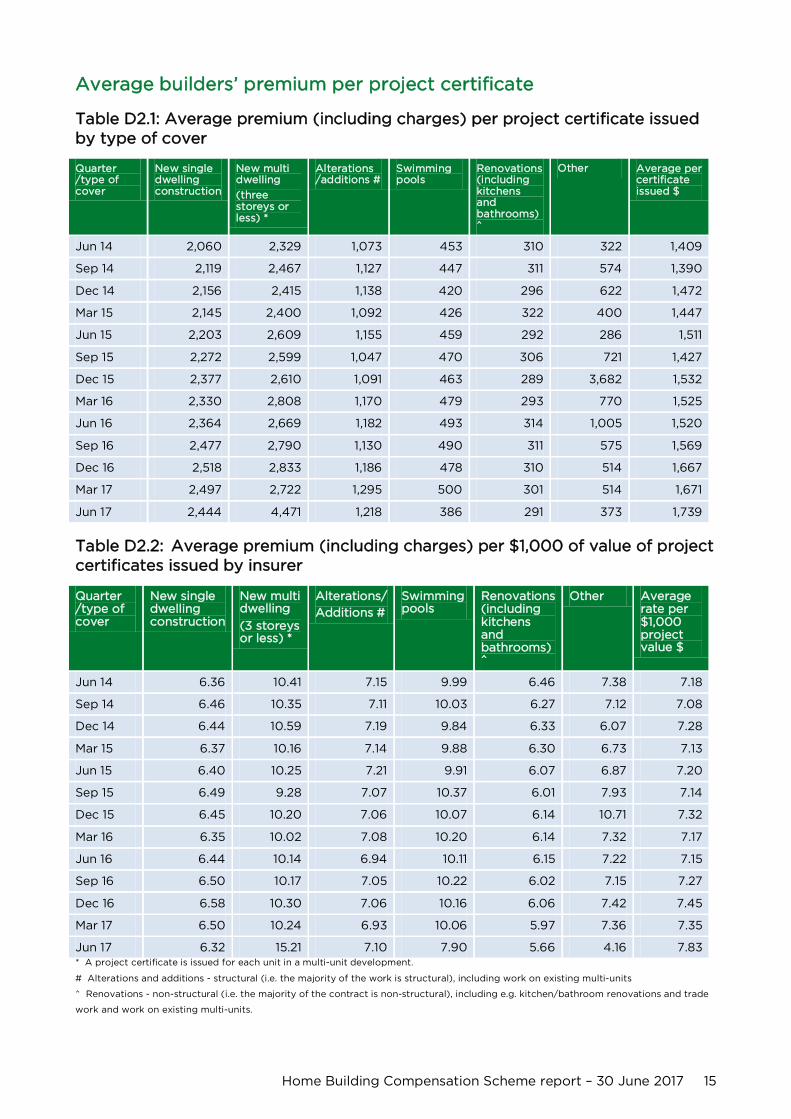
Average builders’ premium per project certificate
Table D2.1: Average premium (including charges) per project certificate issued by type of cover
Quarter /type of cover
New single dwelling construction
New multi dwelling
(three storeys or less) *
Alterations /additions #
Swimming pools
Renovations (including kitchens and bathrooms) ^
Other Average per certificate issued $
Jun 14 2,060 2,329 1,073 453 310 322 1,409
Sep 14 2,119 2,467 1,127 447 311 574 1,390
Dec 14 2,156 2,415 1,138 420 296 622 1,472
Mar 15 2,145 2,400 1,092 426 322 400 1,447
Jun 15 2,203 2,609 1,155 459 292 286 1,511
Sep 15 2,272 2,599 1,047 470 306 721 1,427
Dec 15 2,377 2,610 1,091 463 289 3,682 1,532
Mar 16 2,330 2,808 1,170 479 293 770 1,525
Jun 16 2,364 2,669 1,182 493 314 1,005 1,520
Sep 16 2,477 2,790 1,130 490 311 575 1,569
Dec 16 2,518 2,833 1,186 478 310 514 1,667
Mar 17 2,497 2,722 1,295 500 301 514 1,671
Jun 17 2,444 4,471 1,218 386 291 373 1,739
Table D2.2: Average premium (including charges) per $1,000 of value of project certificates issued by insurer
Quarter /type of cover
New single dwelling construction
New multi dwelling
(3 storeys or less) *
Alterations/
Additions #
Swimming pools
Renovations (including kitchens and bathrooms) ^
Other Average rate per $1,000 project value $
Jun 14 6.36 10.41 7.15 9.99 6.46 7.38 7.18
Sep 14 6.46 10.35 7.11 10.03 6.27 7.12 7.08
Dec 14 6.44 10.59 7.19 9.84 6.33 6.07 7.28
Mar 15 6.37 10.16 7.14 9.88 6.30 6.73 7.13
Jun 15 6.40 10.25 7.21 9.91 6.07 6.87 7.20
Sep 15 6.49 9.28 7.07 10.37 6.01 7.93 7.14
Dec 15 6.45 10.20 7.06 10.07 6.14 10.71 7.32
Mar 16 6.35 10.02 7.08 10.20 6.14 7.32 7.17
Jun 16 6.44 10.14 6.94 10.11 6.15 7.22 7.15
Sep 16 6.50 10.17 7.05 10.22 6.02 7.15 7.27
Dec 16 6.58 10.30 7.06 10.16 6.06 7.42 7.45
Mar 17 6.50 10.24 6.93 10.06 5.97 7.36 7.35
Jun 17 6.32 15.21 7.10 7.90 5.66 4.16 7.83 * A project certificate is issued for each unit in a multi-unit development.
# Alterations and additions - structural (i.e. the majority of the work is structural), including work on existing multi-units
^ Renovations - non-structural (i.e. the majority of the contract is non-structural), including e.g. kitchen/bathroom renovations and trade
work and work on existing multi-units.
Home Building Compensation Scheme report – 30 June 2017 15
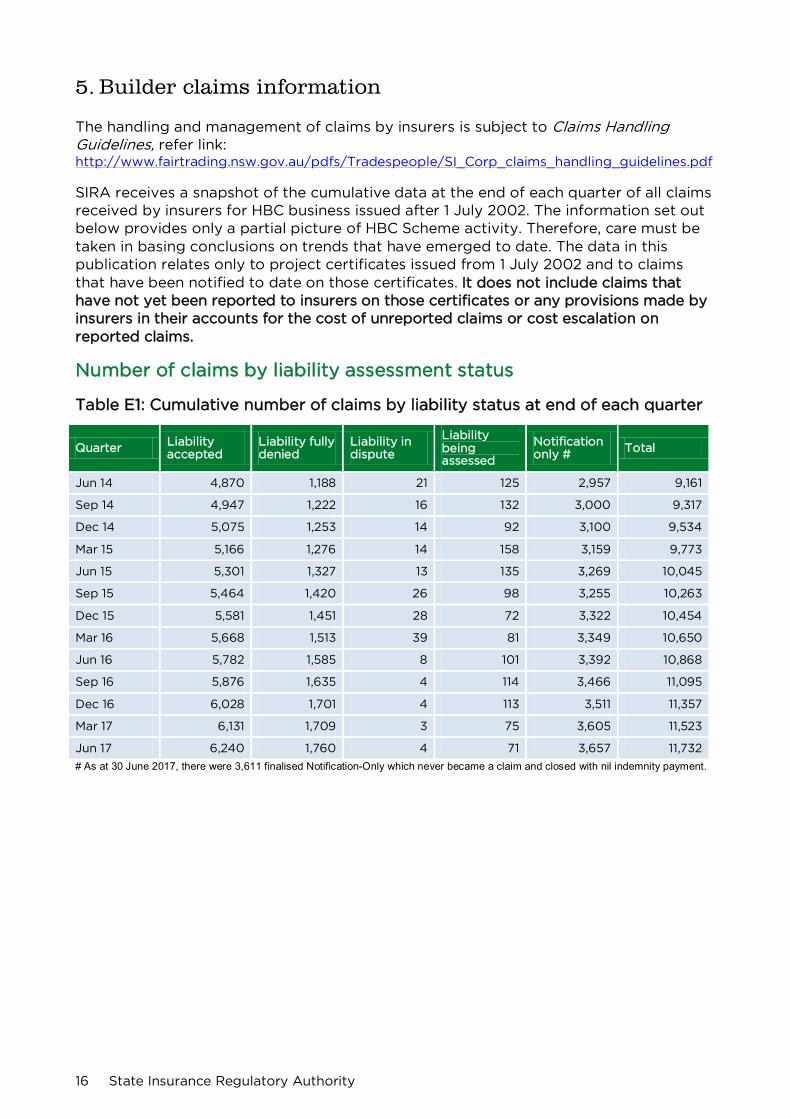
5. Builder claims information
The handling and management of claims by insurers is subject to Claims Handling Guidelines, refer link: http://www.fairtrading.nsw.gov.au/pdfs/Tradespeople/SI_Corp_claims_handling_guidelines.pdf
SIRA receives a snapshot of the cumulative data at the end of each quarter of all claims received by insurers for HBC business issued after 1 July 2002. The information set out below provides only a partial picture of HBC Scheme activity. Therefore, care must be taken in basing conclusions on trends that have emerged to date. The data in this publication relates only to project certificates issued from 1 July 2002 and to claims that have been notified to date on those certificates. It does not include claims that have not yet been reported to insurers on those certificates or any provisions made by insurers in their accounts for the cost of unreported claims or cost escalation on reported claims.
Number of claims by liability assessment status
Table E1: Cumulative number of claims by liability status at end of each quarter
Quarter Liability accepted
Liability fully denied
Liability in dispute
Liability being assessed
Notification only # Total
Jun 14 4,870 1,188 21 125 2,957 9,161
Sep 14 4,947 1,222 16 132 3,000 9,317
Dec 14 5,075 1,253 14 92 3,100 9,534
Mar 15 5,166 1,276 14 158 3,159 9,773
Jun 15 5,301 1,327 13 135 3,269 10,045
Sep 15 5,464 1,420 26 98 3,255 10,263
Dec 15 5,581 1,451 28 72 3,322 10,454
Mar 16 5,668 1,513 39 81 3,349 10,650
Jun 16 5,782 1,585 8 101 3,392 10,868
Sep 16 5,876 1,635 4 114 3,466 11,095
Dec 16 6,028 1,701 4 113 3,511 11,357
Mar 17 6,131 1,709 3 75 3,605 11,523
Jun 17 6,240 1,760 4 71 3,657 11,732
# As at 30 June 2017, there were 3,611 finalised Notification-Only which never became a claim and closed with nil indemnity payment.
16 State Insurance Regulatory Authority
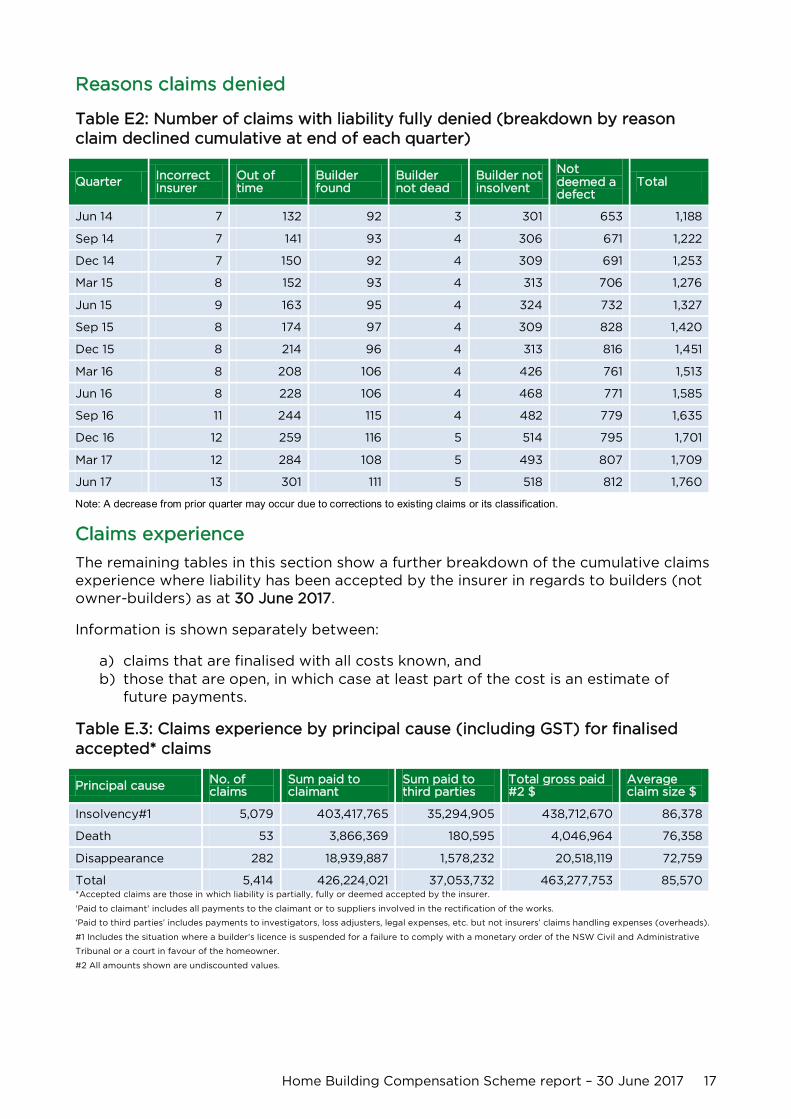
Reasons claims denied
Table E2: Number of claims with liability fully denied (breakdown by reason claim declined cumulative at end of each quarter)
Quarter Incorrect Insurer
Out of time
Builder found
Builder not dead
Builder not insolvent
Not deemed a defect
Total
Jun 14 7 132 92 3 301 653 1,188
Sep 14 7 141 93 4 306 671 1,222
Dec 14 7 150 92 4 309 691 1,253
Mar 15 8 152 93 4 313 706 1,276
Jun 15 9 163 95 4 324 732 1,327
Sep 15 8 174 97 4 309 828 1,420
Dec 15 8 214 96 4 313 816 1,451
Mar 16 8 208 106 4 426 761 1,513
Jun 16 8 228 106 4 468 771 1,585
Sep 16 11 244 115 4 482 779 1,635
Dec 16 12 259 116 5 514 795 1,701
Mar 17 12 284 108 5 493 807 1,709
Jun 17 13 301 111 5 518 812 1,760
Note: A decrease from prior quarter may occur due to corrections to existing claims or its classification.
Claims experience
The remaining tables in this section show a further breakdown of the cumulative claims experience where liability has been accepted by the insurer in regards to builders (not owner-builders) as at 30 June 2017.
Information is shown separately between:
a) claims that are finalised with all costs known, and b) those that are open, in which case at least part of the cost is an estimate of
future payments.
Table E.3: Claims experience by principal cause (including GST) for finalised accepted* claims
Principal cause No. of claims
Sum paid to claimant
Sum paid to third parties
Total gross paid #2 $
Average claim size $
Insolvency#1 5,079 403,417,765 35,294,905 438,712,670 86,378
Death 53 3,866,369 180,595 4,046,964 76,358
Disappearance 282 18,939,887 1,578,232 20,518,119 72,759
Total 5,414 426,224,021 37,053,732 463,277,753 85,570 *Accepted claims are those in which liability is partially, fully or deemed accepted by the insurer.
‘Paid to claimant’ includes all payments to the claimant or to suppliers involved in the rectification of the works.
‘Paid to third parties’ includes payments to investigators, loss adjusters, legal expenses, etc. but not insurers’ claims handling expenses (overheads).
#1 Includes the situation where a builder’s licence is suspended for a failure to comply with a monetary order of the NSW Civil and Administrative
Tribunal or a court in favour of the homeowner.
#2 All amounts shown are undiscounted values.
Home Building Compensation Scheme report – 30 June 2017 17
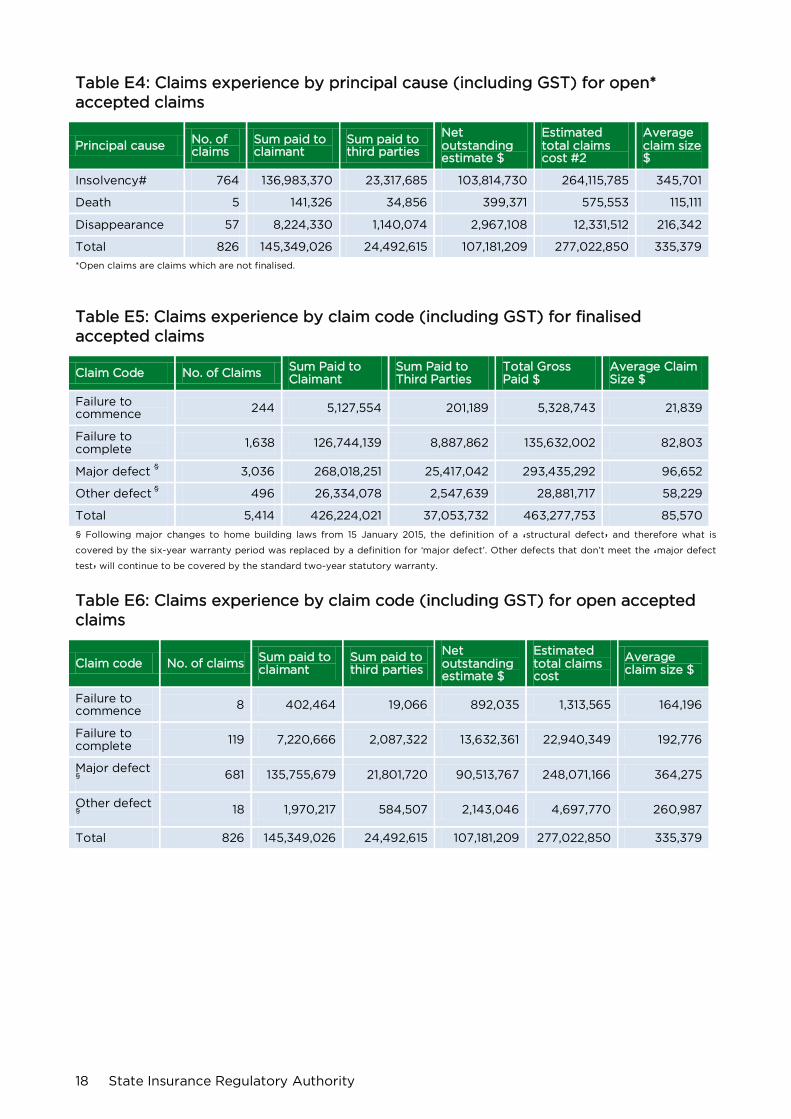
Table E4: Claims experience by principal cause (including GST) for open* accepted claims
Principal cause No. of claims
Sum paid to claimant
Sum paid to third parties
Net outstanding estimate $
Estimated total claims cost #2
Average claim size $
Insolvency# 764 136,983,370 23,317,685 103,814,730 264,115,785 345,701
Death 5 141,326 34,856 399,371 575,553 115,111
Disappearance 57 8,224,330 1,140,074 2,967,108 12,331,512 216,342
Total 826 145,349,026 24,492,615 107,181,209 277,022,850 335,379
*Open claims are claims which are not finalised.
Table E5: Claims experience by claim code (including GST) for finalised accepted claims
Claim Code No. of Claims Sum Paid to Claimant
Sum Paid to Third Parties
Total Gross Paid $
Average Claim Size $
Failure to commence 244 5,127,554 201,189 5,328,743 21,839
Failure to complete 1,638 126,744,139 8,887,862 135,632,002 82,803
Major defect § 3,036 268,018,251 25,417,042 293,435,292 96,652
Other defect § 496 26,334,078 2,547,639 28,881,717 58,229
Total 5,414 426,224,021 37,053,732 463,277,753 85,570
§ Following major changes to home building laws from 15 January 2015, the definition of a ‘structural defect’ and therefore what is
covered by the six-year warranty period was replaced by a definition for ‘major defect’. Other defects that don’t meet the ‘major defect
test’ will continue to be covered by the standard two-year statutory warranty.
Table E6: Claims experience by claim code (including GST) for open accepted claims
Claim code No. of claims Sum paid to claimant
Sum paid to third parties
Net outstanding estimate $
Estimated total claims cost
Average claim size $
Failure to commence 8 402,464 19,066 892,035 1,313,565 164,196
Failure to complete 119 7,220,666 2,087,322 13,632,361 22,940,349 192,776
Major defect § 681 135,755,679 21,801,720 90,513,767 248,071,166 364,275
Other defect § 18 1,970,217 584,507 2,143,046 4,697,770 260,987
Total 826 145,349,026 24,492,615 107,181,209 277,022,850 335,379
18 State Insurance Regulatory Authority

Table E7: Claims experience by type of cover (including GST) for finalised accepted claims
Type of Cover No. of claims Sum paid to claimant
Sum paid to third parties
Total gross paid $
Average claim size $
New single dwelling construction 3,343 221,503,151 18,352,838 239,855,989 71,749
New multi-dwelling (greater than three storeys)
9 4,792,362 756,543 5,548,905 616,545
New multi-dwelling
(3 storeys or less) 808 113,817,267 10,815,085 124,632,352 154,248
Alterations/additions 772 66,196,478 5,376,435 71,572,913 92,711
Swimming pools 291 6,653,485 806,976 7,460,461 25,637
Renovations (including kitchens and bathrooms)
144 11,196,763 837,661 12,034,424 83,572
Other 47 2,064,515 108,194 2,172,709 46,228
Total 5,414 426,224,021 37,053,732 463,277,753 85,570
Table E8: Claims experience by type of cover (including GST) for open accepted claims
Type of Cover No. of claims
Sum paid to claimant
Sum paid to third parties
Net outstanding estimate $
Estimated total claims cost
Average claim size $
New single dwelling construction 418 25,737,293 5,365,640 29,699,577 60,802,510 145,461
New multi-dwelling (greater than 3 storeys)
10 27,711,911 3,592,828 2,878,489 34,183,228 3,418,323
New multi-dwelling
(3 storeys or less) 216 74,233,777 12,482,331 47,396,370 134,112,478 620,891
Alterations/additions 136 13,791,233 2,058,817 23,749,584 39,599,634 291,174
Swimming pools 22 594,595 224,975 441,818 1,261,388 57,336
Renovations (including kitchens and bathrooms)
24 3,280,217 768,024 3,015,371 7,063,612 294,317
Other 0 0 0 0 0 0
Total 826 145,349,026 24,492,615 107,181,209 277,022,850 335,379
Home Building Compensation Scheme report – 30 June 2017 19
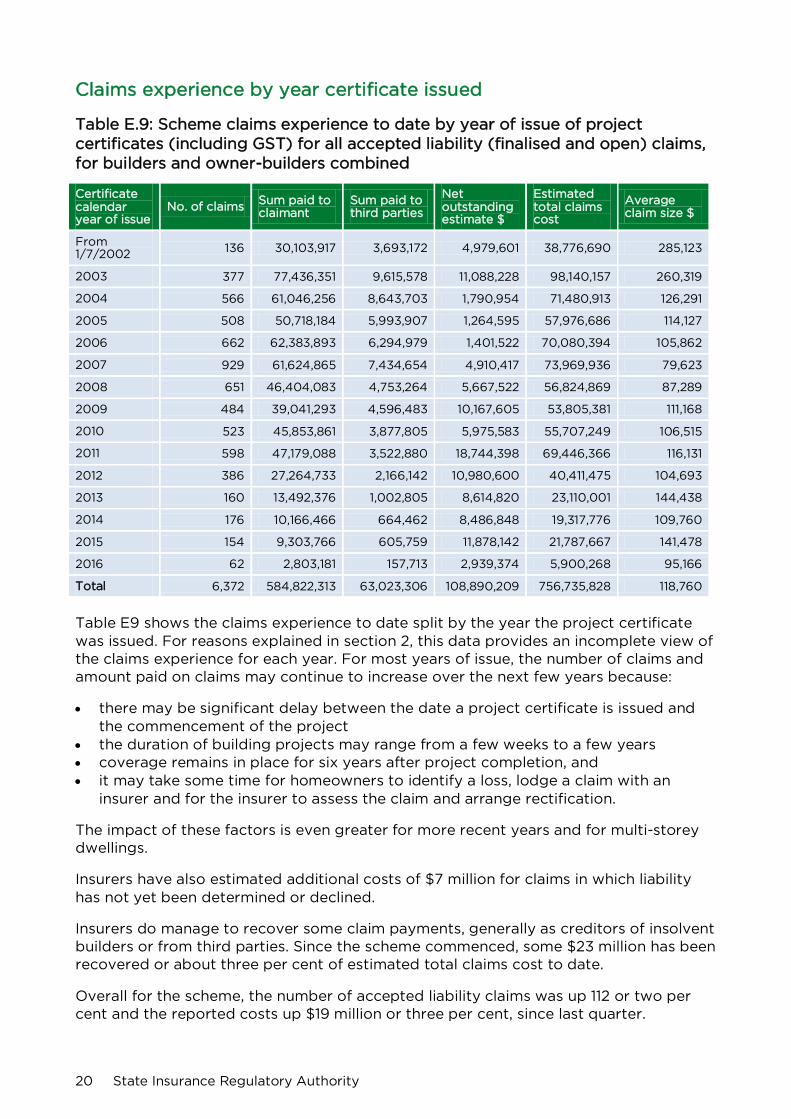
Claims experience by year certificate issued
Table E.9: Scheme claims experience to date by year of issue of project certificates (including GST) for all accepted liability (finalised and open) claims, for builders and owner-builders combined
Certificate calendar year of issue
No. of claims Sum paid to claimant
Sum paid to third parties
Net outstanding estimate $
Estimated total claims cost
Average claim size $
From 1/7/2002 136 30,103,917 3,693,172 4,979,601 38,776,690 285,123
2003 377 77,436,351 9,615,578 11,088,228 98,140,157 260,319
2004 566 61,046,256 8,643,703 1,790,954 71,480,913 126,291
2005 508 50,718,184 5,993,907 1,264,595 57,976,686 114,127
2006 662 62,383,893 6,294,979 1,401,522 70,080,394 105,862
2007 929 61,624,865 7,434,654 4,910,417 73,969,936 79,623
2008 651 46,404,083 4,753,264 5,667,522 56,824,869 87,289
2009 484 39,041,293 4,596,483 10,167,605 53,805,381 111,168
2010 523 45,853,861 3,877,805 5,975,583 55,707,249 106,515
2011 598 47,179,088 3,522,880 18,744,398 69,446,366 116,131
2012 386 27,264,733 2,166,142 10,980,600 40,411,475 104,693
2013 160 13,492,376 1,002,805 8,614,820 23,110,001 144,438
2014 176 10,166,466 664,462 8,486,848 19,317,776 109,760
2015 154 9,303,766 605,759 11,878,142 21,787,667 141,478
2016 62 2,803,181 157,713 2,939,374 5,900,268 95,166
Total 6,372 584,822,313 63,023,306 108,890,209 756,735,828 118,760
Table E9 shows the claims experience to date split by the year the project certificate was issued. For reasons explained in section 2, this data provides an incomplete view of the claims experience for each year. For most years of issue, the number of claims and amount paid on claims may continue to increase over the next few years because:
• there may be significant delay between the date a project certificate is issued and the commencement of the project
• the duration of building projects may range from a few weeks to a few years • coverage remains in place for six years after project completion, and • it may take some time for homeowners to identify a loss, lodge a claim with an
insurer and for the insurer to assess the claim and arrange rectification.
The impact of these factors is even greater for more recent years and for multi-storey dwellings.
Insurers have also estimated additional costs of $7 million for claims in which liability has not yet been determined or declined.
Insurers do manage to recover some claim payments, generally as creditors of insolvent builders or from third parties. Since the scheme commenced, some $23 million has been recovered or about three per cent of estimated total claims cost to date.
Overall for the scheme, the number of accepted liability claims was up 112 or two per cent and the reported costs up $19 million or three per cent, since last quarter.
20 State Insurance Regulatory Authority
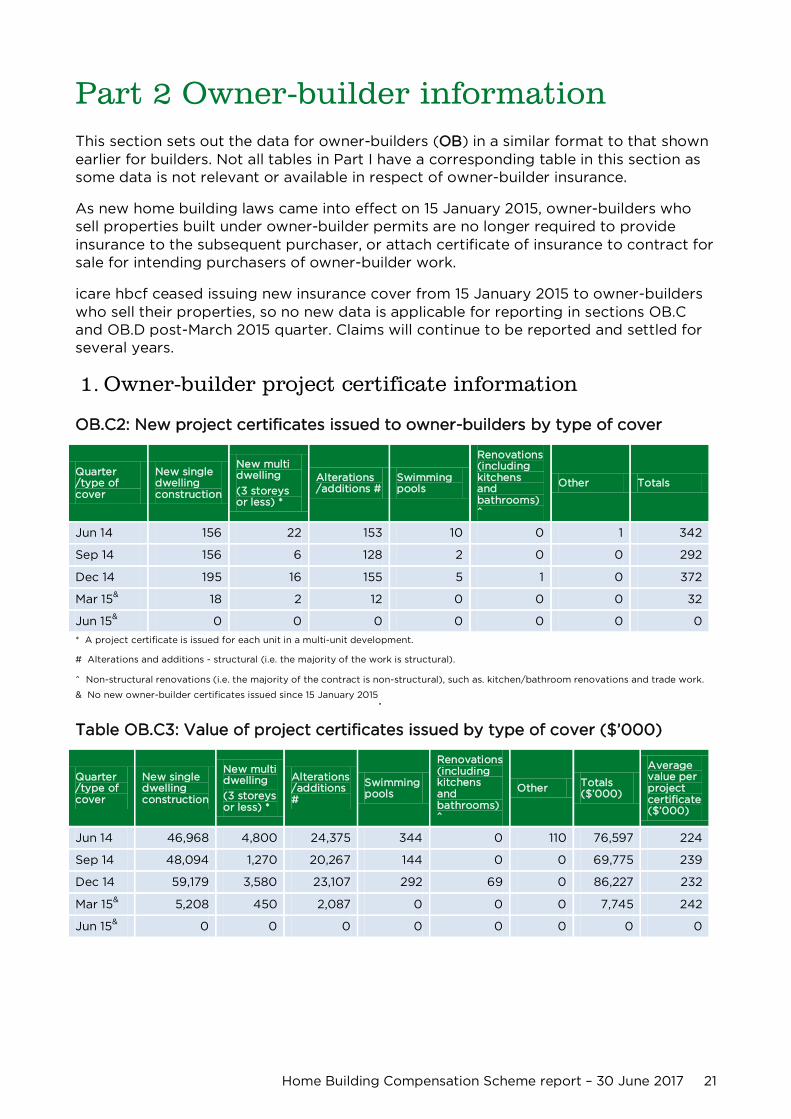
Part 2 Owner-builder information This section sets out the data for owner-builders (OB) in a similar format to that shown earlier for builders. Not all tables in Part I have a corresponding table in this section as some data is not relevant or available in respect of owner-builder insurance.
As new home building laws came into effect on 15 January 2015, owner-builders who sell properties built under owner-builder permits are no longer required to provide insurance to the subsequent purchaser, or attach certificate of insurance to contract for sale for intending purchasers of owner-builder work.
icare hbcf ceased issuing new insurance cover from 15 January 2015 to owner-builders who sell their properties, so no new data is applicable for reporting in sections OB.C and OB.D post-March 2015 quarter. Claims will continue to be reported and settled for several years.
1. Owner-builder project certificate information
OB.C2: New project certificates issued to owner-builders by type of cover
Quarter /type of cover
New single dwelling construction
New multi dwelling
(3 storeys or less) *
Alterations /additions #
Swimming pools
Renovations (including kitchens and bathrooms) ^
Other Totals
Jun 14 156 22 153 10 0 1 342
Sep 14 156 6 128 2 0 0 292
Dec 14 195 16 155 5 1 0 372
Mar 15& 18 2 12 0 0 0 32
Jun 15& 0 0 0 0 0 0 0
* A project certificate is issued for each unit in a multi-unit development.
# Alterations and additions - structural (i.e. the majority of the work is structural).
^ Non-structural renovations (i.e. the majority of the contract is non-structural), such as. kitchen/bathroom renovations and trade work.
& No new owner-builder certificates issued since 15 January 2015.
Table OB.C3: Value of project certificates issued by type of cover ($’000)
Quarter /type of cover
New single dwelling construction
New multi dwelling
(3 storeys or less) *
Alterations /additions #
Swimming pools
Renovations (including kitchens and bathrooms) ^
Other Totals ($’000)
Average value per project certificate ($’000)
Jun 14 46,968 4,800 24,375 344 0 110 76,597 224
Sep 14 48,094 1,270 20,267 144 0 0 69,775 239
Dec 14 59,179 3,580 23,107 292 69 0 86,227 232
Mar 15& 5,208 450 2,087 0 0 0 7,745 242
Jun 15& 0 0 0 0 0 0 0 0
Home Building Compensation Scheme report – 30 June 2017 21
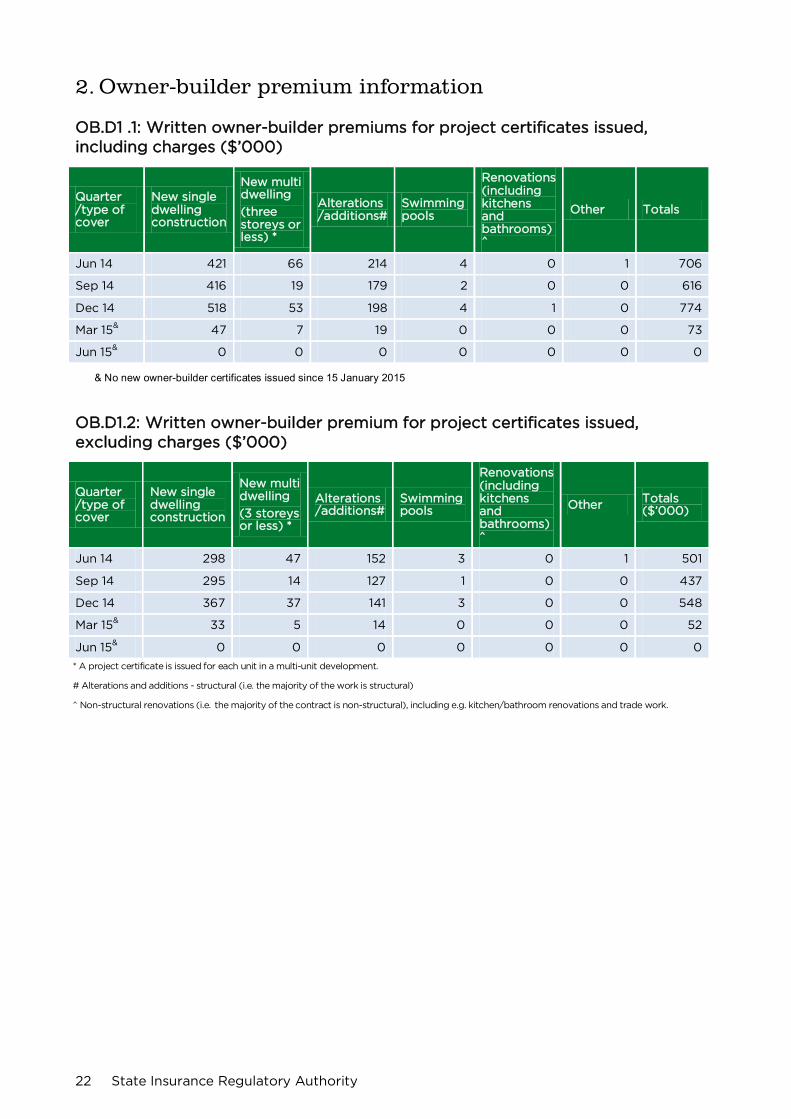
2. Owner-builder premium information
OB.D1 .1: Written owner-builder premiums for project certificates issued, including charges ($’000)
Quarter /type of cover
New single dwelling construction
New multi dwelling
(three storeys or less) *
Alterations /additions#
Swimming pools
Renovations (including kitchens and bathrooms) ^
Other Totals
Jun 14 421 66 214 4 0 1 706
Sep 14 416 19 179 2 0 0 616
Dec 14 518 53 198 4 1 0 774
Mar 15& 47 7 19 0 0 0 73
Jun 15& 0 0 0 0 0 0 0
& No new owner-builder certificates issued since 15 January 2015
OB.D1.2: Written owner-builder premium for project certificates issued, excluding charges ($’000)
Quarter /type of cover
New single dwelling construction
New multi dwelling
(3 storeys or less) *
Alterations /additions#
Swimming pools
Renovations (including kitchens and bathrooms) ^
Other Totals ($’000)
Jun 14 298 47 152 3 0 1 501
Sep 14 295 14 127 1 0 0 437
Dec 14 367 37 141 3 0 0 548
Mar 15& 33 5 14 0 0 0 52
Jun 15& 0 0 0 0 0 0 0
* A project certificate is issued for each unit in a multi-unit development.
# Alterations and additions - structural (i.e. the majority of the work is structural)
^ Non-structural renovations (i.e. the majority of the contract is non-structural), including e.g. kitchen/bathroom renovations and trade work.
22 State Insurance Regulatory Authority
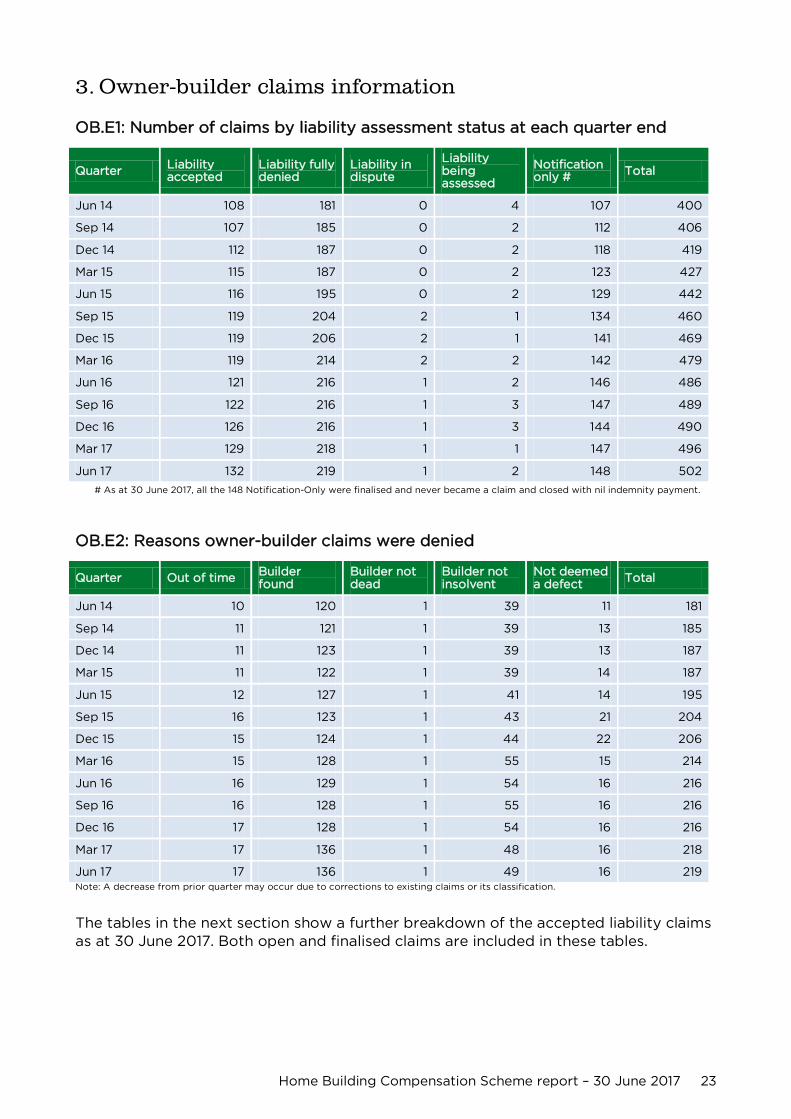
3. Owner-builder claims information
OB.E1: Number of claims by liability assessment status at each quarter end
Quarter Liability accepted
Liability fully denied
Liability in dispute
Liability being assessed
Notification only # Total
Jun 14 108 181 0 4 107 400
Sep 14 107 185 0 2 112 406
Dec 14 112 187 0 2 118 419
Mar 15 115 187 0 2 123 427
Jun 15 116 195 0 2 129 442
Sep 15 119 204 2 1 134 460
Dec 15 119 206 2 1 141 469
Mar 16 119 214 2 2 142 479
Jun 16 121 216 1 2 146 486
Sep 16 122 216 1 3 147 489
Dec 16 126 216 1 3 144 490
Mar 17 129 218 1 1 147 496
Jun 17 132 219 1 2 148 502
# As at 30 June 2017, all the 148 Notification-Only were finalised and never became a claim and closed with nil indemnity payment.
OB.E2: Reasons owner-builder claims were denied
Quarter Out of time Builder found
Builder not dead
Builder not insolvent
Not deemed a defect Total
Jun 14 10 120 1 39 11 181
Sep 14 11 121 1 39 13 185
Dec 14 11 123 1 39 13 187
Mar 15 11 122 1 39 14 187
Jun 15 12 127 1 41 14 195
Sep 15 16 123 1 43 21 204
Dec 15 15 124 1 44 22 206
Mar 16 15 128 1 55 15 214
Jun 16 16 129 1 54 16 216
Sep 16 16 128 1 55 16 216
Dec 16 17 128 1 54 16 216
Mar 17 17 136 1 48 16 218
Jun 17 17 136 1 49 16 219 Note: A decrease from prior quarter may occur due to corrections to existing claims or its classification.
The tables in the next section show a further breakdown of the accepted liability claims as at 30 June 2017. Both open and finalised claims are included in these tables.
Home Building Compensation Scheme report – 30 June 2017 23
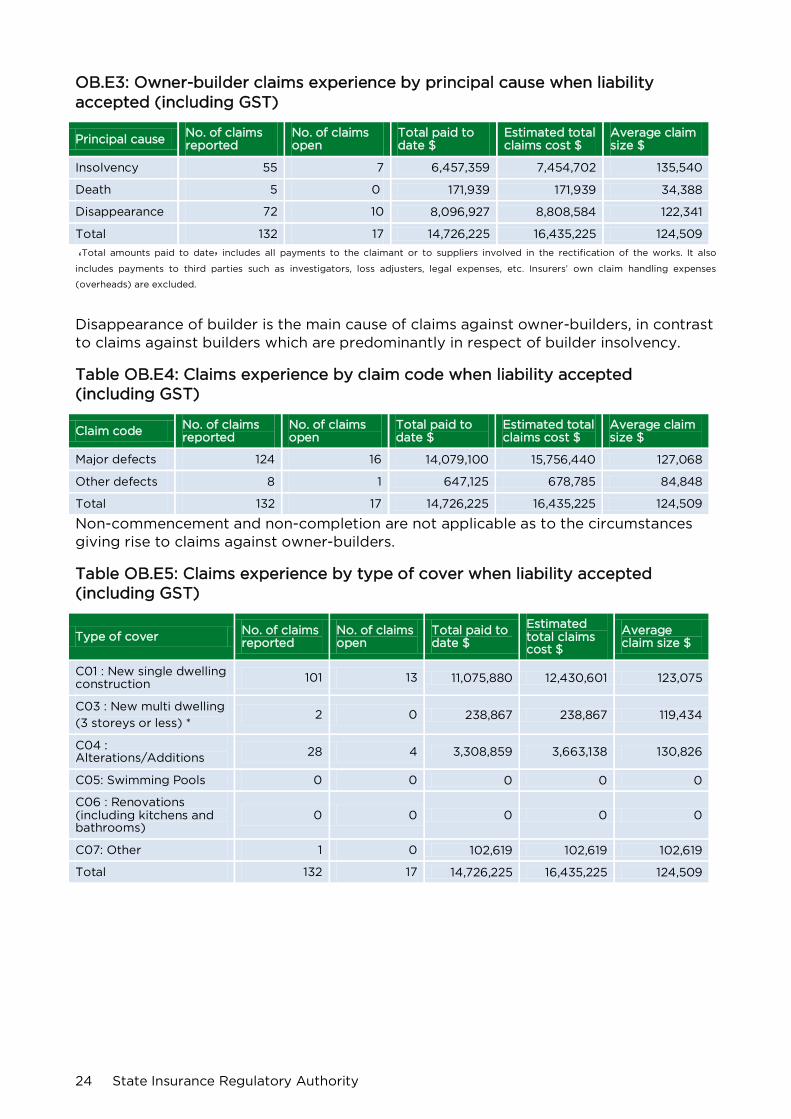
OB.E3: Owner-builder claims experience by principal cause when liability accepted (including GST)
Principal cause No. of claims reported
No. of claims open
Total paid to date $
Estimated total claims cost $
Average claim size $
Insolvency 55 7 6,457,359 7,454,702 135,540
Death 5 0 171,939 171,939 34,388
Disappearance 72 10 8,096,927 8,808,584 122,341
Total 132 17 14,726,225 16,435,225 124,509
‘Total amounts paid to date’ includes all payments to the claimant or to suppliers involved in the rectification of the works. It also
includes payments to third parties such as investigators, loss adjusters, legal expenses, etc. Insurers’ own claim handling expenses
(overheads) are excluded.
Disappearance of builder is the main cause of claims against owner-builders, in contrast to claims against builders which are predominantly in respect of builder insolvency.
Table OB.E4: Claims experience by claim code when liability accepted (including GST)
Claim code No. of claims reported
No. of claims open
Total paid to date $
Estimated total claims cost $
Average claim size $
Major defects 124 16 14,079,100 15,756,440 127,068
Other defects 8 1 647,125 678,785 84,848
Total 132 17 14,726,225 16,435,225 124,509
Non-commencement and non-completion are not applicable as to the circumstances giving rise to claims against owner-builders.
Table OB.E5: Claims experience by type of cover when liability accepted (including GST)
Type of cover No. of claims reported
No. of claims open
Total paid to date $
Estimated total claims cost $
Average claim size $
C01 : New single dwelling construction 101 13 11,075,880 12,430,601 123,075
C03 : New multi dwelling
(3 storeys or less) * 2 0 238,867 238,867 119,434
C04 : Alterations/Additions 28 4 3,308,859 3,663,138 130,826
C05: Swimming Pools 0 0 0 0 0
C06 : Renovations (including kitchens and bathrooms)
0 0 0 0 0
C07: Other 1 0 102,619 102,619 102,619
Total 132 17 14,726,225 16,435,225 124,509
24 State Insurance Regulatory Authority

Disclaimer
This publication may contain information that relates to the regulation of workers compensation insurance, motor accident third party (CTP) insurance and home building compensation in NSW. It may include details of some of your obligations under the various schemes that the State Insurance Regulatory Authority (SIRA) administers.
However to ensure you comply with your legal obligations you must refer to the appropriate legislation as currently in force. Up to date legislation can be found at the NSW Legislation website legislation.nsw.gov.au
This publication does not represent a comprehensive statement of the law as it applies to particular problems or to individuals, or as a substitute for legal advice. You should seek independent legal advice if you need assistance on the application of the law to your situation.
This material may be displayed, printed and reproduced without amendment for personal, in-house or non-commercial use.
State Insurance Regulatory Authority Level 6, McKell Building, 2-24 Rawson Place, Sydney NSW 2000 General phone enquiries 13 32 20 Website www.sira.nsw.gov.au
ISBN 978-0-7347-4621-4 Catalogue no. SIRA08851 © Copyright State Insurance Regulatory Authority NSW 1117