hollow hematite microspheres obtained without hard templates · 4 tecsup, av. cascanueces 2221,...
TRANSCRIPT

Nanotechnology in Drug Delivery 130 130
5 Hollow hematite microspheres obtained without hard templates
L de los Santos Valladares
1*, L. León Félix
2,3, S.M. Espinoza Suárez
2,4, A.G. Bustamante
Domínguez2, S. Holmes
1, T. Mitrelias
1, J. Albino Aguiar
5, C.H.W. Barnes
1
1 Cavendish Laboratory, Department of Physics, University of Cambridge, J.J. Thomson Ave., Cambridge CB3 0HE, UK. 2 Facultad de Ciéncias Físicas, Universidad Nacional Mayor de San Marcos, Ap. Postal 14-0149, Lima, Perú. 3 Laboratório de Caracterição Magnética, Instituto de Física, Universidade de Brasilia, DF 70910-900, Brasilia, Brasil. 4 TECSUP, Av. Cascanueces 2221, Santa Anita, Lima 43, Perú. 5 Laboratório de Superconductividade e Materiais Avançados, Departamento de Física, Universidade Federal de Pernambuco 50670-901, Recife, Brasil.
*Corresponding author.
Outline Introduction…………….…………….…………….…………….…………….…………….…………….…………….……………… 131 Hollow microspheres as drug delivery vehicles…………………………………………………………..………….…… 132 Methods and techniques…………………………………………………………………………………………………………….. 133 Preparation…………….…………….…………….…………….…………….…………….…………….…………….………………. 133 Characterization…………….…………….…………….…………….…………….…………….…………….…………………..… 134 Crystallization….…………………………………………………………………………………………………………………….….… 134 Hollow formation…………………………………………………………………………………………..……………………………. 137 Magnetic properties……………………………………………………………………………………………….…………………… 139 The temperature dependence of the magnetization (M(T)) ……………………………………………………..… 141 The magnetic field dependence of the magnetization (M(H)) ………………………………………………..…… 142 Conclusions…………………………………………………………………………………………………………………………………. 144 Acknowledgements…………………………………………………………………………………………………………………….. 144 References………………………………………………………………………………………………………………………………….. 144

Nanotechnology in Drug Delivery 131 131
Introduction The production of hollow microspheres is of current interest due to their promising applications in photonic crystals, encapsulation, drug delivery, catalysis, chemical storage, light fillers and low dielectric constant materials [1-14]. A variety of hollow spheres such as carbide [15], Ni [16], TiO2 [17], NiS [18], Bi2Te3 [19] and ZnO/SnO2 [20] have been successfully fabricated. The most common techniques to produce hollow spheres are based on the use of core organic/inorganic hard templates such as monodispersed silica spheres [21-23], polymer latex colloids [11, 24], carbon spheres [25] and block copolymers [26, 27] or soft templates, such as emulsion droplets [28,29], surfactants vesicles [30] and liposome [31]. In general, the template technique involves four major steps (as represented in Fig. 5.1) [1]: (1) Preparation of the templates; (2) functionalization/modification of the templates surface to achieve favourable surface properties; (3) coating the templates with desired materials or their precursors; and (4) selective removal of the templates in appropriate solvents or calcination to obtain the hollow structures.
FIGURE 5.1 Schematic representation of the process of hollow spheres by using templates. A typical procedure consists of (1) Preparation of the templates (2) functionalization/modification of their surface, (3) coating them and (4) removal or dissolution of the templates to obtain the hollow structures. (Adapted from Reference [1])
The hard template technique is effective for controlling the morphology of the final product. Nevertheless, this technique requires tedious synthetic procedures such as a careful selection of an affine template and a lot of care to prevent the collapse to affecting the quality of the shell during template removal. Some other drawbacks include limited sphere size, quality, purity, cost of production, and low temperature capability of the produced hollow spheres. Recently different free-template approaches have been developed to produce hollow spheres. Some of these methods are based on Oswald ripening [32, 33], simultaneous blowing and melting hidrogels [34-36], Kirkendall Effect [37-39], among others. However the average size of the hollow spheres produced by these methods are usually larger than 10 µm. Furthermore, it is difficult to obtain small microspheres having a narrow particle size distribution, and high purity metal oxide composition. Another less explored method for the production of hollow spheres is 'the gas-bubble template method'. This method involves the production of gas microbubbles during the chemical preparation of nanoparticles by using selected ligands. It is believed that the nanoparticles cover the surface and form the shell of the hollow spheres after calcinations at high temperatures [40-47]. However the exact mechanism for the bubble nucleation and grow is unclear. Hematite (α-Fe2O3) is the most stable iron oxide. It is n-type semiconductor (Eg=2.2 eV) under ambient conditions and it is easy to synthesize. Due to its magnetic properties, corrosion-resistance, low cost and low toxicity it is widely used in catalysis [48-53], environmental protection [54-60], sensors [61-65], magnetic storage materials [66] and clinic diagnosis and treatment [67,68]. α-Fe2O3 crystallizes in the rhombohedral primitive cell isomorphous to that of ilminite and
corundum (hexagonal unit cell, space group 𝑅3 𝑐) [69]. The primitive cell contains ten atoms (six Fe
Nanotechnology in Drug Delivery 132 132
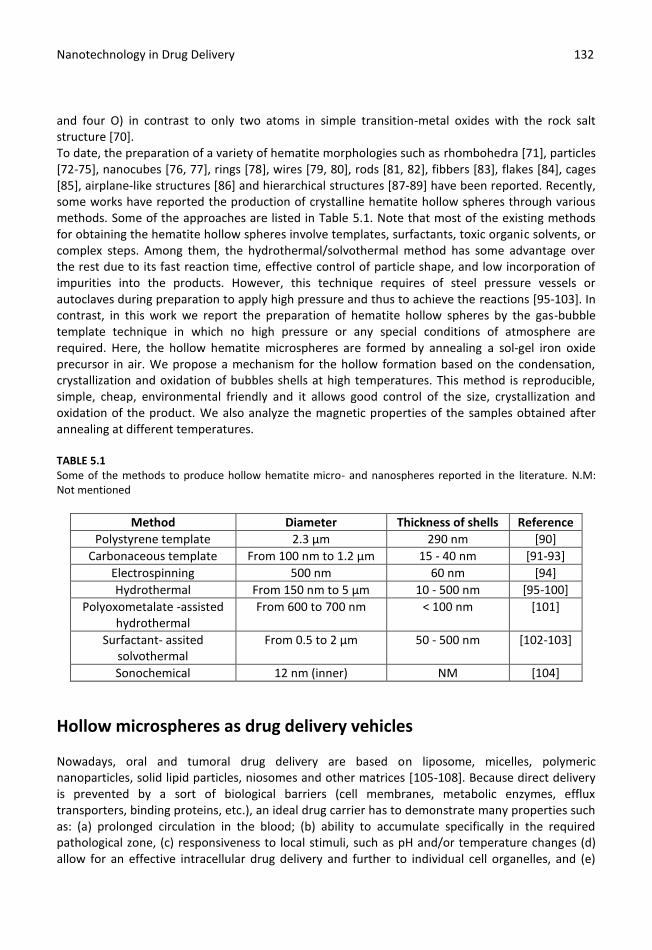
and four O) in contrast to only two atoms in simple transition-metal oxides with the rock salt structure [70]. To date, the preparation of a variety of hematite morphologies such as rhombohedra [71], particles [72-75], nanocubes [76, 77], rings [78], wires [79, 80], rods [81, 82], fibbers [83], flakes [84], cages [85], airplane-like structures [86] and hierarchical structures [87-89] have been reported. Recently, some works have reported the production of crystalline hematite hollow spheres through various methods. Some of the approaches are listed in Table 5.1. Note that most of the existing methods for obtaining the hematite hollow spheres involve templates, surfactants, toxic organic solvents, or complex steps. Among them, the hydrothermal/solvothermal method has some advantage over the rest due to its fast reaction time, effective control of particle shape, and low incorporation of impurities into the products. However, this technique requires of steel pressure vessels or autoclaves during preparation to apply high pressure and thus to achieve the reactions [95-103]. In contrast, in this work we report the preparation of hematite hollow spheres by the gas-bubble template technique in which no high pressure or any special conditions of atmosphere are required. Here, the hollow hematite microspheres are formed by annealing a sol-gel iron oxide precursor in air. We propose a mechanism for the hollow formation based on the condensation, crystallization and oxidation of bubbles shells at high temperatures. This method is reproducible, simple, cheap, environmental friendly and it allows good control of the size, crystallization and oxidation of the product. We also analyze the magnetic properties of the samples obtained after annealing at different temperatures. TABLE 5.1 Some of the methods to produce hollow hematite micro- and nanospheres reported in the literature. N.M: Not mentioned
Method Diameter Thickness of shells Reference
Polystyrene template 2.3 µm 290 nm [90]
Carbonaceous template From 100 nm to 1.2 µm 15 - 40 nm [91-93]
Electrospinning 500 nm 60 nm [94]
Hydrothermal From 150 nm to 5 µm 10 - 500 nm [95-100]
Polyoxometalate -assisted hydrothermal
From 600 to 700 nm < 100 nm [101]
Surfactant- assited solvothermal
From 0.5 to 2 µm 50 - 500 nm [102-103]
Sonochemical 12 nm (inner) NM [104]
Hollow microspheres as drug delivery vehicles Nowadays, oral and tumoral drug delivery are based on liposome, micelles, polymeric nanoparticles, solid lipid particles, niosomes and other matrices [105-108]. Because direct delivery is prevented by a sort of biological barriers (cell membranes, metabolic enzymes, efflux transporters, binding proteins, etc.), an ideal drug carrier has to demonstrate many properties such as: (a) prolonged circulation in the blood; (b) ability to accumulate specifically in the required pathological zone, (c) responsiveness to local stimuli, such as pH and/or temperature changes (d) allow for an effective intracellular drug delivery and further to individual cell organelles, and (e)

Nanotechnology in Drug Delivery 133 133
bear a contrast/reporter moiety allowing for the real-time observation of its accumulation inside the target [109]. Hollow micro- and nano-spheres could be good candidates for drug delivery through oral, inhaling and intravenous dosification. In the latest case, hollow spheres can be used for delivering drugs to cancerous tumors since they fit very well the micro sized veins and vessels of the organs [110-112]. Commonly, the low solubility of anticancer drugs in the physiological conditions causes large aggregates and induces serious side effects [113-116]. It also causes insufficient drug accumulation around tumor sites and weakens chemotherapeutic efficiency [117]. Hollow micro- or nanospheres could be used to overcome this drawback. Fig. 5.1 shows a schematic illustration of the general strategy via injection. After loading the drug into the hollow spheres [118], it is injected to the patience. In this way the drug is protect by the shells from degradation during delivery. Magnetic carriers are preferred since they can be targeted to the tumor by applying an external magnetic field as represented in the figure. As suggested in this work, hematite can be used since it is highly magnetic and it is innocuous for humans [119, 120]. The speed of the delivery could be controlled by the intensity of the external magnetic field. Inside the tumour, the hematite shells can be dissolved and the drug is released.
FIGURE 5.2 Schematic illustration of how the hollow microspheres can be used in Drug Delivery for cancerous tumor treatment. Hollow micro/nano spheres containing the drug it is injected to the patience. The speed of the delivery could be controlled by the intensity of an applied magnetic field and to guide the spheres to the target
Methods and techniques Hollow hematite microspheres were produced by a modified gas-bubble template method following annealing in air an iron oxide precursor obtained by sol-gel [121, 122]. Preparation: For the precursor, 200 ml of colloidal ferric nitrate nine-hydrate (Fe(NO3)3.9H2O) particles and

Nanotechnology in Drug Delivery 134 134
mono hydrated citric acid (C6H8O7.H2O, 0.2M) were dissolved in 800 ml of deionized water. The solution was vigorously agitated in a magnetic stirrer at 350 rpm (70 ºC) for a period of 48 h to form Fe(OH)3. The citric acid was used as ligand, to promote hydrolisis and to balance any difference of ions in the solution. A gel is formed by the hydrolisis of the ferric nitrate to iron oxohydrate FeOOH polymer [123]. The gel was dried for two days at 40 ºC to evaporate the acid, water residuals and other possible impurities formed during hydrolysis. This sample precursor was then introduced in a tubular furnace (LENTON LTF-PTF Model 16/610) for annealing in air at different temperatures, from 180 to 600 ºC. The furnace was programmed to increase the temperature at 2 ±1 ºC/min, to remain constant for 12 h, and finally to cool down at a rate of 2 ± 0.5 ºC/min. This step has two purposes. First, to thermally oxidize the gel to obtain pure hematite; and secondly, to form bubble structures via boiling in air from which the hollow spheres are formed after quenching. Remarkably, the solution precursor, is stable in air and has a shelf life longer than two years. After reacting with water and following the same annealing process, similar hollow spheres can be obtained. Characterization: The characterization of the samples was performed by X-ray diffraction (XRD). The data were collected from 20º to 65º (0.02º steps) using a powder universal diffractometer Bruker D8 Focus with Cu-Kα radiation (1.5406 Å). The diffractograms corresponding to the single hematite phase were refined using the Rietveld method and the peaks shape was modelled with a Pseudo-Voigt function (a combination of Gaussian and Lorentzian functions). The average crystallite size for the single-phase hematite samples was estimated with the Scherrer equation [124]. During Rietveld refinement, RWP/Rexp (the rate of the parameters R-weighted and R-expected) was used to observe the convergence of the cell parameters and to obtain a good fitting [125]. The shape of the hematite crystallite was modeled by using the program Vesta v.3.2.1 [126] and their strain were calculated with the Williamson-Hall method [127]. The morphological analysis was performed using a scanning electron microscope (SEM–XL30 SFEG). With the help of the Image-J software, several SEM images have been used to count N ~ 1,000 particles. Subsequently, particle size histograms have been mounted using the Sturges method [128, 129]. The magnetic measurements were carried out in a DC magnetic property measurement system (DC-MPMS-SQUID) from Quantum Design. The temperature dependence of the magnetization data, M(T), were taken in zero field cooling (ZFC) and field cooling (FC) modes from 8 K to near room temperature (RT), 290 K. The field dependence of the magnetization data, M(H), were taken under different applied magnetic fields (from -50 kOe to 50 kOe). The M(H) data were corrected by removing the diamagnetic contribution of the sample holder. Since hematite's ferromagnetism is so weak and its demagnetizing field is around 10 Oe, any field contribution from internal demagnetization was neglected.
Crystallization Figure 5.3 shows the X-ray diffraction patterns of the samples after annealing at different temperatures from 180 to 600 ºC. Initially, after annealing at 180 ºC, the sample consists of an amorphous solid with no preferred reflections in the XRD. After annealing at 250 ºC, magnetite (Fe3O4) and maghemite (γ-Fe2O3) coexisting with a small amount of hematite (α-Fe2O3) were found. The first two phases were differentiated in the XRD by following the Kim's method [130], in which

Nanotechnology in Drug Delivery 135 135
the (511) peak around 57º is deconvoluted into two peaks corresponding to magnetite (PDF2-No. 85-1436) and maghemite (PDF2-No. 04-0755) respectively; whereas the hematite was identified from its main reflection (104) at 33.16º. The variation of the annealing temperature from 250 to 400 ºC increases the presence of hematite (PDF2-No. 86-550) and its reflections (104), (110), (113), (024) and (300). Increasing the annealing temperature to higher values, such as 500, 550 or 600 ºC, the total transformation of magnetite and maghemite into hematite is obtained. Similar results have been reported by other authors [131, 132]. Note that the sharpness of the hematite peaks improves with annealing temperature meaning that the crystallization improves and the grain size increase. Eventually, after annealing the sample at 600 ºC, all Bragg reflections are consistent with the hematite phase, confirming the complete phase transition. As mentioned above, hematite has a rhombohedrally centered hexagonal structure of corundum type (space group R-3C) with a close-packed oxygen lattice in which two-thirds of the octahedral sites are occupied by Fe(III) ions [133, 134]. The crystal parameters were obtained by Rietveld refinement method where RWP/REXP(the R-weighted to R-expected ratio) was used to observe the convergence of the fitting parameters and to obtain a good fitting. The obtained values are listed in Table 5.2. Note that the crystallite size increases with annealing temperature while the residual strain decreases. In fact, these variations occur because the driving force increases with temperature making to overstep the equilibrium boundary to a more stable phase. The shape of the crystallite is described in more detail next.
20 25 30 35 40 45 50 55 60 65
600 OC
(01
2)
(10
4)
(11
0)
(11
3)
(02
4)
(11
6)
(01
8)
(21
4)
(30
0)
550 OC
500 OC Hematite
*
400 OC Maghemite
** (4
40
)
(51
1)
(42
2)
(40
0)
(31
1)
(22
0)
(21
0)
**
*
*250
OC
*
Magnetite
2 ( O
)
Inte
nsity (
arb
. u
nits)
180 OC
Amorphous
FIGURE 5.3 X-ray diffraction patterns of the samples after annealing at different temperatures. After annealing at 180 ºC, the sample consists of an amorphous solid with no preferred reflections. After annealing at 250 ºC, magnetite and maghemite coexist with an small amount of hematite. Annealing at temperatures above 400 ºC increases the presence of hematite. Annealing at 500, 550 or 600 ºC results in the single-phase hematite

Nanotechnology in Drug Delivery 136 136
TABLE 5.2 Crystallite size, lattice parameters and residual strains obtained by Rietveld refinements from XRD of the single-phase hematite samples
Annealing Temperature (ºC) (nm)
Strain (%) a=b (Å) c (Å) RWP/RExp
600 73.50 0.121 5.0338 13.7472 1.11
550 57.30 0.128 5.0338 13.7378 1.15
500 46.60 0.195 5.0339 13.7487 1.13 Figure 5.4 shows the scanning electron micrographs of the raw sample and after annealing at 550 and 600 ºC. Fig 5.4 (a) shows the morphology of the sample obtained after sol-gel processing. The sample consists mainly of an formless mass of Fe(OH)x
+(3-x), H2O and NO3 [135]. Similar morphology
was obtained for the samples annealed at temperatures below 500 ºC (not shown here). This in contrast to the hydrothermal method, in which intermediate solid cores or urchain-like seeds were observed after increasing the temperature [95, 96, 100]. In the present work the morphology of the sample continued un-shaped even after annealing at 500 ºC. Fig. 5.4 (b) shows the morphology of the sample after annealing at 550 ºC, in which most of the material consists of micropheres with soft surfaces, coexisting with a few unshaped grains. The corresponding histogram (top right inset figure) gives a mean diameter of 889 ± 20 nm. The top left inset figure shows a broken sphere revealing its internal cavity. The broken sphere has an external diameter of around 1.45 µm and shell thickness of around 200 nm. Fig. 5.4 (c) shows the sample after annealing at 600 ºC. The mean size of the spheres has increased to around 1.60 µm as noted from its respective histogram (top right inset figure). The top left inset figure shows a broken sphere with an external diameter of 2 µm and shell thickness of less than 100 nm. The difference in diameter and shell thickness than in the previous case suggests that, as the size of the spheres grows, the shells become thinner. Fig. 5.4 (d) shows one sphere with diameter 1.85 µm obtained after annealing at 600 ºC. Note that the surface is not completely soft and it is rough suggesting that the shell is composed of different grains. A model of the crystallite shape of this sample is provided in the top right inset figure. Note that the shape of the grains conforming the shell are slightly similar to the modeled polyhedron crystallite orientated along the {104} and {110} family of planes. However, since the crystallite size of this sample is 73.5 nm (see Table 5.2), each grain in the shell should contain between 1 - 3 crystallites. Note that by increasing the annealing temperature from 550 to 600 ºC the crystallite size increases and the shell thickness decreases. In this way, the calculated number of crystallites forming the shell of the sample annealed at 550 ºC is around 3.1 × 10
3, whereas that for the sample
annealed at 600 ºC is around 2.6 ×10³. This slightly difference number of crystallites indicates that
the spheres growth is quasi-isotropic.
D

Nanotechnology in Drug Delivery 137 137
FIGURE 5.4 Scanning electron microscope micrograph of the raw sample and after annealing at 550 and 600 ºC. a) Sample obtained after sol-gel processing (raw). b) Sample after annealed at 550 ºC. Top right inset: histogram giving a mean diameter of 889 ± 20 nm. Top left inset: A broken sphere revealing its internal cavity. c) Sample after annealing at 600 ºC. Top right inset: Histogram giving a mean diameter of 1.60 µm. Top left inset: A broken sphere revealing its internal cavity. d) An individual sphere obtained after annealing at 600 ºC. Top right inset: A model of the polyhedron crystallite shape of the hematite orientated along the {104} and {110} family planes
Hollow formation In order to understand better the bubble formation we have exposed the raw precursor to an
electron beam generated in a SEM. Figure 5.5 shows the SEM image of the raw sample obtained by
secondary electrons accelerated at 5 kV at consecutive times. The inset figures show the
topography profile on the areas pointed by the arrows. Fig. 5.5 (a) shows an image taken at an
initial time set as 0 s when the electron beam starts heating the sample. Fig. 5.5 (b) shows the same
area scan after 5 s of electron beam irradiation. Remarkably, bloating areas form in different parts
over the surface. The arrow points a clear formed bubble caused by the heated sample due to
electron beam incidence. The bubble should consist of diffusive gas tending to escape from the
sample and remained trapped due to surface tension. Figure 5.5 (c) shows the morphology of the
same area after 10 s of electron beam irradiation. The bubble pointed by the arrow has exploded. It
is difficult to calculate the internal pressure of the gas before exposion because it depends not only
on the diameter but also on surface tension of the bubble. However, since the internal pressure of
a bubble increase on decreasing its diameter [136], the explosion observed in the figure should be

Nanotechnology in Drug Delivery 138 138
caused by increment on the outgass species promoted by heating due to the long beam exposure.
Similar works about bubble formation in other annealed materials report that the internal pressure
varies over a wide range (from 10 [137] to 300 × 106 Pa [138]) and it also depends on the type of
gas. Thus, this technique is suitable for the encapsulation of pure or preselected combination of
gases.
The mechanism for the formation of the hollow spheres in this work might be as follow:
1st- Initially, dissolution of the reagents occurs via
Fe NO3 .9H2O(s)
H2O Fe3++NO3 (aq)
- (1)
H3C6H5O7.H2O s
H2O H3C6H5O7 (aq) (2)
Reaction between the dissolved reagents occurs via hydrolyzation of iron and nitrate. The nitrate (NO3
-) solubilize in water while the Fe
3+ ions react progressively with water and the decomposed
products of the citric acid to form an hydrated iron-citrate gel which after drying (equation 6) an amorphous compound of Fe, C, H and O ions is formed, as observed in Fig. 5.4 (a) and Fig. 5.5.
Fe(OH)3 gel +H3C6H5O7 aq
drying FeC6H5O7 s +3H2O(g) (3)
2nd- During annealing, the latest product reacts with air to form magnetite, maghemite or hematite depending on the temperature (as detected by XRD in Fig. 5.3). In the case of hematite:
FeC6H5O7 s +𝑎𝑖𝑟∆ Fe2O3(S)
+H2O(v)+CO2 (g) (4)
the reaction occurs with simultaneous melting, vaporization and degassing of the precursor components. In addition to H2O and CO2, N2, NO and O2 might also become volatile due to the decomposition of NO3 [135]. 3rd- At high annealing temperatures, such as 550 and 600 ºC, the melt superheats and decompresses. Decompression exerts a major control on the physical state of the melt. This change in pressure influences the density and solubility of the gaseous components. A chaotic internal diffusion occurs forming a vesicular texture in which the superheated gases take place. These cavities act as heterogeneous nucleation centers for single crystal growth or polycrystalline aggregation [139]. 4th.- The exact processes that control the nucleation and growth of the gas bubbles are complex and highly nonlinear [140]. It is assumed that a bubble nucleates when superheated liquid grows sufficiently to cause the vapour/gas trapped within the cavity to overcome the surface tension force and should grow following the theory of Hsu [141]. 5th- Once a bubble nucleates, it grows through: (i) mechanical expansion due to compressibility of the gas phase and (ii) simultaneous diffusion from the superheated melt to adjacent bubbles and evaporation of the liquid in the surface bubble [142]. The transport of water to the bubbles' interface has not been much investigated, but the growth rate of a bubble was parameterized following the relation [143]:
𝑅 𝑡
𝑅𝑖= 𝑒
𝜏2𝑡𝑑𝑒𝑐2𝑡𝑣𝑖𝑠 (5)

Nanotechnology in Drug Delivery 139 139
where R(t) is the radius of the bubble at a particular time, Ri is the radius previous to decompression, tvis is the timescale for viscous relaxation, tdec is the timescale for decompression
and 𝜏 = 𝑑𝑝
𝑑𝑡 𝑡 in which p is the pressure.
6th- Whereas, the viscosity of the surrounding melt opposes a resistance to bubbles growth. The surface tension acts on the bubbles shrinking the surface and forces them back to the melt. Thus, there is a competition between the buoyancy and surface tension, which is mediated by the temperature. Approaching the surface, the external pressure decreases and the bubbles evolve in the liquid. 7th.- Thus, the microbubbles act as soft templates over which crystallites aggregate and grow. Eventually, the crystallization, condensation and oxidation of the shells is controlled by the heat treatments, thus forming the hollow spheres. A similar mechanism has been also proposed by other authors [144].
FIGURE 5.5 SEM micrographs of the raw sample obtained by secondary electrons accelerated at 5 kV at consecutive times: a) 0 s, b) 5 s and c) 10 s. The arrows point areas in which a clear bubble is formed. The inset figure shows the corresponding topography profile over the area pointed by the arrows The parameters that can be adjusted for controlling the size, shell thickness, crystallization, oxidation and quality of the bubbles are: the annealing temperature, the increase/decrease ratio of temperature, the annealing time, the solvent and the concentration of the reactants (and hence viscosity of the melt). Among them, the annealing temperature has a high influence in the size, shell thickness and crystallization of the product. In this sense, it is expected that for higher annealing temperatures than 600 ºC the percentage of broken bubbles in the final product increases. Moreover, the concentration of the reactants also plays an important role. We observed that citric acid with concentrations lower than 0.1 M (data not shown here) do not produce enough gas to form the microbubbles. The concentration of citric acid used in the present work was 0.2 M resulting in high quality hollow spheres. Whereas, it is expected that using higher molarities might result in thicker shells and smaller diameter for the bubbles [137]. In such a case, the diameter of the hollow spheres can be increased by raising the annealing temperature. Furthermore, the slow heating/quenching rate (2 ºC/min) also assist in yielding intact, dense, and stronger spheres by allowing the nascent, individual bubbles to crystallize completely as separated particles.
Magnetic properties In bulk α-Fe2O3 the spins are oriented along the [111] axis of the rhombohedral primitive cell [145]

Nanotechnology in Drug Delivery 140 140
(along the [001] direction of the hexagonal unit cell [146]). It presents a first-order magnetic transition, called the Morin transition with the corresponding Morin temperature (TM)= 263 K [147, 148]. Below TM, the two magnetic sublattices contain spins oriented antiparallel and the material is antiferromagnetic (AF). Between TM and the Néel temperature (TN≈ 960 K [149]) the spins lie in the basal {111} planes of the rhombohedral cell ({001} planes of the hexagonal unit) and they are slightly canted away (approx 1º) from the antiferromagnetic orientation, resulting in a "weak ferromagnetism" or "canted antiferromagnetic state" [150-152]. In general, TM is dependent on a number of variables such as grain sizes [153], cation substitution [147, 154, 155], lattice defects (which generate internal strains) [156-159] and magnitude of the external magnetic field [160, 161]. In bulk hematite, the energy per unit volume due to exchange interaction is written by [150]:
𝐸M = 𝐽e𝑀1.𝑀2 − C. 𝑀1 ×𝑀2 , (6)
where M1 and M2 are the sublattice magnetization with 𝑀1 = 𝑀2 = 𝑀, Je is the mean-field coefficient related to the isotropic exchange interactions, and C is a constant vector along the [111] direction. If a magnetic field µ0H is applied, it gives rise to a Zeeman energy term:
𝐸𝑍 = −𝜇0𝐻. 𝑀1 +𝑀2 . (7) The magnetocrystalline anisotropy energy of bulk hematite has the form [150]:
𝐸anisotropy = −𝐾1
2 cos2𝜃1 + cos
2𝜃2 −𝐾2
2 cos4𝜃1 + cos
4𝜃2 , (8)
where K1 and K2 are the first and second order anisotropy constants respectively and 𝜃1 and 𝜃2 are the polar angles between M1 and M2 and the [111] direction. Spin rotation is originated from the competition between K1 and K2. K1 dominates at low temperatures, it is positive below TM and it changes to negative above TM. At room temperature K1 >> K2 [150]. Regarding size, a small reduction in TM is observed when grain size decreases from 10,000 µm to 100 nm (~10 K) [161]. However, in the case of hematite nanoparticles superparamagnetism is also expected together with an increase of magnetization in the weakly ferromagnetic state due to two contributions: the canted sublatices and the unpaired spins on the surface [150]. In fact, TM dramatically decreases for particle sizes below 100 nm following a 1/D dependence [162]. For example, TM is around 250 K for 100 nm-size-particles and 190 K for 30 nm-size-particles [161]. For particles with diameters 20 to 8 nm, TM is less than 4 K and it tends to disappear for smaller diameters [150, 151, 162-166]. The suppression of TM in hematite nanoparticles is believed to be caused by high internal strains [158, 167] and from small surface to volume ratio, which allows surface spins to dominate the magnetization [164]. All materials exhibit some type of magnetic behavior which can be sensed by using a magnetometer. As mentioned in the "Methods and techniques" section above, the magnetic properties of the hematite samples were obtained by using a DC-MPMS-SQUID (Quantum Design) magnetometer. There are two principal magnetic measurements which can be performed with this equipment [168]: M(H)- magnetization as a function of the applied magnetic field, and M(T)- magnetization as a function of the temperature.

Nanotechnology in Drug Delivery 141 141
where, H is the applied magnetic field which is the magnetic field applied to the sample by a superconducting magnetic coil in the magnetometer. An M(H) measurement is made by fixing the temperature T and measuring M at a series of H values. An M(T) measurement is made by fixing the applied magnetic field H and measuring M at a series of T values. These measurements can be performed in two modes: i) ZFC (zero field cooling): by cooling dawn to low temperatures without any magnetic field present, once the desired low temperature is reached an external magnetic field is applied and the magnetization is measured by increasing the temperature, and ii) FC (field cooling): by cooling dawn to low temperatures in the presence of a magnetic field while measuring the magnetization. Therefore by studying how the magnetization changes with temperature and intensity of the applied magnetic field, we can determinate the magnetic properties of the hematite hollow spheres. The temperature dependence of the magnetization (M(T)): Figure 5.6 shows the temperature dependence of the magnetization of the samples after annealing at different temperatures. The ZFC and FC loops corresponding to the samples annealed at 250 ºC give an unidentified signal probably caused by a mixture of multidomain structures such as ferromagnetic and paramagnetic domains. Since no Morin transition is detected in the M(T) loop of this sample, then there is no formation of hematite. In contrast, for the samples annealed at higher temperatures, Morin transitions are clearly observed, thus revealing the formation of the hematite phase. Nevertheless, the ZFC and FC curves do not overlap, they form thermal hysteresis around the temperature interval 230-280 ºC, meaning different TM values. The TM values were determined by the sharp peaks in the corresponding derivative curves as they are indicated in the inset plots. Note that for the case of the sample annealed at 450ºC, the Verwey signal [169, 170] at TV=118 K is also found. Verwey transition is the usual fingerprint to identify magnetite (Fe
3+[Fe
3+Fe
2+]O4) [171,
172], in which an ordering of Fe3+
and Fe2+
ions within the octahedral sites is thought to occur below TV. This effect reveals that this annealing temperature was not enough to achieve the complete oxidation of the gel to pure hematite and a remaining magnetite phase is also present. The M(T) loop of the sample obtained at 500 ºC does not show TV indicating the complete oxidation of the magnetite to hematite. Note that irreversibility of the ZFC and FC branches below the Morin transition which indicates that a certain degree of canted spins remains even at low temperatures [91]. The M(T) loop of the samples obtained at 600 ºC correspond to the hematite hollow spheres. Note that this annealing temperature produces bigger grain size and better crystallization than the other annealing temperatures, as it is discussed above, which might influence in a better defined and closed thermal hysteresis as it has also observed by other authors [173, 174]. However, the corresponding TM values do not differ to much from the other cases indicating that the magnetization is not highly sensitive to the shape and configuration of the hematite domains. For the samples obtained after annealing at 450, 500 and 600 ºC, the difference in TM values obtained from the ZFC and FC loops (ΔTM) are 10, 16 and 12 K respectively. We have not observed a clear dependence of ΔTM with annealing temperature. Thermal hysteresis in hematite has been observed for many years mostly in thin films and submicron particles [158-162, 175-180] than in bulk. Nevertheless, up to now there is not a clear understanding about its origin because the exactly mechanisms by which the Morin transition takes place into the hematite crystals remain elusive. Recently, Özdemir and Dunlop proposed that lattice defects could cause internal stresses which could anchor extensive regions of surface spins preventing spin rotation and thus resulting in thermal hysteresis [161]. It has also been proposed that rotation of the surface spins can cause nucleation centres that generate the transition

Nanotechnology in Drug Delivery 142 142
throughout the entire crystal [179, 181]. Furthermore, according to Frandsen et al. exchange coupling between particles is larger than dipole coupling in interacting hematite particles [146]. Exchange interaction between hematite particles suppresses superparamagnetic relaxation and produce spin rotation in the sublattices up to 15º, depending on particle size [182]. The thermal hysteresis observed in this work reveal that there is a remnant magnetization upon thermal cycling. This must be caused by a difference between interacting spins oriented in-plane and out-plane. It includes zones of canted spins which resist to rotate with temperature. Since the hollow spheres presented here consist of multifaceted-polyhedron crystallites stuck together and forming the shells, we believe that remanence zones are mainly located in the grain boundaries were interactions between randomly distributed Fe
3+ moments do not lead to a magnetic ordering. They
might be also susceptible to the magnetic interactions among the nanocrystals.
0.06
0.08
0.10
0.12
0.14
0.16
0.18
0.20
0.02
0.03
0.04
0.05
0.06
0.07
0 50 100 150 200 2500.002
0.004
0.006
0.008
0.010
0.012
0.014
0.016
0.018
0 50 100 150 200 250 3000.000
0.005
0.010
0.015
0.020
FC
AT 250 oCZFC
AT 450 oC
Derivative m
agnetization
AT 500 oC
Derivative m
agnetization
AT 600 oC
Ma
gn
etiza
tio
n (
em
u/g
)
T (K)
80 100 120 140 200 220 240 260 280 300
247 K (FC)
257 K (ZFC)
Deriva
tive
magn
etiza
tio
n
TV=118 K
150 180 210 240 270
254 K
(ZFC)
238 K (FC)
150 200 250
260 K
(ZFC)248 K (FC)
FIGURE 5.6 Temperature dependence, under 100 Oe applied field, of the magnetization (M(T)) of the samples after annealing at different temperatures (AT). The ZFC and FC loops corresponding to the samples annealed at 250 ºC give an unidentified signal probably caused by a mixture of multidomain structures. Morin transitions are clearly observed in the case of the samples annealed at 450, 500 and 600 ºC. The ZFC and FC curves do not overlap and form thermal hysteresis. Insets: Corresponding derivatives to determinate the Morin temperatures and the width of the thermal hysteresis (ΔTM) The magnetic field dependence of the magnetization (M(H)) The magnetic field dependence of the magnetization (M(H)) of the hollow spheres obtained after annealing at 600 ºC is presented in Fig. 5.7. The measurements were taken at three different temperatures around the Morin transition: 200, 230 and 290 K. The M(H) hysteresis loop formed near RT (290 K) confirms the weak ferromagnetic state above TM. At this temperature, magnetic saturation is reached at around HS≈ 20 kOe. The ratio between the remanence magnetization (Mr) and the saturation magnetization (Ms) is Mr/Ms≈0.81. According to Özdemir and Dunlop, values

Nanotechnology in Drug Delivery 143 143
between 0.5-0.9 are typical from multidomain hematite particles [183]. Note that in our case, the shells are composed by multiple hematite grains and they might be forming interacting domains. Remarkably a large coercive field (Hc) of around 2.7 kOe is found and it becomes zero as the temperature scales down. It is commonly accepted that the enhancement of the coercivity in bulk magnetic materials can be obtained by increasing either: (i) the resistance of domain rotation via increment of the magnetic anisotropy and (ii) the resistance of domain wall displacement via enhancing the distribution of internal stress and the volume concentration of impurity. However, up to date, there is not agreement of the exactly causes for the coercivity increase in the case of hematite nanoparticles. Large Hc values have been recently reported near RT for particle diameters in the interval 120-450 nm (1.5-3.5 kOe) while for bigger sizes Hc tends to decreases exponentially [166]. The possibility of enhanced stress is discarded in this work since annealing at high temperatures reduces the number of strains centres. In contrast, similar to other works which relate the high coercivity values with the shape of the hematite particles and the amount of crystallites contained into them [184-186], we believe that the relative large coercivity obtained in this work might be associated to the shape and amount of the crystallites conforming the hollow spheres. Since the brick crystallites are mulfaceted-polyhedron (see Fig. 5.4 (d) above), they should have large shape anisotropy in addition to crystallyne anisotropy. This effect might be also affected by the number of crystallites composing each sphere (2.6 × 10
3, see above), which follows very well
the correlation of coercivity values vs. number of composing crystallites reported by Rath et al. [186]. In other words, similar to the thermal hysteresis reported above, the high coercivity obtained in this work should be caused by the large difference between domains alignment occurred into the crystallites and grain boundaries. As more polyhedron crystallites conform the shells, more grain boundaries and different spin alignments there are, thus resulting in a large coercivity. At 230 K, a coexistence of antiferromagnetic and canted antiferromagnetic domains is detected. Note that the antiferromagnetic state is dominant at the lowest applied fields since the magnetization tends to negative values and there is a lack of remanence and coercivity. Positive magnetization signals are obtained at higher magnetic fields than 30 kOe, enhancing the canted amount of spins (weekly ferromagnetism state). At 200 K, no remanence magnetization, nor coercivity, are obtained and the inverse sigmoidal curve in the M(H) loop reveals the complete antiferromagnetic state of the hematite hollow spheres.
-40 -20 0 20 40
-0.4
-0.3
-0.2
-0.1
0.0
0.1
0.2
0.3
0.4
-40 -20 0 20 40 -40 -20 0 20 40
T=200 K
H (kOe)
T=230 K
Ma
gn
etiza
tio
n (
em
u/g
)
T=290 K
FIGURE 5.7 Magnetic field dependence of the magnetization (M(H)) of the hollow spheres obtained after annealing at 600 ºC. The measurements were taken at three different temperatures (200, 230 and 290 K) as indicated. At 290 K, the hysteresis confirms the weak ferromagnetic and Hc ≈ 2.7 kOe. At 230 K, a coexistence of antiferromagnetic and canted antiferromagnetic domains is detected with a lack of remanence and coercivity. At 200 K, the inverse sigmoidal curve reveals the complete antiferromagnetic state

Nanotechnology in Drug Delivery 144 144
Conclusions Hollow hematite microspheres were prepared without using hard templates by following the gas-bubble template method. Boiling at high temperatures promotes bubble formation on which crystallites agglomerate, crystallize and oxidize to the hematite phase leading in the formation of hollow microspheres. The size and crystallization of the hematite hollow spheres increases with annealing temperature. After annealing at 550 ºC, hollow spheres with mean diameter of 0.889 µm are obtained, whereas after annealing at 600 ºC, hollow spheres of 1.6 µm are obtained. The increase in diameter is accompanied with a slight decrease of the thickness of the shells suggesting that the growth of the hollow spheres depends on the bubble growth. For the samples obtained after annealing at 450, 500 and 600 ºC, thermal hysteresis in the M(T) loops taken in ZFC and FC modes with different TM values were obtained. The thermal hysteresis observed in this work might be caused by remanence zones located in the grain boundaries. Exchange interactions in these zones might also be the responsible in generating the large coercivity observed in this work (~2.7 kOe) since as more crystallites conform the shells, more grain boundaries and different spin alignments there are. Due to the simplicity of the technique presented here for the preparation of hematite hollow spheres, we feel that the results of this work could have important application in the emerging fields of targeted treatment, such as targeted cancer treatment. Our group has pioneered studies of the influence of specially synthesized magnetic nanocomplexes, formed by synthesizing magnetic nanoparticles together with anticancer drugs [187-192], and we have been collected clinical data from animal studies that show a remarkable influence in the survival rates of animals (rats) infected with cancer. The hollow spheres presented here could be used as drug delivery vehicles and potentially this approach could result in replacing chemotherapy with the well known very adverse and serious side effects, with a targeted delivery of the anticancer drug only to the areas of the tumours, for example by directing injection to the solid tumours. Moreover, hyperthermia in which the temperature around solid tumours is raised is also very promising approach in cancer treatment in which we have been working. Since the ferromagnetic behaviour of the hollow hematite spheres is sensed better to higher temperatures than RT, then they can be very suitable candidates as agents of targeted hyperthermia.
Acknowledgements This work was supported by the Engineering and Physical Science Research Council (EPSRC No. EP/J003638/1). The work in Peru was supported by the Ministry of Production through the program "Programa Nacional de Innovación para la Competitividad y Productividad" (Innóvate Perú project No. ECIP-1-P-069-14). The work in Brazil was supported by CNPq (307552/2012-8), CAPES (PNPS-230.007518/2011-11) and FACEPE (APQ-0589-1.05/08).
References
1. X.W. Lou, L.A. Archer, Z.C. Yang, Adv. Mater. 20 (2008) 3987-4019. 2. F. Caruso, Top. Curr. Chem. 227 (2003) 145. 3. F. Caruso, Adv. Mater. 13 (2001) 11.

Nanotechnology in Drug Delivery 145 145
4. W. Schärtl, Adv. Mater. 12 (2000) 1899. 5. R. Pelton, Adv. Colloid Interface Sci. 85 (2000) 1. 6. D. Gan, L. Lyon, J. Am. Chem. Soc. 123 (2003) 7511. 7. C. Jones, L. Lyon, Macromolecules 36 (2003) 1988. 8. F. Caruso, R.A. Caruso, H. Möhwald, Science 282 (1998) 1111. 9. F. Caruso, Chem. Eur. J. 6 (2000) 413. 10. Z. Zhong, Y. Yin, B. Gates, Y. Yia, Adv. Mater. 12 (2000) 206. 11. C.E. Fowler, D. Khushalani, S. Mann, J. Mater. Chem. 11 (2001) 1968. 12. W.R. Zhao, H.R. Chen, Y.S. Li, L. Li, M.D. Lang, J.L. Shi, Adv. Funct. Mater. 16 (2006) 2243. 13. J. Bertling, J. Blömer, R. Kummel, Chem. Eng. Technol. 27 (2004) 829. 14. L.F. Xiao, Y.Q. Zhao, J. Yin, L.Z. Zhang, Chem. Eur. J. 15 (2009) 9442. 15. C. Li, X. Yang, B. Yang, Y. Yan, Y.T. Qian, Eur. J. Inorg. Chem. 2003 (2003) 3534. 16. 13. J. Bao, Y. Liang, Z. Xu, L. Si, Adv. Mater. 15 (2003) 1832. 17. F. Caruso, X. Shi, R.A. Caruso, A. Susha, Adv. Mater. 13 (2001) 740. 18. Y. Hu, J. Chen, W. Chen, X. Lin, X. Li, Adv. Mater. 15 (2003) 726. 19. Y. Jiang, Y.J. Zhu, L.D. Chen, Chem. Lett. 36 (2007) 382. 20. W.W. Wang, Y.J. Zhu, L.X. Yang, Adv. Funct. Mater. 17 (2007) 59. 21. N. Du, H. Zhang, J. Chen, J. Sun, B. Chen, D. Yang, J. Phys. Chem. B 112 (2008) 14836. 22. G.X. Liu, G.Y. Hong, J. Solid State Chem. 178 (2005) 1647. 23. N.A. Dhas, K.S. Suslick, J. Am. Chem. Soc. 127 (2005) 2368-2369. 24. R.A. Caruso, A. Susha, F. Caruso, Chem. Mater. 13 (2001) 400. 25. W. Shen, Y. Zhu, X. Dong, J. Gu, J. Shi, Chem. Lett. 34 (2005) 840. 26. L. Qi, J. Li, J. Ma, Adv. Mater. 14 (2002) 300-303. 27. T. Liu, Y. Xie, B. Chu, Langmuir 16 (2000) 9015-9022. 28. T. Chen, P.J. Colver, S.A.F. Bon, Adv. Mater. 19 (2007) 2286. 29. C. Zimmermann, C. Feldmann, M. Wanner, D. Gerthsen, Small 3 (2007) 1347. 30. D.B. Zhang, L.M. Qi, J.M. Ma, H.M. Cheng, Adv. Mater. 14 (2002) 1499. 31. H.T. Schmidt, A.E. Ostafin, Adv. Mater. 14 (2002) 532-535. 32. X.W. Lou, Y. Wang, C. Yuan, J.Y. Lee, L.A. Archer, Adv. Mater. 18 (2006) 2325.
33. H.C. Zeng, J. Mater. Chem., 16 (2006) 649-662.
34. W.R. Beck, D.L. O' Brien, U.S. Patent No. 3, 365, 315 (23 Jan. 1968).
35. P.A. Howell, U.S. Patent No. 4,391, 646 (5 Jul. 1983).
36. H.J. Marshall, U.S. Patent No. 4, 767, 726 (30 Aug. 1988).
37. H.J. Fan, U. Gösele, M. Zacharias, Small 3 (2007) 1660-1671.
38. Y.D. Yin, R.M. Rioux, C.K. Erdonmez, S. Hughes, G.A. Somorjai, A.P. Alivisatos, Science 304
(2004) 711.
39. F. Aldinger, Acta Metallurgica, 22 (1974) 923-928.
40. J.R. Rodríguez, A. Sevilla, C.M. Bazán, J.M. Gordillo, Annu. Rev. Fluid Mech. 47 (2015)
405-429.
41. Y. Fang, G.Z. Xiao, J. Xin, W.H. Yao, G. Ning, Chin. Phys. B 22 (2013) 104301.
42. C.Z. Wu, Y. Xie, L.Y. Lei, S.Q. Hu, C.Z. OuYang, Adv. Mater. 18 (2006) 1727.
43. X.X. Li, Y.J. Xiong, Z.Q. Li, Y. Xie, Inorg. Chem. 45 (2006) 3493.
44. L. Guo, F. Liang, X.G. Wen, S.H. Yang, L. He, W.Z. Zheng, C.P. Chen, Q.P. Zhong, Adv.
Funct. Mater. 17 (2007) 425.
45. Y.S. Han, G. Hadiko, M. Fuji, M. Takahashi, Chem. Lett. 34 (2005) 152.

Nanotechnology in Drug Delivery 146 146
46. C.L. Jiang, W.Q. Zhang, G.F. Zou, W.C. Yu, Y.T. Qian, Nanotechnology 16 (2005) 551.
47. Q. Peng, Y.J. Dong, Y.D. Li, Angew. Chem., Int. Ed. 42 (2003) 3027.
48. J.L. Zhang, Y. Wang, H. Ji, Y.G. Wei, N.Z. Wu, B.J. Zuo, Q.L. Wang, J. Catal. 229 (2005) 114.
49. O. Shekhah, W. Ranke, A. Schule, G. Kolios, R. Schlogl, Angew. Chem. Int. Ed. 42 (2003)
5760.
50. A.S.C. Brown, J.S.J. Hargreaves, B. Rijniersce, Catal. Lett. 53 (1998) 7.
51. B.C. Faust, M.R. Hoffmann, D.W. Bahnemann, J. Phys. Chem. 93 (1989) 6371.
52. W. Weiss, D. Zscherpel, R. Schlogl, Catal. Lett. 52 (1998) 215.
53. T. Omori, H. Takahashi, H. Mametsuka, E. Suzuki, Phys. Chem. Chem. Phys. 2 (2000)
3519.
54. P. Li, D.E. Miser, S. Rabiei, R.T. Yadav, M.R. Hajaligo, Appl. Catal. B 43 (2003) 151.
55. L.C.A. Oliveira, D.I. Petkowicz, A. Smaniotto, S.B.C. Pergher, Water Res. 38 (2004) 3699.
56. C.H. Lai, C.Y. Chen, Chemosphere 44 (2001) 1177.
57. M.S. Onyango, Y. Kojima, H. Matsuda, A. Ochieng, J. Chem. Eng. Jpn. 36 (2003) 1516.
58. R.C. Wu, J.H. Qu, Y.S. Chen, Water Res. 39 (2005) 630.
59. R.C. Wu, H.H. Qu, H. He, Y.B. Yu, Appl. Catal. B 48 (2004) 49.
60. F. Herrera, A. Lopez, G. Mascolo, E. Albers, J. Kiwi, Appl. Catal. B 29 (2001) 147.
61. J. Chen, L. Xu, W. Li, X. Gou, Adv. Mater. 17 (2005) 58.
62. C.Z. Wu, P. Yin, X. Zhu, C.Z. OuYang, Y. Xie, J. Phys. Chem. B 110 (2006) 110.
63. X.L. Gou, G.X. Wang, J. Park, H. Liu, J. Yang, Nanotechnology 19 (2008) 125605.
64. J.S. Han, T. Bredow, D.E. Davey, A.B. Yu, D.E. Mulcahy, Sens. Actuators B 75 (2001) 18.
65. E. Comini, V. Guidi, C. Frigeri, I. Ricco, G. Sberveglieri, Sens. Actuators B 77 (2001) 16.
66. H. Zeng, J. Li, J.P. Liu, Z.L. Wang, S.H. Sun, Nature 420 (2002) 95.
67. A. Jordan, R. Scholz, K. Maier-Hauff, M. Johannsen, P. Wust, J. Nadobny, H. Schirra, H.
Schmidt, S. Deger, S. Loening, W. Lanksch, R. Felix, J. Magn. Magn. Mater. 225 (2001)
118.
68. A.K. Gupta, M. Gupta, Biomaterials 26 (2005) 3995.
69. L. Pauling, S.B. Hendricks, J. Am. Chem. Soc. 47 (1925) 781.
70. G. Gollmann, A. Rohrbach, P. Entel, J. Hafner, Phys. Rev. B 69 (2004) 165107.
71. T.J. Park, S.S. Wong, Chem. Mater. 18 (2006) 5289.
72. Y.Y. Zhang, Q.J. Zheng, J. Phys. Chem. B 110 (2006) 3093.
73. C.Q. Hu, Z.H. Gao, X.R. Yang, Mater. Chem. Phys. 104 (2007) 429.
74. S. Komarneni, R. Roy, Q.H. Li, Mater. Res. Bull. 27 (1992) 1393.
75. H. Katsuki, S.J. Komarneni, J. Am. Ceram. Soc. 84 (2001) 2313.
76. S.B. Wang, Y.L. Min, S.H. Yu, J. Phys. Chem. C 111 (2007) 3551.
77. B. Hou, Y. Wu, L. Wu, Y. Shi, K. Zou, H. Gai, Mater. Lett. 60 (2006) 3188-3191.
78. X.L. Hu, J.C. Yu, J.M. Gong, Q. Li, G.S. Li, Adv. Mater. 19 (2007) 2324.
79. Y.L. Chueh, M.W. Lai, J.Q. Liang, L.J. Chou, Z.L. Wang, Adv. Funct. Mater. 16 (2006) 2243.
80. X.G. Wen, S.H. Wang, Y. Ding, Z.L. Wang, S.H. Yang, J. Phys. Chem. B 109 (2005) 215-220.
81. J.J. Wu, Y.L. Lee, H.H. Chiang, D.K.P. Wong, J. Phys. Chem. B 110 (2006) 18108.
82. L. Liu, H.Z. Kou, W.L. Mo, H.J. Liu, Y.Q. Wang, J. Phys. Chem. B 110 (2006) 15218-15223.
Nanotechnology in Drug Delivery 147 147
83. C.R. Gong, D.R. Chen, X.L. Jiao, Q.L. Wang, J. Mater. Chem. 12 (2002) 1844.
84. M.V. Reddy, T. Yu, C.H. Sow, Z.X. Shen, C.T. Lim, G.V.S. Rao, B.V.R. Chowdari, Adv. Funct.
Mater. 17 (2007) 2792.
85. D.B. Wang, C.X. Song, G.H. Gu, Z.S. Hu, Mater. Lett. 59 (2005) 782.
86. S.Z. Li, H. Zhang, J.B. Wu, X.Y. Ma, S.R. Yang, Cryst. Growth Des. 6 (2006) 351-353.
87. S.W Cao, Y.J. Zhu, J. Phy. Chem. C 112 (2008) 6253-6257.
88. C. Jia, Y. Cheng, F. Bao, D.Q. Chen, Y.S. Wang, J. Cryst. Growth 294 (2006) 353-357.
89. X.L. Hu, J.C. Yu, J.M. Gong, J. Phys. Chem. C 111 (2007) 11180.
90. Y. Zhang, Y. Chu, L. Dong, Nanotechnology 18 (2007) 435608.
91. D. Jagadeesan, U. Mansoori, P. Mandal, A. Sundaresan, M. Eswaramorthy, Angew. Chem.
Int. Ed. 47 (2008) 7685-7688.
92. S. Xu, C.M. Hessel, H. Ren, R. Yu, Q. Jin, M. Yang, H. Zhao, D. Wang, Energy Environ. Sci. 7
(2014) 632-637.
93. L. Sun, M. Cao, C. Hu, Solid. State Sci. 12 (2010) 2020-2023.
94. L. Wang, X. Lu, C. Han, R. Lu, S. Yang, X. Song, CrystEngComm 16 (2014) 10618-10623.
95. Q. Dong, N. Kumada, Y. Yonesaki, T. Takei, N. Kinomura, D. Wang, J. Mater. Sci. 45 (2010)
5685-5691.
96. L. Li, Y. Chu, Y. Liu, L. Dong, J. Phys. Chem. C 111 (2007) 2123-2127.
97. J. Ma, K. Chen, Phys. Status Solidi RRL 6 (2012) 324-326.
98. I. Opačak, M. Ristid, S. Musid, Mater. Lett. 64 (2010) 2555-2558.
99. H.J. Song, N. Li, X.Q. Shen, Appl. Phys. A 102 (2011) 559-563.
100. P. Sun, Z. Zhu, P. Zhao, X. Liang, Y. Sun, F. Liu, G. Lu, Cryst. Eng. Comm. 14 (2012) 8335-
8337.
101. B.D. Mao, Z.H. Kang, E.B. Wang, C.G. Tian, Z.M. Zhang, C.L. Wang, Y. L. Song, M.Y. Li, J.
Solid State Chem. 180 (2007) 489-495.
102. S. Ni, S. Lin, Q. Pan, F. Yang, K. Huang, X. Wang, D. He, J. Alloys Compd. 478 (2009) 876-
879.
103. S. Lian, E. Wang, L. Gao, D. Wu, Y. Song, L. Xu, Mater. Res. Bull. 41 (2006) 1192-1198.
104. J.H. Bang, K.S. Suslick, J. Am. Chem, Soc. 129 (2007) 2242-2243.
105. A. Rolland (Ed.), Pharmaceutical Particulate Carriers, Marcel Dekker, New York, 1993. 106. G. Gregoriadis (Ed.), Liposomes as Drug Carriers, John Wiley and Sons, New York, 1988. 107. R. Müller, Carriers for Controlled Drug Delivery and Targeting, CRC Press, Boca Raton,
1991. 108. M.J. Alonso, Nanomedicines for overcoming biological barriers, Biomed. Pharmacother.
58 (2004) 168–172. 109. A.P. Torchilin, Adv. Drug Delivery Rev. 58 (2006) 1532-1555. 110. M. Tian, W. Lu, R. Zhang, C. Xiong, J. Ensor, J. Nazario, J. Jackson, C. Shaw, K.A. Dixon, J.
Miller, K. Wright, C. Li, S. Gupta, Mol. Imaging Biol. 15 (2013) 614-624. 111. L. Guo, I. Panderi, D.D. Yan, K. Szulak, Y. Li, Y.T Chen, H. Ma, D.B. Niesen, N. Seeram, A.
Ahmed, B. Yan, D. Pantazatos, W. Lu, ACS Nano 7 (2013) 8780-8793. 112. S. Ivanov, S. Zhuravsky, G. Yukina, V. Tomson, D. Korolev, M. Galagudza, Materials 5
(2012) 1873-1889.

Nanotechnology in Drug Delivery 148 148
113. W. Wei, Z. Yue, J. Qu, H. Yue, Z. Su, G. Ma, Nanomedicine 5 (2010) 589. 114. C. Lipinski, Am. Pharm. Rev. 2 (2002) 82. 115. Z. Yue, W. Wei, Z. You, Q. Yang, H. Yue, Z. Su, G. Ma, Adv. Funct. Mater. 21 (2011) 3446. 116. C. Wischke, S. Schwendeman, Int. J. Pharm. 364 (2008) 298. 117. C. Lipinski, F. Lombardo, B. Dominy, P. Feeney, Adv. Drug Delivery Rev. 46 (2001) 3. 118. Y. Zhu, J. Lei, Y. Tian, Dalton Trans. 43 (2014) 7275-7281. 119. American Conference of Governmental Industrial Hygienists TLVs and BEIs. Threshold
Limit Values for Chemical Substances and Physical Agents and Biological Exposure Indices. Cincinnati, OH, 2008, p. 35.
120. IARC. Monographs on the Evaluation of the Carcinogenic Risk of Chemicals to Humans. Geneva: World Health Organization, International Agency for Research on Cancer, 1972-PRESENT. Available at: http://monographs.iarc.fr/ENG/Classification/index.php p. S7 64 (1987).
121. L. León, A. Bustamante, A. Osorio, G.S. Loarte, L. de los Santos Valladares, C.H.W. Barnes, Y. Majima, Hyperfine Interact. 202 (2011) 131-137.
122. L. De Los Santos Valladares, L. León Félix, S.M Espinoza Suárez, A.G. Bustamante Domínguez, T. Mitrelias, S. Holmes, N.O Moreno, J. Albino Aguiar, C.H.W. Barnes, Mat. Chem. Phys. Doi: 10.1016/j.matchemphys.2015.11.021
123. D. Jagadeesan, U. Mansoori, P. Mandal, A. Sundaresan, M. Eswaramoorthy, Angew. Chem. Int. Ed. 47 (2008) 7685-7688.
124. Bernard Dennis Cullity, Elements of X-ray Diffraction, third ed., Prentice-Hall, Prentice-Hall International, Upper Saddle River, NJ, London, 2000.
125. H. M. Rietveld, J. Appl. Cryst, 2 (1969) 65.
126. K. Momma, F. Izumi, J. Appl. Crystallogr. 44 (2011) 1272-1276.
127. G. K. Williamson and W. H. Hall, Acta Metall, 1 (1953) 22.
128. Aragón, F.H., de Souza, P.E.N., Coaquira, J.A.H., Hidalgo, P., Gouvêa, D.: Physica B 407
(2012) 2601.
129. L. León-Félix, J. Chaker, M. Parise, J.A.H. Coaquira, L. De Los Santos Valladares, A.
Bustamante, V.K. Garg, A.C. Oliveira, P.C. Moris, Hyperfine Interact. 224 (2014) 179-188.
130. W. Kim, C.Y. Suh, S.W. Cho, K.M. Roh, H. Kwon, K. Song, I.J. Shon, Talanta 94 (2012) 348-
352.
131. J. Zhang, L.X. Rong, Y. Liu, B.Z. Dong, Mat. Sci. Eng. A351 (2003) 224–227.
132. K. Haneda, A.H. Morrish, J. Physique, Sup. 4, 38 (1977) C1-321–323.
133. R. Zboril, M. Mashlan, D. Petridis, Chem. Mater. 14 (2002) 969.
134. X. Wang, X.Y. Chen, X.C. Ma, H.G. Zheng, M.R. Ji, Z. Zhang, Chem. Phys. Lett. 384 (2004)
391.
135. Q. Dong, D. Wang, J. Yao, N. Kumada, N. Kinomura, T. Takei, Y. Yonesaki, Q. Cai, J. Ceram.
Soc. Jpn 117 (2009) 245-248.
136. R. Parmar, S.K. Majumder, Chem. Eng. Process.: Process Intensification 64 (2013) 79-97.
137. K.H. Moh, Mat. Res. Soc. Symp. Proc. 372 (1995) 15-23.
138. L. De Los Santos Valladares, A. Bustamante Domínguez, J. Llandro, S. Holmes, O. Avalos
Quispe, R. Langford, J. Albino Aguiar, C.H.W. Barnes, Appl. Surf. Sci. 316 (2014) 15-21.
139. X. Chen, Z. Zhang, X. Li, C. Shi, Chem. Phys. Lett. 422 (2006) 294-298.
140. J. Kim, Int. J. Multiph. Flows 35 (2009) 1067-1076.

Nanotechnology in Drug Delivery 149 149
141. Y.Y. Hsu, J. Heat Transfer. 84 (1962) 207-213.
142. J. Verhoogen, Am. J. Sci. 249 (1951) 729-739.
143. C. Huber, Y. Su, C.T. Nguyen, A. Parmigiani, H.M. Gonnermann, J. Dufek, J. Geophys. Res.
Solid Earth 119 (2014) 216-239.
144. Z. Wu, K. Yu, S. Zhang, Y. Xie, J. Phys. Chem. C 112 (2008) 11307-11313.
145. M.F. Hansen, C.B. Koch, S. Morup, Phys. Rev. B 62 (2000) 1124-1134.
146. C. Frandsen, C.R.H. Bahl, B. Lebech, K. Lefmann, L.T. Kuhn, L. Keller, N.H. Andersen, M.v.
Zimmermann, E. Johnson, S.N. Klausen, S. Morup, Phys. Rev. B 72 (2005) 214406.
147. F.J. Morin, Phys. Rev. 78 (1950) 819.
148. C.G. Shull, W.A. Strauser, E.O. Wollan, Phys. Rev. 83 (1951) 333.
149. R.D. Zysler, M. Vasquez-Mansilla, C. Arciprete, M. Dimitrijewits, D. Rodríguez-Sierra, C.
Saragovi, J. Magn. Magn. Mater. 224 (2001) 39-48.
150. F. Bodker, M.F. Hansen, C.B. Koch, K. Lefmann, S. Morup, Phys. Rev. B 61 (2000) 6826-
6838.
151. S.H. Gee, Y.K. Hong, J.C. Sur, D.W. Erickson, M.H. Park, F. Jeffers, IEE Trans. Magn. 40
(2004) 2691-2693.
152. H. Chow, F. Keffer, Phys. Rev. B 10 (1974) 243.
153. N. Amin, S. Arajs, Phys. Rev. B 35 (1987) 4810.
154. N.A. Curry, G.B. Johnston, P.J. Besser, A.H. Morish, Phil. Mag. 12 (1965) 221-228.
155. T. Ericsson, A. Krisnhamurthy, B.K. Srivastava, Physica Scripta 33 (1986) 88-90.
156. S.A. Schetinkin, E. Wheeler, V.V. Kvardakov, M. Schlender, J. Baruchel, J. Phys. D: Appl.
Phys. 36 (2003) A118.
157. D. Schoeer, R.C. Nininger, Phys. Rev. Lett. 19 (1967) 623-634.
158. G.H. Muench, S. Arajs, E. Matijeviae, Phys. Status Solidi A 92 (1985) 187-192.
159. D.L. Williamson, E.L. Venturini, R.A. Graham, B. Morison, Phys. Rev. B 34 (1986) 1899-
1907.
160. P.J. Besser, A.H. Morrish, Phys. Lett. 13 (1964) 289-290.
161. Ö. Özdemir, D.J. Dunlop, Geochem. Geophys. Geosist. 9 (2008) Q10Z01.
162. R.D. Zysler, D. Fiorani, A.M. Tesla, L. Suber, E. Agnostinelli, M. Godinho, Phys. Rev. B 68
(2003) 212408.
163. J.L. Dromann, J.R. Cui, C.J. Sella, J. Appl. Phys. 57 (1985) 4283.
164. W. Kundig, H. Bommel, G. Constabaris, R.H. Lindquist, Phys. Rev. 142 (1966) 327-333.
165. C. Wu, P. Yin, C. Ou Yang, Y. Xie, J. Phys. Chem. B 110 (2006) 17806.
166. C.B. de Boer, T.A.T. Mullender, M.J. Dekkers, Geophys. J. Int. 146 (2001) 201.
167. D. Schroeer, R.C. Nininger, Phys. Rev. Lett. 19 (1967) 623-634.
168. M. McElfresh, Fundamentals of Magnetism and Magnetic Measurements, Featuring
Quantum Design's Magnetic Property Measurement Systems, Quantum Design, Inc.,
1994, San Diego, CA, USA
169. F. Walz, J. Phys.: Condens. Matter 14 (2002) R285-R340.
170. E.J. Verwey, Nature 144 (1939) 327-328.

Nanotechnology in Drug Delivery 150 150
171. A. Bhattacharjee, D. Roy, M. Roy, S. Chakraborty, A. De, J. Kusz, W. Hofmeister, J. Alloys
Compd. 503 (2010) 449-453.
172. P. Piekarz, K. Parlinski, A.M. Oles, Phys. Rev. B (2007) 165124-165139.
173. C. Luna, V. Vega, V.M. Prida, R. Mendoza-Reséndez, J. Nanosci. Nanotechnol. 12 (2012)
7571-7576.
174. L. Suber, P. Imperatori, A. Mari, G. Marchegiani, M. Vasquez Mansilla, D. Fiorani, W.R.
Plunkett, D. Rinaldi, C. Cannas, G. Ennas, D. Peddis, Phys. Chem. Chem. Phys. 12 (2010)
6984-6989.
175. P.J. Flanders, J. Appl. Phys. 40 (1969) 1247-1248.
176. V.G. Labushkin, N.N. Faleev, V.A. Figin, A.S. Tsaprilov, Sov. Phys. Solid State 18 (1976)
1658-1659.
177. R.C. Nininger, D. Scroeer, J. Phys. Chem. Solids 39 (1978) 137-144.
178. K.B. Vlasov, E.A. Rozenberg, V.I. Timoshchuk, Y.G. Smorodinskii, Sov. Phys. Solid State 28
(1986) 1851-1853.
179. G.F. Goya, M. Veith, R. Rapalavicuite, H. Shen, S. Mathur, Appl. Phys. A 80 (2005) 1523-
1526.
180. P.G. Bercoff, H.R. Bertorello, M.J. Oliva, Physica B 398 (2007) 204-207.
181. H. Chow, F. Keffer, Phys. Rev. B 10 (1974) 243-254.
182. C. Frandsen, M. Morup, Phys. Rev. Lett. 94 (2005) 027202.
183. Ö. Özdemir, D.J. Dunlop, J. Geophys. Res. Solid Earth 119 (2014) 2582-2594.
184. H. Cao, G. Wang, J.H. Warner, A.A.R. Watt, Appl. Phys. Lett. 92 (2008) 013110.
185. X.M. Liu, S.Y. Fu, H.M. Xiao, C.J. Huang, J. Solid State Chem. 178 (2005) 2798-2803.
186. C. Rath, K.K. Sahu, S.D. Kulkarni, S. Anand, S. Anand, S.K. Date, R.P. Das, N.C. Mishra,
Appl. Phys. Lett. 75 (1999) 4171-4173.
187. V.A.J. Silva, P.L. Andrade, A.G Bustamante Domínguez, L. De Los Santos Valladares, M.S.
Mejía Santillan, I.A. Souza, K.P.S. Cavalcanti, M.P.C. Silva, J. Albino Aguiar, Hyperfine
Interact. 224 (2014) 227-238.
188. J.A. Ramos Guivar, A. Bustamante Domínguez, J. Flores, M. Mejía Santillan, A.M. Osorio,
A.I. Martínez, L. de los Santos Valladares, C.H.W. Barnes, Hyperfine Interact. 224 (2014)
89-97.
189. J.A. Ramos Guivar, A.I. Martínez, A.M. Osorio Anaya, L. de los Santos Valladares, L. León
Félix, A.G. Bustamante Domínguez, Adv. Nanoparticles 3 (2004) 114-121.
190. P.L. Andrade, V.A.J. Silva, J.C. Maciel, M. Mejía Santillan, N.O. Moreno, L. de los Santos
Valladares, A. Bustamante, S.M.B. Pereira, M.P.C. Silva, J. Albino Aguiar, Hyperfine
Interact. 224 (2014) 217-225.
191. V.A. Silva, P.L. Andrade, M.P.C. Silva, A. Bustamante Domínguez, L. de los Santos
Valladares, J. Albino Aguiar, J. Magn. Magn. Mater. 343 (2013) 138-143.
192. L. de los Santos Valladares, J. Llandro, D. Lee, T. Mitrelias, J.J. Palfreyman, T.J. Hayward, J.
Cooper, J.A.C. Bland, C.H.W. Barnes, J. Arroyo Cuyubamba, M. Lees, J. Magn. Magn.
Mater. 321 (2009) 2129-2134.