hodge_hkie 2016
TRANSCRIPT

http://globalchange.mit.edu/
The HKIE Environmental Division Annual Forum April 18, 2016
Global experience in carbon pricing: potential implications for Mainland
China and Hong Kong
Joshua Hodge Contact:

http://globalchange.mit.edu/
Carbon Pricing: Theory
• A price on a pollutant, like CO2 or more generally Greenhouse Gases (GHGs)—comes about:
– through a tax set by a government or – by the establishment of a market for
pollution allowances that can be traded
http://globalchange.mit.edu/
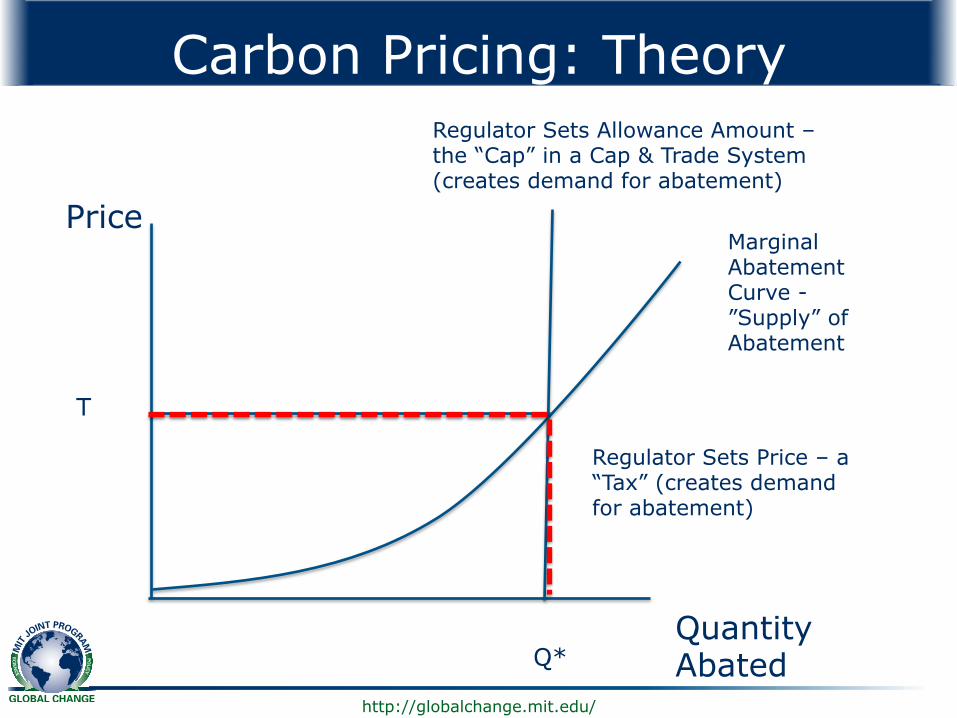
Carbon Pricing: Theory
Quantity Abated
Price Marginal Abatement Curve - ”Supply” of Abatement
Regulator Sets Allowance Amount – the “Cap” in a Cap & Trade System (creates demand for abatement)
P* T
Q Q*
Regulator Sets Price – a “Tax” (creates demand for abatement)

http://globalchange.mit.edu/
Differences between Tax and Cap and Trade
• With a tax the price is set and is invariant (unless or until the regulator changes it) but the quantity emitted is uncertain.
• With Cap and Trade, the allowable emissions are set with certainty (unless or until the regulator changes it) and the price is uncertain.
• Theoretical work has demonstrated an efficiency preference for a fixed price (i.e. tax) over cap and trade when there is uncertainty and the abatement cost is more sensitive to that uncertainty than the damages from the pollution. – But this difference is exaggerated by the implicit assumption
that the tax or cap is set once and for all and by the nature of the uncertainty—is cost uncertainty noise around a trend
http://globalchange.mit.edu/
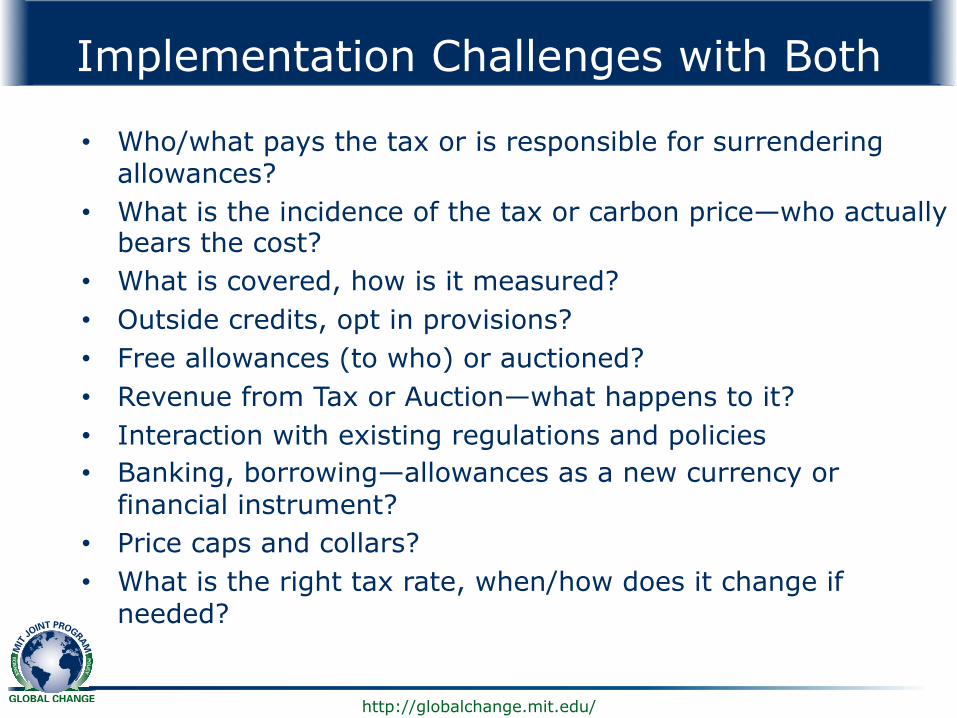
Implementation Challenges with Both
• Who/what pays the tax or is responsible for surrendering allowances?
• What is the incidence of the tax or carbon price—who actually bears the cost?
• What is covered, how is it measured? • Outside credits, opt in provisions? • Free allowances (to who) or auctioned? • Revenue from Tax or Auction—what happens to it? • Interaction with existing regulations and policies • Banking, borrowing—allowances as a new currency or
financial instrument? • Price caps and collars? • What is the right tax rate, when/how does it change if
needed?
http://globalchange.mit.edu/
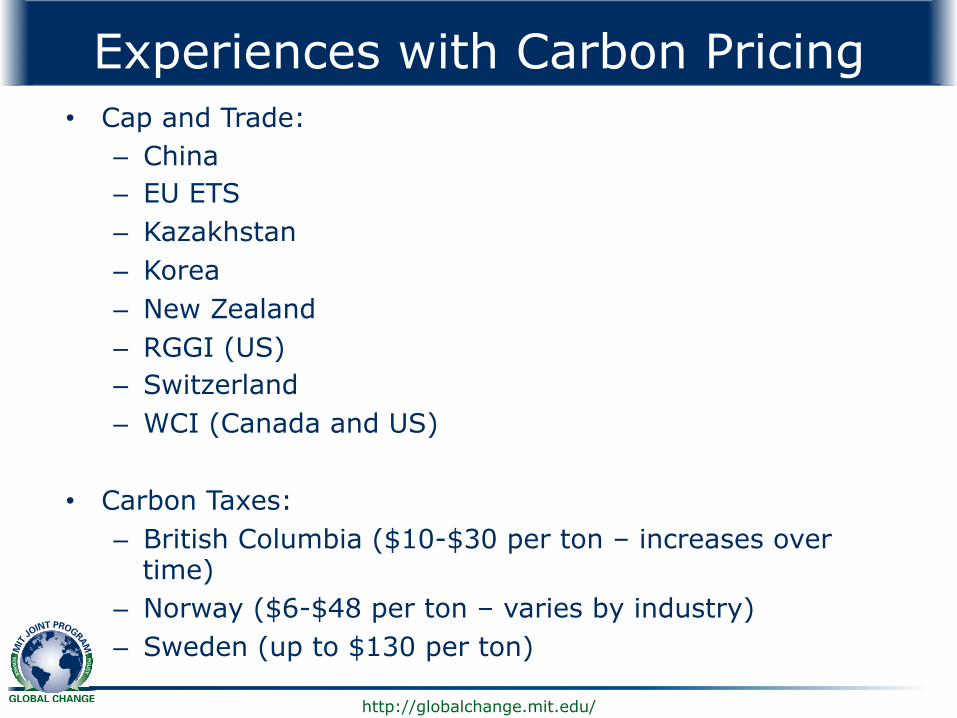
Experiences with Carbon Pricing • Cap and Trade:
– China – EU ETS – Kazakhstan – Korea – New Zealand – RGGI (US) – Switzerland – WCI (Canada and US)
• Carbon Taxes: – British Columbia ($10-$30 per ton – increases over
time) – Norway ($6-$48 per ton – varies by industry) – Sweden (up to $130 per ton)
http://globalchange.mit.edu/
Let us take a closer look at Cap and Trade…
http://globalchange.mit.edu/
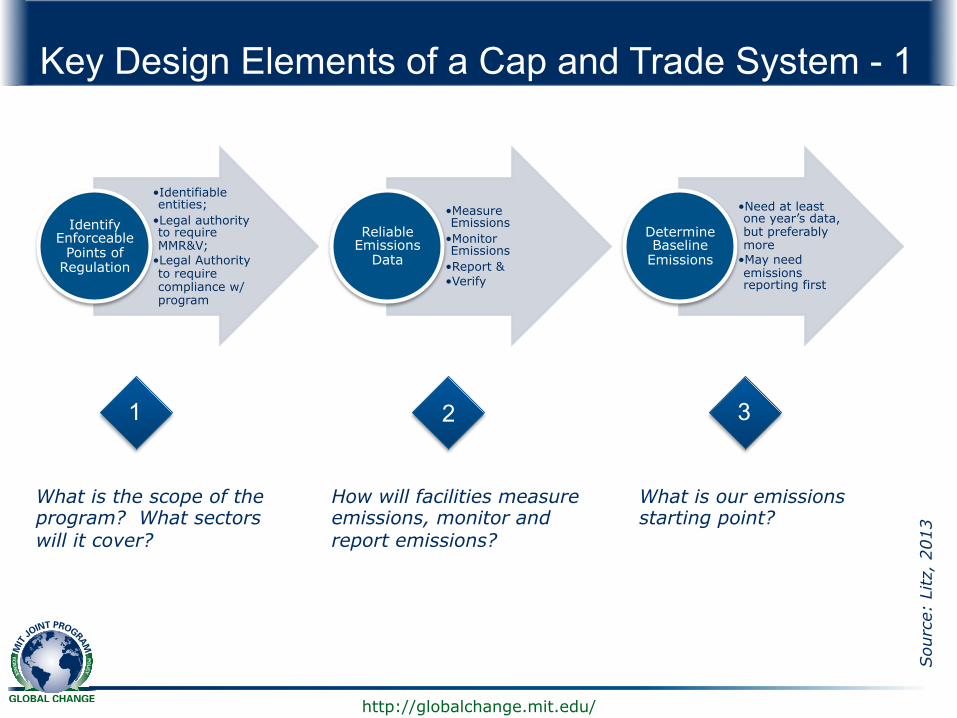
• Identifiable entities;
• Legal authority to require MMR&V;
• Legal Authority to require compliance w/ program
Identify Enforceable
Points of Regulation
• Measure Emissions
• Monitor Emissions
• Report & • Verify
Reliable Emissions
Data
• Need at least one year’s data, but preferably more
• May need emissions reporting first
Determine Baseline
Emissions
1 2 3
What is the scope of the program? What sectors will it cover?
How will facilities measure emissions, monitor and report emissions?
What is our emissions starting point?
Sou
rce:
Litz
, 20
13
Key Design Elements of a Cap and Trade System - 1
http://globalchange.mit.edu/
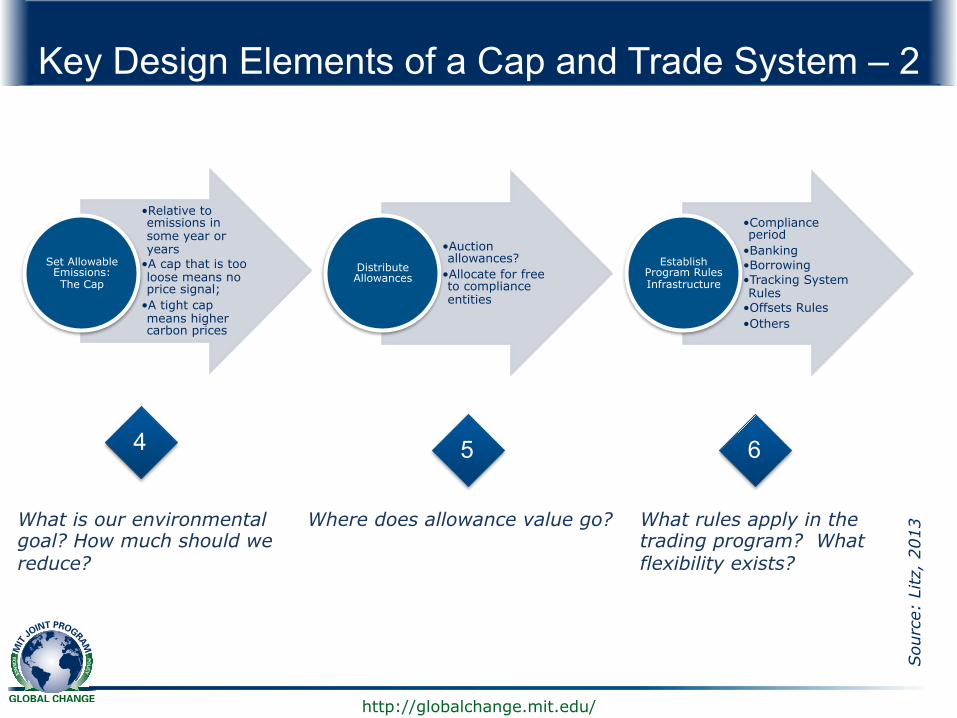
Key Design Elements of a Cap and Trade System – 2
• Relative to emissions in some year or years
• A cap that is too loose means no price signal;
• A tight cap means higher carbon prices
Set Allowable Emissions: The Cap
• Auction allowances?
• Allocate for free to compliance entities
Distribute Allowances
• Compliance period
• Banking • Borrowing • Tracking System Rules
• Offsets Rules • Others
Establish Program Rules Infrastructure
4
What is our environmental goal? How much should we reduce?
5 6
Where does allowance value go? What rules apply in the trading program? What flexibility exists?
Sou
rce:
Litz
, 20
13
http://globalchange.mit.edu/
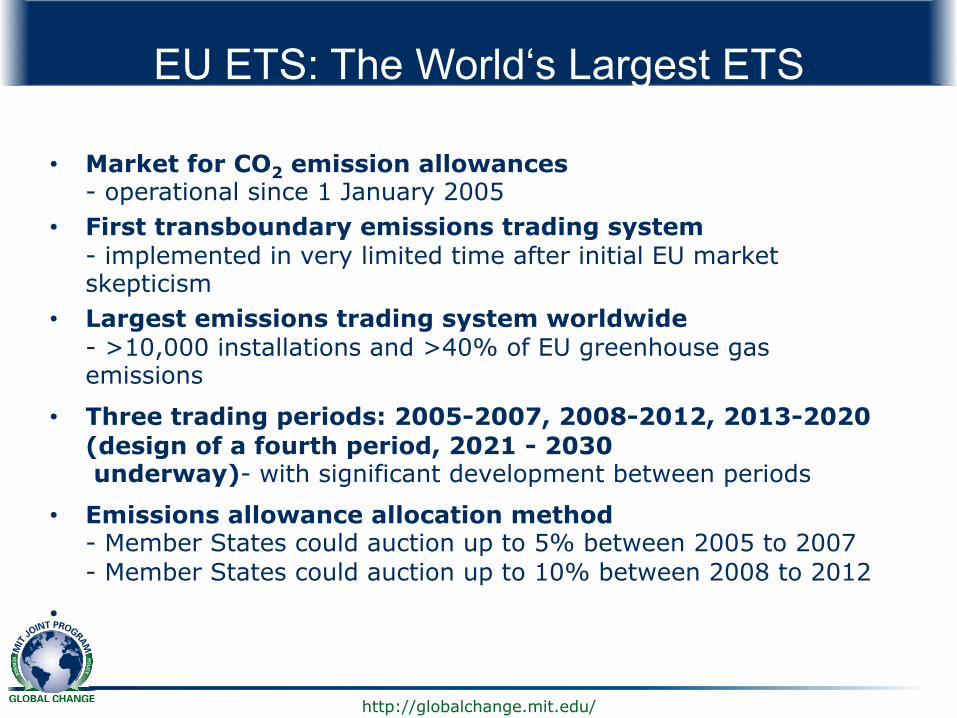
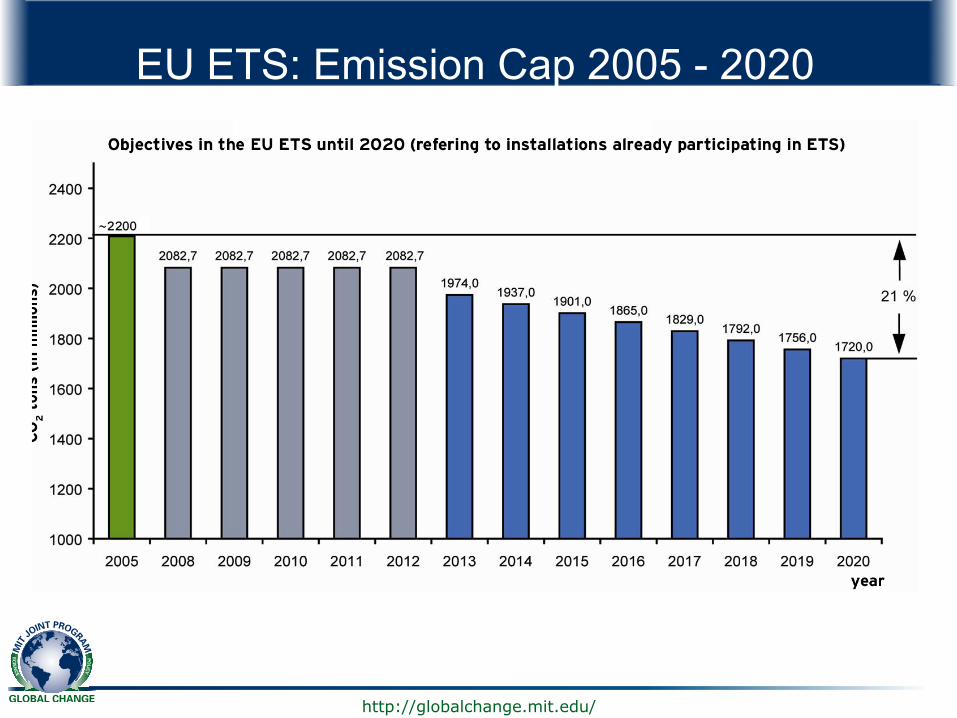
EU ETS: The World‘s Largest ETS
• Market for CO2 emission allowances - operational since 1 January 2005
• First transboundary emissions trading system - implemented in very limited time after initial EU market skepticism
• Largest emissions trading system worldwide - >10,000 installations and >40% of EU greenhouse gas emissions
• Three trading periods: 2005-2007, 2008-2012, 2013-2020 (design of a fourth period, 2021 - 2030 underway)- with significant development between periods
• Emissions allowance allocation method - Member States could auction up to 5% between 2005 to 2007 - Member States could auction up to 10% between 2008 to 2012
•
http://globalchange.mit.edu/
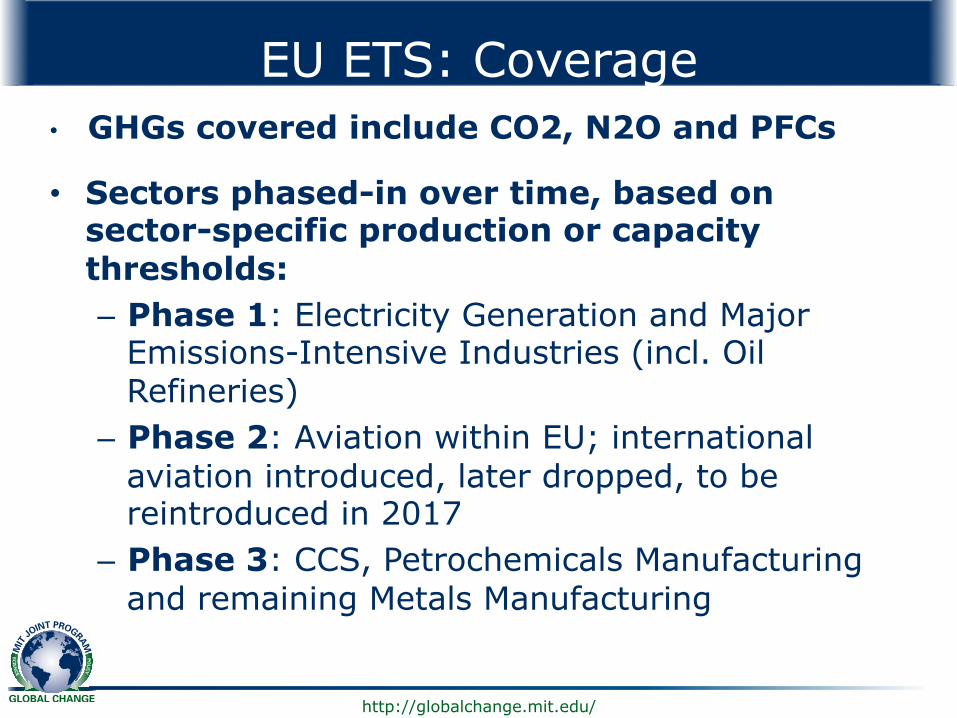
EU ETS: Coverage
• Sectors phased-in over time, based on sector-specific production or capacity thresholds: – Phase 1: Electricity Generation and Major
Emissions-Intensive Industries (incl. Oil Refineries)
– Phase 2: Aviation within EU; international aviation introduced, later dropped, to be reintroduced in 2017
– Phase 3: CCS, Petrochemicals Manufacturing and remaining Metals Manufacturing
• GHGs covered include CO2, N2O and PFCs
http://globalchange.mit.edu/
EU ETS: Emission Cap 2005 - 2020

http://globalchange.mit.edu/
How has the EU ETS fared?

http://globalchange.mit.edu/
EU ETS: A Timeline
EU ETS 1st Trading Period
EU ETS 2nd Trading Period
EU ETS 3rd Trading Period
2005 – 2007 2008 – 2012 2013 - 2020 and
thereafter
Pilot phase: learning by doing
Stabilization and further operationalization
First Kyoto Protocol Commitment Period
Consolidation and EU-wide
harmonization
Nucleus of a linked carbon market
http://globalchange.mit.edu/
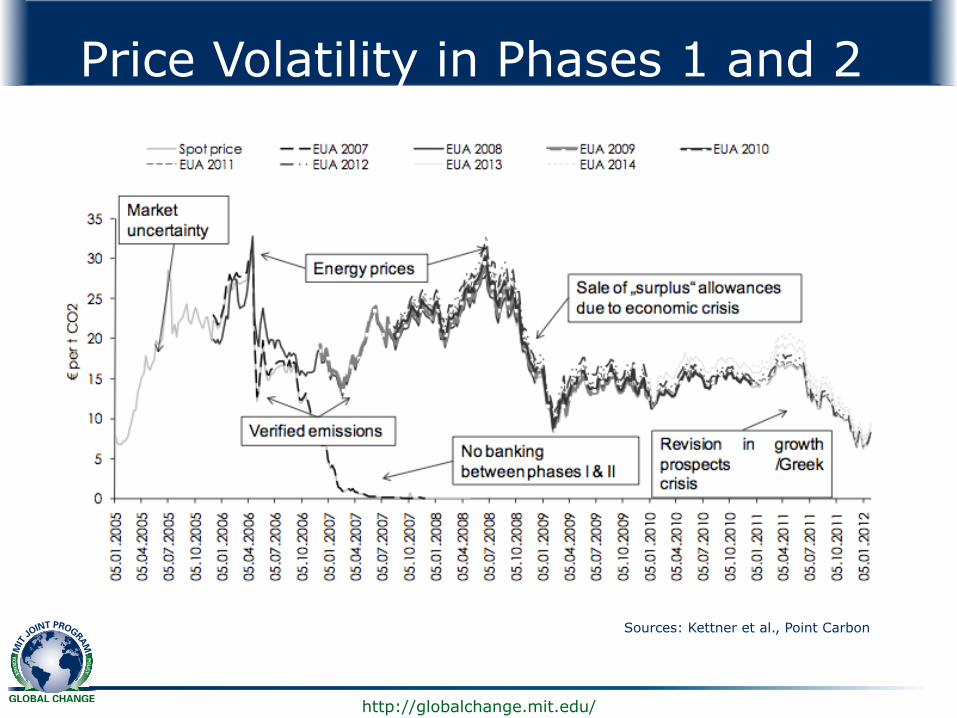
Price Volatility in Phases 1 and 2
Sources: Kettner et al., Point Carbon
http://globalchange.mit.edu/
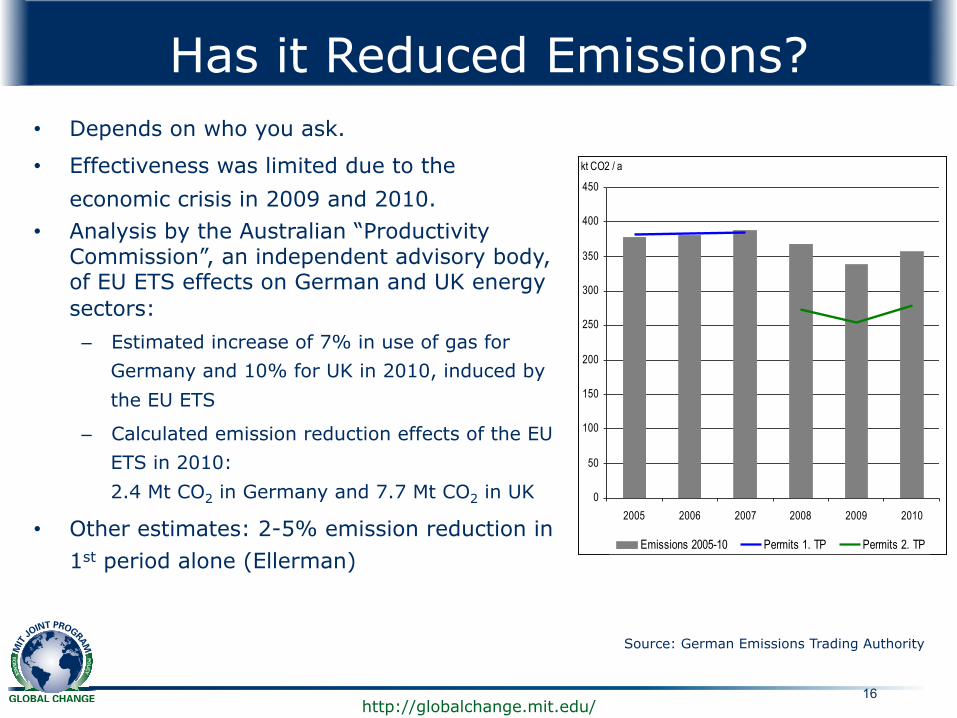
• Depends on who you ask.
• Effectiveness was limited due to the economic crisis in 2009 and 2010.
• Analysis by the Australian “Productivity Commission”, an independent advisory body, of EU ETS effects on German and UK energy sectors:
– Estimated increase of 7% in use of gas for Germany and 10% for UK in 2010, induced by the EU ETS
– Calculated emission reduction effects of the EU ETS in 2010: 2.4 Mt CO2 in Germany and 7.7 Mt CO2 in UK
• Other estimates: 2-5% emission reduction in 1st period alone (Ellerman)
16
0
50
100
150
200
250
300
350
400
450
2005 2006 2007 2008 2009 2010
kt CO2 / a
Emissions 2005-10 Permits 1. TP Permits 2. TP
Source: German Emissions Trading Authority
Has it Reduced Emissions?
http://globalchange.mit.edu/
Key Lessons from the EU ETS • Cap-Setting: too generous in the first trading period?
– Protecting domestic industries vs. integrity, effectiveness of the scheme
• Allocation: gradually moving away from free allocation
– Political haggling: Allowances are an asset worth 30 – 50 billion Euro
– Keep allocation and cap-setting separate
– Auctioning revenue important benefit
• Let the market work! – Carbon prices in the EU have been undermined by the
implementation of overlapping energy and environmental policies including: § Renewable energy subsidies (esp. in Germany) § Energy efficiency mandates
http://globalchange.mit.edu/
Now, let us take at look plans for Cap and Trade in Mainland China…

http://globalchange.mit.edu/
Pilot Cap and Trade Systems in Mainland China
• As part of the 12th Five-Year Plan, the Chinese government selected seven areas to establish pilot emissions trading systems. These are located in: – Beijing – Tianjin – Shanghai – Chongqing – Hubei – Guangzhou – Shenzhen

http://globalchange.mit.edu/
National ETS for Mainland China • In September 2015, China announced that it would launch
a national emission trading system in 2017. – The ETS will cover power generation, steel, cement and
other key industrial sectors – The system will impose caps on ~10,000 companies
when it launches in 2017, regulating 3 – 4 billion tons of CO2
– The ETS was the centerpiece of the the Chinese commitment (INDC) at COP 21 in Paris
• China is expected to retain the ETS pilots even after the national system debuts. – The government’s expectation is that carbon prices
among exchanges will tend to unify based on a national standard of quota allocation

http://globalchange.mit.edu/
Linking Hong Kong to a Mainland ETS
• The Guangzhou and Shenzhen ETS’s have long sought to link their systems to Hong Kong.
• In January 2016, Hong Kong announced a new target of reducing the city’s energy intensity by 40% by 2025.
• In February 2016, Xie Zhenhua, China’s special representative for climate change, formally invited Hong Kong to join the new National ETS.

http://globalchange.mit.edu/
Coverage: How do the Systems Compare?
Region GHGs Covered CO2 emissions (Mton)
Share of total emissions
Direct or indirect emissions
Number of covered entities
Emissions threshold for coverage (tons Co2/year)
Historical emissions period
EU-ETS (Phase 1)
CO2 2014 47% Direct 11,500 >10,000 1996 - 2004
Guangzhou CO2 209 42% Direct & Indirect
830 >20,000 2010-2012
Shenzhen CO2 32 40% Direct & indirect
635 >5000 2009-2011
National ETS (planned)
CO2 TBD TBD TBD ~10,000 TBD TBD
Source: Zhang et. al, 2014
http://globalchange.mit.edu/
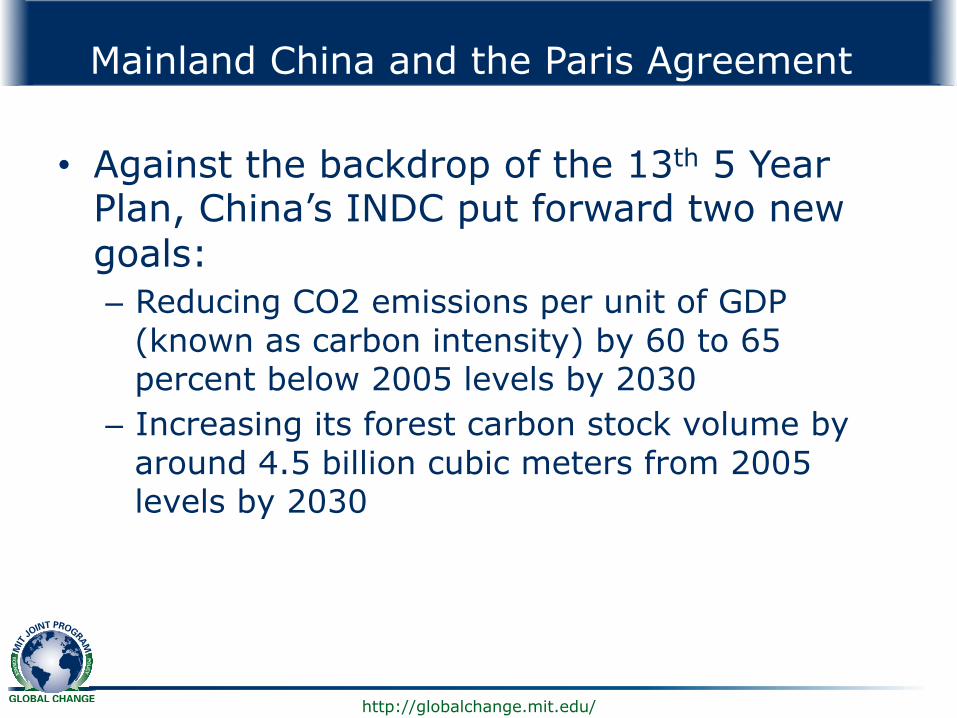
Mainland China and the Paris Agreement
• Against the backdrop of the 13th 5 Year Plan, China’s INDC put forward two new goals: – Reducing CO2 emissions per unit of GDP
(known as carbon intensity) by 60 to 65 percent below 2005 levels by 2030
– Increasing its forest carbon stock volume by around 4.5 billion cubic meters from 2005 levels by 2030
http://globalchange.mit.edu/
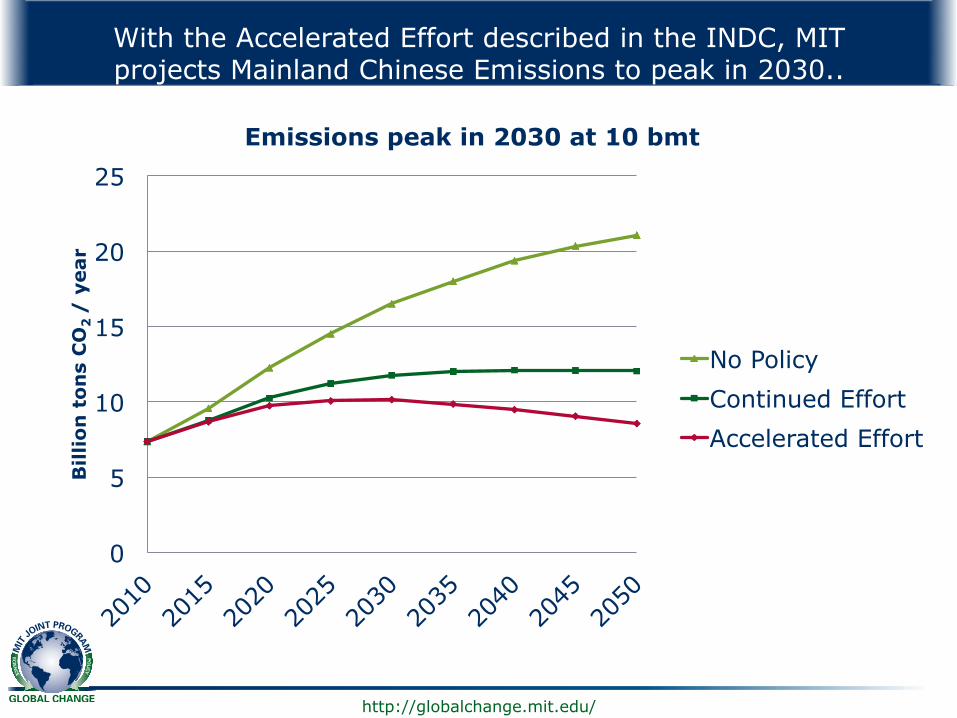
With the Accelerated Effort described in the INDC, MIT projects Mainland Chinese Emissions to peak in 2030..
0
5
10
15
20
25
Bill
ion
ton
s C
O2
/ y
ear
Emissions peak in 2030 at 10 bmt
No Policy Continued Effort Accelerated Effort
http://globalchange.mit.edu/
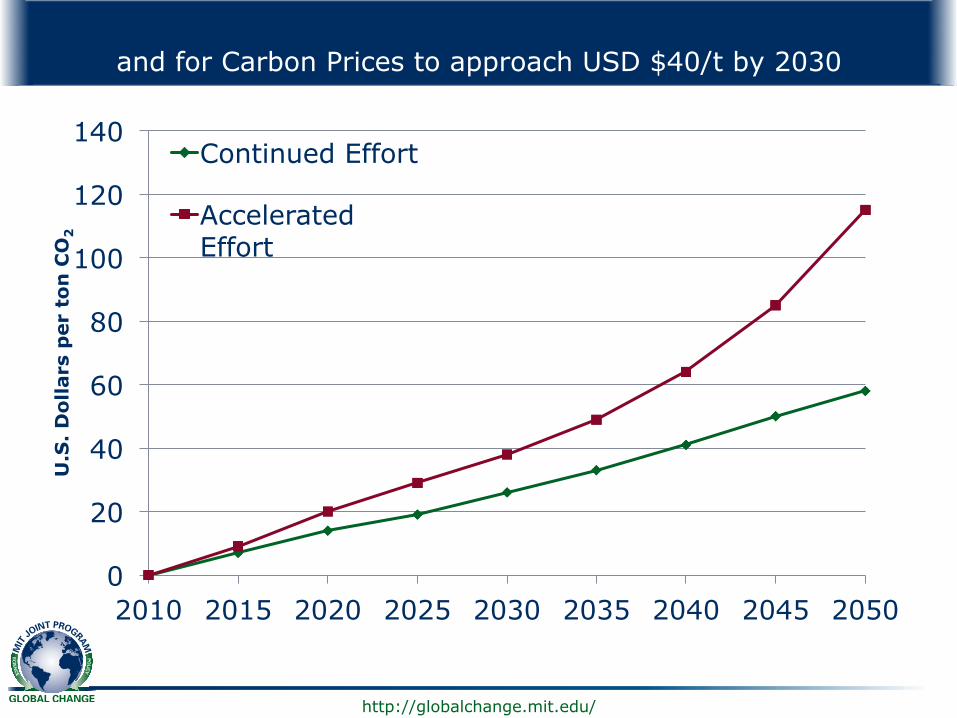
and for Carbon Prices to approach USD $40/t by 2030
0
20
40
60
80
100
120
140
2010 2015 2020 2025 2030 2035 2040 2045 2050
U.S
. D
olla
rs p
er t
on C
O2
Continued Effort
Accelerated Effort

http://globalchange.mit.edu/
Lessons for Hong Kong from the Global Experience
• Start slowly. One way to do this is for Hong Kong to pursue its own ETS pilot, work out the kinks, and explore linkages later.
• Have a flexible system. Be able to adjust the cap if it becomes clear the price is inappropriate.
• Auction allowances. Avoid free allocation of allowances despite inevitable political pressure to do so.
• Don’t combine policies. Avoid diluting the effectiveness of carbon pricing with overlapping renewable energy subsidies, energy efficiency or fuel economy standard mandates.
• Cover as many sectors as possible. Minimize exceptions.

http://globalchange.mit.edu/
Thank you!