hoboken terminal: pedestrian planning for the twenty-first...
TRANSCRIPT

TRANSPORTATION RESEARCH RECORD 1162 43
Hoboken Terminal: Pedestrian Planning for the Twenty-First Century
JOHN s. CHOW, FOSTER NICHOLS, JR., AND GREGORY P. BENZ
New Jersey TRANSIT's Hoboken Terminal ls currently a major hub for rall rapid transit, commuter rail, and bus riders in northern New Jersey and the New York metropolitan area. Major physical and operational changes are being planned for Hoboken Terminal and its Immediate vicinity In the next 15 yr. These changes will bring slgnlflcaotly more people, prlmarlly commuter. and office workers, Into the terminal. Examined lo this paper ls the ability of the terminal to handle the lncrca ed number of pedestrians In the year 2000 from a level-of-service point of view. A microcomputer model of pedestrian flow was developed to examine the Impact of various changes on the pedestrian facilities. Of particular concern Is the possibility that a set of sales windows for commuter rail tickets would be moved from a separate waiting r<)om out onto a heavily traveled rail concourse. Various alternatives, Including automated ticket vending machines, ordered queues, and new window configurations, are proposed to relieve the expected congestion.
New Jersey TRANSIT's (NJ TRANSIT) Hoboken Terminal is currently a major hub for rail rapid transit [Port Authority Trans-Hudson (PATH)], commuter rail, and bus riders in northern New Jersey and the New York metropolitan area. Major physical and operational changes are being planned for Hoboken Terminal and its immediate vicinity in the next 15 yr. These changes will enhance the terminal's role as an intermodal transfer facility, bringing significantly more people, primarily commuters and office workers, into the terminal.
Future transportation services that will affect Hoboken Terminal are a reinstitution of ferry service to New York City, the new light rail system for the rapidly growing Hudson River waterfront, and the reverse Kearny rail connection. The proposed light rail station at the terminal is expected to be a major transfer point for waterfront commuters changing to PATH or ferry service to Manhattan. The reverse Kearny rail connection will allow certain trains that currently travel only to the New York Penn Station to also go directly to Hoboken Terminal, where commuters destined for lower Manhaltan can transfer to PATH. Expanded bus activity will be handled in a new enclosed bus-loading area.
In addition to the new transportation facilities, a major joint development project, sponsored by the Port Authority of New York and New Jersey, is being proposed adjacent to the terminal. Two new office buildings and two new parking garages
Parsons Brinckerhoff Quade & Douglas, Inc., One Penn Plaza, 250 W. 34th Street, New York, N.Y. 10119.
with indoor pedestrian connections to Hoboken Terminal are planned, as is a new hotel above the eastern side of the rail concourse. One proposal is to locate the new hotel's lobby within the historic rail terminal waiting room where rail passengers currently wait for trains and purchase tickets at NJ TRANSIT windows. As part of the joint development project, it has been proposed that the rail ticket sales windows be moved from the waiting room out onto the concourse at the head of the commuter rail platforms.
The Hoboken Terminal pedestrian activity analysis was undertaken to examine the ability of Hoboken Terminal to handle the increased number of pedestrians from a level-of-service (LOS) point of view. Described in this paper are the existing and proposed transportation services at Hoboken Terminal and the results of the analysis for the year 2000 from the standpoint of pedestrian planning. In particular, the level of congestion caused by moving the rail ticket windows from the waiting room onto the rail concourse is examined.
TRANSPORTATION SERVICE AT TERMINAL
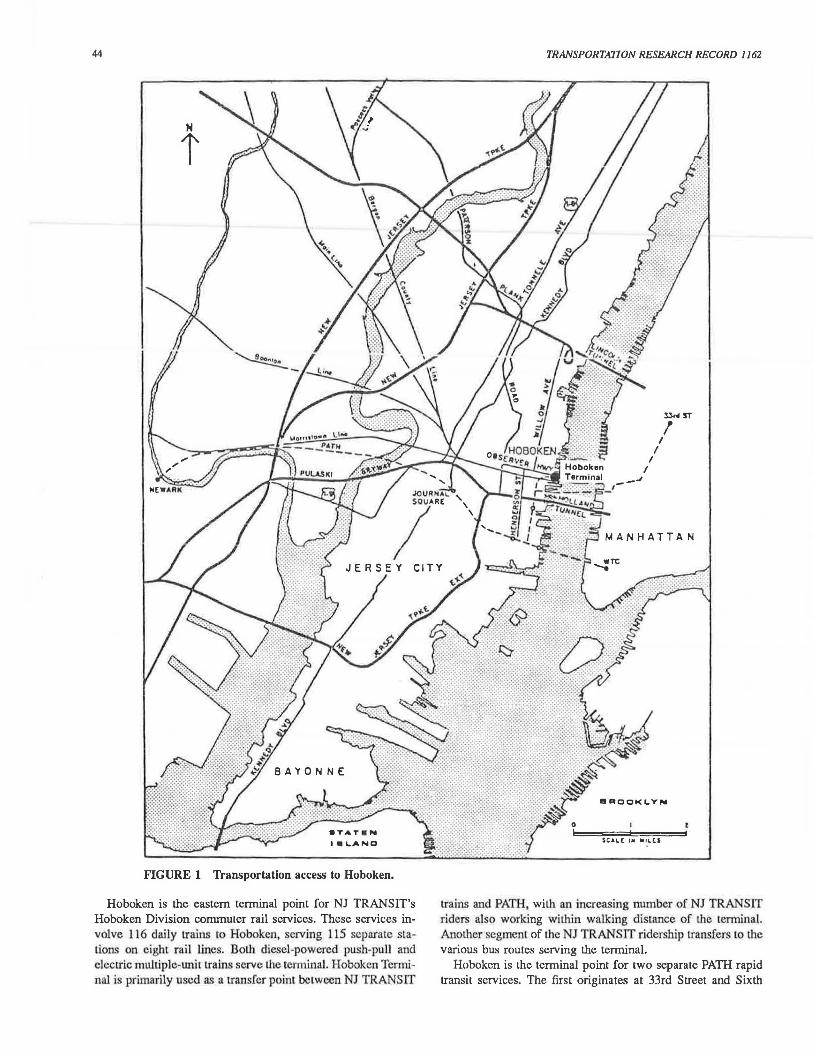
The Hoboken Terminal is one of the busiest transportation centers in the New York-New Jersey metropolitan region. Daily, more than 60,000 commuter rail and bus passengers 1ransfer lo and from PATH, whi.ch connects Hoboken to midtown and lower Manhattan (see location map, Figure 1). Until 1967, ferries also carried passengers across the Hudson to Manhattan.
Hoboken Tenninal, as it is generally called today, is the former Delaware Lackawanna and Western Railroad-Ferry Terminal. This strncture was built in the early 1900s in conjunction with Lhe electrification of suburban services and is now a national landmark. The original architectural rendering are shown in Figure 2. Ferry service was offered at both Barclay and Christopher Streets in lower Manhatlan until 1954, when Lhc Christopher Street ferry was abandoned. Between 1956 and 1959, the Erie Railroad commuter operations were added to the Hoboken Terminal as a result of the Erie-Lackawaima merger. In 1967, the Barclay Street ferry was closed, leaving PATH, Connerly the Hudson-and-Manhattan Railroad Iudson tubes), as the primary means of transfer to Manhattan via tunnels under the Hudson River.
44
t
FIGURE 1 Transportation access to Hoboken.
Hoboken is the eastern terminal point for NJ TRANSIT's Hoboken Division commuter rail services. These services involve 116 daily trains to Hoboken, serving 115 separate stations on eight rail lines. Both diesel-powered push-pull and electric multiple-wiit trains serve the terminal. Hoboken Terminal is primarily used as a transfer point between NJ TRANSIT
TRANSPORTATION RESEARCH RECORD 1162
I
I I
I
$CAL( 11111 lll1LtS
ll<il ST
'
trains and PATH, wilh an increasing number of NJ TRANSIT riders also working within walking distance of the terminal. Another segment of the NJ TRANSIT ridership transfers LO the various bus routes serving the terminal.
Hoboken is the terminal point for two separate PATH rapid transit services. The first originates at 33rd Street and Sixth

Chow el al.
- -- .,... .. ~
11~-~-....,._, .
~...;·.-· ..... __ --· - . _..,. .. - _,.,. __ ~
...... .. .a ,
,,
. , I I: '.; ' .
I . : ~ · '
45
FIGURE 2 Original architectural rendering of Hoboken Terminal.
Avenue (Herald/Greeley Squares), one block from Penn Station, Manhattan. This service runs south along Sixth Avenue with stops at 23rd Street, 14th Street, 9th Street, and Christopher Street in Greenwich Village. Running time from 33rd Street to Hoboken is 14 min. The second service originates at the World Trade Center in downtown Manhattan and stops at Exchange Place and Pavonia in New Jersey. Running time from the World Trade Center to Hoboken is 10 min. Service also runs to Journal Square (Jersey City) and Newark.
Hudson Place, located immediately north of the terminal building, is the site of a former trolley terminal. Today it is the terminal point for eight local bus routes serving Hudson and Bergen Counties, plus a trans-Hudson bus route to the Port Authority Bus Terminal in midtown Manhattan.
Hoboken Terminal is already a heavily used intermodal transfer facility for three modes of transit service-PATH, rail, and bus. The terminal has a distinctive pedestrian flow pattern because it is a commuter hub and transfer point for these transit modes. During the morning rush hour, the majority of the pedestrians passing through the terminal arrive by NJ TRANSIT commuter trains from suburban communities, and transfer to PATH service bound for Manhattan. In the afternoon, the same Manhattan commuters ride PATH to Hoboken Terminal to wait for their departing train trip home. In addition, many local bus routes serve passengers who transfer to PATH, as well as people with local destinations.
With the introduction---0r reintroduction---0f ferry service to Manhattan, the light rail transit (trolley) stations, and the pro-
posed construction of adjacent office, hotel, and parking garage developments, Hoboken Terminal's role as an intermodal transfer facility will be enhanced. Pedestrian flow pattern will be significantly changed. Flows to the ferry portion of the terminal will reach the original volumes attained before the ferries were abandoned. The light rail station that will be on the opposite (south) side of the terminal from the original trolley depot and the joint development projects will result in new patternssignificant reverse flows, crossflows, and multidirectional flow. In addition, a second-floor pedestrian concourse will connect the joint development sites and portions of the bus terminal with the rest of the terminal.
The plan to locate the new hotel's lobby in the terminal waiting room will displace the commuter rail ticketing facilities, putting them out onto the concourse area at the head of the terminal's 11 stub-end platforms. This concourse normally handles very heavy pedestrian flows following the discharge of passengers from arriving trains. During the afternoon peak period, large numbers of passengers waiting for departing trains gather in the concourse area to take advantage of the concessions, telephones, and other amenities located there. The concourse space functions reasonably well today. The volume and new flow pattern created by the new transportation and joint development projects at the terminal create the need to examine future pedestrian flow conditions. Of particular concern is the allocation of space in the concourse area, especially in the area where the commuter rail ticketing facilities are proposed for relocation.

46
Described in the remaining sections of this paper are the approach and analytic tools used to examine pedestrian flow activities and conditions, especially the analysis of alternatives for ticketing facilities.
METHODOLOGY
A computer model of pedestrian flow was developed to examine the effects of various changes on the pedestrian facilities. First, a flow network was developed to represent all pedestrian movements within the terminal. A flow network consists of "sources" and "sinks" of pedestrians, and walking links. A source represents a place where people enter the pedestrian network, such as at a platform where they get off the train. A sink is where they leave the network. Shown in Figures 3 and 4 is the flow network, divided into first- and second-floor plans. Each proposed and existing transportation service, office building, or other trip generator was treated as a source or sink for pedestrians. These 19 sources and sinks are shown as circles in r;g-u....;;;, 3 '1UU .+. E111,;i1 uisLim:t waiking area was mocieieci as a link (shown as a thick black line) with an associated capacity for pedestrian flow. All the links are interconnected to allow the tracing of a path through the links from any source to any sink. The model includes 20 vertical circulation links to connect the first floor (street level) to the second floor (mezzanine). There are 108 one-way links on the first floor (two directions for 54 corridor spaces), with the greatest detail shown on the concourse at the head of the rail platforms, allowing closer study of the area for the proposed location of the ticket windows. The second floor is represented by another 40 one-way links.
HOBOKEN
+ N I
1 Parsons Brinckerhoff 1187
TRANSPORTATION RESEARCH RECORD 1162
The number of people walking from each source to each sink was summarized in a pedestrian trip table. The trip table, representing a weekday afternoon peak hour (5 p.m. to 6 p.m.) in the year 2000, was developed jointly by the Port Authority of New York and New Jersey and NJ TRANSIT and is shown in Figure 5. It is interesting to note that more than half of the nearly 38,000 pedestrians arrive by PATH, and three-quarters of these PATH patrons continue their trips by commuter rail.
The trip assignment followed the same methodology that was used by Benz, Chow, and Lutin in a pedestrian analysis of proposed new exits at New York City's Grand Central Terminal (1). The trip assignment was undertaken in two steps: (a) the determination of a probable path for each source-to-exit pair, and (b) the assignment of a number of pedestrians to the probable paths. Previous studies show that, particularly for commuter facilities, people take the most direct or easiest route from a source to a sink. For each source-to-exit pair, a shortest path through the network passageways was assigned. The path assignmems were completed manually by inspecting the network and distance and ease of passage were taken into account. The path was coded into the simulation program as a probability that trips between a source and exit would make use of a particular link.
The pedestrian assignment model was completed on an IBM AT microcomputer using the Lotus 1-2-3 spreadsheet and taking advantage of the increased memory capabilities of Lotus Version 2. The entire network was represented on the spreadsheet in tabular form, with 168 rows representing links and 19 columns representing sinks. One such table, or base
FIGURE 3 Hoboken Terminal pedestrian ttow network, ground floor.

Chow et al.
TO PARKING GARAGE
\ '
Ker ~ Source or Sink 80
W Unk 127 - (East and West)
127E
Paraon• BrinckerhoH 1187
47
OFFICE
FIGURE 4 Hoboken Terminal pedestrian flow network, second floor.
assignment matrix, was set up for each of the 19 sources. The table was filled in with ones and zeros; a 1.0 in a spreadsheet cell represents a link traveled on the probable path for the source-exit pair, and a 0 represents an untraveled link. In cases where there were two equally likely paths, a factor of 0.5 was used for each of the two links involved.
The second step of the trip assignment is to assign a number of pedestrians to the probable paths. Pedestrians are assigned to the links by multiplying each column of a base assignment matrix by the number of pedestrians coming from that source to each sink. This matrix multiplication process results in one table of link volumes for each of the 19 sources. These 19 source tables were summed together cell by cell, according to the rules of matrix addition, resulting in one table of link volumes for all sources. For example, assume that the trip table shows 100 people going from Source A to Sink B. Assume there are two equally probable paths, with one traveling through link X (probability factor in the base assignment matrix = 0.5), and the other through link Y (probability factor = 0.5). Then the matrix multiplication for this A-to-B pair will contribute 50 trips to link X and 50 trips to link Y. Other source-to-sink pairs will contribute additional trips to links X and Y, with the number of trips depending on the trip table volumes and on the path assignments. The resulting link volumes for the various simulation scenarios were plotted on diagrams of the rail concourse area.
PEDESTRIAN LEVELS OF SERVICE AND LINK CAPACITIES
The capacity of a link is the number of pedestrians able 10 walk through the corridor in the specified time period at a given LOS. To evaluate the perfonnance of pedestrian facilities, criteria are needed that relate pedestrian volumes to levels of congestion and pedesLrian comfort for various types of facilities. One measure is the LOS developed in the field of traffic engineering and adapted by John Fruin 10 pedestrian planning (2).
The level of service for corridors and stairways reflects 1.he freedom of pedestrians to select their normal walking speed and bypass slow-moving and reverse-flow pedestrians at various pedestrian ll'affic concentralions. For escalators, platforms, and concourse waiting areas, the LOS reflects the amount of queueing that occurs at the facility under various pedestrian loadings. In all cases, level of service is a measure of pedestrian congestion. LOS C over the peak 5- to 15-min period is generally accepted as the design standard for commuter facilities. The standard used in this analysis, LOS CID, is 10 pedestrians/min/ft for stairways, and 15 pedestrians/min/ft for corridors.
Another measure of congestion is the volume-to-capacity ratio (V/C), which is related to the LOS. A pedestrian facility (i.e., a corridor, stair, or escalator) that operates at an LOS on the boundary between LOS C and LOS D is defined as having a V /C of 1.0. A ratio greater than 1.0 means that the LOS

H080KEN TERMINAL TRIP TABLE. Year 2000, pm peak hour Created 09-Dec-86 R. W. Feingold Includes reverse Kearny
Source
PATH, E & W entrances 2 Auto dropoff 3 Ferry 4 North Off ice 5 South 11arage 6 Transportation Ctr 7 Hoboken
8A NJT Rail track 1 88 NJT Rail track 2 BC NJT Rail tracks 3-6 80 NJT Rail tracks 7-10 8E NJT Rail tracks 11-14 8F NJT Rail tracks 15-21 9A Bus, south side 9B Bus, north side 9C Bus, center island
ION LRT northbolr.d 10S LRT southbolr.d
11 West garage
Tote ls
0 0
0 1535
0 512
1022 0 0
35 30 21
0 20 24 20
140 635
0
3994
2
513 0
68 0 0 0 0
0 0 9 8 5
0 15 19 15 0 0
0
652
3
0 0
0 1~i6
0 51
117 0
0
4
4 2 0
3 4 3
18 81
0
443
4
243 0
95 0
0 22 61
0 0 8 7 5 0
30 35 30 18 77 0
631
5
0 0
0 360
0 74
442 0 0
0
0 0
0
0 0 0
0 0 0
876
6 7
81 2r.i9 0 0
32 338 22 480 0 0 0 159
20 0 0 0 0 0 3 19 2 15 2 11 0 0
10 28 12 34 10 28 5 21
25 96 0 0
224 3988
Source: Port Authority year 2000 am peak hour trip table. E. Lessieu, 7/24/86 Modified and redistributed by R. Feingold for 2000 pm peak hour. 12/2/86
Going to destination SINK: 8A 88 8C 80 BE 8F
437 0
104 24
0 8
23 0 0
0 0
0 0
3 4 3 5
19 0
630
1167 43T7 2480 0 0 0
279 1048 594 66 248 140 0 0 0
22 83 47 62 232 131 0 0 0 0 0 0 0 0 0 0 0 0 0 0 0 0 0 0 8 30 16
10 36 20 8 la 16
12 42 24 51 192 109
0 0 0
1685 6318 3577
43T7 1r.i 1 0 0
1048 419 247 ~9
0 0 82 ~3
232 ~ ·3
0 0 0 0 0 0 0 0 0 0 0 0
30 12 36 14 30 12 42 17
192 77 0 0
6316 2527
FIGURE 5 Hoboken Terminal year 2000 p.m. peak hour pedestrian trip table.
9A
270 0
63 200
0 66
257 0 0
9 8 6 0
0 31 20 49
221 0
1199
9B
330 0
77 244
0 81
315 0 0
12 9 8 0
31 0
31 60
273 0
1472
9C
270 0
63 200
0
66 257
0 0 9 8 6 0
20 31
0
49 221
0
1199
10N
185 0
30 283
0 94
284 0
0 51 44 30
0 0 0 0
0 0 0
1001
Page 10S 11 Total
41 0
6 62
0 21 62
0
0 12 10 6 0
0 0 0
0 0 0
220
0 19281 0 0 0 4264
266 4632 0 0
135 1557 394 4003
0 0 0 0 0 172 0 145 0 102 0 0 0 256 0 309 0 256 0 502 0 2270 a o
795 37747

Chow et al.
degrades below the design standard, which may result in acceptable queueing if it lasts for only a short duration. A V/C of less than 1.0 means that the facility is functioning at LOS C or better and meets the design goal.
The pedestrian flow model simulates pedestrian flow volumes on each link. The volumes indicate the number of people walking on each link during the evening peak 15-min interval. Shown in Figure 6 are the printout results from the flow simulation for Scenario 1 (year 2000 weekday afternoon peak 15 min, with heavy month-end rail ticket sales). Each row represents one link in the network. Given in the first five columns are measurements that determine the link capacity to carry pedestrians. Shown in the next three columns are the link capacity per min, per 15 min, and per hr. Pedestrian LOS guidelines are used to determine the carrying capacity of each link at LOS C.
The effective width of a corridor, concourse, platform, or stair is always less than its actual width from edge to edge. The effective width of the Hoboken Terminal rail concourse takes into account the presence of structural columns, phone booths, and other obstructions in the center of the concourse and the propensity of pedestrians to stay away from side walls and edges when walking.
To calculate the future effective width of the Hoboken Terminal concourse, the following deductions are made from the actual 41-ft edge-to-edge width: 2.5 ft for the west and east edges of the concourse, and 7.5 ft for the central column line and public phone clusters. At Tracks 5 and 6, two additional feet are deducted for the NJ TRANSIT information booth, resulting in an effective width of 29 ft.
The resulting effective width is 31 ft (except opposite the information booth, where the effective width is 29 ft). The V /C ratios are calculated by the model for the peak 15-min interval. The resulting V /C levels determine the ability of particular Hoboken Terminal corridors to handle the expected peak pedestrian volumes.
TICKET AREA QUEUEING ANALYSIS
The pedestrian flow model was used to examine Hoboken Terminal's ability to handle pedestrian flows in an afternoon peak hour on a month-end weekday in the year 2000. With the exception of the rail concourse area, which is discussed below,
HOBOm mrnAL PEDESTRIAN CAPACITY CALCULATIONS
49
Hoboken Terminal is shown to function well under future conditions.
Rail Concourse Without Ticket Queues
In the middle of the month, when rail ticket sales are low, pedestrian flows are relatively smooth. Queues generally form at the ticket windows. The resulting free-flow V/C ratios are shown in Figure 7.
Conditions are not entirely free flowing, however, during a typical evening peak period. Passengers who wait for their departing trains for train departure information or to meet friends, as well as passengers who stand in line to purchase items from the concession windows, take up space and constrain movement through the concourse by other pedestrians.
Concession queues extending outward from the east wall also pose a greater constraint to pedestrian flows. These queues can extend outward 5 to 10 ft and then bend in a north-south direction, limiting the north-south flow of pedestrians to a double file to the east of the telephones and central columns. The analysis accounted for these waiting passengers by reducing the effective width of the concourse by 5 ft, from 31 to 26 ft. This reduction approximates the amount of additional space taken up by nonmoving passengers occupying the concourse during the peak evening period. These passengers are mostly concentrated in the northern part of the concourse but are relatively spread out in the north-south direction, especially those who are awaiting train information. The resulting V/C levels are presented in Figure 8, which also shows schematically that part of the concourse width is taken up by waiting passengers. The figure shows V/C levels increasing from south to north, reaching congested levels at the northern end of the concourse.
Rail Concourse with Ticket Queues
Greater congestion would be imposed on the rail concourse by moving the rail ticket sales windows out of the waiting room and into the concession area of the relatively narrow rail concourse. People standing in line to buy tickets would reduce the amount of space available for moving pedestrians.
SIESU~
doors Unit :c A P A C I T Y :Page I 10-0ec <--Peak IS-1inutes --:. lt-Feb-B7 :•:----Corridor •idth lftl---;. or oao :persons persons persons : Lin~ volu1e 2-••Y Volu1e
Link Descr iptio' :Actual Obstruction offect1ve stairs loin : loin /15-110 /hour : Link total 2B! 'ol /capacity -- ----------------------- : ----- ----- :------- ------ ------ZONE t. TRANSPORT m
103 E TransoCtr, front lobby . 6.7 1.5 15 : 78 1170 4680 : !OJ E 2779 778 1613 IJB! 104 [ Sus tero, NE side so : 200 JOOO 12000 : 104 E 265~ 74J lB3:> 61! 10S E Si d"k N of PATH NA NA IS : NA NA NA : 105 E 0 0 NA 106 N E of PA~H NA NA l < ' J • NA NA NA ' 106 N I 19B 335 2458 NA 107 E Bus ter1, N ol •ti• ! IU 7 .5 12 15 : 1_86 2790 11160 107 E !200 310 40B IS! ?09 E PATH W turns ti !es NA NA MA . NA NA NA ; !09 E 159B 447 1600 NA I 10 E PATH E turn st i I es NA NA NA : NA NA NA : 110 E 15165 4240 4917 NA Ii I E PAT~ E entr 50 : 400 6000 24000 I 111 E 7582 2!23 me 41! I :2 ~ BU< ter•. S plath I 17.4 7.5 10 15 : 148 2227 8910 I 111 E 310 B7 m 227. !14 N ~us tero, NE side I 16 .4 7. ~ I" ' J ' 131 2002 80?0 ; 114 N )891 1090 1BJ3 m I IS N Bus ter1, SE side ! 7 .3 l.S 16 i.J . 237 3555 14220 : I IS N 1339 m I 108 JI! 11; N PATH E er.tr t 25.6 4,' 21 !5 : ]21 48?5 192'1) ' 116 N 119B m 245B Sil
~-·-· -----... ~ --- --- -- ---- ·--- : ----- ; --~~-
FIGURE 6 Hoboken Terminal year 2000 p.m. peak 15-min pedestrian flow volumes, capacities, and V/Cs.

50
o.s'3
o.so
o.ss
0.s2
o.66
TRANSPORTATION RESEARCH RECORD 1162
Scenario 1E·
FIGURE 7 Free-flow pedestrian LOS without queues.
The impact on pedestrian flows of moving the railroad ticket office to the southern end of the rail concourse was investigated. Ticketing activities reach a relatively high peak at the beginning and end of every month when passengers buy their monthly commutation tickets. The highest peaks occur when the first or last day of the month occurs on a Monday, which also happens to be the busiest day of the week for the sale of weekly tickets.
Existing ticketing conditions were observed from a 1-day survey on May 1, 1986 (a Thursday). Detailed ticket sales records were obtained from the railroad for the same day, and daily ticket sales data were obtained for the years 1985 and 1986. On May l, 1986, during the 5 p.m. to 6 p.m. period, a total of 660 passengers purchased tickets. During the hour, there were from five to six ticket windows open in the main
wailing room, all staffed with agents. Substantial queueing occurred, reaching a maximum of 16 people in each line (a 10-min wait) and 68 people overall. (At present, a separate line forms at each window.) Average queues over the hour were 9 people/window and 52 people overall.
The processing time for each ticket purchase is an important determinant of queueing at the ticket windows and can be used to determine the number of ticket windows required to keep peak period queueing at an acceptable level. The average processing rate from 5 p.m. to 6 p.m. on May l, 1986, was calculated to be 38 sec/person (or 1.6 persons/min). Many monthly ticket purchases are made by check and take longer than the average 38 sec, sometimes in excess of 2 min. This is offset by purchases of single-ride tickets, usually with cash, which generally require much less time per transaction.

Chow el al. 51
0 .13
··~~~;;~; Proposed Rall Ticketing Area
\~t~ Year 2000 PM Peak \\~ 15-Minute Pedestrian V/Cs
%~ Parsons Brinckerhoff 1187
,',fl1~JliJiiilSl~'.1tt1tifF'
Scenario 1E·
FIGURE 8 Pedestrian LOS with departing passengers waiting and without ticket queues.
Peak ticketing activity was projected to the year 2000, using the year 2000 forecast of NJ TRANSIT rail ridership at Hoboken Terminal. In order to estimate a typical worst case condition for ticketing, the design day was assumed to be a Monday occurring at the end or beginning of the month. The analysis assumes that the percentage of rush hour rail passengers who stop to buy tickets will remain at its present 7 percent rate. First, the observed May 1, 1986 (Thursday), ticketing activity was increased by 17 percent (from 660 to 770) to account for the fact that the Monday design day is a busier one than the Thursday. Then this number was projected to the year 2000, resulting in a forecast of 1,500 passengers desiring to purchase tickets between 5 p.m. and 6 p.m. on the year 2000 design day.
The processing rate for ticket sales is assumed to be 1.6
persons/min/window-the same as it is today. The extent of peak-period queueing at the ticket office is a function of this processing rate and is also a function of the number of ticket windows in operation. A queueing analysis was undertaken to determine the required nwnber of ticket windows in the year 2000. To handle the projected volwne without allowi.ng a prolonged queue to build up at the ticket office, 15 window positions would be needed. Because a moderate amount of queueing is tolerable at peak times, the ticket window requirement may be reduced by one or two positions. Fourteen open windows would cause a buildup of a queue to the point where a person would wait 7 min in line, queues would extend to 11 people per window, and a total of 150 people would be in the queue. Providing only 13 windows would increase the maximum wait to 12 min and maximum queues to 19 people/ window-250 people overall.

52
Part of this increased ticket-selling capacity may be provided through the installation of automatic ticket vending machines (TVMs) at Hoboken Terminal, capable of vending monthly and weekly commutation tickets as well as single-ride tickets. These machines have proven practical at other commuter rail terminals but are not currently provided at the terminal. TVMs could be located both within and without the rail concourse, although one potential problem is that these machines themselves can impede pedestrian flow when queues form. If it is assumed that one-third of the peak ticketing demand in the year 2000 is accommodated at TVMs, then the ticket window requirement may be reduced to 10 (moderate queue buildup) or 11 (no queue buildup) positions.
Another possible way to reduce the volume of ticket sales in the terminal is to sell tickets off site or by mail. Tickets could be sold off site at local banks or by business employers. NJ TRANSIT already has a program to sell tickets by mail, but more people could be encouraged to use Mail Tiks.
Each ticket window position in the terminal is assumed to require approximately 5 linear ft of ticket counter, to provide adequate space for booking office machines, ticket stock, and cash drawers. This translates into a requirement of 50 linear ft for 10 windows and 75 linear ft for 15 windows. The required depth of the ticket office may vary, depending on the location of and requirements for supporting space. A 20 to 25 ft depth is assumed here for planning purposes.
The space originally proposed for relocation of the ticket office occupies the east wall of the rail concourse at the south end. Approximately 75 linear ft are available for ticket office frontage. If the proposed retail space facing the rail concourse in this area is eliminated, then there is approximately 25 ft of ticket office depth available. Thus, a relocated ticket office with up to 15 windows could be accommodated in the proposed space.
Queueing for passengers buying tickets, however, would occur entirely within the rail concourse. Based on the results of the queueing analysis, a maximum of 200 passengers would accumulate in the ticket queue in the year 2000 design day, corresponding to a requirement of between 9 and 14 open window positions (depending on the number of TVMs provided).
Two basic types of queue are possible:
• Separate queues at each window (the existing situation at Hoboken);
• A single ordered queue. These queues, often used at banks, operate on a first-in, first-out basis-a procedure where the first person in line goes to the next available window. Movable barriers are used to channel the flow.
Separate queues are less efficient than a single ordered queue in terms of use of space. However, separate queues allow for separate lines for different types of ticket purchases: monthly tickets, cash purchases, credit cards, checks, and so on. A single ordered queue provides more equitable service for passengers waiting in the queue.
Both types of queue were analyzed to determine their impact on north-south movement in the rail concourse. Because ihe rail concourse is only about 40 ft wide, any elongated queue in the east-west direction would substantially reduce the northsouth pedestrian flow capacity of the concourse in this area.
TRANSPORTATION RESEARCH RECORD 1162
Examined in Figure 9 is the impact of the first type of queue, the separate queue, on north-south movement when the ticket windows are moved to the rail concourse in a configuration similar to that which exists in the waiting room today. In the existing waiting room at the end of the month, when ticket sales are the highest, there have been as many as 16 people standing in each line at one time. Each person adds about 2 ft to the queue, resulting in a 32-ft queue. If the ticket office is moved, even if enough additional windows are added so that future queueing is no worse than at present (16 persons maximum per line), the resulting peak queues would block 80 percent of the width of the concourse. Such queues would severely constrain the normal flow of pedestrian traffic, considerably diminishing the effective capacity of the concourse link. The 2,200 people who are trying to walk north and south on the concourse east of Track 13 would have only a 5-ft-wide corridor through which to pass, resulting in an unacceptable V/C of 1.39. This analysis shows that even under the current demand fur Lick.t:Ls, U:1t:rt: is um 1;;11uugl1 :spa1,;c uu il1c <-u1iCvu1-iio tu operate fue existing number of ticket windows with a single line in front of each window.
The second type of queue, the single ordered queue, is illustrated in Figure 10, which shows an ordered queue with a capacity of 200 people occupying the eastern half of fue rail concourse. This arrangement would leave only a 20-ft-wide space for north-soufu circulation. V /C ratios, shown in Figure 11, reflect a crowded but acceptable condition. These ratios assume completely free-flowing movement without, however, any waiting passengers or other obstructions in the concourse. If fue same degree of passenger waiting is assumed as in the rest of fue rail concourse (i.e., a reduction in the effective width of 5 ft), then the V/C ratios, shown in Figure 12, would change to 1.22 at the north end of the ticket office, which is an unacceptable condition.
Alternative Rail Ticketing Arrangements
The foregoing analysis indicates that ticket window arrangements fuat cause queues of ticket buyers to extend into the rail concourse will result in peak period congestion fuat exceeds accepted standards. Ticket queueing, therefore, should be accommodated away from the main circulation area.
One alternative would be to retain fue ticketing function at its existing location in fue waiting room. However, expansion of the seven to eight existing window positions would be physically difficult, and the future use of the room as a hotel lobby would be precluded. Anofuer alternative would be to use a greater part of the ground floor of the proposed new building directly east of the rail concourse opposite Tracks 10 through 14. The ticket windows could then be recessed (and possibly angled at 45 or 90 degrees to the rail concourse) to provide adequate queueing for 200 or more passengers outside (but adjacent to) the concourse. Such a scheme would reduce fue ground floor space available for retail or building services by 2,500 ft2 to 4,000 fl2 (plus an additional 1,000 ft2, if a backup office is provided adjacent to the ticket office). On the oilier hand, these alternatives would allow greater flexibility to acconunodate longer queues when fuey occur, allow future expansion of the ticket office, provide space for ticket vending machines and a seated waiting room, and maintain adequate pedestrian flow conditions in the concourse.

Chow el al. 53
... . . . . . . ...
. .. ... ... g ••• '·
3 ~so"' ,61>9 '31.'
Scenario 1E-Alternatlve 1
FIGURE 9 Pedestrian LOS with 1986 ticket queues.
CONCLUSIONS
Based on the foregoing analysis, a number of conclusions may be reached regarding ticketing facilities for NJ TRANSIT trains at Hoboken Terminal:
• The increased railroad ridership forecast for the year 2000 (21,000 p.m. peak-hour trips) will result in a corresponding increase in demand for ticket sales and unacceptable queues at peak end-of-the-month times if ticket selling facilities are not expanded.
• A generous supply of automated ticket vending machines (TVMs) scattered throughout the terminal would help considerably to reduce ticket window (and agent) requirements and reduce the concentration of queueing at ticket windows.
However, the rail concourse area is already congested and further analysis is required to determine whet.her sufficient space exists to accommodate the TVMs.
• Jn order to accommodate year 2000 peak ticket demands, 9 to 10 windows with 200 ft2 of backup space are required, supplemented by a number of TVMs. If no TVMs are provided, then 13 to 14 windows with 300 ft2 of backup space are required. Because NJ TRANSIT currently staffs a maximum of 6 windows, the opening of more than 9 windows would require additional staff and therefore additional operating expense to NJ TRANSIT.
• If the above ticket window requirements are met, an estimated 1,500 ft2 of concourse area (equivalent to 200 persons), separate from the areas of pedestrian flow, will be required for

54 TRANSPORTATION RESEARCH RECORD 1162
:;:;:;:;:;:;:;:;:;:;:::; Year .2000 PM Pe~k ::::;::: Scenario 1E-Alternative 2 ::;:::;:;:;:: :::::::::::::::::::::::: 15-Mmute Pedestrian V/Cs :::::::: :::::::::::::
.!Jl'ii:";.;;;;,;;;;;;;;r,:,~;:,:::•;:;n•;;:;2·J\f tt••:•;:•:•••:·imm HWi.%i:::::m•:m;,::::::i;;::/,ll! FIGURE 10 Ticket sales with ordered queues.
peak queueing at the ticket office. The queue will fluctuate in size during peak periods and may at times exceed this level.
• An ordered-queue arrangement (similar to a typical bank queue, with a single queue and movable barriers to channel the fl.ow) provides a greater density of queueing, a smaller total required queueing area, and more equitable service to passengers than individual queues at each window.
• The site proposed for relocation of ¢.e ticket office--on the east wall of the rail concourse--is inadequate to serve the projected volumes of queueing passengers buying tickets as well as other passengers and pedestrians traveling in a northsouth direction along the concourse. Ticket queues would block through movement and unacceptable levels of service and V/C ratios would result in this part of the rail concourse, even if TVMs are provided and an ordered-queue arrangement is used.
• Acceptable LOS can be achieved if the new ticket office is angled and recessed, thereby eliminating most of the retail space provided in this area.
Regardless of the site ultimately chosen for the ticket office, the use of TVMs, both at Hoboken Terminal and at outlying stations to supplement manual ticket selling, is strongly recommended The placement of TVMs' at Hoboken Terminal is the subject of continuing study, and a set of logical locations for TVM clusters is being developed. At any location, space for queueing at the TVMs will be provided away from the main pedestrian flows.
The pedestrian fl.ow model is a flexible design tool for testing a variety of physical plans. As plans for the future of Hoboken Terminal change with fluctuating economic conditions, the fl.ow model can be modified and adapted to simulate those


\}} Proposed Rail Ticketing Area ('..H Scenario 1E-Alternative 28 {}}\{
i%% Year _2000 PM Pe~k nr %Wht }:-:::.":::.: 15-Minute Pedestrian V/Cs S·(: ::.//;/:;.
1~@ 108%0itt'.ti1~'.;,'f;s;;A;:;x;x?*;};;;u@iiiitBD!!AfH?!'.&i%H~ii~ FIGURE 12 Pedestrian LOS with ordered ticket queues and departing passengers waiting.

Chow el al.
changes. This type of flow model is well suited to intermodal transfer facilities, and it is expected that this methodology will be applied to other pedestrian facilities.
REFERENCES
1. 0. P. Benz, J. S. Chow, and J. M. Lutin. PC-Based Pedestrian Flow Simulation Model for Grand Central Terminal. In Transporla-
57
lion Research Record 1054, TRB, National Research Council, Washington, D.C., 1986, pp. 8-16.
2. J. Fruin. Pedestrian Planning and Design. Metropolitan Association of Urban Designers and Environmental Planners, New York, 1971.
Publication of this paper sponsored by Commillee on lnlermodal Transfer Facilities.