hoboken public schools - state
TRANSCRIPT

HOBOKEN PUBLIC SCHOOLS
COMPREHENSIVE ANNUAL FINANCIAL REPORT
FOR
THE FISCAL YEAR ENDED JUNE 30, 2015
Hoboken, New Jersey

COMPREHENSIVE ANNUAL
FINANCIAL REPORT
ofthe
Hoboken School District
Hoboken, New Jersey
For Tine Fiscal Year Ended June 30, 2015
Prepared by
Business Office

HOBOKEN PUBLIC SCHOOLS TABLE OF CONTENTS
INTRODUCTORY SECTION
Letter of Transmittal Organizational Chart Roster of Officials Consultants and Advisors Certificates of Achievement for Excellence in Financial Repmiing
Independent Auditor's Report
Management's Discussion and Analysis
Basic Financial Statements
A. District-wide Financial Statements
A-1 A-2
Statement of Net Position Statement of Activities
B. Fund Financial Statements
Governmental Funds B-1 Balance Sheet
FINANCIAL SECTION
B-2 Statement of Revenues, Expenditnres, and Changes in Fund Balances B-3 Reconciliation of the Governmental Funds Statement of Revenues,
Expenditnres and Changes in Fund Balances with the District-Wide Statements
Proprietary Funds B-4 Statement of Net Position B-5 Statement of Revenues, Expenses, and Changes in Net Position B-6 Statement of Cash Flows
Fiduciary Funds B-7 Statement of Fiduciary Net Position B-8 Statement of Changes in Fiduciary Net Position
Notes to the Financial Statements
REQUIRED SUPPLEMENTARY INFORMATION- PART II
C. Budgetary Comparison Schedules
C-1 C-1a C-2
Budgetary Comparison Schedule -General Fund Comhining Budgetary Comparison Schedule- General Fund Budgetary Comparison Schedule - Special Revenue Fund
i-vi vii
viii ix
X-Xl
1-3
4-16
17 18-19
20-21 22
23
24 25 26
27 28
29-66
67-75 76-83
84

HOBOKEN PUBLIC SCHOOLS 'fABLE OF CON'fEN'fS
NOTES TO THE REQUIRED SIUlPPLEMEN'fARY INFORMATION-PART H
C. Budgetary Comparison Schedules (Continued)
C-3 Required Supplementary Information- Budgetary Comparison ScheduleNotes to the Required Supplementary Information
REQUIRED SUPPLEMENTARY INFORMATION -PART III
L. Schedules Related to Acconntiug and Reporting for Pensions (GASB 68)
L-1
L-2
L-3
Required Supplementary lnfonnation - Schedule of the District's Proportionate Share of the Net Pension Liability- Public Employees Retirement System
Required Supplementary Information- Schedule of District Contributions -Public Employees Retirement System
Required Supplementary Information- Schedule of the District's Proportionate Share of the Net Pension Liability- Teachers Pension and Annuity Fund
Notes to Required Supplementary Information
OTHER SIUlPPLEMENTARY INFORMA'flON
D. School Level Schedules
D-1 D-2
D-3
Combining Balance Sheet- General Fund Statement of Expenditures Allocated by Resource Type- Actual -Blended Resource Fund 15
Schedule of Blended Expenditures- Budget and ActualBlended Resource Fund 15
E. Special Revenue Fund
E-1-E-IB
E-2
E-2a
Combining Schedule of Revenues and Expenditures Special Revenue Fund- Budgetary Basis
Preschool Education Program Aid Schedule of ExpendituresBudgetary Basis
Early Childhood Program Aid Schedule of ExpendituresBudgetary Basis
F. Capital Projects Fund
F-1 F-2 F-2a
F-2f
Summary Statement of Project Expenditures Summary Schedule of Revenues, Expenditures and Changes in Fund Balance Schedule of Project Revenues, Expenditures, Project Balance and Project Status- Budgetary Basis
G. Enterprise Fund
G-1 G-2
G-3
Statement of Net Position Statement of Revenues, Expenses and Changes in Net Position
Statement of Cash Flows
85
86
87
88
89
90
91-96
97-114
115-120
121
122
123 124
125-130
131
132 133

HOBOKEN PUBLIC SCHOOLS TABLE OJII CONTENTS
OTHER SUPPLEMENTARY INFORMATION (Continued)
H. Fiduciary Funds
H-1 Combining Statement of Agency Assets and Liabilities H-2 Combining Statements of Changes in Fiduciary Net Position H-3 Student Activity Agency Fund Schedule of Receipts and Disbursements H-4 Payroll Agency Fund Schedule of Receipts and Disbursements
[. Long-Term Debt
I-1 I-2 I-3 I-4
J.
J-1 J-2 J-3 J-4 J-5 J-6 J-7 J-8 J-9 J-10 J-11 J-12 J-13 J-14 J-15 J-16 J-17 J-18 J-19 J-20
Schedule of Bonds Payable- Not Applicable Schedule of Obligations Under Capital Leases/Lease Purchase Agreements Schedule of Loans Payable- Not Applicable Debt Service Fund- Budgetary Comparison= Not Applicable
STATISTICAL SECTION (Unaudited)
Net Position by Component Changes in Net Position Fund Balances - Governmental Funds Changes in Fund Balances - Governmental Funds General Fund Other Local Revenue by Source Assessed Value and Actual Value of Taxable Property Direct and Overlapping Property Tax Rates Principal Property Taxpayers Property Tax Levies and Collections Ratios of Outstanding Debt by Type Ratios of Net General Bonded Debt Outstanding Computation of Direct and Overlapping Bonded Debt Legal Debt Margin Information Demographic and Economic Statistics Principal Employers Full-Time Equivalent District Employees by Function/Program Operating Statistics School Building Information Schedule of Required Maintenance for School Facilities Schedule of Insurance
134 135 136 137
138 139 140 141
142 143-144
145 146 147 148 149 150 151 152 153 154 155 156 157 158 159 160 161
162-163

K.
K-1
K-2
K-3 K-4 K-5
K-6 K-7
HOBOKEN PUBLIC SCHOOLS TABLE OF CONTENTS
SINGLE AUDIT SECTION
Repott on Internal Control Over Financial Reporting and on Compliance and Other Matters Based on an Audit of Financial Statements Performed in Accordance With Government Auditing Standards -Independent Auditor's Report
Report on Compliance for each Major Federal and State Program; Report on Internal Control Over Compliance; and Report on Schedule of Expenditures of Federal Awards Required by U.S. OMB Circular A-133 and Schedule of Expenditures of State Financial Assistance Required by New Jersey OMB Circular 15-08-Independent Auditor's Report
Schedule of Expenditures of Federal Awards Schedule of Expenditures of State Financial Assistance Notes to the Schedules of Expenditures of Federal Awards
and State Financial Assistance Schedule of Findings and Questioned Costs Summmy Schedule of Prior Audit Findings
164-165
166-168 169-170 171-172
173-174 175-181
182

INTRODUCTORY SECTION

HOBOKEN BOARD OF EDUCATION OFFICE OF THE BUSINESS ADMINISTRATOR I BOARD SECRETARY 158 Fourth Street •:• Hoboken, NJ 07030 •:• 201.356.3610 •:• Fax: 201 .356.3642
8 December 2015
Honorable President and Members
of the Hoboken Board of Education
County of Hudson, New Jersey
Dear Board Members and Constituents of Hoboken:
William Moffitt Business Administrator I Board Secretary wmoffitt@hoboken. k 12. nj. us
The comprehensive annual financial report of the Hoboken Board of Education (Board)
for the fiscal year ended June 30, 2015 is hereby submitted. Responsibility for both
the accuracy of the data and completeness and fairness of the presentation, including
all disclosures, rests with the management of the Board. To the best of our
knowledge and belief, the data presented in this report is accurate in all material
respects and is reported in a manner designed to present fairly the financial position
and results of operations of the various funds of the Board. All disclosures necessary
to enable the reader to gain an understanding of the Boards' financial activities have
been included.
The comprehensive annual financial report is presented in four sections: introductory,
financial, statistical and single audit. The introductory section includes this transmittal
letter, the Board organizational chart and a list of principal officials. The financial
section includes the District~wide Statements as now required by GASB 34, general
purpose financial statements, schedules and footnotes as well as the auditor's report
thereon. The statistical section includes selected financial and demographic
information, generally presented on a multi~year basis. The Board is required to
undergo an annual single audit in conformity with the provisions of the Single Audit
Act of 1984 as amended by the Single Audit Act Amendments of 1996; the U.S.
Office of Management and Budget Circular A~ 133, Audits of States, Local
Governments, and Non~Profit Organizations; and New Jersey OMS's Circular 15~08
OMB, Single Audit Policy for Recipients of Federal Grants, State Grants and State Aid.
Information related to this single audit, including the auditor's reports covering
compliance with applicable laws, regulations and requirements, and internal control
over compliance and financial reporting, as well as a schedule of related findings, is
included in the single audit section of this report.
Where Students Come First i

HOBOKEN BOARD OF EDUCATION FY2015 Audit Introduction
8 December 2015 Page2
REPORTING ENTITY AND ITS SERVICES: The Hoboken Board of Education is an
independent reporting entity within the criteria adopted by the Governmental Accounting
Standards Board (GASB) as established by Statement No. 14. All funds and account
groups of the Board are included in this report. The Hoboken Board of Education and
all its schools constitute the Board's reporting entity. For the past five years the
Board provided a full range of educational services appropriate to grade levels Pre-K
through 12. These include regular and special education for handicapped youngsters.
The Board completed the 2014-2015 fiscal year with an average daily enrollment of
1 ,872 students, which is 66 students below the previous year's average daily
enrollment. The following details the changes in the student enrollment of the District
over the last five years.
Hoboken School District
Average Daily Enrollment
Last Five Years
Student Percent
Fiscal Year Enrollment Change
2014-2015 1,872 (3.4%)
2013-2014 1,938 13.31%
2012-2013 1,710 (4.36%)
2011-2012 1,788 (1.5%)
2010-2011 1,816 (0.07%)
MAJOR INITIATIVES: The Hoboken Public School District continued to undertake a
rigorous and comprehensive school improvement process designed to increase
academic performance for all students. The district goals, budgeting process,
technology program, educational materials selection processes, staff evaluation system,
student performance assessment tools, curriculum revisions, facility improvements, and
a variety of work in other areas is aligned in support of teaching, learning, and the
new Common Core State Standards.
New textbooks and professional activities continued districtwide as the district
implemented changes related to the Common Core State Standards. A new language
arts program and textbook was adopted for grades K-8 and continued to be
Where Student~. Come First ll

HOBOKEN BOARD OF EDUCATION FY2015 Audit Introduction
8 December 2015 Page3
implemented from the prior year. This new language arts program is aligned with
national standards as well as those of the state. Language arts program strengths are
developing conceptual understanding, divergent thinking and problem solving skills
necessary for academic success in the 21st century.
activities included job embedded coaching, and strong
Professional development
benchmark. The district
continued progress in raising standards with continued use of the Response to
Intervention (RTI) model at all elementary schools. RTI continued to be part of a
school district goals and our unique program was development during the course of
several school years.
The Hoboken Board of Education invested heavily in technology over this past two
years. A grant from the Hurricane Sandy New Jersey Relief Fund allowed the district
to assess, design and build out infrastructure ahead of the new Partnership for
Assessment of Readiness for College and Careers (PARCC) statewide assessment.
Grant funds supported replacement of out dated student computers along with
upgrading and expanding of the district's local area networks.
A number of facility issues and concerns have been addressed including the expansion
of specialized instructional space and a growing preschool program. The district
renovated an instructional space and educational support room at Connors school for
the continued expansion of the district early childhood program. Several preschool
classrooms were moved and reorganized at Brandt school in order to better
accommodate new students. These renovated areas will improve the general
educational environment, support program reorganization and advance the delivery of
preschools services. Wallace school also received an extensive repainting project to
improve the overall learning environment. Redistribution of student enrollment and
district reconfiguration continued to open educational options and supported the
expansion of the district's preschool and specialized educational programs.
Reducing or eliminating the food service deficit, accumulated over a period of years,
continued to be a major focus for the Board of Education. After working diligently
over the past few years, the Board of Education is proud to report that the
accumulated deficit was eliminate and is reflected on the district's financial statements.
The Board will continue to work with their new food service management company to
address operational issues and improve revenue streams. New menu items, enhanced
Where Students Come First iii

HOBOKEN BOARD OF EDUCATION FY2015 Audit Introduction
8 December 2015 Page4
food quality, debt analysis, continued guarantee to break-even, along with other
changes, will continue to improve operations.
ECONOMIC CONDITION AND OUTLOOK: Refer to the section of this report titled
"Management Discussion and Analysis" for information on the economic condition and
outlook.
INTERNAL ACCOUNTING CONTROLS: Management of the Board is responsible for
establishing and maintaining internal accounting control designed to ensure that the
assets of the Board are protected from loss, theft or misuse and to ensure that
adequate accounting data are compiled to allow for the preparation of financial
statements in conformity with accounting principles which are generally accepted in the
United States of America. Internal control is designed to provide reasonable, but not
absolute assurance that these objectives are met. The concept of reasonable
assurance recognizes that (1) the cost of a control should not exceed the benefits
likely to be derived and, (2) the valuation of costs and benefits requires estimates and
judgments by management.
As a recipient of federal awards and state financial assistance, the Board also is
responsible for ensuring that adequate internal controls are in place to ensure
compliance with applicable laws and regulations related to those programs. Internal
control is also subject to periodic evaluation by the Board management.
As part of the Board's single audit described earlier, tests are made to determine the
adequacy of internal control, including that portion related to federal awards and state
financial assistance programs, as well as to determine that the Board has complied
with applicable laws and regulations.
BUDGETARY CONTROLS: In addition to internal accounting controls, the Board
maintains budgetary controls. The objective of these budgetary controls is to ensure
compliance with legal provisions embodied in the annual appropriated budget approved
by the voters of Hoboken. Annual appropriated budgets are adopted for the general
fund, the special revenue fund, and the debt service fund. Project-length budgets are
approved for the capital improvements accounted for in the capital projects fund. The
final budget amount as amended for the fiscal year is reflected in the financial section.
Where Stude,nts Come First lV

HOBOKEN BOARD OF EDUCATION FY2015 Audit Introduction
8 December 2015 Page 5
An encumbrance accounting system is used to record outstanding purchase
commitments on a line item basis. Open encumbrances at year-end are either
canceled or are included as reappropriations of fund balance in the subsequent year.
Those amounts to be reappropriated are reported as assignments of fund balance at
June 30, 2013.
ACCOUNTING SYSTEM AND REPORTS: The Board's accounting records reflect
accounting principles generally accepted in the United States of America, as
promulgated by the Governmental Accounting Standards Board (GASB). The
accounting system of the Board is organized on the basis that will comply with GASB.
Refer to the Management Discussion and Analysis section of this report for a detailed
explanation.
CASH MANAGEMENT: The investment policy of the Board is guided in large part by
state statute as detailed in "Notes to the Financial Statements". The Board has
adopted a cash management plan which requires it to deposit public funds in public
depositories protected from loss under the provisions of the Governmental Unit Deposit
Protection Act ("GUDPA"). GUDPA was enacted in 1970 to protect Governmental
Units from a loss of funds on deposit with a failed banking institution in New Jersey.
The law requires governmental units to deposit public funds only in public depositories
located in New Jersey, where the funds are secured in accordance with the Act.
DEBT ADMINISTRATION: The Boards outstanding debt issues included general
obligation bonds, loans from the New Jersey Economic Development Authority and a
loan from the United States Environmental Protection Agency. There were no new debt
issues in the fiscal year ended June 30, 2015. Specific details of Debt can be found
in the financial section of this report and notes thereto.
FINANCIAL INFORMATION AT FISCAL YEAR END: Refer to the section of this
report titled "Management Discussion and Analysis" for year end highlighted financial
information.
RISK MANAGEMENT: The Board carries various forms of insurance, including but not
limited to general liability, automobile liability and comprehensive/collision, hazard and
theft insurance on property and contents, excess worker's compensation and fidelity
bonds.
Where Students Come First v

HOBOKEN BOARD OF EDUCATION FY2015 Audit Introduction
8 December 2015 Page6
OTHER INFORMATION, INDEPENDENT AUDIT: State statutes require and annual
audit by independent certified public accountants or registered municipal accountants.
The accounting firm of Lerch, Vinci & Higgins, LLP was selected by the Board. In
addition to meeting the requirements set forth in state statutes, the audit also was
designed to meet the requirements of the Single Audit Act and the related OMB
Circular A-133 and New Jersey OMB's Circular 15-08. The auditor's report on the
basic financial statements and combining and individual fund statements and schedules
is included in the financial section of this report. The auditor's reports related
specifically to the single audit are included in the single audit section of this report.
AWARDS AND ACKNOWLEDGEMENTS:
AWARDS: The Government Finance Officers Association of the United States and
Canada (GFOA) awarded a Certificate of Achievement for Excellence in Financial
Reporting to the Board of Education of the City of Hoboken for its comprehensive
annual financial report for the fiscal year ended June 30, 2014. The Certificate of
Achievement is a prestigious national award, recognizing conformance with the highest
standards for preparation of state and local government financial reports. This was the
third year the District submitted for consideration and received the award. Hoboken
Board of Education also received the Certificate of Excellence for Financial Reporting
from the Association of School Business Officials International for the year ended June
30, 2014 which was the District's third consecutive year receiving this award.
ACKNOWLEDGEMENTS: We would like to express our appreciation to the members
of the Hoboken Board of Education for their concern in providing fiscal accountability
to the citizens and taxpayers of the school district and thereby contributing their full
support to the development and maintenance of our financial operations. The
preparation of this report could not have been accomplished without the efficient and
dedicated services of our business office personnel.
School Business Administrator I
Board Secretary
Where Student~ Come First Vl

< 1-'· 1-'·
'Confidential Executive SecretafJ
~rol l , { Accounts P;c;:ble I Purchasing, \: Human Resources
HOBOKEN BOARD OF EDUCATION ORGANIZATIONAL
Board Secretary
Business Administrator Board Secretary
People of Hoboken
Superintendent of Schools 1-------------------JConfidentia/ Executive Secretaf}
Assistant Superintendenl !-----------!Confidential Executive Secretal)
Supervisor of Special Services
Title 1/ NCLB I coordjnatol of Grants & Prof. Dev.
~~~~ Aides -~
'---- Nurses --........_,
- --./
District Attendance Officer

HOBOKEN BOARD OF EDUCATION
ROSTER OF OFFICIALS JUNE 30, 2015
Board of Education Ruth Tyroler, President Thomas Kluepfel, Vice President Sharyn Angley Peter Biancamano Jennifer Evans Leon Gold Jean Marie Mitchell Irene Sobolov Monica Stromwall
Superintendent of Schools Dr. Richard J. Brockel (Interim, 08/1 1/14- 07/14/15) Dr. Christine A Johnson (07 /15/15 -present)
Assistant Superintendent of Schools Dr. Miguel Hernandez
School Business Administrator/Board Secretary William P. Moffitt
Term Year 2015 2015 2017 2017 2016 2016 2015 2016 2017
Assistant to the School Business Administrator/Assistant Board Secretary Dianne Botti
Where Students Come First viii

Architect
Audit Firm
Board Counsel
HOBOKEN BOARD OF EDUCATION
CONSULTANTS AND ADVISORS JUNE 30, 2015
Mount Vernon Group 24 Commerce Street, Suite #1827
Newark, New Jersey 07102
Lerch, Vinci & Higgins, LLP 17-17 State Highway 208 North Fair Lawn, New Jersey 07410
Porzio, Bromberg & Newman P.C. 1 00 Southgate Parkway
P.O. Box 1997 Morristown, NJ 07962-1997
Engineers of Record (Environmental) Pennjersey Environmental Consulting
326 Willow Grove Road Stewartsville, NJ 08886
&
Partner Engineering and Science, Inc. 10 Mountainview Road, Suite N218
Ramsey, NJ 07458
Where Students Come First l X

Association of School Business Officials International
<!lie Certificate f!!P,;cce{fence in Pinancia{~porting}Iwara is presented" to
Hoboken Board of Education
Por Its Comprefiensive}Innua{Pinancia{IR.rport (CJlPCZ?) Portfie Pisca{r>fearP.nd"u[June 30, 2014
The CAFR has been reviewed and met or exceeded ASBO International's Certificate of Excellence standards
Mark C. Pepera, MBA, RSBO, SFO President
X
John D. Musso, CAE, RSBA Executive Director

Government Finance Officers Association
Certificate of Achievement for Excellence
in Financial Reporting
Presented to
Hoboken Board of Education
New Jersey
For its Comprehensive Annual Financial Report
for the Fiscal Year Ended
June 30, 2014
Executive Director/CEO
xi

FINANCIAL SECTION

LERCH, VINCI & HIGGINS,LLP CERTIFIED PUBLIC ACCOUNTANTS REGISTERED MUNICIPAL ACCOUNTANTS
DIETER P. LERCH. CPA. RMA. PSA
GARY J . VINCI. CPA. RMA. PSA
GARY W. li!GGINS. CPA. RMA, I'SA
JEH'IUiY C. BLISS. CPA. RMA, PSI\
PAULJ. I.ERCH. CPA. RMA.l'SA
DONNA L. JAPIIET. CPA. PSA
JULIUS fl . CONSON!. CPA. PSA
ELIZA!lffi'H A. SHICK. CPA. RMA. PSA
ANDREW PARENTE. CPA. RMA. PSA
ROBERT W. HAAG. CPA. !'SA
DEBORAH K. LERCH. CPA. PSA
RALPII M. PICONE. CPA. RMA, PSA
Honorable President and Members of the Board of Trustees
Hoboken Public Schools Hoboken, New Jersey
INDEPENDENT AUDITOR'S REPORT
Report on the Financial Statements
DEBRA GOLLE, CPA
CINDY JANACEK. CPA. RMA
MARK SACO. CPA
SHERYL M. NlCOI.OSl. CPA
KATHLEEN WANG, CPA
ROBERT AMl'ONSAH, CPA
We have audited the accompanying financial statements of the governmental activities, the business-type activities, each major fund, and the aggregate remaining fund information of the Hoboken Public Schools as of and for the fiscal year ended June 30, 2015 and the related notes to the financial statements, which collectively comprise the Board of Education's basic financial statements as listed in the table of contents.
Management's Responsibility for the Financial Statements
Management is responsible for the preparation and fair presentation of these financial statements in accordance with accounting principles generally accepted in the United States of America; this includes the design, implementation, and maintenance of internal control relevant to the preparation and fair presentation of financial statements that are free from material misstatement, whether due to fraud or error.
Auditor's Responsibility
Our responsibility is to express opinions on these financial statements based on our audit. We conducted our audit in accordance with auditing standards generally accepted in the United States of America, the standards applicable to financial audits contained in the Government Auditing Standards, issued by the Comptroller General of the United States and audit requirements as prescribed by the Office of School Finance, Department of Education, State of New Jersey. Those standards require that we plan and perform the audit to obtain reasonable assurance about whether the financial statements are free of material misstatement.
An audit involves performing procedures to obtain audit evidence about the amounts and disclosures in the financial statements. The procedures selected depend on the auditor's judgment, including the assessment of the risks of material misstatement of the financial statements, whether due to fraud or error. In making those risk assessments, the auditor considers internal control relevant to the entity's preparation and fair presentation of the financial statements in order to design audit procedures that are appropriate in the circumstances, but not for the purpose of expressing an opinion on the effectiveness of the entity's internal control. Accordingly, we express no such opinion. An audit also includes evaluating the appropriateness of accounting policies used and the reasonableness of
significant accounting estimates made by management, as well as evaluating the overall presentation of the financial statements.
We believe that the audit evidence we have obtained is sufficient and appropriate to provide a basis for our audit opinions.
17-17 ROUTE 208• FAIR LAWN, NJ 074 10• TELEPHONE (201) 791-7 100 • FACSIMILE (201) 79 1-3035
WWW.LYHCPA.COM

Opinions
In our opinion, the financial statements referred to above present fairly, in all material respects, the respective financial position of the governmental activities, the business-type activities, each major fund, and the aggregate remaining fund information of the Hoboken Public Schools as of June 30, 2015, and the respective changes in financial position and, where applicable, cash flows thereof for the fiscal year then ended in accordance with accounting principles generally accepted in the United States of America.
Emphasis of Matter
Adoption of New Accounting Pronouncement
As discussed in Note 1 to the financial statements, in the fiscal year ended June 30, 2015, the Hoboken Public Schools adopted new accounting guidance, Governmental Accounting Standards Board Statement No. 68, Accounting and Financial Reporting for Pensions. Our opinion is not modified with respect to this matter.
Other Matters
Required Supp/ementwy lnfi>rmation
Accounting principles generally accepted in the United States of America require that the management's discussion and analysis, budgetary comparison information and pension information be presented to supplement the basic financial statements. Such infonnation, although not a part of the basic financial statements, is required by the Governmental Accounting Standards Board, who considers it to be an essential part of financial reporting for placing the basic financial statements in an appropriate operational, economic, or historical context. We have applied certain limited procedures to the required supplementary information in accordance with auditing standards generally accepted in the United States of America, which consisted of inquiries of management about the methods of preparing the information and comparing the information for consistency with management's responses to our inquiries, the basic financial statements, and other knowledge we obtained during our audit of the basic financial statements. We do not express an opinion or provide any assurance on the information because the limited procedures do not provide us with sufficient evidence to express an opinion or provide any assurance.
Other Information
Our audit was conducted for the purpose of forming opinions on the financial statements that collectively comprise the Hoboken Public Schools' basic financial statements. The introductory section, combining and individual nonmajor fund financial statements, financial schedules, statistical section, schedule of expenditures of federal awards as required by U.S. Office of Management and Budget (OMB) Circular A-133, Audits of States, Local Governments, and Non-Profit Organizations and schedule of expenditures of state financial assistance as required by New Jersey OMB Circular 15-08, Single Audit Policy for Recipients of Federal Grants, State Grants and State Aid, are presented for purposes of additional analysis and are not a required part of the basic financial statements of the Hoboken Public Schools.
The combining and individual nonmajor fund financial statements, schedule of expenditures of federal awards and schedule of expenditures of state financial assistance are the responsibility of management and were derived from and relate directly to the underlying accounting and other records used to prepare the basic financial statements. Such information has been subjected to the auditing procedures applied in the audit of the basic financial statements and certain additional procedures, including comparing and reconciling such information directly to the underlying accounting and other records used to prepare the basic financial statements or to the basic financial statements themselves, and other additional procedures in accordance with auditing standards generally accepted in the United States of America. In our opinion, the combining and individual nonmajor fund financial statements, schedules of expenditures of federal awards and state financial assistance are fairly stated in all material respects in relation to the basic financial statements as a whole.
2

The introductory section, financial schedules and statistical section have not been subjected to the auditing procedures applied in the audit of the basic financial statements and, accordingly, we do not express an opinion or provide any assurance on them.
Other Reporting Required by Government Auditing Standards
In accordance with Government Auditing Standards, we have also issued our report dated December 7, 20 15 on our consideration of the Hoboken Public Schools' internal control over financial reporting and on our tests of its compliance with certain provisions of laws, regulations, contracts, and grant agreements and other matters. The purpose of that report is to describe the scope of our testing of internal control over financial reporting and compliance and the results of that testing, and not to provide an opinion on internal control over financial reporting or on compliance. That report is an integral part of an audit performed in accordance with Government Auditing Standards in considering the Hoboken Public Schools' internal control over financial reporting and compliance.
Fair Lawn, New Jersey December 7, 20 15
3
~;Lc-LL .. / !.~~ )_L ;J INC! & HIGGIN~~
Cert1fied Public Accountants

MANAGEMENT'S DISCUSSION AND ANALYSIS

HOBOKEN PUBLIC SCHOOLS HOBOKEN, NEW JERSEY
Management's Discussion and Analysis For the Fiscal Year Ended June 30,2015
This section of the Hoboken Public Schools' annual financial report presents our discussion and analysis of the District's financial performance during the fiscal year that ended on June 30, 2015. Please read it in conjunction with the transmittal letter at the front of this report and the District's financial statements, which immediately follows this section.
FINANCIAL HIGHLIGHTS
Key financial highlights for the 2014-2015 fiscal year include the following:
• The assets and deferred outflows of resources of the Hoboken Public School exceeded its liabilities and deferred inflows of resources at the close of the fiscal year by $1,915,213 (Net Position).
• The District's total net position increased $1,723,399.
• Overall district revenues were $73,634,996. General revenues accounted for $45,962,341 or 62% of all revenues. Program specific revenues in the form of charges for services and grants and contributions accounted for $27,672,655 or 38% of total revenues.
• Overall district expenses were $71,911,597. Governmental activities accounted for $70,764,345 or 98% of all expenses. Business-type activities accounted for $1,14 7,252 or 2% of all expenses.
• The school district had $70,764,345 in expenses for governmental activities; only $26,693,701 of these expenses were offset by program specific charges, grants or contributions. General revenues (predominantly property taxes and unrestricted State and Federal aid) of $45,890,654 were adequate to provide for these programs.
• As of the close of the current fiscal year, the District's governmental funds reported a combined ending fund balance of$5,457,668 an increase of$1,854,128 when compared to the previous year's ending fund balance.
• The General Fund unassigned fund balance on a GAAP basis at June 30, 2015 was a deficit of $18,816 an increase of $13 8,145 when compared with the beginning balance at July 1, 2014 of a deficit of $156,961. The deficit in the unassigned fund balance is a result of a delay in the payment of state aid until the following fiscal year.
• The General Fund unassigned budgetary fund balance at June 30, 2015 was $1,175,085, which represents a slight increase of$42,877 when compared to the ending unassigned budgetary fund balance at June 30, 2014 of $1,132,208.
4

HOBOKEN PUBLIC SCHOOLS HOBOKEN, NEW JERSEY
Management's Discussion and Analysis For the Fiscal Year Ended June 30,2015
OVERVIEW OF THE FINANCIAL STATEMENTS
The financial section of the annual report consists of four parts - Independent Auditor's Report, required supplementary information which includes the management's discussion and analysis (this section), the basic financial statements, and supplemental information. The basic financial statements include two kinds of statements that present different views of the District:
• The first two statements are district wide financial statements that provide both short-term and long-term information about the District's overall financial status.
• The remaining statements are fund financial statements that focus on individual parts of the District, reporting the District's operations in more detail than the district-wide statements.
The governmental funds statements tell how basic services were financed in the short term as well as what remains for future spending.
Proprietary funds statements offer short-term and long-term financial information about the activities the district operated like businesses.
Fiduciary funds statements provide information about the financial relationships in which the District acts solely as a trustee or agent for the benefit of others to whom the resources belong.
The financial statements also include notes that explain the information in the statements and provide more detailed data. The following illustration shows how the various parts of this annual report are arranged and related to one another.
J. Management's
Discussion and
Analysis
GovernmentWide
Financial Statements
•
J. Basic
Financial Statements
.--~----·---
Fund Financial
Statements
• Required
Supplementary Information
Notes to the
Financial Statements
Summary 14 ~ '-I_D_et_a_il--'
5

HOBOKEN PUBLIC SCHOOLS HOBOKEN, NEW JERSEY
Management's Discussion and Analysis For the Fiscal Year Ended June 30,2015
The following table summarizes the major features of the District's financial statements, including the portion of the District's activities they cover and the types of information they contain. The remainder of this overview section of management's discussion and analysis highlights the structure and contents of each ofthe statements.
Major .Features of the District-Wide and Fund Financial Statements
District-Wide Fund Financial Statements
Statements Governmental Funds Proprietary Funds Fiduciary Funds
Scope 8ntire district (except The activities of the district that are Activities the district llnstances in which the district 1duciary funds ot proprietary or fiduciary, such as perates similar to dministers resources held in trust,
Regular and Special Education rivate businesses: uch as Unemployment, Payroll nstruction and Building maintenance Enterprise Fund Agency and Student Activities
Required financial tatements of Net Position Balance Sheet tatement of Net Position tatements of
statements tatement of Activities tatement of Revenues, tatement of Revenue, Fiduciary Net Position
Expenditures and Changes in fExpenses, and Changes in tatement of Changes
Fund Balances und Net Position in Fiduciary Net Position
Statement of Cash Flows
Accounting Basis and Accrual accounting and Modified accrual accounting Accrual accounting and Accrual accounting
Measurement focus conomic resources focus nd current financial focus conomic resources focus nd economic resources
~ocus
ype of asset/ All assets, liabilities, and Generally assets expected to be All assets, liabilities and All assets and liabilities,
deferred outflows/ eferred outHows/inflows sed up and liabilities and deferred · nd deferred inflows of oth shorHenn and
inflows of resources/ f resources both financial inflows of resources that come esources, both ong-term funds do not
liability information nd capital, short-term ue during the year or soon there financial and capital, urrently contain
nd long-term fter; no capital assets or long-tenn nd short-term and long- apital assets.
liabilities included enn
Type of inflow/outflow All revenues and expenses Revenues for which cash is received All revenues and expenses All additions and
information uring year, regardless of uring or soon after the end of the uring the year, regardless edications during the
when cash is received or ear; expenditures when goods or f when cash is received ear, regardless of when
aid ervices have been received and the rpaid. ash is received or paid.
elated liability is due and payable.
District-wide financial statements
The district-wide statements report information about the District as a whole using accounting methods similar to those used by private-sector companies. The statement of net position includes all of the District's assets, deferred outflows of resources, liabilities and deferred inflows of resources. All of the current year's revenues and expenses are accounted for in the statement of activities regardless of when cash is received or paid.
The two district-wide statements report the District's net position and how they have changed. Net position- the difference between the District's assets/deferred outflows of resources and liabilities/deferred inflows of resourcesis one way to measure the District's financial health or position.
6

HOBOKEN PUBLIC SCHOOLS HOBOKEN, NEW JERSEY
Management's Discussion and Analysis For the Fiscal Year Ended June 30,2015
District-wide financial statements (continued)
• Over time, increases or decreases in the District's net position are an indicator of whether its financial position is improving or deteriorating, respectively.
• To assess the overall health of the District you need to consider additional non-financial factors such as changes in the District's property tax base and the condition of school buildings and other facilities.
In the district-wide financial statements the District's activities are shown in two categories:
• Governmental activities- Most of the District's basic services are included here, such as regular and special education, transportation, administration and plant operations and maintenance. Property taxes and state aids finance most of these activities.
• Business type activities -These funds are used to account for operations that are financed and operated in a manner similar to private business enterprises. The District's Food Service Fund and After Care Program Fund are included under this category.
Fund financial statements
The fund financial statements provide more detailed information about the District's funds - focusing on its most significant or "major" funds - not the District as a whole. Funds are accounting devices the District uses to keep track of specific sources of funding and spending on particular programs:
• Some funds are required by State law and bond covenants.
• The District establishes other funds to control and manage money for particular purposes or to show that it is properly using certain revenues (federal and state grants).
The District has three kinds of funds:
• Governmental funds- Most of the District's basic services are included in governmental funds, which generally focus on (I) how cash and other financial assets that can readily be converted to cash flow in and out and (2) the balances left at year-end that are available for spending. Consequently, the governmental funds statements provide a detailed short-term view that helps to determine whether there are more or fewer financial resources that can be spent in the near future to finance the District's programs. Because this information does not encompass the additional long-term focus of the district-wide statements, we provide additional information at the bottom of the governmental funds statements that explains the relationship (or differences) between them.
• Proprietary funds - Services for which the District charges a fee are generally reported in proprietary funds. Proprietary funds are reported in the same way as the district-wide statements.
7

HOBOKEN PUBLIC SCHOOLS HOBOKEN, NEW JERSEY
Management's Discussion and Analysis For the Fiscal Year Ended June 30,2015
Fund financial statements (continued)
Enterprise Funds - This fund is established to account for operations that are financed and operated in a manner similar to private business enterprises. The stated intent is that costs of providing goods or services to the students on a continuing basis are financed or recovered prhnarily through user charges. The District currently has two enterprise funds.
• Food Service (Cafeteria) • After Care Program
• Fiduciary funds - The District is the trustee, or fiduciary, for assets that belong to others. The District is responsible for ensuring that the assets reported in these funds are used only for their intended purposes and by those to whom the assets belong. All of the District's fiduciary activities are reported in a separate statement of fiduciary net position and a statement of changes in fiduciary net position. We exclude these activities from the district-wide financial statements because the District cannot use these assets to finance its operations.
Notes to the financial statements
The notes provide additional information that is essential to a full understanding of the data provided in the government-wide and fund financial statements. The notes to the financial statements can be found following the financial statements.
Other Information
In addition to the financial statements and accompanying notes, this report also presents certain required supplementary information concerning the District's budget process. The District adopts an annual expenditure budget for the general and special revenue funds. A budgetary comparison statement has been provided for the general and special revenue funds as required supplementary information. The required supplementary information can be found following the notes to the financial statements.
The District also presents required supplementary information regarding the accounting and financial reporting for pensions as required under GASB Statement No. 68. The required supplementary information can be found following the notes to the financial statements.
Combining statements and schedules are presented immediately following the major budgetary comparisons.
DISTRICT-WIDE FINANCIAL ANALYSIS
Net position may serve over time as a useful indicator of a government's financial position. In the case of the District, assets and deferred outflows of resources exceeded liabilities and deferred inflows of resources by $1,915,213 as of June 30, 2015 and $191,814 as of June 30, 2014.
8

HOBOKEN PUBLIC SCHOOLS HOBOKEN, NEW JERSEY
Management's Discussion and Analysis For the Fiscal Year Ended June 30,2015
By far the largest portion of the District's net position reflects its investment in capital assets (e.g., land and improvements, buildings and improvements, construction in progress, vehicles, furniture and equipment); less any related debt used to acquire those assets that are still outstanding. The District uses these capital assets to provide services to its students; consequently, these assets are not available for future spending. Although the District's investment in its capital assets is reported net of related debt, it should be noted that the resources needed to repay this debt must be provided from other sources, since the capital assets themselves cannot be used to liquidate these liabilities.
Net Position As of June 30, 2015 and 2014
Governmental Activities Business-Tyge Activities Total 2015 2014 2015 2014 2015 2014
Current Assets $ 8,209,649 $ 6,524,504 $ 334,532 $ (490,183) $ 8,544,181 $ 6,034,321 Capital Assets 15,695,870 18,101,726 100,426 112,834 15,796,296 18,214,560
Total Assets 23,905,519 24,626,230 434,958 (377,349) 24,340,477 24,248,881
Deferred Amounts on Net Pension Liability 955,576 955,576
Total Deferred Outflows of Resources 955,576 955,576
Total Assets and Deferred Outflows of Resources 24,861,095 24,626,230 434,958 (377,349) 25,296,053 24,248,881
Long-Term Liabilities 19,575,398 21,034,876 19,575,398 21,034,876 Other Liabilities 2,755,909 2,926,201 182,375 93,196 2,938,284 3,019,397
Total Liabilities 22,331,307 23,961,077 182,375 93,196 22,513,682 24,054,273
Deferred Amounts on Net Pension Liability 867,158 867,158
Deferred Commodities Revenues 2,794 2,794
Total Deferred Inflows of Resources 867,158 2,794 867,158 2,794
Total Liabilities and Deferred Inflows of Resources 23,198,465 23,961,077 182,375 95,990 23,380,840 24,057,067
Net Position Net Investment in Capital Assets 15,140,800 17,346,656 100,426 112,834 15,241,226 17,459,490 Restricted 2,210,737 849,225 2,210,737 849,225 Unrestricted (Deficit) (15,688,907) (17,530,728) 152,157 (586,173) (15,536,750) (18,116,901)
Total Net Position $ 1,662,630 $ 665, !53 $ 252,583 $ (473,339) $ 1,915,213 $ 191,814
9

HOBOKEN PUBLIC SCHOOLS HOBOKEN, NEW JERSEY
Management's Discussion and Analysis For the Fiscal Year Ended June 30,2015
Change in Net Position For The Fiscal Years Ended June 30,2015 and 2014
Govemmental Activities Business-TyQe Activities Total
2015 2014 2015 2014 2015 2014
Revenues
Program Revenues
Charges for Services $ 650,355 $ 437,980 $ 367,396 $ 401,065 $ 1,017,751 $ 839,045
Operating Grants and Contributions 25,820,471 20,604,088 611,558 641,072 26,432,029 21,245,160
Capital Grants and Contributions 222,875 31,316 222,875 31,316
General Revenues
Property Taxes 39,426,390 38,220,173 39,426,390 38,220,173
State and Federal Aid 6,308,459 6,048,614 6,308,459 6,048,614 Other 155,805 145,613 71,687 81,259 227,492 226,872
Total Revenues 72,584,355 65,487,784 1,050,641 1,123,396 73,634,996 66,611,180
Expenses
Instruction
Regular 35,297,094 32,250,508 35,297,094 32,250,508
Special Education 7,567,897 6,628,785 7,567,897 6,628,785
Other Instruction 95,316 115,067 95,316 115,067
School Sponsored Activities and Athletics 1,379,540 1,079,547 1,379,540 1,079,547
Adult/Continuing Education 4,883 4,883
Support Services
Student and Instruction Related Services 11,383,511 10,209,494 11,383,511 10,209,494
School Administrative Services 2,691,487 2,327,720 2,691,487 2,327,720
General Administrative Services 1,040,516 913,777 1,040,516 913,777
Central and Other Support Services 1,023,391 1,073,621 1,023,391 1,073,621
Plant Operations and Maintenance 8,838,717 7,467,784 8,838,717 7,467,784
Pupil Transportation 1,438,187 1,551,318 1,438,187 1,551,318
Interest on Long-Term Debt 8,689 12,001 8,689 12,001
Food Services 1,033,361 1,023,661 1,033,361 1,023,661 After Care Program 113,891 107,378 113,891 107,378
Total Expenses 70,764,345 63,634,505 1,147,252 1,131,039 71,911,597 64,765,544
Increase/(Decrease) in Net Position
Before Transfers 1,820,010 1,853,279 (96,611) (7,643) 1,723,399 1,845,636
Transfers (822,533) (482,960) 822,533 482,960
Change in Net Position 997,477 1,370,319 725,922 475,317 1,723,399 1,845,636
Net Position, Beginning of Year 665,153 14,877,978 (473,339) (1,051,494) 191,814 13,826,484
Prior Period Adjustment (15,583,144) 102,838 (15,480,306)
Net Position, End of Year $ 1,662,630 $ 665,153 $ 252,583 $ (473,339) $ 1,915,213 $ 191,814
10

HOBOKEN PUBLIC SCHOOLS HOBOKEN, NEW JERSEY
Management's Discussion and Analysis For the Fiscal Year Ended June 30, 2015
Governmental Activities. The District's total governmental activities' revenues, which includes State and Federal grants, were $72,584,355 and $65,487,784 for the years ended June 30, 2015 and June 30, 2014, respectively. Property taxes of $39,426,390 and $38,220,173 which represented 54% and 58% of the revenues for the fiscal years ended June 30,2015 and 20 14, respectively. Another significant portion of revenues came from State aid; total State, Federal and formula aid was $32,351,805 and $26,684,018 which represented 45% and 41% of the revenues for the fiscal years ended June 30, 2015 and 2014, respectively. A large pmtion of the increase in this revenue type is attributable to the adjustment to the onbehalf TP AF contribution to recognize the actuarially determined amount that should have been contributed on behalf of the District. This adjustment which impacts both the revenues and expenses of the governmental activities was $4,270,044. Charges for services from tuition, transportation fees and rentals of $650,355 and $437,980 represented less than 1% of total revenues for the fiscal years ended June 30, 2015 and 2014, respectively. In addition, miscellaneous income is earned which includes items such as interest, prior year refunds and other miscellaneous items.
The total cost of all governmental activities programs and services were $70,764,345 and $63,634,505 for the fiscal years ended June 30, 2015 and 2014, respectively. The District's expenses are predominantly related to educating and caring for students. Instruction totaled $44,339,847 and $40,078,790 (63% and 63%) of total expenses for the fiscal years ended June 30, 2015 and 2014, respectively. Support services inclusive of interest on long-term debt totaled $26,424,498 and $23,555,715 (37% and 37%) oftotal expenses.
Revenues by Source- Governmental Activities For Fiscal Year 2015
Federal, State Aid and
45%
Other
Expenses by Type- Governmental Activities For Fiscal Year 2015
School, Central &
GeneraiAdmin.
Pupil Transportation
2%
Plant Oper. & Maint. 12%
Student and
Instruction Services
16%
-----.
11
Instruction 63%

HOBOKEN PUBLIC SCHOOLS HOBOKEN, NEW JERSEY
Management's Discussion and Analysis For the Fiscal Year Ended June 30,2015
Total and Net Cost of Governmental Activities. The District's total cost of services were $70,764,345 and $63,634,505 for the fiscal years ended June 30, 2015 and 2014, respectively. After applying program revenues, derived from charges for services of $650,355 and $437,980 operating grants and contributions of $25,820,471 and $20,604,088; and capital grants and contributions of $222,875 and $31,316, for the fiscal year ended June 30, 2015 and 2014, respectively; the net cost of services of the District were $44,070,644 and $42,561,121 for the fiscal years ended June 30, 2015 and 2014, respectively.
Total and Net Cost of Governmental Activities For the Fiscal Years Ended June 30,2015 and 2014
Net Cost
Total Cost of Services of Services 2015 2014 2015 2014
Instruction
Regular $ 35,297,094 $ 32,250,508 $ 20,419,835 $ 19,169,665
Special Education 7,567,897 6,628,785 3,211,411 3,792,183
Other Instruction 95,316 115,067 95,316 115,067
School Sponsored Activities and Athletics 1,379,540 1,079,547 1,051,680 997,821
Adult & Continuing Education 4,883 4,883
Support Services
Student and Instruction Related Services 11,383,511 10,209,494 6,905,817 7,042,916
General Administrative Services 1,040,516 913,777 1,040,516 791,482
School Administrative Services 2,691,487 2,327,720 1,686,802 I ,829,315
Central and Other Support Services I ,023,391 1,073,621 1,023,391 949,442
Plant Operations and Maintenance 8,838,717 7,467,784 7,346,296 6,318,132
Pupil Transportation 1,438,187 1,551,318 1,280,891 1,538,214
Interest on Long-Term Debt 8,689 12,001 8,689 12,001
Total $ 70,764,345 $ 63,634~505 $ 44,070,644 $ 42,561,121
Business-Type Activities- The District's total business-type activities revenues were $1,050,641 and $1,123,396 for the fiscal years ended June 30, 2015 and June 30, 2014. Charges for services accounted for 35% and 36% of total revenues and operating grants and contributions accounted for 58% and 57% of total revenue for the fiscal years ended June 30, 2015 and 2014. The balance of the revenue for the fiscal years ended June 30, 2015 and 2014, respectively, is a guaranteed profit provision received from the food service management company.
The total cost of all business-type activities programs and services were $1,147,252 and $1,131,039 for the fiscal years ended June 30, 2015 and 2014. The District's expenses are related to Food Service programs provided to all students, teachers and administrators within the District as well as the expenses related to the After Care Program available in Wallace and Calabro Schools. The Food Service Program was also subsidized by transfers from the General Operating Fund during the fiscal year ended June 30, 2015. These transfers were part of the District's corrective action plan to fund the accumulated deficit in the fund.
12

HOBOKEN PUBLIC SCHOOLS HOBOKEN, NEW JERSEY
Management's Discussion and Analysis For the Fiscal Year Ended June 30,2015
FINANCIAL ANALYSIS OF THE DISTRICT'S FUNDS
As noted earlier, the District uses fund accounting to ensure and demonstrate compliance with finance-related legal requirements.
Governmental Funds
The focus of the District's governmental funds is to provide information on near-term inflows, outflows, and balances of spendable resources. Such information is useful in assessing the District's financing requirements. In particular, unassigned fund balance may serve as a useful measure of the District's net resources available for spending at the end of the fiscal year.
The fmancial performance of the District as a whole is reflected in its governmental funds as well. As the District completed the year, its governmental funds reported a combined fund balance of $5,457,668 for the fiscal year ended June 30, 2015 compared to a fund balance of $3,603,540 for the year ended June 30, 2014, an increase of $1,854,128 for the year.
Revenues for the District's governmental funds were $68,314,311 and $65,487,784, while total expenses and other financing uses, net were $66,460,183 and $64,431,628 for the fiscal years ended June 30, 2015 and 2014.
General Fund - The General Fund is the chief operating fund of the District and includes the primary operations in providing educational services to students from pre-kindergarten through grade 12 including pupil transportation activities and capital outlay projects.
The following schedule presents a comparison of General Fund Revenues for the fiscal years ended June 30, 2015 and 2014:
Fiscal Year Ended Amount of June 30, Increase Percent
2015 2014 (Decrease) Change
Local Sources Property Tax Levy $ 39,426,390 $ 37,946,477 $ 1,479,913 4% Tuition 73,500 100,636 (27,136) -27% Miscellaneous 732,656 482,941 249,715 52%
State Sources 14,234,774 14,133,204 101,570 1%
Federal Sources 393,862 281,505 112,357 40%
Total General Fund Revenues $ 54,861,182 $ 52,944,763 $ 1,916,419 4%
Local property taxes increased by 4% from the previous year. State aid revenues increased $101,570, predominantly attributable to an additional State Aid allocation. The Federal aid revenues increased by $112,357 or 40% which was mainly due to a significant increase in Medical Assistance (SEMI) program reimbursements submitted by the District. Miscellaneous revenues increased $249,715 or 52% due primarily to the increase in rental fees obtained from charter schools and other local entities.
13
General Fund (Continued)
HOBOKEN PUBLIC SCHOOLS HOBOKEN, NEW JERSEY
Management's Discussion and Analysis For the Fiscal Year Ended June 30,2015
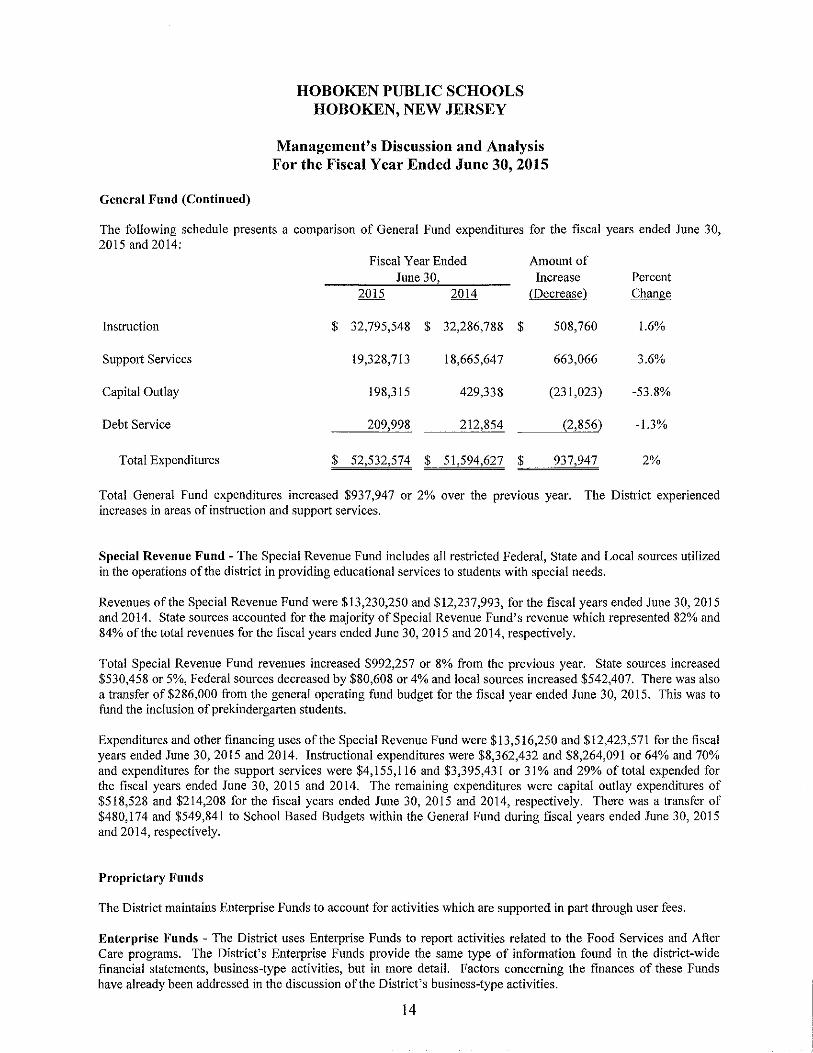
The following schedule presents a comparison of General Fund expenditures for the fiscal years ended June 30, 2015 and 2014:
Fiscal Year Ended Amount of June 30, Increase Percent
2015 2014 (Decrease) Change
Instruction $ 32,795,548 $ 32,286,788 $ 508,760 1.6%
Support Services 19,328,713 18,665,647 663,066 3.6%
Capital Outlay 198,315 429,338 (231,023) -53.8%
Debt Service 209,998 212,854 (2,856) -1.3%
Total Expenditures $ 52,532,574 $ 51,594,627 $ 937,947 2%
Total General Fund expenditures increased $937,947 or 2% over the previous year. The District experienced increases in areas of instruction and support services.
Special Revenue Fund- The Special Revenue Fund includes all restricted Federal, State and Local sources utilized in the operations of the district in providing educational services to students with special needs.
Revenues of the Special Revenue Fund were $13,230,250 and $12,237,993, for the fiscal years ended June 30,2015 and 2014. State sources accounted for the majority of Special Revenue Fund's revenue which represented 82% and 84% of the total revenues for the fiscal years ended June 30, 2015 and 2014, respectively.
Total Special Revenue Fund revenues increased $992,257 or 8% from the previous year. State sources increased $530,458 or 5%, Federal sources decreased by $80,608 or 4% and local sources increased $542,407. There was also a transfer of$286,000 from the general operating fund budget for the fiscal year ended June 30, 2015. This was to fund the inclusion of prekindergarten students.
Expenditures and other financing uses of the Special Revenue Fund were $13,516,250 and $12,423,571 for the fiscal years ended June 30, 2015 and 2014. Instructional expenditures were $8,362,432 and $8,264,091 or 64% and 70% and expenditures for the support services were $4,155,116 and $3,395,431 or 31% and 29% of total expended for the fiscal years ended June 30, 2015 and 2014. The remaining expenditures were capital outlay expenditures of $518,528 and $214,208 for the fiscal years ended June 30, 2015 and 2014, respectively. There was a transfer of $480,174 and $549,841 to School Based Budgets within the General Fund during fiscal years ended June 30,2015 and 2014, respectively.
Proprietary Funds
The District maintains Enterprise Funds to account for activities which are supported in part through user fees.
Enterprise Funds - The District uses Enterprise Funds to report activities related to the Food Services and After Care programs. The District's Enterprise Funds provide the same type of information found in the district-wide financial statements, business-type activities, but in more detail. Factors concerning the finances of these Funds have already been addressed in the discussion of the District's business-type activities.
14

HOBOKEN PUBLIC SCHOOLS HOBOKEN, NEW JERSEY
Management's Discussion and Analysis For the Fiscal Year Ended June 30,2015
GENERAL FUND BUDGETARY HIGHLIGHTS
The District's budget is prepared according to New Jersey Department of Education guidelines, and is based on accounting for certain transactions on the basis of cash receipts, disbursements and encumbrances. The most significant budgetary fund is the General Fund.
Over the course of the year, the District revised the annual operating budget several times. These budget amendments were due to adjusted budgets for specially funded projects, which include both federal and state grants.
General Fund budgetary revenues and other financing sources exceeded budgetary expenditures and other financing uses increasing budgetary fund balance $1,604,981 over the previous year. After deducting restrictions, commitments and assignments, the unassigned budgetary fund balance increased $42,877 from a balance of $1,132,208 at June 30, 2014 to a balance of$1,175,085 atJune 30, 2015.
CAPITAL ASSETS
The District's investment in capital assets for its governmental and business type activities as of June 30,2015 and 2014 amounted to $15,796,296 and $18,214,560 (net of accumulated depreciation). The capital assets consist of land, land improvements, buildings, building improvements, computers, specialized machinery and various other types of equipment. Depreciation charges for fiscal years 2014-2015 and 2013-2014 amounted to $3,181,819 and $2,175,304 for governmental activities and $12,408 and $9,683 for business-type activities.
Land Improvements Building and Building Improvements Machinery and Equipment
Total Capital Assets, Net
Capital Assets at June 30,2015 and 2014 (Net of Accumulated Depreciation)
Govemmcnta! Activities Business-Type Activities
$ 479,411 $ 548,658 14,475,283 16,852,662
741,176 700,406 $ 100,426 $ 112,834
$ 15,695,870 $ 18,101,726 $ 100,426 $ 112,834
$ 479,411 $ 548,658 14,475,283 16,852,662
841,602 813,240
$ 15,796,296 $ 18,214,560
Additional information on the District's capital assets is presented in the Notes to the Financial Statements of this report.
LONG TERM LIABILITIES
At year end, the District's long-term liabilities consisted of compensated absences payable of $4,424,440 and $5,704,529, claims and judgements of$-0- and $266,432, capital leases payable of$600,000 and $800,000, and net pension liability of$14,550,958 and $14,263,915 for the fiscal years ended June 30,2015 and 2014, respectively.
Additional information of the District's long-term liabilities is presented in the Notes to the Financial Statements of this report.
15

HOBOKEN PUBLIC SCHOOLS HOBOKEN, NEW JERSEY
Management's Discussion and Analysis For the Fiscal Year Ended June 30,2015
ECONOMIC FACTORS AND NEXT YEAR'S BUDGET
Many factors were considered by the District's administration during the process of developing the fiscal year 2014-2015 budget. The primary factors were the District's projected student population, anticipated state and federal aid as well as increasing salary and related benefit costs.
These indicators were considered when adopting the budget for fiscal year 2015-2016. Budgeted expenditures in the General Fund decreased less than one percent to $53,466,416 in fiscal year 2015-2016.
CONTACTING THE DISTRICT'S FINANCIAL MANAGEMENT
This financial report is designed to provide our citizens, taxpayers, customers, and investors and creditors with a general overview of the District's finances and to demonstrate the District's accountability for the money it receives. If you have questions about this report or need additional information contact the School Business Adminisn·ator, Hoboken Board of Education, 158 Fourth Street Street, Hoboken, NJ 07030.
16

BASIC FINANCIAL STATEMENTS

EXHIBIT A-1
HOBOKEN PUBLIC SCHOOLS STATEMENT OF NET POSITION
AS OF JUNE 30,2015
Governmental Business-Type Activities Activities Total
ASSETS
Cash and Cash Equivalents $ 6,872,065 $ 73,066 $ 6,945,131 Restricted Assets- Cash with fiscal Agents 45,011 45,011 Receivables, Net I, 180,855 252,139 1,432,994 Inventories 9,327 9,327 Prepaid Items 111,718 111,718 Capital Assets, Net
Capital Assets, Being Depreciated 15,695,870 100,426 15,796,296
Total Assets 23,905,519 434,958 24,340,477
DEFERRED OUTFLOWS OF RESOURCES Deferred Amounts on Net Pension Liability 955,576 955,576
Total Deferred Outflows of Resources 955,576 955,576
Total Assets and Deferred Outflows of Resources 24,861,095 434,958 25,296,053
LIABILITIES
Accounts Payable and Other Current Liabilities 687,011 231,015 918,026 Internal Balances 48,640 (48,640) Accrued Interest 3,928 3,928 Payable to State Government 32,500 32,500 Unearned Revenue 1,983,830 1,983,830 Noncurrent Liabilities
Due Within One Year 1,445,616 1,445,616 Due Beyond One Year 18,129,782 18,129,782
Total I ,iabilities 22,331,307 182,375 22,513,682
DEFERRED INFLOW OF RESOURCES Deferred Amounts on Net Pension Liability 867,158 867,158
Total Deferred Inflow of Resources 867,158 867,158
Total Liabilities and Deferred Inflows of Resources 23,198,465 182,375 23,380,840
NET POSITION
Net Investment in Capital Assets 15,140,800 100,426 15,241,226 Restricted for:
Capital Projects 1,103,104 1,103,104 Other Purposes 1,107,633 1,107,633
Unrestricted (15,688,907) 152,157 (15,536,750)
Total Net Position $ 1,662,630 $ 252,583 $ 1,915,213
The accompanying Notes to the Financial Statements are an Integral Part of this Statement.
17

EXHffiiTA-2
HOBOKEX PUBLIC SCHOOLS STATEMENT OF ACTIVITIES
FOR THE FISCAL YEAR ENDED JUNE 30, 2015 Net (Expense) Revenue and
Program Revenues Changes in Net Position Operating Capital
Charges for Grants and Grants and Governmental Business-Type Functions/Programs ~enses Services Contributions Contributions Activities Activities Total
Governmental Activities
Instruction
Regular $ 35,297,094 $ 14,877,259 $ (20,419,835) $ (20,419,835) Special Education 7,567,897 $ 73,500 4,282,986 (3,211,411) (3,211,411)
Other Instruction 95,316 (95,316) (95,316) School Sponsored Activities and Athletics 1,379,540 327,860 (1,051,680) (1,051,680)
Support Services Student and Instruction Related Svcs. 11,383,511 4,477,694 (6,905,817) (6,905,817)
School Administrative Services 2,691,487 1,004,685 (1,686,802) (1,686,802)
General Administrative Svcs. 1,040,516 (1,040,516) (1,040,516)
Plant Operations and Maintenance 8,838,717 543,838 725,708 s 222,875 (7,346,296) (7,346,296)
Central Services & Adm. Inf. Technology 1,023,391 (1,023,391) (1,023,391)
Pupil Transportation 1,438,187 33,017 124,279 (1,280,891) (1,280,891)
Interest on Long-Term debt 8,689 (8,689) (8,689)
Total Governmental Activities 70,764,345 650,355 25,820,471 222,875 (44,070,644) (44,070,644)
;;; Business-Type Activities
Food Service 1,033,361 227,255 611,558 $ (194,548) (194,548)
After Care Program 113,891 140,141 26,250 26,250
Total Business-Type Activities 1,147,252 367,396 611,558 (168,298) (168,298)
Total Primary Government $71,91),;597 $_ 1,017,751 _$ __ , ~§ •. ~.~-~Ql2_ $ 222,875 (44,070,644) (168,298) (44,238,942)
The accompanying Notes to the Financial Statements are an Integral Part of this Statement. (Continued)

"'
HOBOKEN PUBLIC SCHOOLS STATEMENT OF ACTIVITIES
FOR THE FISCAL YEAR ENDED JUNE 30, 2015
General Revenues and Transfers
General Revenues
Taxes:
Property Taxes, Levied for General Purposes
Unrestricted State and Federal Aid
Miscellaneous
Transfers
Total General Revenues and Transfers
Change in Net Position
Net Position, Beginning of Year (Restated)
Net Position, End of Year
The accompanying Notes to the Financial Statements are an Integral Part of this Statement
$
$
Governmental
Activities
39,426,390
6,308,459
155,805 (822,533)
45,068,121
997,477
665,153
1,662,630
Net (Expense) Revenue and
Changes in Net Position
$
$
Business-Type Activities
71,687
822,533
894,220
725,922
(473,339)
252,583
$
$
EXHIBIT A-2
Total
39,426,390 6,308,459
227,492
45,962,341
1,723,399
191,814
1,915,213

FUND FINANCIAL STATEMENTS

EXHIBIT B-1
HOBOKEN PUBLIC SCHOOLS GOVERNMENTAL FUNDS
BALANCE SHEET AS OF JUNE 30,2015
Special Capital Total General Revenue Projects Governmental
Fund Fund Fund Funds
ASSETS Cash and Cash Equivalents $ 5,487,609 $ I,IHI,434 $ 203,022 $ 6,H72,065
Due From Other Funds 8,326 8,326 Receivables From Other Governments 121,720 357,847 685,275 I,164,H42
Accounts Receivables 7,437 250 7,687 Prepaid Items 111,718 111,718
Restricted Assets- Cash with Fiscal Agents 45,011 45,011
Total Assets $ 5,736,810 $ I ,539,531 $ 933,308 $ 8,209,649
LIABILITIES Liabilities Accounts Payable $ 242,644 $ 208,476 $ 451,120 Due to Other Funds 48,640 48,640 Payable to State Government 32,500 32,500 Other Currentl,iabilitics 235,891 235,891
Unearned Revenue I ,298,555 $ 685,275 I ,983,830
Total Liabilities 527,175 I ,539,531 685,275 2,751 ,981
FUND BALANCES Restricted
Capital Reserve 900,001 900,001
Maintenance Reserve I, I 07,633 1,[07,633 Excess Surplus 437,748 437,748 Capital Projects 248,033 248,033
Assigned Year End Hncumbrances 2,055,002 2,055,002 Designated for Subsequent Years' Expenditures 69! ,530 691,530
ARRA/SEM!- Designated for Subsequent
Year's Expenditures 36,537 36,537
Unassigned
General (18,816) ( 18,816)
Total Fund Balances 5,209,635 248,033 5,457,668
Total Liabilities and Fund Balances $ 5,736,810 $ 1,539,531 $ 933,308
The accompanying Notes to the Financial Statements are an Integral Pmt of this Statement
20

HOBOKEN PUBLIC SCHOOLS GOVERNMENTAL FUNDS
BALANCE SHEET AS OF JUNE 30, 2015
Total Fund Balances (Exhibit B-1)
Amounts reported for governmental activities in the statement of net position (A-1) are different because:
Capital assets used in governmental activities are not financial resources and therefore are not reported in the funds. The cost of the assets is $65,112,695 and the accumulated depreciation is $49,416,825.
Certain amounts resulting from the measurement of the net pension liability are reported as either deferred inflows of resources or deferred outflows of resources on the statement of net position and deferred over future years.
Deferred Outflows of Resources Deferred Inflows of Resources
The District has financed capital assets through the issuance of long-term lease obligations. The interest accrual at year end is:
$
Long-term liabilities, including capital leases payable, and net pension liability are not due and payable in the current period and therefore are not reported as liabilities in the funds .
Compensated Absences
Capital Leases Payable Net Pension Liability
Net Position of Governmental Activities
The accompanying Notes to the Financial Statements are an Integral Part of this Statement 21
955,576 (867,158)
( 4,424,440)
(600,000) (14,550,958)
$
$
EXHIBITB-1
5,457,668
15,695,870
88,418
(3,928)
(19,575,398)
1,662,630
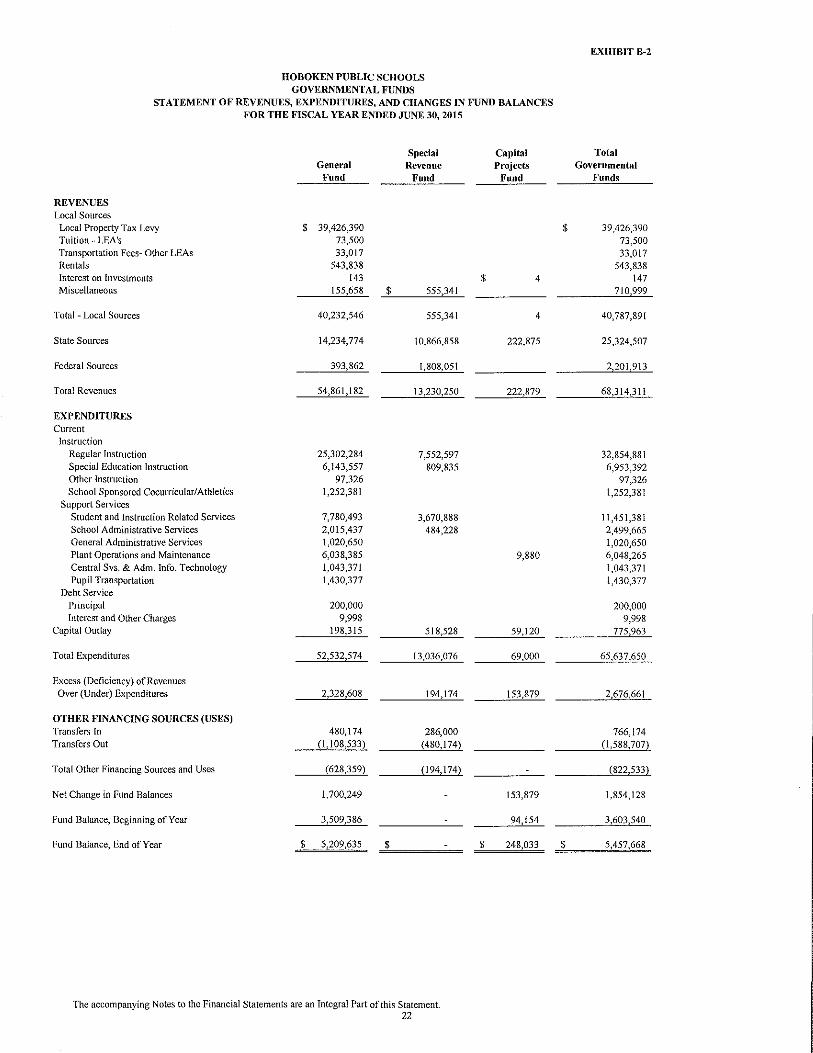
HOBOKEN PUBLIC SCHOOLS GOVERNMENTAL FUNDS
STATEMENT OF REVENUES, EXPENDITURES, AND CHANGES IN FUND BALANCES FOR THE FISCAL YEAR ENDED JUNE 30, 2015
Special General Revenue
Fund Fund
REVENUES Local Sources
Local Property Tax Levy $ 39,426,390 Tuition- LEA's 73,500 Transportation Fees- Other LEAs 33,017 Rentals 543,838 Interest on Investments 143 Miscellaneous 155,658 $ 555,341
Total- Local Sources 40,232,546 555,341
State Sources 14,234,774 10,866,858
Federal Sources 393,862 1,808,051
Total Revenues 54,861,182 13,230,250
EXPENDITURES Current
Instruction Regular Instruction 25,302,284 7,552,597 Special Education Instruction 6,143,557 809,835 Other Instruction 97,326 School Sponsored Cocurricular/ Athletics 1,252,381
Support Services Student and Instruction Related Services 7,780,493 3,670,888 School Administrative Services 2,015,437 484,228 General Administrative Services 1,020,650 Plant Operations and Maintenance 6,038,385 Central Svs. & Adm. Info. Technology 1,043,371 Pupil Transportation 1,430,377
Debt Service Principal 200,000 Interest and Other Charges 9,998
Capital Outlay 198,315 518,528
Total Expenditures 52,532,574 13,036,076
Excess (Deficiency) of Revenues Over (Under) Expenditures 2,328,608 194,174
OTHER FINANCING SOURCES (USES) Transfers In 480,174 286,000 Transfers Out (1,108,533) (480,174)
Total Other Financing Sources and Uses (628,359) (194,174)
Net Change in Fund Balances 1,700,249
Fund Balance, Beginning of Year 3,509,386
Fund Balance, End of Year $ 5,209,635 $
The accompanying Notes to the Financial Statements are an Integral Part of this Statement. 22
Capital Projects
Fund
$ 4
4
222,875
222,879
9,880
59,120
69,000
153,879
153,879
94,154
$ 248 033
EXIIIBIT B-2
Total Governmental
Funds
$ 39,426,390 73,500 33,017
543,838 147
710 999
40,787,891
25,324,507
2 201 913
68,314311
32,854,881 6,953,392
97,326 1,252,381
11,451,381 2,499,665 1,020,650 6,048,265 1,043,371 1,430,377
200,000 9,998
775 963
65,637,650
2 676 661
766,174 (1,588,707)
(822,533)
I ,854,128
3,603 540
$ 5,457 668

HOBOKEN PUBLIC SCHOOLS RECONCILIATION OF THE GOVERNMENTAL FUNDS STATEMENT OF
REVENUES, EXPENDITURES AND CHANGES IN FUND BALANCES WITH THE DISTRICT-WIDE STATEMENTS
FOR THE FISCAL YEAR ENDED JUNE 30, 2015
Total Net Change in Fund Balances- Governmental Funds (Exhibit B-2)
Amounts reported for governmental activities in the statement of activities are different because:
Capital outlays to purchase or build capital assets are reported in governmental funds as expenditures. However, for governmental activities those costs are shown in the statement and allocated over their estimated useful lives as annual depreciation expense. This is the amount by which depreciation exceeds capital outlay in the current period.
Capital Outlays Depreciation Expense
The issuance of long-term debt (e.g., bonds, leases) provides current financial resources to governmental funds, while the repayment of the principal of long-term debt consumes the current financial resources of governmental funds. Neither transaction, however, has any effect on net position.
Principal repayments: Down Payment on Capital Lease
In the statement of activities, certain operating expenses - compensated absences and claims and judgements- are measured by the amounts earned or incurred during the year. In the governmental funds, however, expenditures for these items are measured by the amount of financial resources used (paid):
Net Decrease in Compensated Absences Decrease in Claims and Judgments for Self Insurance Increase in Pension Expense
Interest on long-term debt in the statement of activities differs from the amount reported in the governmental funds because interest is recorded as an expenditure in the funds when it is due, and thus requires the use of current financial resources. In the statement of activities, however, interest expense is recognized as the interest accrues, regardless of when it is due.
Decrease in Accrued Interest
Change in Net Position of Governmental Activities (Exhibit A-2)
The accompanying Notes to the Financial Statements are an Integral Part of this Statement 23
$ 775,963 (3,181,819)
1,280,089 266,432
(198,625)
EXHIBITB-3
$ 1,854,128
(2,405,856)
200,000
1,347,896
1,309
$ 997,477

ASSETS
Current Assets Cash Due (h)m Other Funds
Accounts Receivable Federal State Other
Inventories
Total Current Assets
Capital Assets Furniture, Machinery, and Equipment Less: Accumulated Depreciation
Total Capital Assets , Net
Total Assets
LIABILITIES
Currentl,iabilities Accounts Payable
Total Current Liabilities
NET POSITION
Investment in Capital Assets
Unrestricted
Total Net Position
HOBOKEN PUBLIC SCHOOLS
PROPRIETARY FUNDS STATEMENT OF NET POSITION
AS OF JUNE 30,2015
The accompanying Notes to the Financial Statements are an Integral Part of this Statement. 24
$
$
EXIIIBIT B-4
Business -Type Activities- Enterprise Funds
Food Service
$ 48,640
167,2XI 3,013
81,845 9,327
310,106
170,418 (69,992)
11111,426
Non-Major Enterprise
Fund
73,066
73,066
$ 73,066 48,640
167,281 3,013
81,845 9 327
383,172
1711,418 (69.992)
I 00,426 ------
410,532
230,555
230,555
I 00,426
79 551
179,977 $
73,066
460
460
72 606
483,598
231,015
231 015
100,426 152 157
72,6116 $~' ~~25"'2"',5~8~3
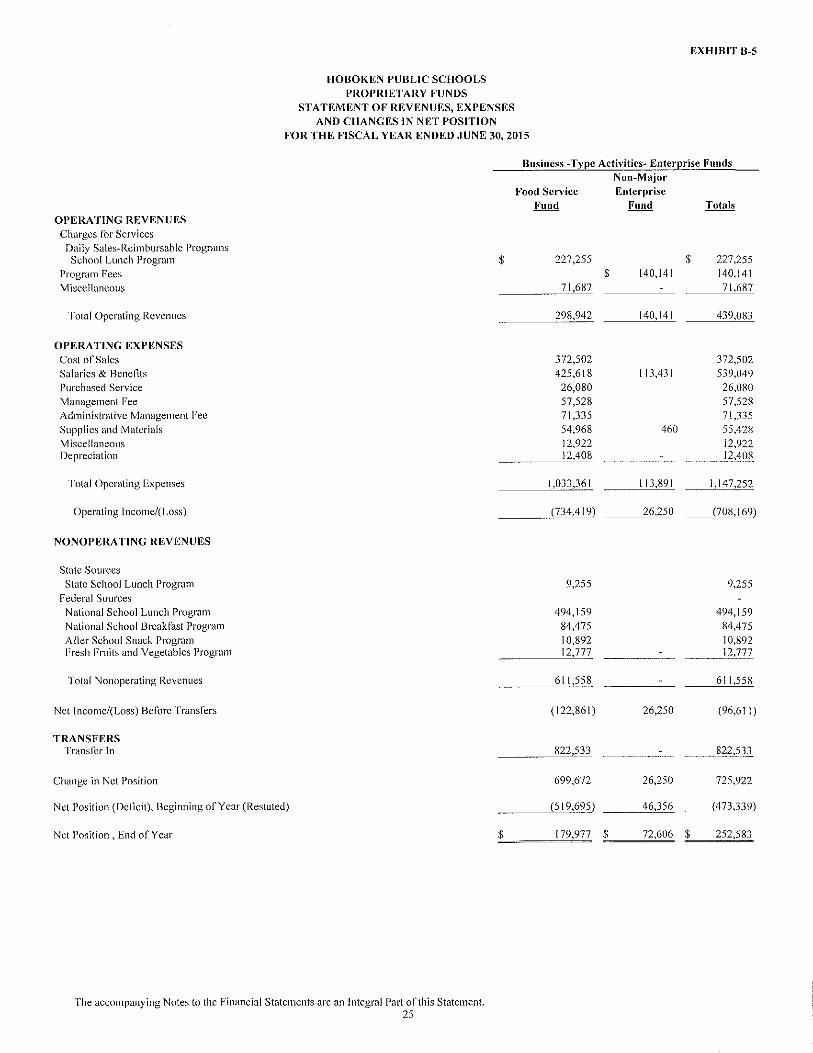
HOBOKEN PUBLIC SCHOOLS PROPRIETARY FUNDS
STATEMENT OF REVENUES, EXPENSES AND CHANGES IN NET POSITION
EXHIBIT B-5
FOR THE FISCAL YEAR ENDED .IUNE 30,2015
OPERATING REVENUES Charges fOr Services
Daily Sales-Reimbursable Programs School Lunch Program
Program Fees
Miscellaneous
Total Operating Revenues
OPERATING EXPENSES Cost of Sales
Salaries & Benerils Purchased Service Management Fee Administrative Management Fee Supplies and Materials
Miscellaneous Depreciation
Total Operating Expenses
Operating Income/(Loss)
NONOPERATING REVENUES
State Sources State School Lunch Program
Federal Sources National School Lunch Program
National School Breakfast Program Aller School Snack Program fresh Fruits and Vegetables Program
Total Nonoperating Revenues
Net Income/(Loss) Before 'J'ransfhs
TRANSFERS Transfer In
Change in Net Position
Net Position (DeHcit), !3eginning of Year (Restated)
Net Position , End of Year
The accompanying Notes to the Financial Statements are an Integral Part of this Statement. 25
$
$
Business-Type Activities- Enterprise Funds
Food Scr·vice Fund
227,255
71,687
298,942
372,502 425,618
26,080 57,528
71,335 54,968 12,922 12,408
I ,033,36 I
(734,4 I 9)
9,255
494,159
84,475 10,892 12,777
611,558
( 122,861)
822,533
699,672
(519,695)
[ 79,977
$
$
Non-Major· Enterprise
Fund
140,141
140,141
113,431
460
I 13,891
26,250
26,250
26,250
46,356
72,606
$
$
227,255 140,141 71,687
439,083
372,502 539,049
26,080 57,528
71,335 55,428 12,922 12,408
1,147,252
(708, 169)
9,255
494,159 84,475
10,892 12,777
61 1,558
(96,611)
822,533
725,922
(473,339)
252,583

HOBOKEN PUBLIC SCHOOLS PROPRIETARY FUNDS
STATEMENTS OF CASH FLOWS
EXHIBIT B-6
FOR THE FISCAL YEAR ENDED .JUNE 30,2015
Cash Flows from Operating Activities Cash Receipts from Customers Cash Receipts from Other Sources (Prior Year Guarantee) Cash Payments for Salaries and Benelits Cash Payments to Suppliers for Goods and Services
Net Cash Provided/ (Used) By Operating Activities
Cash Flows from Noncapital Financing Activities Cash Received from State and Federal Sources Advance from General Fund
Net Cash Provided Uy Noncapital Financing Activities
Net Increase in Cash
Cash, Beginning of Year
Cash , End of Year
Reconciliation of Operating Income/( Loss) to Net Cash Provided (Used) By Operating Activities:
Operating Income/( Loss)
Adjustments to Reconcile Operating Income/(Loss) to Net Cash Provided (Used) by Operating Activities
Depreciation Expense Non-Cash Federal Assistance-Food Distribution Program
Changes in Assets, Liabilities and Defcncd InJlows of Resources (lncrease)/Decrease in Other Receivables (lncrcase)/Dccrcase in Inventories lncrease/(Decreasc) in Deferred ln!lnws of Resources Increase/( Decrease) in Accounts Payable
Total Adjustments
Net Cash Used by Operating Activities
Non-Cash Investing Capital and Financing Activities Value Received for Food Distribution Program
The accompanying Notes to the Financial Statements are an Integral Part of this Statement. 26
$
$
$
$
$
Business-Type Activities- Enterj!rise Funds Non-Major
Food Service Enterprise Fund Fund Totals
217,097 $ 140,141 $ 357,238 81,259 81,259
(425,618) ( 113,43 I) (539,049) (357 ,569) (357,569)
( 484,831) 26,710 (458,121)
49\,092 491,092 (6,261) (6,261)
484,831 484,831
26,710 26,710
46,356 46,356
$ 73,066 $ 73,066
(734,419) $ 26,250 $ (70S, 169)
12,408 12,408 71,130 71,1311
(586) (586) 32,1171 32,071 (2,794) (2,794)
137,359 4611 137,819
249,588 460 250,048
( 484,831) $ 26,710 $ (458,121)
68,336

ASSETS Cash and Cash Equivalents Prepaid Item
Total Assets
LIABILITIES
HOBOKEN PUBLIC SCHOOLS FIDUCIARY FUNDS
STATEMENT OF FIDUCIARY NET POSITION AS OF JUNE 30, 2015
$
$
Judge Zamrin Memorial
Scholarship Funds
Payroll Deductions and Withholdings Due to Other Funds Accrued Salaries and Wages (Deficit) Due to Student Groups
Total Liabilities
NET POSITION
Reserved for Scholarships $
The accompanying Notes to the Financial Statements are an Integral Part of this Statement. 27
EXHIBIT B-7
$
$
$
$
Agency Fund
369,988 722
370,710
263,548 8,326
(3,885) 102,721
370,710

HOBOKEN PUBLIC SCHOOLS FIDUCIARY FUNDS
STATEMENT OF CHANGES IN FIDUCIARY NET POSITION FOR THE FISCAL YEAR ENDED JUNE 30, 2015
ADDITIONS
Investment Earnings Interest
Total Additions
DEDUCTIONS Other- Funds Returned to Donors
Total Deductions
Change in Net Position
Net Position, Beginning of Year
Net Position, End of Year
$
$
$
EXHIBIT B-8
Judge Zamrin Memorial
Scholarship Fund
5,773
5,773
(5,773)
5,773
The accompanying Notes to the Financial Statements are an Integral Part of this Statement. 28

NOTES TO THE FINANCIAL STATEMENTS

HOBOKEN PUBLIC SCHOOLS NOTES TO THE FINANCIAL STATEMENTS FOR THE FISCAL YEAR ENDED JUNE 30, 2015
NOTE 1 SUMMARY OF SIGNIFICANT ACCOUNTING POLICIES
A. Reporting Entity
The Hoboken Public Schools (the "Board" or the "District") is an instrumentality of the State of New Jersey, established to fimction as an education institution. The Board consists of nine elected officials and is responsible for the fiscal control of the District. A superintendent is appointed by the Board and is responsible for the administrative control of the District. Under existing statutes, the Board's duties and powers include, but are not limited to, the development and adoption of a school program; the establishment, organization and operation of schools; and the acquisition, maintenance and disposition ofschoolproperty.
The Board also has broad financial responsibilities, including the approval of the annual budget and the establishment of a system of accounting and budgetary controls.
The reporting entity is composed of the primary government, component units, and other organizations that are included to ensure that the financial statements of the District are not misleading. The primary government consists of all funds, departments, boards and agencies that are not legally separate from the District. For the Hoboken Public Schools this includes general operations, food service, after school child care and student related activities of the District.
Component units are legally separate organizations for which the District is financially accountable. The District is financially accountable for an organization if the District appoints a voting majority of the organization's governing board and (1) the District is able to significantly influence the programs or services perfonned or provided by the organization; or (2) the District is legally entitled to or can otherwise access the organization's resources; the District is legally obligated or has otherwise assumed the responsibility to finance the deficits of, or provide financial support to, the organization; or the District is obligated for the debt of the organization. Component units may also include organizations that are fiscally dependent on the District in that the District approves the budget, the issuance of debt or the levying of taxes. Based on the foregoing criteria, the District has no component units. Furthermore, the District is not includable in any other reporting entity as a component unit.
B. New Accounting Standards
During fiscal year 2015, the District adopted the following GASB statements:
•
•
GASB 68, Accounting and Financial Reporting for Pensions. The objective of this Statement is to improve accounting and financial reporting by state and local governments for pensions. It also improves information provided by state and local governmental employers about financial support for pensions that is provided by other entities. This Statement replaces the requirements of Statement No. 27, Accounting for Pensions by State and Local Governmental Employers, as well as the requirements of Statement No. 50, Pension Disclosures, as they relate to pensions that are provided through pension plans administered as trusts or equivalent arrangements that meet certain criteria.
GASB 71, Pension Transition for Contributions Made Subsequent to the Measurement Date- an amendment of GASB Statement No. 68, should be applied simultaneously with the provisions of Statement No. 68. The objective of this Statement is to address an issue regarding application of the transition provisions of Statement No. 68, Accounting and Financial Reporting for Pensions. The issue relates to amounts associated with contributions, if any, made by a state or local government employer or nonemployer contributing entity to a defined benefit pension plan after the measurement date of the government's beginning net pension liability.
29
HOBOKEN PUBLIC SCHOOLS NOTES TO THE FINANCIAL STATEMENTS FOR THE FISCAL YEAR ENDED JUNE 30, 2015
NOTE 1 SUMMARY OF SIGNIFICANT ACCOUNTING POLICIES (Continued)
B. New Accounting Standards (Continued)
Other accounting standards that the District is currently reviewing for applicability and potential impact on the financial statements include:
• GASB 72, Fair Value Measurement and Application, will be effective beginning with the fiscal year ending June 30, 2016. This Statement addresses accounting and financial reporting issues related to fair value measurements. This Statement provides guidance for determining a fair value measurement for financial reporting purposes. This Statement also provides guidance for applying fair value to certain investments and disclosures related to all fair value measurements.
• GASB 73, Accounting and Financial Reporting for Pensions and Related Assets that Are Not Within the Scope of GASB Statement 68, and Amendments to Certain Provisions of GASB Statements 67 and 68, will be effective beginning with the fiscal year ending June 30, 2017. The objective of this Statement is to improve the usefulness of information about pensions included in the general purpose external financial reports of state and local governments for making decisions and assessing accountability.
• GASB 74, Financial Reporting for Postemployment Benefit Plans Other than Pension Plans, will be effective beginning with the fiscal year ending June 30, 2017. The objective of this Statement is to improve the usefulness of information about postemployment benefits other than pensions (other postemployment benefits or OPEB) included in the general purpose external financial reports of state and local governmental OPEB plans for making decisions and assessing accountability.
• GASB 75, Accounting and Financial Reporting for Postemployment Benefits Other Than Pensions, will be effective beginning with the fiscal year ending June 30, 2018. The primary objective of this Statement is to improve accounting and financial reporting by state and local governments for postemployment benefits other than pensions (other postemployment benefits or OPEB). It also improves information provided by state and local governmental employers about financial support for OPEB that is provided by other entities.
• GASB 76, The Hierarchy of Generally Accepted Accounting Principles for State and Local Governments, will be effective begitming with the fiscal year ending June 30, 2016. The objective of this Statement is to identifY- in the context of the current governmental financial reporting environment - the hierarchy of generally accepted accounting principles (GAAP). The "GAAP hierarchy" consists of the sources of accounting principles used to prepare financial statements of state and local governmental entities in conformity with GAAP and the framework for selecting those principles. This Statement reduces the GAAP hierarchy to two categories of authoritative GAAP and addresses the use of authoritative and nonauthoritative literature in the event that the accounting treatment for a transaction or other event is not specified within a source of authoritative GAAP.
C. Basis of Presentation - Financial Statements
The financial statements include both district-wide financial statements (based on the District as a whole) and fund financial statements (based on specific District activities or objectives). Both the district-wide and fund financial statements categorize activities as either governmental activities or business-type activities. While separate district-wide and fund financial statements are presented, they are interrelated. In the district-wide financial statements, the governmental activities column incorporates data from governmental funds, while business-type activities incorporate data from the District's enterprise funds. Fiduciary funds are excluded from the district-wide financial statements.
30

HOBOKEN PUBLIC SCHOOLS NOTES TO THE FINANCIAL STATEMENTS FOR THE FISCAL YEAR ENDED JUNE 30, 2015
NOTE 1 SUMMARY OF SIGNIFICANT ACCOUNTING POLICillS (Continued)
C. Basis of Presentation - Financial Statements (Continued)
District-Wide Financial Statements
The district-wide financial statements (i.e., the statement of net position and the statement of activities) report information on all of the nonfiduciary activities of the Board of Education. All fiduciary activities are reported only in the fund financial statements. For the most part, the effect of interfund activity has been removed from these statements. Governmental activities, which normally are supported by property taxes and intergovernmental revenues, are reported separately from business-type activities, which rely to a significant extent on fees and charges for support. In the statement of net position, both the governmental and business-type activities columns (a) are presented on a consolidated basis by column, and (b) reflect on a full accrual economic resource basis, which incorporates long-term assets and receivables as well as long-term debt and obligations.
The statement of activities demonstrates the degree to which the direct expenses of a given function or segment are offset by program revenues. Direct expenses are those that are clearly identifiable with a specific function or segment. Program revenues include I) charges to customers or other governmental entities, including other school districts, who purchase, use, or directly benefit from goods or services provided by a given function or segment and 2) grants and contributions that are restricted to meeting the operational or capital requirements of a particular function or segment. Property taxes, unrestricted state aid, federal and state grants for school-based budgeting and other items not properly included among program revenues are reported instead as general revenues.
As a general rule the effect of interfund activity has been eliminated from the district-wide financial statements. Exceptions to this general rule are charges between the Board's proprietary and fiduciary funds since elimination of these charges would distort the direct costs and program revenues reported for the various functions concerned.
Fund Financial Statements
Separate fund financial statements are provided for governmental, proprietary, and fiduciary activities, even though the latter are excluded from the district-wide financial statements. The emphasis of fund financial statements is on major individual governmental and enterprise funds, each reported as separate columns in the fund financial statements. All remaining governmental and enterprise funds are aggregated and reported as nonmajor funds. The District considers all of its governmental and food service enterprise funds to be major funds.
The District reports the following major governmental funds:
The general fond is the School District's primary operating fund. It accounts for all financial resources of the District, except those to be accounted for in another fund.
The special revenue fond accounts for the proceeds of specific revenue sources legally restricted to expenditures for specified purposes. This fund accounts for federal, state and local financial programs, with the exception of grants for major capital projects and the child nutrition programs.
The capital projects fund accounts for the proceeds from the sale of bonds, lease purchases and other revenues used for the acquisition or construction of capital facilities and other capital assets, other than those financed by the proprietary funds.
31

HOBOKEN PUBLIC SCHOOLS NOTES TO THE FINANCIAL STATEMENTS FOR THE FISCAL YEAR ENDED JUNE 30, 2015
NOTE 1 SUMMARY OF SIGNIFICANT ACCOUNTING POLICffiS (Continued)
C. Basis of Presentation- Financial Statements (Continued)
Fund Financial Statements (Continued)
The District reports the following major proprietary fund which is organized to be self-supporting through user charges:
The food service fond accounts for the activities of the school cafeteria, which provides food service to students as well as a Ia carte and catering services for teachers and special events.
The District reports the following non-major proprietary fund which is organized to be self-supporting through user charges:
The after care program fond accounts for the activities of the District's after care prot,>rarn which provides extended school day program activities.
Additionally, the government reports the following fund types:
The fiduciary trust fond is used to account for resources legally held in trust for private donations for scholarship awards and agency fund. All resources of the fund, including any earnings on invested resources, may be used to support the intended purpose. There is no requirement that any portion of these resources be preserved as capital. The agency funds account for assets held by the district as an agent for student activities, payroll deductions and withholding. The funds for the student activities fund are solely for Noninstructional student activities and the school administration does not have management involvement. The payroll funds are held to remit withholdings to respective state, federal and other agencies.
Activity between funds that are representative of lending/borrowing arrangements outstanding at the end of the fiscal year are referred to as either "due to/from other funds" (i.e., the current portion of interfund loans) or "advances to/from other funds" (i.e., the non-current portion of interfund loans). All other outstanding balances between funds are reported as "due to/from other funds". Any residual balances outstanding between the governmental activities and business-type activities are reported in the district-wide financial statements as "internal balances".
Reclassifications
Certain amounts presented in the prior year data may have been reclassified in order to be consistent with the current year's presentation.
32

HOBOKEN PUBLIC SCHOOLS NOTES TO THE FINANCIAL STATEMENTS FOR THE FISCAL YEAR ENDED JUNE 30, 2015
NOTE 1 SUMMARY OF SIGNIFICANT ACCOUNTING POLICIES (Continued)
D. Measurement Focus and Basis of Accounting
The accounting and financial reporting treatment is determined by the applicable measurement focus and basis of accounting. Measurement focus indicates the type of resources being measured such as cun·ent financial resources or economic resources. The basis of accounting indicates the timing of transactions or events for recognition in the financial statements.
The district-wide financial statements are reported using the economic resources measurement focus and the accrual basis of accounting, as are the proprietary fund and fiduciary fund financial statements with the exception of the agency fund which does not have a measurement focus. All assets, all liabilities and all deferred outflows/inflows of resources associated with these operations (with the exception of the fiduciary funds) are included on the Statement of Net Position. Revenues are recorded when earned and expenses are recorded at the time liabilities are incurred, regardless of the timing of related cash flows. Property taxes are recognized as revenues in the year for which they are levied. Grants and similar items are recognized as revenue as soon as all eligibility requirements imposed by the provider have been met.
Governmental fund financial statements are reported using the current financial resources measurement focus and the modified accrual basis of accounting. Revenues are recognized when susceptible to accrual (i.e. when they are both measurable and available). Revenues are considered to be available when they are collectible within the current period or soon enough thereafter to pay liabilities of the current period. For this purpose, the Board considers revenues to be available if they are collected within 60 days after year-end. Expenditures are recorded when a liability is incurr-ed, as under accrual basis of accounting, with the exception of debt service expenditures as well as expenditures related to compensated absences and claims and judgments which are recorded only when payment is due. General capital asset acquisitions are reported as expenditures in governmental funds. Issuance of long-term debt and acquisitions under capital leases are reported as other financing sources.
Property taxes, tuition, transportation fees, unrestricted state aid, and interest associated with the current fiscal period are all considered to be susceptible to accrual and so have been recognized as revenues of the current fiscal period. Entitlements (formula-type grants and aid) are recorded as revenues when all eligibility requirements are met, including any time requirements, and the amount is received during the period or within the availability period for this revenue source. Expenditure-driven grants and similar awards (reimbursement-type grants and awards) are recognized as revenue when the qualifYing expenditures have been incurred and all other eligibility requirements imposed by the grantor or provider have been met, and the amount is received during the period or within the availability period for this revenue source. All other revenue items are considered to be measurable and available only when cash is received by the District.
When both restricted and unrestricted resources are available for use, it is the government's policy to use restricted resources first, then unrestricted resources as they are needed.
E. Assets, Liabilities, Deferred Outflows/Inflows of Resources, and Net Position/Fund Balance
1. Cash, Cash Equivalents and Investments
Cash and cash equivalents are considered to be cash on hand, demand deposits, and short-term investments with original maturities of three months or less from the date of acquisition.
Investments are reported at fair value and are limited by N.J.S.A. 18A:20-37.
2. Receivables
All receivables are reported at their gross value, and where appropriate, are reduced by the estimated portion that is expected to be uncollectible.
33

HOBOKEN PUBLIC SCHOOLS NOTES TO THE FINANCIAL STATEMENTS FOR THE FISCAL YEAR ENDED JUNE 30, 2015
NOTE 1 SUMMARY OF SIGNIFICANT ACCOUNTING POLICIES (Continued)
E. Assets, Liabilities, Deferred Outflows/Inflows of Resources, and Net Position/Fund Balance (Continued)
3. Inventories
The cost of inventories of the governmental fund types are recorded as expenditures at the time individual inventory items are purchased.
Food Service Fund inventories, exclusive of the federal commodities, are valued at cost, using the first-in first-out (FIFO) method and consist of food and expendable supplies. The cost of such inventories is recorded as expenses when consumed rather than when purchased. The United States Department of Agriculture (USDA) commodity portion of the Food Service Fund inventory consists of food donated by the USDA. It is valued at estimated market prices by the USDA.
4. Prepaid Items
Certain payments to vendors reflect costs applicable to future accounting periods and are recorded as prepaid items in both district-wide and fund financial statements. The cost of prepaid items is recorded as expenditures/expenses when consumed rather than when purchased.
5. Restricted Assets
Certain assets are classified as restricted on the balance sheet because they are maintained in separate bank accounts and their use is limited by Lease-Purchase Agreements for capital projects.
6. Capital Assets
Capital assets, which include property, plant and equipment, are reported in the applicable governmental or business-type activities columns in the district-wide financial statements. Capital assets are defined by the Board as assets with an initial, individual cost of $2,000 and an estimated useful life in excess of two years. The District was able to estimate the historical cost for the initial reporting of these capital assets through back trending. As the District constructs or acquires additional capital assets each period, they are capitalized and reported at historical cost. Donated capital assets are recorded at estimated fair market value at the date of donation. The costs of normal maintenance and repairs that do not add to the value of the asset or materially extend its useful life are not capitalized.
Major outlays for capital assets and improvements are capitalized as projects are constructed. Interest incurred during the construction phase of capital assets of business-type activities is included as part of the capitalized value of the assets constructed.
34

HOBOKEN PUBLIC SCHOOLS NOTES TO THE FINANCIAL STATEMENTS FOR THE FISCAL YEAR ENDED JUNE 30, 2015
NOTE 1 SUMMARY OF SIGNIFICANT ACCOUNTING POLICIES (Continued)
E. Assets, Liabilities, Deferred Outflows/Inflows ofResonrces, and Net Position/Fund Balance (Continued)
6. Capital Assets (Continued)
Land and construction in progress are not depreciated. The other property, plant, and equipment of the District IS
depreciated using the straight line method over the following estimated useful lives:
Land Improvements Buildings Building Improvements Machinery and Equipment
7. Deferred Outflows/Inflows of Resources
20 20-50
20 5-15
In addition to assets, the statement of financial position will sometimes report a separate section for deferred outflows of resources. This separate financial statement element, deferred outflows of resources, represents a consumption of net position that applies to a future period(s) and so will not be recognized as an outflow of resources (expense/expenditure) until then. The government has one item which arises only under the accrual basis of accounting that qualifies for reporting in this category. The item is the deferred amounts on net pension liability. Deferred amounts on net pension liability are reported in the district-wide statement of net position and result from: (1) differences between expected and actual experience; (2) changes in assumptions; (3) net difference between projected and actual investment eamings on pension plan investments; ( 4) changes in proportion and differences between employer contributions and proportionate share of contributions; and (5) contributions made subsequent to the measurement date. These amounts are deferred and amortized over future years.
In addition to liabilities, the statement of financial position will sometimes report a separate section for deferred inflows of resources. This separate financial statement element, deferred inflows of resources, represents an acquisition of net position that applies to a future period(s) and so will not be recognized as an inflow of resources (revenue) until that time. The government has one type of item which arises only under the accrual basis of accounting that qualifies for reporting in this category. The item that qualifies for reporting in this category are the deferred amounts on net pension liability. Deferred amounts on net pension liability are reported in the district-wide statement of net position and result from: (!)differences between expected and actual experience; (2) changes in assumptions; (3) net difference between projected and actual investment earnings on pension plan investments; and (4) changes in proportion and differences between employer contributions and proportionate share of contributions. These amounts are deferred and amortized over future years.
8. Compensated Absences
It is the District's policy to permit employees to accumulate (with ce1tain restrictions) earned but unused vacation and sick leave benefits. A long-term liability of accumulated vacation and sick leave and salary related payments has been recorded in the governmental activities in the district-wide financial statements, representing the Board's commitment to fund such costs from future operations. Proprietary Funds accrue accumulated vacation, personal and sick leave and salary related payments in the period that they are earned. A liability is reported in the governmental funds only to the amount actually due at year end as a result of employee resignations and retirements.
35

HOBOKEN PUBLIC SCHOOLS NOTES TO THE FINANCIAL STATEMENTS FOR THE FISCAL YEAR ENDED JUNE 30, 2015
NOTE 1 SUMMARY OF SIGNIFICANT ACCOUNTING POLICIES (Continued)
E. Assets, Liabilities, Deferred Outflows/Inflows of Resources, and Net Position/Fund Balance (Continued)
9. Pensions
In the district-wide financial statements, for purposes of measuring the net pension liability, deferred outflows of resources and deferred inflows of resources related to pensions, and pension expense, information about the fiduciary net position of the retirement systems sponsored and administered by the State of New Jersey and additions to/deductions from these retirement systems' fiduciary net position have been determined on the same basis as they are reported by the retirement systems. For this purpose, benefit payments (including refunds of employee contributions) are recognized when due and payable in accordance with the benefit terms. Investments are reported at fair value.
In the governmental fund financial statements, net pension liabilities represent amounts normally expected to be liquidated with expendable available financial resources for required pension contributions that are due and payable at year end. Pension expenditures are recognized based on contractual pension contributions that are required to be made to the pension plan during the fiscal year.
10. Long-Term Obligations
In the district-wide financial statements, and proprietary fund types in the fund financial statements, long-term debt and other long-term obligations are reported as liabilities in the applicable governmental activities, business-type activities, or proprietary fund type statement of net position.
11. Net Position/Fund Balance
District-Wide Statements
In the district-wide statements, there are three classes of net position:
• Net Investment in Capital Assets- consists of net capital assets (cost less accumulated depreciation) reduced by outstanding balances of related debt obligations from the acquisition, construction or improvement of those assets. Deferred outflows of resources and deferred inflows of resources attributable to the acquisition, construction or improvement of those assets or related debt also should be included.
• Restricted Net Position- repmts net position when constraints placed on the residual amount of noncapital assets are either externally imposed by creditors (such as through debt covenants), grantors, contributors, or laws or regulations of other governments, or imposed by law through constitutional provisions or enabling legislation.
• Unrestricted Net Position - any portion of net position not already classified as either net investment in capital assets or net position -restricted is classified as net position - unrestricted.
Governmental Fund Statements
Fund balance categories are designed to make the nature and extent of the constraints placed on the District's fund balance more transparent. These categories are comprised of a hierarchy based primarily on the extent to which the District is bound to observe constraints imposed upon the use of the resources reported in governmental funds.
36

HOBOKEN PUBLIC SCHOOLS NOTES TO THE FINANCIAL STATEMENTS FOR THE FISCAL YEAR ENDED JUNE 30, 2015
NOTE 1 SUMMARY OF SIGNIFICANT ACCOUNTING POLICIES (Continued)
E. Assets, Liabilities, Deferred Outflows/Inflows ofResonrces, and Net Position/Fund Balance (Continued)
Governmental Fund Statements (Continued)
Restricted Fund Balance- Amounts constrained to specific purposes by their providers (such as grantors, bondholders, and higher levels of govermnent), through constitutional provisions, or by enabling legislation.
Capital Reserve -This restriction was created by the District in accordance with NJAC 6A:23A-14.1 to fund future capital expenditures (See Note 2.)
Maintenance Reserve - This restriction was created by the Board in accordance with NJAC 6A:23A-14.2 to accumulate fuuds for the required maintenance of school facilities in accordance with the EFCA (NJSA 18A:7G-9) for a thorough and efficient education.
Excess Surplus- This restriction was created in accordance with NJSA 18A:7F-7 to represent the June 30, 2015 audited excess surplus that is required to be appropriated in the 2016/2017 original budget certified for taxes.
Capital Projects - Represents fund balance restricted specifically for capital acquisitions and improvements in the Capital Projects Fund.
Assigned Fund Balance - Amounts a government intends to use for a specific purpose; intent can be expressed by the governing body or by an official or body to which the governing body delegates the authority.
Year-End Encumbrances - Represent outstanding purchase orders for goods or services approved by management for specific purposes from available resources of the current year for which the goods and materials have not yet been received or the services have not yet been rendered at June 30.
Designated for Subsequent Year's Expenditures - This designation was created to dedicate the portion of fund balance appropriated in the adopted 2015/2016 District budget certified for taxes.
ARRAISEMI- Designated for Subsequent Year's Expenditures - This designation was created to dedicate the portion of the ARRAISEMI revenue that is unexpended at June 30, 2015 that will be appropriated either by Board resolution into the 2015/2016 budget or in the adopted 2016/2017 budget certified for taxes.
Unassigned Fund Balance - Represents fund balance that has not been restricted, committed or assigned to specific purposes within the governmental funds.
In the general operating fund and other governmental funds (capital projects and debt service fund types), it is the District's policy to consider restricted resources to have been spent first when an expenditure is incurred for purposes for which both restricted and unrestricted (i.e., committed, assigned or unassigned) fund balances are available, followed by committed and then assigned fund balances. Unassigned amounts are used only after the other resources have been used.
37

HOBOKEN PUBLIC SCHOOLS NOTES TO THE FINANCIAL STATEMENTS FOR THE FISCAL YEAR ENDED JUNE 30, 2015
NOTE 1 SUMMARY OF SIGNIFICANT ACCOUNTING POLICIES (Continued)
E. Assets, Liabilities, Deferred Ontflowsllntlows of Resources, and Net Position/Fund Balance (Continued)
Governmental Fnnd Statements (Continued)
12. Fund Balance Policies
Fund balance of governmental funds is reported in various categories based on the nature of any limitations requiring the use of resources for specific purposes. The government itself can establish limitations on the use of resources through either a commitment (committed fund balance) or an assignment (assigned fund balance).
The committed fund balance classification includes amounts that can be used only for the specific purposes determined by a formal action of the government's highest level of decision-making authority. The Board of Trustees is the highest level of decision-making authority for the government that can, by adoption of a resolution or formal Board action prior to the end of the fiscal year, commit fund balance. Once adopted, the limitation imposed by the resolution remains in place until a similar action is taken (the adoption of another resolution) to remove or revise the limitation.
Amounts in the assigned fund balance classification are intended to be used by the government for specific purposes but do not meet the criteria to be classified as committed. The Board has authorized the School Business Administrator/Board Secretary to assigned fund balance. The Board may also assign fund balance as it does when appropriating fund balance to cover a gap between estimated revenue and appropriations in the subsequent year's appropriated budget. Unlike commitments, assignments generally only exist temporarily. In other words, an additional action does not normally have to be taken for the removal of an assignment. Conversely, as discussed above, an additional action is essential to either remove or revise a commitment.
F. Revenues and Expenditures/Expenses
1. Program Revenues
Amounts reported as program revenues in the district-wide statement of activities include I) charges to customers or applicants for goods or services, provided, 2) operating grants and contributions, and 3) capital grants and contributions. Internally dedicated resources are reported as general revenues rather than as program revenues. Likewise, general revenues include all property taxes, unrestricted state aid, federal and state grants for school-based budgeting investment earnings and miscellaneous revenues.
2. Property Taxes
Property taxes are levied pursuant to law and are collected by the municipality and are transferred to the District as requested. Property tax revenues are recognized in the year they are levied and become available. Property taxes collected in advance of the year-end for which they are levied and transferred to the District are reported as deferred inflows of resources. The tax bills are mailed annually in June by the municipal tax collector and are levied and due in four quarterly installments on August I, November I, February I and May I of the fiscal year. When unpaid, taxes or any other municipal lien, or part thereof, on real property, remains in arrears on April I" in the year following the calendar year levy when the same became in arrears, the tax collector of the municipality shall, subject to the provisions of New Jersey Statute, enforce the lien by placing the property on a tax sale. The municipality may institute annual "in rem" tax foreclosure proceedings to enforce the tax collection or acquisition of title to the property.
38

HOBOKEN PUBLIC SCHOOLS NOTES TO THE FINANCIAL STATEMENTS FOR THE FISCAL YEAR ENDED JUNE 30, 2015
NOTE 1 SUMMARY OF SIGNIFICANT ACCOUNTING POLICIES (Continued)
F. Revenues and Expenditures/Expenses (Continued)
3. Tuition Revenues and Expenditures
Tuition Revenues - Tuition charges were established by the Board of Education based on estimated costs. The charges are subject to adjustment when the final costs are determined and certified by the State Department of Education.
Tuition Expenditures- Tuition charges for the fiscal years 2013-2014 and 2014-2015 were based on rates established by the receiving district. These rates are subject to change when the actual costs have been certified by the State Department of Education.
4. Proprietary Funds, Operating and Non-Operating Revenues and Expenses
Proprietary funds distinguish operating revenues and expenses from nonoperating items. Operating revenues and expenses generally result from providing services and producing and delivering goods in connection with a proprietary fund's principal ongoing operations. The principal operating revenues of the food service enterprise fund, and of the after care program enterprise fund, are charges to customers for sales and services. Operating expenses for enterprise funds include the cost of sales and services, administrative expenses, and depreciation on capital assets. All revenues and expenses not meeting this definition are reported as nonoperating revenues and expenses. Federal and State subsidies for the food service operation are considered nonoperating revenues.
NOTE 2 STEWARDSHIP, COMPLIANCE AND ACCOUNTABILITY
A. Budgetary Information
In accordance with the requirements of the New Jersey Department of Education ("the Department"), the District annually prepares its operating budget for the forthcoming year. The budget, except for the general fund and special revenue fund, which is more fully explained below and in the notes to the required supplementary information, is prepared in accordance with accounting principles generally accepted in the United States of America and serves as a formal plan for expenditures and the proposed means for financing them. Capital lease transactions are accounted for on the GAAP basis.
The annual budget is adopted in the spring of the preceding year for the general and special revenue funds. The District is not required to adopt an annual budget for the capital projects fund. The budget is submitted to the county superintendent for review and approval prior to adoption. Prior to the 2012/2013 budget year, the annual budget was required to be voted upon at the annual school election held on the third Tuesday in April. On January 17, 2012, Chapter 202 of the Laws ofP.L. 2011 was approved which established procedures for moving the date of a school district's annual school election from April to the general election in November. Under the new law, districts that have their school board members elected in November no longer have to submit their budgets that meet levy cap requirements for voter approval beginning with the 2012/2013 budget year. Only a school board decision to exceed the tax levy cap would require voter approval for the additional amount on the November ballot. On February 14, 2012, the Board adopted a resolution to move its annual election to the date of the general elections in accordance with the law; therefore voter approval of the annual budget is not required.
39

HOBOKEN PUBLIC SCHOOLS NOTES TO THE FINANCIAL STATEMENTS FOR THE FISCAL YEAR ENDED JUNE 30, 2015
NOTE 2 STEWARDSHIP, COMPLIANCE AND ACCOUNTABILITY (Continued)
A. Budgetary Information (Continued)
Budget adoptions and amendments are recorded in the District's board minutes. The budget is amended by the Board of Trustees as needed throughout the year. The budget for revenues, other resources, other uses, and fund balances is prepared by fund source and amount. The budget for expenditures is prepared by fund, program, function, object and amount. The legal level of budgetary control is established at the line item account within each fund. Line item accounts are defined as the lowest (most specific) level of detail as established pursuant to the minimum chart of accounts referenced in N.J.A.C. 6:20-2A.2(m)l. The Board approved several budget transfers during 2014/2015. Also, during 2014/2015 the Board increased the original general fund budget by $1,566,348 and the original special revenue fund budget by $2,029,477. The increase was funded by the reappropriation of prior year general fund encumbrances and grant awards.
Formal budgetary integration into the accounting system is employed as a management control device during the year. For governmental funds there are no substantial differences between the budgetary basis of accounting and accounting principles generally accepted in the United States of America, with the exception of the legally mandated revenue recognition of certain state aid payments for budgetary purposes only and the treatment of encumbrances in the special revenue fund as described in the Notes to Required Supplementary Information (RSI). Encumbrance accounting is also employed as an extension of formal budgetary integration in the governmental fund types. Unencumbered appropriations lapse at fiscal year end.
Encumbrance accounting is employed in the governmental funds. Under encumbrance accounting, purchase orders, contracts and other commitments for the expenditure of resources are recorded to reserve a portion of the applicable appropriation. Open encumbrances in governmental funds other than the special revenue fund are reported as committed and/or assigned fund balances at fiscal year end as they do not constitute expenditures or liabilities but rather commitments related to unperformed contracts for goods and services which are reappropriated and honored during the subsequent fiscal year.
B. Deficit Fund Equity
The District has an unassigned fund deficit of $18,816 in the General Fund as of June 30, 2015 as reported in the fund financial statements (modified accrual basis). NJSA 18A:22-44.2 provides that in the event a state school aid payment is not made until the following school budget year, districts must record these delayed state aid payments as revenue, for budget purposes only, in the current school budget year. The statute provides legal authority for school districts to recognize this revenue in the current budget year. GASB Statement No. 33, "Accounting and Financial Reporting for Nonexchange Transactions", requires that intergovernmental transactions (revenue, expenditure, asset, liability) should be recognized in symmetry (i.e., if one government recognizes an asset, the other government recognizes a liability). Since the State of New Jersey is recording certain 2014/2015 budgeted state aid payments in the subsequent fiscal year, the school district cannot recognize such payments on the GAAP (fund) financial statements until the year the State records the payable. Due to the timing difference of recording these delayed state aid payments, the General Fund deficit does not alone indicate that the District is facing financial difficulties; however, unless the State of New Jersey budgets the delayed payments in future years, the District may also report fund deficits in the future.
Pursuant to NJSA 18A:22-44.2, any negative unreserved, undesignated (i.e., unassigned) general fund balance that is reported as a direct result of a delay in the payment of state aid until the following fiscal year, is not considered as a violation of New Jersey Statute or regulation and is not considered an item in need of corrective action. The District deficit in the GAAP (fund) financial statements of$18,816 in the General Fund is less than the delayed state aid payments.
40
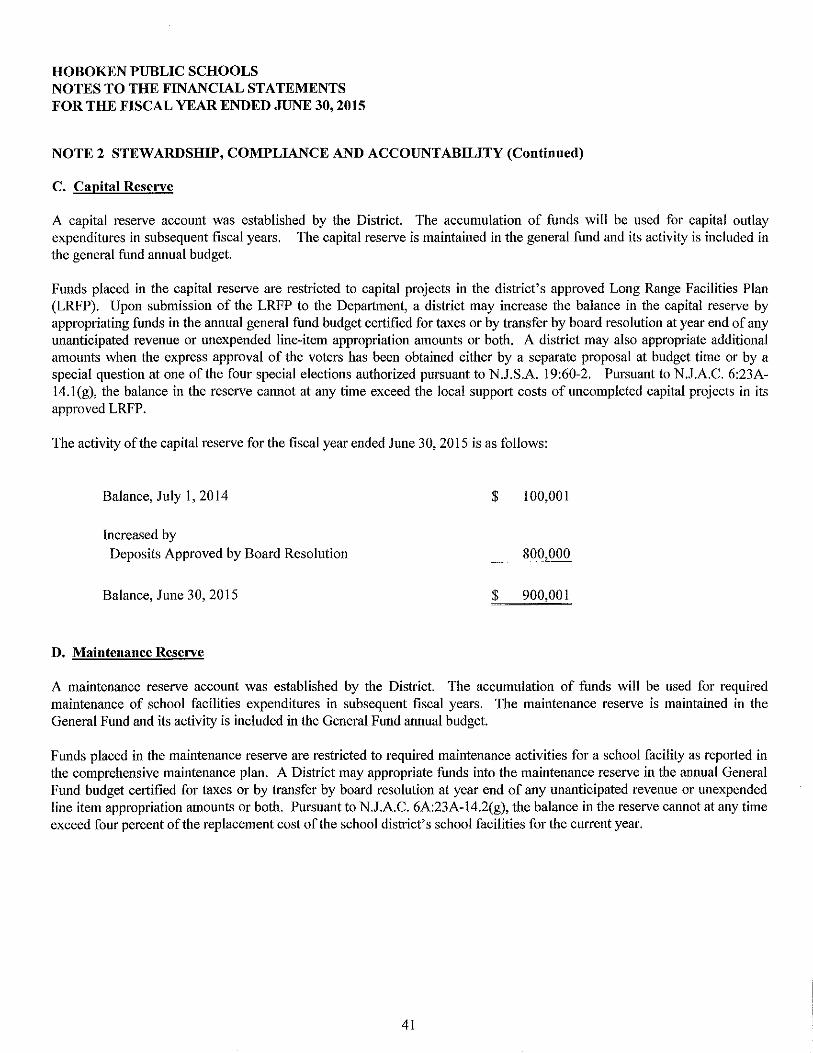
HOBOKEN PUBLIC SCHOOLS NOTES TO THE FINANCIAL STATEMENTS FOR THE FISCAL YEAR ENDED JUNE 30, 2015
NOTE 2 STEWARDSHIP, COMPLIANCE AND ACCOUNTABILITY (Continued)
C. Capital Reserve
A capital reserve account was established by the District. The accumulation of funds will be used for capital outlay expenditures in subsequent fiscal years. The capital reserve is maintained in the general fund and its activity is included in the general fund annual budget.
Funds placed in the capital reserve are restricted to capital projects in the district's approved Long Range Facilities Plan (LRFP). Upon submission of the LRFP to the Department, a district may increase the balance in the capital reserve by appropriating funds in the annual general fund budget certified for taxes or by transfer by board resolution at year end of any unanticipated revenue or unexpended line-item appropriation amounts or both. A district may also appropriate additional amounts when the express approval of the voters has been obtained either by a separate proposal at budget time or by a special question at one of the four special elections authorized pursuant to N.J.S.A. 19:60-2. Pursuant to N.J.A.C. 6:23A-14.l(g), the balance in the reserve cannot at any time exceed the local support costs of uncompleted capital projects in its approved LRFP.
The activity of the capital reserve for the fiscal year ended June 30,2015 is as follows:
Balance, Jnly I, 2014 $ 100,001
Increased by Deposits Approved by Board Resolution 800,000
Balance, June 30,2015 $ 900,001
D. Maintenance Reserve
A maintenance reserve account was established by the District. The accumulation of funds will be used for required maintenance of school facilities expenditures in subsequent fiscal years. The maintenance reserve is maintained in the General Fund and its activity is included in the General Fund annual budget.
Funds placed in the maintenance reserve are restricted to required maintenance activities for a school facility as reported in the comprehensive maintenance plan. A District may appropriate funds into the maintenance reserve in the annual General Fund budget certified for taxes or by transfer by board resolution at year end of any unanticipated revenue or unexpended line item appropriation amounts or both. Pursuant to N.J.A.C. 6A:23A-14.2(g), the balance in the reserve cannot at any time exceed four percent of the replacement cost of the school district's school facilities for the current year.
41

HOBOKEN PUBLIC SCHOOLS NOTES TO THE FINANCIAL STATEMENTS FOR THE FISCAL YEAR ENDED JUNE 30, 2015
NOTE 2 STEWARDSHIP, COMPLIANCE AND ACCOUNTABILITY (Continued)
D. Maintenance Reserve
The activity of the maintenance reserve for the fiscal year ended June 30,2015 is as follows:
Balance, July l, 2014
Increased by Deposits Approved by Board Resolution
Total Increases
Balance, June 30, 2015
$ 700,000
407,633
$ 1,107,633
The June 30,2015 comprehensive maintenance plan indicated a maximum maintenance reserve amount of$4,430,529.
E. Transfers to Capital Outlay
During the 2014/2015 school year, the district transferred $144,068 to the non-equipment capital outlay accounts. The transfer was made to supplement a project previously approved in the 2014/2015 original budget.
F. Calculation of Excess Surplus
In accordance with N.J.S.A. 18A:7F-7, as amended, the restricted fund balance for Reserved Excess Surplus is a required calculation pursuant to the New Jersey Comprehensive Educational Improvement and Financing Act of 1996 (CEIFA). New Jersey school districts are required to reserve General Fund fund balance in excess of 2% of budget expenditures at the fiscal year end of June 30 if they did not appropriate a required minimum amount as budgeted fund balance in their subsequent year's budget. The excess fund balance at June 30, 2015 is $437,748. This amount will be appropriated in the 2016/2017 original budget certified for taxes.
NOTE 3 DETAILED NOTES ON ALL FUNDS
A. Cash Deposits and Investments
Cash Deposits
The Board's deposits are insured through either the Federal Deposit Insurance Corporation (FDIC), Securities Investor Protection Corporation (SIPC) or New Jersey's Governmental Unit Deposit Protection Act (GUDPA). The Board is required to deposit their funds in a depository which is protecting such funds pursuant to GUDPA. The New Jersey Governmental Unit Deposit Protection Act requires all banks doing business in the State of New Jersey to pledge collateral equal to at least 5% of the average amount of its public deposits and I 00% of the average amount of its public funds in excess of the lesser of 75% of its capital funds or $200 million for all deposits not covered by the FDIC.
42

HOBOKEN PUBLIC SCHOOLS NOTES TO THE FINANCIAL STATEMENTS FOR THE FISCAL YEAR ENDED JUNE 30, 2015
NOTE 3 DETAILED NOTES ON ALL FUNDS (Continued)
A. Cash Deposits and Investments (Continued)
Cash Deposits (Continued)
Bank balances are insured up to $250,000 in the aggregate by the FDIC for each bank. SIPC replaces cash claims up to a maximum of $250,000 for each failed brokerage firm. At June 30, 2015, the book value of the Board's deposits were $7,360,130 and bank and brokerage firm balances of the Board's deposits amounted to $8,549,720. The Board's deposits which are displayed on the various fund balance sheets as "cash and cash equivalents" or "cash with fiscal agents" are categorized as:
Bank Depository Account Balance
Insured
Cash and Cash Equivalents $ 8,282,095
Uninsured and Uncollateralized
Cash with Fiscal Agents 45,011
Cash and Cash Equivalents 222,614
$ 8,549,720
Custodial Credit Risk - Deposits - Custodial credit risk is the risk that in the event of a bank failure, the government's deposits may not be returned to it. The Board does not have a policy for custodial credit risk. As of June 30, 2015 the Board's bank balance of$267,625 was exposed to custodial credit risk as follows:
Depository Account
Uninsured and Uncollateralized Collateral Held by Pledging Financial Institution's Trust
Department in the Board's Name Uninsured and Uncollateralized
43
$
Bank Balance
45,011 222,614
$ 267,625

HOBOKEN PUBLIC SCHOOLS NOTES TO THE FINANCIAL STATEMENTS FOR THE FISCAL YEAR ENDED JUNE 30, 2015
NOTE 3 DETAILED NOTES ON ALL FUNDS (Continued)
A. Cash Deposits and Investments (Continued)
Investments
The BoaJ"d is permitted to invest public funds in accordance with the types of securities authorized by N.J.S.A. 18A:20-37. Examples of the allowable investments are bonds or other obligations of the United States or obligations guaranteed by the United States of America, Government Money Market Mutual Funds, bonds or other obligations of the school district or bonds or other obligations of the local unit or units within which the school district is located, Local Government investment pools, and agreements or the repurchase of fully collateralized securities, if transacted in accordance with the above statute.
As of June 30,2015, the Board had no outstanding investments.
B. Receivables
Receivables as of June 30, 2015 for the district's individual major funds are as follows:
Special Capital Food General Revenue Projects Service Total
Receivables: Accounts $ 7,437 $ 250 $ 81,845 $ 89,532 Intergovernmental-
Federal - $357,847 167,281 525,128 State 121,720 $ 685,275 3,013 810,008
Net Total Receivables $129,157 $358,097 $ 685,275 $252,139 $ 1,424,668
C. Unearned Revenue
Governmental funds report unearned revenue in connection with resources that have been received, but not yet earned. At the end of the current fiscal year, the various components of unearned revenue reported in the governmental funds were as follows:
Special Revenue Fund Unencumbered Grant Draw Downs Grant Draw Downs Reserved for Encumbrances
Capital Projects Fund Unrealized School Facilities Grants
Total Unearned Revenue for Governmental Funds
44
$
$
1,014,516 284,039
685,275
1,983,830

HOBOKEN PUBLIC SCHOOLS NOTES TO THE FINANCIAL STATEMENTS FOR THE FISCAL YEAR ENDED JUNE 30, 2015
NOTE 3 DETAILED NOTES ON ALL FUNDS (Continued)
D. Capital Assets
Capital asset activity for the fiscal year ended June 30,2015 was as follows:
Balance, June 30,2014 Increases
Governmental Activities: (Restated)
Capital Assets, Being Depreciated: Land Improvements $ 1,594,560 Buildings 61,274,909 $ 554,432 Machinery and Equipment 2,023,930 221,531
Total Capital Assets Being Depreciated 64,893,399 775,963
Less Accumulated Depreciation for: Land Improvements (I ,045,902) (69,247) Buildings ( 44,422,247) (2,931,811) Machinery and Equipment {1,323,524) (180,761)
Total Accumulated Depreciation (46,791,673) {3,181,819)
Total Capital Assets, Being Depreciated, Net 18,101,726 {2,405,856)
Governmental Activities Capital Assets, Net $ 18,101,726 $ (2,405,856)
Balance, June 30, 2014 Increases
Business-Type Activities: (Restated) Capital Assets, Being Depreciated:
Machinery and Equipment $ 170,418 Total Capital Assets Being Depreciated 170,418
Less Accumulated Depreciation for: Machinery and Equipment {57,584) $ (12,408)
Total Accumulated Depreciation (57,584) (12,408)
Total Capital Assets, Being Depreciated, Net 112,834 (12,408)
Business-Type Activities Capital Assets, Net $ 112,834 $ (12,408)
45
Balance, Decreases June 30, 2015
$ (209,620) $ 1,384,940 (9,193) 61,820,148
{337,854) 1,907,607
(556,667) 65,112,695
209,620 (905,529) 9,193 ( 47,344,865)
337,854 (I, 166,431)
556,667 ( 49,416,825)
15,695,870
$ $ 15,695,870
Balance, Decreases June 30,2015
$ 170,418 170,418
(69,992) (69,992)
100,426
$ $ 100,426

HOBOKEN PUBLIC SCHOOLS NOTES TO THE FINANCIAL STATEMENTS FOR THE FISCAL YEAR ENDED JUNE 30,2015
NOTE 3 DETAILED NOTES ON ALL FUNDS (Continued)
D. Capital Assets (Continued)
Depreciation expense was charged to functions/programs of the District as follows:
Governmental Activities: Instruction Regular
Total Instruction
Support Services Student and Instruction Related Services General Administrative Services Plant Operations and Maintenance Pupil Transportation
Total Support Services
Total Depreciation Expense- Governmental Activities
Business-Type Activities: Food Service Fund
Total Depreciation Expense-Business-Type Activities
46
$ 236,510
236,510
3,256
31,183 2,896,476
14,394 2,945,309
$ 3,181,819
$ 12,408 $ 12,408

HOBOKEN PUBLIC SCHOOLS NOTES TO THE FINANCIAL STATEMENTS FOR THE FISCAL YEAR ENDED JUNE 30, 2015
NOTE 3 DETAILED NOTES ON ALL FUNDS (Continued)
D. Capital Assets (Continued)
Construction and Other Significant Commitments
The District has the following active construction projects as of June 30,2015:
Project
Brandt Primary School Exterior Masonry Repairs
Total
The District has other significant commitments at June 30,2015 as follows:
Purposes
Hurricane Disaster Costs - General Fund
Total
E. Interfund Receivables, Payables, and Transfers
The composition of interfund balances as of June 30, 2015, is as follows:
Due to/from other funds
Receivable Fund
General Fund Food Service-Enterprise Fund
Payable Fund
Payroll Agency General Fund
$
Remaining Commitment
$ 759,000
$ 759,000
Remaining Commitment
285,267
$ 285,267
Amount
8,326 48,640
$ 56,966
The above balances are the result of revenues earned or other financing sources received in one fund which are due to another fund and/or expenditures paid by one fund on behalf of another fund and/or to cover cash balances which were in an overdraft position.
The District expects all interfund balances to be liquidated within one year.
47

HOBOKEN PUBLIC SCHOOLS NOTES TO THE FINANCIAL STATEMENTS FOR THE FISCAL YEAR ENDED JUNE 30, 2015
NOTE 3 DETAILED NOTES ON ALL FUNDS (Continued)
E. Iuterfuud Receivables, Payables, and Transfers (Continued)
Interfund transfers
Transfer Out: Special Revenue Fund General Fund
Transfer In:
Special Revenue General Fund Fund
Food Service Fund
$ 480,174 $ 286,000 "-$ -----'-82=22, 5'-"3~3
$ 480,174 1,108,533
Total $ 480,174 $ 286,000 $ 822,5 3 3 ""$~~1"",5~8 8;;,b, 7~0~7
The above transfers are the result of revenues earned and/or other financing sources received in one fund to finance expenditures in another fund.
F. Leases
Operating Leases
The District leases copiers under noncancelable operating leases. Lease payments for the fiscal year ended June 30, 2015 were $82,372. The future minimum lease payments for these operating leases are as follows:
Fiscal
Year Ending June 30 Amount
2016 $ 82,372 2017 82,372 2018 82,372 2019 68,643 Total $ 315,759
48
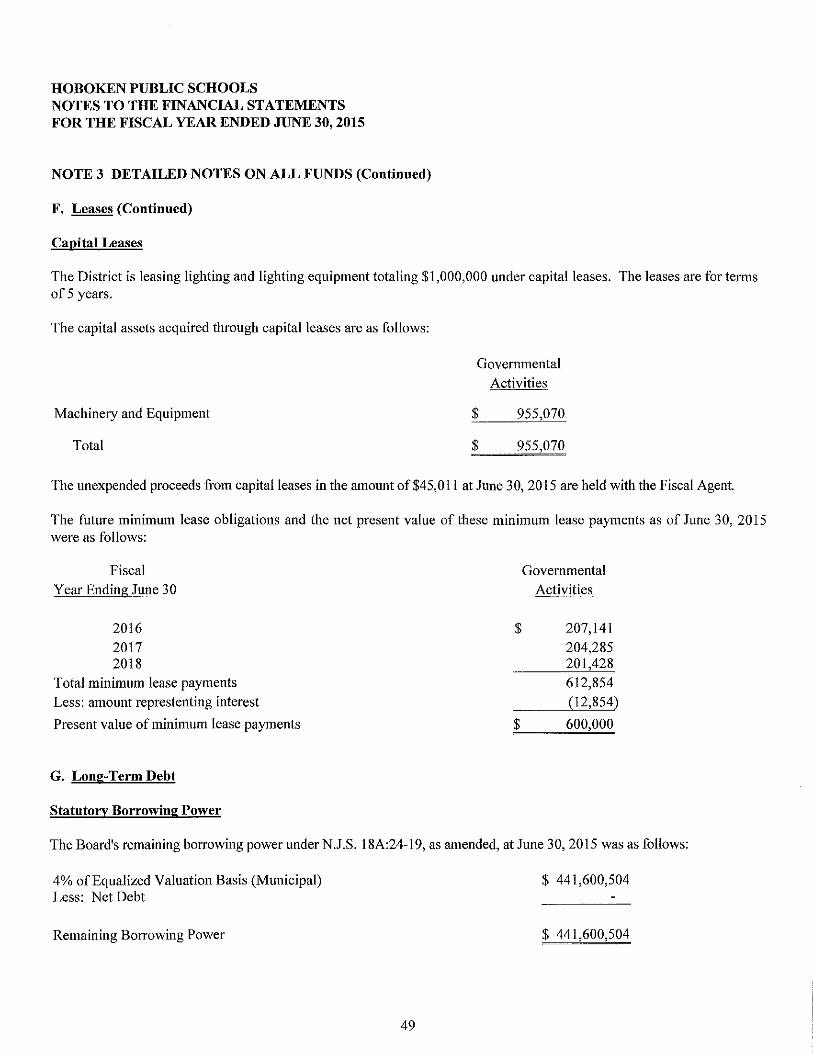
HOBOKEN PUBLIC SCHOOLS NOTES TO THE FINANCIAL STATEMENTS FOR THE FISCAL YEAR ENDED JUNE 30, 2015
NOTE 3 DETAILED NOTES ON ALL FUNDS (Continued)
F. Leases (Continued)
Capital Leases
The District is leasing lighting and lighting equipment totaling $1,000,000 under capital leases. The leases are for terms of5 years.
The capital assets acquired through capital leases are as follows:
Machinery and Equipment
Total
Governmental Activities
$ 955,070
$ 955,070
The unexpended proceeds from capital leases in the amount of$45,011 at June 30, 2015 are held with the Fiscal Agent.
The future minimum lease obligations and the net present value of these minimum lease payments as of June 30, 2015 were as follows:
Fiscal Year Ending June 30
2016 2017 2018
Total minimum lease payments Less: amount represtenting interest
Present value of minimum lease payments
G. Long-Term Debt
Statutory Borrowing Power
$
$
Governmental Activities
207,141 204,285 201,428 612,854 (12,854)
600,000
The Board's remaining borrowing power under N.J.S. 18A:24-19, as amended, at June 30, 2015 was as follows:
4% of Equalized Valuation Basis (Municipal) Less: Net Debt
Remaining Borrowing Power
$ 441,600,504
$ 441,600,504
49

HOBOKEN PUBLIC SCHOOLS NOTES TO THE FINANCIAL STATEMENTS FOR THE FISCAL YEAR ENDED JUNE 30, 2015
NOTE 3 DETAILED NOTES ON ALL FUNDS (Continued)
H. Other Long-Term Liabilities (Continued)
Changes in Long-Term Liabilities
Long-term liability activity for the fiscal year ended June 30, 2015, was as follows:
Governmental Activities: Claims and Judgments Capital Leases Payable Compensated Absences Net Pension Liability
Balance, June 30, 2014
(Restated)
$ 266,432 800,000
5,704,529 14,263,915 $
Balance, Additions Reductions June 30,2015
$ (266,432) (200,000) $ 600,000
(1,280,089) 4,424,440 287,043 14,550,958
Due Within
One Year
$ 200,000 558,231 687,385
Governmental activity Long-term liabilities $ 21,034,876 $ 287,043 $ (1,746,521) $ 19,575,398 $ 1,445,616
For the governmental activities, the liabilities for compensated absences and net pension liability are generally liquidated by the general fund.
NOTE 4 OTHER INFORMATION
A. Risk Management
The District is exposed to various risks of loss related to property, general liability, automobile coverage, theft of, damage to and destruction of assets; errors and omissions; injuries to employees; student accident; termination of employees and natural disasters. The Board has obtained commercial insurance coverage to guard against these events to minimize the exposure to the District should they occur. A complete schedule of insurance coverage can be found in the statistical section of this Comprehensive Annual Financial Report.
The District has previously established a worker's compensation plan for its employees. Effective January 2013, the District elected to participate in an insurance pool rather than remain self insured. However, the District remains enable for the un out of those claims incurred prior to this date. Transactions related to the plan are accounted for in the General Fund. The District funds the entire cost of the plan. Claims are paid directly by the plan up to a maximum of$350,000 for any one accident or occurrence, with any excess benefit being reimbursed through a Re-Insurance Agreement with Amerihealth. The reinsurance policy also contains an aggregate loss provision in the amount of $1,000,000 employers limit $750,000. A contingent liability exists with respect to reinsurance, which would become an actual liability in the event the reinsuring company may not be able to meet their obligations to the District under existing reinsurance agreements.
50

HOBOKEN PUBLIC SCHOOLS NOTES TO THE FINANCIAL STATEMENTS FOR THE FISCAL YEAR ENDED JUNE 30, 2015
NOTE 4 OTHER INFORMATION (Continued)
A. Risk Management (Continued)
Estimates of claims payable and of claims incurred, but not reported (IBNR) at June 30, 2015, are reported as claims and judgments payable and accrued liability for insurance claims, respectively. These estimates were determined based on claim information supplied by the claims administrator and actuary. The unpaid claims liability of $233,568 reported at June 30, 2015 is based on the requirements of the Governmental Accounting Standards Board Statement No. 10, which requires that a liability for claims be reported ifinfonnation prior to the issuance of the financial statements indicates that it is probable that a liability has been incurred at the date of the financial statements and the amount of the loss can be reasonably estimated.
Changes in the balances of claims liabilities for the workmen's compensation plan for the fiscal years ended June 30, 2015 and 2014 are as follows:
Governmental Activities:
Fiscal Year Ended Fiscal Year Ended
June 30, 2015 June 30, 2014
Unpaid Claims, Beginning of Year $ 500,000 $ 583,516 Incurred Claims Claims Paid (266,432) (83,516)
Unpaid Claims, End of Fiscal Year $ 233,568 $ 500,000
Fiscal Year Ended Fiscal Year Ended June 30, 2015 June 30,2014
General Fund
Other Current Liabilities $ 233,568 $ 233,568 Governmental Activities
Noncurrent Liabilities 266,432
$ 233,568 $ 500,000
The District is a member of the New Jersey School Insurance Group (NJSIG). The Group is a risk sharing public entity pool, established for the purpose of insuring against various types of coverage.
The relationship between the Board and the insurance fund is governed by a contract and by-laws that have been adopted by resolution of each unit's governing body. The Board is contractually obligated to make all annual and supplementary contributions to the fund, to report claims on a timely basis, cooperate with the management of the fund, its claims administrator and attorneys in claims investigation and settlement, and to follow risk management procedures as outlined by the fund. Members have a contractual obligation to fund any deficit of the fund attributable to a membership year during which tbey were a member.
NJSIG provides its members with risk management services, including the defense of and settlement of claims and to establish reasonable and necessary loss reduction and prevention procedures to be followed by tbe members. Complete financial statements of the respective insurance funds are on file with the School's Business Administrator.
There has been no significant reduction in insurance coverage ft·om the previous year nor have there been any settlements in excess of insurance coverage's in any of the prior three years.
51
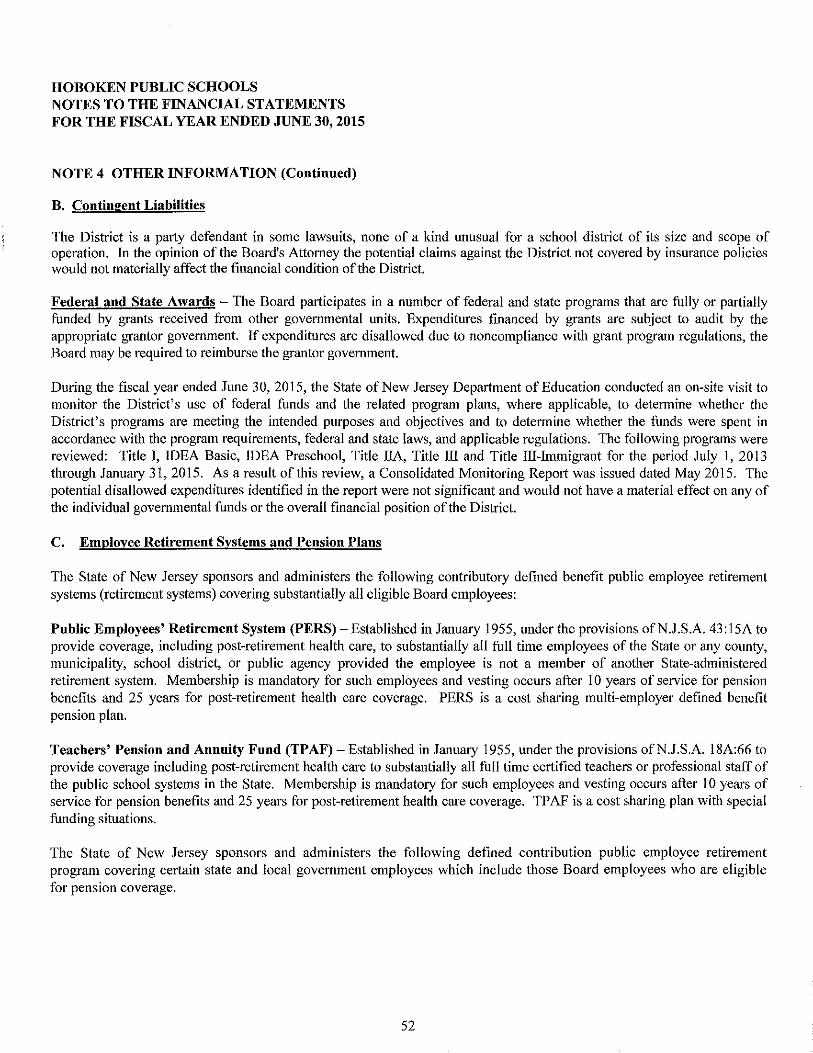
HOBOKEN PUBLIC SCHOOLS NOTES TO THE FINANCIAL STATEMENTS FOR THE FISCAL YEAR ENDED JUNE 30, 2015
NOTE 4 OTHER INFORMATION (Continued)
B. Contingent Liabilities
The District is a party defendant in some lawsuits, none of a kind unusual for a school district of its size and scope of operation. In the opinion of the Board's Attorney the potential claims against the District not covered by insurance policies would not materially affect the financial condition of the District.
Federal and State Awards - The Board participates in a number of federal and state programs that are fully or partially funded by grants received from other governmental units. Expenditures financed by grants are subject to audit by the appropriate grantor government. If expenditures are disallowed due to noncompliance with grant program regulations, the Board may be required to reimburse the grantor government.
During the fiscal year ended June 30, 2015, the State of New Jersey Department of Education conducted an on-site visit to monitor the District's use of federal funds and the related program plans, where applicable, to determine whether the District's programs are meeting the intended purposes and objectives and to determine whether the funds were spent in accordance with the program requirements, federal and state laws, and applicable regulations. The following programs were reviewed: Title I, IDEA Basic, IDEA Preschool, Title !lA, Title III and Title III-Immigrant for the period July I, 2013 through January 31,2015. As a result of this review, a Consolidated Monitoring Report was issued dated May 2015. The potential disallowed expenditures identified in the report were not significant and would not have a material effect on any of the individual governmental funds or the overall financial position of the District.
C. Employee Retirement Systems and Pension Plans
The State of New Jersey sponsors and administers the following contributory defined benefit public employee retirement systems (retirement systems) covering substantially all eligible Board employees:
Public Employees' Retirement System (PERS)- Established in January 1955, under the provisions ofN.J.S.A. 43: JSA to provide coverage, including post-retirement health care, to substantially all full time employees of the State or any county, municipality, school district, or public agency provided the employee is not a member of another State-administered retirement system. Membership is mandatory for such employees and vesting occurs after 1 0 years of service for pension benefits and 25 years for post-retirement health care coverage. PERS is a cost sharing multi-employer defined benefit pension plan.
Teachers' Pension and Annuity Fund (TPAF)- Established in January 1955, under the provisions ofN.J.S.A. 18A:66 to provide coverage including post-retirement health care to substantially all full time certified teachers or professional staff of the public school systems in the State. Membership is mandatory for such employees and vesting occurs after I 0 years of service for pension benefits and 25 years for post-retirement health care coverage. TP AF is a cost sharing plan with special funding situations.
The State of New Jersey sponsors and administers the following defined contribution public employee retirement program covering certain state and local government employees which include those Board employees who are eligible for pension coverage.
52

HOBOKEN PUBLIC SCHOOLS NOTES TO THE FINANCIAL STATEMENTS FOR THE FISCAL YEAR ENDED JUNE 30, 2015
NOTE 4 OTHER INFORMATION (Continued)
C. Employee Retirement Systems and Pension Plans (Continued)
Defined Contribution Retirement Program (DCRP) - established under the provisions of Chapter 92, P.L. 2007 and Chapter I 03, P.L. 2008 to provide coverage to elected, certain appointed officials, and certain Board employees not eligible for enrollment in PERS or TPAF. Effective July I, 2007 membership is mandatory for such individuals with vesting occurring after one (I) year of membership. DCRP is a defined contribution pension plan.
Other Pension Funds
The State established and administers a Supplemental Annuity Collective Trust Fund (SACT) which is available to active members of the State-administered retirement systems to purchase annuities to supplement the guaranteed benefits provided by their retirement system. The state or local government employers do not appropriate funds to SACT.
The cost of living increase for PERS and TPAF, are funded directly by each of the respective systems but are currently suspended as a result of reform legislation.
According to state law, all obligations of each retirement system will be assumed by the State of New Jersey should any retirement system be terminated.
The State of New Jersey, Department of the Treasury, Division of Pensions and Benefits, issues publicly available financial reports that include the financial statements and required supplementary information of each of the above systems. The financial reports may be accessed via the New Jersey, Division of Pensions and Benefits, website at www.state.nj.us/treasury/pensions.
Basis of Accounting
The financial statements of the retirement systems are prepared on the accrual basis of accounting. Employer contributions are recognized when payable to the retirement systems. Benefits or refunds are recognized when due and payable in accordance with the terms of the retirement systems.
Investment Valuation
Investments are reported at fair value. Securities traded on a national or international exchange are valued at the last reported sales price at current exchange rates. Mortgages are valued on the basis of future principal and interest payments, and are discounted at prevailing interest rates for similar instruments. The fair value of real estate investments is based on independent appraisals. Investments that do not have an established market are reported at estimated fair values.
The State of New Jersey, Department of the Treasury, Division of Investment, issues publicly available financial reports that include the financial statements of the State of New Jersey Cash Management Fund. The financial reports may be obtained in writing to the State of New Jersey, Department of the Treasury, Division of Investment, P.O. Box 290, Trenton, New Jersey 08625-0290 or at www.state.nj/treasury/doinvest.
53

HOBOKEN PUBLIC SCHOOLS NOTES TO THE FINANCIAL STATEMENTS FOR THE FISCAL YEAR ENDED JUNE 30, 2015
NOTE 4 OTHER INFORMATION (Continued)
C. Employee Retirement Systems and Pension Plans (Continued)
Funding Status and Funding Progress
As of July 1, 2013, the most recent actuarial valuation date, the aggregate funded ratio for all the State administered retirement systems including TPAF and PERS, is 62.8 percent with an unfunded actuarial accrued liability of$51.0 billion. The aggregate funded ratio and unfunded accrued liability for the State-funded systems is 54.2 percent and $37.3 billion, and the aggregate funded ratio and unfunded accrued liability for local PERS and Police and Firemen's Retirement System ("PFRS") is 75.4 percent and $13.7 billion, respectively.
The funded status and funding progress of the retirement systems is based on actuarial valuations which involve estimates of the value of reported amounts and assumptions about the probability of events far into the future. These amounts are subject to continual revision as actual results are compared to past expectations and new estimates are made about the probability of future events.
Actuarial calculations reflect a long-term perspective and are based on the benefits provided under the terms of the retirement systems in effect at the time of each valuation and also consider the pattern of the sharing of costs between the employer and members at that point in time. The projection of benefits for financing reporting purposes does not explicitly incorporate the potential effects of legal or contractual funding limitations on the pattern of cost sharing between the employer and members in the future.
Actuarial Methods and Assumptions
In the July I, 2013 actuarial valuation, the projected unit credit was used as the actuarial cost method, and the five year average of market value was used as the asset valuation method for the retirement systems. The actuarial assumptions included (a) an investment rate of return for the retirement systems of 7.90 percent and (b) projected salary increases of 4.24 percent for the PERS and 3.33 percent for TPAF.
Employer and Employee Pension Contributions
The contribution policy is set by laws of the State of New Jersey and contributions are required by active members and participating employers. Plan member and employer contributions may be amended by State of New Jersey legislation with the amount of contributions by the State of New Jersey contingent upon the Annual Appropriations Act. As defined, the retirement systems require employee contributions based on 6.9% for PERS, 6.9% for TPAF and 5.50% for DCRP of the employee's annual compensation.
Annual Pension Costs (APC)
Per the requirements of GASB Statement No. 27 Accounting for Pensions by State and Local Government Employees, for the fiscal year ended June 30, 2015 for TPAF, which is a cost sharing plan with special funding situations, the annual pension cost differs from the annual required contribution. For PERS, which is a cost sharing multi-employer defined benefit pension plan, the annual pension cost equals contributions made. TP AF employer contributions are made annually by the State of New Jersey to the pension system on behalf of the Board. PERS employer contributions are made annually by the Board to the pension system in accordance with Chapter 114, P.L. 1997. In the DCRP, which is a defined contribution plan, member contributions are matched by a 3% employer contribution.
54

HOBOKEN PUBLIC SCHOOLS NOTES TO THE FINANCIAL STATEMENTS FOR THE FISCAL YEAR ENDED JUNE 30, 2015
NOTE 4 OTHER INFORMATION (Continued)
C. Employee Retirement Systems and Pension Plans (Continued)
During the fiscal years ended June 30, 2015, 2014 and 2013 the Board was required to contribute for PERS and DCRP and the State of New Jersey was required to contribute for TPAF for normal cost pension and accrued liability contributions (including non-contributory group life insurance (NCGI)) the following amounts:
Fiscal Year Ended On-behalf
June 30, PERS TPAF DCRP
2015 $ 640,697 $ 1,020,453 $ 35,719 2014 568,471 778,215 16,882 2013 581,636 1,252,888 11,119
For fiscal years 2014/2015 and 2012/2013, the state contributed $1,020,453 and $1,252,888 respectively for normal cost pension, accrued liability and the NCGJ premium. For fiscal year 2013/2014 the State did not contribute to the TPAF for accrued liability but did contribute $778,215 for normal cost pension and NCGl premium.
The PERS contributions are recognized in the governmental fund financial statements (modified accrual basis) as an expenditure. The on-behalf TPAF contributions are recognized in the governmental fund financial statements (modified accrual basis) as both a revenue and expenditure in accordance with GASB No. 24. The DCRP contributions are recognized in the governmental fund financial statements (modified accrual basis) as an expenditure, as well as, the district-wide financial statements (accrual basis) as an expense.
Also, in accordance with N.J.S.A. 18A:66-66 the State of New Jersey reimbursed the Board $1,386,247 during the fiscal year ended June 30, 2015 for the employer's share of social security contributions for TPAF members as calculated on their base salaries. This amount has been recognized in the district-wide financial statements (accrual basis) and the governmental fund financial statements (modified accrual basis) as a revenue and expense/expenditure in accordance with GASB No. 24.
Pension Liabilities, Pension Expense, and Deferred Outflows of Resources and Deferred Inflows of Resources Related to Pensions
Public Employees Retirement System (PERS)
At June 30, 2015, the District reported in the statement of net position (accrual basis) a liability of $14,550,958 for its proportionate share of the PERS net pension liability. The net pension liability was measured as of June 30, 2014 and the total pension liability used to calculate the net pension liability was determined by an actuarial valuation as of that date. The District's propottionate share of the net pension liability was based on a projection of the District's long-term share of contributions to the pension plan relative to the projected contributions of all participating governmental entities, actuarially determined. At June 30, 2014, the District's proportionate share was .07771 percent, which was an increase of .15234 percent from its proportionate share measured as of June 30, 2013.
55

HOBOKEN PUBLIC SCHOOLS NOTES TO THE FINANCIAL STATEMENTS FOR THE FISCAL YEAR ENDED JUNE 30,2015
NOTE 4 OTHER INFORMATION (Continued)
C. Employee Retirement Systems and Pension Plans (Continued)
Pension Liabilities, Pension Expense, and Deferred Outflows of Resources and Deferred Inflows of Resources Related to Pensions (Continued)
Public Employees Retirement System (PERS) (Continued)
For the fiscal year ended June 30, 2015, the District recognized in the district-wide statement of activities (accrual basis) pension expense of$839,322 for PERS. At June 30,2015, the District repmted deferred outflows of resources and deferred inflows of resources related toPERS pension from the following sources:
Deferred Outflows Deferred Inflows
Differences Between Expected and Actual Experience Changes of Assumptions Net Difference Between Projected and Actual Earnings on Pension Plan Investments
Changes in Proportion and Differences Between District Contributions and Proportionate Share of Contributions
Total
$
$
of Resources of Resources
457,560
$ 867,158
498,016
955,576 $ 867,158
Amounts reported as deferred outflows of resources and deferred inflows of resources related to PERS pension will be recognized in pension expense as follows:
Fiscal Year Ending June 30, Total
2016 $ (41,132) 2017 (41,132) 2018 (41,132) 2019 (41,132) 2020 175,657
Thereafter 77,289
$ 88,418
56

HOBOKEN PUBLIC SCHOOLS NOTES TO THE FINANCIAL STATEMENTS FOR THE FISCAL YEAR ENDED JUNE 30, 2015
NOTE 4 OTHER INFORMATION (Continued)
C. Employee Retirement Systems and Pension Plans (Continued)
Pension Liabilities, Pension Expense, and Deferred Outflows of Resources and Deferred Inflows of Resources Related to Pensions (Continued)
Public Employees Retirement System (PERS) (Continued)
Actuarial Assumptions
The total pension liability for the June 30, 2014 measurement date was determined by an actuarial valuation as of July 1, 2013, which was rolled forward to June 30, 2014. The total pension liability for the June 30, 2013 measurement date was determined by an actuarial valuation as of July 1, 2013. This actuarial valuation used the following actuarial assumptions, applied to all periods in the measurement:
Inflation Rate Salary Increases: 2012-2021
Thereafter
Investment Rate of Return Mortality Rate Table Period of Actuarial Experience
Study Upon Which Actuarial Assumptions were Based
3.01%
2.15-4.40% Based on Age
3.15-5.40% Based on Age
7.90% RP-2000
July l, 2008-June 30, 2011
Assumptions for mortality improvements are based on Society of Actuaries Scale AA.
57

HOBOKEN PUBLIC SCHOOLS NOTES TO THE FINANCIAL STATEMENTS FOR THE FISCAL YEAR ENDED JUNE 30, 2015
NOTE 4 OTHER INFORMATION (Continued)
C. Employee Retirement Systems and Pension Plans (Continued)
Pension Liabilities, Pension Expense, and Deferred Outflows of Resources and Deferred Inflows of Resources Related to Pensions (Continued)
Public Employees Retirement System (PERS) (Continued)
Long-Term Expected Rate of Return
The long-term expected rate of return on pension plan investments was determined using a building-block method in which best-estimate ranges of expected future real rate of return (expected returns, net of pension plans investment expense and inflation) are developed for each major asset class. These ranges are combined to produce the long-term expected rate of return by weighting the expected future real rates of return by the target asset allocation percentage and by adding expected inflation. Best estimates of arithmetic real rates of return for each major asset class included in the pension plans' target asset allocation as of June 30,2014 are summarized in the following table:
Asset Class
Cash Core Bonds Intermediate-Term Bonds Mortgages High Yield Bonds Inflation-Indexed Bonds Broad US Equities Developed Foreign Equities Emerging Market Equities Private Equity Hedge Funds/Absolute Return
Real Estate (Property) Commodities
Discount Rate
Target Allocation
6.00% 1.00% 11.20% 2.50% 5.50% 2.50%
25.90% 12.70% 6.50% 8.25% 12.25%
3.20% 2.50%
Long-Term Expected Real Rate of Return
0.80% 2.49% 2.26% 2.17% 4.82% 3.51% 8.22% 8.12% 9.91% 13.02% 4.92%
5.80% 5.35%
The discount rate used to measure the total pension liabilities of the PERS plan was as follows:
Discount Rate
PERS 5.39%
58

HOBOKEN PUBLIC SCHOOLS NOTES TO THE FINANCIAL STATEMENTS FOR THE FISCAL YEAR ENDED JUNE 30,2015
NOTE 4 OTHER INFORMATION (Continued)
C. Employee Retirement Systems and Pension Plans (Continued)
Pension Liabilities, Pension Expense, and Deferred Outflows of Resources and Deferred Inflows of Resources Related to Pensions (Continued)
Public Employees Retirement System (PERS) (Continued)
Discount Rate (Continued)
The following table represents the crossover period, if applicable, for the PERS defined benefit plan:
Period of Projected Benefit Payments for which the Following Rates were Applied: Long-Term Expected Rate of Return
Municipal Bond Rate *
Through June 30, 2033
From July I, 2033 and Thereafter
* The municipal bond return rate used is 4.29%. The source is the Bond Buyer Go 20-Bond Municipal Bond Index, which includes tax-exempt general obligation municipal bonds with an average rating of AA/Aa or higher.
Sensitivity of Net Pension Liability
The following presents the District's proportionate share of the PERS net pension liability calculated using the discount rate of 5.39%, as well as what the District's proportionate share of the PERS net pension liability would be if it were calculated using a discount rate that is !-percentage-point lower ( 4.39 percent) or !-percentage-point higher (6.39 percent) than the current rate:
1% Current 1% Decrease Discount Rate Increase (4.39%) (5.39%) (6.39%)
District's Proportionate Share of the PERS Net Pension Liability $ 18,305,542 $ 14,550,958 $ 11,398,056
The sensitivity analysis was based on the propmtionate share of the District's net pension liability at June 30, 2014. A sensitivity analysis specific to the District's net pension liability was not provided by the pension system.
Pension Plan Fiduciary Net Position
Detailed information about the PERS pension plan's fiduciary net position is available in the separately issued financial report from the State of New Jersey, Department of the Treasury, Division of Pension and Benefits. The financial repmts may be accessed via the New Jersey, Division of Pensions and Benefits, website at www.state.nj.us/treasury/pensions.
59

HOBOKEN PUBLIC SCHOOLS NOTES TO THE FINANCIAL STATEMENTS FOR THE FISCAL YEAR ENDED JUNE 30, 2015
NOTE 4 OTHER INFORMATION (Continued)
C. Employee Retirement Systems and Pension Plans (Continued)
Pension Liabilities, Pension Expense, and Deferred Outflows of Resources and Deferred Inflows of Resources Related to Pensions (Continued)
Teachers Pension and Annuity Fund (TPAF)
In accordance with GASB Statement No. 68, Accounting and Financial Reporting for Pensions, the District is not required to recognize a net pension liability for TPAF. The State of New Jersey is the only entity that has a legal obligation to make employer contributions to TPAF on behalf of the District. Accordingly, the District's proportionate share percentage determined under Statement No. 68 is zero percent and the State's proportionate share is 100% for TPAF. Therefore, in addition, the District does not recognize any portion of the TPAF collective deferred outflows of resources and deferred inflows of resources.
For the fiscal year ended June 30, 2015, the District recognized in the district-wide statement of activities (accrual basis) pension expense of$5,290,497 for TPAF. This amount has been included in the district-wide statement of activities (accrual basis) as a revenue and expense in accordance with GASB No. 24.
At June 30,2015 the State's proportionate share of the net pension liability attributable to the District is $98,319,221. The nonemployer allocation percentages are based on the ratio of the State's contributions made as au employer and nonemployer towards the actuarially determined contribution amount adjusted by locations who participated in the State early retirement incentives to total contributions to TP AF during the year ended June 30, 2014.
Actuarial Assumptions
The total pension liability for the June 30, 2014 measurement date was determined by an actuarial valuation as of July I, 2013, which was rolled forward to June 30, 2014. The total pension liability for the June 30, 2013 measurement date was determined by an actuarial valuation as of July 1, 2013. This actuarial valuation used the following actuarial assumptions, applied to all periods in the measurement.
Inflation Rate Salary Increases: 2012-2021
Thereafter
Investment Rate of Return Mortality Rate Table Period of Actuarial Experience
Study Upon Which Actuarial Assumptions were Based
2.50%
Varies based on experience Varies based
on experience 7.90%
RP-2000 July 1, 2009-Jnne 30, 2012
Assumptions for mortality improvements are based on Society of Actuaries Scale AA.
60
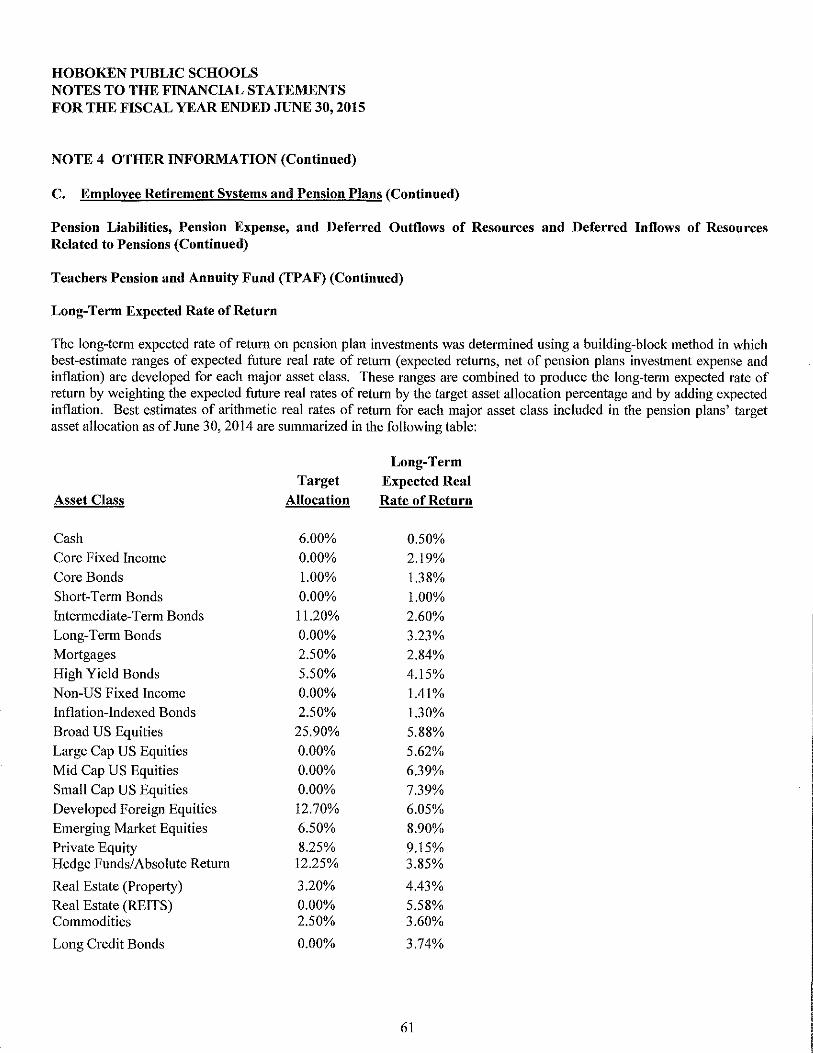
HOBOKEN PUBLIC SCHOOLS NOTES TO THE FINANCIAL STATEMENTS FOR THE FISCAL YEAR ENDED JUNE 30, 2015
NOTE 4 OTHER INFORMATION (Continued)
C. Employee Retirement Systems and Pension Plans (Continued)
Pension Liabilities, Pension Expense, and Deferred Outflows of Resources and Deferred Inflows of Resources Related to Pensions (Continued)
Teachers Pension and Annuity Fund (TPAF) (Continued)
Long-Term Expected Rate of Return
The long-term expected rate of return on pension plan investments was detennined using a building-block method in which best-estimate ranges of expected future real rate of retum (expected returns, net of pension plans investment expense and inflation) are developed for each major asset class. These ranges are combined to produce the long-term expected rate of return by weighting the expected future real rates of return by the target asset allocation percentage and by adding expected inflation. Best estimates of arithmetic real rates of retum for each major asset class included in the pension plans' target asset allocation as of June 30, 2014 aTe summarized in the following table:
Long-Term Target Expected Real
Asset Class Allocation Rate of Return
Cash 6.00% 0.50% Core Fixed Income 0.00% 2.19% Core Bonds 1.00% 1.38% Shmt-Term Bonds 0.00% 1.00% Intermediate-Term Bonds 11.20% 2.60% Long-Term Bonds 0.00% 3.23% Mortgages 2.50% 2.84% High Yield Bonds 5.50% 4.15% Non-US Fixed Income 0.00% 1.41% Inflation-Indexed Bonds 2.50% 1.30% Broad US Equities 25.90% 5.88% Large Cap US Equities 0.00% 5.62% Mid Cap US Equities 0.00% 6.39% Small Cap US Equities 0.00% 7.39% Developed Foreign Equities 12.70% 6.05% Emerging MaTket Equities 6.50% 8.90% Private Equity 8.25% 9.15% Hedge Funds/Absolute Return 12.25% 3.85%
Real Estate (Property) 3.20% 4.43% Real Estate (REITS) 0.00% 5.58% Commodities 2.50% 3.60%
Long Credit Bonds 0.00% 3.74%
61

HOBOKEN PUBLIC SCHOOLS NOTES TO THE FINANCIAL STATEMENTS FOR THE FISCAL YEAR ENDED JUNE 30, 2015
NOTE 4 OTHER INFORMATION (Continued)
C. Employee Retirement Systems and Pension Plans (Continued)
Pension Liabilities, Pension Expense, and Deferred Outflows of Resources and Deferred Inflows of Resources Related to Pensions (Continued)
Teachers Pension and Annuity Fund (TP AF) (Continued)
Discount Rate
The discount rate used to measure the total pension liabilities of the TPAF plan was as follows:
Discount Rate
TPAF 4.68%
The following table represents the crossover period, if applicable, for the TPAF defined benefit plan:
Period of Projected Benefit Payments for which the Following Rates were Applied:
Long-Term Expected Rate of Return
Municipal Bond Rate *
Through June 30, 2027
From July I, 2027 and Thereafter
* The municipal hond return rate used is 4.29%. The source is the Bond Buyer Go 20-Bond Municipal Bond Index, which includes tax-exempt general obligation municipal bonds with an average rating of AA/Aa or higher.
Sensitivity of Net Pension Liability
The following presents the State's proportionate share oftbe TPAF net pension liability attributable to the District calculated using the discount rate of 4.68%, as well as what the State's proportionate share of the TP AF net pension liability attributable to the District that would be if it were calculated using a discount rate tbat is !-percentage-point lower (3 .68 percent) or !-percentage-point higher (5.68 percent) than the current rate:
1% Current 1% Decrease Discount Rate Increase (3.68%) (4.68%) (5.68%)
State's Proportionate Share of the TPAF Net Pension Liability Attributable to the District $ 118,252,460 $ 98,319,221 $ 81,740,634
The sensitivity analysis was based on the State's proportionate share oftbe net pension liability attributable to the District at June 30, 2014. A sensitivity analysis specific to the State's proportionate share of the net pension liability attributable to the District at June 30, 2014 was not provided by the pension system.
62

HOBOKEN PUBLIC SCHOOLS NOTES TO THE FINANCIAL STATEMENTS FOR THE FISCAL YEAR ENDED JUNE 30, 2015
NOTE 4 OTHER INFORMATION (Continued)
C. Employee Retirement Systems and Pension Plans (Continued)
Pension Liabilities, Pension Expense, and Deferred Outflows of Resources and Deferred Inflows of Resources Related to Pensions (Continued)
Teachers Pension and Annuity Fund (TPAF) (Continued)
Pension Plan Fiduciary Net Position
Detailed information about the TPAF pension plan's fiduciary net position is available in the separately issued financial repmt from the State of New Jersey, Department of the Treasury, Division of Pension and Benefits. The financial reports may be accessed via the New Jersey, Division of Pensions and Benefits, website at www.state.nj.us/treasruy/pensions.
D. Post-Retirement Medical Benefits
The State of New Jersey sponsors and administers the post-retirement health benefit program plans for school districts. The Plans are classified as either single employer plans or cost sharing multiple employer defined benefit plans depending on the plan the eligible employee is covered under.
As a result of implementing Govemmental Accounting Standards Board (GASB) Statement No. 43, Financial Reporting for Post-employment Benefit Plans Other than Pension Plans (OPEB), effective for Fiscal Year 2007, the State Health Benefits Program (SHBP), and the Prescription Drug Program (PDP), and Post-Retirement Medical (PRM) of the PERS and TPAF are combined and reported as Pension and Other employee Benefit Trust Funds in the State's Comprehensive Annual Financial Report (CAFR). Specifically, SHBP-State, and the PRM of the PERS are combined and reported as a Health Benefits Program Fund - State classified as a single employer plan. The SHBP-Local, PDP-Local, and the PRM of the TPAF-Local are combined and reported as Health Benefits Program Fund -Local Government classified as a cost-sharing multiple-employer plan in the State's CAFR. The post-retirement benefit programs had a total of 590 state and local participating employers and contributing entities for Fiscal Year 2014.
The State of New Jersey sponsors and administers the following health benefit programs covering certain state and local government employees, including those Board employees and retirees eligible for coverage.
Health Benefits Program Fund (HBPF) -Local Education (including Prescription Drug Program Fund)- The State of New Jersey provides paid coverage to members of the Teachers' Pension and Annuity Fund who retire from a board of education or county college with 25 years of service or on a disability retirement. Under the provisions of P.L. 1992, c.l26, the State also provides paid coverage to members of the Public Employees' Retirement System and Alternate Benefits Program who retire from a board of education or county college with 25 years of service or on a disability retirement if the member's employer does not provide this coverage. Certain local participating employers also provide post-retirement medical coverage to their employees. Retirees who are not eligible for state paid health coverage at retirement can continue in the program if their employer participates in this program or if they are participating in the health benefits plan of their former employer and are enrolled in Medicare parts A and B by paying the cost of the insurance for themselves and their covered dependents. Also, education employees are eligible for the PDP coverage after 60 days of employment.
The State of New Jersey, Department of the Treasury, Division of Pensions and Benefits, issues publicly available financial reports that include the financial statements and required supplementary information of the above Fund. The financial reports may be accessed via the State of New Jersey, Department of the Treasury, Division of Pensions and Benefits, website at www.state.nj.us/treasury/pensions.
63

HOBOKEN PUBLIC SCHOOLS NOTES TO THE FINANCIAL STATEMENTS FOR THE FISCAL YEAR ENDED JUNE 30,2015
NOTE 4 OTHER INFORMATION (Continued)
D. Post-Retirement Medical Benefits (Continued)
Basis of Accounting
The financial statements of the health benefit programs are prepared on the accrual basis of accounting. Employer contributions are recognized when payable to the health benefit programs. Benefits or refunds are recognized when due and payable in accordance with the terms of the health benefit programs.
Significant Legislation
P .L. 20 II, c. 78, effective October 20 II, sets new employee contribution requirements towards the cost of employerprovided health benefit coverage. Employees are required to contribute a certain percentage of the cost of coverage. The rate of contribution is determined based on the employee's annual salary and the selected level of coverage. The increased employee contributions will be phased in over a 4-year period for those employed prior to this new legislation's effective date with a minimum contribution required to be at least 1.5% of salary.
Investment Valuation
Investments are reported at fair value. Investments that do not have an established market are reported at estimated fair values.
Funded Status and Funding Progress
As of July I, 2013, the most recent actuarial valuation date, the State had a $53.0 billion unfunded actuarial accrued liability for other post-employment benefits (OPEB) which is made up to $19.7 billion for state active and retired members and $33.3 billion for education employees and retirees that become the obligation of the State of New Jersey upon retirement.
The funded status and funding progress of the OPEB includes actuarial valuations which involve estimates of the value of reported amounts and assumptions about the probability of events far into the future. These amounts are subject to continual revision as actual results are compared to past expectations and new estimates are made about the probability of future events.
Actuarial calculations reflect a long-term perspective and are based on the benefits provided under the terms of the OPEB in effect at the time of each valuation and also consider the pattern of the sharing of costs between the employer and members at the point in time. The projection of benefits for financial repmting purposes does not explicitly incorporate the potential effects of legal or contractual funding limitations on the pattern of cost sharing between the employer and members in the future.
Actuarial Methods and Assumptions
In the July I, 2013, OPEB actuarial valuation, the projected unit credit was used as the actuarial cost method. The actuarial assumptions included an assumed investment rate of return of 4.50 percent.
64

HOBOKEN PUBLIC SCHOOLS NOTES TO THE FINANCIAL STATEMENTS FOR THE FISCAL YEAR ENDED JUNE 30, 2015
NOTE 4 OTHER INFORMATION (Continued)
D. Post-Retirement Medical Benefits (Continued)
Funded Status and Funding Progress (Continued)
Post-Retirement Medical Benefits Contributions
P.L. 1987, c. 384 and P.L. 1990, c.6 required the Teachers' Pension and Annuity Fund (TPAF) and Public Employees' Retirement System (PERS), respectively to fund post-retirement medical benefits for those State employees and education employees who retire after accumulating 25 years of credited service or on a disability retirement. As of June 30, 2014, there were 103,432, retirees receiving post-retirement medical benefits and the State contributed $1.04 billion on their behalf. The cost of these benefits is funded through contributions by the State and in accordance with P.L. 1994, c.62. Funding of post-retirement medical benefits changed from a pre-funding basis to a pay-as-you-go basis beginning in Fiscal Year 1994.
The State is also responsible for the cost attributable to P.L. 1992, c.l26, which provides employer paid health benefits to members of PERS and the Alternate Benefit Program who retired from a board of education or county college with 25 years of service. The State paid $165.8 million toward Chapter 126 benefits for 18,122 eligible retired members in Fiscal Year 2014.
The State sets the contribution rate based on a pay as you go basis and not on the annual required contribution of the employers (ARC), an amount actuarially determined in accordance with the parameters of GASB Statement 45. The ARC represents a level of funding that, if paid on an ongoing basis, is projected to cover normal cost each year and amortize any unfunded actuarial liabilities (or funding excess) of the plan over a period not to exceed thirty years. The State's contributions to the State Health Benefits Program Fund for TPAF retirees' post-retirement benefits on behalf of the School District for the fiscal years ended June 30, 2015, 2014 and 2013 were $1,619,970, $1,275,980 and $1,416,701 respectively, which equaled the required contributions for each year. The State's contributions to the State Health Benefits Program Fund for PERS retirees' post-retirement benefits on behalf of the School District was not determined or made available by the State of New Jersey.
E. Hurricane Sandy
On October 29, 2012 Hurricane Sandy, the largest Atlantic hurricane on record made landfall in New Jersey and resulted in severe damage in numerous communities and a federal disaster was declared throughout the State. The District has incurred significant costs in the clean up and recovery from this federal disaster. The Federal Emergency Management Agency ("FEMA") provides emergency grant assistance (voluntary nonexchange transaction) to help government's cope with losses. Although the District has applied for reimbursement from FEMA, the total amount to be received in conjunction with this event is not considered to be measurable with sufficient reliability and therefore has not been recognized in the financial statements as of June 30, 2015. As of June 30, 2015, the District has received $515,080 in FEMA reimbursements relating to Hurricane Sandy which have been reflected in the financial statements.
65

HOBOKEN PUBLIC SCHOOLS NOTES TO THE FINANCIAL STATEMENTS FOR THE FISCAL YEAR ENDED JUNE 30, 2015
NOTE 5 RESTATEMENT
On July I, 2014, the Hoboken Public Schools implemented GASB Statement No. 68, "Accounting and Financial Reporting for Pensions. The Hoboken Public Schools has determined that the effect of implementing this accounting change on the financial statements previously reported as of and for the fiscal year ended June 30, 2014 was to recognize the District's proportionate share of the Public Employees' Retirement System's (PERS) net pension liability, deferred outflows of resources and deferred inflows of resources with a corresponding reduction in the unrestricted component of net position in the amount of$14,263,915. The result of this restatement is to reduce total net position of Governmental Activities.
The District conducted an update of its capital asset inventory as of June 30, 2015. The District has restated its July 1, 2014 capital asset values, including accumulated depreciation amounts, to reflect the amounts reported in the capital asset inventory report. The net effect of this restatement was a reduction to governmental activities net position of $1,319,229 and an increase to business-type activities net position of$102,838.
The net effect of these restatements combined is a decrease of $15,583,144 of total net position of governmental activities at June 30, 2014 from $16,248,297, as originally reported, to $665,153, an increase in total net position of business-type activities atJune 30, 2014 from a deficit of$576, 177, as originally reported, to a deficit of $473,339.
66

REQUIRED SUPPLEMENTARY INFORMATION- PART II

BUDGETARY COMPARISON SCHEDULES

EXHIBITC-1 HOBOKEN PUBLIC SCHOOLS
GENERAL FUND BUDGETARY COMPARISON SCHEDULE
FOR THE FISCAL YEAR ENDED .JUNE 30, 2015
Variance Original Final Final Budget Budget Adjustments Budget Actual to Actual
REVENUES Local Sources
Local Property Tax Levy $ 39,426,390 $ 39,426,390 $ 39,426,390 Tuition- Other LEAs 28,693 28,693 73,500 $ 44,807
Transportation Fees from Other LEAs 44,959 44,959 33,017 (11,942)
Rentals 247,769 247,769 543,838 296,069
Interest on Investments 143 143 Unrestricted Miscellaneous Revenues 249,066 249,066 155,658 (93,408)
Total Local Sources 39,996,877 39,996,877 40,232,546 235,669
State Sources Public Schools Choice Aid 2,566,179 2,566,179 1,896,741 (669,438) Transportation Aid 124,289 124,289 124,289 Special Education Aid 1,463,760 1,463,760 1,463,760 Security Aid 725,704 725,704 725,704 Adjustment Aid 5,392,689 5,392,689 5,392,689 Extraordinary Aid 180,473 180,473 205,409 24,936 Additional Adjustment Aid 255,024 255,024 255,024 P ARCC Readiness Aid 24,610 24,610 24,610 Per Pupil Growth Aid 24,610 24,610 24,610 On Behalf TP AF Pension System Contrib.(Norma1 & Accrued Liab.) 951,964 951,964 On BehalfTPAF Pension System Contrib.(NCGl) 68,489 68,489 On-Behalf Post Retirement Medical Benefit Contr 1,619,970 1,619,970
Reimbursed TP AF Social Security Contribution (Non Budgeted) 1,386,247 1,386,247
Total State Sources 10,757,338 10,757,338 14,139,506 3,382,168
Federal Sources Impact Aid 139,275 139,275 183,914 44,639 Medicaid Reimbursement 40,427 40,427 209,948 169,521
Total Federal Sources 179,702 179,702 393,862 214,160
Total Revenues 50,933,917 50,933,917 54,765,914 3,831,997
EXPENDITURES CURRENT EXPENDITURES
Instruction - Regular Programs
Salaries of Teachers Kindergarten 643,211 $ 485,548 1,128,759 1,124,962 3,797 Grades 1-5 5,091,989 (367,478) 4,724,511 4,677,985 46,526
Grades 6-8 1,458,921 (96,422) 1,362,499 1,334,591 27,908 Grades 9-12 3,307,987 35,693 3,343,680 3,264,214 79,466
Home Instruction Salaries of Teachers 5,000 19,319 24,319 23,432 887 Purchased Professional Educational Services 9,990 40,700 50,690 30,420 20,270
Regular Programs- Undistributed Instruction Other Salaries for Instruction 180,682 180,682 !64,849 15,833 Purchased Professional Educational Services 6,750 (4,250) 2,500 2,500
Purchased Technical Services 251 (251)
Other Purchased Services 4,500 59,714 64,214 22,494 41,720
General Supplies 700,526 849,935 1,550,461 699,135 851,326
Textbooks 91,532 155,207 246,739 236,687 10,052
Other Objects 27 705 5,237 32,942 24,173 8,769
Total Regular Programs 11,348,362 1,363,634 12,711,996 11,605,442 1,106,554
67

EXHJBITC-1 HOBOKEN PUBLIC SCHOOLS
GENERAL FUND BUDGETARY COMPARISON SCHEDULE
FOR THE FISCAL YEAR ENDED .JUNE 30, 2015
Variance Original Final Final Budget Budget Adjustments Budget Actual to Actual
EXPENDITURES CURRENT EXPENDITURES (Continued)
Special Education Cognitive- Moderate
Salaries of Teachers $ 75,402 $ (74,602) $ 800 $ 800 Other Salaries for Instruction Purchased Professional Educational Services Other Purchased Services 1,800 (1,800) General Supplies 5,412 (4,459) 953 $ 399 554
Total Cognitive- Moderate 82,614 (80,861) 1,753 399 1,354
Learning and/or Language Disabilities Salaries of Teachers 93,062 6,026 99,088 98,808 280 Other Purchased Services 350 (350) General Supplies 1,000 67 1,067 790 277 -----
Total Learning and/or Language Disabilities 94,412 5,743 100,155 99,598 557
Behavioral Disabilities Salaries of Teachers 93,062 (42,843) 50,219 49,223 996 Other Salaries for Instruction Purchased Professional/Educational Services Other Purchased Services General Supplies 850 (554) 296 296
Total Behavioral Disabilities 93,912 (43,397) 50,515 49,519 996 -----
Multiple Disabilities Salaries of Teachers 485,427 (13,857) 471,570 464,475 7,095 Other Salaries for Instruction 118,004 (13,591) 104,413 97,596 6,817 Purchased Professional/Educational Services 300 (300) Other Purchased Services 1,650 (1,500) 150 150 General Supplies 7,037 (1,591) 5,446 5,208 238 Other Objects 1,000 (1,000)
Total Multiple Disabilities 613,418 (31,839) 581,579 567,279 14,300
Resource Room Salaries of Teachers 1,817,133 24,790 1,841,923 1,788,626 53,297 Other Salaries for Instruction Purchased Professional/Educational Services 2,400 (2,400) Purchased Technical Services 1,500 ( 1,500) Other Purchased Services 5,000 (4,428) 572 572 General Supplies 2,650 327 2,977 2,127 850
Total Resource Room 1,828,683 16,789 1,845,472 1,791,325 --~
Autism
Salaries of Teachers Other Salaries for Instruction
General Supplies 292 292 292
Total Autism 292 292 292
68

EXHIBIT C-1 HOBOKEN PUBLIC SCHOOLS
GENERAL FUND BUDGETARY COMPARISON SCHEDULE
FOR THE FISCAL YEAR ENDED JUNE 30, 2015
Variance Original Final Final Budget Budget Adjustments Budget Actual to Actual
EXPENDITURES CURRENT EXPENDITURES (Continued)
Preschool Disabilities- Full Time
Salaries of Teachers $ 475,360 $ (46,713) $ 428,647 $ 428,123 $ 524 Other Salaries for Instruction 14,575 988 15,563 14,640 923 Purchased Professional-Educational Services 22,000 (1,840) 20,160 19,740 420 Other Purchased Services 1,000 (1,000) General Supplies 30,050 (26,581) 3,469 3,388 81
Total Preschool Disabilities- Full Time 542,985 (75,146) 467,839 465,891 1,948
Home Instruction
Salaries of Teachers 6,000 6,343 12,343 11,664 679 Purchased Professional/Educational Services 75,000 {52,736) 22,264 11,247 11,017
Total Home Instruction 81,000 ~46,393) 34,607 22,911 11,696
Total Special Education 3,337,024 (254,812) 3,082,212 2,997,214 84,998
Bilingual Education Salaries ofT eachers Other Salaries for Instruction
Purchased Professiona!!Educalional Services Other Purchased Services
General Supplies Other Objects
Total Bilingual Education
School Sponsored Cocurricular Activities Salaries 403,964 3,204 407,168 222,257 184,911 Other Purchased Services 18,104 10,119 28,223 27,009 1,214 Supplies and Materials 67,921 (37,256) 30,665 28,036 2,629 Other Objects 68,095 4,814 72,909 71,263 1,646
Total School Sponsored Cocurricular Activities 558,084 (19,119) 538,965 348,565 190,400
School Sponsored Athletics Salaries 407,020 22,321 429,341 404,087 25,254 Other Purchased Services 106,220 10,950 117,170 59,327 57,843 Supplies and Materials 105,211 9,926 115,137 109,504 5,633 Other Objects 160,064 (129,030) 31,034 12,471 18,563
Total Athletics 778,515 {85,833) 692,682 585,389 107,293
Summer Schoo[
Salaries of Teachers 52,565 420 52,985 49,599 3,386 Other Salaries for Instruction 41,375 (4,242) 37,133 30,731 6,402 Salaries of Teacher Tutors General Supplies 7,500 (1,041) 6,459 2,133 4,326 Other Objects
Total Summer School 101,440 {4,863) 96,577 82,463 14,114
Other Supplemental/At-Risk Programs-Instruction Salaries of Teacher Tutors
Total Other Supplemental/At-Risk Programs-Instrucion
Total- Instruction 16,123,425 999,007 17,122,432 15,6\9,073 1,503,359
69
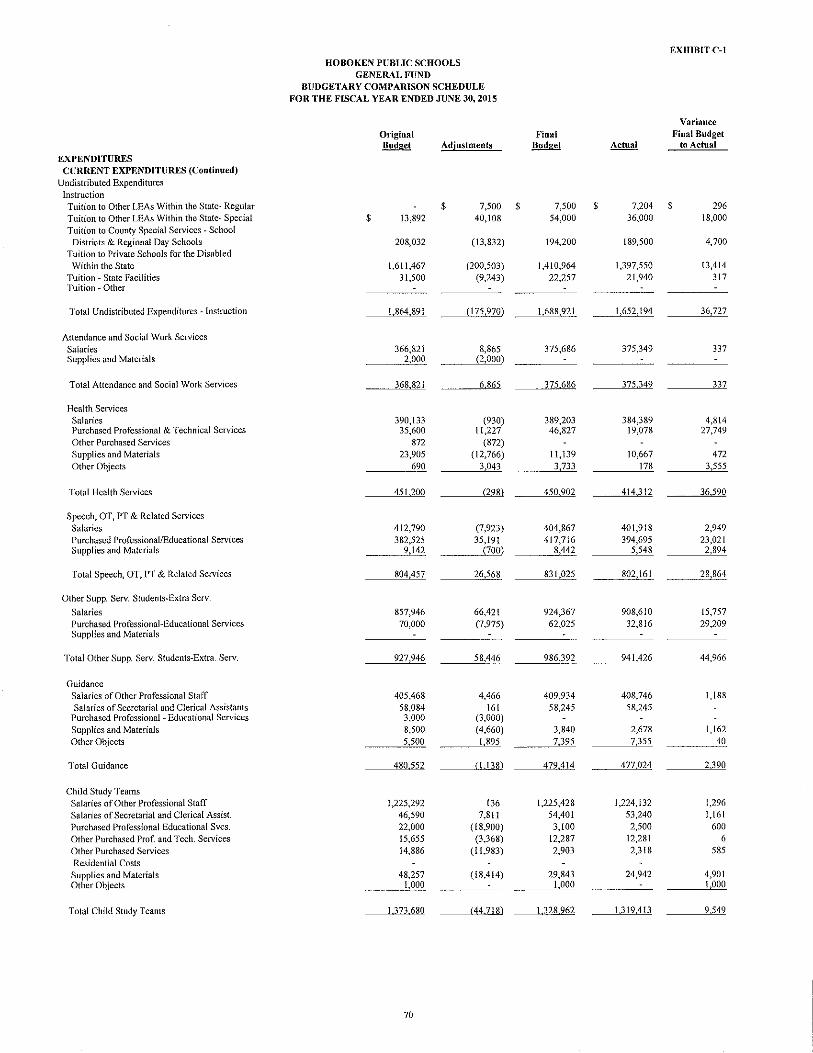
EXHIBIT C-1 HOBOKEN PUBLIC SCHOOLS
GENERAL FUND BlJDGETARY COMPARISON SCHEDULE
FOR THE FISCAL YEAR ENDED .JUNE 30, 2015
Variance Original Final Final Budget Budget Adjustments Budget Actual to Actual
EXPENDITURES CtJRRENT EXPENDITURES (Continued)
Undistributed Expenditures Instruction Tuition to Other LEAs Within the State- Regular $ 7,500 $ 7,500 $ 7,204 $ 296
Tuition to Other LEAs Within the State- Special $ 13,892 40,108 54,000 36,000 18,000
Tuition to County Special Services - School Districts & Regional Day Schools 208,032 (13,832) 194,200 189,500 4,700
Tuition to Private Schools for the Disabled
Within the State 1,611,467 (200,503) 1,410,964 1,397,550 !3,414 Tuition- State Facilities 31,500 (9,243) 22,257 21,940 317 Tuition • Other
Total Undistributed Expenditures- Instruction 1,864,891 (175,970) 1,688,921 1,652,194 36,727
Attendance and Social Work Services
Salaries 366,821 8,865 375,686 375,349 337 Supplies and Materials 2,000 (2,000)
Total Attendance and Social Work Services 368 821 6 865 ___ 3_7~ 375 349 337
Health Services Salaries 390,133 (930) 389,203 384,389 4,814 Purchased Professional & Technical Services 35,600 11,227 46,827 19,078 27,749 Other Purchased Services 872 (872) Supplies and Materials 23,905 (12,766) 11,139 10,667 472 Other Objects 690 3,043 3,733 178 3,555
Total Health Services 451 200 (298} 450 902 414 312 36 590
Speech, OT, PT & Related Services Salaries 412,790 (7,923) 404,867 401,918 2,949 Purchased Professional/Educational Services 382,525 35,191 417,716 394,695 23,021 Supplies and Materials 9,142 (700) 8,442 5,548 2,894
Total Speech, OT, PT & Related Services 804,457 26,568 831,025 802,161 28,864
Other Supp. Serv. Students-Extra Serv.
Salaries 857,946 66,421 924,367 908,610 15,757 Purchased Professional-Educational Services 70,000 (7,975) 62,025 32,816 29,209 Supplies and Materials
Total Other Supp. Serv. Students-Extra. Serv. 927,946 58,446 986,392 941,426 44,966
Guidance Salaries of Other Professional Statf 405,468 4,466 409,934 408,746 1,188
Salaries of Secretarial and Clerical Assistants 58,084 161 58,245 58,245 Purchased Professional- Educational Services 3,000 (3,000) Supplies and Materials 8,500 (4,660) 3,840 2,678 1,162
Other O~jects 5,500 1,895 7,395 7,355 40
Total Guidance 480 552 (] 138) 479414 477 024 2 390
Child Study Teams Salaries of Other Professional Staff 1,225,292 136 1,225,428 1,224,132 1,296
Salaries of Secretarial and Clerical Assist. 46,590 7,811 54,401 53,240 1,161
Purchased Professional Educational Svcs. 22,000 (18,900) 3,100 2,500 600
Other Purchased Prof. and Tech. Services 15,655 (3,36&) 12,287 12,281 6
Other Purchased Services 14,886 (11,9&3) 2,903 2,318 585
Residential Costs Supplies and Materials 48,257 (18,414) 29,843 24,942 4,901 Other Objects 1,000 1,000 1,000
Total Child Study Teams 1 373 680 (44 718) 1 328 962 1319413 9 549
70

EXHIBIT C~t HOBOKEN PUBLIC SCHOOLS
GENERAL FUND BUDGETARY COMPARISON SCHEDULE
FOR THE FISCAL YEAR ENDED JUNE 30, 2015
Variance Original Final Final Budget Budget Adjustments Budget Actual to Actual
EXPENDITURES CURRENT EXPENDITURES (Continued) Undistributed Expenditures (Continued) Improvement of Instructional Services
Salaries of Supervisors of Instruction $ 438,813 $ 100,454 $ 539,267 $ 539,267 Salaries of Other Professional Staff 116,252 12,239 128,491 128,491 Salaries of Secretarial and Clerical Assist. 203,523 (16,297) 187,226 187,226 Other Salaries 74,808 (40,410) 34,398 34,398
Salaries of Facilitators, Math & Literacy Coaches 95,307 5,119 100,426 94,621 $ 5,805 Other Purchased Services
Purchased Professional Educational Svcs. 13,664 (10,014) 3,650 3,650 Other Purchased Prof & Tech Services Supplies & Materials Other Objects
Total Improvement of Instructional Services 942,367 51,091 993,458 987,653 5,805
Educational Media Services/School I .ibrary Salaries 585,616 (193,623) 391,993 389,102 2,891
Purchased Professional and Technical Services 150 (150) Other Purchased Services 50 (50) Supplies and Materials 70,437 (22,246) 48,191 43,040 5,151 Other Objects -----
Total Educational Media Services/School Library 656,253 {216,069) 440,\84 432,142 8,042
Instructional Staff Training Services Salaries of Secretarial and Clerical Assist. 6,178 6,178 6,177 Purchased Professional Educational Svcs. 17,000 (15,670) 1,330 1,060 270 Other Purchased Prof. and Tech. Services 500 (500) Other Purchased Services 148,873 (128,080) 20,793 18,901 1,892 Supplies and Materials
Total Instructional Staff Training Services 166,373 {138,072) 28,301 26,138 2,\63
Support Services General Administration Salaries 293,541 (8,106) 285,435 279,137 6,298 Legal Services 210,000 142,692 352,692 153,976 198,716 Audit Fees 53,804 68,903 122,707 95,692 27,015 Other Purchased Professional Services 15,500 18,940 34,440 34,440 Purchased Technical Services
Communicationsffelephone 173,322 35,221 208,543 76,893 131,650 BOE Other Purchased Services 4,853 (2,879) 1,974 1,974 Misc. Purchased Services 76,418 154,324 230,742 220,863 9,879 General Supplies 3,925 15,162 19,087 17,981 1,106 BOE In-House Training/Meeting Supplies 2,040 (2,040) Judgements Against the School District
Miscellaneous Expenditures 6,670 1,048 7,718 7,556 162 BOE Membership Dues and Fees 27,100 (835) 26,265 26,134 131
Total Support Services General Administration 867,173 422,430 I ,289,603 914,646 374,957
Support Services School Administration Salaries of Principals/ Asst. Principals 944,423 53,110 997,533 984,749 12,784 Salaries of Other Professional Staff 750 750 750
Salaries of Secretarial and Clerical Assistants 341,475 (19,161) 322,314 322,082 232 Purchased Professional & Technical Svcs. Other Purchased Services 1,300 (1,086) 214 214 Supplies and Materials 86,097 244 86,341 76,071 10,270 Other Objects 4,961 3,622 8,583 8,540 43 ------
Total Support Services School Administration -~1 378256 37 479 1415735 l 392 192 23 543
7l

EXHIBIT C~t HOBOKEN PUBLIC SCHOOLS
GENERAL FUND BUDGETARY COMPARISON SCHEDULE
FOR THE FISCAL YEAR ENDED JUNE 30, 2015
Variance Original Final Final Budget Budget Adjustments Budget Actual to Actual
EXPENDITURES CURRENT EXPENDITURES (Continued) Undistributed Expenditures (Continued) Support Services Central Services
Salaries $ 454,480 $ 3,752 $ 458,232 $ 458,232
Purchased Professional Services 102,700 64,477 167,177 139,135 $ 28,042
Purchased Technical Services 82,963 (17,217) 65,746 43,715 22,031
Misc. Purch. Services 40,525 (14,400) 26,125 3,890 22,235
Sale/Lcase~Back Payments Supplies and Materials 35,520 8,770 44,290 42,147 2,143 Interest on Lease Purchase Agreements 9,998 9,998 9,998 Misc. Expenditures 8,383 --~ -- 4,094 4,289
Total Support Services Central Services 734 569 45 382 779 951 701 211 78 740
Admin. Info. Tech. Salaries 34,760 34,760 34,593 167 Purchased Professional Services 9,610 (4,900) 4,710 1,397 3,313 Purchased Technical Services 4,900 59,717 64,617 19,947 44,670 Other Purchased Services 75,769 (15,095) 60,674 57,514 3,160 Supplies and Materials 28,867 24,792 53,659 51,907 1,752
Total Admin. Info Tech. [53 906 64 5l:l: 218 420 165358 53 062
Required Maintenance For School Facilities
Salaries 863,291 5,467 868,758 868,758 Cleaning, Repair, and Maintenance Services 393,926 230,447 624,373 550,754 73,619 General Supplies 95,505 (32,674) 62,831 54,878 7,953
Total Required Maintenance For School Facilities 1,352,722 203,240 1,555,962 1,474,390 81,572
Custodial Services Salaries 1,051,258 407,757 1,459,015 1,348,770 110,245 Salaries of Non-Instructional Aides 10,648 456 11,104 6,810 4,294 Cleaning, Repair, and Maintenance Services 426,484 (105,956) 320,528 194,544 125,984
Other Purchased Property 118,740 14,020 132,760 106,184 26,576
Insurance 189,304 14,817 204,121 204,121 Miscellaneous Purchased Services 93,487 56,004 149,491 100,832 48,659 General Supplies 249,847 (7,005) 242,842 225,240 17,602 Energy (Ileal and Electricity) 730,957 12,870 743,827 507,582 236,245 Enerb'Y (Natural Gas) 599,720 ____(103,261) 496,459 277,958 218,501
Total Custodial Services 3,470,445 289,702 3,760,147 2,972,041 788,!06
Care & Upkeep of Grounds Snlaries 105,896 (1,777) 104,119 101,077 3,042
Cleaning, Repair, and Maintenance Services 2,470 2,470 2,470 General Supplies 13,160 (10,692) 2,468 3,659 (1,191)
Total Care & Upkeep of Grounds 105,896 7,324 113,220 107,206 6,014
Security Salaries 284,168 18,939 303,107 296,407 6,700
Cleaning, Repair, and Maintenance Services 1,664 1,664 1,664 General Supplies 14,165 (1,266) 12,899 10,131 2,768
Total Security 298,333 17,673 316,006 306,538 9,468
72
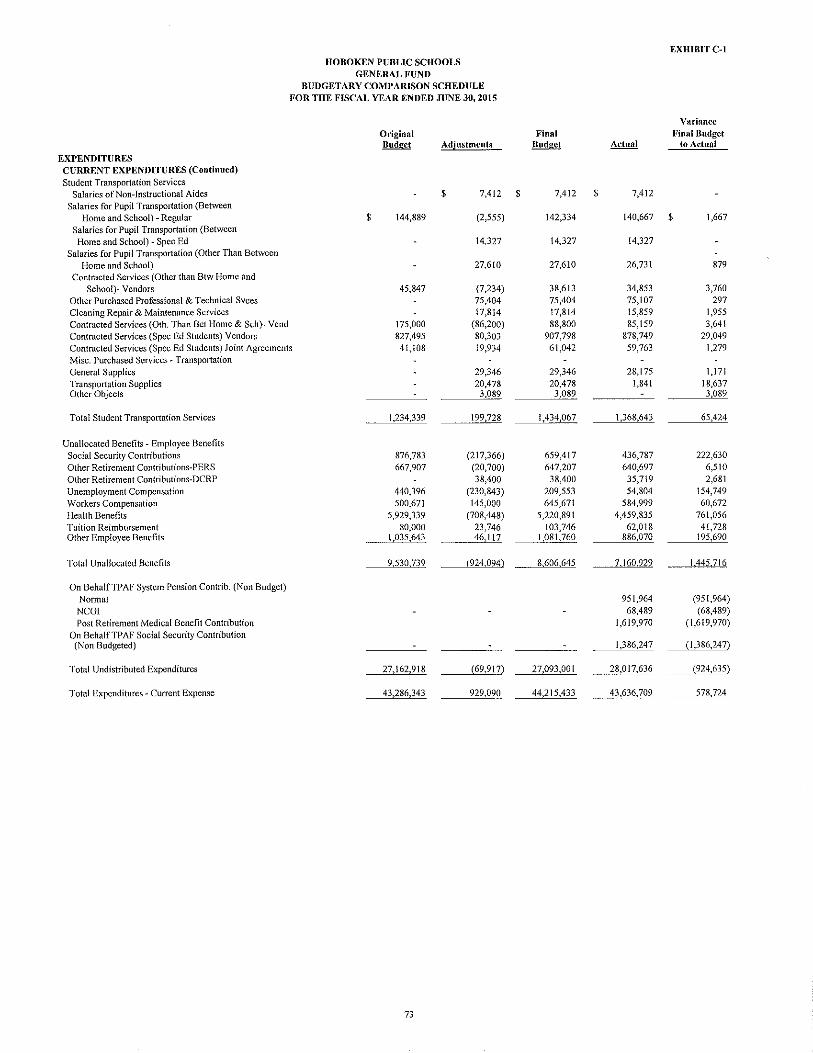
EXHIBIT C*l
HOBOKEN PtlBLIC SCHOOLS GENERAL FUND
BUDGETARY COMPARISON SCHEDULE FOR THE FISCAL YEAR ENDED JUNE 30, 2015
Variance 0.-iginal Final Final Budget Budget Adjustmcnfl! Budget Actual to Actual
EXPENDITURES CURRENT EXPENDITURES (Continued) Student Transportation Services
Salaries of Non-Instructional Aides $ 7,412 $ 7,412 $ 7,412
Salaries for Pupil Transportation (Between Home and School)- Regular $ 144,889 (2,555) 142,334 140,667 $ 1,667
Salaries for Pupil Transportation (Between Home and School)- Spec Ed 14,327 14,327 14,327
Salaries for Pupil Transportation (Other Than Between Home and School) 27,610 27,610 26,731 879
Contracted Services (Other than Btw Home and School)- Vendors 45,847 (7,234) 38,613 34,853 3,760
Other Purchased Professional & Technical Svces 75,404 75,404 75,107 297 Cleaning Repair & Maintenance Services 17,814 17,814 15,859 1,955 Contracted Services (Oth. Than Bet Home & Sch)- Vend 175,000 (86,200) 88,800 85,159 3,641 Contracted Services (Spec Bd Students) Vendors 827,495 80,303 907,798 878,749 29,049
Contracted Services (Spec Ed Students) Joint A!,>reements 41,108 19,934 61,042 59,763 1,279
Misc. Purchased Services~ Transportation General Supplies 29,346 29,346 28,175 1,171
Transportation Supplies 20,478 20,478 1,841 18,637 Other Objects 3,089 3,089 3,089
Total Student Transportation Services 1,234,339 199,728 1.434,067 1,368,643 65,424
Unallocated Benefits~ Employee Benefits Social Security Contributions 876,783 (217,366) 659,417 436,787 222,630
Other Retirement Contributions~PERS 667,907 (20,700) 647,207 640,697 6,510 Other Retirement Contributions~DCRP 38,400 38,400 35,719 2,681
Unemployment Compensation 440,396 (230,843) 209,553 54,804 154,749 Workers Compensation 500,671 145,000 645,671 584,999 60,672
Health Benefits 5,929,339 (708,448) 5,220,891 4,459,835 761,056 Tuition Reimbursement 80,000 23,746 103,746 62,018 41,728 Other Employee Benefits 1,035,643 46,117 1,081,760 886,070 195,690
Total Unallocated Benefits 9 530 739 (924 09~:) 8 606 645 7 \60 929 l 445 716
On BehalfTPAF System Pension Contrib. (Non Budget)
Normal 951,964 (951,964)
NCGI 68,489 (68,489) Post Retirement Medical Benefit Contribution 1,619,970 (1,619,970)
On BehalfTP AF Social Security Contribution (Non Budgeted) 1,386,247 (1,386,247)
Total Undistributed Expenditures 27,!62,918 (69,917) 27,093,001 28,017,636 (924,635)
Total Expenditures ~ Current Expense 43,286,343 929,090 44,215,433 43,636,709 578,724
73
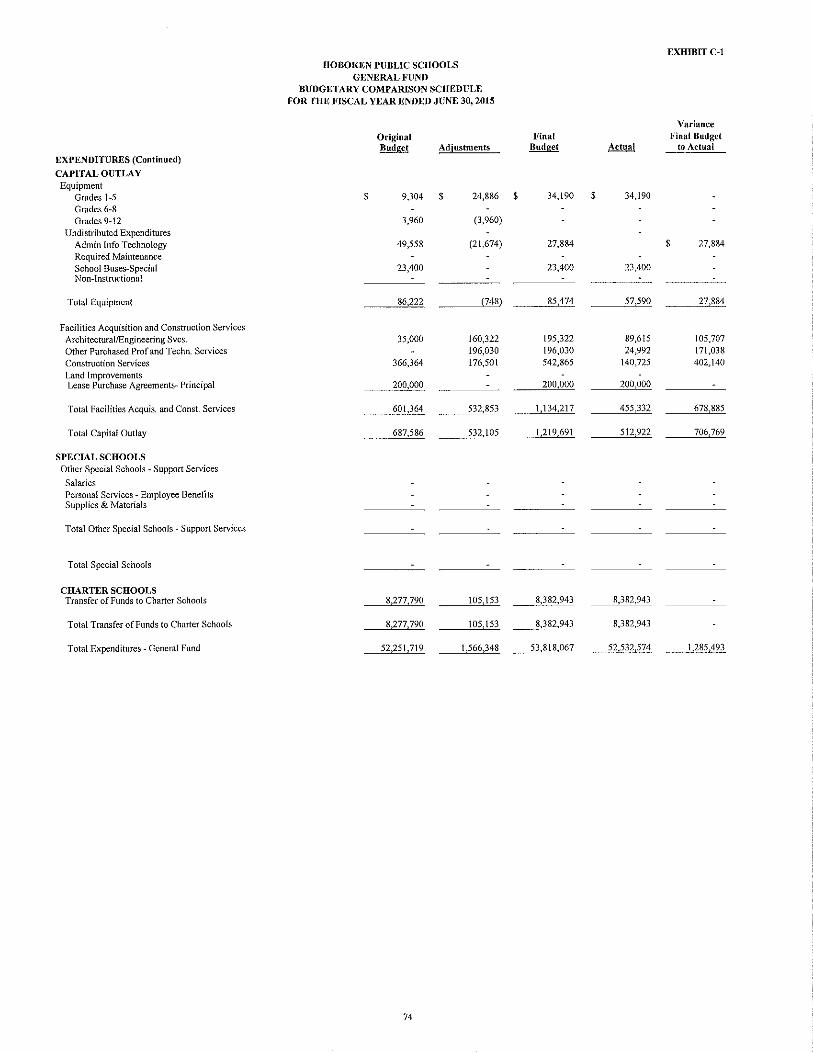
EXHIDITC-1
HOBOKEN PUBLIC SCHOOLS GENERAL FUND
BUDGETARY COMPARISON SCHEDULE FOR THE FISCAL YEAR ENDED JUNE 30, 2015
Variance
Original Final Final Budget Budget Adjustments Budget Actual to Actual
EXPENDITURES (Continued)
CAPITAL OUTLAY Equipment
Grades 1-5 $ 9,304 $ 24,886 $ 34,190 $ 34,190
Grades 6-8 Grades 9-12 3,960 (3,960)
Undistributed Expenditures Admin Info Technology 49,558 (21,674) 27,884 $ 27,884
Required Maintenance School Buses-Special 23,400 23,400 23,400 Non-Instructional -----
Total Equipment 86,222 {748) 85,474 57,590 27,884
Facilities Acquisition and Construction Services Architectural/Engineering Svcs. 35,000 160,322 195,322 89,615 105,707
Other Purchased Prof and Techn. Services 196,030 196,030 24,992 171,038
Construction Services 366,364 176,501 542,865 140,725 402,140
Land Improvements Lease Purchase Agreements- Principal 200,000 200,000 200,000
Total Facilities Acquis. and Canst. Services 601,364 532,853 1,134,217 455,332 678,885
Total Capital Outlay 687,586 532,105 1,219,691 512,922 706,769
SPECIAL SCHOOLS Other Special Schools - Support Services
Salaries Personal Services- Employee Benefits Supplies & Materials
Total Other Special Schools- Support Services
Total Special Schools
CHARTER SCHOOLS Transfer of Funds to Charter Schools 8,277,790 105,153 8,382,943 8,382,943
Total Transfer of Funds to Charter Schools 8,277,790 105,153 8,382,943 8,382,943
Total Expenditures- General Fund 52,251,719 1,566,348 53,818,067 52,532,574 1,285,493
74

HOBOKEN PUBLIC SCHOOLS GENERAL FUND
BllDGETARYCOMPARISON SCHEDtlLE FOR THE FISCAL YEAR ENDED ,JllNE 30, 2015
Excess (Deficiency) of Revenues Over (Under) Expenditures
Other Financing Sources(Uses) Transfers In-SBB-Gencra1 Fund Transfers In-SBB-Special Revenue Fund Transfurs Out- Special Revenue Fund Transfer Out- Food Service Fund Transfers Out-SBB
Total Other Financing Sources(Uses)
Exccss(Deficiency) of Revenues and Other Financing Sources Over{Under) Expenditures and Other Financing Uses
Fund Balances, Beginning of Y car
Fund Balances, End of Y car
Recapitulation: Restricted
Capital Reserve Maintenance Reserve Excess Surplus
Assigned Year End Encumbrances
Designated for Subsequent Year's Expenditures
$
$
Designated for Subsequent Year's Expenditures- 2016117 Budget- ARRA/SEMI Unassigned
Reconciliation to Governmental Fund Statements (GAAP): Less: State Aid Payments Not Recognized on a GAAP Basis
Fund Balance per Governmental Funds (GAAP)
Original Budget Adjustments
{1,317,802) $ (I ,566,348)
22,324,397 (146,769) 503,802
(286,000) (22,324,397) 22,124,397
(200,000) (21 ,977 ,628)
17,802
(1 ,300,000) (1 ,566,348)
4,798,555
3,498,555 $ [ 1 ,566,348)
75
EXIIIDIT C~t
Variance Final Final Budget
Budget Actual to Actual
$ (2,884,150) $ 2,233,340 $ 5,117,490
22,177,628 21,156,066 (1,021,562) 503,802 480,174 (23,628)
(286,000) (286,000) (200,000) (822,533) (622,533)
(22,177,628) (21,156,066) 1,021,562
17,802 __ (628,359) (646,161)
(2,866,348) 1,604,981 4,471,329
4,798,555 4,798,555
$ 1,932,207 $ 6,403,536 $ 4,471,329
$ 900,001 1,107,633
437,748
2,055,002 691,530
36,537 1,175,085
6,403,536
{1,193,901)
$ 5,209,635

f ; -~. i' ••• 0 '
'·i ' ' •• 0 '
·~
I ' ~"'] ' ' ~ J5 :<:ll
... l~~ ' ' .g ll "' 0:: A"'
~I -
I
i ' i ' ~ ' " ~ ~

EXPE.'IDITURES CURRENT EXPENDITURES (Continued)
Special Educotioo Cognitive - !>.1oderate
Salarie< ofTeaohers Othor Salaries for Insttuction Purchosed Professiorull Educational Son. ices Other Purchosed Services Gcnc'l"Jl Supplies
Total Cognitive Moderate
Looming. ond/or Language Di,.hilitic'S Salaries ofT eachers Othe-r Purohased Services Gcneml Suppli"'
Total Looming ond/or Language Disabilities
Bchoviornl Disabili~os SalariesofT""ch= Other Salaries for Jnstruc~on Pnrohesed Professiomt! Educa~omtl Scrvicos Other Purchased Services General Supphes
Total Behavioral Disabilities
Multiple Disabilities Salarie> ofToochers Other Sa!;ries for lnstruction Purchased Profe•sional Eduootionnl Ser>ice• Other Purchased Sen-ices General Supplies D!he.-Objocts
Totlll Multiple Disabilitic•
Resource Room SolariesofToachers Other Solorie• for lnstroctioo Purchased Professionolffiducationol Son. ices Purchased Technical Sen ices Othor Purchased Sor;ice• G=~l Supplies
Toto! Rew= Room
Operating
'~ Fund 11-13
Ori~ln~I Bud~et
$
Budge! Blended ReS<>Ur'«
Fund 15
75.402 $
t.SOO 5_412
82,614
93,062
'" 1.000
94.412
93,062
850
93.912
485.427 118,004
300 1.650 7.037 1,000
HOBOKEN PUBLIC SCHOOLS GENERAL FUND
CO:\>IBI/i;L'lG BUDGETARY COMPARISON SCHEDULE FOR THE F1SCAL YEAR ENDED JUNE 30,2015
T<>bil General
Fund
75_402
1.800 5.412
82,614
93,062 350
],000
94,412
93,062
850
93.912
485.427 118,004
;w 1.650 7,037 !,000
Oporaliog Fund
Fundll-13
Adju>lmeol>l Bud~erTran.•fer
Budget Blended Res<>urce Fund 15
Tol:ol General
Fund
$ (74.602) $ (74.602)
(1.800) (1,800) (4,459) (4,459)
(80.861) (80,861)
6,026 6.026 (350) (350)
" " 5,743 5,743
(42.843) (42.843)
554) 554)
(43,397) (43,397)
(13,857) (13,857) (13,591) (13,591)
(300) (300) (1.500) (1,500) (1.591) (1.591) 0.000) __ jJ.,QQQ)
613.418 ~ (31,839) (31.339)
l.817,1B 1,817.133 24,790 24,790
2,400 2,400 (2.400) (2,400) 1500 1,500 (1,500) (1,500) 5.000 5,000 (4,428) (4,~28)
2.650 2.650 m 327
1.828,683 l,S28,683 16.789 16.789
n
EXHIBIT C-IA
Final Budoel Adual
Budget Ao""'l Oporali..g BIC11ded Tutal Operating Bknded T<>l:d
Fund Rcsou= Gcoe....:J Fund -·- Gcnel"lll ~ Food!~ Fond Fund 11-13 Fond 15 Fund
$ wo $ $00
953 953 "' '" ----1.753 ~ ---"-' "'
99,088 99,088 98,808 98,808
1.067 1.067 m ___ ;oo_
!00,155 ~ 99,598 ___ ,_,;n
50.219 50.219 49.223 49,2B
---"-' M '% ___ ,%_
50.515 50.515 49,519 ___ .,_.519
471.570 471.570 464,475 464,475 104.413 104,413 97,596 97.596
''" "" 5,446 5,4% 5.208 5,208
581,579 581.579 ~279 567.279
1.841,923 1.841.923 1,788,626 1,788,626
572 572 572 572 2.971 2.977 2.127 2.127
- 1,845.472 1.845,472 1.79!.325 L79L325
(Continued)

EXP£1\"DITURES CURRE!''IT EXPENDITURES (Continued)
Autism
Salarie< of Teachers OlhorS..Ioriosforlns!ruction Gen=l Supplies
To~aiAutism
P=chool Di>:lbilitics-Full Time S..loricsofToochors Olhor Solarics for Instruction Pu,.crnscd Profe<sional-EdtlC:ltiOilal S=ices
Other Purchased Sen ices General Supplies
To!!ll Preschool Di>llbilitios
Homcln>lruction
S..lnrie< ofTeochers Purchoscrl Prof=ionai!Educational Seni=
To!al Home Instruction
Total Special Educ:ltion
Bilingual Education SnlariesofTeacl!er.;
Other S.lnri« for ln>!ruction Purchascr!Prof .. sionaVF.du,.tionnl S=i«s Other Purch"crl Services General Supplie< OtherObjoots
Total Bilingual Education
Sohool Sponsored Co/E<tro-Curriculor Acti,itic':l
Solari« Otk"r Purchased Servie<s Supplies nnd Materials OthorObjoets
T ol.:ll School Sponsored Co/Exttu-Curricular Activiti<:>
School Sponsored Athletics So !aries Othcr Ptm:hascrl Sorvices Supplies and Materials OtherObjoots
To!!ll School Sponsored A!hktios
Sumrnor School • Jnstruction
Salori<:> ofTcachcrs O!he:rS.Iariosf<rrlnstruction Salaries ofTcach<rTutors Oenernl Supplie• Other Objects
To!!ll Summer School
Other Suppk-mc-ntdiAt-Risk Progroms-lnstruc!ion
Solari .. ofToocllor Tutoro
Total Other Supplcmen~ai/At-Risk Pro8fams-lnstruction
Total·ln.<truction
Ori!!inal Bud~ct
OperatiDg Fund
Fund 11-13
22,000
22,000
0,~ 75.000
81.000
Budget Blended Rc•on<= Fund 15
475~160
14.575
1.000 30,050
520.985
----''~""'"""'0 ~.024
41.637 17.124 55.590 22.769
137.120
52.565 4!,375
7.500
101,440
362.327
'"" 12.331 45.326
420,964
407.020 106.220 105.21 I 160.064
778.515
__ _cu~'~''~'"5 __ I4.887.19tl
HOBOKEN PUBLIC SCHOOLS GENERAL FGND
COMBL~L~G BUDGETARY COMPARISON SCHEDULE FOR THE FISCAL YEAR F.l"'DEDJUNE 30,2015
To<al Gc...,,.,]
~·
475.360 14.575 22,000
1.000 30.050
542.985
6.000 75.000
___ ._l.O.QQ.
3.337.024
403.964 18.104 67.921 61!.095
558.084
407,020
106.220 105,211 160,064
ns.s1s
52.565 41.375
7.500
101.440
16,123.425
Adjn•tmcnfsl Bud.,ctTrnnsfec
Opcrollng Fond
Fund ll-13
Budget Bkndtd R..,.u,..e
Fund 15
To<a1 General
Fund
292 s 292
m 292
(46.713) (46.713) 988 988
(1.840) (1,840) (1.000) (1.000)
~) (26.581) -----___ _J1L~oo~Ol 03.3061 (75.1461
6343 6.343
---~"~"'~'061 (52.736)
---~"~,,~,~3) (~6.393)
(48.233) (206.579) (254.812)
11.820 (8,616) 3,204 8.942 1,1n w.li9
(28.3!3) (8,943) (37.256) -----''''~oo, (8&6) 4.814
----"'''"~'~1 (]7.268) (19.!19)
'" 21.573 10.950 9,926
029,030)
22.321 10.950 9.926
(129,030)
----~"'8 (86.581) (85.833)
"" (4,242)
(1.041)
"' (4.242)
(1.041)
----"'''~&>~3) (4.863)
896.044 102.963 999,007
"
Opcrnting Fund
Fond ll·J3
20,160
20.160
12.343 22.264
34.607
54.767
53.457 26.066 27.277 28.469
135.269
"'
m
52.985 37.133
6,459
96.577
2.132.279
Fir»! Budget
Budget Blended Rcsoufte Fund I~
Total General
Fund
292 $ 292
---C'"'"' ---''-'
428,647 15.563
3.469
447.679
428.647 15.563 20.160
3.469
467.839
12.343 22.264
34.607
Operating ,_, Fund 11-13
Aellt>l
Aeluol Blended
Re!IOU""' Fnnd IS
EXHIBIT C-IA
Total Gcnchll
brul.
292 s 292
---- 292~
19)40
428.123 14.640
1.388
428.123 14.640 19.740
3.388
~ 446,151 465,891
11,664 11,664 ~ 11.247
-~ 22,911
3.027.445 3.082.212 ~~ 2.954.563 2.997.214
353,711 2,157 3,388
44.440
403.6%
428.593 117.170 115.137 31.034
691.934
14.990.153
407,168 28.223 30,665 72.909
538.965
429,341
117.170 115.137 31,034
692.682
52.985 37.133
6.459
%.577
17.122.432
52,967 26.020
25.978 27.957
132.922
''"
"" 49.599 30,731
2,133
82,463
1,625.588
169,29tl
'" 2,058 43.306
215.643
403,339 59.327
109.504 12.471
584,641
13.993,485
222.257 27,009 28,036 71.26::.
348.565
404,087 59,327
109.504 12,471
585,389
49.599
30.731
2,133
82.463
15.619.073
(Con!in:>e-d)
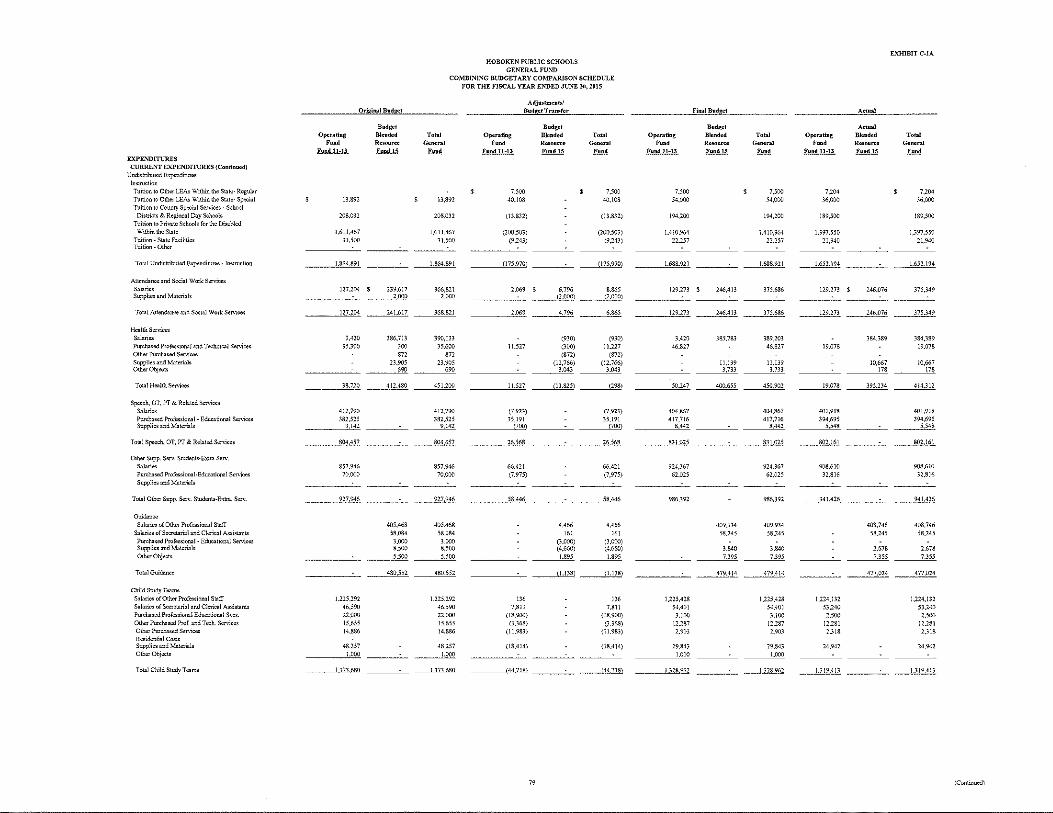
EXPF..'IDITURES CURRENT EXPENDITURES (Continued) Undis~butod E:q><:nditures
Instruction Tuition to O!herLEAs Within !he Stole· Regular Tuition to Other LEAs Within !he Sto.te· Spec~al Tuition to County Sp«ial Scr.ices • School
Dis!!icts & Regional Doy Schools Tuition to Private Schools for the o;,.hkd
Wi!hm!hcS\IItc
Tuition S\llteFocilities Tuition Oilier
Total Undis~buted E>.penditurcs • lns!ruction
Attendance and Social Work Servioos Salaries Suppl!es and Motcriols
Tot~~l Attendanee ond Sooiol Work Set<. ice•
HealthSenices Salanes Purchased Professional and Techmoal Senices Other Purchased Sorvioos Supplies and Materials Other Objects
Tola!HOIII\hSorvices
Spec"Ch, OT, PT & Related Sorvices S.laries Purcll.,ed Professional-Educational Senoees Supplies ond Materials
Total Spoech. OT. PT & Reloted&"r\ioes
Other Supp. Sen·- Studcnts-E.wa S=·S.Jaries Purcllased Professional-Educational Seniees Supplies and Materials
Total Other Supp. Sen·- Studenta·Extn. Sen·.
Guidancc Salaries of Other Professional Stoff
Solari•• ofSecre~ariolond Clericcl Assislllnts Purchased Professional· Educationol Set<. ices Supplie-s ond Materials OthorObjccts
Tola] Guidance
Clrild Study Teams
Salaries of Other Profes•ionol Stoff Salanes of Socre\llriol ond Clenoal AssisUtnts Purchased Profe,.ional Educ:ttiolllll S\'CS.
Othor Purch"ed Pro[ and Tech. S=iocs Other Purchased Senie<• Residential Costs Supplies and Ma!erials 0\horObjc-c\s
Tollll Child StudyTeoms
HOBOKEN PUBLIC SCHOOLS GENERAL FUND
COMBINING BUDGETARY COMPARISON SCHEDULE FOR THE FISCAL YEAR ENDED JUNE 311,2015
Ori~inal Bud~ot
OP<ta~ng
'""' Fund 11-13
13,892
208,032
1.611.467 31,500
1,864,891
127.204 s
127.204
3,420 35,300
38.720
412,790 382,525
9.142
804,457
857,946 70,000
Budget Blended Resour« Fuud I~
239.617 2.000
241.617
386.713 ;oo m
23,905 MO
412,480
Total c.:: ... ,.,.]
"""
13,892
208.032
1,611,467 31.500
1,864,891
366,821 2.000
368.821
3%,133 35.600
m 23,905
·~ 451.200
412.700 382,525
9.142
804.457
857,946 70,000
___ ,_27,~ 927,9~6
1.225.292 46,590 22,000 15.655 14,886
48.257 1.000
1.373,680
405.468 58,084
3.000 8.500 5.500
480.552
405,468 58,084
3.000 8,500 5,500
480.552
1.225.292 46.500 22.000 !5,655 14,8&6
48.257 1,000
______ c_ ~
Adjustment./ Bu·l~ot Tr-~n•f•r
0P<Nting Fund
Fund 11-ll
7,500 40.108
(13.832)
(200.503) (9,243)
Budget Blended Rcsour-re Fund 15
--~'~"~'-~"~"' ---~
Tofal G.::neral
Fund
7.500 40.108
(13.832)
(200,503) (9,243)
!175,970)
2,069 6,796 8.&65
2.069
11.527
--"'"'·"~""0) (2.000)
4.796
(930)
(300) (872)
(12,766) 3.043
6,&65
(930) 11.227
(872) (12.766)
3.043
---~·~·~;'"7 (11.825) 298)
(7.923) (7.923) 35,191 35,191
----"'~00~ (700)
26.568
66,421 (7,975)
58.446
'" 7,811 (18.900)
(3.368) (11.983)
(18.414)
4.466
'"' (3,000) (4,660) 1.895
(1.!38)
-------'"''''"'ID"' ------~
"
26.563
66,421 (7,975)
58,446
4,466
"' (3,000) (4,660)
1.895
(1.138)
136 7,811
(18,900) (3,368)
(11.983)
(18,414)
144.718)
Operating Fuud
Fund 11-13
7,500 54,000
194,200
1.410,964
22.257
Final Bud~ot
Budget Blended Re!IOUr<:e Fund 15
ToW General
Fund
7,500 54,000
194.200
1.410,964 22,2;7
OP<rating Fund
Fund 11-13
7,204 36,000
189,500
1.397.550 21,940
--~-~-- --
---"'·~""~'-~""1 ~ ~
129.273 s 2441,413 375.686 129.273 $
--~-~-- --]29.273 246.413~ ~
3.420 46.827
385.783 389,203 46.827
I 1,139 1],139
----~ ----''·~"~3 _______l,Zll.
50.247
404.&67 417,716
8.442
83),025
92-1,367 62,025
400.655 ~
404.867 417,716
8.442
831.025
924,367 62,025
19.078
19.078
401.918 394,695
5,548
802.161
908,610 32,816
--~-~-- --9&6392 986.392
409.934 409,934 58.245 58.245
3.840 3,840
----~ ----"'·'"~5 ___Lill_
1,225,428 54,401 3.100
12,287 2.903
-~~~.414
1.225.428 54,401
3,100 12,287 2,903
29,843 29.843
-------"'~ooo, ~
l.:m.%.2 ~
941.426
1.224,132 53,240
2,500 12,281 2.318
24,942
~!2.
A->
A-> BleDded Resoun:e Fund 15
2441,076
246.076
384,389
10,667
"' 395,234
408,746 58,245
2.678 /,355
477.024
EXlflBIT C-IA
Total General
Fund
7,204 36,000
189,500
1,397550 21,940
1.652.194
375,349
375.349
384,389 19.078
10,667
"' 414.312
4{)1.918 394,695
5.548
-- 802,161
!108.610 32.816
941.426
408)46 58,245
2.678 7.355
477.024
1,224.132 53.240 2.500
12.281 2,318
24,942
1319.413
(Continued)

EXPE."'DITURES CURRENT EXPE."'DITURES (Con~nucd) Undistributed E~T'-·mlitures (Continue-d) hnprov.:ment oflnstroctionol.'>c.,...ioe< S•laries of Supet"""or' oflnstroction Salaries of Other Prof,..jooal Staff Salanos of Secretarial and Clorie:tl ksisl OtherSolaries Salaries offactlitators. Moth & Lit<rncy Coaches
Other Purchoscd S""'i""" Pur<h"cd Prof,..ional Edue:ttional S'""' Other Purch Prof & Tech Sen ice< Supplies and Motcnols Other Objects
Totallrnprovemenl of Instructional Services
Educational Media SmiccsiSchool Librnry Salaries
PurchasodProf<ssionol and Tcelmiool Sorvi<>.'S Other Purohased s.,.,iccs Suppli"' and Materials Other Objects
Total Edtt03tional Media Sen'cos/Scbool Librn'}'
Instructional St:t!TTrnining Scr\iccs Salaries ofS=tarial and Cb:iC<tl A;,ist Purchasod Professional Edueationol Svcs. Other P=h,ed Pro[ ondToclt. Sen ices Other Purchosed Sen ice< Supplies & Motcrials
Totnllnstntctionol St:tffTnining Smo<:<s
Support Serv:iocs Geneml Administrntion Sobrios Legal Sorvi= Audit Fee. Other Pur<ltascd Professioml Sen ices Purcho.cd Technical s....,...ices Cornmunioetionsrfdephone BOE Other Purcltascd Smices Mise Pun:hascd Servioes Genernl Supplies BOE In-House Trnining/M..,ting Supplies Judgments Agamst the Scbool District Misce11aneous E.•;pendit=s BDE Mombcrship Duos and Fe<.">
Total Suppon Sorvi= General Administrntion
Support Sonioes School Administration Salaries ofPrincipaWAsst. Principols Salaries of Other Professional Stnff Salaries of Secretarial and Clerical Assi.!;tants Purchased ProfO<siona] and T<ehnical S\'CS Other Pur<hased Sonic"' Supplies and Materials Other Objects
Total Support Sen ices S.Chool Administration
HOBOKEN PUBLIC SCHOOLS GENERAL FUND
COMBll'iiNG BUDGETARY COMPARISON SCHEDULE FOR THE FISCAL YEAR ENDED JUNE J.O, 2015
Or!!!inol Buried
Operating Fund
Fund 11-U
330.535 s 116.252 132.162 74.808 95.307
Budget Blended --· Fund 1~
108.278 $
71.161
13.664
Tobll Gene"']
Fund
438,813 116.252 203.523
74,808 95.307
13.664
---~"~n~M, 193.103 942367
322.276 263.340 150 ;;
70,437
585,616
"" ;o 70,437
---~"~'"~''6 333.977 656.253
17.000 ;oo
90.000 5S.S73
17.000 500
148.873
---~·~··~"'"' 76.173 166.373
293.541 210.000 53.804 15.500
173.322
4.853 76.418
3.925 2.040
6.670 27.100
293541 210,000
53,804 15,500
173.322 4.853
76.418 3.925 2,040
6,670 27.100
---~""~'·~""3 867.173
944.423 944.423
341.475 341.475
1.300 1.300 86.097 86,097
---'"·'"'il 4.%1
1.378.256 ~.256
Adju•tmentsl Bud!!<l T,.,nriec
Operating Fuud
Fund 11-13
%.972 12,239
(32.301) (40.410)
5.!19
Budget Blended R<l;OtlrcO
""'-"
3.482 s
16.004
(10.014)
Tol:ll Genora1
""' 100.454
12.239 (16.297) (40.410)
5.119
(10.014)
41.619 ___ ,,.o,o,z 51.091
(84.802)
'"' (84,619)
6.178
(1!9.250)
(83.072)
(8.106) 142.692
61!.903 18,940
35,221 (2.879)
154.324 15.162 (2,040)
(108.821) (150)
(50) (22.429)
(131.450)
(15.670) (500)
rlK830)
(55.000)
1.048
-~--~-
22,500 750
3D.610
(19.161)
(1.086) 244
3.622
(193.623) (150)
(50) r22246)
(216.069)
6.178 (15.670)
(500) (128.080)
(138.072)
(8.106) 142,692 68.903 18.940
35.221 (2.879)
154,324 15.162 (2.040)
1.048 (835)
53.110 750
(19.161)
(1.086)
'« 3.622
---~'~3.Ze>"o ~ 37.479
w
fi,.] Budf!.cl
Ope,.,dng
'"" Fohd 11-13
427.507 $ 128.491 100,061 34.398
!00.426
Budgot Blen<kd Resoo""' Fund 15
111.760 $
87.165
3.650
Total General
Fond
539.267 128.491 187.226 34,398
100.426
3,650
Ope"'ling
'~' Fund 11-13
427.507 128,491 100.061 34,398 94.621
Actual
Actual Blended R=o= l.!!!!.!ill
EXHIBIT C-IA
Toto] G""""'l
Fund
111,760 $ 539.267 128.491 187.226 34.398 94.621
87.165
3,650 3.650
---- -------~""~·~"''3 202.575 ~
237.474 154,519 391,993
183 48,00ll 48.191
---"''"37 .• 657 202.527 ~
6.178 1.330
,, 20.043
6.178 1.330
20.793
___ _.,o.~n,s 21.373 28.301
285.435 352.692 122.707
34.440
208.543 1.974
230.742 19.087
285,435 352,692 122.707 34.440
208.543 1.974
230.742 19.087
7.718 7.718 ----'•'~·'~65 26.265
-- 1.289.603 1,289.603
22.500 ,,
23,250
975,033
322.314
214 86.341
8,583
1.392.485
997.533 ,, 322.314
'" 86.341 8.583
1,4!5,735
785,078 ~ 987.653
237.474 151.628 389.102
43.040 43.040
237,474 ~ 432.142
6.177 1.060
750 18.151
6.177 1.060
18.9tll
----~
-- . 6.927 _______l2dll 26.138
279.137 153,976 95.692 34.4.W
76.893 1,974
220.863 17,981
7,556 26.134
279,137 153,976 95,692 34.440
76.893 1.974
220.863 17.981
7.556 26,134
914.646 914.646
21.250 750
963,499
322.082
76.071 8.540
--""~.o~oo, __ 1.370.192
984.749
'" 322.082
76,071 8,540
1.392.192
(Continuod)

EXPENDITURES CURRENT EXPEI'<"DITURES (C.,.,tinuod) Undi,tributed E~1X'llditures (Continued)
Support Sc>nices Central Senices Solaries Purch:isod Professional Scrvioes Purt:hasodTcchnical S<miccs !>.1isc_ Purch Services
Sale/Lease--back Paymon!s Supptiesand Materials lnt=t on Lease Purchase Agrocmon<s
Misc. Espendttures
Toto! Support S=ices Ccntrul Senioes
Admin. Info. Tech Snlarics Puroh"ed Professional Ser,,ces Putoh"ed Technical Sen ices Other Purchased Ser.-icos Supplies and Materiols
Totnl Admin. Info Tech
Required Maintenance For School FaoilitiC> SntnriO> Clcorting. Repair, and Maintenance Ser.ioes Ckn=l Supplies
Total Required Maintenance For School Facilities
Custodtal s"""""' Snlnries S..laric'S ofNoo"lnstructiono1 Aides deoning, Repair. nnd Maintenonoe Service'S Other Purcha.c-d Propotty S"""""' Insurance Mi,;oellaneous Purchusod Smices 0011oral Supplies Energy (Electricity) Encrsy(Nuttrral Gao)
Totlll CUstodial Sor;ico:s
Care & Upkeep of Grounds Salaries
Cleaning. Repair, and Maintcn:mco Scr.-icC> G""""'l Supplies
Toto! Care & Upkeep of Grounds
Security
Solari"" dconing. Ropair & Maintonance Ser.ioos Gonoral Supplies
Toto.) Socun!}'
HOBOKEN PUBLIC SCHOOLS GENERAL FUND
COMBL"lNG BUDGETARY COMPARISON SCHEDULE FOR THE FISCAL YEAR ENDED JUNE 30,2015
Ori~!""l Bud~er
OJI"rntiug Fund
Fund 11-13
454.480 102.700 82.%3 40.525
35,520 9,998 8.383
734,569
34.760 9,610 4.900
75.769 28.867
153.906
S63.291 393,926 95,505
Budget Ble11.ded
Resource Fund 15
-----"'~"s'·'~''' --------
1.051.258
426.484 118,740 189.304 93,487
249,S47 730.957 599.720
3.459,797
105,8%
10,648
10.648
Total C..neral
Fund
454.480 102.700 82.%3 40.525
35.520 9,998 8.383
734569
34.76-0 9.610 4,900
75.769 28.867
153.906
S63.29l 393,926 95.505
1.3;2,722
1.051.258 10,648
426.4S4 118.740 189.304 93,487
249,847 730,957 599.720
3.470.445
105.896
___ 105.896 105.8%
284.168 284.168
----""'·"''"' ----~ 284.168 14.165 298.333
Adju•ttneuW
Bud~etTransfer
OJI"n&tiug Fund
Fund 11-13
3.752 64.477
(17.217) (14.400)
8.770
45.382
(4.900) 59.717
{15.015) 24.792
64.514
5.467 230,447 (32.674)
___ 203.240
407,757
(105.956) 14.020 14.817 56.004 (7.005)
12.870
Budget Bleuded -.. Fund 15
'"
(103.261) ---~
289,2-!6
(1,777)
2.470 (,,631
7.324
18,939
'"
T<>ll>l C..nontl
Fund
3.752 64.477
(17.217) (14,400)
8.770
45382
(4,900)
59.717 (15.095) 24.792
64,514
5.467 230,447 (32.674)
203.240
407,757
'" (!05,956) 14.020
14,8!7
56,004 (7,005)
12.870 (103.261)
289,702
(1,777)
2,470 6.631
7.324
18.939
----''"~~, (7,75£,) (1.26£,)
---~'""~'"~ (7.756) 17,673
"'
Operating ,_, Fund 11-13
FilllllBudJ1.el
Budget
Blended
Rosour=
~
Tuml Gonernl
Fund
Ope..,.ting Fuud
F1111d 11-13
458.232 167,177 65.7# 26,125
458.232 $ 458,232 167.177 139.135 65.746 43,715 26.125 3.890
44.290 44.290 42.147 9.998 9,998 9,998
-----''·~"~3 ~ -~
---~"~'·~"eel ~ ~
34.760 4,710
64,617 &0.674 53.659
34.760
4.710 64,617
60.674 53.659
---~"~'"~'£0 ~
868,758 624,373
62.831
1.555.962
1.459.015
863.758 624,373 62,831
1.555.%2
1.459.015 11,104 IU04
320,528 320528 ll2,7&0 132.760 204,121 204.121 149,491 149.491 242,842 242.842 743,827 743,S27
------~··~·-~~"9 ~ ---"'·~"~'·~"ce> Juw 3.760.147
104,119
2.470 6.631
113,220
303,1D7
6_49{)
104.119
2,470 6,631
~
303.107
-----''"'""9 ~
34.593 1.397
19.947 57.514 ~
~
868,758
550,754 54,878
1.474.390
!.348,770
194,544 l06.1S4 204,121
100.832 225,24Q 507,582 277.958
2,965.231
101.077
2.470 3,659
107.206
2%.407
3,728
Aetu»l
A~twol
Blended
Resource Fund 15
6,810
6.810
6.403
EXlflBITC-IA
Toto! General
Fund
458.232 IW,l35 43.715
3,890
42.147 9,998 4.094
701,211
34.593 1.397
19.947 57.514 51.9{)7
165.358
868,758
550,754 54,878
1.474.390
1.348.770 6,810
194.544 106.184 204.121 100.832 215.240 507.582 277.958
2,972,041
101.077
2.470 3.659
107.206
296.407
10,131
309.5n _____ ,,,.,o,9 ~ 300,135 6.403 ~
(C<'nlinued)

~- ~ q.l.~l
n I I
~~~~il ~ I
, ~ ~ ~
1

··~" " , .. 0 •
I I
H I
~ ~I ~
I I I
I I
·1 I PI ~ II gl ~
Ill ~1 ~~~
I '~· I I
I ~I
I
H ~I
n ~I
00~.· ·~ ::; ~ 5 '

REVENUES State Sources Federal Sources Other Sources
Total Revenues
EXPENDlTURES Instruction
Salaries ofTeachcrs Other Salaries for Instruction Other Salaries
Salaries for Pupul Transportation (Between Home and School)- Non-Public
Purchased Prof. and Tech. Svcs. Purchased Professional-Educational Smvices Tuition Other Purchased Services General Supplies Textbooks Trsvel Other Objects
Total Instruction
Support Services Salaries Salaries ofPrincipa1s/Assistant PrincipalsfProgram
Directors Salaries of Other Professional Staff Salaries of Secretarial and Clerical Asst Salaries of Community Parent Involvement Specialists Salaries of Master Teachers Other Salaries Personnel Services -Employee Benefits Purchased Prof./Educ. Svcs. Purchased Educational Services-Contracted Pre-K Purchased Professional and Technical Services Purchased Educational Services- Head Start
Other Purchased Professional-Education Services Other Purchased Professional Services Cleaning, Repair and Maintenance Services Contracted Services (Other than Between Home & School) Travel Other Purchased Services Miscellaneous Purchased Services Supplies and Materials Other Objects Miscelleneous Expenditures
Total Student and Instruction Related Services
Capital Outlay Instructional Equipment Non-instructional Equipment
Total Capital Outlay
Total Expenditures
Excess (Deficiency) ofRevenucs Over (Under) Expenditures
Other Financing Sources (Uses) Transfer In- General Fund Transfer Out - Contribution to School Based Budgets (SBB)
Total Other Financing Sources (Uses)
Excess (Deficiency) of Revenues and Other Financing Sources Over/(Under)
Expenditures and Other Financing (Uses)
Fund Balances, Beginning of Year
Fund Balances, End of Year
HOBOKEN PUBLIC SCHOOLS SPECIAL REVENUE FUND
BUDGETARY COMPARISON SCHEDULE FOR THE FISCAL YEAR ENDED JUNE 30, 2015
Original Budget Adjustments
11,178,639 269,634 1,438,055 1,068,720
691 123
12,616,694 2,029,477
651,313 83,023 255,000 15,781
40
689 346,868 150 250
602,536 (12,214)
158,670 266,248 45,644 14,055
5,583 15,920
-~.§1 729 971
378,920 53,370
92,607 (2,490) 489,616 (!08,192) !28,457 (1,832) 59,719
239,586 (18,319) 372,054 (8,793) 817,374 (204,686) 279,239 39,555
6,721,000 129,096 170,081
862,470 48,300 33,400 (9,711)
2,300 2,000 246,829 5,000 17,694 5,000
92,749 65,226 30,762
103,460 30,023 21,879 285,770
10,679,307 -- .. ---·---~Q,~Q§.
5,039 504,261
.~09,300
12,398,892 2,029,477
____ , __ ,_2).?)19.2_
286,000 ___ _(}.~~ (217,802)
$
84
EXUUHTC-2
Final Variance Final Budget Actn:d Budget to Actual
$ 11,448,273 10,783,028 ' (665,245) 2,506,775 1,835,779 (670,996)
___ 6_91).n_ 684 145 (6,978)
__ 1_4646,171 __ 13_,}02,952 (1,343,219)
734,336 685,877 48,459 270,781 124,700 146,081
40 40
347,557 21 !,642 135,915 400 400
590,322 589,978 344
424,918 261,149 163,769 59,699 57,819 1,880
21 503 ____ 2,,~Ji 18,988
2,449,556 1,934,120 ilM~
432,290 394,071 38,219
90,117 90,117 381,424 381,424 126,625 122,894 3,731 59,719 58,293 1,426
221,267 213,702 7,565 363,261 347,816 15,445 612,688 600,168 12,520 318,794 296,011 22,783
6,850,096 6,539,014 311,082 170,081 !30,907 39,174 910,770 910,770
23,689 6,456 17,233 2,300 2,300
248,829 47,223 201,606 22,694 15,!54 7,540
5,000 825 4,175 92,749 26,348 66,401 95,988 95,988
133,483 96,740 36,743 307,649 291,439 16,210
11,469,513 10,665,360 804,153
5,039 5,039
---·- 504,261 . 504,259
509,300_ 509,298
~;<8369 __ 1.~,!08 778 1,3 19,59!
217,802 194,174 ___ ____ill.,ill)
286,000 286,000 (503,802) (480,174) 23,628
_______Q.17,802) .(194,174) 23,628_

NOTES TO THE REQUIRED SUPPLEMENTARY INFORMATION PART II

HOBOKEN PUBLIC SCHOOLS REQUIRED SUPPLEMENTARY INFORMATION
BUDGETARY COMPARISON SCHEDULE NOTES TO THE REQUffiED SUPPLEMENTARY INFORMATION
FOR THE FISCAL YEAR ENDED JUNE 30, 2015
Formal budgetary integration into the accounting system is employed as a management control device during the year. For governmental funds there arc no substantial differences between the budgetary basis of accounting and accounting principles generally accepted in the United States of America, with the exception of the legally mandated revenue recognition of certain state aid payments for budgetary purposes only and the treatment of encumbrances in the special revenue fund as described below. Encumbrance accounting is also employed as an extension of formal budgetary integration of the governmental fund types. Unencumbered appropriations lapse at fiscal year end.
The accounting records of the Special Revenue Fund are maintained on the grant accounting budgetary basis. The grant accounting budgetary basis differs from GAAP in that the grant accounting budgetary basis recognizes encumbrances as expenditures and also recognizes the related revenues, whereas the GAAP basis docs not. Sufficient supplemental records arc maintained to allow for the presentation of GAAP basis financial reports.
The following presents a reconciliation of the General and Special Revenue Funds from the budgetmy basis of accounting as presented in the Budgetary Comparison Schedule- General Fund and Special Revenue Fund to the GAAP basis of accounting as presented in the Statement of Revenues, Expenditures and Changes in Fund Balance- Governmental Funds.
Sources/Inflows of Resources Actual amounts (budgetary basis) "revenue"
General Fund
EXHIBITC-3
Special Revenue
Fund
from the budgetary comparison schedule (Exhibits C-1, C-2) Difference- Budget to GAAP:
$ 54,765,914 $ 13,302,952
Grant accounting budgetary basis differs from GAAP in that encumbrances are recognized as expenditures, and the related revenue is recognized.
Encumbrances, June 30,2015 Encumbrances, June 30, 2014 (Net of Cancellations)
State Aid payments recognized for GAAP purposes not recognized for Budgetary statements (June 30, 2014)
State Aid payments recognized for Budgetary purposes not recognized for GAAP statements (June 30, 2015)
Total revenues as reported on the Statement of Revenues, Expenditures and Changes in Fund Balances- Governmental Funds (Exhibit B-2)
Uses/Outflows of Resources Actual amounts (budgetary basis) "total expenditures" from the
budgetary comparison schedule (Exhibits C-1, C-2)
Differences- Budget to GAAP Encumbrances for supplies and equipment ordered but
not received are reported in the year the order is placed for budgetary purposes, but in the year the supplies arc received for financial reporting purposes.
Encumbrances, June 30,2015
Encumbrances, June 30, 2014 (Net of Cancellations)
Total expenditures as reported on the Statement of Revenues, Expenditures, and Changes in Fund Balances- Governmental Funds (Exhibit B-2)
85
1,289,169
(1,193,901)
(284,039) 211,337
$ 54,86 J, 182 $ 13,230,250
$ 52,532,574 $ 13,108,778
(284,039)
211,337
$ 52,532,574 $ 13,036,076

REQUIRED SUPPLEMENTARY INFORMATION PART III
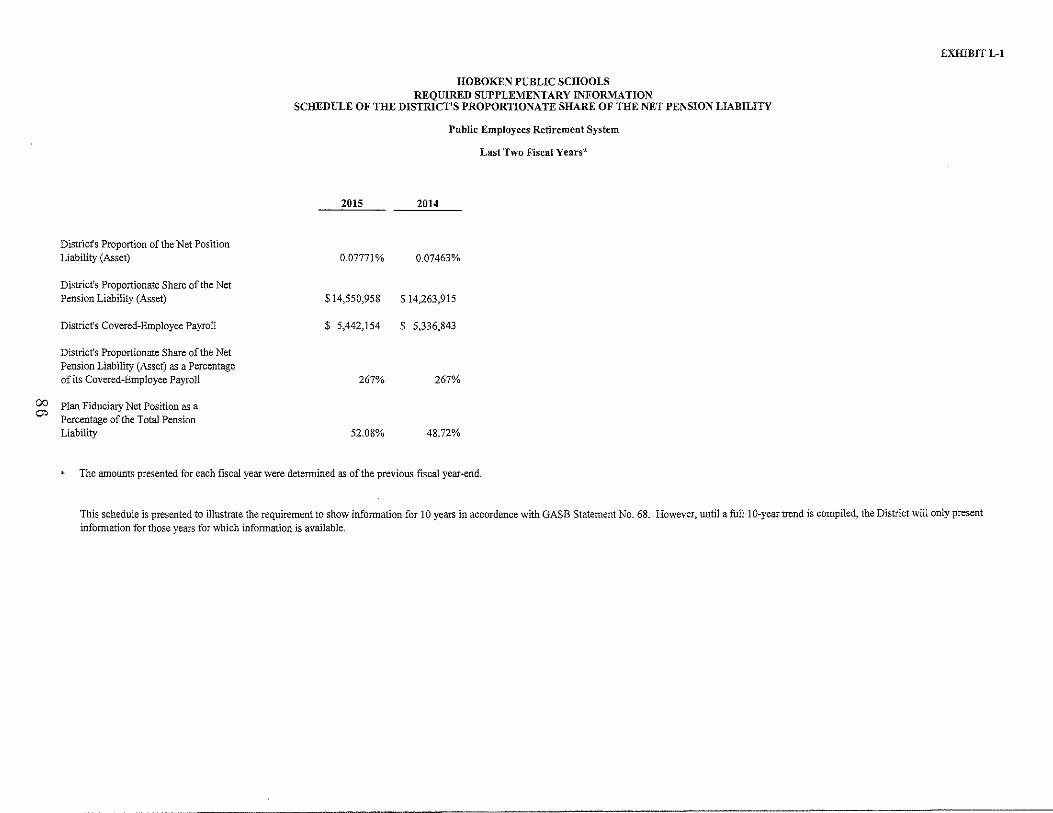
00 0>
District's Proportion of the Net Position Liability (Asset)
District's Proportionate Share of the Net Pension Liability (Asset)
District's Covered-Employee Payroll
District's Proportionate Share of the Net Pension Liability (Asset) as a Percentage of its Covered-Employee Payroll
Plan Fiduciary Net Position as a Percentage of the Total Pension Liability
HOBOKEN PUBLIC SCHOOLS REQUIRED SUPPLEMENTARY INFORMATION
SCHEDULE OF THE DISTRICT'S PROPORTIONATE SHARE OF THE NET PENSION LIABILITY
Public Employees Retirement System
Last Two Fiscal Years*
2015 2014
0.07771% 0.07463%
$14,550,958 $14,263,915
$ 5,442,154 $ 5,336,843
267% 267%
52.08% 48.72%
* The amounts presented for each fiscal year were determined as of the previous fiscal year-end.
EXHIBITL-1
This schedule is presented to illustrate the requirement to show information for 10 years in accordance with GASB Statement No. 68. However, until a full 1 0-year trend is compiled, the District will only present information for those years for which information is available.

00 -..:]
Contractually Required Contribution
Contributions in Relation to the Contractually Required Contribution
Contribution Deficiency (Excess)
District's Covered-Employee Payroll
Contributions as a Percentage of Covered-Employee Payroll
HOBOKEN PUBLIC SCHOOLS REQUIRED SUPPLEMENTARY INFORMATION
SCHEDULE OF DISTRICT CONTRIBUTIONS
Public Employees Retirement System
Last Two Fiscal Years
2015 2014
$ 640,697 $ 562,347
640,697 562,347
$ $
EXH!BITL-2
This schedule is presented to illustrate the requirement to show infonnation for 10 years in accordance \Vith GASB Statement No. 68. However, until a :fulll 0-year trend is compiled, the District will only present information for those years for which information is available.
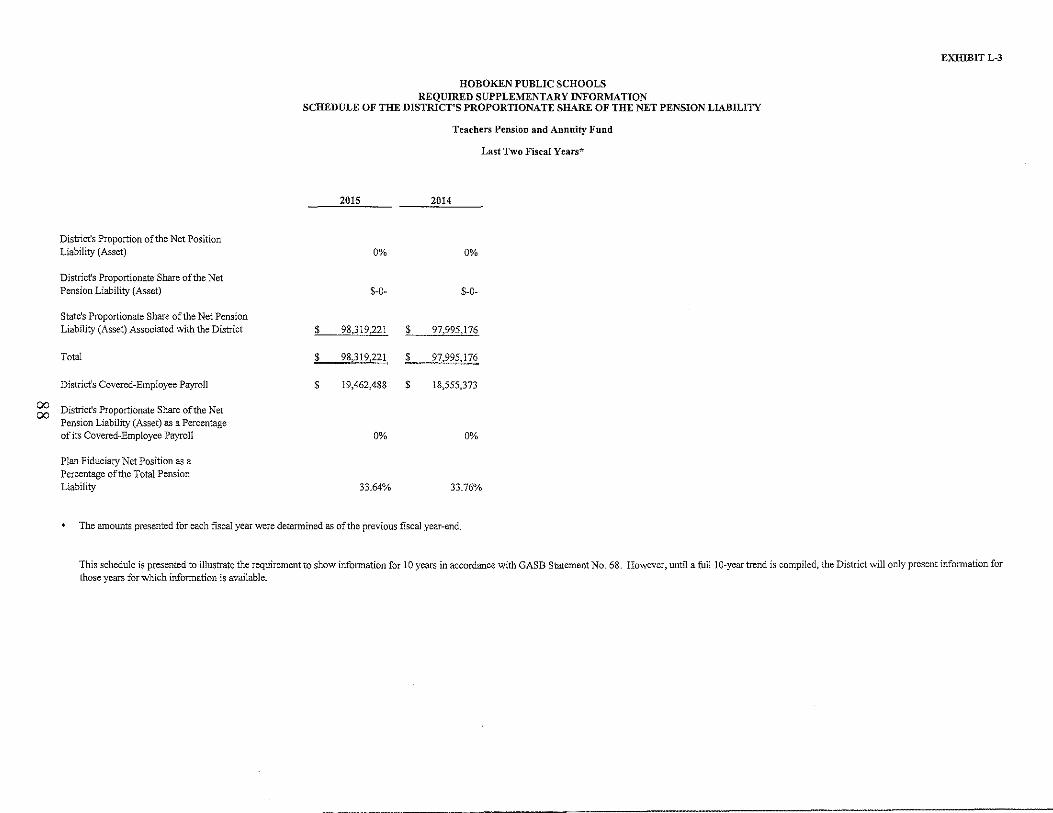
District's Proportion of the Net Position Liability (Asset)
District's Proportionate Share of the Net Pension Liability (Asset)
State's Proportionate Share of the Net Pension Liability (Asset) Associated with the District
Total
District's Covered-Employee Payroll
g; District's Proportionate Share of the Net Pension Liability (Asset) as a Percentage of its Covered-Employee Payroll
Plan Fiduciary Net Position as a Percentage of the Total Pension Liability
HOBOKEN PUBLIC SCHOOLS REQUffiED SUPPLEMENTARY INFORMATION
SCHEDULE OF THE DISTRICT'S PROPORTIONATE SHARE OF THE NET PENSION LIABILITY
Teachers Pension and Annuity Fund
Last Two Fiscal Years*
20I5 2014
0% 0%
$-0- $-0-
$ 98,319,221 $ 97,995,176
$ 98,319,221 $ 97,995,176
$ 19,462,488 $ 18,555,373
0% 0%
33.64% 33.76'%
The amounts presented for each fiscal year were determined as of the previous fiscal year-end.
EXHIBIT L-3
This schedule is presented to illustrate the requirement to show information for 10 years in accordance with GASB Statement No. 68. However, until a full 1 0-year trend is compiled, the District will only present information for those years for which information is available.

HOBOKEN PUBLIC SCHOOLS REQUIRED SUPPLEMENTARY INFORMATION
SCHEDULE OF DISTRICT'S PROPORTIONATE SHARE OF NET PENSION LIABILITY AND SCHEDULE OF DISTRICT CONTRIBUTIONS
NOTES TO REQUIRED SUPPLEMENTARY INFORMATION
Change of Benefit Terms:
Change of Assumptions:
FOR THE FISCAL YEAR ENDED JUNE 30, 2015
None.
The discount rate changed from the District's rate as of June 30, 2014 to the District's rate as of June 30, 2015, in accordance with GASB Statement No. 67.
89

SCHOOL LEVEL SCHEDULES

ASSETS
HOBOKEN PUBLIC SCHOOLS GENERAL FUND
COMBINING BALANCE SHEET AS OF JUNE 30, 2015
Operating Fund
Fund Il-13
Cash and Cash Equivalents Receivables, Net
Intergovernmental
$ 5,447,300 $
State Federal
Other Accounts Receivable Due from Other Funds Prepaid Items
Total Assets
LIABILITIES Accounts Payable Due to Other Funds Other Current Liabilities
Total Liabilities
FUND BALANCES Restricted
Capital Reserve Maintenance Reserve Excess Surplus
Assigned Year End Encumbrances Designated for Subsequent Years' Expenditures ARRA/SEMI- Designated for Subsequent Year's Expenditures
Unassigned
Total Fund Balances
Total Liabilities and Fund Balances
90
121,720
4,970 8,326
111,718
$ 5,694,034 $
$ 199,868 $ 48,640
235,891
484,399
900,001 1,107,633
437,748
2,055,002 691,530
36,537 (18,816)
5 209,635
$ 5 694,034 $
Blended Resource Fund 15
EXHIBIT D-1
Total General
Fund
40,309 $ 5,487,609
121,720
2,467 7,437 8,326
111,718
42,776 $ 5,736,810
42,776 $ 242,644 48,640
235,891
42,776 527,175
900,001 1,107,633
437,748
2,055,002 691,530
36,537 (18,816)
5,209,635
42,776 $ 5,736,810

HOBOKEN PUBLIC SCHOOLS BLENDED RESOURCE FUND IS
SCHEDULE OF EXPENDITURES ALLOCATED BY RESOURCE TYPE-ACTUAL FOR THE FISCAL YEAR ENDED JUNE 30, 2015
Districtwidc
Resour·ccs
General Fund Contribution to School Based Budgets General Fund Bncumbrances -June 30, 20 I 4
Combined General Fund Contribution and State Resources
Restricted Federal Resources
Title I, Part A Tille II Part A
Restricted Federal Resources Total
Totals
$
$
91
Resource Amount (Final
Budget)
22,098,440 79,188
22 177 628
22,177,628
412,971 90,831
503,802
22,681,430
Total District-Wide Expenditures
Blended Allocated as a %of Total 'Yo of Total Resources Resources
$ 2\,076,878 79,188
21 156066
97.78% 21,156,066
1.82% 393,6112 0.40% 86,572
2.22% 480,174
100.00% $ 21,636,240
EXHIBIT D-2
Total/Surplus Carryover
$ 1,021,562
I 021 562
1,021,562
19,369 4,259
23,628
$ \,045,190

School- High School
HOBOKEN PUBLIC SCHOOLS BLENDED RESOURCE FUND IS
SCHEDULE OF EXPENDITURES ALLOCATED BY RESOURCE TYPE~ACTUAL FOR THE FISCAL YEAR ENDED JUNE 30,2015
Total Expenditures
Resources
General Fund Contribution to School Based Budgets General Fund Encumbrances- June 30,2014
Combined General Fund Contribution and State Resources
Restricted Federal Resources
Tille I, Part A Title !I Part A
Restricted Pederal Resources Total
Totals
92
Resource Amount
$ 9,326,173 33,975
9 360 148
9,360,148
152,799 33,607
186,406
$ 9,546,554
'Yo of Total o;;, of Total
Resources Resources
$ 8,828,896 33,975
8 862 871
98.05% 8,862,871
1.60% 144,681 0.35% 31,822
1.95% 176,503
100.00% $ 9,039,374
EXHIBIT D-2.1
Total/Surplus Carryover %, of Total Resources
$ 497,277
497 277
497,277
8,118 1,785
9,903
$ 507,180

HOBOKEN PUBLIC SCHOOLS BLENIHm RESOURCE FUND 15
SCHEDULE OF EXPENDITURES ALLOCATED BY RESOURCE TYPE-ACTUAL FOR TI-lE FISCAL YEAR ENDE() .JUNF, 30,2015
School- Wallace
Resources
General Fund Contribution to School Based Budgets General Fund Encumbrances- June 30, 2014
Combined General found Contribution and State Resources
Restricted Federal Resources
Title I, Part A Title II Part A
Restricted Federal Resources Total
Totals
Resource Amount
$ 6,625,!27 ___ 1_7,412
6 642 539
6,642,539
140,410 30,883
171,293
$ 6,813,832
93
Total Expenditures
%of Total 'Yo of Total Resources Resources
$ 6,352,385 17,412
6 369 797
2_2.49% 6,369,797
2.06% 134,645 0.45% 29,61_~
2.51% 164,260
100.00% $ 6,534,057
EXHIBIT D-2.2
Total/Surplus Carryover oA, of Total
Resources
$ 272,742
--------
272 742
272,742
5,765 ______ l,~<!ll_
7,033
$ 279,775
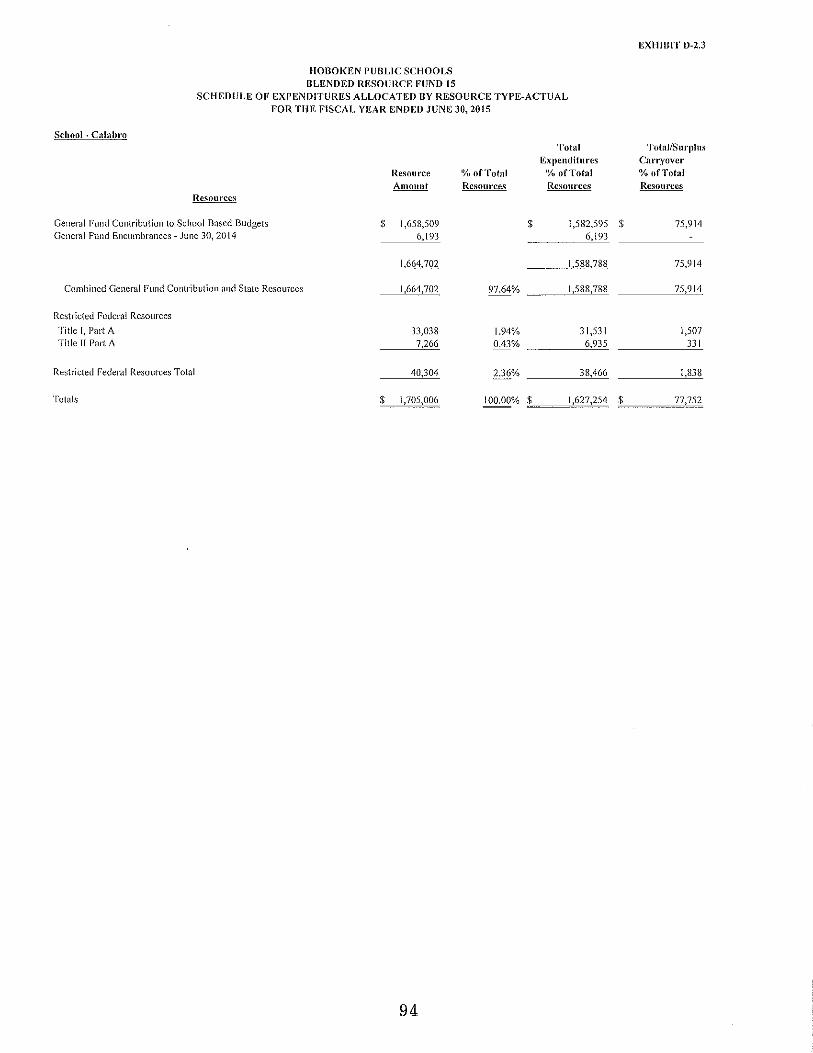
HOBOKEN PUBLIC SCHOOLS BLENDED RESOURCE FUND IS
SCHEDULE OF EXPENDITURES ALLOCATED BY RESOURCE TYPE-ACTUAL FOR THR FISCAL YEAR ENDED JUNE 30,2015
School- Calabro
Resources
General Fund Contribution to School Based Budgets General Fund Encumbrances- June 30, 2014
Combined General Fund Contribution and State Resources
Restricted Federal Rcsomces
Title l, Part A Title Jl Part A
Restricted Federal Resources Total
Totals
$
$
Resou1·ce Amount
I ,658,509 6,193
1 664 702
1,664,702
33,038 7,266
40,304
1,705,006
94
'Yo of Total Resources
97.64%
1.94% 0.43%
2.36%
100.00%
$
$
Total Expenditures %of Total Resources
I ,582,595 6,193
I 588 788
!,588,788
31,531 6,935
38,466
1,627,254
EXHIHIT D-2.3
Total/Surplus Carryover %of Total Resources
$ 75,914
75 914
75,914
1,507 331
1,838
$ 77,752

HOBOKEN PUBLIC SCHOOLS BLENDED RESOURCE FUND IS
SCHEDULE OF EXPENDITURI<:S ALLOCATED BY RESOURCE TYPE-ACTUAL FOR THE FISCAL YEAR RNDIW ,JUNE 30,2015
School- Connors
Resources
Genera! found Contribution to School Based Budgets General Fund Encumbrances- June 30, 2014
Combined General Fund Contribution and State Resources
Restricted Federal Resources
Title I, Part A Title II Parl A
Restricted f-ederal Resources Total
Totals
Resource Amount
$ 3,364,23 I 18,703
3,382,934
86,724 19,075
105,799
$ 3,488,733
95
"/o of Total Resources
96.97%
2.49% 0.55%
3.03%
100.00%
$
$
Total Expenditures
%, ofTotnl Resources
3,209,025 18,703
3 227 728
3,227,728
82,745 18,200
I 00,945_
3,328,673
EXHIBIT D-2.4
Total/Surplus Carryover %of Total Resources
$ 155,206
I 55 206
155,206
3,979 875
,,,,,,___ 4,854_
$ 160,060

HOBOKEN PUBLIC SCHOOLS BLENDED RESOURCE FUND IS
SCHEDULE OF EXPENDITURES ALLOCATED Y RESOURCE TYPE-ACTUAL FOR THE FISCAL YEAR ENDED JUNE 30,2015
School - Brandt Total
Expenditures Resource ~Yo of Total 0
/., of Total Amount Resou1·ces Resources
Resources
General Fund Contribution to School Based Budgets $ 1,124,400 $ 1,103,977 General Fund Encumbrances- June 30,2014 2,905 2,905
127 305 I 106 882
Combined Gcncm! Fund Contribution and State Resourc 1,127,305 100.00% I ,I 06,882
Restricted Federal Resources
Tille I, Part A 0.00% Title II Part A 0.00%
Restricted Federal Resources Total 0.00%
Totals $ I ,127,305 100.00% $ I ,I 06,882
96
EXHIBIT D-2.5
Total/Surplus Carryover u;;, of Total Resources
$ 20,423
- 20.423
20,423
$ 20,423
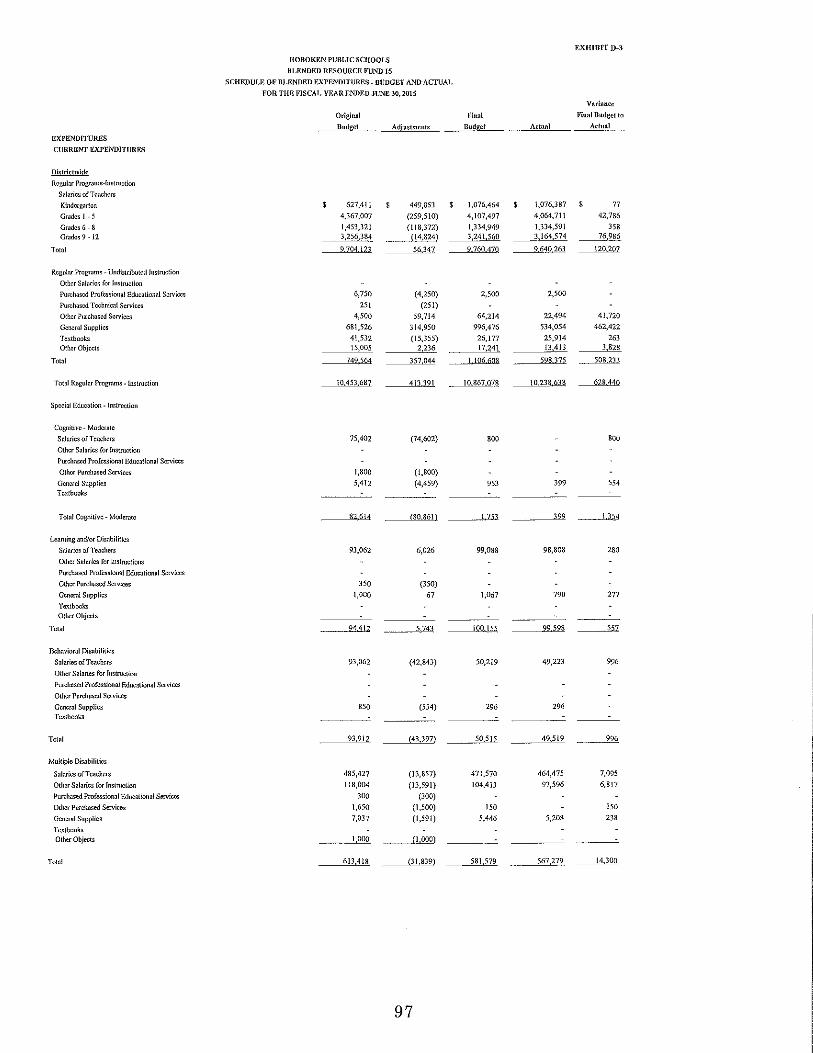
EXHIBIT D-3
HOBOKEN PUBLIC SCHOOLS
BLENDED RESOURCE FUND 15
SCHEDULE OF BLENDED EXPENDITURE!';- BUDGET AND ACfUAL
FOR THE FISCAL YEAR ENDED JUNE 30,2015
Variance
Origin~! llinal Final Budget to
Budget Adjustments Budget Actual Actual
EXPENDITURES
CURRENT EXPENDITURES
Districtwidc
Regular Programs-lmtruction
Salaries of Teachers
Kindergarten 627,411 449,053 1,076,464 1,076,387 $ 77 Grades I· 5 4,367,007 (259,510) 4,107,497 4,064,711 42,786
Grades6- 8 1,453,321 (118,372) 1,334,9~9 1,334,591 358 Gradcs9- 12 3,256 38'!. ---- (14,824) 3 241 560 __ 3,164,574 76 986
Total 9704121 56 31.1 9 760 470 9 640 263 ~
Regular Programs Undistributed Instruction
Other Salaries for Instruction
Purchased Professional Educational Services 6,750 (4,250) 2,500 2,500
Purchased T cchnical Services 251 (251)
Other Purchased Services 4,500 59,714 64,214 22,494 41,720
General Supplies 681,526 314,950 996,476 534,054 462,422
Textbooks 41,532 (!5,355) 26,177 25,914 263 Other Objects !5,005 2 236 17,241 ___ !M!l_ 3,828
Total 749 564 357 044 ~.J....l.QMQ3_ 598 375 ~
Total Regular Progmms -Instruction 10 453 6&7 413391 10 867 0{§. 10 238 63& ~
Special Education- lm;truction
Cognitive- Moderate
Salaries of Teachers 75,402 (74,602) 800 800
Other Salaries for Instruction
Purchased Professional Educational Services
Other Purchased Services 1,800 (1,800)
General Supplies 5,412 (4,459) 953 399 554 Tc.~tbooks
Total Cognitive- Moderate 82 614 (SO 861) __ _em __ _________122 ~4
Leaming and/or Disabilities
Salaries of Teachers 93,062 6,026 99,088 98,808 280
Other Salaries for Instructions
Purchased Professional Educational Services
Other Purchased Services 350 (350)
General Supplies 1,000 67 1,067 790 277
Textbooks Other Objects -----
Total 94 412 __ ........2,.lli --~'~0~0 ,155 99 598 _____ill
Behavioral Disabilities
Salaries of Teachers 93,062 (42,843) 50,2]9 49,223 996
Other Salaries for Instruction
PurclJased Professional Educational Services
Other Purchased Services
General Supplies 850 (554) 296 296 Textbooks
Total 93,912 (43,397) --50,515 49,519 996
Multiple Disabilities
Salaries of Teachers 485,427 (13,857) 471,570 464,475 7,095
Other Salaries for Instruction 118,004 (13,591) 104,413 97,596 6,817
Purchased Professional Educational Services 300 (300)
Other Purchased Services 1,650 (1,500) ISO !50
General Supplies 7,037 (1,591) 5,446 5,208 238
Textbooks Other Objects I 000 (l,OOO) ---- -----
Total 613,418 (31,839) - 581,579 567,279 !4,300
97

EXHIDITD-3
HOBOKEN PUBLIC SCHOOLS
BLENDED RESOURCE FUND 15
SCJIEDIJLE OF BLENDED EXPENDITURES- JlUDGET AND ACfUAL
FOU THE FJSCAL YEAR ENDED JUNE 30,2015 Vadanc~
Original Final Final Budget to
Budget Adiustments Jlndgct Attunl Attual
EXPENDITURES
CURRENT EXPENDITURES
Distdctwidc
Resource Room
Salaries ofTcm:hers 1,817,133 24,790 1,841,923 1,788,626 53,297
Other Salaries for Jnstmction
Purchused Professional Educational Services 2,400 (2,400)
Purchased Technical Services 1,500 (1,500)
Other Purchased Se,.,•iccs 5,000 (4,428) 572 572
General Supplies 2,650 327 2,977 2,127 850
Te1<tbooks Other Objects
---~-- ----
Total ~ _ __j,mJi!J. __ , __ 16789 -~1845472 l 791 325 54 147
Autism:
Salaries ofTeach.er:s
Other Salaries for lnstmction
Other Purcl>ascd Services General Supplies 292 29?_ ----~
Total ___ .....1,22. _ ______m ---.-
Preschool Disabilities- fu!!-Time
Salaries of Teachers 475,360 (46,713) 428,647 428,123 524
O~ler Salaries for Instruction 14,575 988 15,563 14,640 923
Other Purchased Services 1,000 (1,000)
General Supplies 30 050 (26,581) _ ______1__,1§2. 3,388 81
Total 520 985 (73 306) 447 679 446 151 I 528
Totol Special Education- Instruction ___ 1,;!_~ __ ,___(206 579) 3 027 445 2 954 563 -~ 72 882
Bilingual Education
Salaries of Teachers
Other Salaries for lnstmction
Purchased Professional-Educational Sc,.,•iccs
Purchased Teclmical Services
Other Purchased Services
General Snp!Jiies
Tc1<tbooks Other Objects
Totnl ------
School Sponsored Co/E!<t!1lC!I!Tioular Activities
Salaries 362,327 (8,616) 353,711 169,290 184,421
Purchased Services 980 1,177 2,157 989 1,168
Supplies and Mutcriuls 12,331 (8,943) 3,388 2,058 1,330
Other Objects 45 326_ (886) 44,440 43,306 _ _______!_,__Qi
Total 420 964 ______mJ&ID_ 403 696 -- 215 643 --~~
School Sponsored Athletics
Salaries 407,020 21,573 428,593 403,339 25,254
Purchased Services !06,220 \0,950 117,170 59,327 57,843
Supplies and Materials 105,211 9,926 115,137 109,504 5,633
Other Objects 160 064 (129,030) 31,034 12,471 18,563
Total ~-'ill..ll~ (86 581) 691 934 584 641 -- 107 293
Total Instruction 14 887 190 ]()2 963 14 990 !53 13 993 485 996 66S
Attendance and Social Work
Salaries 239,617 6,796 246,413 246,076 337
Other Purchased Services
Supplies and Materials 2,000 (2,000)
Other Objects
Total 241 617 4 796 246 413 246 076 337
Health Services
Salaries 386,713 (930) 385,783 384,389 1,394
Purchased Professional and Technical Services 300 (300)
Other Purchased Services 872 (872)
Supplies and Materials 23,905 (!2,766) 11,139 10,667 472
Other Objects 690 3 043 _ ______11]1_ 178 -- 3,555
Total ___ 4_1?~ (] 1 825) 400 6~5 395 234 5 421
98

EXHIDITD-3
HOBOKEN PUBLIC SCHOOLS
BLENDED RESOURCE FUND IS
SCHEDULE OF BLENDED EXPENDITURES- BUDGET AND ACfUAL
FOR THE FISCAL YEAR ENDED JUNE 30,2015
Variance
Original Finn! Final Budget to
Budget Adjustments Budget Actual Ac!unl
EXPENDITURES
CURRENT EXPENDITURES
Districtwide
Guid~nce
Salaries of Other Professional Staff 405,468 4,466 409,934 408,746 1,188
Salaries of Secretarial and Clerical Assistants 58,084 161 58,245 58,245
Other Salaries Purcha.1cd Professional Educational Services 3,000 (3,000} Other Purchased Teclmical Services
Other Purchased Services
Supplies and Materials 8,500 (4,660) 3,840 2,678 1,162 Other Obj<X:ts 5,500 l 895 7,395 ~-~ 40
Total 480 552 (l 138) 479111 477 024 -------'= Improvement of !rutructiona[ Services
Salaries Supervisors oflnstmc!ion 108,278 3,482 111,760 111,760
Salaries of0~1cr Professional Staff
Snlarics ofSccrclnria! a~d Clerical Assistants 71,161 16,004 87,165 87,165
Other Purchased Services
Purchosed Professional Educational Services 13,664 (10,014) 3,650 3,650
Other Purch. Prof, and Tech. Services
Supplies and Materials Other Objects -------
Total 193 ]03 9 472 __ 2_0b.ll5_ ___ 202575 ----
Educational Media/School Library
Salaries 263,340 (108,821) 154,519 151,628 2,891
Purchased Professional Educational Services
Purchased Professimud and Technical Scrviccs 150 (150)
Other Purchased Services 50 (50)
Supplies and Materials 70,437 (22,429) 48,008 43,040 4,968 OthcrOilJ"ccts
Total 333 977 (131 450) 202 521 -- 194668 _____,.., Instructional Staff Training Services
Purchased Professional Educational Services 17,000 (15,670) 1,330 1,060 270
Other Purchased Prof. and Tech. Services 500 (500) Other Purchased Services 58,873 (38,830) 20,043 18,151 1,892 Supplies and Materials Other Objects
----~
Total 76,373 (55,000) 21,373 19,211 2 162
Support Scn•ice- School Administration
Salaries of Principals/ Assistant Principals 944,423 30,6!0 975,033 963,499 11,534
Snlnries of Other Professional Staff
Salaries ofScc't und Clerical Assistunts 341,475 (19,161) 322,314 322,082 232 Purch~sed Professional and Technical Services
Other Salaries
Other Purchased Services 1,300 (1,086) 214 214 Supplies and Materials 86,097 244 86,341 76,071 10,270 Other Objects 4 961 3 622 8,583 --~ 43
Total 1 378 256 14 229 I 392 485 ______l.liQ, 192 ______TI.123_
99
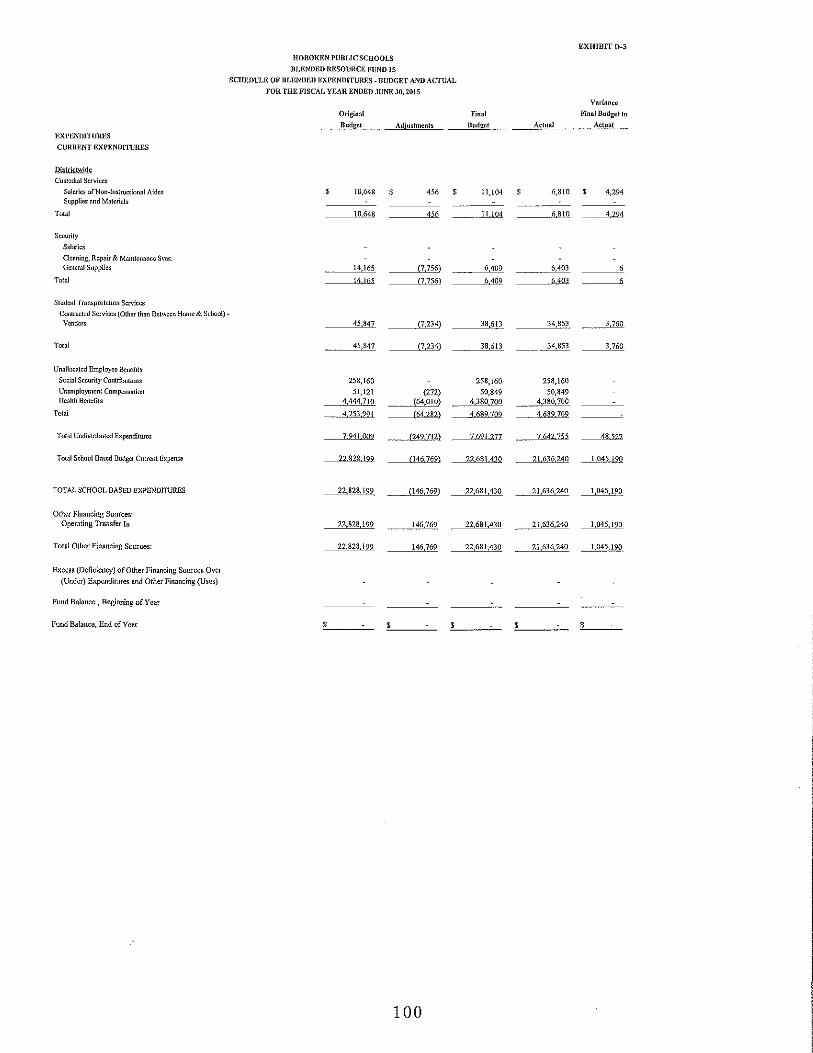
EXI'ENDITUllliS
CURRENT EXPENDITURES
Districtwide
Custodial Services
Salaries ofNon-lnstructional Aides Supplies and Materials
HOBOKEN PUBLtC SCHOOLS
BLENDED RESOURCE FUND 15
SCHEDULE OF BLENDED EXPENDITURES- BUDGET AND ACruAL
FOR THE FISCAL YRAR ENDED JUNE 30,2015
'
Original
Budget
10,648
Adjustments
456
Finn!
Dudget
11,104
A dun!
6,810
Total 10 648 ---~'~'·' --~·Jl..l.Q1 ___ .Ml.Q
Security Salaries
Cleaning, Repair & Maintenance S1•es. General Supplies
Total
Student Transportation Services
Contracted Services (Other than Bctwce11 Home & School)Vendors
Total
Unallocated Employee Benefits
Social Security Contributions
Unemployment Compensation fJC<Jlth Benefits
Total
Total Undistributed Expenditures
Total School Based Budget Current El<peru;e
TOTAL SCHOOL BASED EXPENDITURES
Other Financing Sources: Operating Transfer In
Total Other Financing Sources:
Excess (Deficiency) of Other Financing Sources Over (Under) Expenditures and Other Financing (Uses)
Fund Balance, Beginning of Year
Fund Balance, End of Year
14,165
14 165
45,847
45,847
258,160
51,121 4,444 710
-·-.:!...lli..m_
7 94! 009
22 828 199
22,828,199
22,828 199
22,828,199
$
(7,756)
(7 756)
(7,234)
(7,234)
(272) (64,010)
C64 282)
____ ru2.1m
{146 769)
(146 769)
146 769
146,769
100
___ ____MQQ_
___ .§,409
___ 3_8~613
_, _ __1Mll_
258,160
50,849 4 380 700
7 691 277
22 681430
22,681,430
22,681,430
22,681,430
6,403
____ 6,403
34,85~-
--- 34,853
258,160
50,849 4,380,700
4 689 709
7 642 755
21636240
21,636 240
21,636,240
21,636,240
EXHIBITD-3
Vnrinnce
Final Budget to
Actual
4,294
4 794
-- 3,760
3,760
48 sn
~190
~90
1,045,190
I 045 190
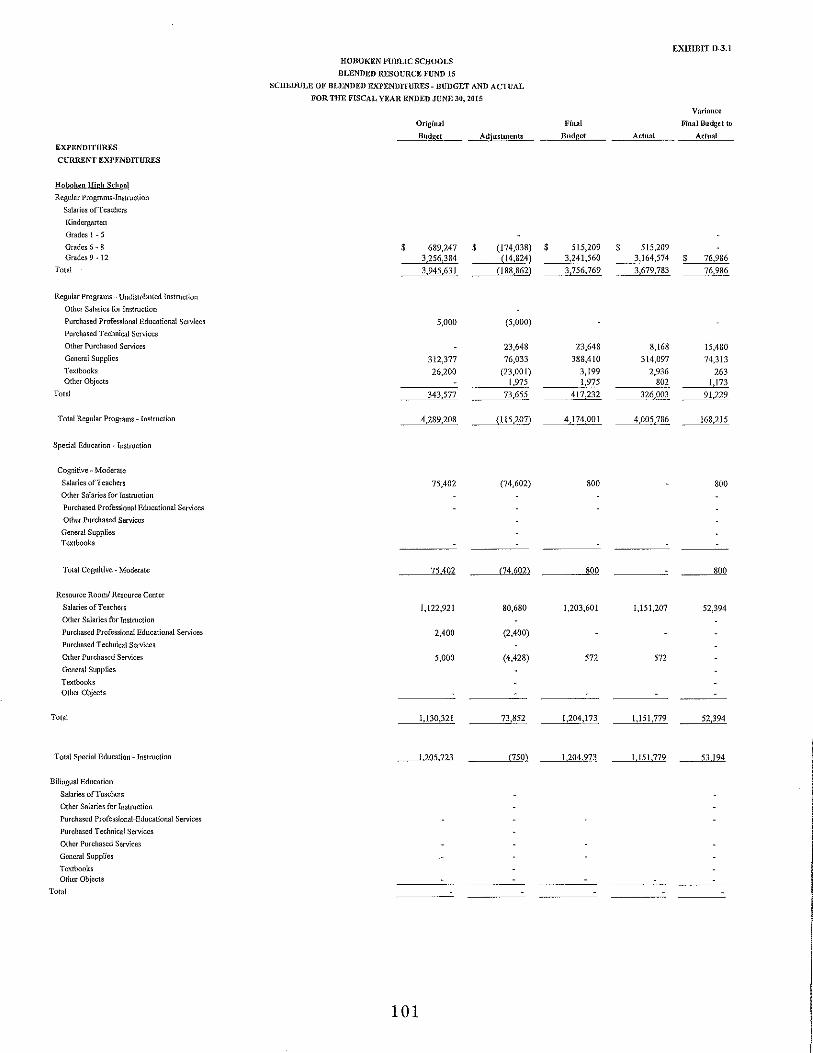
EXPENDITURES
CURRENT EXPF:NDITURES
Hobol1en lligh School
Regular Programs-Instruction
Salaries ofTeachers
Kindergarten
Grades I- 5
Grades 6- g Grades 9- 12
Total
Regular Programs- Undistributed tnsln!ction
Other Salaries for Instruction
Purchased Professional Educational Services
Purchased Technical Services
Other Purchased Services
General Supplies
Textbooks Other Objects
Total
Total Regular Programs Instruction
Special Education -Instruction
Cognitive- Moderate
Salaries of Teachers
Other Salaries for Instruction
Purchased Professional Educational Services
Other Purchased Services
General Supplies
Textbooks
Total Cognitive- Moderate
Resource Room/ Resource Center
Salaries ofTeachers
Other Salaries for Instruction
Purchased Professional Educational Services
Purchased Technical Services
Other Purchased Services
General Supplies
Textbooks Other Objects
Total
Total Special Education Instruction
Bilingual Education
Salaries ofTcachers
Other Salaries for Instruction
Purchased Professional-Educational Services
Purchased Technical Services
Other Purchased Services
General Supplies
Textbooks Other Objects
Total
HOBOKEN PUBLIC SCHOOLS
BLENDED RESOURCE FUND 15
SCHEDULE OF BLENDED EXPENDITURES -BUDGET AND ACTUAL
FOR THE FISCAL YEAR ENDED JUNE 30,2015
$
Original
Budget
689,247 3,256,384
3,945,631
5,000
312,377
26,200
$
Adjustments
(174,038) $ (14,82:!)
{188,862)
(5,000)
23,648
76,033
(23,001) 1,975
Final
Budget
515,209 3,241,560
3,756,769
23,648
388,410
3,199 1,975
343,577 73,655 __ 4_17,232
4,289,208 {115,207) 4,174,001
75,402 (74,602) 800
75 402 (74 602) 800
1,122,921 80,680 1,203,601
2,400 (2,400)
5,000 (4,428) 572
1,130,321 73,852 1,204,173
I 205 723 (750) I 204 973
101
Actual
$ 515,209
F.XIIIHIT IJ-3.1
Variance
Final Budget to
Actual
3,164,574 $"-----"""''"'""' 3,679,783 76,986
8,168 15,480
314,097 74,313
2,936 263 802 1,173
326,003 91,229
4,005,786 168,215
800
800
1,151,207 52,394
572
l,l51,779 52,394
I 151 779 53 194

EXHIHIT D-3.1
HOBOKEN PUBLIC SCHOOLS
liLJ~NDED RESOURCE FUNU IS
SCHEDULE OF BLENDED EXPENDITURES- BUDGET AND ACTUAL
FOR THE FISCAL YEAR ENDED J1JNE 30,2015
Vuri~nce
Origin~! Final Finn! Budget to
Budget Adjustmcr>ts Budget Actual Aetunl
EXPENDITURES
CURRENT EXPENDITURES
Hobol1en High School
School Sponsored Co/Extracurricular Activities
Salaries $ 286,139 $ $ 286,139 137,968 148,171
Purchased Services 260 1,177 1,437 989 $ 448
Supplies and Materials 12,331 (8,943) 3,388 2,058 1,330 Other Objects 45,326 (886) ~- 44,440 43,306 1,134
Total 344,056 _ ___JMg} ---335,404 184,321 151,083
School Sponsored Athletics
Salaries 407,020 21,573 428,593 403,339 25,254
Purchased Services 106,220 10,950 l17,170 59,327 57,843
Supplies and Materials 105,211 9,926 115,137 109,504 5,633 Other Objects 160,064 {129,030) 31,034 12,471 18,563
Total 778,515 {86,581) 691,934 584,641 107,293
Total Instruction ___ .§,617 502 f2111.2ill 6406312 5 926 527 ~._____:\~~m
Attendance and Social Work
Salaries 156,121 156,121 155,784 337
Other Purchased Services
Supplies and Materials 2,000 (2,000) Other Objects
Total 158,121 (2,000) 156,121 155,784 337
Health Services
Salaries 93,062 (669) 92,393 92,167 226
Supplies and Materials 10,979 (1,990) 8,989 8,521 468 Other Objects 690 3,043 3,733 178 3,555
Total 104,731 ~~ 105,115 100,866 4,249
Guidance
Salaries of Other Professional Staff 347,077 4,466 351,543 351,543
Salaries of Secretarial and Clerical Assistants 58,084 161 58,245 58,245
Other Salaries
Purchased Professional Educational Services 1,000 (1,000)
Supplies and Materials 7,000 (3,542) 3,458 2,296 1,162 Other Objects 4,500 2,400 6,900 6,860 40
Total 417,661 --~ 420,146 418,944 1,202
Improvement oflnstn~ctional Services
Salaries Supervisors ofrnstruction 108,278 3,482 lll,760 111,760
Salaries of Other Professional Staff
Salaries of Secretarial and Clerical Assistants 71,161 16,004 87,165 87,165
Other Purchased Services
Purchased Professional Educational Services
Other Purch. Prof. and Tech. Services
Supplies and Materials Other Objects
Total 179,439 19,486 198,925 198,925
Educational Media/School Library
Salaries 96,107 96,107 95,414 693
Purchased Professional Educational Services
Purchased Professional and Technical Services
Other Purchased Services
Supplies and Materials 52,787 ([6,514) 36,273 34,60] 1,672 Other Objects
Total 148,894 (16,514) 132,380 130,015 2,365_
102

EXHIBIT D-3.1
HOBOKEN PUBLIC SCHOOLS
BLENDED RESOURCE FUND 15
SCHEDULE OF BLENDED EXPENDITURES. BUDGET AND ACTUAL
FOR THE FISCAL YEAR ENDED JUNE 30, 2015
Vnriance
Original Final Final Budget to
Budget Adiustmcnts Budget Acttml Actunl
£Xl'ENJHTURES
CURRENT EXPENDITURES
Hoboken Hig!1 SchO()I
Instructional Staff Training Services
Purchased Professional Educational Services $ 11,000 $ (11,000) $ $ $ Other Purchased Prof. and Tech. Services
Other Purchased Smviccs 35,173 (18,557) 16,616 15,742 874 Supplies and Materials
Other Objects
Total __ 46,173 - (29,557) !6,616 15,742 874
Support Service- School Administration
Salaries ofPrincipals/Assistant Principals 252,503 5,144 257,647 246,113 [],534
Salaries of Other Professional Staff
Salaries ofScc't a11d Clerical Assistants 50,485 166 50,651 50,651
Purchased Professional and Technical Services
Other Salaries
Other P1.1rchased Services
Supplies and Materials 39,500 2,838 42,338 36,859 5,479 Other Objects 1,224 2,281 3,505 3,500 5
Total 343,7l2 10,429 354,141 337,123 17,018
Security
Salaries General Supplies 9,350 (3,341) 6,009 6,009
Total 9,350 {3,341) 6,009 6,009
Student Transportation Services
Contracted Services (Other than Between Home & School)-
Vendors 27,740 {9,416) 18,324 16,974 1,350
Total 27,740 {9,416) 18,324 16,974 1,350
Unallocated Employee Benefits
Social Security Contributions ll9,674 119,674 ll9,674 Unemployment Compensation 21,842 21,842 21,842 Health Benefits 1,618 512 {27,563) 1,590,949 1,590,949
Total 1,760 028 (27,563) 1,732,465 1,732,465
Total Undistributed Expenditures 3 195 849 {55 607) 3 140 242 3 ll2 847 27 395
Total School Based Budget Current Expense 981JJ~l (266 797} 9 546 554 9 039 374 507 180
TOTAL SCHOOL BASED EXPENDITURES 9,813 351 {266,797) 9,546,554 9,039,374 507,180
Other Financing Sources: Operating Transfer In 9,813 351 (266,797) 9,546,554 9,039,374 507,180
Total Other Financing Sources: 9,813 351 {266,797) 9,546,554 9,039,374 507,180
Excess (Deficiency) of Other Financing Sources Over
(Under) Expenditures and Other Financing (Uses)
Fund Balance , Beginning of Year
Fund Balance, End of Year $ $ $ L_ __ $
103

EXPI':NDITURES
CURRENT EXPENDITURES
School- Wnll~cc
Regular Programs-Instruction
Sal,.ricsofTcm::llcrs
Kindergnnen
Omdcs I -5
Gradcs6· 8 Grades 9-12
Total
Regular Programs - Undistribt!led Instruction
Other S,larics for hmruction
Purchased Professional Educational S<rviccs
Purchased Technical Servicos
Other Purchased Services
Geneml Supplies
Textb<Jok.s Otl1er Objects
To~1l
Total Regular Programs- Jnstnoction
Special Education -lnstmction
Cognitive- Moderate
Salaries of Teachers
Other Salaries for Instruction
Purchased Professional Educational Services
Other Purchased Services
Ocncm! Supplies Textbooks
Total Cognitive Moderate
Learning and/or Disabilities
Salaries of Teachers
Other Salaries for Instruction
Pm<:hased Professional Educational Sen-ices
Other Purchased Services
General Supplies
ToxtOOoks Other Objects
Total
Multiple Disabilities
Salaries of Teachers
Other Salaries for !nstmction
Purchased Professional Educational Services
Other Purchased Services
General Supplies
TC)(thook.s Other Objects
Total
Resource Room! Resource Center
Salaries of Teachers
Other Salaries for Instruction
Purcbased Professional Education Scn'iccs
Purclmscd Technical Services
Other Purchased Services
General Supplies
Other Objects
Total
Autism:
Genera! Supplies
Total
HOBOKEN PUJlUC SCHOOLS
BLENDED RESOURCE FUND 15
SCHEDULE OF BLENDED EXPENDITURES- BUDGET AND ACTUAL
FOR THE FISCAL YEAR ENDED JUNE Jll, 2015
Origin;~!
Budget
302,743
2,255,251
394,169
2952163
182,500
9,405
191,905
3,144,068
1,800
5,412
7 212
93,062
350
1,000
-~---
94,412
325,187
1,500
2,500
329 187
466,710
1,350
1,800
469,860
----
----
Adjustments
(57,822)
195,293
19,384
\56 855
14,587
172,479
8,137 76;
-- 195966
352,821
(1,800)
(4,459)
--.-~
6,026
(350)
67
5143
37,227
(1,500)
{612)
-----
35 115
{58,332)
(1,350)
582
__ (59.100)
292
292
104
Fln:tl
Dttdgct
244,921
2,450,544
413,553
3 109 018
14,587
354,979
8,137 10,!68
-- 387,871
_______M2~
953
_____2,i1
99,088
1,067
100,!55
362,414
1,888
--~--
364,302
408,378
2,382
410,760
292
292
Actual
244,885
2,448,7&2
413,229
--~---
-- 3 106 896
9,667
107,077
8,137 --9408
~- 134,289
3 241,l85
399
399
98,808
790
99 598
362,054
1,689
363,743
408,358
1,532
- 409,890
29~
-···~
EXHIBIT D-3.2
Variance
Final D11dgct to
Mtual
36
1,762
324
~-..----1..ill.
4,920
247,902
~ -- 253,582
_____ill,1Q<!_
554
__ .521
'"0
277
___ 55_7
360
199
___ 55_9
20
850
__ __[?_Q_

EXPENDITURES
CURRENT EXPENDITURES
School- Wallncc
Preschool Dis~bililies Full-Time
Sal;orics of Teachers
Other Salaries for lnstmctian
Other Purchased Services
General Supplies
Total
Total Special Education -Instruction
Bilingual Education
Salaries of Teachers
Other Salaries for lmtruction
Purchased Professional-Educational Services
Purchased Technical Services
Other Purchased Services Gcnernl Supplies
Textbooks Other Objects
Total
School Sp<Jnsorcd Co/Extracurricular Activities
Salaries
Other Purchased Services
Supplies and Materials
Other Objects
Total
Tol~llnstmction
Attendance and SGGial Wmk
Salaries
Other P11rchased Services
Supplies nnd Materials
OthcrObjtcts
Total
Health Services
Salaries
Purchased Professional and Technical Services
Other Purchased Services
Supplies m1d Materials
Other Objects
Total
Guidnnce
Salaries of Other Pmfcssio11al Staff
Salnries of Secretarial and Clerical
Other Salaries
Purchased Professional Educational Services
Other Purchased Technical Services
Other Purchased Services
Supplies and Materinls Other Objects
Total
lmpro\'Cincllt oflnstructiomil Services
Salaries Supervisors of lnstnlction
Salaries of Other Professional Staff
Salaries of Secretarial nnd Clerical
Other Purchased Services
Purchased Professi011nl Educational Services
OtherPurch. Prof. and Tech. Services
S11pp1ics and Materials
Other Objects
Total
IIOllOKEN PUBLIC SCHOOLS
BLENDED RESOURCE FUNlllS
SCHEDULE OF BLENDED EXPt;;NDlTURES- BUDGET AND ACTUAL
FOR Til It illS CAL YEAR ENDED JUNE 3U, 1Ul:'i
Origiunl
Budget
475,360
14,575
!,000 30 050
- 520,935
·-- 1.421,656
20,326
20 826
4,586 550
12,622
12 622
103,821
220
2,500
----111,541
58,391
2,000
1,500
61 891
1,200
1,200
Adjustments
(46,713}
988
(1,000) (26,581)
__ _(73,306)
______i2?..ill)
----
255,306
m
m
(712)
(220)
(2,445)
(3 377)
(2,000)
(1,118)
(31l8)
(1,200}
(1,200)
105
Final
Budget
423,647
15,563
3,46~
447,679
I 324,141
----
20,826
-~!!
4,841 856
13,334
____________lhl;!i
108,109
55
108,164
58,391
382
58,773
EXHllllT D-3.2
Actunl
428,123
14,640
__ 3388
_____±!Q?J_
1,320,013
10,8\0
10 8\0
__ 4.572.063
13,334
]3 334
107,724
55
107,779
57,203
382
57,585_
Variance
~·tnal Budget to
Actual
524
923
---"-~
______:!,Q§__!I
10,016
~
__ 26~
385
___ 38_5
1,188
_______!_,__!!!

EXPENDITURI!:S
CURRENT EXPENDITURES
Sclmol" Wallace
llducatimtal Media/School Library
Salaries
Purcha«d Professional Edt!C.1tional Services
Purcha«d Professional nnd Technlc;ol Services
Other Purchased Se<Viccs
Supplies and Materials Other Objects
To~ol
Instructional StniTTraining SeJVice.s
Purchased Professional Educational Services
Other Pttrchascd Prof. nud Tech. Services
O~oer Purchased Services
Supplies and Materials Other Objects
Total
Support ScJVicc School Administration
S"larios of Prindpals/Assist•mt Principals
Salaries of Other Professional Staff
SalaricsofSec't and Cieri col Assistants
Purchased Professional aud Technical Services
Other Salaries
Other Purchased Sen'iccs
Supplies and Materials
Other Objects
Total
Custodial Services
Salaries of Noll-hts!ntctio•~al Aides
Supplies and Materials
Total
Security
Salaries Geneml Supplies
Total
Student Tmnsponation Services
Contracted Services (O~ter than Between Home & School)
Vendors
Total
Unallocated Employee Bcnefill;
Social Security Contribntious
Unemployment Compensation
Health Benefits
Total
Total Undistributed Expenditures
Total School Based lludgct Current Expense
TOTAL SCHOOL BASED EXPENDJTIJRES
Other Financing Sources:
OperaHng Transfer In
Total Other Financing Sources:
Excess (Deficiency) of Other Financing Sources Over
(Under) Expenditures !irld Other Financing (Uses)
Fund Balance, Beginning ofYear
Fund Balance, End of Year
HOBOKEN PUBLIC SCHOOLS
II LEND ED RESOURCE FUND 15
SCHEDULE OF BLENDED EXPENDITURES- BUDGET AND ACTUAL
FOR THE FISCAL YEAR ENDED JUNE 3(1, 2015
Original
Budget
57,612
7,500
---- 65112
3,000
13,400
-----16 400
271,933
128,119
10,000 2,040
412,092
10,648
10,648
4 815
4,815
7 500
_ _______12.QQ_
64,311
15,664 1,231,469
1,311,444
-~2015265
6 601815
6 601 815
6 601 815
6 601 815
'
Adjustments
(2,332)
{2,332)
(3,000)
(12,072)
(15 072)
8,762
(30,096)
114 481
{20, 739)
456
456
(4415) (4,415)
5 792
5 792
(43 289}
212 017
' 212017
__ _.?12 017
~m
106
Finnl
B1"lgct
57,612
5,168
-----62,780
1,328
1,328
280,695
98,023
10,114 ___ 2£
-·-· 391,353
ll,l04
11.!04
400
400
13292
13.292
64,311
15,664 1,231473
____________1,311 448
197\.976
6 813 832
6,813,832
__________MlM_:g_
6,813,832
Actual
56,214
3,873
-~
1,328
1,328
280,695
98,023
9,212 2,521
~l
6,810
6,810
394
394
12,773
12 773
64,311
15,664 1,231,473
1,311,448
_________l.221,989
6 534 057
' 6 534057
6.534,057
6,534.057
EXHIBIT D-3.2
Vari:tocc
Final Budget to
Actual
1,398
1,295
________M2l
902
__ ______m
4,294
~
____ 6
----'
___ 5_1_9
___ 51_9
___________2.il
...........IJ.2
$ 279,775
~
$ 279,775
_, __ _

EXHIBIT D-3.3
HOBOKEN PUBLIC SCHOOLS
BJ_,ENDEJ> RESOURCE FUND IS
SCHEDULE OF BLENDED EXPENDITURES- BUDGET AND ACTUAL
FOR THE FISCAl_, YEAR ENDED JUNE 30, 2015
Variance
Original Final Final Budget to
Budget Adjustments Budget Actual Actual
EXPENDITURES
CURRENT EXPENDITURES
School- Calahro
Regular Programs-Instruction
Salaries of Teachers
Kindergarten $ 146,268 $ 8,709 $ 154,977 $ 154,966 [[
Grades I -5 526,759 (44) 526,715 488,715 38,000 Grades 6- 8 199,846 29,283 229,129 229,095 34 Grades 9- 12
Total 872,873 37 948 910,821 872,776 38,045
Regular Programs -Undistributed Instruction
Other Salaries for Instruction
Purchased Professional Educational Services 250 (250) Purchased Technical Services 25[ (251) Other Purchased Services 4,585 4,585 1,305 3,280 General Supplies 86,649 (21,736) 64,913 48,805 16,108 Textbooks Other Objects I 405 1,405 745 660
Total 87 150 (16 247) 70 903 50 855 20 048
Total Regular Programs- Instruction 960 023 21 701 981 724 923 631 58 093
Special Education- Instruction
Multiple Disabilities
Salaries ofTeachers 103,42& 103,42& 96,611 6,817 Other Salaries for Instruction
Purchased Professional Educational Services
Other Purchased Services
General Supplies Textbooks
Total 103,428 103,428 96,611 6,817
Total Special Education -Instruction 103,428 103 428 96,611 6,817
School Sponsored Co/Extracurricular Activities
Salaries 20,362 (9,000) 11,362 5,649 5,713 Purchased Services 720 720 720 Supplies and Materials Other Objects -----
Total 21,082 {9,000) 12,0&2 5,649 6,433
Total Instruction 1 084 533 12 701 I Q21231 I 025 891 71 343
Health Services
Salaries 93,062 (42) 93,020 92,237 783
Purchased Professional and Technical Services
Other Purchased Services 550 (550)
Supplies and Materials 5,926 (4,602) 1,324 1,324 Other Objects
Total 99,538 (5,!94) 94 344 93,561 783
107

HOBOKEN PUBLIC SCHOOLS
BLENDED RESOURCE FUND 15
SCHEDULE OF BLENDED EXPENDITURES- BUDGET AND ACTUAL
FOR THE FISCAL YEAR ENDED JUNE 30, 2015
EXPENDITURES
CURRENT EXPENDITURES
School- Calabro
Educational Media/School Library
Salaries
Purchased Professional Educational Services
Purchased Professional and Technical Services
Other Purchased Services
Supplies and Materials Other Objects
Total
Instructional Staff Training Services
Purdmsed Professional Educational Services
Other Purchased Prof. and Tech. Selvices
Other Purchased Services
Supplies and Materials Other Objects
Total
Support Service- School Administration
Salaries of Principals/Assistant Principals
Salaries of Other Professional Staff
Salaries ofSec't and Clerical Assistants
Purchased Professional and Technical Services
Other Salaries
Other Purchased Services
Supplies and Materials Other Objects
Total
Security
Salaries General Supplies
Total
Custodial Services
Salaries ofNon-Instructional Aides Supplies and Materials
Total
Student Transportation Services
Contracted Services (Other than Between Home & School)
Vendors
Total
Unallocated Employee Benefits
Social Security Contributions
Unemployment Compensation Health Benefits
Total
Total Undistributed Expenditures
Total School Based Budget Current Expense
$
Original
Budget
8,150
8,150
3,800
3,800
131,780
50,485
500
10,300 197
193,262
6,400
6,400
18,023
4,297 304,557
326,877
638 027
1 722 560
108
Adjustments
$ (4,582) $
(4,582)
(2,201)
-- (2,201)
5,695
311
(500)
97
5 603
(3,485)
(3,485)
(20,396)
(20,396)
(30 255)
07554)
Final
Budget
3,568
3,568
1,599
1,599
137,475
50,796
10,397 197
198,865
2,915
2,915
18,023
4,297 284 161
306 481
607 772
1 705 006
$
Actual
EXHIBIT D-3.3
Variance
Final Budget to
Actual
2,568 $ 1,000
2,568
995
995
137,475
50,796
7,357 !59
195,787
I 971
1,971
18,023
4,297 284161
306,481
601 363
1 627 254
1,000
604
604
3,040 38
3,078
944
944
6 409
77 752

EXPENDITURES
CURRENT EXPENDITURES
School* Calabro TOTAL SCHOOL BASED EXPENDITURES
Other Financing Sources: Operating Transfer In
Total Other Financing Sources:
Excess (Deficiency) of Other Financing Sources Over
(Under) Expenditures and Other Financing (Uses)
Fund Balance , Beginning of Year
Fund Balance, End of Year
HOBOKEN PUBLIC SCJIOOl.S
BLENDED RESOURCE FUND IS
SCHEDULE OF BLENDED EXPENDITURES- BUDGET AND ACTUAL
FOR THE FISCAL YEAR ENDED JUNE 30,2015
Original
Budget Adjustments
Final
Budget
$ 1,722,560 $ (17,554) ~$-~!~,7~05~,0~0~6
1,722,560 (17,554) 1,705,006
1,722,560 (17,554) 1,705,006
$
109
Actual
EXliiDIT 0-3.3
Variance
Final Budget to
Actual
$ 1,627,254 ~$-~''~·'~'~'
1,627,254 77,752
__ 1,627,254 77,752
$

EXHIBIT D-3.4 HOBOKEN PUBLIC SCHOOLS
BLENDED RESOURCE FUND IS
SCHEDULE OF BLENDF.D EXPENDITURES- BUDGET AND ACTUAL
FOR THE FISCAL YEAR ENDED JUNE 30, 2015
V:~ri:~ncc
Orlghml Final Final Btulget to
Budget Adjustments Budget Actmli A dual
EXPENDITURES
CURRENT EXl'ENDITURES
School- Cnnnors
Regular Programs-Instruction
Saluries ofTeachers
Kindergnrten $ 178,400 $ (29,729) $ 148,67! $ 148,67\ Grades I- 5 1,070,308 59,930 1,130,238 1,!27,214 $ 3,024 Grades 6-8 170,059 6,999 !77,058 177,058 Grades 9- " Total I 418 767 37 200 1 455 967 I 452 94:2. 3 024
Regular Programs- Undistributed !nstmcrion
Other Salaries for Instruction
Purchased Professional Educational Services 2,500 2,500 2,500 Purchased Technical Services
Other Purchased Services 14,052 14,052 2,162 11,890 General Supplies 70,000 85,292 155,292 43,560 111,732 Textbooks 10,332 (109) 10,223 \0,223 Other Objects 5,600 {3,857) 1,743 I 743
Total 85 932 97 878 183 810 60188 123 622
Total Regular Programs- Instruction I 504 699 135 078 I 639 777 1 513 11\ 126 646
Special Education -Instruction
Behavioral Disabilities
Salaries ofTeachers 93,062 (42,843) 50,219 49,223 996 Other Salaries for Instruction
Porchased Professional Educational Services
Other Purchased Services
General Supplies 850 {554) 296 296 Textbooks
Total 93 912 (43 397) 50 515 49519 996
Multiple Disabilities
Salaries ofTeachers 160,240 (51,084) 109,156 102,421 6,735 Other Salaries for Instruction 14,576 (13,591) 985 985 Purchased Professional Educational Services 300 (300) Other Purchased Services 150 150 ]50 General Supplies 4,537 (979) 3,558 3,519 39 Textbooks Other Objects 1,000 (1,000)
Total 180,803 (66,954) I 13,849 106,925 6,924
Resource Room/ Resource Center
Salaries ofTeachers 97,044 97,044 96,161 883 Other Salaries for Instruction
Purchased Professional Educational Services
Purchased Technkal Sen•iccs 150 (!50) Other Purchased Services
General Supplies 850 (255) 595 595 Textbooks Other Objects
Total 98 044 __ _(1@ 97 639 - 96756 883
Total Specinl Education- Instruction 372 759 (110756) 262 003 253 20Q 8 8QJ
110

EXPENDITURES
CURRENT EXPENDITURES
School- Connnrs
School Sponsored Co/Extracurricular Activities
Salaries
Purchased Services
Supplies and Materials Other Olliecls
Total
Total Instruction
Attendance and Social Work
Salaries
Other Purchased Services
Supplies and Materials Other Objects
Total
Ho:mlth Services
Salaries
Purchased Professional and Technical Services
Other Purchased Services
Supplies and Materials Other Objects
Total
Guidance
Salaries of Other Professional Staff
Salaries of Secretarial and Clerical Assistants
Olher Salaries
Purchased Professional Educational Services
Olher Purchased Technical Services
Olher Purchased Services
Supplies and Materials Other Objects
Total
Improvement of Instructional Services
Salaries Supervisors oflnstruction
Salaries of Other Professional Staff
Salaries of Secretarial and Clerical Assistants
Other Purcha.~ed Services
Purchased Professional Educational Services
Other Puf(;b. Prof and Tech. Services
Supplies and Materials Other Objects
Total
Educational Media/School Library
Salaries
Purchased Professional Educational Services
Purchased Professiona!Md Technical Services
Other Purchased Services
Supplies and Malerials Other Objects
Total
HOBOl<EN PUBLIC SCHOOLS
BLENDED RESOURCE FUND 15
SCHEDULE OF BLENDED EXPENDITURES- BUDGET AND ACTUAl,
FOR THE FISCAL YEAR ENDED .JUNE 30, 2015
$
Odginnl
Budget
30,000
3QQQQ
I 907 458
70,874
70,874
91,768
300 102
3,000
95 170
I 000
I 000
12,464
12464
109,621
150 50
2,000
____llL821
Adjustments
$ $
24 322
6,084
6,084
493 (300)
(102}
(2,284)
{2,193)
{505) (505)
(8,814)
(8 814)
(108,821)
(150)
(50)
999
(108 022)
111
Final
Budget
30,000
30 000
1 931,780
76,958
76,958
92,261
716
92,977
495 495
3,650
3 650
800
2,999
3 799
$
Actual
9,602
9602
I 775,933
76,958
76,958
92,261
712
92,973
495 495
3,650
3 650
1,998
I 998
EXHIBIT D-3.4
Vari~nce
Fit•nl Budget to
Actunl
$ 20,398
20 398
155 847
4
4
800
1,001
I 801

EXHIBIT D-3.4
IIOllOKEN PUBLIC SCHOOLS
BLENDED llESOURCE FUND 15
SCHEDULE OF BLENDED EXPENDITURES- BUDGET AND ACTUAL
FOR THE FISCAL YEAR ENDED JUNE 30,2015
Variance
Original Finn! Final Budget to
Budget Adjustments Budget Actual Actual
EXPENDITURES
CURRENT EXPENDITURES
Schnnl- Connors
Instructional StaffTraining Services
Purchased Professional Educational Services 3,000 $ (1,670) $ 1,330 $ !,060 $ 270
Other Purchased Prof. nnd Tech. Ser~iccs 500 (500)
Other Purchased Services 4,500 (4,000) 500 86 414
Supplies and Materials OUter Objects
Total 8 000 (6,170) I 830 1 146 684
Support Service School Administration
Salaries of Principals/Assistant Principals 247,983 7,975 255,958 255,958
Salaries of Other Professional Staff
Salaries of Sec'! and Clerical Assistants 100,970 7,246 108,216 108,216
Purchased Professional and Technical Services
Other Salnrie~
Other Purchased Services
Supplies and Materials 26,297 (2,805) 23,492 22,643 849 Other Objects 1,500 274 1,774 1,774
Total 376,750 12,690 389,440 388,591 849
Security
Salaries General Supplies
Total ----
Student Transpor1ation Services
Contracted Services {Other than Between Home & School)-
Vendors 2,207 336 2,543 1,668 875
Total 2,207 336 2,543 ___ ,_,668 875
Unallocated Employee Benefits
Social Security Contributions 56,152 56,152 56,152
Unemployment Compensation 9,318 (272) 9,046 9,046 Health Benefits 920,063 920,063 920,063
Total 985,533 {272) 985,261 985,261
Total Undistributed Expenditures 1,663,819 $ {106,866) 1,556,953 1,552,740 4,213
Total School Based Budget Current Expense 3,571,277 {82,544) 3,488,733 3,328,673 160,060
TOTAL SCHOOL BASED EXPENDITURES 3,571,277 (82,544) 3,488,733 - 3,328,673 160,060
Other Financing Sources:
Operating Transfer In 3,571,277 (82,544) 3,488,733 3,328,673 160,060
Total Other Financing Sources: 3,57!,277 {82,544) 3,488,733 3,328,673 160,060
Excess (Deficiency) of Other Financing Sources OVer
(Under) Expenditures and Other Financing (Uses)
Fund Balance, Beginning of Year
Fund Balance, End of Year $ $ $ $ $
112

EXHIBIT D-3.5
HOBOKEN PUBLIC SCHOOLS
BLENDED RESOURCE FUND 15
SCHEDULE OF BLENDED EXPENDITURES- BUDGET AND ACTUAL
FOR THE FISCAL YEAR ENDED JUNE 30,2015
Vnri,,nce
Original Final Final Budget to
Budget Adjustments Budg~t Actual Actual
EXPENDITURES
CURRENT EXPENDITURES
Schoa!- Brandt
Regular Programs-Instruction
Salaries ofTeachers
Kindergarten $ 514,689 $ 13,206 $ 527,895 ' 527,865 $ 30
Grades 1- S
Grades 6- 8 Grades 9- 12 -----
Total 514,689 13,206 527,895 527,865 30
Regular Programs- Undistributed Instruction
Other Salaries for Instruction
Purchased Professional Educational Services 1,500 (1,500)
Other Purchased Services 4,500 2,842 7,342 1,192 6,\50
General Supplies 30,000 2,882 32,882 20,5[5 12,367
Textbooks 5,000 (382) 4,618 4,618 Other Objects 1,950 1,950 715 1,235
Total 41,000 5,792 46,792 27,040 19,752
Total Regular Programs- Instruction 555 689 18 998 574 687 554 90~ 19 782
Special Education- Instruction
Resource Room
Salaries ofTeachers 130,458 2,442 132,900 132,900
Other Purchased Services General Supplies
Total 130 458 2 442 132 900 132 900
Preschool Disabilities- Full-Time Salaries of Teachers
Total
Total Special Education- Instruction 130 458 2 442 132900 132 900
School Sponsored Co/Extracurricular Activities
Salaries 5,000 384 5,384 5,261 123
Supplies and Materials Other Objects
Total 5 000 384 5 384 s 261 123
Total Instruction 691,147 21 824 712,971 693,066 19 905
Health Services
Salaries
Purchased Professional and Technical Services
Other Purchased Services
Supplies and Materials 1,500 (1,445) 55 55 Other Objects
Total 1,500 {1,445) 55 55 -----
113

EXHIBIT 0~3.5
HOBOKEN PUBLIC SCHOOLS
BLENDED RESOURCE FUND 15
SCHEDULE OF BLENDED EXPENDITURES- BUDGET AND ACTUAL
FOR THE FISCAL YEAR ENDED JUNE 30,2015
v~rlance
Original Final Final Budget to
Budget Adinstmcnts JJndget Actunl Actual
EXPENDITURES
CURRENT EXPENDITURES
School- Dnmdt
Instructional Staff Training Services
Purchased Profe~~ional Educational Services
Other Purchased Services $ 2,000 $ (2,000)
Other Objects
Total 2,000 (2,000)
Support Service- School Administration
Salaries of Principals/ Assistant Principals 40,224 3,034 $ 43,258 $ 43,258
Salaries ofSec't and Clerical Assistants l1,416 3,212 14,628 14,396 $ 232
Purchased Professional and Technical Services
Other Purchased Services 800 (586) 214 214
Supplies and Materials Other Objects 586 586 586
Total 52,440 6,246 58,686 58,240 446
Custodial Services
Salaries ofNon-Instructional Aides General Supplies
Total
Student Transportation Services
Contracted Services (Other than Between Home & School)-
Vnndors 2,000 (461) 1,539 1,467 72
Total 2,000 (461) 1,539 1,467 72
Unallocated Employee Benefits
Social Senurity Contributions
Uncmploymnnt Compensation Health Benefits 370,109 {16,055) 354,054 354,054
Total 370 109 06 055) 354 054 354 054
Total Undistributed Expenditures 428,049 {13,715) 414,334 413 816 518
Total School Based Budget Current Expense 1,119,196 8,109 1,127,305 1,106,882 20,423
TOTAL SCHOOL BASED EXPENDITURES 1,119 196 8,109 1,127,305 1,106,882 20,423
Other Financing Sources:
Operating Transfer In 1,119,196 8,109 1,127,305 I 106,882 20,423
Total Other Financing Sources: l,ll9,196 8,109 1,127,305 1,106,882 20,423
Excess (Deficinncy) of Other Financing Sources Over
(Under) Expenditures and Other Financing (Uses)
Fund Balance, Beginning of Year
Fund Balance, End of Year $ $ $ $ $
114

SPECIAL REVENUE FUND
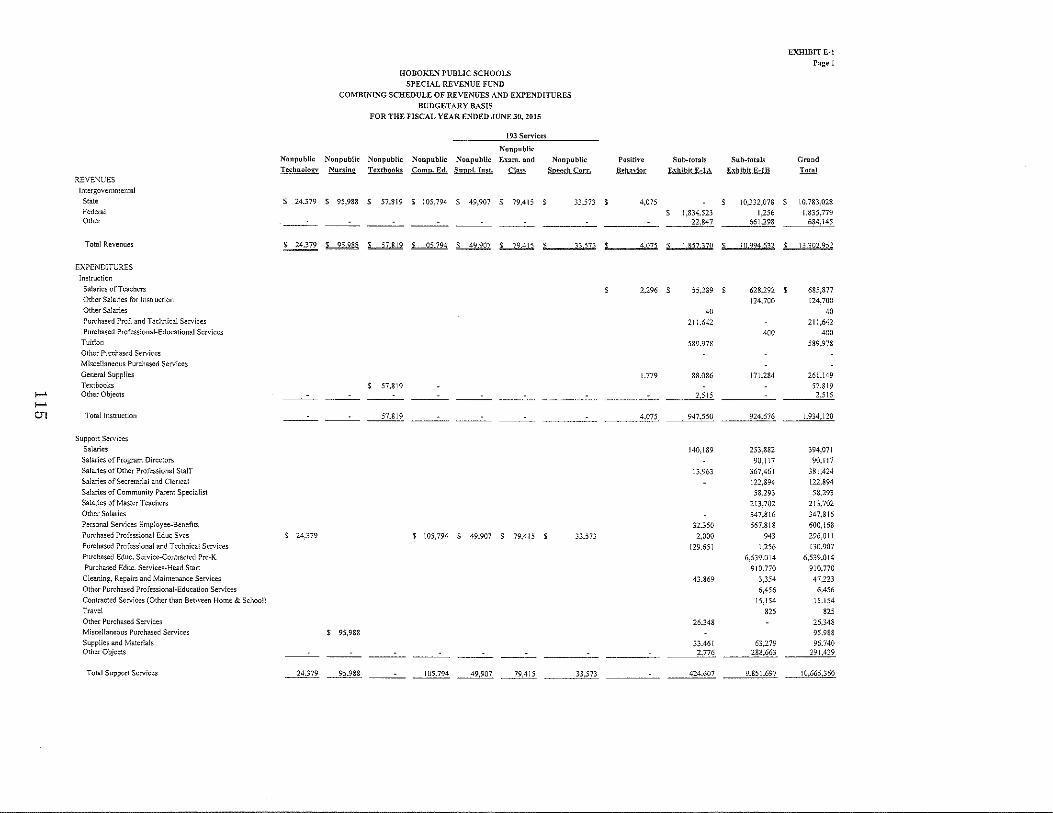
REVENUES Intergovernmental
State Federal Other
Total Revenues
EXPENDITURES Instruction
Salaries ofTeachers Other Salaries for Instruction Other Salaries
Purchased Prof. and Technical Services Purchased Professional-Educational Services
Tuition
Other Purchased Services Miscellaneous Purchased Services General Supplies
Textbooks J-lo Other Obje<;ts
>--' Ul Total Instruction
Support Services Salaries
Salaries of Program Directors Salaries of Other Professional Staff
Salaries of Secretarial and Clerical Salaries of Community Parent Specialist Salaries of Master Teachers
Other Salaries
Personal Services Employee-Benefits Purchased Professional Educ Svcs Purchased Professional and Technical Services
Purchased Educ. Service-Contracted Pre-K
Purchased Educ. Services-Head Start Cleaning, Repairs and Maintenance Services
Other Purchased Professional-Education Services
Contracted Services (Other than Between Home & School) Travel Other Purchased Services Miscellaneous Purchased Services Supplies and Materials Other Objects
Total Support Services
HOBOKEN PUBLIC SCHOOLS SPECIAL REVENUE FUND
COMBINI!\"G SCHEDULE OF REVENUES AND EXPENDITURES
BUDGETARY BASIS FOR THE FISCAL YEAR ENDED JUNE30, 2015
193 Sen·ices
Nonpublic Nonpubllc Non public Nonpublic Nonpublic Nonpnblic Exam. and Nonpublic Techno!Ql:y Nul"liin<> Textbooks Comp. Ed. Suppl. {nst. Class Speech Corr.
$ 24.379 $ 95.988 s 57.819 s 105.794 $ 49.907 $ 79.415 33.573
Positive Behavior
4.075
Sub-totals Sub-totals Exhibit E-lA Exhibit E-lB
1.834.523 22.847
10.332.078 1.256
661.2.98
EXHIBITE-1
Page 1
Grand Total
10.783.028 1.835.779
684,145
~ ~ ~ .s...J.ll.5...1 ~ ~ s 1)571 $ 4075 $ 1857)70 s !0994fi"n $ l)j0?9j?
57.819
-- ---- ---- ----
__fU_!2_
s 24.379 $ 105,794 $ 49,907 s 79,415 $ 33.573
$ 95,988
24.379 95.988 105.794 ~ ~ 33.573
2.296 s
1.779
4.075
55.289
40
211.642
589.978
88.086
2.515
947.550
140,189
13.963
32.350 2.000
129.651
43.869
26.348
33.461 2.776
424.607
628,292 $ 685,877
124.700 124.700
40
211.642 400 400
589,978
171.284 261.149 57,819
2.515 -
924.676 1.934.120
253.882 394.071
90.117 90.117
367.461 381,424 122.894 122.894
58.293 58.293
213.702 213.702
347.816 347.816
567.818 600.168
943 296.011
1.256 130.907
6,539,014 6,539,014 910.770 910,770
3.354 47.223
6.456 6.456
15,154 15.154
825 825 26.348 95.988
63.279 96.740 288.663 291.439
9.851.697 I 0,665,360

I-' I-'
0>
Transfer of Funds to SBB
Facilities Acquisition and Construction Serv.
Instructional Equipment l'oninstructional Equipment
Total Facilities Acquisitions and Construction Serv.
Total Expenditures
Excess (Deficiency} of Revenues and Other
Financing Sources Over/(Under) Expenditures
Other Financing Sources Transfer In- General Fund
HOBOKEN PUBLIC SCHOOLS SPECIAL REVENUE FUND
COMBINING SCHEDULE OF REVENUES AND EXPENDITURES
BUDGETARY BASIS FOR THE FISCAL YEAR ENDED JUNE 31), 21)15
193 Se..vices
Nonpublic Nonpublic Nonpublic Nonpublic Nonpublic Nonpublic Exam. and NonpubHc Technolo~Y Nursing Textbooks Comn. Ed. Suppl.lnst. .Qru Speech Corr .
--- --- --- ---- ---- ----
$ 24.379 ~ .L..1Z&.!.2.. $ 105.794 $ 49.907 $ 79.415 $ 33,573
_, ____ , ____ , ____ , --- _, ____ , ___ $
EXHIBITE-1 Page 2
Positive Sub-totals Sub-totals Grand Behavior Exhibit E-IA Exhibit E-lB I.ill.!
480.174 $ 480.174
5.039 5.039 $ 504.259 504.259 --
5.039 504.259 509.298
$ 4.075 1.857.370 1\.280.632 13.588.952
(286,000) (236,000)
$ $ $ 286.000 $ 236.000

EXHIBIT E-lA
Page 1
HOBOKEN PUBLIC SCHOOLS
SPECIAL REVENUE FUND
COMBINING SCHEDULE OF REVENUES AND EXPENDITURES
BUDGETARY BASIS
FOR THE FISCAL YEAR ENDED JUNE 30, 2015
I.D.E.A.
Part I.D.E.A.
Local B-Basic Part B- Title III
Donations FEMA Title I Reg. Prog. Preschool Title II A Title III Immigrant Subtotals
REVENUES
Intergovernmental
State
Federal $ 43,869 $ 697,092 $ 778,928 $ 18,894 $ 276,191 $ 13,420 s 6,129 $ 1,834,523 Other $ 22,847 ?2,847
Total Revenues $ 22,847 $ 43,869 $ 697,092 $ 778,928 $ 18,894 $ 276,191 $ 13,420 $ 6,129 $ 1,857,370
EXPENDITURES
Instruction
Salaries of Teachers $ 55,289 $ s 55,289
Other Salaries 40 40
Purchased Prof. and Tech. Services 5,263 $ 206,379 211,642
Tuition 571,084 $ 18,894 589,978
..... Other Purchased Services
..... General Supplies $ 7,112 63,064 $ 11,781 6,129 88,086
...:, Textbooks Other Objects 50 ___ 2_,IIO 355 2,515
Total Instruction 7£ 125,766 777,463 __ 1_8,894 12,136 6,129 947,550
Support Services
Salaries 129,874 $ 10,315 140,189
Salaries of Program Directors
Salaries of Other Professional Staff 13,963 13,963
Salaries of Seer. And Clerical Assis.
Other Salaries
Personal Services- Employee Benefits 30,493 1,857 32,350
Purchased ProfEduc Services 2,000 2,000
Purchased Prof. and Tech. Services 6,156 123,495 129,651
Cleaning, Repair and Maintenance Services $ 43,869 43,869
Travel
Other Purchased Services 25,064 1,284 26,348
Miscellaneous Purchased Services
Supplies and Materials $ 15,309 3,762 1,465 12,925 33,461 Other Objects 376 2,400 2,776
Total Support Services ·-L~A~-~. . _<j._3,869 1_?~,@-~ ····- .. _1_,_465 189,619 1,284 424,607

Facilities Acquisition and Construction Serv.
Instructional Equipment Noninstructional Equipment
Total Facilities Acquisitions and Construction Serv.
Transfer of Funds to SBB
Total Expenditures
Excess (Deficiency) of Revenues and Other
)--1. Financing Sources Over/(Under) Expenditures >--' 00 Other Financing Sources
Transfer In- General Fund
HOBOKEN PUBLIC SCHOOLS
SPECIAL REVENUE FUND
COMBINING SCHEDULE OF REVENUES AND EXPENDITURES
BUDGETARY BASIS
FOR THE FISCAL YEAR ENDED JUNE 30, 2015
Local Donations
$ 22,847
$
FEMA
43,869
$
Title I
5,039
5,039
$ 393,602
697,092
$
I.D.E.A.
Part I.D.E.A.
B-Basic
Reo. Proo.
778,928
$
Part BPreschool
18,894
$
Title II A Title III
$ 86,572
276,191 13.420
s $
Title III Immigrant
6,129
$
$
EXHIBIT E-lA
Page2
Subtotals Paoe2
5,039
5,039
480,174
---''"''857,370
s

EXHIBIT E-lB Page 1
HOBOKEN PUBLIC SCHOOLS SPECIAL REVENUE FUND
COMBINING SCHEDULE OF REVENUES AND EXPENDITURES BUDGETARY BASIS
FOR THE FISCAL YEAR ENDED JUNE 30, 2015
Hurricane NJ School Race to Sandy New Family Based Preschool
'"' Jersey Friendly Youth EduClltlon
I!lli Relief Fund Centers Sen•ices Aid Subtotals REVENUES
Intergovernmental State $ 45.463 $ 263.839 $ 10,022,776 $ I 0,332,078 Federal $ 1.256 1.256 Other $ 661,.298 66!.298
Total Revenues s I ~5§ ' 2~1 ?28 ! ~~ 4§1 I ?~j ~12 $ IQ Q~~ ZZ§ s 10.994.632
EXPENDITURES Instruction Salaries ofTeachers s 37.656 s 590.636 $ 628.292 Salaries of Seer. And Clerical Assistants Other Salaries for Instruction 124.700 124.700 Salaries for Pupil Transportation (Between Home
and School)- Non-Public Purchased Prof. and Tech. Services Purchased Professional-Educational Services 400 400
Other Purchased Services Miscellaneous Purchased Services General Supplies $ 128.804 1.089 41.391 171.284 Textbooks
I-' Other Objects I-'
<D Total Instruction 128.804 39.145 756.727 924.676
Support Services Salaries 6.318 $ 247.564 2.53.882 Salaries of Program Directors $ 90,117 90.117 Salaries of Supervisors of Instruction Salaries of Other Professional Staff 367.461 367.461 Salaries of Seer. and Clerical Assistants 122.,894 122.894 Other Salaries 347.816 347.816 Salaries of Community Parent Specialist 58.293 58.293 Salaries of Master Teachers 213,702 213.702 Personal Services- Employee Benefits 567,818 567.818 Purclmsed Professional Educational Services 943 943 Purchased Prof. and Tech. Services $ 1.256 1,256 Purchased Educ. Services-Contracted Pre-K 6.539,014 6.539.014 Purchased Educ. Services-Head Start 910,770 910.770 Other Purchased ProfTech. Services
Other Purchased Professional-Education Services 6.456 6.456 Other Purchased Professional Services Cleaning. Repairs and Maintenance Services 3.354 3.354 Co11tracted Services (Other than Between Home & School) 15,154 15.154 Travel 825 825 Other Purchased Services Supplies and Materials 28,235 898 34,146 63.279 Other Objects 14.434 274.229 288.663
Total Support Services 1.256 28.235 6.318 263.839 9.552..049 9.851.697

...... N 0
HOBOKEN PUBLIC SCHOOLS
SPECIAL REVENUE FUND
COMBINING SCHEDULE OF REVENUES AND EXPENDITURES BUDGETARY BASIS
Facilities Acquisition and Construction Serv.
Instructional Equipment Noninstructional Equipment Construction Services
Total Facilities Acquisitions and Construction Serv.
Transfer of Funds to SBB
Total Expenditures
Excess (Deficiency) of Revenues and Other
Financing Sources Over/(Under) Expenditures
Other Financing Sources Transfer In- General Fund
FOR THE FISCAL YEAR ENDED JUNE 30,2015
Hurricane NJ School Race Sandy New Family Based to the Je.-sey Friendly Youth
I2Il Relief Fund Centers Sen·ices
504.259
504.259
1.256 661,298 45.463 263.839
Preschool
Education
Aid
10.308.776
(286.000)
286.000 $
EXHIBIT E-IB Page 2
Subtotals
504.259
504.259
11,280.632
(286.000)
286.000

HOBOKEN PUBUC SCHOOLS SPECIAL REVENUE FUND
PRESCHOOL EDUCATION PROGRAM AID SCHEDULE OF EXPENDITURES PRESCHOOL- ALL PROGRAMS
BUDGETARY BASIS FOR THE FISCAL YEAR ENDED JUNE 30, 2015
EXPENDITURES Instruction Services Salaries of Teachers Other Salaries for Instruction General Supplies Other Objects
Total Instruction Services
Support Services
Salaries of Program Directors Salaries of Other Professional Staff Salaries of Seer. and Clerical Assistants Other Salaries Salaries of Community Parent Involvement Spec. Salaries of Master Teachers Personal Services -Employee Benefits Purchased Professional -Educational Services- Contracted Pre-K Purchased Professional - Educational Services- Head Start Other Purchased Professiona!-Ed Services Other Purchased Professional Services Cleaning, Repair and Maintenance Services Contracted Services (Other than Between Home and School) Travel Supplies and Materials Other Objects
Total Support Services
Facilities Acquisition and Construction Svcs.
Instructional Equipment Non-Instructional Equipment
Total Facilities Acquisition and Construction
Total Expenditures
Original Final Budget Adjustments Budget
$ 541,000 $ 80,719 $ 621,719 255,000 15,781 270,781 46,000 15,902 61,902
5,000 2,500 7,500
847,000 114,902 961,902
92,607 (2,490) 90,117 473,841 (106,380) 367,461 128,457 (1,832) 126,625 372,054 (8,793) 363,261
59,719 59,719 239,586 (18,319) 221,267 817,374 (249,556) 567,818
6,435,000 129,096 6,564,096 862,470 48,300 910,770 33,400 (9,711) 23,689
2,300 2,300 2,000 54,023 56,023 5,000 17,694 22,694 5,000 5,000
98,960 (54,183) 44,777 274,229 274,229
9,627,768 72,078 9,699,846
$ 10,474,768 $ 186,980 $ 10,661,748
Calculation of Budget Carrvover
Total2014-2015 Preschool Education Allocation Add: Actual ECPA Carryover (June 30, 2014)
Add: Prior Year Payables Cancelled
Actual
$ 590,636 124,700 41,391
756,727
90,117 367,461 122,894 347,816
58,293 213,702 567,818
6,539,014 910,770
6,456
3,354 15,154
825 34,146
274,229
9,552,049
$ !0,308,776
Add: Budgeted Transfer from the General Fund 2014-2015 Inclusion
Total Preschool Education Aid Funds Available for 2014-2015 Budget Less: 2014-2015 Budgeted Preschool Education Aid (Including
prior year budgeted carryover) Available & Unbudgeted Preschool Education Aid Funds as of June 30, 2015
Add: June 30, 20 I 5 Unexpended Preschool Education Aid 2014-2015 Actual Carryover- Preschool Education Aid
2014-2015 Preschool Education Aid Carryover Budgeted for Preschool Education in 2015-2016
121
EXHIBIT E-2
Variance Final
Budget to Actual
$ 31,083 146,081 20,511
7,500
205,175
3,731 15,445
1,426 7,565
25,082
17,233 2,300
52,669 7,540 4,175
10,631
147,797
$ 352,972
$ 10,295,424 1,549,946
62,945 286,000
12,194,315
10 661 748 1,532,567
352,972 $ 1,885,539
$ 1,532,567

HOBOKEN PUBLIC SCHOOLS SPECIAL REVENUE FUND
EARLY CHILDHOOD PROGRAM AID SCHEDULE OF EXPENDITURES PRESCHOOL- FULL DAY 3YR & 4YR- REGULAR
BUDGETARY BASIS FOR THE FISCAL YEAR ENDED JUNE 30, 2015
01·iginal Final Budget Adjustlncnt Budget
EXPENDITURES Instruction Salaries of Teachers $ 541,000 $ 80,719 $ 621,719 Other Salaries for Instruction 255,000 15,781 270,781 General Supplies 46,000 15,902 61,902 Other Objects 5,000 2 500 7,500
Total Instruction Services 847,000 114 902 961,902
Support Services
Salaries of Program Directors 92,607 (2,490) 90,117 Salaries of Other Professional Staff 473,841 (106,380) 367,461 Salaries ofSecr, and Clerical Assistants 128,457 (1,832) 126,625 Other Salaries 372,054 (8,793) 363,261 Salaries of Community Parent Involvement Spec. 59,719 59,719 Salaries of Master Teachers 239,586 (18,319) 221,267 Personal Services - Employee Benefits 817,374 (249,556) 567,818 Purchased Professional~ Educational Services~ Contracted Pre~K 6,435,000 129,096 6,564,096 Purchased Professional- Educational Services~ Head Start 862,470 48,300 910,770 Other Purchased Professional-Ed Services 33,400 (9,711) 23,689 Other Purchased Professional Services 2,300 2,300 Cleaning, Repair and Maintenance Services 2,000 54,023 56,023 Contracted Services (Other than Between Home and School) 5,000 17,694 22,694 Travel 5,000 5,000 Supplies and Materials 98,960 (54,183) 44,777 Other Objects 274 229 274,229
Total Support Services 9,627,768 72 078 9,699,846
Facilities Acquisition and Construction Svcs.
Instructional Equipment Noninstructional Equipment
Total Facilities Acquisition and Construction Svcs.
Total Expenditures $ 10,474,768 $ 186 980 $ 10,661,748
122
EXHIBIT E~2a
Variance Final Actual Budget to Actual
$ 590,636 $ 31,083 124,700 146,081 41,391 20,511
7 500
756,727 205 175
90,117 367,461 122,894 3,731 347,816 15,445
58,293 1,426 213,702 7,565 567,818
6,539,014 25,082 910,770
6,456 17,233 2,300
3,354 52,669 15,154 7,540
825 4,175 34,146 10,631
274,229
9,552,049 147 797
$ 10,308,776 $ 352 972

CAPITAL PROJECTS FUND

HOBOKEN PUBLIC SCHOOLS CAPITAL PROJECTS FUND
SUMMARY STATEMENT OF PROJECT EXPJ~NDITURES FROM INCEPTION AND FOR THE FISCAL YEAR ENDED JUNE 30, 2015
Issue/Project Title
Public School Capital Finance Act Loans for Construction, Renovation, Repair or Alterations of Public Schools
Public School Capital Finance Act Loans for Constmction, Renovation, Repair or Alterations of Public Schools
Original Date Appromiations
8/18/1993 $ 1,510,571
8/18/1993 2,602,000
Cancelled State Grant
Expenditures to Date PriorY ears Current Year
$ 1,510,571
2,602,000
EXHIBIT F-1
Balance, June 30. 2015
Lighting Upgrade Lease Purchase 1,000,000 955,070 ~$--"-'''-''''-''"o
sub-total Local Projects
Schools Development Authority- Educational Facilities Construction Aid
On-Beha1fPayments
A.J. Demarest M.S. 2210-0 I 0-00-0626 Hoboken H.S. 2210-005-00-0691 Hoboken H.S. 2210-005-03-0786
Hoboken H.S. 2210-005-05-0APR Joseph F. Brandt 2210-050-01-0782 Joseph F. Brandt 2210-050-00-0624
New Hoboken Elementary School221 0-NO I-03-0642 New Hoboken High School 221 O-N02-03-0643
New Hoboken Middle School 221 O-N03-03-0644 Salvatore R. Calabro, No. 4 E.S. 2210-063-00-0625
Salvatore R. Calabro, No. 4 E.S. 2210-063-01-0780 Thomas G. Cmmors 2210-065-00-0627 Thomas G. Connors 2210-065-0 1-07 83 Wallace No.6 E.S. 2210-070-01-0781 Wallace No. 6 B.S. 2210-070-00-0692 A.J. Demarest M.S. 2210-010-08-0FAC Brandt Middle School2210-050-08-0IAQ Hoboken High School2210-005-08-0FAD Wallace No.6 School2210-070-08-0IAR
sub-total On-Behalf SDA Payments
Direct Payments
A.J. Demarest M.S. 2210-010-08-0FAC-00
Brandt Middle Schooi2210-050-08-0IAQ-OO
Hoboken High School2210-005-08-0FAD-OO
Wallace No.6 School2210-070-08-0IAR Brandt Middle Schoo1221 0-050-12-1400
sub-total Direct SDA Payments
Total Expenditures
5,112,571 5,067,641
4,889,591 4,889,591 2,867,759 2,867,759 1,148,682 1,148,682
18,500 18,500 1,045,576 1,045,576 8,525,289 8,525,289
53,226 53,226 80,881 80,881
436,538 436,538 1,252,577 1,252,577
10,593,680 10,593,680 6,328,970 6,328,970 1,143,886 1,143,886 1,684,539 1,684,539 5,549,562 5,549,562
36,514 36,514 11,245 11,245 14,734 14,734 12,761 I2,761
45,694,510 45,694,510
948,345 932,344 $
620,374 $ 24,451 590,445
664,032 53,174 599,950
30,483 2,023 26,700 923,150
3,186,384 79,648 2,149,439
$ 53,993,465 $ 79,648 $ 52,911,590 $
Reconciliation of Fund Balance
Project Balances Interest Earning to be Utilized for Payment of Lease Purchase
Principal and Interest Less: Unearned SDA Grant Revenue
Total Fund Balance, June 30,2015 (GAAP Basis)
123
3,600
6,280
59,120
69,000
69000 $
$
$
44,930
12,401
5,478
4,628
1,760 864,030
888,297
933,227
933,227
81 (685,275)
248,033
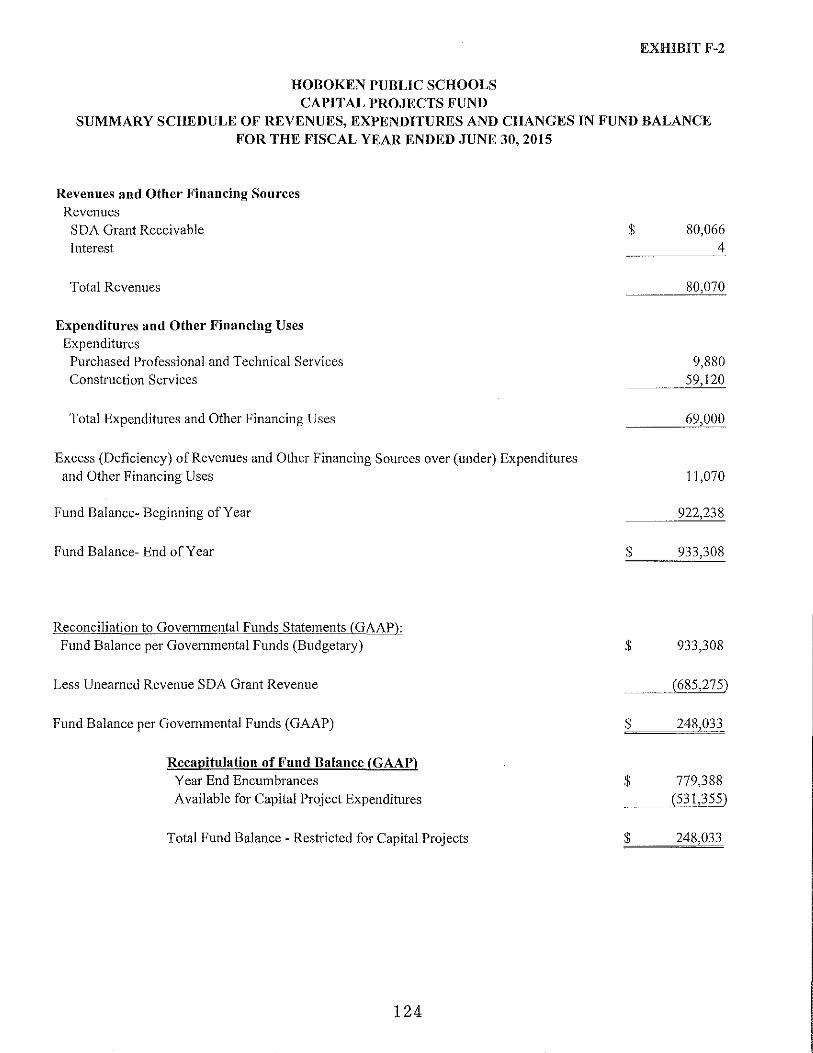
HOBOKEN PUBLIC SCHOOLS CAPITAL PROJECTS FUND
EXHIBIT F-2
SUMMARY SCHEDULE OF REVENUES, EXPENDITURES AND CHANGES IN FUND BALANCE FOR THE FISCAL YEAR ENDED JUNE 30, 2015
Revenues and Other Financing Sources Revenues
SDA Grant Receivable Interest
Total Revenues
Expenditures and Other Financing Uses Expenditures
Purchased Professional and Technical Services Construction Services
Total Expenditures and Other Financing Uses
Excess (Deficiency) of Revenues and Other Financing Sources over (under) Expenditures and Other Financing Uses
Fund Balance- Beginning of Year
Fund Balance- End of Year
Reconciliation to Governmental Funds Statements (GAAP): Fund Balance per Governmental Funds (Budgetary)
Less Unearned Revenue SDA Grant Revenue
Fund Balance per Governmental Funds (GAAP)
Recapitulation of Fund Balance (GAAP) Year End Encumbrances Available for Capital Project Expenditures
Total Fund Balance -Restricted for Capital Projects
124
$
$
$
$
$
$
80,066 4
80,070
9,880 59,120
69,000
I 1,070
922,238
933,308
933,308
(685,275)
248,033
779,388 (53 1,355)
248,033
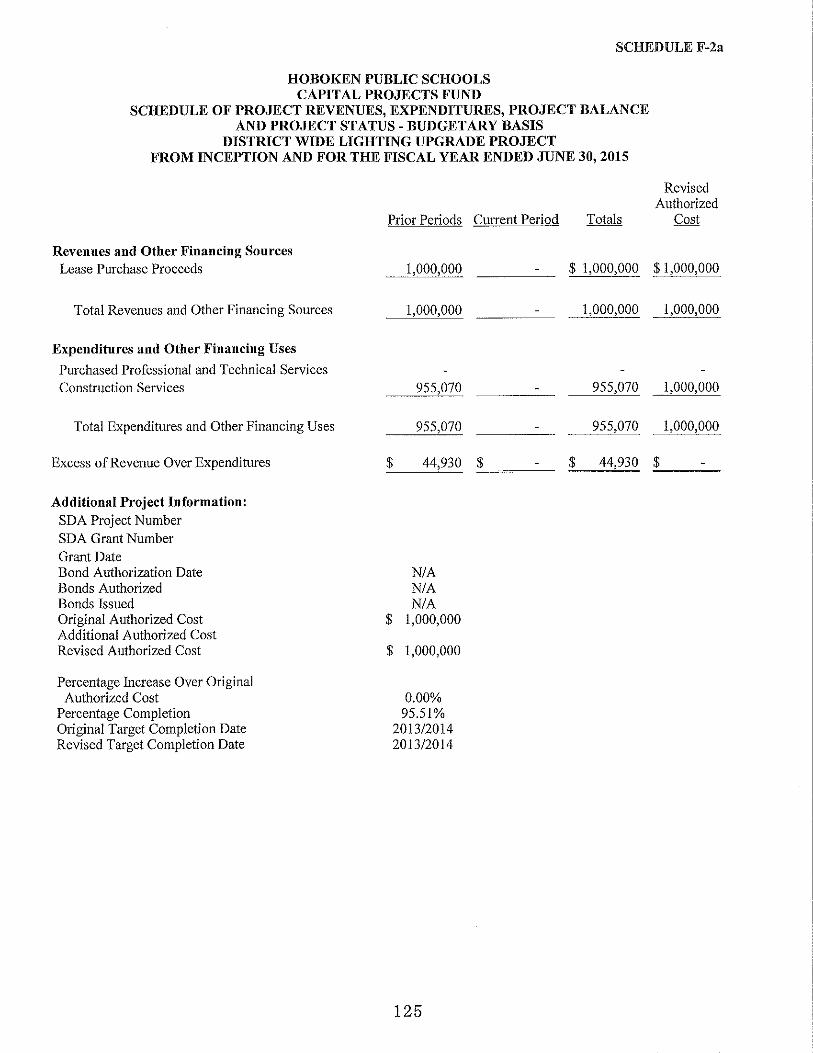
HOBOKEN PUBLIC SCHOOLS CAPITAL PROJECTS FUND
SCHEDULE F-2a
SCHEDULE OF PROJECT REVENUES, EXPENDITURES, PROJECT BALANCE AND PROJECT STATUS- BUDGETARY BASIS
DISTRICT WIDE LIGHTING UPGRADE PROJECT FROM INCEPTION AND FOR THE FISCAL YEAR ENDED JUNE 30, 2015
Revenues and Other Financing Sources Lease Purchase Proceeds
Total Revenues and Other Financing Sources
Expenditures and Other Financing Uses
Purchased Professional and Technical Services Construction Services
Total Expenditures and Other Financing Uses
Excess of Revenue Over Expenditures
Additional Project Information: SDA Project Number SDA Grant Number Grant Date Bond Authorization Date Bonds Authorized Bonds Issued Original Authorized Cost Additional Authorized Cost Revised Authorized Cost
Percentage Increase Over Original Authorized Cost
Percentage Completion Original Target Completion Date Revised Target Completion Date
Prior Periods Current Period
$
$
$
1,000,000
1,000,000
955,070
955,070
44,930 ~$ ~~~
N/A N/A N/A
1,000,000
1,000,000
0.00% 95.51%
2013/2014 2013/2014
125
Revised Authorized
Cost
$ 1,000,000 $ 1,000,000
1,000,000 1,000,000
955,070 1,000,000
955,070 1,000,000
$ 44,930 ~$ ~~~

SCHEDULE F-2b
HOBOKEN PUBLIC SCHOOLS CAPITAL PROJECTS FUND
SCHEDULE OF PROJECT REVENUES, EXPENDITURES, PROJECT BALANCE AND PROJECT STATUS- BUDGETARY BASIS
A.J. DEMAREST MIDDLE SCHOOL-EVALUATION OF EXISTING HVAC SYSTEM AND ROOFING CONDITIONS
FROM INCEPTION AND FOR THE FISCAL YEAR ENDED JUNE 30, 2015
Revenues and Other Financing Sources State Sources-SDA Grant
Total Revenues and Other Financing Sources
Expenditures and Other Financing Uses
Purchased Professional and Technical Services
Construction Services
Total Expenditures and Other Financing Uses
Excess (Deficit) of Revenue Over Expenditures
Additional Project Information: SDA Project Number SDA Grant Number Grant Date Bond Authorization Date Bonds Authorized Bonds Issued Original Authorized Cost Additional Authorized Cost Revised Authorized Cost
Percentage Increase Over Original Authorized Cost
Percentage Completion Original Target Completion Date Revised Target Completion Date
Prior Periods Current Period
$ 948,345
948,345
17,680 $
914,664
932,344
3,600
3,600
Revised Authorized
Cost
$ 948,345 $ 948,345
948,345
21,280
914,664
935,944
948,345
21,280
927,065
948,345
$ 16,001 ~$ ~.d(;;;,3,;;,:60~0) $ 12,401 ;:;..$ ~~~
2210-010-08-0FAC GB-0168-DOI
2010 N/A N/A NIA
$ 15,000 $ 917,028 $ 948,345
0.00% 94% N/A
2014/2015
126

HOBOKEN PUBLIC SCHOOLS CAPITAL PROJECTS FUND
SCHEDULE F-2c
SCHEDULE OF PROJECT REVENUES, EXPENDITURES, PROJECT BALANCE AND PROJECT STATUS- BUDGETARY BASIS
JOSEPH F. BRANDT NO. 2 MIDDLE SCHOOL- EVALUATION OF EXISTING HVAC SYSTEM AND ROOFING CONDITIONS
FROM INCEPTION AND FOR THE FISCAL YEAR ENDED JUNE 30, 2015
Revenues and Other Financing Sources State Sources-SDA Grant
Total Revenues and Other Financing Sources
Expenditures and Other Financing Uses
Purchased Professional and Technical Services
Construction Services Cancelled SDA Grant Receivable
Total Expenditures and Other Financing Uses
Excess (Deficit) of Revenue Over Expenditures
Additional Project Information: SDA Project Number SDA Grant Number Grant Date Bond Authorization Date Bonds Authorized Bonds Issued Original Authorized Cost Additional Authorized Cost Revised Authorized Cost
Percentage Increase Over Original Authorized Cost
Percentage Completion Original Target Completion Date Revised Target Completion Date
Prior Periods Current Period Totals
Revised Authorized
Cost
$ 598,103
598,103
12,280
578,165 2,180
592,625
$ 5,478 $
2210-050-08-01AQ GB-0169-D01
2010 NIA NIA NIA
$ 620,374 $ (22,271) $ 598,103
0.00% 99% NIA
2012/2013
127
$598,103 $ 598,103
598,103 598,103
12,280 12,280
578,165 585,823 2,180
592,625 598,103
$ 5,478 $

SCHEDULE F-2d
HOBOKEN PUBLIC SCHOOLS CAPITAL PROJECTS FUND
SCHEDULE OF PROJECT REVENUES, EXPENDITURES, PROJECT BALANCE AND PROJECT STATUS- BUDGETARY BASIS
HOBOKEN HIGH SCHOOL-EVALUATION OF EXISTING CURTAIN WALL SYSTEM FROM INCEPTION AND FOR THE FISCAL YEAR ENDED JUNE 30, 2015
Revenues and Other Financing Sources State Sources-SDA Grant
Total Revenues and Other Financing Sources
Expenditures and Other Financing Uses
Purchased Professional and Technical Services Construction Services Cancelled SDA Grant Receivable
Total Expenditures and Other Financing Uses
Excess (Deficit) of Revenue Over Expenditures
Additional Project Information: SDA Project Number SDA Grant Number Grant Date Bond Authorization Date Bonds Authorized Bonds Issued Original Authorized Cost Additional Authorized Cost Revised Authorized Cost
Percentage Increase Over Original Authorized Cost
Percentage Completion Original Target Completion Date Revised Target Completion Date
Prior Periods Current Period
Revised Authorized
Cost
$ 664,032
664,032
81,180 $ 518,770
53,174
653,124
$ 10,908 $
221 0-005-08-0F AD GB-0170-DOl
2010 N/A N/A N/A
$ 15,000 $ 649,032 $ 664,032
2.31% 99.30%
2011/2011 2011/2011
128
$ 664,032 $ 664,032
664,032 664,032
6,280 87,460 87,460 518,770 576,572
53,174
6,280 659,404 664,032
(6,280) $ 4,628 $

HOBOKEN PUBLIC SCHOOLS CAPITAL PROJECTS FUND
SCHEDULE F-2e
SCHEDULE OF PROJECT REVENUES, EXPENDITURES, PROJECT BALANCE AND PROJECT STATUS- BUDGETARY BASIS
WALLACE NO.6 ELEMENTARY SCHOOL-REVIEW OF ELECTRICAL SERVICE INTERRUPTION AND ROOFING CONDITIONS
FROM INCEPTION AND FOR THE FISCAL YEAR ENDED JUNE 30, 2015
Revenues and Other Financing Sources State Sources-SDA Grant
Total Revenues and Other Financing Sources
Expenditures and Other Financing Uses
Purchased Professional and Technical Services Construction Services Cancelled SDA Grant Receivable
Total Expenditures and Other Financing Uses
Excess (Deficit) of Revenue Over Expenditures
Additional Project Information: SDA Project Number SDA Grant Number Grant Date Bond Authorization Date Bonds Authorized Bonds Issued Original Authorized Cost Additional Authorized Cost Revised Authorized Cost
Percentage Increase Over Original Authorized Cost
Percentage Completion Original Target Completion Date Revised Target Completion Date
Prior Periods Current Period Totals
Revised Authorized
Cost
$ 30,483
30,483
6,960 19,740 2,023
28,723
$ 1,760 $
2210-070-08-01 AR GB-0171
2010 NIA N/A NIA
$ 15,000 $ 15,483 $ 30,483
0.00% 94% NIA
2012/2013
129
$ 30,483 $ 30,483
30,483 30,483
6,960 6,960 19,740 23,523 2,023
28,723 30,483
$ 1,760 $

HOBOKEN PUBLIC SCHOOLS CAPITAL PROJECTS FUND
SCHEDULE F-2f
SCHEDULE OF PROJECT REVENUES, EXPENDITURES, PROJECT BALANCE AND PROJECT STATUS- BUDGETARY BASIS
JOSEPH F. BRANDT SCHOOL-REHABILITATION: BUILDING ENVELOPE- EXTERIOR MASONRY REPAIR
FROM INCEPTION AND FOR THE FISCAL YEAR ENDED JUNE 30, 2015
Revenues and Other Financing Sources State Sources-SDA Grant
Total Revenues and Other Financing Sources
Expenditures and Other Financing Uses
Purchased Professional and Technical Services Construction Services
Total Expenditures and Other Financing Uses
Excess (Deficit) of Revenue Over Expenditures
Additional Project Information: SDA Emergent Project Number SDA Grant Number Grant Date Bond Authorization Date Bonds Authorized Bonds Issued Original Authorized Cost Additional Authorized Cost Revised Authorized Cost
Percentage Increase Over Original Authorized Cost
Percentage Completion Original Target Completion Date Revised Target Completion Date
Prior Periods Current Period Totals
Revised Authorized
Cost
$ 843,084 $
843,084
$ 843,084 $
2210-050-12-1400 GB-0222
2015 NIA N/A NIA
$ 864,365 $ 58,785 $ 923,150
0.00% 6%
2014/2015 2015/2016
130
80,066 $923,150 $ 923,150
80,066 923,150 923,150
59,120 59,120 923,150
59,120 59,120 923,150
20,946 $ 864,030 :::.$~~~

ENTERPRISE FUND

ASSETS
Cash
Total Assets
LIABILITIES
Current Liabilities Due to Other Funds Accounts Payable
Total Current Liabilities
NET POSITION
Unrestricted
Total Net Position
HOBOKEN PUBLIC SCHOOLS ENTERPRISE FUNDS- NON-MAJOR
STATEMENT OF NET POSITION FOR THE FISCAL YEAR ENDED JUNE 30, 2015
131
EXHIBITG-1
Non-Major Enterprise Funds
$
$
After Care Program
73,066
73,066
460
460
72,606
72,606

HOBOKEN PUBLIC SCHOOLS ENTERPRISE FUND -NON-MAJOR
STATEMENT OF REVENUES, EXPENSES AND CHANGES IN NET POSITION
FOR THE FISCAL YEAR ENDED JUNE 30, 2015
OPERATING REVENUES Charges for Services
Program Fees
Total Operating Revenues
OPERATING EXPENSES Salaries and Employee Benefits Supplies and Materials
Total Operating Expenses
Operating Income
Change in Net Position
Total Net Position, Beginning of Year
Total Net Position, End of Year
132
EXHIBIT G-2
Non-Major Enterprise Fund
$
$
After Care Program
140,141
140,141
113,431 460
113,891
26,250
26,250
46,356
72,606

HOBOKEN PUBLIC SCHOOLS ENTERPRISE FUND- NON-MAJOR
STATEMENT OF CASH FLOWS FOR THE FISCAL YEAR ENDED JUNE 30, 2015
Cash Flows from Operating Activities Cash Received from Customers Cash Payments for Employees
Salaries & Benefits Cash Payments to Suppliers for Goods
and Services
Net Cash Provided by Operating Activities
Net Increase in Cash
Cash , Beginning of Year
Cash, End of Year
Reconciliation of Operating Income to Net Cash Provided by Operating Activities Operating Income
Adjustments to Reconcile Operating Income to Net Cash Provided by Operating Activities
Increase/(Decrease) in Due to Other Funds Increase/(Decrease) in Accounts Payable
Total Adjustments
Net Cash Provided by Operating Activities
133
EXHffiiTG-3
Non-Major Enterprise Fnnd
$
$
$
$
After Care Program
140,141
(113,431)
26,710
26,710
46,356
73,066
26,250
460
460
26,710

FIDUCIARY FUNDS

HOBOKEN PUBLIC SCHOOLS FIDUCIARY FUNDS
COMBINING STATEMENT OF AGENCY ASSETS AND LIABILITIES AS OF JUNE 30, 2015
Agency Student Activity Payroll
ASSETS
Cash $ 102,721 $ 267,267 Prepaid Items 722
Total Assets $ 102,721 $ 267,989
LIABILITIES
Liabilities Accrued Salaries and Wages (Deficit) $ (3,885) Payroll Deductions and Withholdings Payable 263,548 Due to Other Funds 8,326 Due to Student Groups $ 102,721
Total Liabilities $ 102,721 $ 267,989
134
EXHIBIT H-1
Total
$ 369,988 722
$ 370,710
$ (3,885) 263,548
8,326 102,721
$ 370,710
HOBOKEN PUBLIC SCHOOLS FIDUCIARY FUNDS
COMBINING STATEMENTS OF CHANGES IN FIDUCIARY NET POSITION FOR THE FISCAL YEAR ENDED JUNE 30, 2015
NOT APPLICABLE
135
EXHIBIT H:-2

Elementary Schools Wallace School Salvatore R. Calabro School Thomas G. Connors
Total Elementary Schools
High School General Activity Fund/Athletic
Total High School
Total
HOBOKEN PUBLIC SCHOOLS STUDENT ACTIVITY AGENCY FUND
SCHEDULE OF RECEIPTS AND DISBURSEMENTS FOR THE FISCAL YEAR ENDED JUNE 30, 2015
Balance, Cash July l, 2014 Receipts
$ 1,535 533
80 $ 6,228
2,148 6,228
92,573 113,826
92,573 113,826
$ 94,721 $ 120,054
136
EXHIBIT H-3
Cash Balance, Disbursements June 30, 2015
$ 1,535 533
$ 6,296 12
6,296 2,080
105,758 100,641
105,758 100,641
$ 112,054 $ 102,721

Due to/(From) Other Funds Payroll Deductions and Withho1dings Accrued Salaries and Wages (Deficit) Reserve for Flexible Spending
Total
HOBOKEN PUBLIC SCHOOLS PAYROLL AGENCY FUND
SCHEDULE OF RECEIPTS AND DISBURSEMENTS FOR THE FISCAL YEAR ENDED JUNE 30, 2015
Balance, Cash July 1, 2014 Receipts
$ 441,059 $ 2,544,819 272,970 14,957,154
(3,540) 15,569,325 18,050
$ 710,489 $ 33,089,348
137
EXHIBIT H-4
Cash Balance, Disbursements June 30, 2015
$ 2,977,552 $ 8,326 14,966,576 263,548 15,569,670 (3,885)
18,050
$ 33,531,848 $ 267,989
LONG-TERM DEBT

HOBOKEN PUBLIC SCHOOLS LONG TERM DEBT
SCHEDULE OF BONDS PAYABLE FOR THE FISCAL YEAR ENDED JUNE 30, 2015
NOT APPLICABLE
138
EXHIBIT 1-1
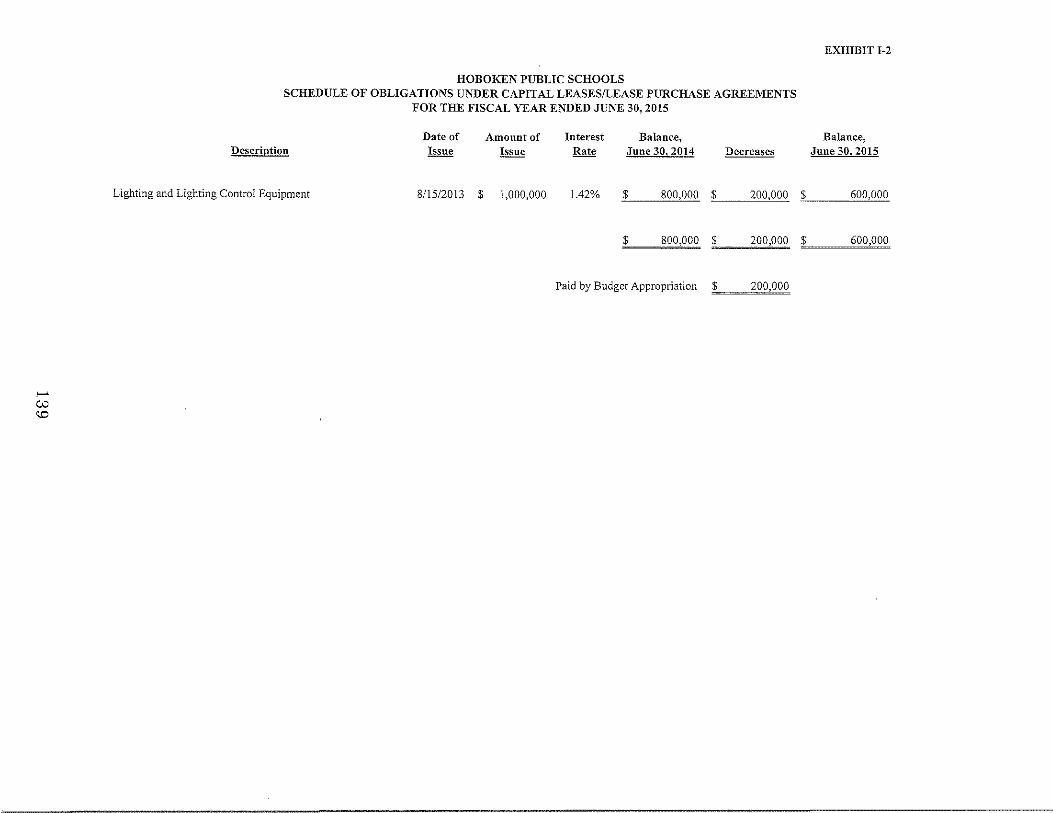
I-' 00
"'
HOBOKEN PUBLIC SCHOOLS SCHEDULE OF OBLIGATIONS UNDER CAPITAL LEASES/LEASE PURCHASE AGREEMENTS
FOR THE FISCAL YEAR ENDED JUNE 30, 2015
Date of Amount of Interest Balance, Description Issue Issue Rate June 30, 2014 Decreases
Lighting and Lighting Control Equipment 8/15/2013 $ 1,000,000 1.42% $ 800,000 $ 200,000
$ 800,000 $ 200,000
Paid by Budget Appropriation 200,000
EXHIBIT I-2
Balance, June 30, 2015
$ 600,000
$ 600,000

>-'
""" 0
HOBOKEN PUBLIC SCHOOLS LONG-TERM DEBT
SCHEDULE OF LOANS PAYABLE FOR THE FISCAL YEAR ENDED JUNE 30, 2015
NOT APPLICABLE
EXHIBIT 1-3
HOBOKEN PUBLIC SCHOOLS DEBT SERVICE FUND
BUDGETARY COMPARISON FOR THE FISCAL YEAR ENDED JUNE 30, 2015
NOT APPLICABLE
141
EXHIBIT 1-4

STATISTICAL SECTION
This part of the Hoboken Board of Education's comprehensive annual financial report presents detailed information as a context for understanding what the information in the financial statements, note disclosures, and required supplementary information says about the government's overall financial health.
Contents
Financial Trends
These schedules contain trend information to help the reader understand how the government's financial performance and well-being have changed over time.
Revenue Capacity
These schedules contain information to help the reader assess the government's most significant local revenue source, the property tax.
Debt Capacity
These schedules present information to help the reader assess the affordability of the government's current levels of outstanding debt and the government's ability to issue additional debt in the future.
Demographic and Economic Information
These schedules offer demographic and economic indicators to help the reader understand tl)e environment within which the government's financial activities take place.
Operating Information
These schedules contain service and infrastructure data to help the reader understand how the information in the government's financial report
Exhibits
J-1 to J-5
J-6 to J-9
J-10 to J-13
J-14 and J-15
relates to the services the government provides and the activities it performs. J-16 to J-20
Sources: Unless otherwise noted, the information in these schedules is derived from the comprehensive annual financial reports for the relevant year.
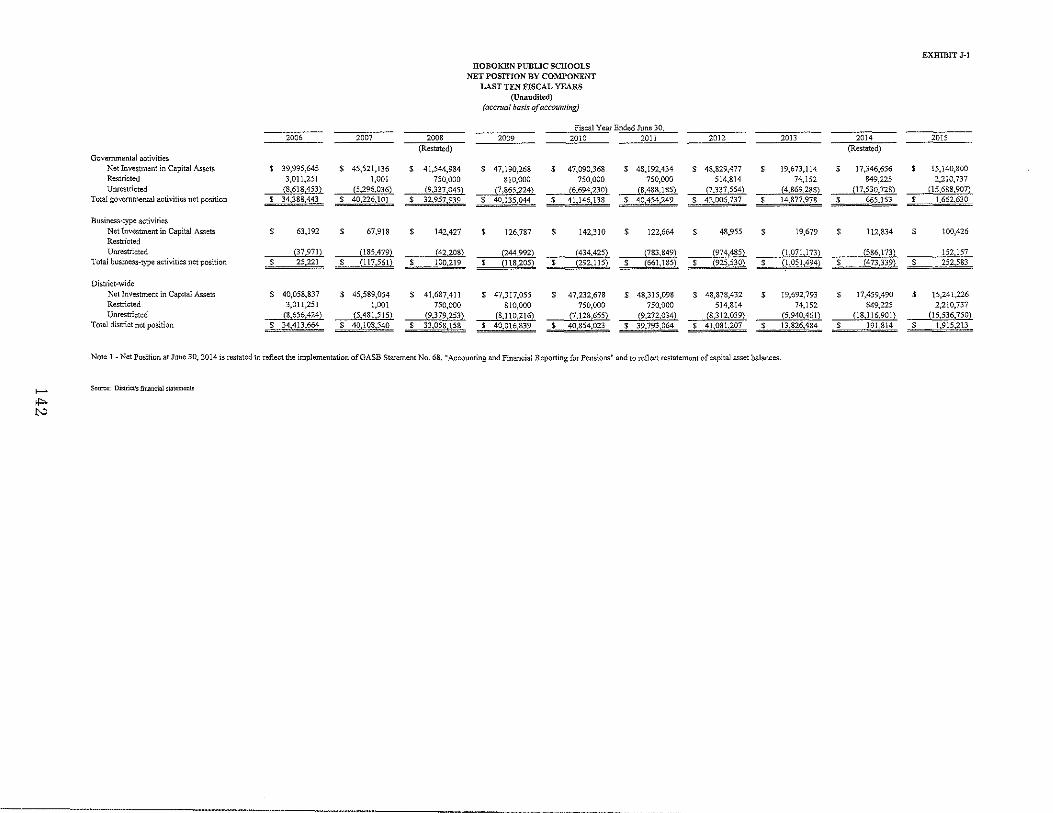
...... II'> N
HOBOKEN PUBLIC SCHOOLS NET POSITION BY COMPONENT
LAST TEN FISCAL YEARS (Unaudited)
(accroa/ basis of accounting)
Fiscal Year Ended June 30, -~ 2007 2008 2009 2010 2011 2012 2013
(Restated) Governmental activities
Net Investment in Capital Assets $ 39,995,645 $ 45,521,136 $ 41,544,984 $ 47,190,268 $ 47,090,368 $ 48,192,434 s 48,829,477 $ 19,673,114 Restricted 3,011,251 1,001 750,000 810,000 750,000 750,000 514,814 74,152 Unrestricted (8,618!453) (5,296,036) (9,337,045) (7,865,224) (6,694,230) (8,488, 185) (7.337,5542 (4,869,288}
Total governmental activities net position $ 34,388,443 _s; 1Q,226,101 Si _3_~,\:1?_7_,2l2_ $ 40,]35,044 $ 41,146,138 $ 40,454,249 s 42,006,7}7 $ 1:1.~?7._~78
Business-type activities Net Investment in Capital Assets $ 63,192 s 67,918 $ 142,427 $ 126,787 s 142,310 $ 122,664 s 48,955 $ 19,679 Restricted Unrestricted (37,971) (185,479) (42 208) (244,992} (434,425) (783,849) (974,485) (1,07U73}
Total business-type activities net position $ 25,221 $ (117,561} $ 100,219 $ (118,205) $ (292,115) s (661,185) $ (925,530) $ {1,051,494)
District-wide Net Investment in Capital Assets $ 40,058,837 $ 45,589,054 $ 41,687,411 $ 47,317,055 $ 47,232,678 $ 48,315,098 $ 48,878,432 $ 19,692,793 Restricted 3,011,251 1,00] 750,000 810,000 750,000 750,000 514,814 74,152 Unrestricted (8,656,424) (5,481,515) (9,379,253) (8,!10,216) (7,128,655) (9,272,034) (8,312,039) (5,940,461)
Total district net position $ 34,413 664 $ 40 108 540 $ 33,058 158 $ 40,016,839 -$ --- 40,854,():~;3_- $ 39,793,_()~-- $ -1:1,081,207 $ 13,826,484
Note 1 -Net Position at June 30, 2014 is restated to reflect the implementation ofGASB Statement No. 68, "Accounting and Financial Reporting for Pensions" and to reflect restatement of capital asset balances.
Source: Disuict's financial statements
EXHIBIT J-1
2014 2015
(Restated)
$ 17,346,656 $ 15,140,800 849,225 2,210,737
(17530,728} (15 688,907) $ __ ___§_65,153 $ 1,662,630
$ 112,834 $ 100,426
(586,173} 152,157 $ (473,339) $ 252,583
$ 17,459,490 $ 15,241,226 849,225 2,210,737
{18.116,901) (15,536,750) $ 191,814 $ 1,91,5,213

EXHffiiT J-2
HOBOKEN PUBLIC SCHOOLS CHANGES IN NET POSITION
LAST TEN FISCAL YEARS (Unaudited)
(accn~af basis of accounting)
Fiscal Year Ended June 30,
lQQ§_____ 2007 2008 2009 2010 2011 2012 ___ 2.013 2.014 2015
Expenses Governmental activities
Instruction Regular $ 16,632,659 $ 22,434,017 ' 26,549,093 $ 25,275,975 $ 28,384,653 $ 28,844,002 $ 29,461,070 $ 31,452,283 $ 32,250,508 $ 35,297,094 Special education 3,883,020 5,558,549 6,588,100 5,200,818 6,428,338 6,608,002 7,256,560 7,704,906 6,62.8,785 7,567,897 Other special education 473,235 Other instruction 838,857 486,386 576,634 439,467 793,236 507,227 391,025 377,032 115,067 95,316 School Sponsored Activities and Athletics 1,4ll,411 1,557,039 1,181,554 1,305,913 1,286,586 1,284,573 1.196,697 1,079,547 1,379,540 Adult ContillUing Education 84,451 72,996 203,062 194,604 149,219 215,509 111,956 4,883
Support Services: Tuition 872,407 Student & instroction related services 12,488,974 9,783,809 12,500,371 11,665,895 8,642,936 10,047,684 9,612,865 9,517,130 10,209,494 11,383,511 School administrative services 2,423,233 1,509,025 1,624,710 1,058,298 3,252,194 2,611,085 2,362,057 2,183,241 2,327, 720 2,691,487 General administrative services 1,684,758 2,025,964 2,045,647 1,961,797 1,82.6,507 1,582,886 1,255,631 1,013,937 913,777 1,040,516 Plant operations and maintenance 7,187,236 7,423,023 8,165,353 7,248,281 6,652,937 6,610,137 6,337,611 7,843,598 7,467,784 8,838,717 Central and other support services 1,095,308 887,778 970,882 617,419 1,200,727 1,179,722 942,232 969,084 1,073,621 1,023,391 Pupil transportation 1,543,476 1,485,719 1,781,575 1,520,871 1,574,379 1,670,164 1,659,517 1,524,452 1,551,318 1,438,187
Special Schools 221,408 Charter Schools 3,777,889 2,872,596 Interest on long-term debt 112,523 119,472 59 759 50,741 41 408 31,733 21,698 17,824 12,001 8 689
Total governmental activities expenses 53,234,983 56,082 200 62492159 56,424,178 60,297 832 61,128,447 60 800,348 63,912,140 63,634,505 7QJ64,345
1---l Business-type activities:
fP:.. Food service 1,215,367 1,246,906 1,067,242 1,301,220 1,293,551 968,736 871,727 1,074,759 1,023,661 1,033,361 After Care 107 378 113 891
00 Total business-type activities expense 1215 367 1246.906 I 067 242 1301.220 1,293,551 968,736 871 727 1,074,759 1,131,039 I 147,252 Total district expenses $ 54,450 350 $ 57,329 106 $ 63 559 401 $ 57 725,398 $ 61,591,383 ' 62,097,183 $ 61,672,075 $ 64,986,899 $ 64,765,544 $ 71,911,597
Program Revenues Governmental activities:
Charges for services: Instruction $ 520,539 ' 442,111 $ 424,848 $ 384,930 $ 263,215 $ 432,095 $ 316,516 $ 100,636 ' 73,500 Support Services 980,117 289,568 315,722 369,537 337,344 576,855
Operating Grants and Contributions $ 18,051,448 17,855,925 18,139,548 15,236,370 16,121,194 16,288,055 18,711,728 21,080,906 20,604,088 25,820,471 Capital grants and contributions 5,366 115 118,852 5 505,504 517 006 1,746,672 373,106 31316 222 875
Total governmental activities program revenues 18,051,448 23 742,579 18,700,511 21 166,722 18,003 247 18 587,510 19,832,651 21 766,959 21,073,384 2_§,693,701
Business-type activities:
Charges for services Food service 110,708 115,360 136,453 108,605 151,984 124,967 171,199 191,564 247,331 227,255 After Care Program 153,734 140,141
Operating grants and contributions 633,562 602,227 632,248 574,191 633,414 474,699 500,209 632,231 641,072 611,558 Capital grants and contributions 28,417
Total business type activities program revenues 744 270 717587 768 701 682 796 813,815 599 666 671,408 823,795 1,042,137 978,954 Total district program revenues $ 18,795,718 ' 24,460,166 $ 19,469,212 $ 21,849,518 ' 18 817,062 $ 19,187,176 $ 20,504,059 $ 22,590,754 $ 22,115,521 $ 27,672,655
Net (Expense)/Revenue Governmental activities $ (35,183,535) $ (32,339,621) $ (43,791,648) $ (35,257,456) ' (42,294,585) $ (42,540,937) s (40,967,697) s (42,145,181) $ (42,561,121) $ (44,070,644) Business-type activities (471,0972 {529,3192 {298,5412 {618,424} (479,7362 (369,070) (200,319) (250,964) (88,9022 (168,298) Total district-wide !lei expense $ (35,654,632) $ (32,868,9_~0_}_ ___1___i±t_,_()_?_()._!_lli_ _ s m_&!'~.-~o) $ __ (1b774,321) $ (42,910,007) $ (4_1_,_1__()8,016) _$_(4~,396,145) $ (42,(55Q,Q23) ~- ill-,238,942)

EXHIBIT J-2 HOBOKEN PUBLIC SCHOOLS CHANGES IN NET POSITION
LAST TEN F1SCAL YEARS (Unaudited)
(accrual basis of accouming)
.. _Fiscal Yea:r Ended June 30,
--~ 2007 2008 2009 2010 2011 2012 ___ 2013 2014 2015
General Revenues and Other Changes in Net Positi!ln Governmental activities:
Property taxes levied for general purposes, net s 31,750,000 $ 33,450,000 $ 34,700,000 $ 36,073,367 $ 36,764,796 $ 36,761,743 $ 36,758,684 $ 36,755,753 $ 38,220,173 $ 39,426,390 Investment earnings 27,9'22. Miscellaneous income 650,015 253,391 420,182 544,585 227,433 420,331 140,773 521,799 145,613 155,805 Tuition received 606,075 Federal & State aid not received (6,221) Federal & State aid not restricted 4,254,659 4,809,712 5,069,308 6,216,609 6,619,276 4,666,974 6,235,078 5,437,678 6,048,614 6,308,459 Special item Accounts receivable canceled Various special items NJ EDA Projects Completed (Non-Cash) Adjustment to fixed asset inventory (285,035) Credit from stale facilities loans payable Transfers (833,333) (386,537) (425,000) (305,826) (482,960) (822,533) Miscellaneous adjustment {6,467)
Total governmental activities 36 157 615 38,126,566 39 764 490 42,834 561 43,305,679 41 849,048 43,134,535 42,715,230 43,931,440 45,0@)21
Business-type activities Miscellaneous income 125,000 81,259 71,687 Transfers 833,333 386 537 425,000 305 826 482,960 822 533
Total business-type activities 833,333 386,537 425,000 305,826 125,000 564 219 894,'22.0 1--' Total district-wide $ 36,990,948 $ 38,5p,J()3- $ 4(),.!_?9,490 $ 42,834,561 $ 43,611,505 $ 41,849,048 s 43,134,535 $ 4~,_840,239 $ 4:!_,495,659 s 45,962,341
t Change in Net Position Governmental activities $ 974,080 $ 5,786,945 s (4,027,158) $ 7,577,105 $ 1,011,094 $ (691,889) $ 2,166,838 $ 570,049 $ 1,370,319 $ 997,477 Business-type activities 362 236 (142,7822 126 459 (618,424) (173,910) (369,070) (200,319) (125.964) 475,317 725 922 Total district $ 1,336,316 $ 5 644,163 $ (3,900,699) $ 6 958,681 $ 837,184 $ (1,060,959) $ 1,966,519 ' 444,085 s 1,_~4_5,636 $ 1,723,399
Sour=. Di•lriot's financial statements

...... """ 01
HOBOKEN PUBLIC SCHOOLS FU~~BALANCES-GOVERNMENTALFUNDS
LAST TEN FISCAL YEARS (Unaudited)
(modified accntal bt1$iS of accounting)
Fiscal Year Ended June 30, -2006 2007 2008 2009 2010
General Fund Reserved $ 3,272,640 ' 2,326,479 $ 2,341,713 $ 1,924,576 $ 1,695,143 Unreserved 662,020 564,771 1,029,001 940,462 1,735,257 Restricted $ Committed Assigned Unassigned 662,020 564,771 1,029,001 940,462 1,735,257
Total general fund $ 4,596 680 $ 3,956,021 $ 4,399,720 $ 3,805,500 $ 5,165,657 $
All Other Governmental Funds Reserved $ '237,729 $ ' 5$4 ' 537,758 Unreserved 62,021 261,824 165,435 225,989 (263,860) Restricted Unassigned
Total all other governmental funds $ 299,750 $ 261,824 $ 165,989 $ 225,989 $ 273,898 $
Beginning with Fiscal Year lOll, the District implemented GASB Statement No. 54, "F~md Balance Reponing and Governmental F~md T}lle Definitions". The Statement provides more
clearly defined fund balance categories to make the nature and extent of the constraints placed on a governments fund balance more trlmsparent. This Statement established fund
balance classifications that comprise a hierarchy based primarily on the e~1en1 to wbich a government is bound to observe constraints imposed upon the use of the resources reponed
in governmental funds. Reclassificarion of prior year fund balanc:e amounts to comply with Statement No. 54 is not requireri.
Source: District's financial statements
2011
750,000
1,258,749 C62,683)
I 946,066
616,428 (278,330}
338,098
EXHIBIT J-3
2012 2013 ___1Q_l± 2015
$ 130,665 $ ' 300,001 ' 2,445,382 203,765
1,872,333 2,361,823 2,866,346 2,783,069 [25,119) Cl29,900} [156,961) CI8,8162
$ 1,977,879 $ 2 435,689 ~386 $ 5,209,635
384,149 269,437 94,154 248,033 (157,742)
$ 384,149 $ 1]_1,695 __ $ 94,154 $ 248,033

EXHIBIT J-4 HOBOKEN PUBLIC SCHOOLS
CHANGES IN FUND BALANCES- GOVERNMENTAL FUNDS, LAST TEN FISCAL YEARS
(Unaudited) (modified accn<al basis af accounring)
~rEndedJUJJc30,
~ 2007 2009 2010 2011 2012 2013 2014 ~ Revenues
Tax levy $ 31,750,000 $ 33,450,000 $ 34,700,000 $ 36,073,367 $ 36,764,796 $ 36,761,743 $ 36,758,684 $ 36,755,753 $ 38,220,173 $ 39,426,390 Interest Earned 27,922 12,516 7,352 2,793 7,783 142 147 Miscellaneous 223,047 253,391 420,182 55!,096 214,917 432,035 154,344 59!,167 221,000 710,999 Tuition- LEA~ 450,981 358,725 247,577 228,057 176,804 149.409 249,632 180,276 100,636 73,500 Tuition -Individuals 71,815 77,697 77,385 89,571 88,118 113,806 13,710 Tuition- Other 83,279 84,117 117,149 107,220 120,008 168,753 136,240 Transportation Fees-Other LEAs 173,448 57,100 54,252 53,695 13,104 33,017 Rentals 426,968 806,669 232,468 261,470 238,691 261,645 543,838 State sources 17,612.887 24,161,576 19,977,726 23,873,047 19,978,903 19,477,2ll 22,365,442 23,657,807 24,500,920 25,324,507 Federal sources 4.552.899 3 870.176 3,349,982 3.078,925 3 278,573 3,205.434 2,938,106 2 861,579 2 170 164 2 201,913
Total revenue 55.199.798 62.255 682 58 890.001 64.001.283 61.614 752 60.436 558 62.967_!86 64.482.991 65 487,784 68 314,311
Expenditures Instruction
Regular Instruction 12,562,188 22,876,916 25,202,133 26,065,513 28,532,851 28,688,302 29,802,945 31,763,869 32,680,217 32,854,881 Special education instruction 2,795,067 5,680,512 6,229,156 5,442,924 6,463,972 6,562,400 7,373,851 7,993,013 6,639,832 6,953,392 Other special instruction 342,723 School Sponsored CoCurricular/Ath1ctics 1,441,715 1,475,320 1,208,959 1,309,947 1,277,799 1,304,718 1,236,547 1,106,301 1,252,381 Other instruction 707,113 494,689 540,620 462,898 796,685 500,218 399,523 399,911 119,448 97,326 AdultfContinuing Education 84,451 71,226 203,062 194,604 147,750 221,215 119,261 5,081
Support Services: Tuition 872,407 Student & inst. related services 10,436,362 9,995,087 11,679,584 12,133,524 8,117,932 9,383,661 9,169,!85 9,918,673 10,442,588 11,451,381 School administrn!ive services 1,724,721 2,044,123 1,486,!04 1,111,135 3,259,971 2,592,430 2,404,902 2,275,171 2,241,710 2,499,665 Other administrative services 1,684,006 1,462,208 1,937,255 1,912,839 1,752,651 1,495,815 1,189,244 971,938 1,051,102 1,020,650 Plant operations and maintenance 5,004, 741 6,611,606 6, 797,797 7,152,543 6,354,684 6,229,894 6,084,369 6,085,938 5,636,573 6,048,265 Central services 858,706 909,198 916,077 634,830 1,203,290 1,178,786 969,891 1,005,041 1,101,454 1,043,371 Pupil transportation 1,123,968 1,502,233 1,629,763 1,557,104 1,548,945 1,613,055 1,643,440 1,568,148 1,587,651 1,430,377
...... Employee benefits 10,292,481
"'" Special schools 164,788 Transfer to charter school 3,777,889 2,872,596 en Debt service: Principal 477,133 515,144 261,727 267,641 256,827 246,474 253,276 260,597 468,280 200,000 Interest and other charges 112,523 88,253 63,755 54,881 45,692 36,174 26,304 16,061 18,280 9,998 Capital Outlay 845 114 5,871480 291 120 5 839,111 857,604 1 903 934 2,046.459 1.683 467 850,151 775,963
Total expenditures 53,781930 62,450,211 58,581,637 64,046 964 60 695.655 61,856 692 62,889 322 65,297.635 63,948,668 65 637,650 Excess (Deficiency) of revenues
over (under) expenditures ].417,868 (194,529) 308,364 ___ (45,681) 919.097 (1,420,134) 77.864 _1]14.644) 1,539.116 2.676.661
Other Financing sources (uses) Lease Purchase Proceeds 1,000,000 Transfers in 93,994 674,347 746,851 741,615 737,625 893,161 766,174 Transfers out (833,3332 (386,53:D (425,0002 (400,000) (980.173) )146.851) (741615) (737 625) (1376,121) (1588,707)
Total other fimncing sources (uses) {?39,339) {386j37} (425.000} _____{±QQ,_OOO) (305,826) I,_ooo.ooo (482.960) (822.533}
Specinl Item Prior year adjustmeo! Prior year expenditure Accounts receivable canceled Current Year expenditure Accounts payable canceled
Total special item
Net change in fund balances $ 678 529 $ 1581,066): $ )116,636) $ {445.68!) ' 613 271 $ (1.420,134) $ 77,864 $ 185.356 $ 1,056,1~6 $ ___\,854,128
Debt service as a percentage of noncapital expenditures 1.78% 9.54% 0.61% 9.20% 1.49% 3.14% 3.30% 2.60% 0.77% 0.32%
~ Nancapital C}..-penditures are total expenditures less capital outlay.
Source: District's financial statements

2006 2007 General Fund Interest on Investments $ 27,922 Hoboken Charter School 309,435 Rentals (Incl.Charter Schools) 117,533 Transportation Fees-Other LEAs E- Rate Reimbursements Unspent Insurance Proceeds Other Miscellaneous 223,047 $ 253,391
Total Miscellaneous 677,937 253,391
Tuition 606,075 520,539
$ 1,284,012 $ 773,930 ,.....
""" -...:,
Source: District's financial records
HOBOKEN PUBLIC SCHOOLS GENERALFUNDOTHERLOCALREVENUEBYSOURCE
LAST TEN FISCAL YEARS
2008 2009 2010 2011
$ 106,625 $ 38,540 $ 12,516 $ 7,352 $
11,670 44,800 806,669 232,468 173,448 57,100
258,420 146,103 162,198
301,887 202,825 68,814 250,781
420,182 544,585 1,207,550 709,899
442,111 424,848 384,930 263,215
$ 862,293 $ 969,433 $ 1,592,480 $ 973,114 $
EXHIBIT J-5
2012 2013 2014 2015
2,793 $ 7,721 $ 126 $ 143
261,470 238,691 261,645 543,838 54,252 53,695 13,104 33,017
77,151 62,595 203,765
137,980 293,223 145,471 155,658
456,495 874,246 482,941 732,656
432,095 316,516 100,636 73,500
888,590 $ 1,190,762 $ 583,577 $ 806,156
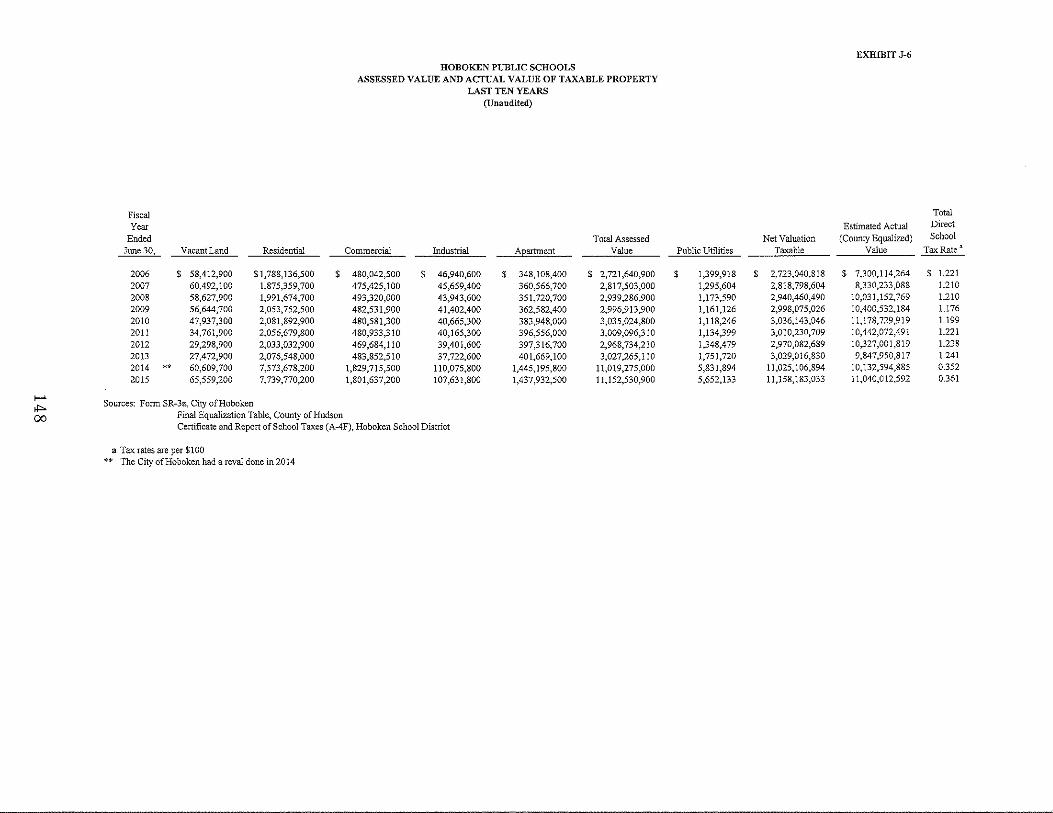
>--'
""" 00
Fiscal Yo<rr
Ended June 30, Vacant Land Residential
2006 $ 58,412,900 $1,788,136,500 $ 2007 60,492,100 1,875,359,700 2008 58,627,900 1,991,674,700 2009 56,644,700 2,053,752,500 2010 47,937,300 2,081,892,900 2011 34,761,900 2,056,679,800 2012 29,298,900 2,033,032,900 2013 27,472,900 2,076,548,000 2014 .. 60,609,700 7,573,678,200 2.015 65,559,200 7,739,770,200
Sources: Form SR-3a, City ofHoboken Final Equalization Table, County ofHudson
HOBOKEN PUBLIC SCHOOLS ASSESSED VALUE AND ACTUAL VALUE OF TAXABLE PROPERTY
LAST TEN YEARS (Unaudited)
Total Assessed Commercial Industrial AEartment Value
480,042,500 $ 46,940,600 $ 348,108,400 $ 2,721,640,900 475,425,100 45,659,400 360,566,700 2,817,503,000 493,320,000 43,943,600 351,720,700 2,939,286,900 482,531,900 41,402,400 362,582,400 2,996,913,900 480,581,300 40,665,300 383,948,000 3,035,024,800 480,933,310 40,165,300 396,556,000 3,009,096,310 469,684,110 39,401,600 397,316,700 2,968,734,210 483,852,510 37,722,600 401,669,100 3,027,265,110
1,829,715,500 110,075,800 1,445,195,800 11,019,275,000 1,801,637,200 107,631,800 1,437,932,500 11,152,530,900
Certificate and Report of School Taxes (A-4F), Hoboken School District
a Tax rates are per $100 ** The City ofHoboken had a reval done in 2014
EXHIBIT J-6
Tornl
Estimated Actual Direct
Net Valuation (County Equalized) School
Public Utilities Taxable Value Tax Rate a
$ 1,399,918 $ 2,723,040,818 $ 7,300,114,264 $ 1.221 1,295,604 2,818,798,604 8,330,233,088 1.210 1,173,590 2,940,460,490 10,031,152,769 1.210 1,161,126 2,998,075,026 10,400,532,184 1.176
1,118,246 3,036,143,046 11,178,729,919 1.199 1,134,399 3,010,230,709 10,442,072,491 1.221
1,348,479 2,970,082,689 10,327,001,819 1.238 1,751,720 3,029,016,830 9,847,950,817 1.241
5,831,894 11,025,106,894 10,132,594,885 0.352 5,652,133 11,158,183,033 11,040,012,592 0.361

Calendar Year
2006 2007 2008 2009 2010 2011 2012 2013 2014 ** 2015
HOBOKEN PUBLIC SCHOOLS DIRECT AND OVERLAPPING PROPERTY TAX RATES
LAST TEN YEARS (Unaudited)
(rate per $100 of assessed value)
Total Direct School Tax
Rate Overlapping Rates
Hoboken Local School Municipality County of
District of Hoboken Hudson Library tax
$ 1.220 $ 0.977 $ 1.236 $ 1.210 1.064 1.217 1.210 1.791 1.292 1.176 1.957 1.356 1.199 2.042 1.504 1.221 1.731 1.556 0.113 1.238 1.732 1.672 0.108 1.241 1.698 1.754 0.105 0.352 0.489 0.554 0.033 0.361 0.489 0.610 0.037
**-The City of Hoboken had a revaluation done in 2014
149
EXHIBIT J-7
Total Direct and Overlapping Tax
Rate
$ 3.433 3.491 4.293 4.489 4.745 4.621 4.750 4.798 1.428 1.497
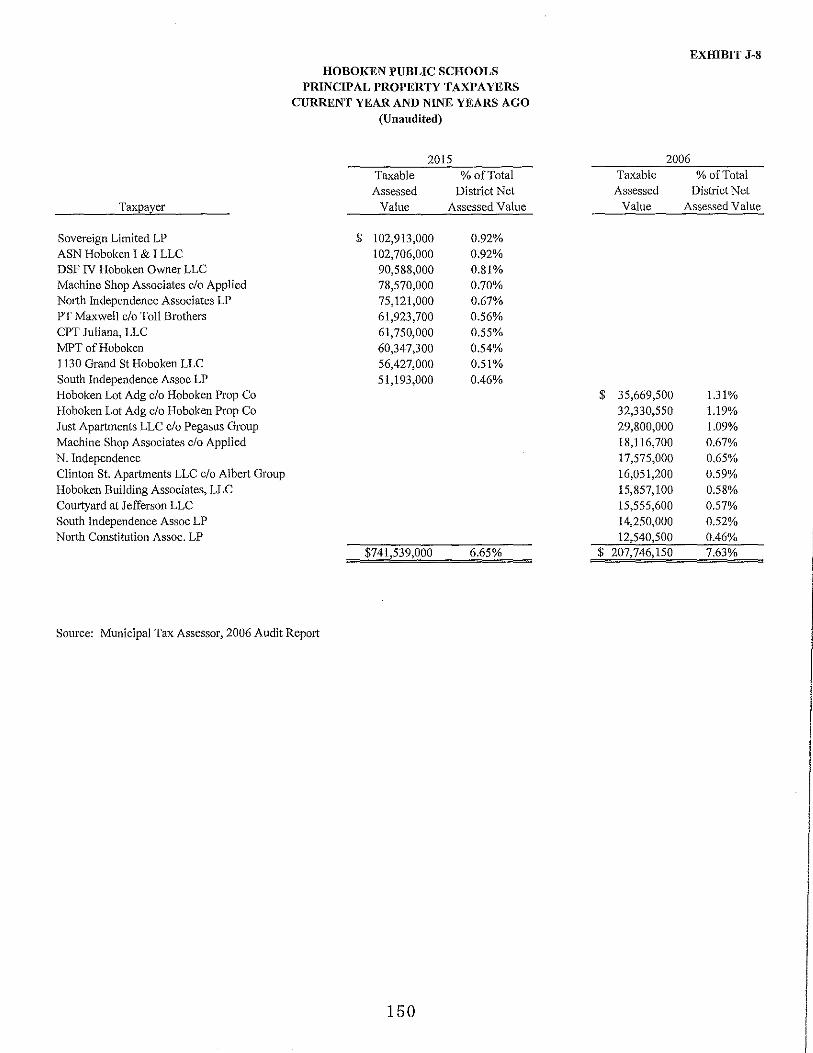
Taxpayer
Sovereign Limited LP ASN Hoboken I & I LLC DSF IV Hoboken Owner LLC Machine Shop Associates c/o Applied Nmth Independence Associates LP PT Maxwell c/o Toll Brothers CPT Juliana, LLC MPT of Hoboken 1130 Grand St Hoboken LLC South Independence Assoc LP Hoboken Lot Adg c/o Hoboken Prop Co Hoboken Lot Adg. c/o Hoboken Prop Co Just Apartments LLC c/o Pegasus Group Machine Shop Associates c/o Applied N. Independence Clinton St. Apartments LLC c/o Albert Group Hoboken Building Associates, LLC Courtyard at Jefferson LLC South Independence Assoc LP North Constitution Assoc. LP
HOBOKEN PUBLIC SCHOOLS PRINCIPAL PROPERTY TAXPAYERS
CURRENT YEAR AND NINE YEARS AGO (Unaudited)
$
2015 Taxable Assessed
Value
102,913,000 102,706,000 90,588,000 78,570,000 75,121,000 61,923,700 61,750,000 60,347,300 56,427,000 51,193,000
$741,539,000
%of Total District Net
Assessed Value
0.92% 0.92% 0.81% 0.70% 0.67% 0.56% 0.55% 0.54% 0.51% 0.46%
6.65%
Source: Municipal Tax Assessor, 2006 Audit Report
150
$
$
EXHIBIT J-8
2006 Taxable Assessed
Value
35,669,500 32,330,550 29,800,000 18,116,700 17,575,000 16,051,200 15,857,100 15,555,600 14,250,000 12,540,500
207,746,150
%of Total District Net
Assessed Value
1.31% 1.19% 1.09% 0.67% 0.65% 0.59% 0.58% 0.57% 0.52% 0.46% 7.63%
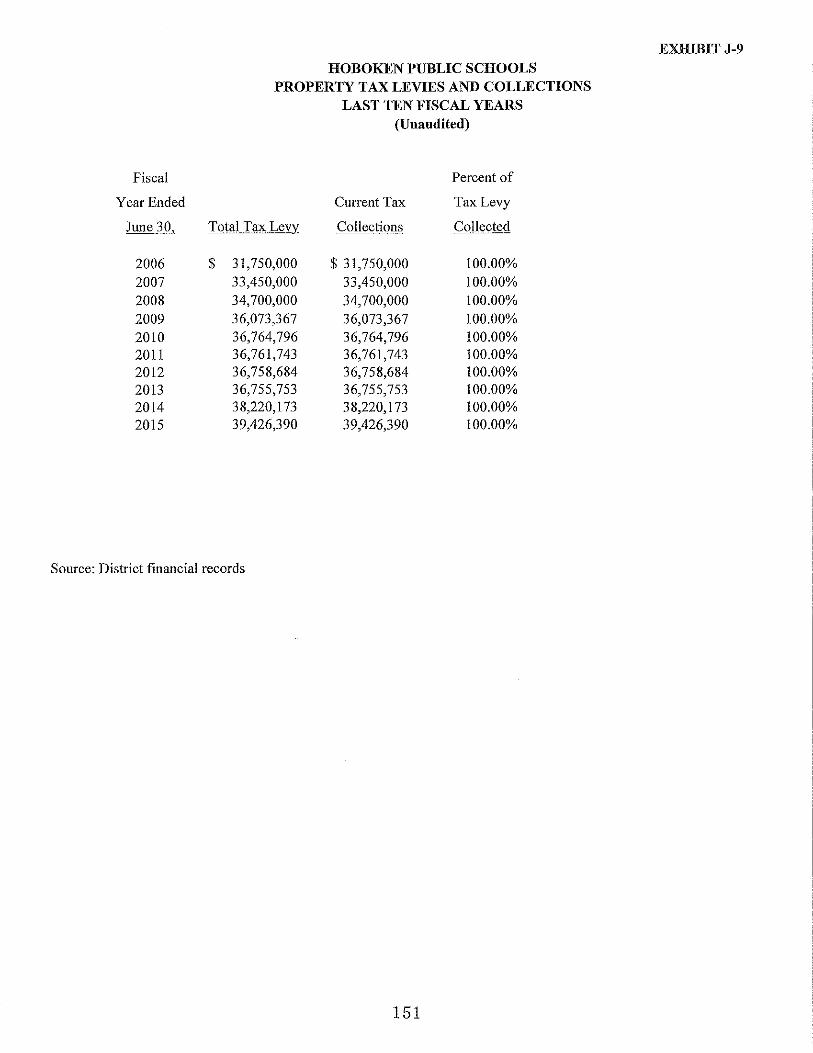
Fiscal
Year Ended
June 30,
2006 2007 2008 2009 2010 2011 2012 2013 2014 2015
HOBOKEN PUBLIC SCHOOLS PROPERTY TAX LEVIES AND COLLECTIONS
LAST TEN FISCAL YEARS (Unaudited)
Percent of
Current Tax Tax Levy
Total Tax Levy Collections Collected
$ 31,750,000 $ 31,750,000 100.00% 33,450,000 33,450,000 100.00% 34,700,000 34,700,000 100.00% 36,073,367 36,073,367 100.00% 36,764,796 36,764,796 100.00% 36,761,743 36,761,743 100.00% 36,758,684 36,758,684 100.00% 36,755,753 36,755,753 100.00% 38,220,173 38,220,173 100.00% 39,426,390 39,426,390 100.00%
Source: District financial records
151
EXHIBITJ-9
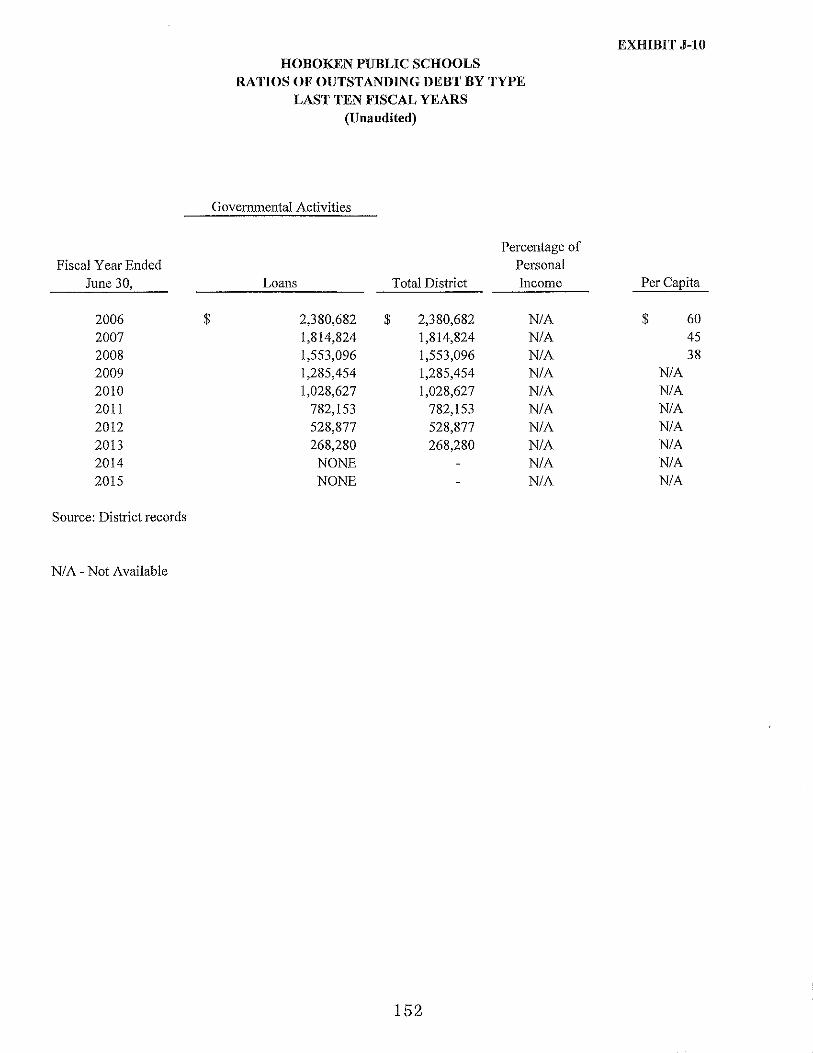
Fiscal Year Ended June 30,
2006 $ 2007 2008 2009 2010 2011 2012 2013 2014 2015
Source: District records
N/ A - Not Available
HOBOKEN PUBLIC SCHOOLS RATIOS OF OUTSTANDING DEBT BY TYPE
LAST TEN FISCAL YEARS (Unaudited)
Governmental Activities
Percentage of Personal
Loans Total District Income
2,380,682 $ 2,380,682 N/A 1,814,824 1,814,824 N/A 1,553,096 1,553,096 N/A 1,285,454 1,285,454 N/A 1,028,627 1,028,627 N/A
782,153 782,153 N/A 528,877 528,877 N/A 268,280 268,280 N/A
NONE N/A NONE N/A
152
EXHIBIT J-10
Per Capita
$ 60 45 38
N/A N/A N/A N!A N/A N/A N/A
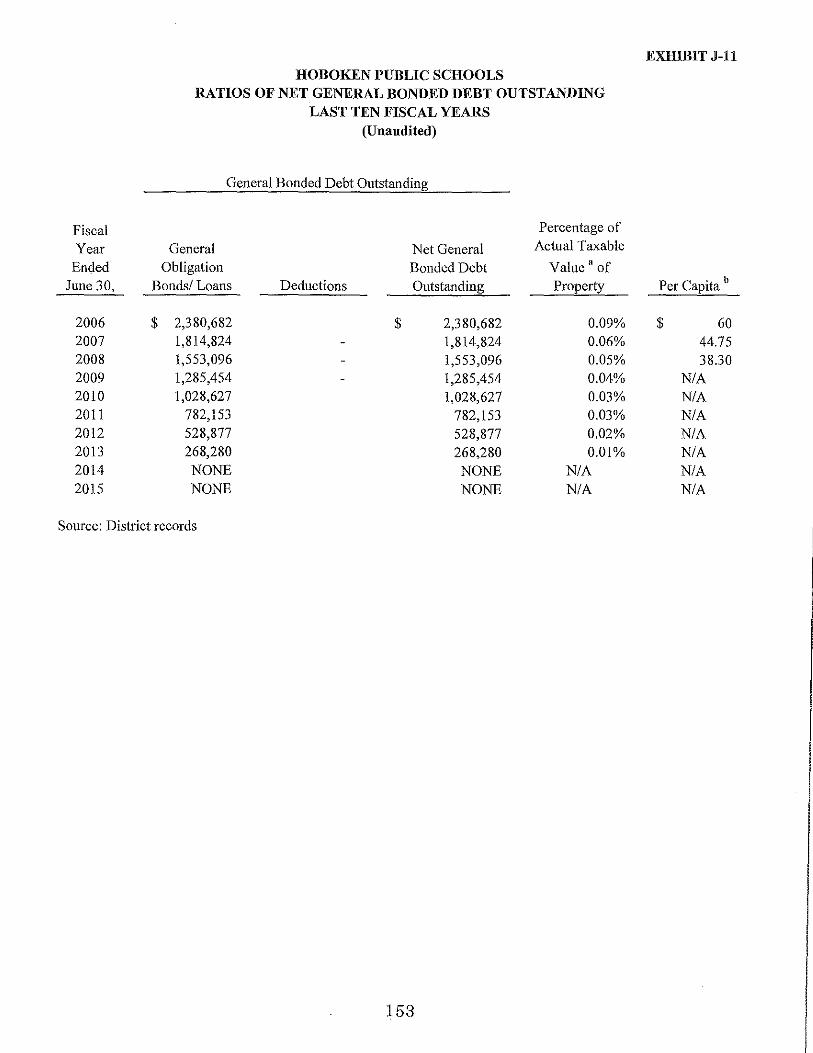
Fiscal Year
Ended June 30,
2006 2007 2008 2009 2010 2011 2012 2013 2014 2015
HOBOKEN PUBLIC SCHOOLS RATIOS OF NET GENERAL BONDED DEBT OUTSTANDING
LAST TEN FISCAL YEARS (Unaudited)
General Bonded Debt Outstanding
Percentage of
General Net General Aetna] Taxable
Obligation Bonded Debt Value" of Bonds/ Loans Deductions Outstanding Properly
$ 2,380,682 $ 2,380,682 0.09% 1,814,824 1,814,824 0.06% 1,553,096 1,553,096 0.05% 1,285,454 1,285,454 0.04% 1,028,627 1,028,627 0.03%
782,153 782,153 0.03% 528,877 528,877 0.02% 268,280 268,280 0.01% NONE NONE N/A NONE NONE N/A
Source: District records
153
EXHIBIT J-11
Per Capita b
$ 60 44.75 38.30
NIA NIA NIA NIA NIA NIA NIA

HOBOKEN PUBLIC SCHOOLS COMPUTATION OF DIRECT AND OVERLAPPING BONDED DEBT
FOR THE YEAR ENDED DECEMBER 31, 2014 (Unaudited)
Gross Debt
MUNICIPAL DEBT: Self Liquidating Debt $ 2,943,000 City of Hoboken 112,014,991
$ 114,957,991
OVERLAPPING DEBT APPORTIONED TO THE MUNICIPALITY County of Hudson (A) North Hudson Sewerage Authority
Overlapping Debt
Total Direct and Overlapping Outstanding Debt
SOURCE: (I) City of Hoboken 2014 Annual Debt Statement
County of Hudson 2014 Annual Debt Statement Final Equalization Table, County of Hudson 2014
Deduction
$ 29,433,000 360,974
$ 29,793,974
(A) The debt for this entity was apportioned to City of Hoboken by dividing the municipality's 2014 equalized value by the total 2014 equalized value for the County of Hudson.
154
EXHIBIT J-12
$
Net Debt
111,654,017
111,654,017
111,704,489 125,474,002
237,178,491
$ 348,832,508

Debt limit
Total net debt applicable to limit
Legal debt margin
Total net debt applicable to the limit as a percentage of debt limit
>-' 01
Source: Annual Debt Statements 01
HOBOKEN PUBLIC SCHOOLS LEGAL DEBT MARGIN INFORMATION
LAST TEN FISCAL YEARS (Unaudited)
Legal Debt Margin Calculation for Fiscal Year 2014
Equalized valuation basis 2012 2013 2014
$
9,597,139,703 11,097,012,867
12425885205 20,694,1_~:2.570
Average equalized valuation of taxable property $ 11,040,012,592
$
$
Debt limit (4% of average equalization value) Total Net Debt Applicable to Limit
Legal debt margin
2006 2007 2008
228,456,720 $ 270,772,978 $ 321,936,907
2 380,682 1,814,819 1,553,096
226,076,038 $ 268,958,159 $ 320 383,811
1.04% 0.67% 0.48%
441,600,504
$ 441 600,504
2009 2010
$ 365,426,531 $ 407,213,582
1,285,454 ],028,627
$ 364,141,077 $ 406,184,955
0.35% 025%
EXHIDIT J-13
2011 2012 2013 2014 2015
$ 417,682,900 $ 413,080,073 $ 441,600,504 $ 405,303,795 s 441,600,504
782.]53 528,877 268,280
$ 416,900,747 s 412,55_l,J96 $ ~Ln2,224 $ 405,303,79_5 J>. 441,600,504
0.19% 0.13% 0.06% 0.00"/o 0.00%

Year
2005 2006 2007 2008 2009 2010 2011 2012 2013 2014 2015
HOBOKEN PUBLIC SCHOOLS DEMOGRAPHIC AND ECONOMIC STATISTICS
LAST TEN FISCAL YEARS (Unaudited)
County Per Capita Personal
Population Income
39,435 (E) $ 34,412 (R) 39,259 (E) 36,976 (R) 39,930 (E) 39,447 (R) 40,314 (E) 42,884 (R) 41,015 (E) 42,824 (R) 50,060 (E) 44,926 (R) 50,545 (E) 47,377 (R) 52,034 (E) 50,033 52,575 (E) N/A 52,575 (E) N/A
Source: New Jersey State Department of Education
(E) - Estimate (R) - Revised N/A- Not Available
156
EXHIBIT J-14
Unemployment Rate
2.6% 2.8% 2.4% 3.1% 5.7% 5.6%
5% 5%
4.3% 4.3%

HOBOKEN PUBLIC SCHOOLS PRINCIPAL EMPLOYERS
CURRENT YEAR AND NINE YEARS AGO (Unaudited)
Employer
John Wiley & Sons Inc. Marsh USA, Inc. Hoboken University Medical Center (formerly St. Mary Hospital) NJ Transit Corp. Stevens Institute of Technology Academy Bus Tours Inc. Guy Carpenter and Co. Mindlance, Inc. Starwood Hotels and Resorts Worldwide Sumitomo Trust & Banking Co. USA St. Mary Hospital (Bonsecuors NJ Health Center) J olm Wiley & Sons, Inc. NJ Transit Corp. City of Hoboken Stevens Institute ofTeclmology 'ITI Team Telecom International Hudson Sewing Inc. (Vision Textiles) Academy Bus Tours Inc. Ciber Inc. Mizuho Securities USA Inc.
Employees
1,519 1,500
1,300 700 500 250 250 225 180 156
6,580
2015
Percentage of Total Municipal
Employment
8.90% 8.79%
7.61% 4.10% 2.93% 1.46% 1.46% 1.32% 1.05% 0.91%
38.54%
Sources: NJ Dept of Labor~ Employment and Wage Data, Municipal Annual Report Hudson County Economic Development Commission, Major Employers List
157
Employees
1,200 1,000
700 600 500 400 300 250 195 180
5,325
EXHIBIT J-15
2006
Percentage of Total Municipal
Employment
4.43% 3.69% 2.58% 2.21% 1.84% 1.48% 1.11% 0.92% 0.72% 0.66%
19.64%

HOBOKEN PUBLIC SCHOOLS FULL-TIME EQUIVALENT DISTRICT EMPLOYEES BY FUNCTION/PROGRAM
LAST EIGHT FISCAL YEARS (Unaudited)
Function/Program
Instruction
Support Services: Student & instruction related services General administration School administrative services Central and Other Support Services Plant operations and maintenance Pupil transportation Special Revenue Other
Total
~ Source: District Personnel Records ()()
Note:
2007 2008
202.6 210.8
86.0 89.5 3.0 3.0 9.0 9.0 8.0 7.2
50.5 55.1 22.0 25.6 15.8 13.3 9.0 17.6
405.9 431.1
GASB requires that ten years of statistical data be presented. As a result of the implementation of GASB No. 44
in fiscal year 2006 only seven years of information is available. Each year thereafter, an additional year's data will be
included until ten years of data is present.
N/A- Not Available
2009
197.4
71.7 2.0 5.0 2.6
48.3 21.0 14.2 6.0
368.2
2010 2011
184.00 208.40
89.60 73.50 3.00 2.00 5.00 15.00 1.60 6.00
64.50 42.20 20.00 28.50 10.90 19.60 10.00 10.50 388.6 405.7
Note- Starting in fiscal year 2014, used the New Jersey Department of Education's certified and non-certified staff reports as source data.
EXHIBIT J-16
2012 2013 2014 2015
206.80 206.80 232.90 223.50
66.50 66.50 41.50 41.20 2.00 2.00 2.00 2.00
14.20 14.20 29.00 26.60 8.00 8.00 17.50 14.50
50.00 50.00 79.50 69.10 25.00 25.00 1.50 !.50 20.10 20.10 7.00 7.00
392.6 392.6 410.9 385.4

I-'
01
"'
HOBOKEN PUBLIC SCHOOLS OPERA.TING STATISTICS LAST TEN FISCAL YEARS
(Unaudited)
Teacher/Pupil Ratio
Operating Cost Per Percentage Teaching Pre- Average Daily Fiscal Year Enrollment~ Expenditur"" • Pu~ Change Staff kindergarten g Elementary d Middle School e High School f Enrollment (ADE)
2006 2,234 $ 52,347,160 $ 23,432 0.16% 237 2007 2,212 55,975,334 25,305 7.99% 261 2008 2,194 57,965,035 26,420 4.40% 237 2009 2,223 58,003,291 26,092 -L24% 230 2010 2,340 59,535,532 25,443 -2.49% 238 2011 2,317 59,670,l!O 25,753 1.22% 227 2012 2,343 60,563,283 25,849 0.37% 204 2013 2,363 63,337,510 26,804 3.70% 249 2014 2,431 62,611,957 25,756 -3.91% 221 2015 2,470 64,651,689 26,175 1.63% 229
Sources: District records
Note: Enrollment based on annual October district count. b Operating expenditures equal total expenditures less debt service and capital outlay.
Cost per pupil represents operating expenditures divided by enrollment. For 2007, elementary consists of Calabro (K-5), Connors (K-.6) and Wallace (K-6) Schools. For 2008, elementary consists of Calabro (K-6), Connors (K-6) and Wallace (K-6) Schools.
e For 2007, middle school consists solely of Brandt (7-8) School. For 2008, middle school consists ofBrandt (8), Calabro (7), Connors (7) and Wallace (7) Schools. For 2012, middle school no longer exists For 2007 and 2008, high school consists of Hoboken High (9-12) and Demarest Alternate (7-12) Schools. For 2014, high school consists of Hoboken High (7-12).
g For 2008, pre--kindergarten consists ofBrandt, Calabro, Connors and Wallace Schools. For 2012, pre-kindergarten consists of Brandt, Connors and Wallace.
N/ A Information not available
8.82 7.46 7.16 2,232 10.03 7.60 7.34 2,226
15.61 11.54 13.67 7.18 2,290 9.52 9.07 7.30 1,874 8.93 8.77 7.93 1,937
8.41 8.25 11.4 1,790 7.34 8.51 NIA 9.80 2,333
10.13 N/A 10.0 1,710 10.92 9.36 NIA 10.0 1,719 N/A N/A NIA NIA 1,716
Average Daily Attendance
(ADA)
2,041 2,041 2,097 1,719 1,791 1,656 2,177 1,609 1,611 1,612
%Change in Average Daily
Enrollment
-3.96% -0.27% 2.88%
-18.17% 3.36% -7.59% 30.34% -26.71% 0.53% -0.17%
EXHIBIT J-17
Student Attendance Percentage
91.44% 91.69% 91.57% 91.73% 92.46% 92.51% 93.31% 94.09% 93.72% 93.94%

EXHffiiT J-18 HOBOKEN PUBLIC SCHOOLS
SCHOOL BUTI...DING INFORMATION LAST TEN FISCAL YEARS
(Unaudited)
2006 2007 2008 2009 2010 2011 2012 2013 2014 2015 District Building Elementary School Wallace No.6 (19721
Square Feet 122,300 125,500 125,500 152,094 152,094 152,094 152,094 152,094 152,094 152,094 Capacity (Students) 591 591 565 565 565 565 565 565 565 565 Enrollment 622 584 746 713 744 666 666 590 605 599
Thomas G. Connors (1908) Square Feet 60,265 60,265 60,265 65,799 65,799 65,799 65,799 65,799 65,799 65,799 Capacity (Students) 339 339 339 338 338 338 338 338 338 338 Enrollment 302 311 415 383 346 267 267 257 257 229
Salvatore R Calabro No.4 f1976) Square Feet 30,750 30,750 30,750 41,550 4!,550 41,550 41,550 41,550 41,550 41,550 Capacity (Students) 448 448 222 137 137 137 137 137 137 137 Enrollment 128 93 266 162 * 160 * 134 134 132 128 119
Joseph F. Brandt No.2 f1920l Square Feet 79,290 79,290 79,290 77,945 77,945 77,945 77,945 77,945 77,945 77,945 Capacity (Students) 637 637 469 469 469 469 469 469 469 469 Enrollment 399 209 321 490 82 56 56 60 Ill 269
A.J. Demarest (1910) I-' Square Feet 82,435 82,435 82,435 89,042 89,042 89,042 89,042 89,042 89,042 89,042
"' 0 Capacity (Students) 425 425 425 425 425 425 425 425 425 425 Enrollment 180 123 69 70 73
Junior/Senior High School Hoboken High f1962l
Square Feet 193,780 193,780 193,780 193,780 193,780 193,780 193,780 193,780 193,780 193,780 Capacity (Students) 838 838 829 829 829 829 829 829 829 829 Enrollment 597 572 539 537 508 667 667 586 683 643
JFK Athletic Complex Square Feet 154,358 154,358 154,358 154,358 154,358 154,358 154,358 154,358 154,358 154,358 Capacity (Students) 2,000 2,000 2,000 2,000 2,000 2,000 2,000 2,000 2,000 2,000 Enrollment N/A N/A N/A N/A N/A N/A N/A N/A N/A N/A
Number of Schools at June 30, 2015
Pre-K/Kindergarten- 1 Elementary- 3 Junior/Senior High School- 1
• Swing Space enrollment included
Source: District Records, Department ofBuildings and Grounds

,__. 0> ,__.
HOBOKEN PUBLIC SCHOOLS GENERAL FUND
SCHEDULE OF REQUIRED MAINTENANCE FOR SCHOOL FACILITIES
UNDISTRIBUTED EXPENDITURES- REQUIRED MAINTENANCE FOR SCHOOL FACILITIES
11-000-261-XXX
*School Facilities Hoboken High School A.J. Demarest Joseph F. Brandt No.2
SalvatoreR. Calabro No.4
Thomas G. Connors Wall ace No. 6 JFK Stadium
Grand Total School Facilities
Source: District Records *"'-infOrmation not available
Project# {s2 N/A N/A N/A
NIA
N/A
N/A
N/A
2006
$ 416,726 179,285 169,530
66,800
131,006
266,580
4,815
$ 1,234,742
LAST TEN YEARS (Unaudited)
2007 ___2Q08 2009 2010
$ 278,859 $ 370,534 $ 433,124 $ 324,557 57,760 107,361 165,665 133,241
176,446 191,484 107,077 93,637 17,299 6,097 45,959 40,073
99,949 51,513 135,095 101,903
464,120 623,647 463,790 332,411 4,721 6,326 4,272 4,726
$ 1,099,154 $ 1,356,962 $ 1,354,982 $ 1,030,548
EXHIBIT J-19
2011 2012 2013 2014 2015
$ 341,738 $ 252,949 $ 179,317 $ 291,276 $ 284,932 147,390 166,447 179,087 164,827 140,046 101,228 109,312 129,657 145,145 317,280
41,599 68,530 97,272 91,497 247,793
119,915 166,447 248,677 267,180 205,388
340,285 142,947 156,833 298,468 244,328
17,180 7,494 6,773 43,068 34,623
$ 1,109,335 $ 914,126 $ 997,616 $ 1,301,461 $ 1,474,390

EXHIBIT J-20
HOBOKEN PUBLIC SCHOOLS INSURANCE SCHEDULE
JUNE 30,2015 (Unaudited)
Coverage Deductible
School Package Policy- N.J.S.I.G Blanket Real and Personal Property Extra Expense Valuable Papers and Records Flood Special Flood Hazard Area Flood Zones
All Other Flood Zones Earthquake Increase Cost of Construction Terrorism
Electronic Data Processing- N.J.S.I.G Limit- Hardware Equipment Coverage Extension - Transit Coverage Extension - Loss of Income
Boiler and Machinery- N.J.S.I.G Liability Limit- Property Damage and Business Income Perishable Goods Expediting Expenses Hazardous Substances Off-Premise Property Damage Extra Expense Service Interruption Data Restoration Contingent Business Income Demolition Ordinance of Law Newly Acquired Locations- 120 Days Notice
General Liability- N.J.S.I.G Bodily Injury and Property Damage Bodily Injury from Products and Completed Operations Child Molestation/Sexual Abuse Personal Injury and Advertising Injury Employee Benefit Liability Premises Medical Payments
Per Person Each Accident
Terrorism
Source: District's records
350,000,000 per occurrence $ 50,000,000 10,000,000 10,000,000
162
75,000,000 50,000,000 10,000,000
1,000,000
1,500,000 25,000 10,000
I 00,000,000 500,000 500,000 500,000 100,000
10,000,000 10,000,000
100,000 100,000
1,000,000 1,000,000
250,000
I 1,000,000 I 1,000,000 11,000,000 ll,OOO,OOO I 1,000,000
5,000 10,000
1,000,000
5,000 5,000 5,000
500,000 500,000
!0,000 5,000 5,000 5,000
1,000 1,000 1,000
5,000 5,000 5,000 5,000 5,000 5,000 5,000 5,000 5,000 5,000 5,000 5,000
1,000
per building per building contents

HOBOKEN PUBLIC SCHOOLS INSURANCE SCHEDULE
JUNE 30,2014 (Unaudited)
Crime- N.J.S.I.G. Public Employee Dishonesty with Faithful Performance Limit Forgery or Alteration Money and Securities Limit Money Orders/Counterfeit Currency Computer Fraud
School Leaders Errors & Omissions- N.J.S.I.G. Coverage A: each policy period Coverage B: each claim Coverage B: each policy period
Public Official Bonds- N.J.S.I.G. Board Secretary
Automobile - N.J.S.I.G. Combined Single Limits for Bodily
Injury and Property Damage Uninsured!Underinsured Motorist -
Private Passenger Auto All Other Vehicles- Bodily Injury Per Person All Other Vehicles - Bodily Injury Per Accident All Other Vehicles - Properly Damage Per Accident
Personal Injury Protection (Including Pedestrians)
Medical Payments Private Passenger Vehicles
All Other Vehicles Terrorism
Student Accident Coverage- People's Benefit Life Insurance Interscholastic Sports and Compulsory Plans
All Athletes Athletic Disability
Excluding Interscholastic Sports and Compulsory Plans Volunteers
Excess Workers Compensation- AmeriHealth Casualty Insur. Co. Occurrence Aggregate Countrywide Aggregate
Source: District's records
163
$
Coverage
500,000 500,000
50,000 50,000
500,000
11,000,000 100,000 300,000
317,500
11,000,000
1,000,000 15,000 30,000
5,000
250,000
10,000 5,000
1,000,000
5,000,000 1,500,000 1,000,000
25,000
1,000,000 1,000,000
EXHIBIT J-20
Deductible
$ 1,000 1,000
500 500
1,000
15,000 15,000 15,000
1,000
1,000
250,000 250,000

SINGLE AUDIT SECTION

LERCH, VINCI & HIGGINS,LLP CERTIFIED PUBLIC ACCOUNTANTS REGISTERED MUNICIPAL ACCOUNTANTS
DIETER P. LERCH, CPA, RMA, PSA
GARY J. VINCI, CPA, RMA. PSA
GARY W. HIGGINS, CPA, RMA, PSA
JEFFREY C. BLISS, CPA, RMA, PSA
PAULI. LERCH, CPA. RMA, PSA
DONNA L. JAPHET, CPA, PSA
JULIUS B. CONSONI, CPA, I'SA
ELIZABETH A. SHICK, CPA, RMA, PSA
ANDREW PARENTE, CPA, RMA, PSA
ROBERT W. HAAG, CPA, PSA
DEBORAH K. LERCH, CPA, PSA
RALPH M. PICONE, CPA, RMA, PSA
REPORT ON INTERNAL CONTROL OVER FINANCIAL REPORTING AND ONCOMPLIANCE AND OTHER MATTERS
BASED ON AN AUDIT OF FINANCIALSTATEMENTS PERFORMED IN ACCORDANCE WITH GOVERNMENT AUDITING STANDARDS
Honorable President and Members of the Board of Trustees
Hoboken Public Schools Hoboken, New Jersey
INDEPENDENT AUDITOR'S REPORT
DEBRA GOLLE, CPA
CINDY JANACEK, CPA. RMA
MARK SACO, CPA
SHERYL M. NICOLOSI, CPA
KATHLEEN WANG, CPA
ROBERT AMPONSAH, CPA
We have audited, in accordance with the auditing standards generally accepted in the United States of America; the standards applicable to fmancial audits contained in Government Auditing Standards issued by the Comptroller General of the United States and audit requirements prescribed by the Office of School Finance, Department of Education, State of New Jersey, the financial statements of the governmental activities, the business-type activities, each major fund, and the aggregate remaining fund information of the Hoboken Public Schools as of and for the fiscal year ended June 30, 2015 and the related notes to the financial statements, which collectively comprise the Hoboken Public Schools' basic financial statements and have issued our repo11 thereon dated December 7, 2015.
Internal Contml Over Financial Reporting
In planning and perfmming our audit of the financial statements, we considered the Hoboken Public Schools' internal control over financial reporting (internal control) to determine the audit procedures that are appropriate in the circumstances for the purpose of expressing our opinions on the financial statements but not for the purpose of expressing an opinion on the effectiveness of the Hoboken Public Schools' internal control. Accordingly, we do not express an opinion on the effectiveness of the Hoboken Public Schools' internal control.
A deficiency in internal control exists when the design or operation of a control does not allow management or employees, in the normal course of performing their assigned functions, to prevent, or detect and correct, misstatements on a timely basis. A material weakness is a deficiency, or a combination of deficiencies, in intemal control, such that there is a reasonable possibility that a material misstatement of the entity' s financial statements will not be prevented, or detected and corrected on a timely basis. A significant deficiency is a deficiency, or a combination of deficiencies, in internal control that is less severe than a material weakness, yet important enough to merit attention by those charged with governance.
17-17 ROUTE 208 •FAIR LAWN, NJ 07410• ·TELEPHONE C20D 791-7100 • FACSIMILE (20 1) 791-3035
WWW.LVHCPA.COM
164

EXIDBIT K-1
Our consideration of internal control was for the limited purpose described in the first paragraph of this section and was not designed to identifY all deficiencies in internal control that might be material weaknesses or significant deficiencies. Given these limitations, during our audit we did not identifY any deficiencies in internal control that we consider to be material weaknesses. However, material weaknesses may exist that have not been identified.
Compliance and Other Matters
As part of obtaining reasonable assurance about whether the Hoboken Public Schools's financial statements are free from material misstatement, we performed tests of its compliance with certain provisions of laws, regulations, contracts, and grant agreements, noncompliance with which could have a direct and material effect on the determination of financial statement amounts. However, providing an opinion on compliance with those provisions was not an objective of our audit, and accordingly, we do not express such an opinion. The results of our tests disclosed no instances of noncompliance or other matters that are required to be reported under Government Auditing Standards and audit requirements as prescribed by the Office of School Finance, Department of Education, State of New Jersey.
However, we noted certain matters that are not required to be reported under Government Auditing Standards that we reported to management of the Hoboken Pnblic Schools in a separate report entitled, "Auditor's Management Repmt on Administrative Findings- Financial, Compliance and Performance" dated December 7, 2015.
Purpose of this Report
The purpose of this report is solely to describe the scope of our testing of internal control and compliance and the results of that testing, and not to provide an opinion on the effectiveness of the Hoboken Public Schools's internal control or on compliance. This report is an integral part of an audit performed in accordance with Government Auditing Standards in considering the Hoboken Public Schools's internal control and compliance. Accordingly, this communication is not suitable for any other purpose. ?
~~;L~~:d~ llr
Fair Lawn, New Jersey December 7, 2015
165
E~H, VINCI & IDGGINS,Jif Certified Public Accountants
Public School ccountant PSA Number CS00756

LERCH, VINCI & HIGGINS,LLI_JHIB1TK-
2
DIETER P. LERCH, CPA, RMA, PSA
GARY J. VINCI, CPA, RMA, PSA
GARY W. HIGGINS, CPA, RMA, PSA
JEFFREY C. BLISS, CPA, RMA, PSA
PAULJ. LERCH, CPA, RMA, PSA
DONNA L. JAPHET, CPA, PSA
JULIUS B. CONSONI, CPA, PSA
ELIZABETH A. SHJCK, CPA, RMA, PSA
ANDREW PARENTE, CPA, RMA, PSA
ROBERT W. HAAG, CPA, PSA
DEBORAH K. LERCH, CPA, PSA
RALPH M. PICONE, CPA, RMA, PSA
CERTIFIED PUBLIC ACCOUNTANTS REGISTERED MUNICIPAL ACCOUNTANTS
DEBRA GOLLE, CPA
CINDY JANACEK, CPA, RMA
MARK SACO, CPA
SHERYL M. NICOLOSI, CPA
KATHLEEN WANG, CPA
ROBERT AMPONSAH, CPA
REPORT ON COMPLIANCE FOR EACH MAJOR FEDERAL AND STATE PROGRAM; REPORT ON INTERNAL CONTROL OVER COMPLIANCE; AND REPORT
ON SCHEDULE OF EXPENDITURES OF FEDERAL AWARDS REQUIRED BY U.S. OMB CIRCULAR A-133 AND SCHEDULE OF EXPENDITURES OF STATE FINANCIAL
ASSISTANCE REQUIRED BY NEW JERSEY OMB CIRCULAR 15-08
Honorable President and Members of the Board of Trustees
Hoboken Public Schools Hoboken, New Jersey
INDEPENDENT AUDITOR'S REPORT
Report on Compliance for Each Major Federal and State Program
We have audited the Hoboken Public Schools' compliance with the types of compliance requirements described in the U.S. Office of Management and Budget COMB) Circular A-133 Compliance Supplement and the New Jersey OMB Circular 15-08 State Aid/Grant Compliance Supplement that could have a direct and material effect on each of the Hoboken Public Schools' major federal and state programs for the fiscal year ended June 30, 2015. The Hoboken Public Schools' major federal and state programs are identified in the summaty of auditor's results section of the accompanying schedule of findings and questioned costs.
Management's Responsibility
Management is responsible for compliance with the requirements of laws, regulations, contracts, and grants applicable to its federal and state programs.
Auditor's Responsibility
Our responsibility is to express an opinion on compliance for each of the Hoboken Public Schools' s major federal and state programs based on our audit of the types of compliance requirements referred to above. We conducted our audit of compliance in accordance with auditing standards generally accepted in the United States of America; the standards applicable to financial audits contained in Government Auditing Standards, issued by the Comptroller General of the United States; audit requirements as prescribed by the Office of School Finance, Department of Education, State of New Jersey; U.S. OMB Circular A-133, Audits of States, Local Governments, and Non-Profit Organizations and New Jersey OMB Circular 15-08, Single Audit Policy for Recipients of Federal Grants, State Grants and State Aid. Those standards and Circulars require that we plan and perform the audit to obtain reasonable assurance about whether noncompliance with the types of compliance requirements referred to above that could have a direct and material effect on a major federal or state program occurred. An audit includes examining, on a test basis, evidence about the Hoboken Public Schools' compliance with those requirements and performing such other procedures as we considered necessaty in the circumstances.
17- 17 ROUTE 208 • FAIR LAWN, NJ 07410 <~ TELEPHONE <20 1) 791-7100 • FACSIMILE (20 1) 79 1-3035
WWW.LilHCPA.COM
166

EXHIDITK-2
We believe that our audit provides a reasonable basis for our opinion on compliance for each major federal and state program. However, our audit does not provide a legal determination of the Hoboken Public Schools' compliance.
Opinion on Each Major Federal and State Program
In our opinion, the Hoboken Public Schools complied, in all material respects, with the types of compliance requirements referred to above that could have a direct and material effect on each of its major federal and state programs for the fiscal year ended June 30, 2015.
Other Matters
The results of our auditing procedures disclosed instances of noncompliance, which are required to be reported in accordance with U.S. OMB Circular A-133 and New Jersey OMB Circular 15-08 which are described in the accompanying schedule of findings and questioned costs as items 2015-001, 2015-002 and 2015-003. Our opinion on each major federal and state program is not modified with respect to these matters.
The Hoboken Public Schools' responses to the noncompliance findings identified in our audit are described in the accompanying schedule of findings and questioned costs. The Hoboken Public Schools' responses were not subjected to the auditing procedures applied in the audit of compliance and, accordingly, we express no opinion on the responses.
Report on Internal Control Over Compliance
Management of the Hoboken Public Schools is responsible for establishing and maintaining effective internal control over compliance with the types of compliance requirements referred to above. In planning and performing our audit of compliance, we considered the Hoboken Public Schools' internal control over compliance with the types of requirements that could have a direct and material effect on each major federal and state program to determine the auditing procedures that are appropriate in the circumstances for the purpose of expressing an opinion on compliance for each major federal and state program and to test and report on internal control over compliance in accordance with U.S. OMB Circular A-133 and New Jersey OMB Circular 15-08, but not for the purpose of expressing an opinion on the effectiveness of internal control over compliance. Accordingly, we do not express an opinion on the effectiveness of the Hoboken Public Schools' internal control over compliance.
A deficiency in internal control over compliance exists when the design or operation of a control over compliance does not allow management or employees, in the normal course of performing their assigned functions, to prevent, or detect and correct, noncompliance with a type of compliance requirement of a federal or state program on a timely basis. A material weakness in internal control over compliance is a deficiency, or combination of deficiencies, in internal control over compliance, such that there is a reasonable possibility that material noncompliance with a type of compliance requirement of a federal or state program will not be prevented, or detected and corrected, on a timely basis. A significant deficiency in internal control over compliance is a deficiency, or a combination of deficiencies, in internal control over compliance with a type of compliance requirement of a federal or state program that is less severe than a material weakness in internal control over compliance, yet important enough to merit attention by those charged with governance.
Our consideration of internal control over compliance was for the limited purpose described in the first paragraph of this section and was not designed to identifY all deficiencies in internal control over compliance that might be material weaknesses or significant deficiencies and, therefore, material weaknesses or significant deficiencies may exist that were not identified. We did not identifY any deficiencies in internal control over compliance that we consider to be material weaknesses. However, we identified certain deficiencies in internal control over compliance, as described in the accompanying schedule of findings and questioned costs as items 2015-00 I and 2015-003 that we consider to be significant deficiencies.
The Hoboken Public Schools' responses to the internal control over compliance findings identified in our audit are described in the accompanying schedule of findings and questioned costs. The Hoboken Public Schools' responses were not subjected to the auditing procedures applied in the audit of compliance and, accordingly, we express no opinion on the responses.
The purpose of this report on internal control over compliance is solely to describe the scope of our testing of internal control over compliance and the results of that testing based on the requirements of U.S. OMB Circular A-133 and New Jersey OMB Circular I 5-08. Accordingly, this report is not suitable for any other purpose.
167
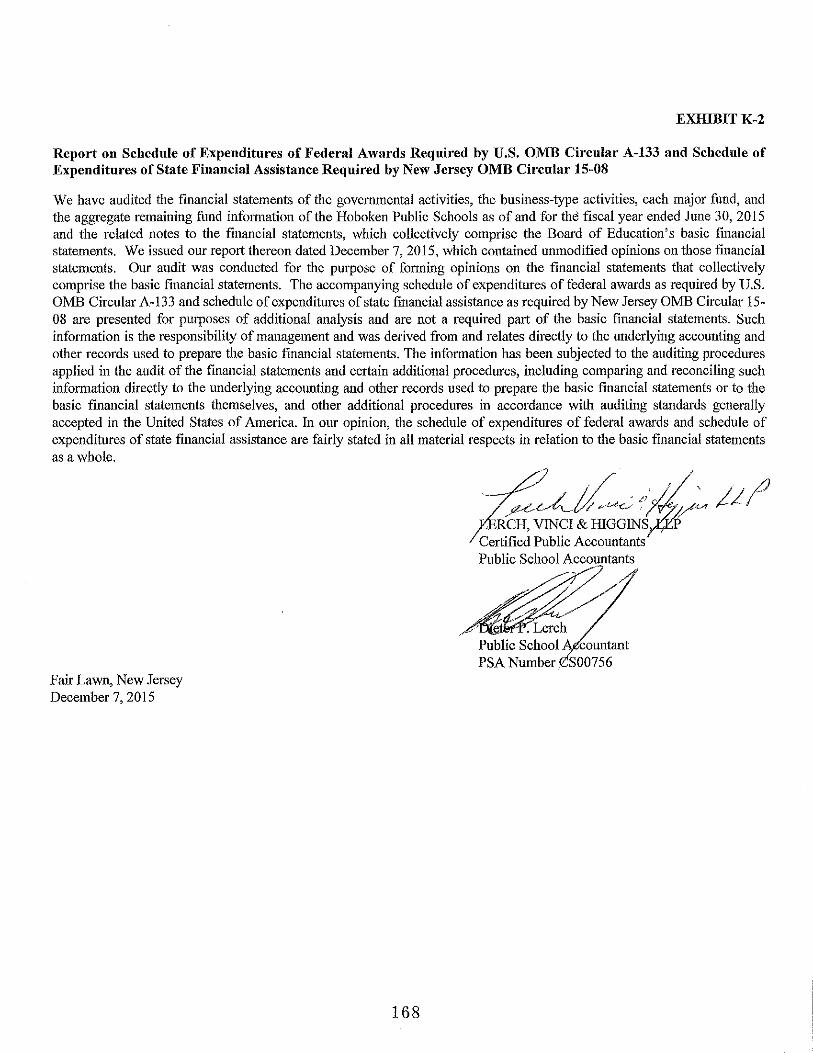
EXHIBITK-2
Report on Schedule of Expenditures of Federal Awards Required by U.S. OMB Circular A-133 and Schedule of Expenditures of State Financial Assistance Required by New Jersey OMB Circular 15-08
We have audited the financial statements of the governmental activities, the business-type activities, each major fund, and the aggregate remaining fund infmmation of the Hoboken Public Schools as of and for the fiscal year ended June 30,2015 and the related notes to the financial statements, which collectively comprise the Board of Education's basic financial statements. We issued our report thereon dated December 7, 2015, which contained unmodified opinions on those financial statements. Our audit was conducted for the purpose of forming opinions on the financial statements that collectively comprise the basic financial statements. The accompanying schedule of expenditures of federal awards as required by U.S. OMB Circular A-133 and schedule of expenditures of state fmancial assistance as required by New Jersey OMB Circular 15-08 are presented for purposes of additional analysis and are not a required part of the basic fmancial statements. Such information is the responsibility of management and was derived from and relates directly to the underlying accounting and other records used to prepare the basic financial statements. The information has been subjected to the auditing procedures applied in the audit of the financial statements and certain additional procedures, including comparing and reconciling such information directly to the underlying accounting and other records used to prepare the basic financial statements or to the basic fmancial statements themselves, and other additional procedures in accordance with auditing standards generally accepted in the United States of America. In our opinion, the schedule of expenditures of federal awards and schedule of expenditures of state financial assistance are fairly stated in all material respects in relation to the basic financial statements as a whole.
Fair Lawn, New Jersey December 7, 2015
168
J._/L~ ;;j~~ j/ / INC! & HIGGINW
Certified Public Accountants Public School Accountants
. Lerch Public School countant PSA Number. S00756

EXH!BIT K-3
HOBOKEN PUBLIC SCHOOLS SCHEDULE OF EXPENDITURES OF FEDERAL A WARDS
FOR THE FISCAL YEAR ENDED JUNE 30,2015
Fedenil Grant or State Program or Balance Carr;,·o,·cr/ Funds Release<l Balance at June 30,1015 Memo Federai/GrantorfPass-Through Grantor/ CFDA Project Award Project at June 30, (Walko,·cr) Cash Budgetary Adjust Adjustments Accounts Unearned (Account Unearned Due to GAAP Pro,ram Title Number Number Amount Period 201-1 Amount R""ei\·cd Expenditures Receh·ables ill Recch·nble ~ ~ Re,·enue Grantor Roceh·able
U.S. Department of Agriculture Passed-through State Department of Education
Enterprise Fund National School Lunch Program 10.555 Non-Cash Assistance (Food Distribution) $ 68.336 711/14·6/30115 $ 68.336 $ 68.336 Non-Cash Assistance (Food Distribution) 62.304 711/IJ-6/30/14 $ 2.794 2.794 Cash Assistance 423.019 7/1114-6/30115 292.887 413.029 $ (130.142) $ (130.1~2) Cash Assistance -146.738 711113-6/30114 (92,285) 92,285
National School Breakfast 10.553 N/A 84.475 711114-6/30/15 54.934 84.475 (29.541) (29.541) National School Breakfast 10.:553 N/A 117.316 7/1/13-6130/14 (23.750) 23.750 After Care Snack 10.555 N/A 10,892 7/1/14-6/30115 7.738 10.892 (3.154) (3.154) After Care Snack 10.555 >II A 2.332 7/1/13-6/30!14 (2.332) 1.332 Fresh Fruits and Vegetables 10.582 12.777 711/14-6/30/15
---- 8.333 _.!1272. ---- ----- ----- ----~ ..... --- ---- (4.44-1)
Total Enterprise Fund (115.573) ---- 550.595 ~ ~) (167,281)
U.S. Department of Health & Human Serdces- Passed through State DepL of Education
General Fund Medical Assistance Program 93.778 N/A 109,948 7/1/14-6/30/15 ---- 209,948 209.948
Total U.S. Dept of Health & Human Svc ---- 209.948 209.948 ----
V.S.. Department of Education- Direct Aid General Fund
Impact Aid 84.041 40-NJ-01-2901 183.914 711/14·6130/15 183.914 183.914 Impact Aid 84.0-11 40-NJ-01-2901 117.81\ 711/13-6/30/14 (117,811) ---- ______!_.!22!_ ---- ---- ---
Total U.S. Dept of Education (117.811) ---- 301.725 ~
~ U.S. Department Of Education o-, Passed-through State DepaMment c.o of Education
General Fund FEMA· Hurricane Sandy 97.036 69.537 (69.537) ----~
Total General Fund [187.348) -----~ ~ ---- ---- ---- ---- ----
Special Revenue Fund Title 1 84.010A NCLB-nl0-14 809.746 7/\/13-6!30/14 106.800 $ (97.104) 52.450 159.250 $ 97.104 Title I 84.0\0A NCLB-2210-15 817.828 711114-6/30115 97.104 688.430 537.842 (97.104) s (919) (226.502) 376.17\ LD.E.A. Part B. Basic Regular 84.027 IDEA-2210-14 709.676 711113-6/30/14 (203.030) (136,645) I 96.035 136,645 6.995 J.D.E.A. Part B. Basic Regular 84.027 IDEA-2210-15 757,563 7/1/14-6/}0/15 136.645 563.182 778.928 (136.645) (331.026) 115.280 I (215.746) I.D.E.A. Part B. Preschool 84.173 IDEA-2110-\5 19,066 7/1/13-6/30114 (811) "' l.D.E.A. Part B. Preschool 8-1.173 lDEA-2210-\5 19.244 711/14-6/30115 811 \8.894 18,894 (81\) (1.16\) 1.161 FEMA- Hurricane Sandy 97.036 954.312 [177.390) 136.985 43,869 [508.784) -124.510 (84.274) Race to the Top 84.413A Race To The Top-2210 91.61\ 9/1111-1\/30115 (12.798) 14.054 1.256 3.337 (3.337)
Continued
The Notes to tile Schedules of Expenditures of federal Awards and State Financial Assistance are an Integral Pan of this Schedule

>--' --:, 0
FedernUGrnntor/P~ss-Tb;ou~h Grantor/ Program Title
U.S. Department or Education Passed-throuj!;h St::ltc Department ofEduoation
Spedal Revenue Fcmd (Continued) Title II Part A Tille II Part A Title II PartD Title Ill Title II\ Title III. Immigrant Title V
Total Special Revenue Fund
Fedcrol CFDA
Number
84.367A 84.367A 84.318X 84.365A 84.365A
84.298A
Grant or State Project Number
NCLB-2210-14 NCLB-2210--15 NCLB-2210-12 NCLB-2210-14 NCLB-2210-15
NCLB-2210-09
Progrnm or Award Amount
' 309,304 310.686
2.103 23.173 14.839 10.359 7.082
HOBOKEN PUBLIC SCHOOLS SCHEDULE OF EXPENDITURES OF FEDERAL A WARDS
FOR THE FISCAL YEAR ENDED JUNE 30,2015
Proje<'t
hrl2.!!
711113-6/30/]4 711114-6130115 911111-8131112 711113-6130114 711114-6130115 711114-6130115
$
Balance at June 30,
201-t
Car;ym·erl (Walko,·er·)
Amount
(15.812} $ (126.172) $
126.172
''" (4.198) (22.851)
22.851
Cash Rccch·cd
18.541 218.405
1.230 15.044 6.088
Budgetal")" Adjust Expenditures Receinbles
s 126.172 $ 276.191 (126.172)
(22.8:51)
13.420 22.851 6.129
AdJustments
ill
' (2.729)
(840} 2.968
Funds Released AcC<Junts Unearned Recci\·ablc ~
s 6.298 ' (6.298)
EXHIBIT K.J
Balance at June 30.2015 (Account Unearned
Receivoblel Revenue
s (218.453) s 160.667
(16.348) 17.972 (4.271) 4.230
Due to Grantor
911108-8131109 ____hill_ ~~~·- -~~~ ~~~- -~~-~ ~~~- -~~- ~~~- -~~- ~~~-
(304.123) ~~~- 1.929.338 1.835.779 ~ ............... _.§.d2! ~ (1.306.545) ~ ~~~-
[$
Total Federal Awards (607.044) -'~~~ $ 3.061.143 s 2.831.944 ~ ~ ~ s (6..:!98} s (1.473.826) s 1.099.991 -'~~~ $
(I) Represents cancelled encumbrance>fpayables. and cancelled accounts receivable in the Special Revenue Fund.
The Notes 10 the Schedules ofE~penditures of Federal Awards and State Financial Assisw.nce are an Integral Part of this Schedule
Memo GAAe
Receh·ablc
(57.786}
(41}
(357.847)
(525.128)

EXHIBIT K-~
HOBOKEN PUBLIC SCHOOLS SCHEDULE OF EXPENDITURES OF STATE FINANCIAL ASSISTANCE
FOR THE FISCAL YEAR ENDED JUNE 30, 2015
Program Balance, Repayment Balance at June 30,2015 MEMO Grant or State or Award Grant at June 30, C~h Transfer from Budgetary of Prior Years' (Accounts Unearned Due to o~e Cum. Total
Swte Grantor/Proeram Title Proje<:t Number Amount .Emm!_ 6Qli Received General Fund E;spenditurcs Carryovers Adlustments ~ Receivablel Revenue ~ Receivable Expenditures
State Department of Education General Fund Transportation Aid 15-495-034--5120-0 14 s 124.289 7/1/14-6/30/15 $ I I 1,860 $ 124,289 s (12.429) s 124.289 Transponallon Aid 14-495-034-5120-0 14 124.289 7!1/IH/30114 $ (12.419) 12.419 Special Education Categorical Aid 15-495-034-5120-089 1,463,760 7!1114-6/30!15 1.319.631 1.463,760 (144,129) 1.463,760 Special Education Categorical Aid 14-495-034-5120-089 1,463.750 7!1/13-6130/14 (141.485) 141.485 School Choice Aid 15-495-034-5068--00 1 1.896.741 7!!114-6/30/\5 \.707.067 \.896,741 (189.674) 1.896.74\ School Choice Aid 14-495-034-5068--00\ 2.821,203 7/\!13-6/30/14 (282,123) 282,\23 Security Aid 15-495-034-5 120-084 725.704 7/1!14-6/30/15 653,134 725.704 (72,570) 725.704 Security Aid 1 4-495--034-5 I 20-084 725,704 711/13-6/30114 (72.574) 72,574 Adjustment Aid 15-495-034-5 1 20-085 5.392.689 7!1!14--6/30/\5 4.853.423 5.392,689 (539.266) 5.392.689 Adjustment Aid 14-495-034-5 1 20-085 5.392,689 7/1!13-6/30/\4 (539,277) 539.277 Add] Adjustment Aid 15-495-034-5120-085 255.024 7/1/14-6/30/15 229.522 255,024 (25.502) 255.024 PARCC Readiness Aid 15-495-034-5120-098 24.610 711!14-6/30/\5 22.149 24.6\0 (2.461) 24.610 Per Pupil Gro"1h Aid 15-495-034-5120-097 24.610 7!1!14--6130/15 22.149 24.610 (2,461) 24.610 Extraordinary Aid 15-495-034-5 1 20-473 205.409 7!1/14-6/30/15 205,409 (205,409) 205.409 E.l:traordinary Aid I 4-495-034-5120-473 241,291 711!13-6/30114 (241,291) 241.291 TPAF Social Security Ta.1: 1 5-495-034-5094-003 1.386.247 711114-6130115 1,264.527 I ,386,247 (121.720) ' (121,720) 1.386.247 TPAF Social Security Tax 14-495-034-5095-002 1.451.304 7/1/13-6/30/\4 (126,510) 126.6\0 TPAF On Behalf Pension NCGI 15-495-034-5094--007 68.489 711/14-6/30/15 68,489 68,489 68,489 Normal Costs 15-495-034-5094-006 951.964 7fl/l4-6/30!15 951,964 951,964 951.964 Post Retirement Med. Contrib. 15-495-034-5094-00 I 1.619.970 7/1114-6/30115 1.619,970 1.619,970 ---- ---- 1.619.970
Total General Fund (1.415779) 14.239,664 14,139,505 ---- (1.315.621) (121.720) 14.139.506
Special Revenue Fund Preschool E.-.;pansion Aid 15-495-034--5120-086 10,295.424 7/1114-6130/15 9.265.882 $ 286.000 10.308,776 $ 1,549,946 $ 62.945 s (1.029,542) s 1.599.539 10.308,776 Preschool Expansion Aid 14.495-034-5120-086 9,700,959 7/\!13-6/30/14 s 577,763 972.\83 (1,549,946) ,..... Family Friendly Centers 15-1 00-034-5120-344 45,463 7/1{14-6/30/\5 45.463 45.463 45.463
-'1 Family Friendly Centers 14-1 00-034-5120-344 45.463 7/1113-6/30/14 $92 s 591 ,..... Family Friendly Centers 13-!00-034-5 1 20-344 45.463 711!12-6/30/13 582 $ 582 NJ School Based Youth Services 15-7550- I 00-452-05 263,976 7/1!14-6/30/15 263,976 263,839 137 263,839 NJ School Based Youth Services- Direct Care 15-7750-100-452 2.474 711!14-6/30/\5 2.474 2.474 NJ School Based Youth Services 14--7550-100-452-05 263,976 7/1!13-6/30/14 1.504 "' 1.822 NJ School Based Youth Services 13-7550- I 00-452-05 268,776 7/\/12-6/30/13 1.060 1.060
Nonpublic Aid Nonpubllc Textbooks I 5-1 00-034-5120-064 59,699 7/1/14-6/30/15 59,699 57,819 \.830 57.819 Nonpublic Textbooks 14-!00-034--5120-064 53,699 7/1/13--6/30114 981 2.389 981 2,389 Nonpublic Textbooks 13-100-034--5120-064 49.881 7fl/12-6/:;Q/13 3,}02 $ 3.302 Nonpublic Nursing 15-100-034--5120-070 95,988 7!1114-6/30/\5 95,988 95,988 95.988 Nonpublic Technology 1 5-100-034-5120-373 32,064 7!1!14-6/30/15 32.064 24,379 7,685 24,379 Nonpublic Technology 14-100-034-5120-373 19,580 711/13-6/30/14 4,093 \.423 4.093 1.423 Nonpublic Technology I 3- I 00-034-5 1 20-373 18,4\0 7!1!12-6/30113 155 155
The Notes to the Schedules of Expenditures of Federal Awards and State Financial Assistance are an integral pare of this schedule.

>--' -:]
"'
State Grantor!Proaram Title
State Department of Education Nonpublic AtLxillary
Compensatory Education Comperu;atory Education
Nonpub1ic Handicapped Supplementary Instruction Supplementary Instruction Examination and Classifka<ion Examination and Classification Examination and Classification Corrective Speech Corrective Speech Corrective Speech English as Second Language Home Instruction PBS1S HSNJRF
Total Special Revenue Fund
Capital Projects Fund School Construction Corporation (SCC) SDA- Direct Payments- Brandt SDA- Direct Payments- Demarest
Total Capital Projects
State Department of Agriculture Enterprise Fund School Lunch Program School Lunch Program
Total Enterprise Fund
Total State Financial Assistance
State Financial Assistance Not Subject to Single Audit Determination
General Fund
Grant or State Project Number
15-1 00-034-5120-067 14-1 00-034-5120-067
15-1 00-034-5120-066 14-100-034-5120-066 15-1 00-034-5120-066 14-100-034-5120-066 13-1 00-034-5120-066 15-1 00-034-5120-066 14-1 00-034-5120-066 13-1 00-034-5120-066 15-1 00-034-5120-066 14-1 00-034-5120-067
2210-050-12-1400 2210-01 0-08-0FAC
15-100-010-3360-067 14-100-010-3360-067
On-BehalfTPAF Pension System Contributions NCGI On-BehalfTPAF Pension System Contributions- Normal Costs On-BehalfTPAF Post-Retirement Medical Contributioru;
Total State Financial Assistance Subject to Single Audit
(!)Cancelled prior year payables.
{2) Funds are being provided by private wrporation not State of New Jersey
NfA- Not Applicable
Program or Award Amount
s 112,423 139,525
51.947 47,251 83,017 69,412 64,644 33.573 59,371 66,402
1,827 1,354 5,000
819,000
923,150 700,338
9.255 10,303
HOBOKEN PUBLIC SCHOOLS SCHEDULE OF EXPENDITURES OF STATE FINANCIAL ASSISTANCE
Grant Period
7/1114-6/30115 711/13-6/30/14
7/1/14-6/30/15 7/1/13-6130/14 7/1/14-6130/IS 711/13-6/30114 711/12-6130/13 711/14-6/30115 71\/13-6/30/14 711/12-6/30/13 711/14-6/30/15 7/l/\3-6/30/14
N/A N/A
9/\/14-6/30/15 911/13-6/30/14
FOR THE FISCAL YEAR ENDED JUNE 30, 2015
Balance, at June 30, Cash
2014 Received
$ 112.423 s 47,163
51,947 3,955
83.017
33.573 27.459
1,827 (1,354) 1.354
(925) 3,939 334.14S
1.000.478 11.025.809
222.875 (700.337) 700.337
(700.337) 923,212
6.242 (2.591) 2,591
(2.591) 8.833
$ (1.118.229) s 26.197.518
(68.489) (951,964)
(1.619.970)
Tmnsfer from General Fund
286.000
-----
$ 286,000
Budgetary ~
$
$
105,794
49.907
79,415
33.573
4.075
11.069.028
222.875
222.875
9.255
9.255
25.440.664
{68.489) (951.964)
(1.619.970)
Carryovers
$
$ (1,118.229) $ 23.557,095 $ 286,000 s 22.800,241 ''---'-
The Notes to the Schedules of Expenditures of Federal Awards and State Financial Assistance are an integral part of this schedule.
Repayment Balance at June 30 2015 of Prior Years· (Accounts Unearned Due to
Adjustments fl) Balances Recei\"ablel Rm·enue Qrantorat
s 6,629 $ 47.163
2.040 3.955
3,602
27.459
1.827
$ 1,061 (2) (334.148)
s (266,012) ~ (1.029.541) 1.599.539 ~
(685,275) 685,275
·····---
······--- (685.275) 685.275 ----
(3.013)
(3.013) ---- ----s (266.012) ~ $ (3.033.451) s 2.284.814 $ 32.500
(266,012) ~ $ (3,033.451) $ 2.284,814 $ 32500
$
$
EXHIBIT K-~
MEMO GAAP Cum. Total
Receivable Expenditures
s
(685,275}
(685.275)
(3.013)
(3,013)
(810.008) $
105.794
49.907
79.415
33.573
4,075
11.069.023
237.375 700.338
938.213
9.255
9.255
26.156.002
(68,489) (61.179)
(\.619.970}
(810,008) $ 24.406.364

HOBOKEN PUBLIC SCHOOLS NOTESTOTHESCHEDULESOFEXPENDITURESOF FEDERAL AWARDS AND STATE FINANCIAL ASSISTANCE FOR THE FISCAL YEAR ENDED JUNE 30, 2015
NOTE 1 GENERAL
EXHIBITK-5
The accompanying schedules present the activity of all federal and state financial assistance programs of the Hoboken Public Schools. The Board of Education is defined in Note l(A) to the Board's financial statements. All federal financial assistance received directly from federal agencies, as well as federal awards and state financial assistance passed through other government agencies is included on the schedule of expenditures of federal awards and state financial assistance.
NOTE 2 BASIS OF ACCOUNTING
The accompanying schedules are prepared and presented using the budgetary basis of accounting with the exception of programs recorded in the food service fund, which are presented using the accrual basis of accounting. These bases basis of accounting are described in Notes l(C) to the Board's fmancial statements. The information in these schedules is presented in accordance with requirements of U.S. OMB Circular A-133, "Audits of States, Local Governments and Non-Profit Organizations" and New Jersey OMB Circular 15-08, "Single Audit Policy for Recipients of Federal Grants, State Grants, and State Aid". Therefore, some amounts presented in these schedules may differ fi·om the amounts presented in, or used in tl1e preparation of, the financial statements.
NOTE 3 RELATIONSHIP TO FINANCIAL STATEMENTS
The financial statements present the general fund and special revenue fund on a GAAP basis. Budgetary comparison statements or schedules (RSI) are presented for the general fund and special revenue fund to demonstrate finance-related legal compliance in which certain revenue is permitted by law or grant agreement to be recognized in the audit year, whereas for GAAP reporting, revenue is not recognized until the subsequent year or when expenditures have been made.
The general fund is presented in the accompanying schedules on a modified accrual basis with the exception of the revenue recognition of the delayed state aid payments in the cun·ent budget year, which is mandated pursuant to N.J.S.A. 18A:22-44.2.. For GAAP purposes, those payments are not recognized until the subsequent year due to the state deferral and recording of certain state aid payments in the subsequent year. The special revenue fund is presented in the accompanying schedules on the grant accounting budgetary basis which recognizes encumbrances as expenditures and also recognizes the related revenues, which may include the delayed state aid payments, whereas the GAAP basis does not. The special revenue fund also recognizes the delayed state aid payments in the current budget year, consistent with N.J.S.A. 18A:22-44.2.
The net adjustment to reconcile from the budgetary basis to the GAAP basis is an increase of $95,268 for the general fund and a decrease of $72,702 for the special revenue fund. See the Notes to Required Supplementary hlformation for a reconciliation of the budgetary basis to the modified accrual basis of accounting for the general and special revenue funds. Awards and financial assistance revenues are reported in the Board's financial statements on a GAAP basis as presented as follows:
Federal State Total
General Fund $ 393,862 $ 14,234,774 $ 14,628,636
Special Revenue Fund 1,808,051 10,866,858 12,674,909
Capital Projects Fund 222,875 222,875 Food Service Fund 602,303 9,255 611,558
Total Financial Assistance $ 2,804,216 $ 25,333,762 $ 28,137,978
173

HOBOKEN PUBLIC SCHOOLS NOTES TO THE SCHEDULES OF EXPENDITURES OF FEDERAL A WARDS AND STATE FINANCIAL ASSISTANCE FOR THE FISCAL YEAR ENDED JUNE 30,2015
NOTE 4 RELATIONSHIP TO FEDERAL AND STATE FINANCIAL REPORTS
EXHIBITK-5
Amounts reported in the accompanying schedules may not necessarily agree with the amounts reported in the related federal and state financial reports due to timing differences between the District's fiscal year and grant program years.
NOTES OTHERINFORMATION
Revenues and expenditures repotied under the National School Lunch Program as non-cash assistance represent current year value received and current year distributions, respectively of the Federal Food Distribution Program. TP AF Social Security contributions in the amount of $1 ,3 86,24 7 represents the amount reimbursed by the State for the employer's share of social security contributions for TPAF members for the fiscal year ended June 30, 2015. The amount reported as TPAF Pension System Contributions in the amount of$1,020,453 and TPAF Post-Retirement Medical Benefits Contributions in the amount of$1,619,970 represents the amount paid by the State on behalf of the District for the fiscal year ended Jnne 30, 2015.
NOTE 6 ON-BEHALF PROGRAMS NOT SUBJECT TO STATE SINGLE AUDIT
On-behalf State Programs for TP AF Pension and Post-Retirement Medical Benefits Contributions as well as on-behalf School Development Authority Educational Facility Construction and Financing Act Program payments are not subject to a State single audit and, therefore, are excluded from major program determination. The Schedule of State Financial Assistance provides a reconciliation of State financial assistance reported in the District's financial statements and the amount subject to State single audit and m'jjor pmgram determination.
NOTE 7 SCHOOL WIDE PROGRAM FUNDS
Schoolwide programs are not separate federal programs as defined in OMB Circular A-133; amounts used in schoolwide programs (i.e., school based budgets) are included in the total expenditures of the program contributing the funds in the Schedule of Expenditure of Federal Awards. The following funds by program are included in schoolwide programs in the District.
Federal Program
Title I, Part A: Grants to Local Educational Agencies Title II, Part A: Teacher and Principal Training and Recruiting
Total
174
Amount
$393,602 86 572
_$4_80 174

EXJHmliUTK-6 HOBOKEN JPUBUC SCHOOLS
SCHEDULE OF FINDINGS AND QUESTIONED COSTS FOR THE FISCAL YEAR ENDED JUNE 30, 2015
Part I- Summary of Auditor's Results Financial Statement Section
Type of auditor's report issued:
Internal control over financial reporting:
I) Material weakness(es) identified?
2) Were significant deficiency(ies) identified that were not considered to be material weaknesses?
Noncompliance material to the basic fmancial statements noted?
Federal Awards Section
Internal Control over compliance:
1) Material weakness(es) identified?
2) Were significant deficiency(ies) identified that were not considered to be material wealmesses?
Type of auditor's report on compliance for major programs:
Any audit fmdings disclosed that are required to be reported in accordance with OMB Circular A-133 (section.510(a))?
Identification of major programs:
CFDA Number(s)
10.555
10.553
84.010
84.027
84.173
Dollar threshold used to distinguish between Type A and Type B Programs
Auditee qualified as low-risk auditee?
175
Unmodified
yes X no
yes X none repmted
yes X no
yes X no
X yes none reported
Unmodified
X yes none
Name ofFederal Program or Cluster
National School Lunch and After Care Snack
National School Breakfast
Title I
IDEA Basic
IDEA Preschool
$300,000
______ yes X no ----''---

EXHffiiTK-6
HOBOKEN SCHOOL DISTRICT SCHEDULE OF FINDINGS AND QUESTIONED COSTS (CONT'D)
FOR THE FISCAL YEAR ENDED JUNE 30, 2015
Part I- Summary of Auditor's Results
State Awards Section
Internal Control over compliance:
1) Material weakness( es) identified?
2) Were significant deficiency(ies) identified that were not considered to be material weaknesses?
Type of auditor's report on compliance for major programs:
Any audit findings disclosed that are required to be reported in accordance with N.J. OMB Circular 15-08, as amended?
Identification of major programs:
State Grant/Project Number (s)
495-034-5120-089
495-034-5068-001
495-034-5120-084
495-034-5120-085
495-034-5 I 20-098
495-034-5 I 20-097
495-034-5094-003
495-034-5 I 20-086
Dollar threshold used to distinguish between Type A and Type B Programs
Auditee qualified as low-risk auditee?
176
____ yes X no ----"''-----
---"X-'-_ yes ____ none reported
Unmodified
---"X-'-_ yes none ----
Name of State Program
Special Education Categorical Aid
School Choice Aid
Security Aid
Adjustment Aid
P ARCC Readiness Aid
Per Pupil Growth Aid
TPAF Social Security Tax
Preschool Expansion Aid
$ 684,007
____ yes _ _..:.:X:___ no

HOBOKEN PUBLIC SCHOOLS SCHEDULE OF FINDINGS AND QUESTIONED COSTS
FOR THE FISCAL YEAR ENDED JUNE 30, 2015
Part 2- Schedule of Financial Statement Findings
EXHIBIT K-6
This section identifies the significant deficiencies, material weaknesses, and instances of noncompliance related to the financial statements that are required to be reported in accordance with Chapter 5.18 of Government Auditing Standards.
THERE ARE NONE.
177

HOBOKEN PUBLIC SCHOOLS SCHEDULE OF FINDINGS AND QUESTIONED COSTS
FOR THE FISCAL YEAR ENDED JUNE 30, 2015
Part 3- Schedule of Federal and State Award Findings and Questioned Costs
EXHIBITK-6
This section identifies the significant deficiencies, material weaknesses, and instances of noncompliance, including questioned costs, related to the audit of major federal and state programs, as required by OMB Circular A-133 and New Jersey OMB's Circular 15-08.
CURRENT YEAR FEDERAL AWARDS
Finding 2015-001
With respect to our audit of Title I and IDEA programs, the invoices submitted by Catapult, Inc. did not provide adequate detail to properly support the number of students serviced, the services provided as well as the hourly rates charged. Additionaiiy, the contract did not always specify the detail of services and corresponding rates to be charged.
Federal program information
Title I IDEA Basic IDEA Preschool
84.010 84.027 84.173
Criteria or specific requirement
OMB A-133 Grant Compliance Supplement
Condition
Invoices submitted for Title I services included hourly rates and services billed, however, no supporting documentation was provided to verify dates of service and student attendance. In addition, the contract did not specify the academic services that Catapult would provide and was not signed by a Catapult representative. The contract for IDEA services did not specify services provided and associated rates. For both Title I and IDEA, the supporting documentation provided was not detailed enough to verify proper amounts were charged.
Questioned Costs
Unknown
Context
Payments made to Catapult Learning LLC for Title I and IDEA services could not be verified as proper charges.
Unknown.
Charges for services could not be verified.
178

HOBOKEN PUBLIC SCHOOLS SCHEDULE OF FINDINGS AND QUESTIONED COSTS
FOR THE FISCAL YEAR ENDED JUNE 30, 2015
Part 3- Schedule of Federal and State Award Findings and Questioned Costs
EXHIBITK-6
This section identifies the significant deficiencies, material weaknesses, and instances of noncompliance, including questioned costs, related to the audit of major federal and state programs, as required by OMB Circular A-133 and New Jersey OMB's Circular 15-08.
CURRENT YEAR FEDERAL A WARDS
Finding 2015-001 (Continued)
Recommendation
With respect to Title I and IDEA programs, all invoices submitted by Catapult be detailed and properly supported as to the number of students serviced, the services provided and the hourly rates charged be expressly approved in the contract. Furthermore, the District pre-audit bills submitted by Catapult to verifY proper charges.
Views of Responsible Officials and Planned Corrective Actions
Management has reviewed this finding and has indicated it will review and revise its procedures to ensure corrective action is taken.
179

HOBOKEN PUBLIC SCHOOLS SCHEDULE OF FINDINGS AND QUESTIONED COSTS
FOR THE FISCAL YEAR ENDED JUNE 30, 2015
Part 3- Schedule of Federal and State Award Findings and Questioned Costs
EXHIBITK-6
This section identifies the significant deficiencies, material weaknesses, and instances of noncompliance, including questioned costs, related to the audit of major federal and state programs, as required by OMB Circular A-133 and New Jersey OMB's Circular 15-08.
CURRENTYEARFEDERALAWARDS
Finding 2015-002
Our audit of the meal reimbursements revealed several instances where the number of meals claimed did not agree with the monthly edit worksheets. In addition, the incorrect number of operating days for November 2014 was claimed. Also, not all after school snack tally sheets were available for audit.
Federal program information
School Breakfast National School Lunch After School Snack
Criteria or specific requirement
10.553 10.555 10.556
OMB A-133 Grant Compliance Supplement
Condition
See Finding
Questioned Costs
Unknown.
Context
The number of meals served per meal count records did not agree to the number of meals claimed for reimbursement.
Unknown.
District may be incorrectly claiming meals served.
Recommendation
Prior to submitting reimbursement claims, the amounts to be reported be verified to the meal count activity records and edit check worksheets.
Views of Responsible Officials and Planned Corrective Actions
Management has reviewed this finding and has indicated it will review and revise its procedures to ensure corrective action is taken.
180

HOBOKEN PUBLIC SCHOOLS SCHEDULE OF FINDINGS AND QUESTIONED COSTS
FOR THE FISCAL YEAR ENDED JUNE 30, 2015
Part 3- Schedule of Federal and State Award Findings and Questioned Costs
EXHIBITK-6
This section identifies the significant deficiencies, material weaknesses, and instances of noncompliance, including questioned costs, related to the audit of major federal and state programs, as required by OMB Circular A-133 and New Jersey OMB's Circular 15-08.
CURRENT YEAR STATE AWARDS
Finding 2015-003
With respect to our audit of the Preschool Education Aid program, the invoices submitted by Catapult, Inc. did not provide adequate detail to properly support the number of students serviced. The services provided as well as the hourly rates charged. Additionally, the contract did not always specifY the detail of services and corresponding rates to be charged.
State program information:
Preschool Education Aid 495-034-5120-086
Criteria or specific requirement:
State Grant Compliance Supplement- State Aid Public
Condition:
Invoices and supporting documentation submitted for Preschool Education Aid services are not detailed enough to verifY services being provided and rates charged.
Questioned Costs:
None.
Context:
Payments made to Catapult Learning LLC for Preschool Education Services.
Cause:
Unknown.
Effect:
Charges for services could not be verified
Recommendation
With respect to the Preschool Education program, all invoices submitted by Catapult be detailed and properly supported as to the number of students serviced, the services provided and the hourly rates charged be expressly approved in the contract. Furthermore, the District pre-audit bills submitted by Catapult to verifY proper charges.
Views of Responsible Officials and Planned Corrective Actions
Management has reviewed this finding and has indicated it will review and revise its procedures to ensure corrective action is taken.
181
HOBOKEN PUBLIC SCHOOLS SUMMARY SCHEDULE OF PRIOR AUDIT FINDINGS
FOR THE FISCAL YEAR ENDED JUNE 30, 2015
EXIDBITK-7
This section identifies the status of prior-year findings related to the basic financial statements and federal and state awards that are required to be reported in accordance with Chapter 6.12 of Government Auditing Standards, U.S. OMB Circular A-133 (Section .315(a)(b)) and New Jersey OMB's Circular 04-04.
STATUS OF PRIOR YEAR FINDINGS
Finding 2014-001
Our audit of free and reduced meal applications found that applications are not being signed by determining District official(s).
Current Status
Corrective action has been taken.
Finding 2014-002
The District is not maximizing its efforts under the Special Education Medicaid Initiative (SEMI) Program for obtaining Federal reimbursement for special education services.
Current Status
Corrective action has been taken.
Finding 2014-003
Our audit indicated several instances where post travel reports that substantiated the purpose and relevance of the travel were not maintained with the payment packet.
Current Status
Corrective action has been taken.
182