hmrc compliance costs and commercial impact of december 2008 vat … · 2013-10-14 · hmrc...
TRANSCRIPT

HMRC Compliance Costs and Commercial Impact of December 2008 VAT Rate Change
Prepared for
Her Majesty’s Revenue and Customs
Prepared by
Peter Myant and Janine Hawkins
Angel Corner House 1 Islington High Street London N1 9AH
www.orc.co.uk
Tel. 020 7675 1026 E-mail [email protected]
October 2010
Her Majesty’s Revenue and Customs Research Report Number 103

Her Majesty’s Revenue and Customs Research Report Number 103
© Crown Copyright 2010 Published by Her Majesty’s Revenue and Customs.
Disclaimer: The views in this report are the authors’ own and do not necessarily reflect those of HM Revenue & Customs.

Contents
Page
1� Executive Summary 1�
1.1�Background and methodology 1�
1.2� Impact of compliance 1�
1.3�Commercial Impact 3�
1.4�The reversion to 17.5% in January 2010 4�
2� Background to research 5�
2.1�Pre-Budget Report 5�
2.2� Impact assessment 5�
2.3�Research commissioned 7�
2.4� Interpreting the results: a cautionary note 7�
2.5�Methodology 8�
2.6�Structure of report 12�
3� Impact of compliance 14�
3.1�Background to compliance 14�
3.2�Overview of compliance activities 17�
3.3�Familiarisation with the rate change 22�
3.4�System changes 32�
3.5�Re-pricing standard-rated goods and services 43�
3.6�Extra bookkeeping 51�
3.7�Business operational activities relating to the rate change 59�
3.8�Overall time burden 65�
3.9�Overall impact of compliance 76�
3.10� Time and cost-saving initiatives 80�
3.11� Conclusion 82�

4� Commercial impact 83�
4.1 Introduction 83�
4.2�Approach to pricing 83�
4.3�Sales impact of rate change 89�
4.4�Overall impact of rate change 91�
4.5�Conclusion 97�
5� The reversion to 17.5% in 2010 98�
5.1�Comparing time and costs 98�
5.2�Suitable notice period for a rate change 101�
5.3�Help that HMRC / Government could provide for rate reversal 104�
5.4�Conclusion 106�
6� Conclusion 107�
6.1� Impact of compliance 107�
6.2�Commercial impact 108�
6.3�Rate reversal from 15% to 17.5% 108�
Appendix A – Profile 110�
A.1�Respondents’ role 110�
A.2�Number of sites 111�
A.3�Number of employees 112�
A.4�Sales and accounting processes 113
Appendix B – Questionnaire 116�
Appendix C – References 136�

List of figures and tables
Page
Table 2.1 Costs of compliance .................................................................................. 6
Figure 2.1 Research design........................................................................................ 8
Table 2.2 Task analyses completed ........................................................................ 10
Table 2.3 Completed interviews .............................................................................. 12
Figure 3.1 VAT schemes (% using) .......................................................................... 15
Figure 3.2 How businesses heard about the rate change (% citing) ........................ 16
Table 3.1 Familiarisation with rate change .............................................................. 18
Table 3.2 Adjusting prices of goods and services ................................................... 18
Table 3.3 Additional Bookkeeping ........................................................................... 18
Table 3.4 System changes ...................................................................................... 19
Table 3.5 Business operational activities ................................................................ 19
Figure 3.3 Activities that were undertaken as a result of the rate change (% mentioning) …………………………………………………………………………………. 20
Figure 3.4 Categories of activities undertaken as a result of the rate change (% undertaking) …………………………………………………………………………………. 21
Figure 3.5 Familiarisation with the rate change – what was involved ....................... 22
Table 3.6 Familiarisation with the rate change - what was involved by size of business (% undertaking each task) ............................................................................. 23
Figure 3.6 Familiarisation with the rate change – who was involved?...................... 25
Table 3.7 Familiarisation with the rate change – who was involved by size of business (% involving) .................................................................................................. 26
Table 3.8 Familiarisation – who was involved (task analyses) ................................ 26
Figure 3.7 Familiarisation with rate change – time spent broken down by type of staff …………………………………………………………………………………. 27

Figure 3.8 Familiarisation with rate change – total time spent (%) ........................... 28
Figure 3.9 Familiarisation by sector – % spending 2 or more hours......................... 29
Table 3.9 Descriptive statistics on familiarisation (hours spent) .............................. 30
Table 3.10 Descriptive statistics on familiarisation by organisation size (hours spent) …………………………………………………………………………………..30
Figure 3.10 System changes – what was involved (% mentioning) ........................ 33
Table 3.11 What was involved in system change – by size of business (% undertaking each task).................................................................................................. 33
Figure 3.11 System changes – who was involved .................................................. 36
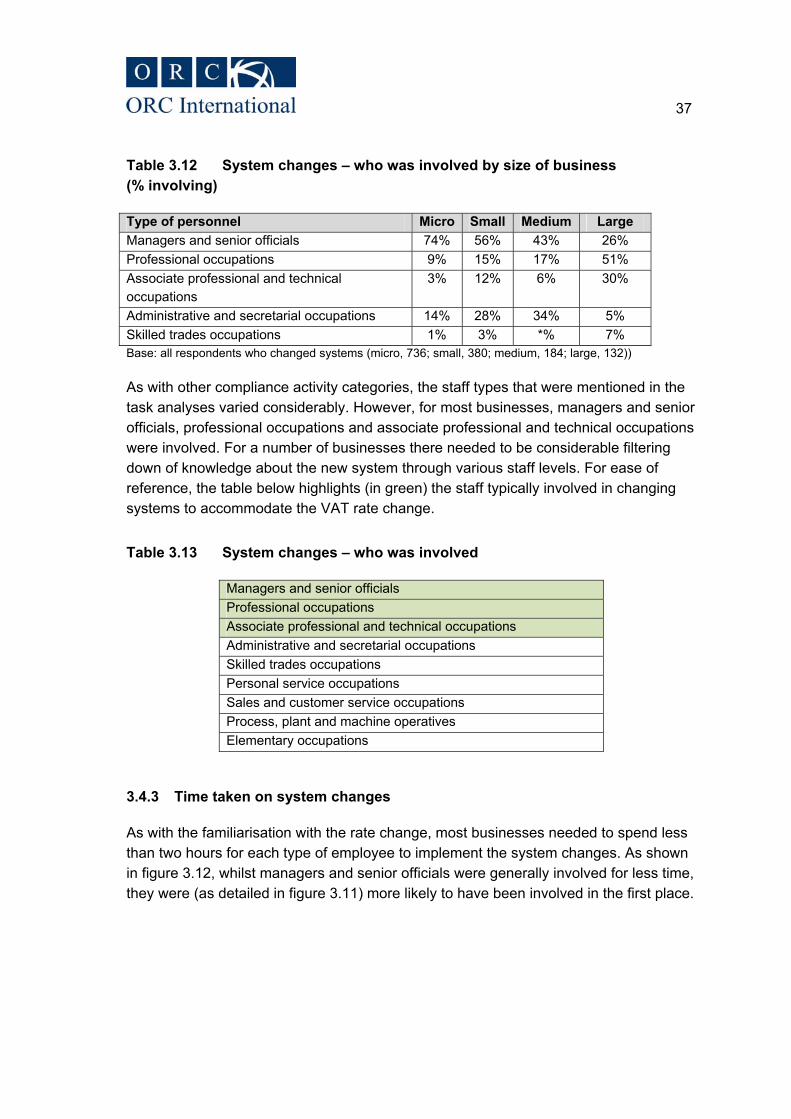
Table 3.12 System changes – who was involved by size of business (% involving) …………………………………………………………………………………..37
Table 3.13 System changes – who was involved...................................................... 37
Figure 3.12 System changes – time spent broken down by type of staff ................ 38
Figure 3.13 System changes – total time spent ...................................................... 39
Figure 3.14 Systems changes by sector – % spending 2 or more hours ................ 40
Table 3.14 System changes descriptive statistics (hours spent) ............................... 41
Table 3.15 System changes descriptive statistics by size of organisation (hours spent) …………………………………………………………………………………..41
Figure 3.15 Re-pricing – what was involved (% citing)............................................ 43
Table 3.16 Re-pricing – what was involved by size of business (%) ......................... 44
Figure 3.16 Re-pricing – who was involved............................................................. 46
Table 3.17 Re-pricing – who was involved by size of business (% involving) ........... 47
Table 3.18 Re-pricing of goods and services – who was involved ............................ 47
Figure 3.17 Re-pricing – who it involved ................................................................. 48
Figure 3.18 Re-pricing – total time spent ................................................................ 49
Figure 3.19 Re-pricing goods/services by sector – % spending 2 or more hours ... 50

Table 3.19 Re-pricing descriptive statistics (hours spent) ......................................... 50
Table 3.20 Re-pricing descriptive statistics by size of organisation (hours spent) .... 51
Figure 3.20 Extra bookkeeping checks – what was involved.................................. 52
Table 3.21 Extra bookkeeping – what was involved by size of business (%)............ 53
Figure 3.21 Extra bookkeeping – who was involved ............................................... 55
Table 3.22 Extra bookkeeping – who was involved by size of business (% involving) …………………………………………………………………………………..55
Table 3.23 Extra bookkeeping – who was involved (task analyses).......................... 56
Figure 3.22 Extra bookkeeping – how long was involved ....................................... 56
Figure 3.23 Extra bookkeeping – total time spent ................................................... 57
Figure 3.24 Extra bookkeeping checks – % spending 2 hours or more .................. 58
Table 3.24 Extra bookkeeping checks descriptive statistics (hours spent)................ 59
Table 3.25 Extra bookkeeping checks descriptive statistics by size of organisation (hours spent)…...............................................................................................................59
Table 3.26 Business operational activities – what was involved, % by business size60
Figure 3.25 Business operational activities – who was involved............................. 61
Table 3.27 Business operational activities – who was involved by size of business. 62
Table 3.28 Business operational activities – who was involved (task analyses) ....... 62
Figure 3.26 Business operational activities – how long was involved ..................... 63
Figure 3.27 Business operational activities............................................................. 64
Table 3.29 Business operational activities descriptive statistics (hours spent) ......... 65
Table 3.30 Business operational activities descriptive statistics by size of organisation (hours spent) ………………………………………………………………………………….65
Table 3.31 Time burden descriptive statistics (hours spent) ..................................... 66
Figure 3.28 Category breakdown of overall time burden ........................................ 66
Table 3.32 Mean and median by business size ........................................................ 67
Table 3.33 Time burden breakdown by category and business size......................... 67
Table 3.34 Time burden breakdown by type of transactions..................................... 68
Figure 3.29 Time burden by sector ......................................................................... 69
Table 3.35 Time burden breakdown by category and sector..................................... 71
Table 3.36 Compliance burden key statistics (hours spent) ...................................... 72
Figure 3.30 Category breakdown of overall compliance burden............................. 72
Table 3.37 Compliance burden by business size (hours spent) ................................ 73
Table 3.38 Compliance burden by size and category ............................................... 73
Table 3.39 Compliance burden by type of transaction and category......................... 73
Figure 3.31 Compliance burden by business sector ............................................... 74
Table 3.40 Compliance burden by category and sector ............................................ 75
Figure 3.32 Impact of compliance ........................................................................... 76
Table 3.41 “Complying was straightforward” by industry sector................................. 77
Figure 3.33 Impact of not having sufficient time...................................................... 79
Figure 3.34 The time of year (before Christmas) affected the costs ....................... 80
Figure 3.35 Time and cost-saving initiatives ........................................................... 81
Figure 4.1 Business passed on the VAT saving to customers.................................. 84
Table 4.1 Approach to pricing by business size ...................................................... 85
Table 4.2 Approach to pricing by customer profile .................................................. 85
Figure 4.2 Business sectors most and least likely to have passed on the savings (% passing on savings) ...................................................................................................... 86
Figure 4.3 How much of the saving was passed onto customers............................. 87
Table 4.3 Proportion passing on VAT savings by payment method........................ 87
Figure 4.4 Has the rate change had a positive sales impact? .................................. 89
Figure 4.5 Sales impact of the rate change by sectors (% who agreed there was a positive impact) ............................................................................................................. 90
Figure 4.6 Impact on their organisation .................................................................... 91
Figure 4.7 Impact on their customers ....................................................................... 92
Table 4.4 Impact on organisation by size of business (%) ...................................... 94
Table 4.5 Impact on customers by size of business (%) ......................................... 96
Figure 5.1 How the time and cost of reversal will compare ...................................... 98
Table 5.1 How the time and cost of reversal will compare by organisation size...... 99
Table 5.2 How the time and cost of reversal will compare by organisation sector (%) …………………………………………………………………………………..99
Figure 5.2 Minimum amount of notice businesses would like for rate changes...... 101
Table 5.3 Minimum amount of notice businesses would like for rate changes by organisation size ......................................................................................................... 102
Table 5.4 Minimum amount of notice businesses would like for rate changes by organisation sector...................................................................................................... 103
1
1 Executive Summary
1.1 Background and methodology
In December 2008, the standard VAT rate was temporarily reduced to 15%; a change that remained in place until January 2010. ORC International was commissioned to undertake research with businesses and trade associations to explore the compliance burden and commercial impact of the VAT rate change.
The research programme was conducted in two phases:
x The qualitative phase comprised 36 depth interviews with a selection of businesses (31 interviews) and business stakeholders (5 interviews); and,
x The quantitative phase comprised 2,005 telephone interviews with a sample of businesses from a range of sectors and of different sizes.
1.2 Impact of compliance
This research focuses on the costs incurred by businesses implementing the VAT rate reduction. This research focuses on four categories of additional compliance activity that HMRC considered central to undertaking the VAT rate reduction. Throughout this report these costs are referred to as "compliance costs" and the "compliance burden."
The tasks that businesses undertook in relation to the rate change were grouped into five categories: familiarisation, system changes, adjusting prices, additional bookkeeping and business operational activities1. Activity across the categories was as follows:
x 78% of all businesses reported that they had undertaken one or more of the familiarisation tasks, which generally involved reading materials on the change (60%) and decisions on what their business needed to do to comply (49%) and whether to pass on the rate saving to customers (36%)
x Two-thirds (67%) of all businesses undertook one or more of the activities relating to system changes; updating and changing computerised accountancy
1 In addition to the four categories that were central to complying with the VAT rate reduction, there were also certain related activities that were deemed by HMRC not to be essential for compliance, but were undertaken by businesses for commercial reasons. These business operational activities are included in the report as it is important to understand the full range of business activity relating to the rate change.

2
systems (49%), learning how to change the system (36%) and updating and changing manual accountancy systems (30%)
x Additional pricing costs were only an issue for a minority of businesses (27%): the most common activities were altering website prices (11%), reissuing invoices (10%), and altering price tags and labels (10%)
x Additional bookkeeping was undertaken by 71% of businesses; most commonly involving checking invoices from suppliers (57%) and checking VAT returns (48%)
x Business operational activities were undertaken by 43% of businesses; with 32% monitoring systems, 27% testing systems and 25% communicating changes to customers and suppliers.
The time spent on activities resulting from the VAT rate change (as of the fieldwork conducted in May/June 2009) has been calculated including and excluding business operational activities:
x The mean total time spent on compliance activities (familiarisation, system changes, additional pricing costs and additional bookkeeping, but excluding business operational activities) was 10.2 hours; the median time spent was 2.5 hours;
x Overall, the mean total time spent by businesses as a result of the rate change (including business operational tasks) was 11.4 hours, with a median score of 2.7 hours;
x The differences between the average scores (both mean and median) for both the compliance and total time burdens shows that, whilst the majority of businesses found that compliance took little time, a minority found the activity relating to the rate change to be very time-consuming;
x The overall compliance burden (excluding operational activities) for businesses can be split into familiarisation activities (38%), additional bookkeeping (31%), system changes (23%) and adjusting prices (8%). When operational activities are included, the equivalent breakdown is familiarisation (34%), additional bookkeeping (28%), system changes (21%), operational activities (9%) and adjusting prices (8%).
Larger businesses were more likely to spend longer complying with the rate change than smaller ones. Whilst businesses with no employees spent on average (median) 0.6 hours, businesses with 250+ employees spent 11 hours. Three sectors, in particular, had a relatively large compliance burden: Electricity, Gas, Steam and Air-conditioning supply (EGSA) (median – 6hrs); Public Administration and Defence (PAD) (median –

3
5hrs); and Human Health and Social Work (HHSW) (median – 8hrs). These sectors are characterised by the fact that they are less likely than average to be businesses on single sites, are more likely to be using some type of VAT scheme and less likely to make quarterly VAT returns.
Relatively high proportions of businesses (of all sizes) involved senior personnel in activities relating to the rate change. This was the case for all task categories, but was particularly apparent for familiarisation activities (75% of businesses undertaking familiarisation involved managers and senior officials). The qualitative research suggests one possible reason for senior level involvement was the commercial nature of the rate change. The initial decision whether to pass on the rate change to consumers was, for many, a complex commercial decision with repercussions for an organisation’s reputation.
The vast majority of businesses felt confident that they were fully compliant (98%), that they knew what to do to comply (95%), that they were given enough time to comply (90%) and that compliance was straightforward (89%). This is encouraging feedback in light of the short time scale for the rate change. However, medium and large businesses were less positive about their compliance experience. The qualitative research findings suggest that some businesses found that the short-time scales resulted in additional bookkeeping in the form of issuing credit notes to customers who had paid for goods and services up-front.
1.3 Commercial Impact
Almost four in five businesses (78%) reported that they passed the VAT rate-change savings on to their customers. Large businesses (90%), those selling to both B2B and B2C customers (87%) and those in the Wholesale and Retail (87%), Transport and Storage (87%), Professional, Scientific and Technical (85%), Construction (84%) and Education (83%) sectors were most likely to have passed on the savings.
The main reasons for businesses indicating they passed on the rate change to their customers were that it seemed the right thing to do (43%), that their organisation’s prices were quoted excluding VAT (30%), or that they thought they had no choice but to pass it on (21%).
Although the majority passed on the rate reduction, most businesses felt that it had no impact on either their customers (55%) or their organisation (63%). Only relatively small proportions were either positive about its impact (on customers, 24%; on the organisation, 16%) or negative about its impact (on customers, 4%; on the organisation 9%). However, perhaps, as a reflection of the fact that large businesses tended to spend proportionately more time on activity related to the rate change, they were notably more negative about the impact (customers, 28%; organisation, 35%) than

4
micro (customers, 4%; organisation, 9%), small (customers, 3%; organisation, 8%), and medium companies (customers, 1%; organisation, 8%).
Of those businesses that chose not to pass on the additional savings, over one third (36%) felt it had little or no impact on their business and a further 30% did not know how the additional income had been used. Even so, some businesses were positive about its impact; 12% said it had improved cash flow, 5% felt it had reduced costs, and 4% that it had increased profits.
1.4 The reversion to 17.5% in January 2010
The original impact assessment conducted by HMRC assumed that time spent on, and the costs associated with compliance, would be slightly lower for the reversion to 17.5% than the original change because of learning effects.
x However, more than three quarters of businesses (77%) felt that time and costs expended would be the same, and only 12% thought it would be less (a further 6% actually stated that it would be more);
x Whilst Small and Medium Enterprises (SME) thought that the time spent and costs would be the same (78%), large businesses were more divided with 43% anticipating that it would be more and 20% that it would be less;
x Similarly, businesses using retail VAT schemes were slightly more divided than others; 60% felt it would be the same, 12% more and 24% less
x Encouragingly many of the sectors with larger than average compliance burdens, including Financial and Insurance (29%), Information and Communication (26%), Education (20%) and Public Administration (18%), were more likely [than average] to think that reversion would have a lower impact than the original change.
The VAT rate reduction was introduced with a week’s notice; whilst only 5% of businesses suggested this time scale caused them a problem, 80% of businesses felt that more than a week’s notice would have been preferable (with the majority suggesting four weeks).
Lastly, 55% felt there was nothing that the government or HMRC could do to help them prepare for the future rate increase.

5
2 Background to research
2.1 Pre-Budget Report
In the Pre-Budget Report on 24 November 2008, the Chancellor announced that the standard rate of VAT was to be temporarily reduced to 15% on 1 December 2008. Only standard-rated sales were affected, with no changes made to sales that are zero-rated or reduced-rated goods. The 15% rate would remain in place until 31 December 2009; from 1 January 2010, the standard rate would revert to 17.5%.
The precise economic impact of the VAT measure depended on a number of factors, including the extent to which the reduction in prices was passed through to consumers, the extent to which temporarily lower prices stimulated greater volume of spending, and the amount that was spent on domestically produced goods and services.
This research focuses on the costs incurred by businesses implementing the VAT rate reduction. This research focuses on four categories of additional compliance activity that HMRC considered central to undertaking the VAT rate reduction. Throughout this report these costs are referred to as "compliance costs" and the "compliance burden.”
2.2 Impact assessment
The government recognised that the rate change would impose compliance burdens on business, and, along with the announced rate change, produced an impact assessment which estimated the associated costs to businesses. This factored in the costs of transition to the new system whilst assuming that the ongoing costs of compliance with the VAT system remained the same.
The impact assessment identified the following categories of costs for businesses:
x Familiarisation: it was expected that businesses would need to familiarise themselves with the changes; it was assumed that it would take between half an hour (for a small business with simple VAT affairs) to three hours (for a large business)
x Re-pricing: businesses would be expected to incur costs in re-pricing their standard-rated goods. Whilst it was acknowledged that businesses selling goods and services at prices including VAT and large businesses selling many different products in multiple stores would be particularly affected, the typical range was from £25 (small business) to £600 (larger businesses)
x Extra bookkeeping costs: it was expected that businesses with manual VAT records would need to take extra care with their billing, accounting systems and first [rate change] VAT return. HM Treasury estimated that relatively few

6
businesses would be affected by this activity, and it would mainly affect small businesses. Therefore, it was estimated that between 1 to 15 hours would be involved, at a cost of between £13 and £450 each
x Extra accountancy costs: it was anticipated that businesses outsourcing their accounts might incur extra fees to cover any additional bookkeeping checks arising from the rate change. It was estimated this would take between one additional hour (for the smallest businesses) and 10 additional hours (for larger businesses). It was estimated that for smaller businesses this additional cost would be £25, but for larger businesses it would be approximately £275
x System changes / upgrades: the costs involved in changing systems and upgrading software to cope with the change. It was expected that the vast majority of businesses would have to alter systems and that the estimated costs per business would be between £13 and £325 (in time costs). The purchase costs were largely unknown, but a number of assumptions were used for the purposes of the impact assessment. It was assumed that 20% of businesses would incur an additional purchasing charge, and this would be between £10 for a smaller business to £500 for a larger-sized business.
The anticipated costs of complying with the VAT rate change were, therefore, as follows:
Table 2.1 Costs of compliance
Category of cost Cost per business Total cost
Familiarisation £7 (smaller business) – £100 (larger business) £24.55m
Re-pricing £25 (smaller business) – £600 (larger business) £50m
Extra paper accounts checks
£13 (smaller business) – £450 (larger business) £5m
Extra accountancy checks
£25 (smaller business) – £275 (larger business) £26.5m
System changes
£13 (smaller business) – £325 (larger business); purchasing costs for 20% of businesses – £10 (smaller business) – £500 (larger business)
£70m
Total costs N/A £176.05m
Source: HM Treasury Impact Assessment, http://www.hm-treasury.gov.uk/d/pbr08_vat_1845.pdf
7
2.3 Research commissioned
HMRC commissioned ORC International to undertake research to explore the compliance costs associated with the changes in the VAT rate and also to gather data on the commercial impact.
This project has two primary objectives:
x To gather information on the compliance costs of the VAT rate reduction. The information collected will be used by HMRC to assess the reasonableness and accuracy of the impact assessment; and,
x To gather data about the commercial impact of the rate change; for example, by establishing the extent to which the change has been passed on in prices and when price changes were made.
2.4 Interpreting the results: a cautionary note
This is a survey research report around the costs businesses believed they incurred as a result of the VAT rate change; it is not intended to be a full diagnosis of the impact of the policy change. The findings are based on results from a survey of a sample of businesses and a qualitative study. As such the information is not presented as, or intended to be, exact, indisputable fact but rather, as with all research of this kind, the valid perceptions of the respondents.
The quantitative figures produced are as robust as possible and representative of the UK business population. However, because it is a sample, there is a margin of error associated with these numbers when used as a reflection of the population as a whole, and through the limitation of any survey tools to collect exact facts.
Respondents’ answers are based on recall: they are a best-estimate rather than based on objectively collected data. Responses given are what a business said they did as a result of the rate change; it is impossible to say whether they acted in the most efficient way or how much of the costs were driven by enacting just the minimum that HMRC required them to do to comply, or what went beyond that.
The statistics on the impact of the rate change are similarly perceptions. They are valid views from businesses of what they believe the impact on them was. However, the nature of the economic uncertainty at the time of the survey meant there were many different impacts on prices and sales. It is, therefore, difficult to isolate the effect of the VAT rate change on prices or on consumption.

8
2.5 Methodology
The research was conducted amongst VAT-registered businesses using a mixed methodological approach, including both qualitative and quantitative methods; as set out in figure 2.12.
Figure 2.1 Research design
Familiarisation involving ORC International project team, HMRC and trade associations
Qualitative research with trade associations (this also included sector representatives and industry groups) to ascertain a broad understanding
of the issues
More detailed phase of qualitative fieldwork with businesses including a ‘task analysis’, whereby businesses were asked to describe, in detail,
the steps involved in the compliance process. It also explored the commercial impact and feelings towards the planned reversion
A quantitative (CATI) survey of 2,005 UK businesses, representative by size and sector. This used a structured questionnaire based on the
qualitative findings to map compliance activity according to task, personnel involved, time spent and external costs incurred. It also
covered a limited number of questions on the commercial impact and businesses’ attitudes towards reverting back to 17.5%
2.5.1 Familiarisation and Research Design
The familiarisation phase began with an arranged meeting with HMRC involving key policy stakeholders, and a period of desk review of relevant material, including the impact assessment that was provided along with the rate reduction. The research design was further informed by a workshop with stakeholders in industry to develop the qualitative topic guides for the first stage of the fieldwork.
2 A more detailed discussion of the overall sample design, and the various stages involved in the research is provided in the accompanying Technical Report.

9
2.5.2 Sampling
HMRC required the survey to include an achieved sample of 2,000 VAT-registered businesses across different turnover categories (from zero to over £10 million). The database used for this study was taken from the HMRC database of VAT-registered businesses, which is comprised of approximately two million businesses.
The sample methodology adopted was a stratified sampling design. The primary sampling units are businesses, with strata defined by turnover (six categories defined by the HMRC population frame) and cross-classified with type of industry (21 in all). In total, the design used 120 selection strata3. The strata were disproportionately allocated, as having sample sizes proportionate to the corresponding population sizes would have led to samples for the smaller population groups which were too small for robust analysis. Minimum sample sizes for groups of businesses and turnover were, therefore, guaranteed.
In total, 38,082 records were requested and provided by HMRC for the purposes of this research. Following receipt of the sample from HMRC, a number-matching exercise was undertaken. All telephone matching was undertaken by UK Changes, a specialist agency which is an approved supplier of ORC International.
Whilst the overall match rate was 39.2% or 14,923 pieces of sample, there was variation between industry segments and VAT-able turnover categories. On average, larger and more well-established businesses achieve a better match rate as they are less likely to move and / or close down and have a higher likelihood of having a business-registered landline (rather than it being registered as a consumer line or being mobile only).
The next stage involved all potential respondents being sent an opt-out letter prior to fieldwork starting to provide them with the opportunity to decline to take part – a practice which is in line with HMRC data protection requirements. Respondents were given the details of a dedicated helpline set up by ORC International and the contact details of a researcher at HMRC. Six percent of businesses contacted opted out of the research. Whilst there was little variation by VAT-able turnover, opt-out rates by sector varied from 3% to 10%.
3 Two industry categories, ‘Activities of households as employers; undifferentiated goods- and service-producing activities of households for own use’ and ‘Activities of extraterritorial organisations and bodies’, were merged to form one category ‘Activities of households as employers/extraterritorial organisations’.

10
2.5.3 Qualitative research
The first phase of fieldwork, conducted in April and May 2009, comprised 36 qualitative interviews with a selection of businesses (31 interviews) and business stakeholders (5 interviews). Whilst the businesses were selected according to size and sector to be a cross-section of business in the UK, the stakeholders were selected not to be representative but rather because they had interesting experiences and insight into businesses’ ability to comply with the rate change. HMRC inputted into the selection of relevant stakeholder organisations and the business sampling was led by ORC International.
A ‘task analysis’4 technique was used to structure the business interviews. The interview started with a description of the activity and a broad description of what the business did to comply. Thereafter, questions were used in order to direct the respondent towards a clear description of the task. This hierarchical task analysis resulted in a detailed understanding of what was involved in compliance, which in turn, formed the basis of the quantitative stage that followed.
Table 2.2 Task analyses completed Industry Type Number of interviews completed Services 22 Production, construction and utilities 9 Size 0-67k 7 67k – 1m 10 1m+ 14
The stakeholder interviews were designed in a similar manner, but the purpose was to obtain a more general overview of business or a sector in general. The following topics were covered in phase 1 of the fieldwork:
x what was involved in compliance (broken down into the specific tasks involved)
x who was involved in compliance
x how much time was involved in compliance (broken down by member of staff)
x what external costs were involved in compliance
4 Task analysis is the study of what an individual is required to do, in terms of actions and / or cognitive processes, in order to achieve a task objective; therefore it provides structure for the description of tasks or activities. Further details on the process involved are available in the technical report and in Task Analysis Techniques (Embrey, D., 2000).

11
x what the commercial impact of the rate change was.
The main purpose of the interviews was to gain as much insight as possible into the compliance impact of the rate change as the outputs were to be used in the quantitative research and needed to represent a comprehensive list of activities. Therefore, the commercial impact was covered in some interviews for only a relatively short period of time due to the compliance impact taking priority.
2.5.4 Review of qualitative findings
The qualitative phases of research were used to develop the quantitative Computer Assisted Telephone Interviewing (CATI) questionnaire; to structure the list of tasks involved in business compliance with the VAT rate change (from familiarisation to system change); and to allow this to be evaluated with respondents.
2.5.5 Quantitative fieldwork
The main quantitative survey was conducted by telephone using Computer Assisted Telephone Interviewing (CATI). Using CATI ensured that all routing was correctly followed, and allowed certain logic checks to be built into the survey. This meant that for the questions designed to elicit precise time allocation for compliance activities, the interviewer was able to read out a total time taken for confirmation by the respondent at the end of each section ensuring that the results for this study were as accurate as possible. The questionnaire used has been included in Appendix B.
Following the initial telephone matching exercise, opt-out stage and removal of sample for the task analyses, a total of 13,976 potential respondents remained. These became the available records for the quantitative stage of the survey. The available sample was randomised and divided into four batches; each sample batch was loaded up separately onto the CATI system to help improve sample efficiency. Fieldwork was conducted between 26 May 2009 and 18 June 2009.
The sample was monitored closely during fieldwork to see how the interviews completed were falling out (according to the two stratifying variables). Call-backs were utilized (on average four per respondent) where appropriate in order to follow up with initially contacted subjects. We worked towards an overall achieved sample size of 2,000.
The distribution of completed interviews by turnover and industry segment is shown in table 2.3. A more detailed profile of the achieved interviews has been provided in Appendix A.

12
Table 2.3 Completed interviews
The final response rate was 44% based on the known valid sample. At the end of fieldwork, respondents and non-respondents were compared across the subgroups using the available sample frame characteristics (turnover and industry); this was to provide information relating to the presence of non-response bias. Following the profile comparison analysis, chi-squared tests were conducted to check statistically whether the differences/variations seen in the profile of the responders versus non-responders were significant. The findings of both analyses provided evidence that there was an element of non-response bias within the achieved sample. Therefore, weights were calculated and applied to the data to adjust for non-response.
2.6 Structure of report
The broad structure of the report is as follows:
x Chapter 3 analyses the impact on businesses of complying with the change in the standard rate of VAT. This examines findings from the three strands of the research, so includes 2,005 interviews with businesses, 31 task analyses, and 5 interviews with trade associations. It includes discussion of what the business did to comply, which personnel within the company were involved and how long
13
they were involved. It also looks at the overall impact of compliance and businesses’ views of the guidance materials that HMRC provided
x Chapter 4 moves on to look at the commercial impact that the rate change had on businesses. This includes information on whether businesses passed on the rate change and the perceived impact on their customers, sales, and their organisation
x Chapter 5 looks forward to the reversion to 17.5%; this examines businesses’ views on how this will compare with the rate reduction, how long they should be given for a rate change, and what HMRC could do to help businesses
x Finally, chapter 6 includes concluding comments on the implications of the research findings.
14
3 Impact of compliance
3.1 Background to compliance
This chapter of the report details businesses’ experience of complying with the change in the standard rate of VAT. It provides analysis and discussion from the qualitative and quantitative stages of the research.
3.1.1 Type of VAT business
Respondents were asked whether the quoted prices for their products and / or services included the standard rate of VAT. In total, 61% quoted goods and services inclusive of VAT, 36% did not (and 3% did not know).
x Those who accounted for sales at the point of sale were more likely to quote prices inclusive of VAT than those who accounted through invoicing (73% vs. 59%)
x Similarly, those who primarily sold to consumers or a mix of consumers and businesses were more likely to quote prices including VAT than those who sold primarily to other businesses (77% and 78% vs. 48%, respectively).
Businesses were asked what VAT scheme they were on; the most common schemes were Annual Accounting (14%), Cash Accounting (13%) and Flat Rate Scheme (8%). 70% commented that they made quarterly VAT returns.5
5 The data for figure 3.1 is from a multi-code question; therefore, responses add up to more than 100%.

15
Figure 3.1 VAT schemes (% using)
Base: all respondents (2005); multiple responses allowed.
3.1.2 Finding out about the VAT rate change
Approximately three in five (58%) businesses heard that they would have to comply with a VAT rate change informally through the TV news and 31% found out through a letter from HMRC.

16
Figure 3.2 How businesses heard about the rate change (% citing)
Base: all respondents (2005)
In the qualitative research, trade associations were asked how the news of the change in standard-rate VAT was first received by their respective sectors. It was felt that the reaction from industry was ‘subdued’; there were particular concerns with the amount of time allowed and the burden that the change placed upon many businesses:
“There was a small tremble of panic, because the last time we had a rate change, which was a rate change the other way, it was actually quite difficult to do and everybody was
fearful that there would be similar difficulty.” (trade association)
“A VAT rate change has always been speculated – could we cope with it if it ever happened, and what would we do in the circumstances if it did happen. Everybody
assumed that when the VAT rate changed it would go up; I don’t think anybody anticipated it would go down, and nobody anticipated that we would only be given one
week to do it.” (trade association)

17
More specifically, the most immediate concern identified by stakeholders was whether it was possible to implement the required changes in the time available. This was particularly the case for those businesses selling directly to consumers.
“The immediate concern was the amount of work that we were expected to do, particularly if you were a retailer selling stuff to the public, the public might well expect
to see the price cut.” (trade association)
“Some members had expressed concern about what [the rate change] might mean in practice, essentially around the practical implications of making changes to thousands
of product lines within stores at very short notice.” (trade association)
Some were also concerned that the demands of the rate change could contradict other regulations that businesses are bound by:
“Members operate in a regulated environment covered by the Consumer Credit Act; it is a legal requirement … to give [customers] 10 days’ notice if you are going to change
their direct debit.” (trade association)
It was felt that future rate changes should ensure that all the legal obligations of businesses should be able to be met when deciding on appropriate time-scales.
3.2 Overview of compliance activities
From the task analyses and trade association interviews, a detailed understanding was formed of what businesses did to comply with the rate change. A comprehensive list of categories, tasks and sub-tasks was formed; this information was used as the basis of the quantitative interviews.
Tables 3.1 to 3.5 show the over-arching categories and sub-categories that were used as the basis for the quantitative fieldwork.

18
Table 3.1 Familiarisation with rate change
Table 3.2 Adjusting prices of goods and services
Table 3.3 Additional Bookkeeping

19
Table 3.4 System changes
Table 3.5 Business operational activities
The overarching categories and sub-categories were used as the main structure for the interviews with the businesses in the quantitative stage.
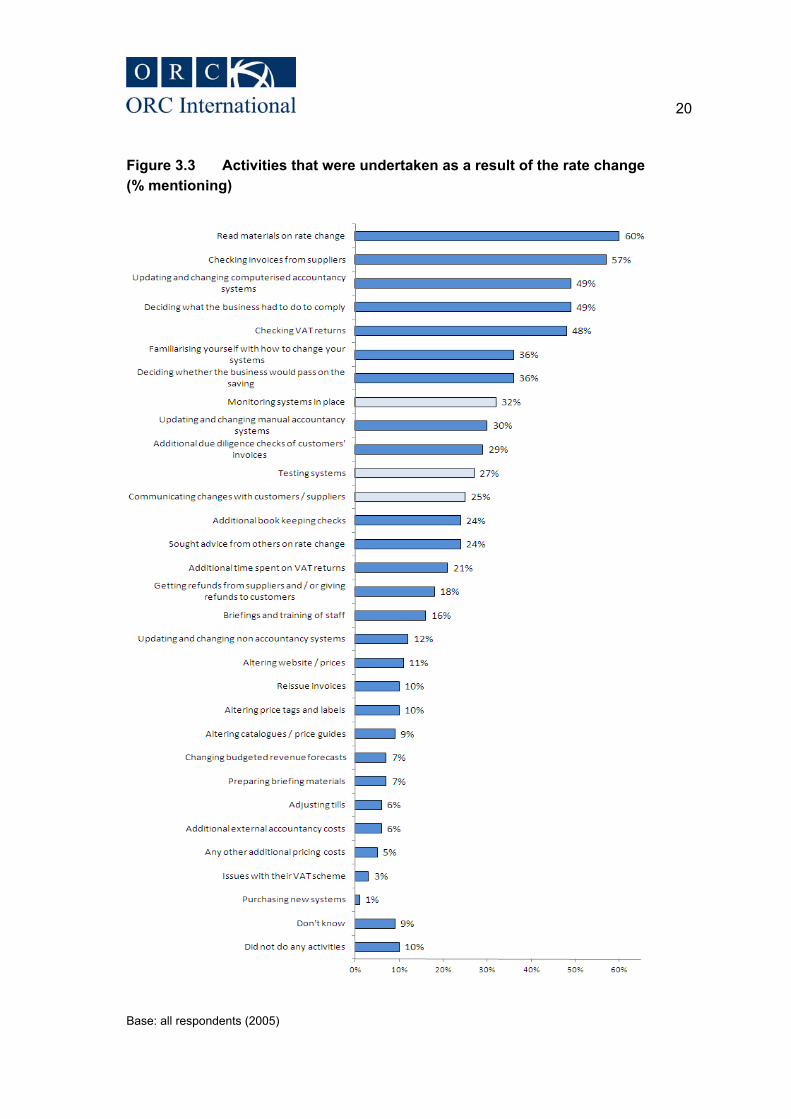
Figure 3.3 gives a full breakdown of activities that businesses undertook as a result of the rate change, including whether or not the activity was considered a direct cost of compliance (with compliance highlighted in darker blue). A large proportion of all businesses had to read materials on rate change (60%), check invoices from suppliers (57%), update and change computerised accountancy systems (49%), decide what the business had to do to comply (49%), and check VAT returns (48%). One in ten respondents did not complete any compliance activities as a result of the VAT rate change.
20
Figure 3.3 Activities that were undertaken as a result of the rate change (% mentioning)
Base: all respondents (2005)

21
Each of the activities was categorised according to tables 3.1 to 3.5 presented earlier to allow for aggregated analysis. As shown in figure 3.4 most businesses had to familiarise (78%), undertake extra bookkeeping (71%), and change systems (67%). A substantial minority also had to undertake business operational activities6 (43%) and re-price goods (27%).
Figure 3.4 Categories of activities undertaken as a result of the rate change (% undertaking)
Base: all respondents (2005)
6 Operational activities were tasks that were not deemed compliance activities by HMRC. These tasks were related to activities in the other four categories but have been kept separate. For example, a business may have changed their systems, and then decided to monitor the change that they had made. The additional monitoring was considered a commercial decision, the initial change a compliance activity (as per table 3.5).
22
3.3 Familiarisation with the rate change
3.3.1 What familiarisation involved
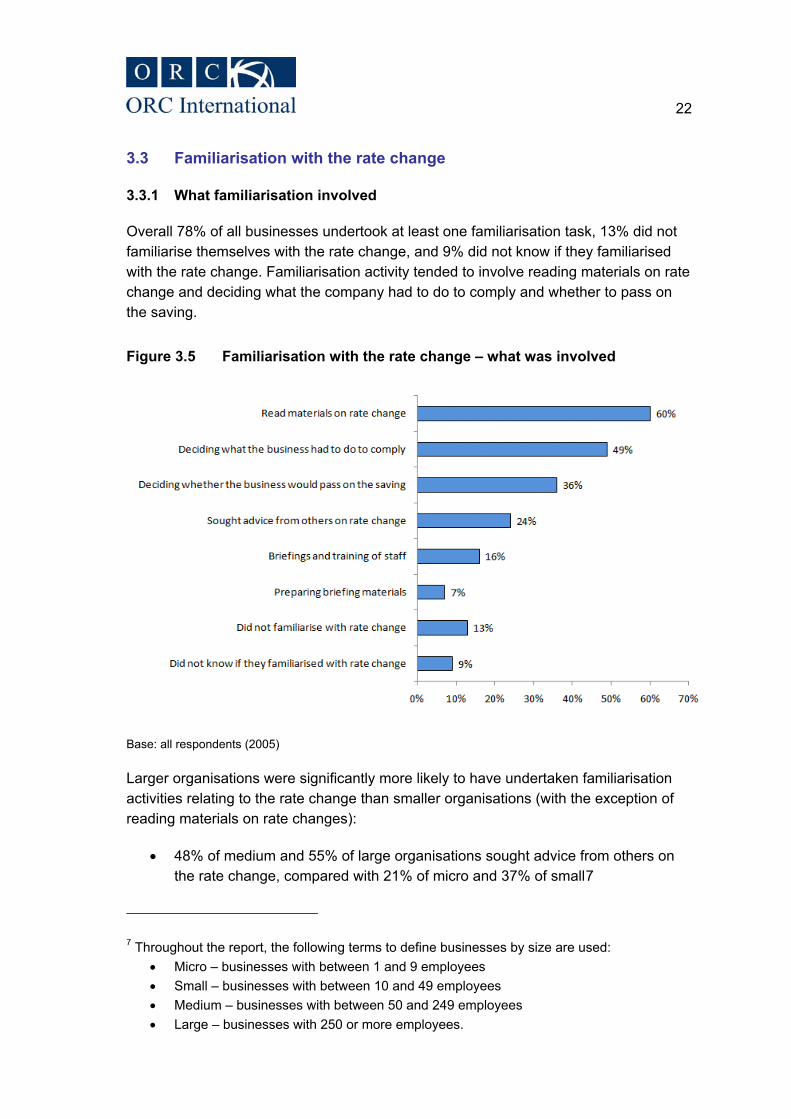
Overall 78% of all businesses undertook at least one familiarisation task, 13% did not familiarise themselves with the rate change, and 9% did not know if they familiarised with the rate change. Familiarisation activity tended to involve reading materials on rate change and deciding what the company had to do to comply and whether to pass on the saving.
Figure 3.5 Familiarisation with the rate change – what was involved
Base: all respondents (2005)
Larger organisations were significantly more likely to have undertaken familiarisation activities relating to the rate change than smaller organisations (with the exception of reading materials on rate changes):
x 48% of medium and 55% of large organisations sought advice from others on the rate change, compared with 21% of micro and 37% of small7
7 Throughout the report, the following terms to define businesses by size are used: x Micro – businesses with between 1 and 9 employees x Small – businesses with between 10 and 49 employees x Medium – businesses with between 50 and 249 employees x Large – businesses with 250 or more employees.

23
x 42% of medium and 56% of large organisations prepared briefing materials, compared with 5% of micro and 12% of small
x 86% of medium and 77% of large organisations decided what the business had to do to comply, compared with 46% of micro and 57% of small
x 70% of large organisations briefed and trained staff, compared with 11% of micro, 36% of small and 45% of medium
x 59% of medium and 59% of large organisations decided whether the business would pass on the saving, compared with 34% of micro and 39% of small.
Table 3.6 Familiarisation with the rate change - what was involved by size of business (% undertaking each task)
Task Micro Small Medium Large Read materials on rate change 57 71 74 76 Sought advice from others on rate change 21 37 48 55 Preparing briefing materials 5 12 42 56 Briefings and training of staff 11 36 45 70 Deciding what the business had to do to comply 46 57 86 77 Deciding whether the business would pass on the saving
34 39 59 59
Base: all respondents (micro, 1204; small, 436; medium, 211; large, 149)8
Through the task analyses discussion, it was apparent that ‘familiarisation’ often involved meetings, reading materials and briefing staff members to ensure that everyone was fully aware of what was involved. However, it was suggested that this did not inevitably result in additional work as this could often be included as part of pre-planned meetings.
“It was a question of sending information out, meeting with them, just talking it through, but that just fell in line with our normal cycle because we have quarterly update
meetings with them. We built that in and went through the whole thing, so, armed with the guidance that the Revenue put out, and the various scenarios that we might come up with in providing a service over a period of time, etc, we went through all that and it
actually, touch wood, wasn’t too bad.” (business interview, services, 10m+)
“It was a case of just making sure that the relevant people within the office had a copy of the documentation.” (business interview, production, 10m+)
8 Five respondents did not state how many employees they had in their organisation.
24
For some organisations, familiarisation was a more complex process whereby they attempted to identify the impact on their customers as well as their own organisation. For example, one leading software provider commented:
“In terms of the familiarisation of details ... we had to understand [the rate change] for ourselves but also understand it for our customers, and we had a lot of additional
phone calls the day after the announcement; but also we were putting up on the web simple questions and answers for them ... with our customers, the day after, so on Tuesday 2nd December, we had an additional call volume of 85%, and our phones were
ringing off the hook.” (business interview, services, 10m+)
Similarly, two large retail organisations felt the information about the change needed to be filtered down to shop-floor staff. Both businesses quoted prices on their shelves so anticipated that they would get customer queries, and, therefore, they needed to be able to suitably train and brief staff:
“Developing materials that we could give to Customer Services, developing materials that we could give to customers, it was educating the buyers in the business ... who
have to manage the profit line ... so they have to go through each of the products and change the stuff ... just coming up with the idea of what we could and couldn’t do ...
education of the people, what happens when there is a VAT change? What invoices can you process at 17.5%? What do you have to reject?”
(business interview, services, 10m+)
“Most of the complaints go to a customer service desk – we don’t want somebody blocking up the till, but you are talking about the level of people who are trying to deal with these queries, they are not exactly tax experts, training people who are not tax
experts.” (business interview, services, 10m+)
3.3.2 Who was involved in the familiarisation process
Managers and senior officials (75%) were most often involved in familiarising with what needed to be done to comply. Administrative and secretarial occupations (20%) and professional occupations (12%) were also commonly involved, but to a far lesser extent. Whilst this high level of senior involvement is to be expected given the proportion of small businesses in the UK economy, the trade associations interviewed also suggested that they discussed the implications of the rate change with senior managers and officials even in large businesses. This would be particularly the case for the familiarisation process whereby strategic decisions were made, for example, whether or not to pass on the rate change:
“We were having regular contact at a relatively surprisingly senior level in the first instance, contact with CEOs, MDs of significant members ... that would be unusual because normally it would tend to be delegated because there are people who are
specifically charged with interfacing with that.” (trade association)
25
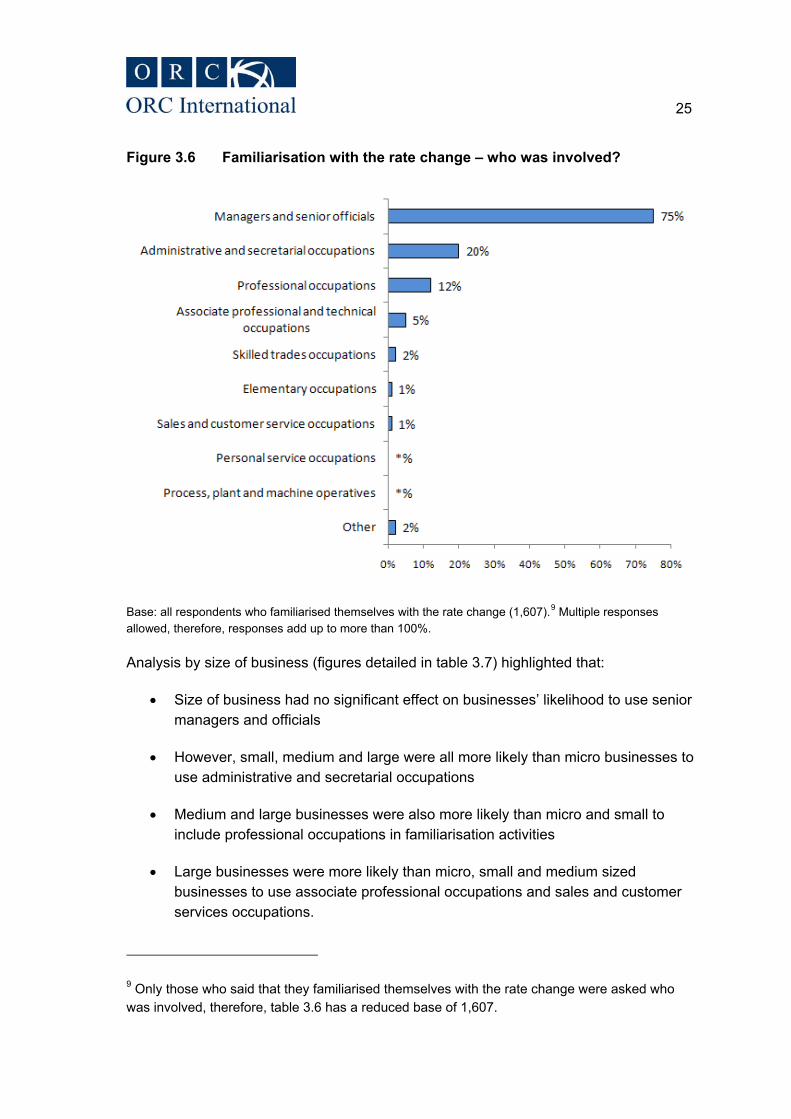
Figure 3.6 Familiarisation with the rate change – who was involved?
Base: all respondents who familiarised themselves with the rate change (1,607).9 Multiple responses allowed, therefore, responses add up to more than 100%.
Analysis by size of business (figures detailed in table 3.7) highlighted that:
x Size of business had no significant effect on businesses’ likelihood to use senior managers and officials
x However, small, medium and large were all more likely than micro businesses to use administrative and secretarial occupations
x Medium and large businesses were also more likely than micro and small to include professional occupations in familiarisation activities
x Large businesses were more likely than micro, small and medium sized businesses to use associate professional occupations and sales and customer services occupations.
9 Only those who said that they familiarised themselves with the rate change were asked who was involved, therefore, table 3.6 has a reduced base of 1,607.

26
Table 3.7 Familiarisation with the rate change – who was involved by size of business (% involving)
Task Micro Small Medium Large Managers and senior officials 75% 71% 77% 75% Professional occupations 10% 13% 42% 61% Associate professional and technical occupations
3% 11% 4% 45%
Administrative and secretarial occupations 17% 30% 40% 41% Sales and customer occupations 0% 4% 3% 36% Base: all respondents who familiarised themselves with the rate change (1,607). Multiple responses allowed, therefore, responses add up to more than 100%.
The task analyses found that there were certain types of staff that were involved in familiarisation more than others. Most businesses only involved managers and senior officials, professional occupations and associate professional and technical occupations. Table 3.8 shows, in highlighted cells, all the staff levels that were mentioned as taking part in familiarisation.
Table 3.8 Familiarisation – who was involved (task analyses)
Managers and senior officials Professional occupations Associate professional and technical occupations Administrative and secretarial occupations Skilled trades occupations Personal service occupations Sales and customer service occupations Process, plant and machine operatives Elementary occupations
3.3.3 Time taken on familiarisation activities
Respondents were asked for the time committed to familiarisation activities for each staff member mentioned. Whilst businesses less commonly had to involve them, associate professional and technical occupations and sales and customer service occupations were generally used for a longer period of time when they were involved. In contrast, whilst most businesses involved managers and senior officials, time taken was minimal.

27
Figure 3.7 Familiarisation with rate change – time spent broken down by type of staff
Base: all respondents who familiarised themselves with the rate change (1,607) (managers and senior officials, 1192; professional occupations, 279; administrative and secretarial occupations, 298; associate professional and technical occupations, 110; skilled trades occupations, 36; sales and customer service occupations, 43). Respondents allowed to select multiple types of staff, therefore, the base breakdown adds up to more than total number of respondents (1,958 compared to 1,607).
The figures given for each business were totalled and an overall amount of time spent on familiarisation with rate change was calculated. For 39% of all businesses, the familiarisation10 process took less than an hour to complete; 16% stated it took between 1 and 1.99 hours; 31% took at least 2 hours; 5% were unable to estimate and 9% did not know whether they familiarised.
10 Businesses that reported no familiarisation was involved for their business were included in this calculation as no time taken. Similar amendments to calculations were made for system changes, re-pricing, extra bookkeeping and operational activities.

28
Figure 3.8 Familiarisation with rate change – total time spent (%)
Base: all respondents (2005)
There were several significant differences in terms of the familiarisation burden by size:
x Large businesses were more likely than micro, small, and medium businesses to have spent 10 or more hours familiarising themselves with what they had to do (large, 51%; medium, 19%; small, 16%; micro, 5%)
x Businesses whose sales were split equally between business to business (B2B) and business to consumer (B2C) were more likely than those who sold primarily to B2B or to B2C to state that it took 10 or more hours (15% compared with 5% and 6%, respectively)
x 69% of those that quoted prices excluding VAT were able to familiarise in less than 2 hours; this compared with 61% of those who quote including VAT
x As the rate change was expected to impose a greater burden on the retail sector as a whole, it is not surprising that users of the VAT retail scheme had a longer than average familiarisation period. Indeed, 22% of users of the VAT retail scheme spent 5 or more hours on familiarisation (compared with the average of all businesses of 12%).
29
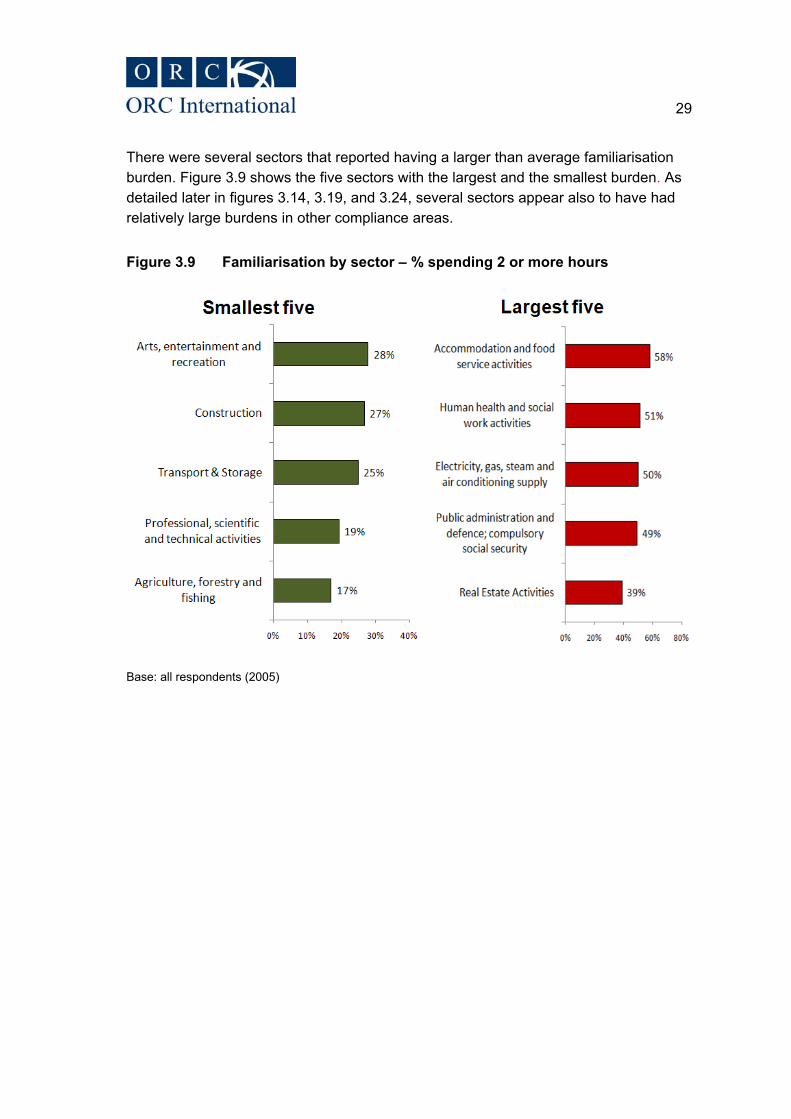
There were several sectors that reported having a larger than average familiarisation burden. Figure 3.9 shows the five sectors with the largest and the smallest burden. As detailed later in figures 3.14, 3.19, and 3.24, several sectors appear also to have had relatively large burdens in other compliance areas.
Figure 3.9 Familiarisation by sector – % spending 2 or more hours
Base: all respondents (2005)

30
Overall, the (mean) average time businesses spent on familiarisation with the rate change was 4.1 hours; the median average was much lower at 0.5 hours. Analysis by the type of customers shows that B2B organisations (mean - 3 hours) had a less time-consuming familiarisation period than B2C (mean - 5.5 hours) or B2B / B2C (mean - 5.3 hours)11. Further analysis shows that as the size of organisation increased, so too did the required amount of familiarisation. Whereas, the mean for a micro organisation was 2.5 hours, the mean for a large organisation was 131 hours (see table 3.10).
Table 3.9 Descriptive statistics on familiarisation (hours spent)
Statistic Overall B2B B2C B2B / B2C Mean 4.1 3.0 5.5 5.3 Median 0.5 0.5 1.0 1.0 Minimum 0.0 0.0 0.0 0.0 Maximum 3000.0 380.0 1300.0 3000.0 Base: all respondents who were able to estimate a figure for familiarisation (1,727)
Table 3.10 Descriptive statistics on familiarisation by organisation size (hours spent)
Statistic Overall Micro Small Medium Large Mean 4.1 2.5 5.6 10.6 131 Median 0.5 0.5 1.0 2 14 Minimum 0.0 0.0 0.0 0.0 0.0 Maximum 3000.0 468.0 268.0 380.0 3000.0 Base: all respondents who were able to estimate a figure for familiarisation (1,727)
These statistics reaffirm what was found in the task analyses, whereby the majority of businesses required a relatively short period of time for familiarisation; for example one business commented:
“It took two minutes on a phone call to my accountant, just to confirm that was all I needed to do, two minutes reading up on the VAT change in the Map manual, just to make sure that was correct, and then doing it.” (business interview, services, 0-67k)
However, as with the quantitative stage, there were exceptions: as mentioned earlier, a software provider found that they had to invest considerable resources understanding what it meant not only for themselves but also for their customers. A retailer commented having listed, at length, all the complexities relating to the rate change that they had to understand:
11 Where groups of organisations are referred to as B2B, B2C or B2C/B2B this refers to their relative sales split between selling to consumers and businesses.

31
“I dread to think how many thousands of hours it was…” (business interview, services, 10m+)
3.3.4 Guidance received
42% of businesses received external guidance to help them understand what they needed to do; 57% did not and 1% did not know. This guidance was most commonly sought from either HMRC (35%) or from an accountant (42%). There were significant differences in whether they sought guidance between different profiles of businesses:
x Those who were primarily B2C were more likely than B2B to have received outside guidance (49% vs. 39%)
x Those who rely on computerised accounting systems or an agent for their accounting processes were more likely than manual accounting firms to have sought guidance (46% and 50% vs. 36%)
x Larger businesses were more likely than smaller businesses to have received outside guidance (large, 72%; medium, 60%; small, 56%; micro, 38%).
Whilst many businesses [in the task analyses] found compliance so straightforward that they did not need any help or guidance from HMRC, those that did were generally positive. One business commented that the documents provided were helpful, and another said that it covered all the essentials:
“They were useful, yes, and to be fair, a lot of the literature that comes out now is more useful than it used to be, it’s written in a better way.” (business interview, services,
10m+)
“I think from the documents we’ve been talking about, they were self-explanatory, fairly straightforward, I actually think they have improved a lot on their guidance side and I wouldn’t have hesitated just contacting them.” (business interview, services, 10m+)
“Well you just pick up the bits that are relevant to you really, don’t you? I know they’ve got to cover all sorts of markets so no, I think it was self-explanatory and covered
everything we needed to know.” (business interview, production, 10m+)
The main issue that some businesses found slightly confusing relating to the rate reduction was how to treat continuous services that are provided before and after December 2008. It is likely that many businesses will treat the rate reversal in a similar way to treating the initial reduction, so unequivocal clarification of the right procedure will be important from HMRC:
“The only issue that came up as a result of the rate change was whether we should apply it to the services we provide after December 1st … there are two ways to look at it, if the services had been conducted before December 1st, but the invoice went out after
32
1st December, should we charge 15% or 17.5%? Well after some debate, we decided that if an invoice was dated 1st December and onwards, we would charge 15%.”
(business interview, services, 67k-100k)
“I suppose the only grey area was maybe buying materials at 17.5% VAT and then not using them until a few weeks after the change happened, so should that have been out
at 17.5% or 15%?” (business interview, production, 100k-1m)
However, one business commented that they would have preferred more specific and tailored advice towards their business:
“I wanted more sort of slightly real and practical advice rather than reading a website, which might be too theoretical – I just wanted practical advice. How could I apply the
change to me and my small business and my little accounting system and my invoicing system. Not whatever it says on the website in theory.”
(business interview, services, 67k – 100k)
3.4 System changes
3.4.1 What system changes involved
Two thirds (67%) of all sampled businesses made at least one system change activity, 24% did not make any system changes and 9% did not know whether they made any system changes or not. This includes 49% of businesses who updated and changed computerised accountancy systems, 36% who familiarised themselves with how to change their systems, and 30% who updated and changed manual accountancy systems. The full breakdown for all businesses interviewed in the quantitative stage of the research is detailed in figure 3.10.

33
Figure 3.10 System changes – what was involved (% mentioning)
Base: all respondents (2005)
Medium and large businesses were more likely to have carried out many of the system change tasks than micro and small businesses. One possible explanation for this is that medium and large businesses are more likely to have computer systems for accounting and sales purposes than smaller companies.
Table 3.11 What was involved in system change – by size of business (% undertaking each task)
Task Micro Small Medium Large Updating and changing computerised accountancy systems
43 75 88 79
Familiarising yourself with how to change your systems
33 44 66 66
Base: all respondents (micro, 1204; small, 436; medium, 211; large, 149) 12
12 Five respondents did not state how many employees they had in their organisation.
34
In terms of business activity, those who sell primarily B2B were significantly less likely than B2C to have updated and changed their computerised accountancy systems (54% vs. 43%).
The task analyses also found that the impact that the VAT rate change had on businesses’ systems varied. Many businesses only used a simple accountancy software system, and found it relatively simple to change the rate from 17.5% to 15%:
“Yes, once I got to the right page in the 1,000 page manual that told me how to do it, so I knew which buttons to press, it was quite straightforward – as with all these things, if I
had tried without consulting the manual, it would have been a lot quicker!” (business interview, production, 67k-100k)�
“As I say, there are a number of codes for different rates of VAT ... and it was basically just pick another number and use that for 15%; that was the only change that
happened.” (business interview, production, 100k-1m)
However, there was a minority who found that the rate changes caused them significant difficulties and that it was very time-consuming. This was particularly the case for financial services and retail sectors which tended to have multiple systems or very complex systems:
“[the system changes] was a big one, yes, for our retail arm of the business where we do more standard-rate, if we had to have a new rate input into the system or a new VAT code ... I know there was a working party set up for it and the changes had to be done,
but I wouldn’t know how much time was spent on it, but it was quite big, it was understanding how to change it in the system and then obviously conveying that across
to everybody so that they started using the correct code for the correct transaction.” (business interview, services, 10m+)
“We have an Accounts Payable system, we have a Full Ledger system, APB ... Sales Ledger system, you’ve got a Retail EPOS system, we have a Distribution system which
needs to be changed, Property system which needs to be changed, the Dot Com system, Direct systems, literally every part of the business, and little parts of the
business are self-accounting in their own right, ... which are run on completely different systems.” (business interview, services, 10m+)
One trade association, involved with large businesses in the services industry, suggested that for their type of businesses there would be a substantial amount involved:
“Sitting down with a VAT manager and listing every system and process that we thought was impacted, we then got together with our IT people and we had to set up a
SharePoint site in order to be able to monitor all the different changes, because there were a lot …” (trade association)
35
One trade association pointed out that it would be easy to underestimate the burden involved:
“A VAT rate change affects a huge number of people in a organisation – you have the main Tax Teams, who are subject matter experts, you have to understand the rules and
understand the changes and direct what change is going to be made; you have the Documentation Teams that are required to make sure that invoices go out with the right VAT rates on; you have the system changes that need to be made, and many of those systems are quite diverse; many members will have several systems for example, not
just one, that they are managing, so you have to make changes across multiple systems.” (trade association)
Similarly, a trade association (in the finance sector) suggested that many of their members had a wide range of systems that were negatively affected:
“The members will have quite a complex series of systems – you tend to have origination systems which keep the details of the early stages of a contract, then those
tend to be moved into kind of sub-ledger accounting systems, which is normally bespoke ... we then have the multiple-invoicing types, we have monthly invoicing,
quarterly in arrears, annual in advance.” (trade association)
The impact of system change was clearly contingent upon the complexity of the system that the organisation had in place rather than the size of company per se and some small companies, with complex systems, experienced significant problems dealing with change:
“From my experience of the retail sector, a lot of times you can download the price changes to tills centrally, ... big companies will have a central system for downloading all the prices ... the degree of difficulty depends upon that putting a layer on top of it, and if that layer on top isn’t hard coded then yes, it’s probably quite straightforward,
but if you have got old systems ... they tend to be a bit tricky, one touches them at their peril.” (trade association)
Another stakeholder who was interviewed commented that the main problem with the system change was the time-scale given for the change. This meant that teams were focussed on only this one activity, whereas if there had been a longer lead-in time then it would have been ‘quite relaxed’.
3.4.2 Who was involved in system changes
Managers and senior officials were most commonly involved in undertaking system changes (69%).

36
Figure 3.11 System changes – who was involved
Base: all respondents who changed systems (1435)
Analysis by size of business, as shown in table 3.11, highlighted the following statistically significant differences:
x Large businesses (26%) were less likely than micro (74%), small (56%) and medium businesses (43%) to involve managers and senior officials to change systems
x They were also less likely to involve administrative and secretarial occupations than other sizes of businesses.
x However, they were more likely than other sizes of businesses to involve professional occupations (51% vs 9%-17%) and associate professional and technical occupations (30% vs 3%-12%)
37
Table 3.12 System changes – who was involved by size of business (% involving)
Type of personnel Micro Small Medium Large Managers and senior officials 74% 56% 43% 26% Professional occupations 9% 15% 17% 51% Associate professional and technical occupations
3% 12% 6% 30%
Administrative and secretarial occupations 14% 28% 34% 5% Skilled trades occupations 1% 3% *% 7% Base: all respondents who changed systems (micro, 736; small, 380; medium, 184; large, 132))
As with other compliance activity categories, the staff types that were mentioned in the task analyses varied considerably. However, for most businesses, managers and senior officials, professional occupations and associate professional and technical occupations were involved. For a number of businesses there needed to be considerable filtering down of knowledge about the new system through various staff levels. For ease of reference, the table below highlights (in green) the staff typically involved in changing systems to accommodate the VAT rate change.
Table 3.13 System changes – who was involved
Managers and senior officials Professional occupations Associate professional and technical occupations Administrative and secretarial occupations Skilled trades occupations Personal service occupations Sales and customer service occupations Process, plant and machine operatives Elementary occupations
3.4.3 Time taken on system changes
As with the familiarisation with the rate change, most businesses needed to spend less than two hours for each type of employee to implement the system changes. As shown in figure 3.12, whilst managers and senior officials were generally involved for less time, they were (as detailed in figure 3.11) more likely to have been involved in the first place.

38
Figure 3.12 System changes – time spent broken down by type of staff
Base: all who changed systems (1435; managers and senior officials, 957; administrative and secretarial occupations, 214; professional occupations, 228; associate professional and technical occupations, 133; skilled trade occupations, 30)
The figures given for each business were aggregated and a total amount of time spent on system changes was calculated. Therefore, as shown in figure 3.13, just over half (52%) of businesses implemented any system changes within an hour, 24% took between 1 and 4.99 hours, and only 8% spent 5 or more hours.

39
Figure 3.13 System changes – total time spent
Base: all businesses (2005)
There were a number of significant differences in the extent of the burden created by system change when looked at by company size. Many of these differences relate, as noted in section 3.3.3, to familiarisation and reaffirm hypotheses in HM Treasury’s original impact assessment:
x Large businesses were more likely than micro, small and medium businesses to have spent 10 or more hours dealing with system changes (large, 51%; medium, 14%; small, 6%; micro, 3%)
x Businesses that quoted prices including VAT were significantly more likely [than those who quote excluding VAT] to have spent 2 or more hours on system changes (24% vs. 17%)
x Businesses whose revenue is primarily through B2B activity were significantly less likely than B2C or B2B/B2C to have spent 2 or more hours on system changes (18% vs. 25% and 26%, respectively)
x 38% of users of the retail VAT scheme reported that system changes took them 2 or more hours; Annual Accounting and Cash Accounting scheme users were

40
both more likely than Flat Rate scheme users to have system changes that took at least 2 hours (both 25% compared to 13%); and
x Unsurprisingly, businesses that used computerised accountancy systems were more likely than those who used manual books and records to take 2 or more hours (26% vs. 16%).
As Figure 3.14 shows, several sectors reported system changes to be relatively time-consuming – in particular electricity, gas, steam and air-conditioning supply, human health and social work, accommodation and food service, and public administration and defence.
Figure 3.14 Systems changes by sector – % spending 2 or more hours
Base: all businesses (2005)
Overall, the (mean) average time that businesses spent implementing system changes was 4.5 hours; the median was much lower at 0.3 hours. This is due to the large variation in experiences of businesses; whilst the majority reported it as not overly onerous, there were a few exceptional cases (e.g. large businesses) that found it arduous. Whilst B2C and B2B businesses showed higher means than B2B/B2C businesses, this was due to cases at the extreme that each of them included. Further analysis shows that as the size of organisation increased, so too did the required amount of familiarisation. Whereas, the median for a micro organisation was 0.3 hours,

41
the median for a large organisation was 15 hours. The descriptive statistics for system changes are summarised in table 3.14 and table 3.15.
Table 3.14 System changes descriptive statistics (hours spent)
Statistic Overall B2B B2C B2B /B2C Mean 4.5 4.3 5.9 3.5 Median 0.3 0.3 0.3 0.3 Minimum 0.0 0.0 0.0 0.0 Maximum 4040 1500.0 4040.0 250.0 Base: all respondents who were able to estimate a figure for system changes (1,742)
Table 3.15 System changes descriptive statistics by size of organisation (hours spent)
Statistic Overall Micro Small Medium Large Mean 4.5 2.1 6.6 7.7 235.5Median 0.3 0.3 0.5 1.0 15.0Minimum 0.0 0.0 0.0 0.0 0.0Maximum 4040.0 230.0 1500.0 110.0 4040.0Base: all respondents who were able to estimate a figure for system changes (1,742)
Similar findings were apparent in the task analyses; as discussed earlier in more detail, the majority found it straightforward and took less than an hour in total to do. For example, one business recalled his discussion with their IT department as thus:
“He said ‘what do you want?’ and I just told him, and he came back 10 minutes later and said ‘right, it’s done’ and that was that ... so we didn’t have major projects and people coming in, it was very straightforward.” (business interview, services, 10m+)
Another business commented on how simple and quick they found it:
“It’s literally just going into the masters of both those packages and inputting an additional rate ... literally took minutes; it was just then making the staff aware that they
had two codes to post the invoices through.” (business interview, production, 10m+)
However, as found in the quantitative study, some of the larger organisations interviewed found it far more time-consuming.
“…so for large organisations there are a lot of systems that need to be changed, but actually putting man hours to that ... I hate to think.” (business interview, services,
10m+)
“It was a huge mobilisation and every other thing that IT was doing, all the other project work that they were working on, just stopped for a week.” (trade association)

42
3.4.4 External system changes costs
Almost all (96%) of businesses were able to change their systems with no additional external costs. 1% (each) needed to purchase software or accountancy services; less than 1% (each) needed to purchase postage, printing, technical equipment / machinery, or external professional services.

43
3.5 Re-pricing standard-rated goods and services
3.5.1 What was involved in re-pricing
27% of all the businesses sampled stated that they carried out tasks related to re-pricing goods and services. Businesses’ re-pricing tasks were fairly evenly spread amongst the different tasks: 11% altered website prices, 10% reissued invoices, 10% altered price tags and labels, and 9% altered catalogues and pricing guides (see figure 3.15).
Figure 3.15 Re-pricing – what was involved (% citing)
Base: all respondents (2005)
In terms of tasks relating to adjusting prices; businesses primarily involved in business to consumer activity were significantly more likely to have been affected than those in business to business in the following areas:
x Altering price tags and labels (16% of B2C undertook some activity relating to this compared with 6% of B2B)
x Altering catalogues / price guides (13% of B2C undertook some activity relating to this compared with 6% of B2B).

44
Larger businesses were also more likely than smaller businesses to have undertaken the various pricing tasks as detailed in table 3.16.
Table 3.16 Re-pricing – what was involved by size of business (%)
Task Micro Small Medium Large Altering price tags and labels 8 13 32 39 Altering catalogues / price guides 8 13 33 15 Altering website / prices 8 21 30 42 Re-issue invoices 9 17 20 46 Any other additional pricing costs 4 2 32 34 Base: all respondents (micro, 1204; small, 436; medium, 211; large, 149)
Businesses that quoted prices for products or services including VAT were more likely to undertake re-pricing tasks than those that did not. However, differences were fairly small, albeit still statistically significant, as detailed below:
x Altering price tags and labels (12% of those with quoted prices including VAT vs. 4% of those excluding VAT)
x Altering catalogues / price guides (11% of those with quoted prices including VAT vs. 5% of those excluding VAT)
x Altering website / prices (12% of those with quoted prices including VAT vs. 7% of those excluding VAT).
Over three-quarters (78%) of businesses stated that they passed on the rate change to their customers (see section 4.1); however, only 27% stated that they did at least one activity that was considered as a re-pricing activity. The task analyses helped in explaining this anomaly in that, for many businesses, the re-pricing of goods is a simple change in a spreadsheet and does not factor as a substantial and separate activity.
In the task analyses, there was also a clear distinction between those businesses whose main sales stream was business to business compared with those which mainly dealt directly with consumers, with the latter feeling the greater impact.
For those businesses which dealt mainly business to business and raised invoices for transactions, the activities that they generally undertook were changing a calculation on a spreadsheet, reissuing invoices and changing invoices. The rate change had less of an impact as these businesses tended to quote prices excluding VAT, so there would be no alteration of individual pricing, but only in terms of the actual invoices going out:
“If there were any fees that were sent out that were subject to VAT, they would just have literally applied the lower rate to the same price.” (business interview, services,
10m+)

45
“It was just changing 17.5 in the formula to 15. Not very complicated and it was an invoice thing that I set up myself, so that was easy for me. I set the programme up
myself so I knew how to use it.” (business interview, services, 67k-100k)
“I only charge VAT as a single line on an invoice once I’ve totted everything up, so it’s already there on all my invoices, VAT @17.5% ... so it was a matter of going through each invoice we were going to send out and making sure that was changed to 15%;
nothing else was necessary, and each case probably takes a minute or less.” (business interview, services, 0-67k)
However, other businesses that quoted prices including VAT experienced more difficulties. For example, a large financial institution provided largely VAT-exempt services but provided a small proportion of its services (an event management stream and an online company search facility) with prices including VAT. The event management stream had brochures printed which included VAT and, after much deliberation it was decided not to reprint as the cost was too high. However, the search facility needed to be changed, and this involved some changes on their website.
The large retailers interviewed were the ones who experienced the most disruption. There was considerable impact in spite of retailers attempting to minimise this by saving some costs through implementing Point of Sale changes (i.e. so that pricing systems were changed rather than individual prices so that the correct price appeared when the customer purchased the goods).
“Once we’d done the systems upgrade, effectively then you’ve got to produce shelf-edge labels for all the products that are in store ... [thousands] of products that are
standard-rated will need their price changing ... it’s in every store where they stock the product, it’s identifying what products they stock and then firing shelf-edge labels out of
the system and people physically walking around and fitting them onto shelf-edges.” (business interview, services, 10m+)
“We basically had just launched our pre-Christmas marketing, so everything had to be re-done for that, which went down a dream! ... you’ve got to get a clear message to the customer otherwise they get totally confused and that’s bad customer experience, so
we basically reprinted everything for our stores over the period of about a month.” (business interview, services, 10m+)
A trade association also commented on independently received feedback from a number of retailers:
“They referred to significant costs around reprinting existing POS materials … the cost of store implementation, so physically changing labels … for small retailers is that there often there will be extremely limited resource in terms of people working in the stores …
necessary staff overtime … IT system changes were referred to by a number of members as being particularly problematic.” (trade association)

46
“If you are an old-fashioned retailer with stickers on all the things on the shelves, then obviously you have to do all the re-stickering, that’s obvious, if you did everything by barcodes, then you would have to play around with your computers … if you had any kind of long-term contracts, you would need to get into the rules of time of supply …
there is also the commercial question of ‘Do I cut my prices, or do I just keep the money for myself or a bit of both?’” (trade association)
3.5.2 Who was involved in re-pricing
As with other elements of compliance with the VAT rate change, respondents were asked who was involved, how long they were involved for and whether there were any external costs involved. Once again, as shown in figure 3.16, it was managers and senior officials that were most often involved.
Figure 3.16 Re-pricing – who was involved
Base: all respondents who re-priced goods/services (601)
However, as detailed in table 3.17, medium (25%) and large (26%) businesses were less likely than micro (81%) and small businesses (62%) to involve managers and senior officials. Large businesses were, instead, more likely than other business sizes to have used sales and customer service occupations to re-price goods and services (54% compared with micro, 2%; small, 13%; and medium, 8%).

47
Table 3.17 Re-pricing – who was involved by size of business (% involving)
Type of personnel Micro Small Medium Large Managers and senior officials 81 62 25 26 Sales and customer service occupations 2 13 8 54 Base: all respondents who re-priced goods/services (micro, 288; small, 150; medium, 88; large, 72)
From the task analyses, it was clear that there was variation in the staff types involved in re-pricing by business size. Small businesses were more likely, as a result of small numbers of staff, to involve more senior levels of staff than larger businesses. Therefore, as a result, senior levels of staff were used for much shorter periods of time than more junior members of staff.
A minority of large businesses interviewed found that re-pricing could take considerable amounts of junior staff members’ time. Table 3.18 shows the staff levels involved (shaded in green), but it should be remembered that the time involved varied considerably.
Table 3.18 Re-pricing of goods and services – who was involved
Managers and senior officials Professional occupations Associate professional and technical occupations Administrative and secretarial occupations Skilled trades occupations Personal service occupations Sales and customer service occupations Process, plant and machine operatives Elementary occupations
3.5.3 Time taken on re-pricing
Whilst about half of businesses (49%) which involved managers and senior officials in re-pricing did so for less than two hours, with other occupation levels, duration was more varied, and less easy to define (see figure 3.17).

48
Figure 3.17 Re-pricing – who it involved
Base: all who adjusted prices (601 - managers and senior officials, 385; administrative and secretarial occupations, 111; professional occupations, 74; associate professional and technical occupations, 55; sales and customer service occupations, 47)
The figures that respondents gave for each individual member of staff were aggregated giving a total amount of time spent on re-pricing for each business. As figure 3.18 shows, the majority (64%) of businesses spent no time at all on re-pricing and a further 11% were able to re-price in less than 2 hours.
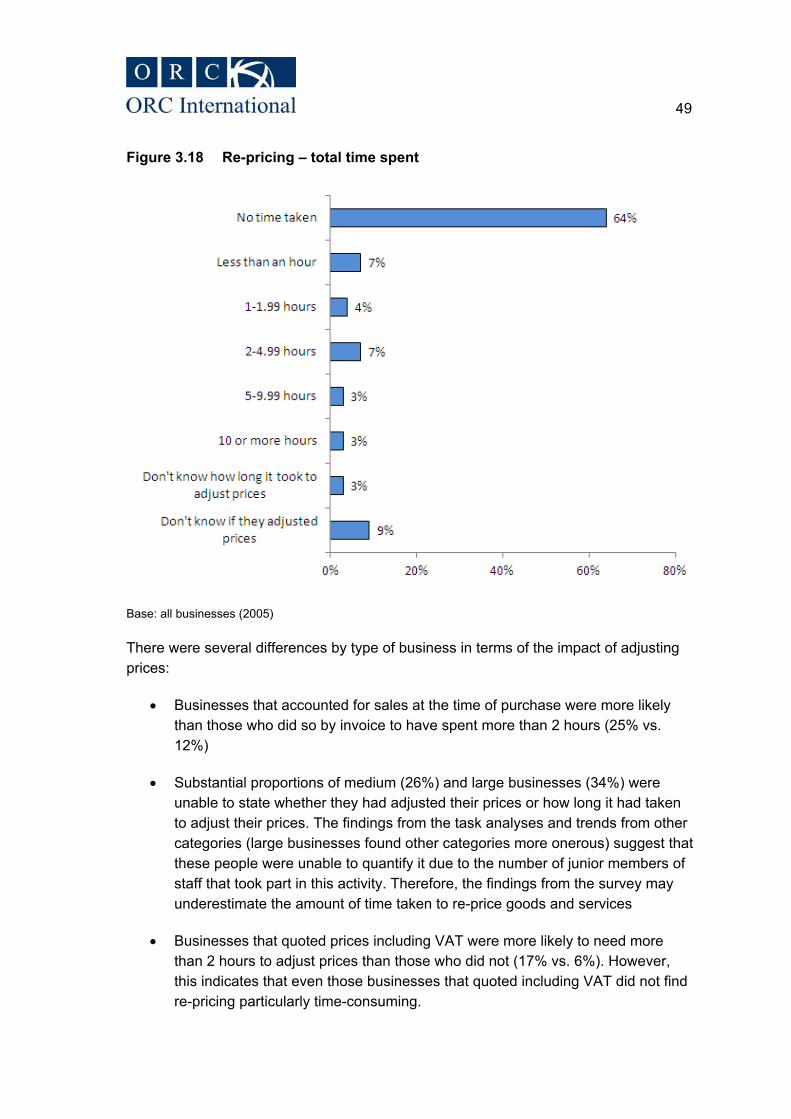
49
Figure 3.18 Re-pricing – total time spent
Base: all businesses (2005)
There were several differences by type of business in terms of the impact of adjusting prices:
x Businesses that accounted for sales at the time of purchase were more likely than those who did so by invoice to have spent more than 2 hours (25% vs. 12%)
x Substantial proportions of medium (26%) and large businesses (34%) were unable to state whether they had adjusted their prices or how long it had taken to adjust their prices. The findings from the task analyses and trends from other categories (large businesses found other categories more onerous) suggest that these people were unable to quantify it due to the number of junior members of staff that took part in this activity. Therefore, the findings from the survey may underestimate the amount of time taken to re-price goods and services
x Businesses that quoted prices including VAT were more likely to need more than 2 hours to adjust prices than those who did not (17% vs. 6%). However, this indicates that even those businesses that quoted including VAT did not find re-pricing particularly time-consuming.

50
As shown in figure 3.19, no sector reported more than a quarter of businesses with 2 hours or more spent on re-pricing goods and services.
Figure 3.19 Re-pricing goods/services by sector – % spending 2 or more hours
Base: all businesses (2005)
The descriptive statistics show that re-pricing goods took on average (mean) 1.6 hours to complete. However, the largest amount of time reported was 600 hours. As 73% of businesses did no re-pricing, the median amount of time spent was zero. The re-pricing descriptive statistics are detailed in table 3.19 and table 3.20.
Table 3.19 Re-pricing descriptive statistics (hours spent)
Statistic Figure B2B B2C B2B /B2C Mean 1.6 1.0 2.1 2.8 Median 0.0 0.0 0.0 0.0 Minimum 0.0 0.0 0.0 0.0 Maximum 600.0 600.0 336.0 150.0 Base: all respondents who were able to estimate a figure for re-pricing (1,773)
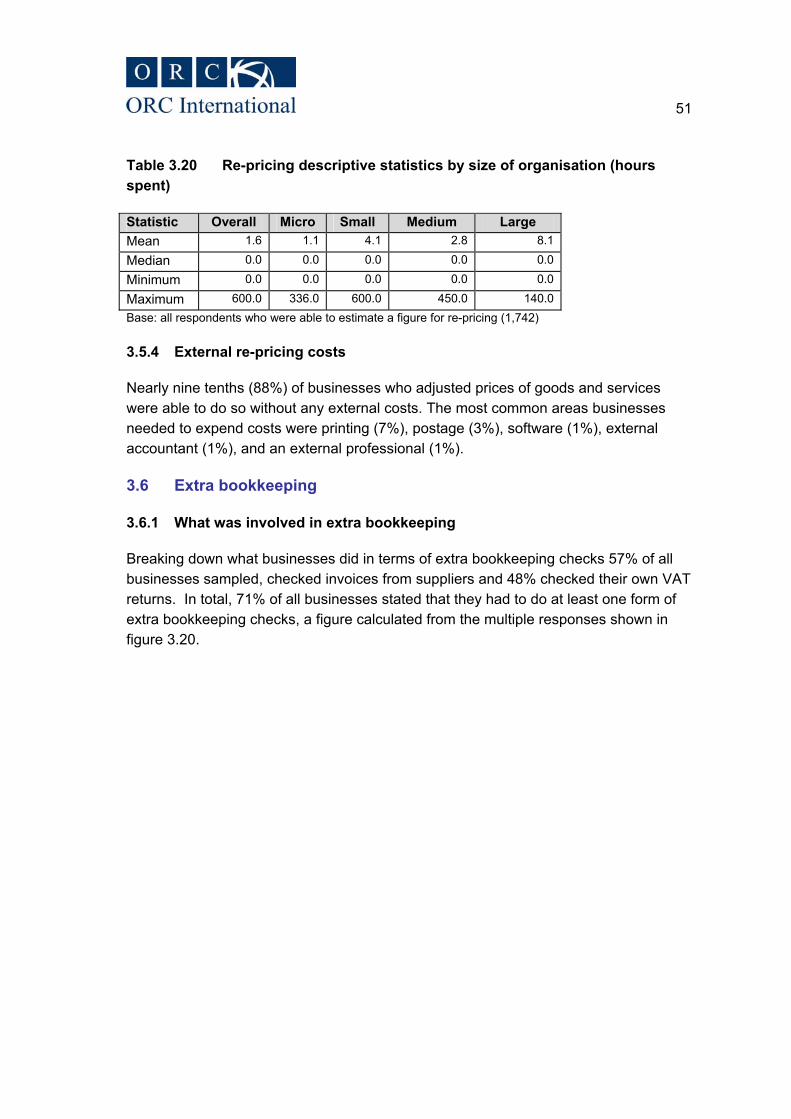
51
Table 3.20 Re-pricing descriptive statistics by size of organisation (hours spent)
Statistic Overall Micro Small Medium Large Mean 1.6 1.1 4.1 2.8 8.1
Median 0.0 0.0 0.0 0.0 0.0
Minimum 0.0 0.0 0.0 0.0 0.0
Maximum 600.0 336.0 600.0 450.0 140.0 Base: all respondents who were able to estimate a figure for re-pricing (1,742)
3.5.4 External re-pricing costs
Nearly nine tenths (88%) of businesses who adjusted prices of goods and services were able to do so without any external costs. The most common areas businesses needed to expend costs were printing (7%), postage (3%), software (1%), external accountant (1%), and an external professional (1%).
3.6 Extra bookkeeping
3.6.1 What was involved in extra bookkeeping
Breaking down what businesses did in terms of extra bookkeeping checks 57% of all businesses sampled, checked invoices from suppliers and 48% checked their own VAT returns. In total, 71% of all businesses stated that they had to do at least one form of extra bookkeeping checks, a figure calculated from the multiple responses shown in figure 3.20.

52
Figure 3.20 Extra bookkeeping checks – what was involved
Base: all respondents (2005)
As detailed in table 3.21, larger businesses were more likely, overall, to state that the rate change had caused them to undertake some additional bookkeeping tasks than smaller companies. However, this was not the case across a range of potential extra bookkeeping activities with, for example, issues with the VAT scheme reported by small percentage numbers no matter what the size of business (2-3%).
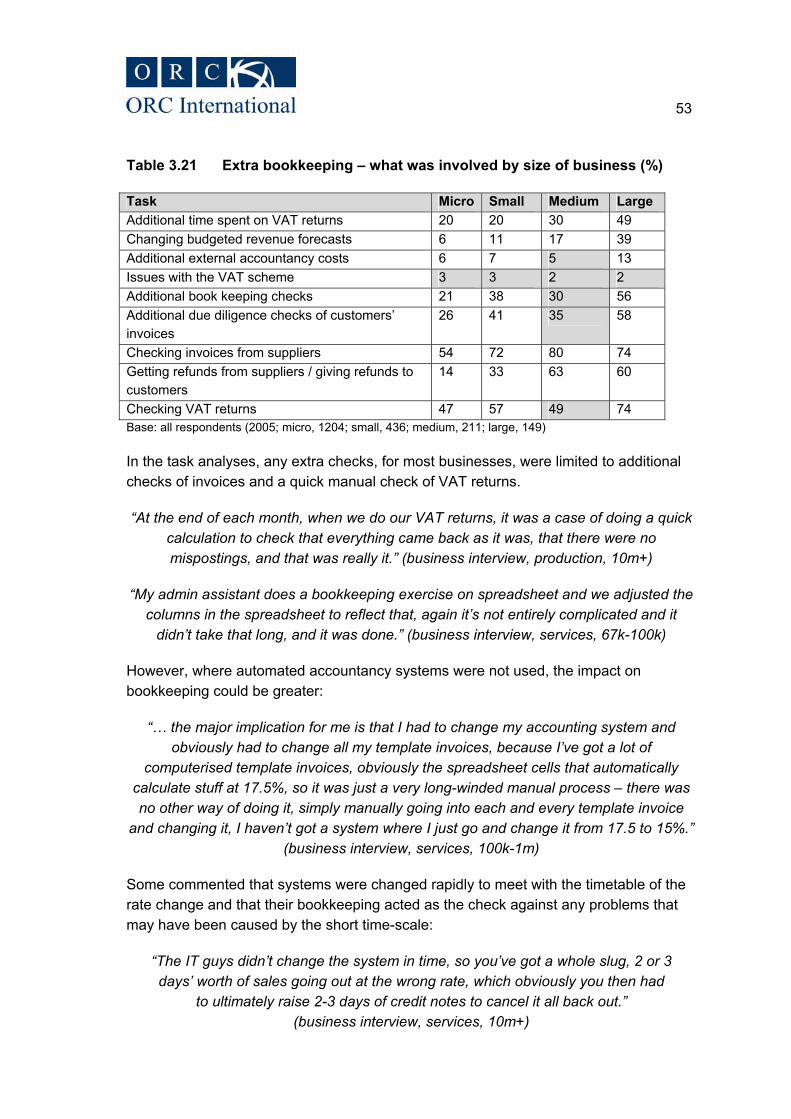
53
Table 3.21 Extra bookkeeping – what was involved by size of business (%)
Task Micro Small Medium Large Additional time spent on VAT returns 20 20 30 49 Changing budgeted revenue forecasts 6 11 17 39 Additional external accountancy costs 6 7 5 13 Issues with the VAT scheme 3 3 2 2 Additional book keeping checks 21 38 30 56 Additional due diligence checks of customers’ invoices
26 41 35 58
Checking invoices from suppliers 54 72 80 74 Getting refunds from suppliers / giving refunds to customers
14 33 63 60
Checking VAT returns 47 57 49 74 Base: all respondents (2005; micro, 1204; small, 436; medium, 211; large, 149)
In the task analyses, any extra checks, for most businesses, were limited to additional checks of invoices and a quick manual check of VAT returns.
“At the end of each month, when we do our VAT returns, it was a case of doing a quick calculation to check that everything came back as it was, that there were no mispostings, and that was really it.” (business interview, production, 10m+)
“My admin assistant does a bookkeeping exercise on spreadsheet and we adjusted the columns in the spreadsheet to reflect that, again it’s not entirely complicated and it
didn’t take that long, and it was done.” (business interview, services, 67k-100k)
However, where automated accountancy systems were not used, the impact on bookkeeping could be greater:
“… the major implication for me is that I had to change my accounting system and obviously had to change all my template invoices, because I’ve got a lot of
computerised template invoices, obviously the spreadsheet cells that automatically calculate stuff at 17.5%, so it was just a very long-winded manual process – there was no other way of doing it, simply manually going into each and every template invoice
and changing it, I haven’t got a system where I just go and change it from 17.5 to 15%.” (business interview, services, 100k-1m)
Some commented that systems were changed rapidly to meet with the timetable of the rate change and that their bookkeeping acted as the check against any problems that may have been caused by the short time-scale:
“The IT guys didn’t change the system in time, so you’ve got a whole slug, 2 or 3 days’ worth of sales going out at the wrong rate, which obviously you then had
to ultimately raise 2-3 days of credit notes to cancel it all back out.” (business interview, services, 10m+)

54
On a similar note a trade association commented that the duration of bookkeeping depended on the individual businesses’ initial preparation for the accounting exercise:
“Some people flap and do an awful lot on information and then in a way their book-keeping goes absolutely perfectly and takes them no time at all; other people do nothing
in the way of informing themselves and then they lose time on their bookkeeping.” (trade association)
Some businesses experienced problems as a result of their having received payment from their customers up-front. The rate change meant that their customers had, in fact, overpaid and were entitled to a credit note. One interviewee commented that ‘providing credit notes was a huge issue’, and the change had resulted in the issuing of a considerable number of credit notes. Another commented that they looked through their books to find any large transactions that were affected. Due to the burden that providing credit notes on all transactions would cause, they provided credit notes to those who requested them, or to those that were above a certain value. Similarly, they only pursued refunds from businesses that they were purchasing from for large contracts.
Businesses that reverse-charge experienced specific problems as a result of the VAT rate change and spent a considerable amount of time bookkeeping to ensure accuracy:
“We do reverse charging, we have quite a lot of imported services, so yes, there was work there. There was an element of work on invoices being received and the dates
and what period it’s actually relating to, so yes, that had quite an impact, they needed to discuss and bring items to myself ... the month of December was a very tricky month
really, that’s the best way to put it.” (business interview, services, 10m+)
3.6.2 Who was involved in extra bookkeeping checks
As with previous elements of the rate change, respondents were then asked who was involved, how long they were involved for and whether there were any external costs involved. As shown in figure 3.21 businesses most commonly involved managers and senior officials (67%).

55
Figure 3.21 Extra bookkeeping – who was involved
Base: all respondents who undertook extra book keeping (1,487)
Large businesses were less likely (than other sizes of business) to have included managers and senior officials, but were more likely to have used professional occupations. Table 3.22 details the notable differences by size of business.
Table 3.22 Extra bookkeeping – who was involved by size of business (% involving)
Type of personnel Micro Small Medium Large Managers and senior officials 71% 56% 38% 23% Professional occupations 10% 23% 21% 56% Administrative and secretarial occupations 16% 30% 45% 10% Base: all respondents who undertook extra book keeping (1,487 - micro, 805; small, 362; medium, 188; large, 129)
From the task analyses, it was clear that extra bookkeeping was only burdensome for a minority of businesses interviewed, and, whilst it tended to involve the most senior tiers of staff, this was only for short periods of time. Table 3.23 shows who was involved in additional bookkeeping – again those shaded in green were staff types that took part.

56
Table 3.23 Extra bookkeeping – who was involved (task analyses)
Managers and senior officials Professional occupations Associate professional and technical occupations Administrative and secretarial occupations Skilled trades occupations Personal service occupations Sales and customer service occupations Process, plant and machine operatives Elementary occupations
3.6.3 Time taken in extra bookkeeping checks
Respondents were asked how long each member of staff was involved; as with other categories about half of managers and senior officials (52%) were involved for less than two hours. However, other occupational categories were involved in the rate change to a greater extent; for example, 45% of associate professional and technical occupations were involved for 2-5 hours.
Figure 3.22 Extra bookkeeping – how long was involved
Base: all respondents who undertook additional book keeping (1487) variable bases, managers and senior officials, 922; administrative and secretarial occupations, 292; professional occupations, 276; associate professional and technical occupations, 83)
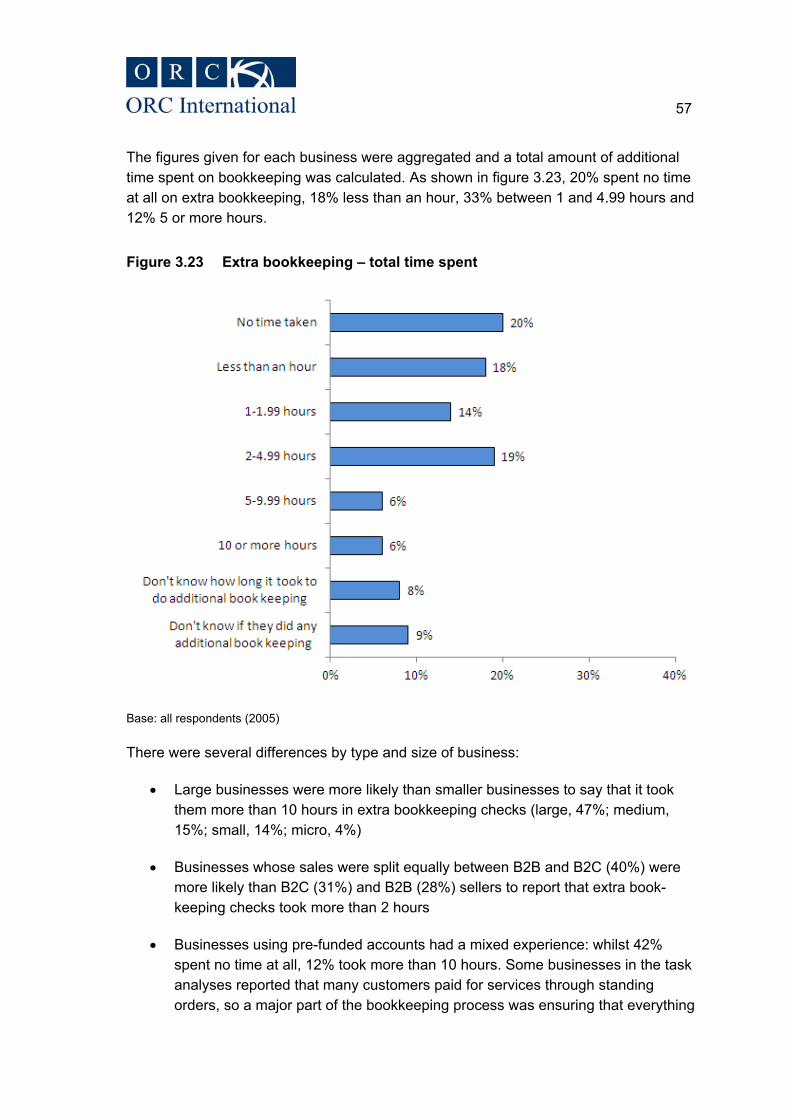
57
The figures given for each business were aggregated and a total amount of additional time spent on bookkeeping was calculated. As shown in figure 3.23, 20% spent no time at all on extra bookkeeping, 18% less than an hour, 33% between 1 and 4.99 hours and 12% 5 or more hours.
Figure 3.23 Extra bookkeeping – total time spent
Base: all respondents (2005)
There were several differences by type and size of business:
x Large businesses were more likely than smaller businesses to say that it took them more than 10 hours in extra bookkeeping checks (large, 47%; medium, 15%; small, 14%; micro, 4%)
x Businesses whose sales were split equally between B2B and B2C (40%) were more likely than B2C (31%) and B2B (28%) sellers to report that extra book- keeping checks took more than 2 hours
x Businesses using pre-funded accounts had a mixed experience: whilst 42% spent no time at all, 12% took more than 10 hours. Some businesses in the task analyses reported that many customers paid for services through standing orders, so a major part of the bookkeeping process was ensuring that everything

58
matched the correct rate. The comment below summarises the problem for one of the businesses interviewed:
“Most of our clients pay us by standing order, and we’ve had to amend every single standing order and get the clients to send them back to us; this process has taken,
as you can imagine, several weeks, ... it’s probably taken three days of staff time just with the standing orders ... what also happened was that only half of them did it
and then we had to deal with the fall-out of why they didn’t change it.” (business interview, production, 1m-10m)
x Businesses spent similar time on extra bookkeeping tasks irrespective of whether their quoted prices included VAT or not
However, businesses that used retail VAT schemes were more likely than those not using a retail VAT scheme to report extra bookkeeping checks taking at least 2 hours (57% vs. 32%).
As with other areas of compliance, extra bookkeeping checks were more time-consuming in particular for the Electricity, Gas, Steam and Air-Conditioning supply and Human Health and Social Work sectors.
Figure 3.24 Extra bookkeeping checks – % spending 2 hours or more
Base: all businesses (2005)

59
On average (mean) 2.8 hours was taken by businesses to account for the extra bookkeeping checks required because of the rate change. Again, there were extreme variations in the data, the median was only 0.5 hours; the descriptive statistics are shown in table 3.24 and table 3.25.
Table 3.24 Extra bookkeeping checks descriptive statistics (hours spent)
Statistic Figure B2B B2C B2B /B2C Mean 2.8 2.4 3.0 4.1 Median 0.5 0.5 1.0 1.0 Minimum 0.0 0.0 0.0 0.0 Maximum 1600 360.0 440.0 1600.0 Base: all respondents who were able to estimate a figure for extra bookkeeping (1,666)
Table 3.25 Extra bookkeeping checks descriptive statistics by size of organisation (hours spent)
Statistic Overall Micro Small Medium Large Mean 2.8 2.1 4.4 8.4 31.2Median 0.5 0.5 2.0 2.0 15.0Minimum 0.0 0.0 0.0 0.0 0.0Maximum 1600.0 170.0 320.0 85.0 1600.0Base: all respondents who were able to estimate a figure for extra bookkeeping (1,666)
3.6.4 External bookkeeping checks
Almost all (98%) of businesses did not have to purchase any external services for any additional bookkeeping they undertook. Only 1% of businesses said that in order to prepare for this activity they had to engage additional accountancy services.
No task analysis interviewee reported paying additional external accountancy costs, and similarly a trade association commented that:
“I suspect that [external accountancy costs] are not going to be a big deal; a lot of businesses adjusted the VAT themselves rather than outsourcing accountants, and
those who did outsource to their accountants are the ones who gave the accountant a shoe box full of invoices.” (trade association)
3.7 Business operational activities relating to the rate change
3.7.1 What was involved in business operational activities
Those respondents who carried out business operational activities related to the rate change (excluding compliance activity) were asked a series of questions about what was involved. Overall, 43% of businesses stated that they undertook at least one operational activity; with 32% monitoring systems, 27% testing systems, and 25%
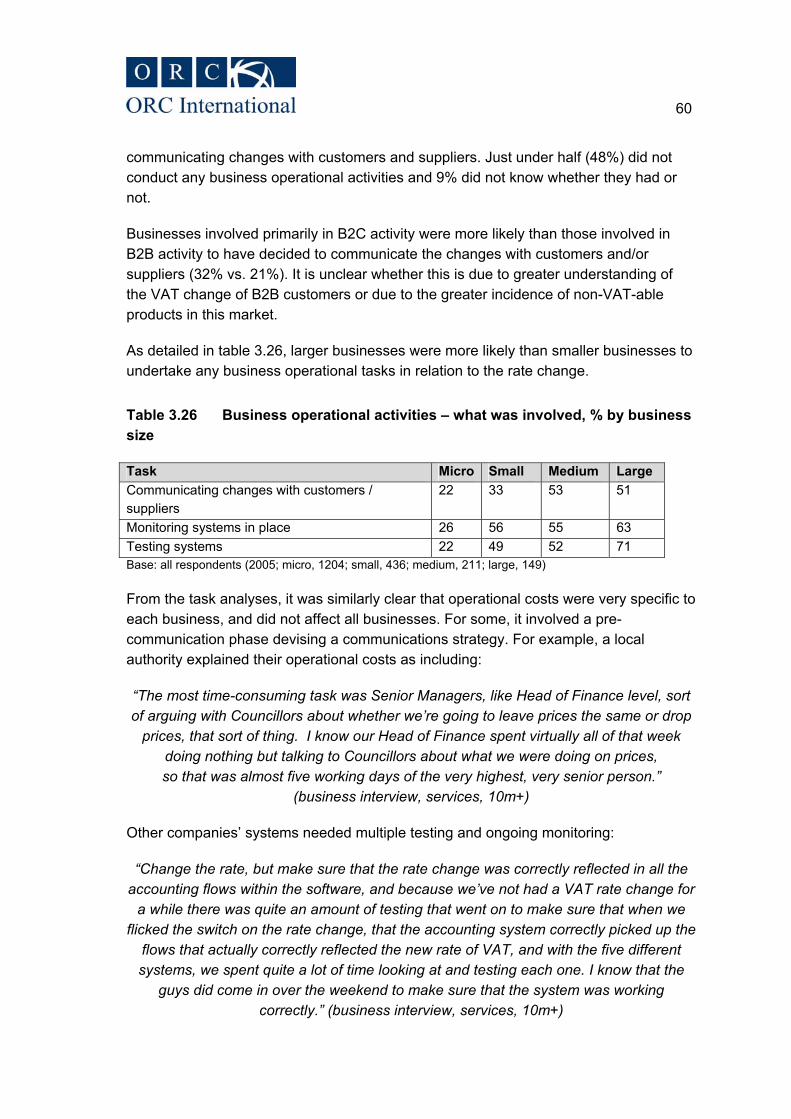
60
communicating changes with customers and suppliers. Just under half (48%) did not conduct any business operational activities and 9% did not know whether they had or not.
Businesses involved primarily in B2C activity were more likely than those involved in B2B activity to have decided to communicate the changes with customers and/or suppliers (32% vs. 21%). It is unclear whether this is due to greater understanding of the VAT change of B2B customers or due to the greater incidence of non-VAT-able products in this market.
As detailed in table 3.26, larger businesses were more likely than smaller businesses to undertake any business operational tasks in relation to the rate change.
Table 3.26 Business operational activities – what was involved, % by business size
Task Micro Small Medium Large Communicating changes with customers / suppliers
22 33 53 51
Monitoring systems in place 26 56 55 63 Testing systems 22 49 52 71 Base: all respondents (2005; micro, 1204; small, 436; medium, 211; large, 149)
From the task analyses, it was similarly clear that operational costs were very specific to each business, and did not affect all businesses. For some, it involved a pre-communication phase devising a communications strategy. For example, a local authority explained their operational costs as including:
“The most time-consuming task was Senior Managers, like Head of Finance level, sort of arguing with Councillors about whether we’re going to leave prices the same or drop
prices, that sort of thing. I know our Head of Finance spent virtually all of that week doing nothing but talking to Councillors about what we were doing on prices, so that was almost five working days of the very highest, very senior person.”
(business interview, services, 10m+)
Other companies’ systems needed multiple testing and ongoing monitoring:
“Change the rate, but make sure that the rate change was correctly reflected in all the accounting flows within the software, and because we’ve not had a VAT rate change for
a while there was quite an amount of testing that went on to make sure that when we flicked the switch on the rate change, that the accounting system correctly picked up the
flows that actually correctly reflected the new rate of VAT, and with the five different systems, we spent quite a lot of time looking at and testing each one. I know that the
guys did come in over the weekend to make sure that the system was working correctly.” (business interview, services, 10m+)
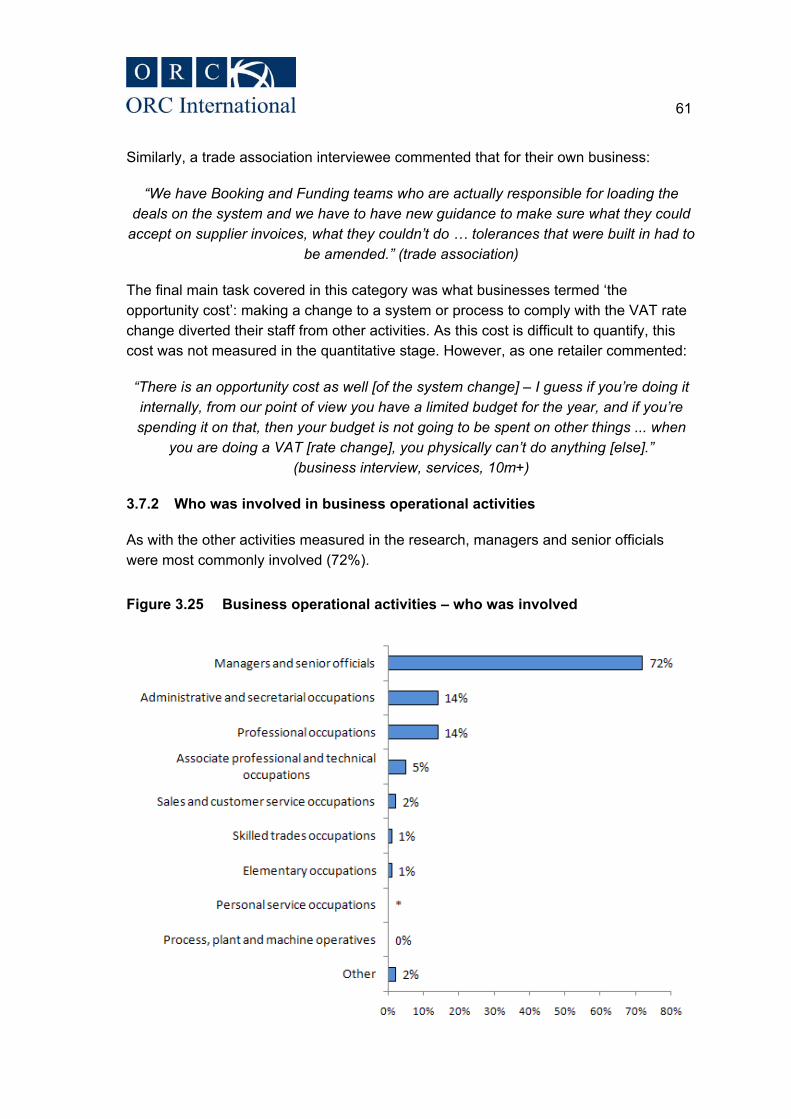
61
Similarly, a trade association interviewee commented that for their own business:
“We have Booking and Funding teams who are actually responsible for loading the deals on the system and we have to have new guidance to make sure what they could
accept on supplier invoices, what they couldn’t do … tolerances that were built in had to be amended.” (trade association)
The final main task covered in this category was what businesses termed ‘the opportunity cost’: making a change to a system or process to comply with the VAT rate change diverted their staff from other activities. As this cost is difficult to quantify, this cost was not measured in the quantitative stage. However, as one retailer commented:
“There is an opportunity cost as well [of the system change] – I guess if you’re doing it internally, from our point of view you have a limited budget for the year, and if you’re spending it on that, then your budget is not going to be spent on other things ... when
you are doing a VAT [rate change], you physically can’t do anything [else].” (business interview, services, 10m+)
3.7.2 Who was involved in business operational activities
As with the other activities measured in the research, managers and senior officials were most commonly involved (72%).
Figure 3.25 Business operational activities – who was involved

62
Base: all respondents who undertook business operational activities (1026)
Micro (77%) and small businesses (65%) were more likely than medium (44%) and large businesses (34%) to have involved managers and senior officials in operational change. Small (21%) and medium businesses (49%) were more likely than large businesses (12%) to have used professional occupations. Small businesses (27%) were more likely than any other business size (micro, 11%; medium, 8%; large, 8%) to use administrative and secretarial occupations. Finally, large businesses (38%) were most likely to have used sales and customer service occupations (compared to micro, 1%; small, 4%); medium, 1%).
Table 3.27 details the breakdown of figures by size of business.
Table 3.27 Business operational activities – who was involved by size of business
Type of staff Micro Small Medium Large Managers and senior officials 77% 65% 44% 34% Professional occupations 9% 21% 49% 12% Associate professional and technical occupations 3% 9% 6% 17% Administrative and secretarial occupations 11% 27% 8% 8% Sales and customer service occupations 1% 4% 1% 38% Base: all respondents who undertook business operational activities (1,026 – micro, 468; small, 277; medium, 158; large, 120)
As this category includes a wide range of activities, the task analyses show that any staff types could be involved.
Table 3.28 Business operational activities – who was involved (task analyses)
Managers and senior officials Professional occupations Associate professional and technical occupations Administrative and secretarial occupations Skilled trades occupations Personal service occupations Sales and customer service occupations Process, plant and machine operatives Elementary occupations
3.7.3 Time taken on business operational activities
Respondents were asked how long each type of staff member was involved in operational aspects. Whilst half of managers and senior officials were involved for less than 2 hours, associate and professional occupations were more commonly involved for
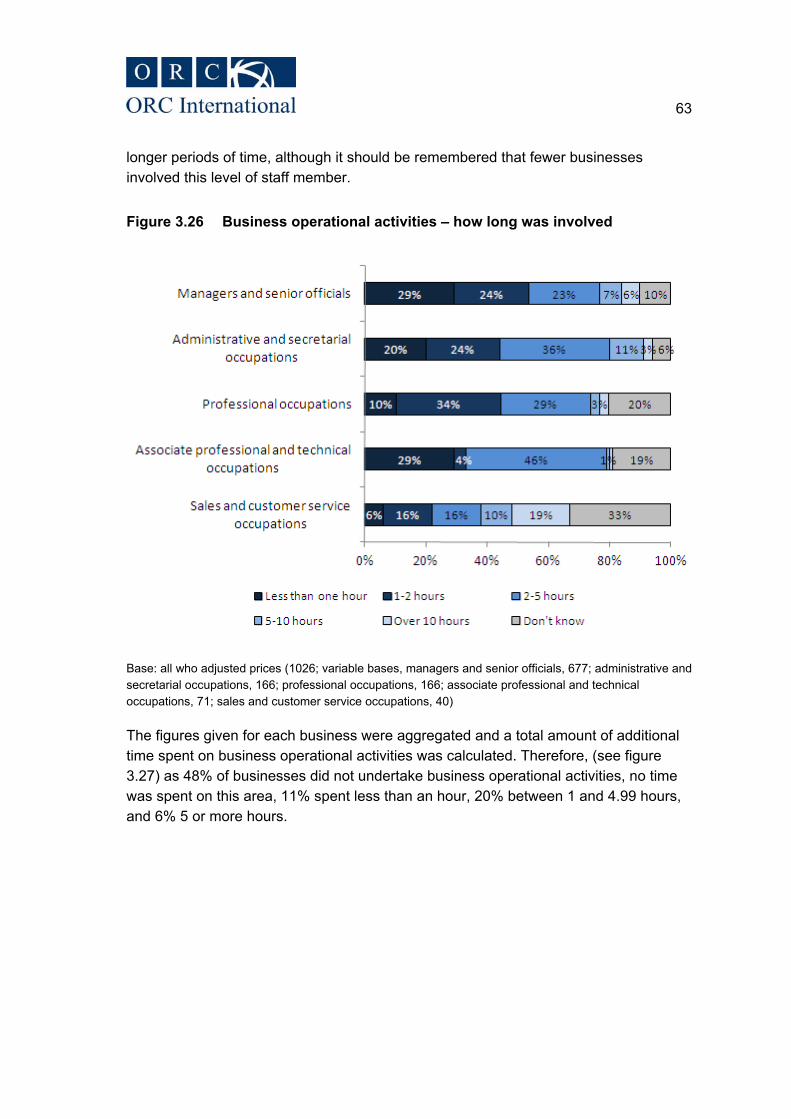
63
longer periods of time, although it should be remembered that fewer businesses involved this level of staff member.
Figure 3.26 Business operational activities – how long was involved
Base: all who adjusted prices (1026; variable bases, managers and senior officials, 677; administrative and secretarial occupations, 166; professional occupations, 166; associate professional and technical occupations, 71; sales and customer service occupations, 40)
The figures given for each business were aggregated and a total amount of additional time spent on business operational activities was calculated. Therefore, (see figure 3.27) as 48% of businesses did not undertake business operational activities, no time was spent on this area, 11% spent less than an hour, 20% between 1 and 4.99 hours, and 6% 5 or more hours.

64
Figure 3.27 Business operational activities
Base: all businesses (2005)
Large businesses, as in other types of compliance activities, were most likely to have spent more than 10 hours on business operational activities (40%; compared with micro, 2%; small, 3%; medium, 8%). Whilst businesses using retail VAT schemes were more likely than those using not using retail VAT schemes to report that they spent 2-5 hours on business operational activities, they were not any more likely to spend 5 or more hours than average.
Overall, the (mean) average amount of time that a business spent on business operational activities was 1.6 hours. However, as detailed in Table 3.29, again there was considerable variation as evidenced by the median of 0 and the maximum value of 720 hours. Whilst, there were no differences between businesses that dealt with B2B, B2C and B2B/B2C customers, there was a difference by size of business (see table 3.29 and 3.30.
The qualitative stage found that it was larger businesses, and often businesses selling to the consumer market that had additional business operational activities. Incurring additional work in this area was due to the complex nature of their businesses, for example having systems that needed to be repeatedly checked because other business areas relied upon them. Alternatively, businesses with diverse customer bases may

65
have chosen to inform their customers of the rate change to ensure that ad-hoc customer communication was minimised.
Table 3.29 Business operational activities descriptive statistics (hours spent)
Statistic Figure B2B B2C B2B /B2C Mean 1.6 1.6 1.5 1.9 Median 0.0 0.0 0.0 0.0 Minimum 0.0 0.0 0.0 0.0 Maximum 720.0 120.0 100.0 720.0 Base: all respondents who were able to estimate a figure for business operational activities (1,704)
Table 3.30 Business operational activities descriptive statistics by size of organisation (hours spent)
Statistic Overall Micro Small Medium Large Mean 1.6 1.4 2.0 3.8 11.5Median 0.0 0.0 1.0 2.0 7.0Minimum 0.0 0.0 0.0 0.0 0.0Maximum 720.0 170.0 80.0 120.0 720.0Base: all respondents who were able to estimate a figure for extra bookkeeping (1,666)
3.7.4 External operational activities
Almost all (98%) of businesses reported that they did not have any additional external costs as a result of business operational costs of compliance; where businesses did have costs, it was most often from software (1%) or postage (1%).
3.8 Overall time burden
3.8.1 Time burden (this includes business operational activities)
Businesses’ responses for each activity were summed to give a figure for the total time burden for each business surveyed. This calculation excluded any business which was unable to give an answer to any of the category questions. It is important to note that this calculation includes business operational activities, and thus includes non-compliance activities. Further information on the calculation of a compliance burden figure is provided in section 3.9.
The mean total time taken by businesses as a result of the rate change was 11.4 hours; this mean figure is skewed by businesses at the extremes – indeed the median response was 2.7 hours.
Overall, the median score for businesses whose customers are at least half consumers was higher than those who were involved in primarily B2B transactions.

66
Table 3.31 Time burden descriptive statistics (hours spent)
Statistic Figure B2B B2C B2B /B2C Mean 11.4 10.6 10.8 16.2 Median 2.7 2.3 3.0 4.5 Minimum 0.0 0.0 0.0 0.0 Maximum 3840.0 1509.0 617.0 3840.0 Base: all businesses who have not said ‘don’t know’ for any category of time taken to complete an activity (base: 1515)
Familiarisation activity accounted for the largest proportion of businesses’ compliance burden (34% of total), with additional bookkeeping accounting for 28% and system changes for 21% (see figure 3.28).
Figure 3.28 Category breakdown of overall time burden
Base: all businesses who have not said ‘don’t know’ for any category of time taken to complete an activity (base: 1515)

67
Table 3.32 shows the mean and median values broken down by the size of the business; as would be expected this shows that the time taken by businesses as a result of the rate change increased with size.
Table 3.32 Mean and median by business size
Business size Mean Median Micro 8.3 2.1 Small 23.1 7.5 Medium 31.6 10.0 Large 102.7 11.0 Base: all businesses who have not said ‘don’t know’ for any category of time taken to complete…. (base: 1515)
That said, table 3.33 shows that there was little difference by business size in the relative proportions that each of the elements (familiarisation, system changes, adjusting prices, extra bookkeeping, and business operational activities) represented of the total time burden.
Table 3.33 Time burden breakdown by category and business size
Familiarisation (%)
System changes
(%)
Re-pricing (%)
Extra book keeping checks
(%)
Business operational
activities (%)
Micro 35% 22% 7% 28% 8% Small 31% 19% 9% 27% 13% Medium 30% 19% 8% 25% 18% Large 34% 25% 10% 20% 12% Base: all businesses who have not said ‘don’t know’ for any category (base: 1515)

68
As shown in table 3.34, there is moreover, little difference by the type of transactions that businesses are involved in; the only notable difference is that those involved in B2B transactions were more likely to spend time on system changes rather than re-pricing goods.
Table 3.34 Time burden breakdown by type of transactions
Familiarisation (%)
System changes
(%)
Re-pricing (%)
Extra book keeping checks
(%)
Business operational
activities (%)
B2B 35% 24% 5% 27% 9% B2C 32% 19% 8% 29% 11% Equally split between B2B and B2C
35% 17% 13% 25% 10%
Figure 3.29 shows both the mean and median values for each sector included in the study. This shows that Electricity, Gas, Steam and Air-Conditioning Supply, Public Administration and Defence, and Human Health and Social Work had the largest time burden.

69
Figure 3.29 Time burden by sector
Base: all businesses who have not said ‘don’t know’ for any category (base: 1515)

70
The sectors with disproportionately high averages (mean or median) are broken down by type of activity; this is shown in table 3.35. Notable findings are that:
x Electricity, Gas, Steam and Air-Conditioning Supply and Human Health and Social Work spent a higher proportion of their total time on familiarisation activities. This may mean that the burden relating to the rate reversion for these sectors may be reduced when reverting to 17.5% as the familiarisation activity has already been conducted
x Information and Communication businesses spent a relatively high proportion of their total time spent on compliance activity on system changes
x Wholesale, retail and motor vehicle businesses spent proportionately more time on re-pricing than other sectors. This is in line with the expectations presented in the original Impact Assessment
x Water, Supply, Sewerage, Waste Management and Remediation spent proportionately more time on additional bookkeeping.

71
Table 3.35 Time burden breakdown by category and sector
Familiarisation (%)
System changes
(%)
Re-pricing (%)
Extra book keeping checks
(%)
Business operational
activities (%)
Accommodation and food services
31% 17% 10% 31% 10%
Arts, entertainment and recreation
34% 24% 8% 25% 9%
Education 25% 21% 13% 29% 11% Electricity, gas, steam and air conditioning supply
43% 17% 4% 26% 10%
Human health and social work
40% 21% 9% 22% 9%
Information and communication
29% 28% 3% 28% 12%
Manufacturing 31% 23% 11% 28% 8% Public administration and defence; compulsory social security
30% 23% 11% 23% 13%
Water, supply, sewerage, waste management and remediation
28% 24% 4% 35% 8%
Wholesale and retail trade; motor vehicles
32% 20% 14% 23% 11%
Overall 34% 21% 8% 28% 9% Base: all businesses who have not said ‘don’t know’ for any category (base: 1515)
3.8.2 Compliance burden (excluding business operational activities)
The figures given by businesses for all the categories apart from the ‘business operational costs category’ were also aggregated. The business operational costs category was excluded from the calculation because it was considered by HM Treasury to be costs incurred as a result of commercial decisions, and not directly a compliance activity. This calculated a figure for the total time it took each business to comply with the rate change. Again, any business that was unable to give a figure for an activity was excluded from the calculation. Therefore, the mean total compliance time burden for businesses was 10.21 hours, with the median figure much lower at 2.50 hours. This

72
difference shows the impact the businesses at the extremes of the spectrum have on the figures produced. Indeed the maximum compliance time reported by a business was 3,720 hours.
Businesses that were split evenly between selling to other businesses and consumers had the highest compliance burden. This was shown not only in a higher mean and an exceptionally high maximum value, but also in a higher median value.
Table 3.36 Compliance burden key statistics (hours spent)
Statistic Figure B2B B2C B2B /B2C Mean 10.21 9.1 9.6 15.9 Median 2.50 2.0 2.8 4.3 Minimum 0 0.0 0.0 0.0 Maximum 3720 1507.0 592.0 3720.0 Base: all businesses who have not said ‘don’t know’ for any category (exc. operational) (base: 1551)
The following figure shows the breakdown of the burden across the four categories; as expected from the earlier analysis (fig 3.30), bookkeeping, system changes and familiarisation make up the bulk of the compliance burden.
Figure 3.30 Category breakdown of overall compliance burden
Base: all businesses who have not said ‘don’t know’ for any category (exc. operational) (base: 1551)

73
Table 3.37 shows the mean and median values broken down by the size of the business; as would be expected, this shows that the time taken increased by company size.
Table 3.37 Compliance burden by business size (hours spent)
Business size Mean Median Micro 7.4 2.0 Small 21.0 7.0 Medium 28.3 8.6 Large 88.7 11.0 Base: all businesses who have not said ‘don’t know’ for any category (exc. operational) (base: 1551)
As shown in table 3.38 there is little difference by size in the category distribution of this time.
Table 3.38 Compliance burden by size and category
Familiarisation (%)
System changes (%)
Re-pricing (%)
Extra book keeping checks
(%) Micro 38% 24% 8% 31% Small 36% 22% 10% 32% Medium 37% 25% 9% 29% Large 37% 27% 12% 25% Base: all businesses who have not said don’t know for any category (exc. operational) (base: 1551)
The main difference between businesses selling to other businesses and those selling to consumers is that the former tended to spend proportionately more time on system changes as a proportion of the total and relatively less time on re-pricing (see table 3.39).
Table 3.39 Compliance burden by type of transaction and category
Familiarisation (%)
System changes (%)
Re-pricing (%)
Extra book keeping checks
(%) B2B 38% 26% 6% 30% B2C 37% 21% 9% 33% Evenly split between B2B and B2C
37% 21% 14% 28%
Base: all businesses who have not said don’t know for any category (exc. operational) (base: 1551)
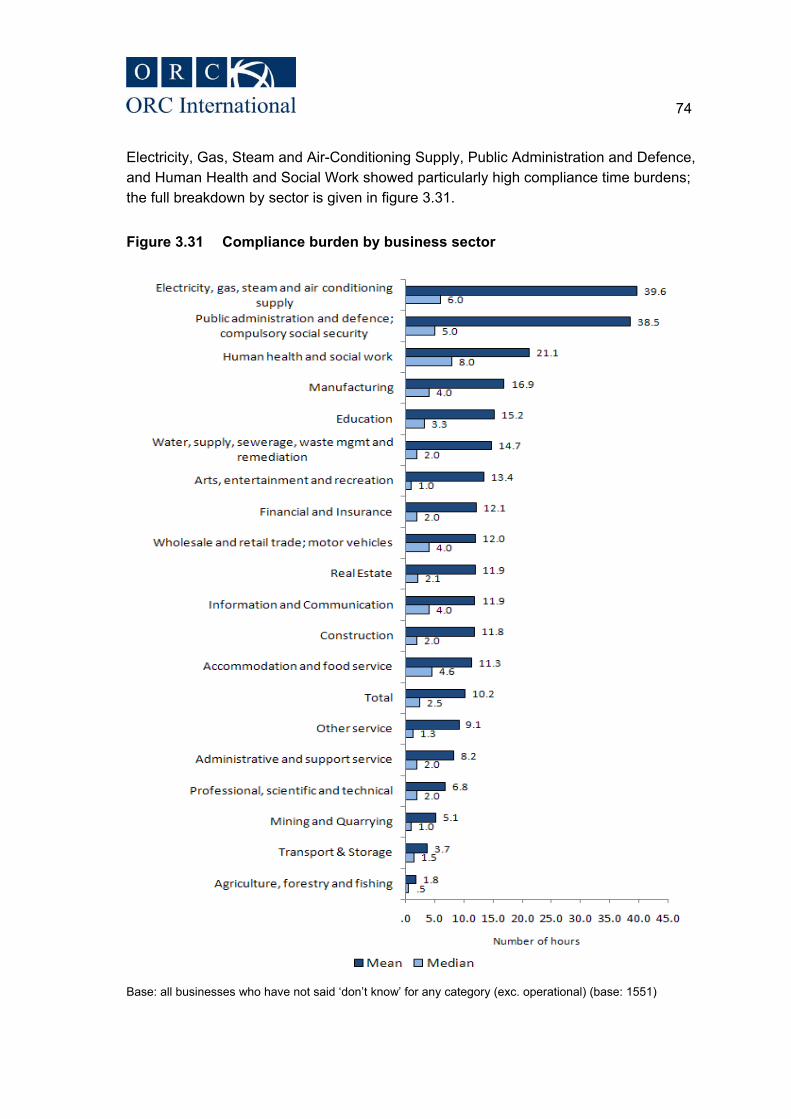
74
Electricity, Gas, Steam and Air-Conditioning Supply, Public Administration and Defence, and Human Health and Social Work showed particularly high compliance time burdens; the full breakdown by sector is given in figure 3.31.
Figure 3.31 Compliance burden by business sector
Base: all businesses who have not said ‘don’t know’ for any category (exc. operational) (base: 1551)
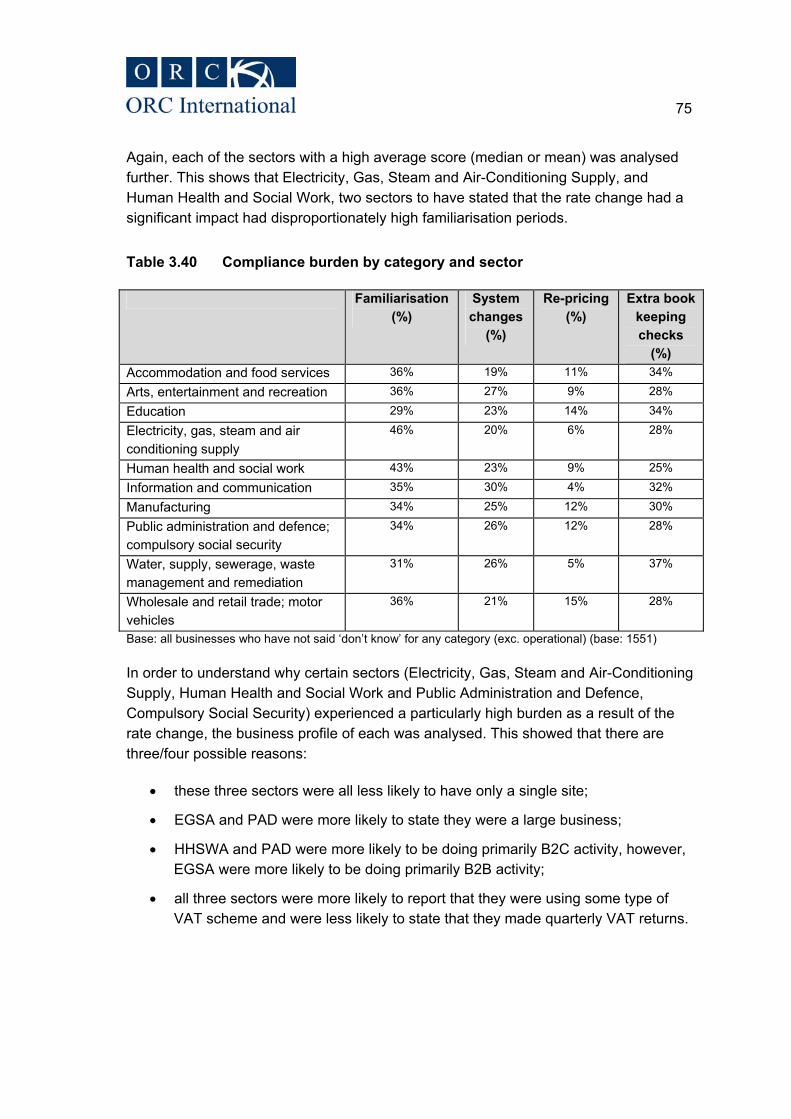
75
Again, each of the sectors with a high average score (median or mean) was analysed further. This shows that Electricity, Gas, Steam and Air-Conditioning Supply, and Human Health and Social Work, two sectors to have stated that the rate change had a significant impact had disproportionately high familiarisation periods.
Table 3.40 Compliance burden by category and sector
Familiarisation (%)
System changes
(%)
Re-pricing (%)
Extra book keeping checks
(%) Accommodation and food services 36% 19% 11% 34%
Arts, entertainment and recreation 36% 27% 9% 28%
Education 29% 23% 14% 34%
Electricity, gas, steam and air conditioning supply
46% 20% 6% 28%
Human health and social work 43% 23% 9% 25%
Information and communication 35% 30% 4% 32%
Manufacturing 34% 25% 12% 30%
Public administration and defence; compulsory social security
34% 26% 12% 28%
Water, supply, sewerage, waste management and remediation
31% 26% 5% 37%
Wholesale and retail trade; motor vehicles
36% 21% 15% 28%
Base: all businesses who have not said ‘don’t know’ for any category (exc. operational) (base: 1551)
In order to understand why certain sectors (Electricity, Gas, Steam and Air-Conditioning Supply, Human Health and Social Work and Public Administration and Defence, Compulsory Social Security) experienced a particularly high burden as a result of the rate change, the business profile of each was analysed. This showed that there are three/four possible reasons:
x these three sectors were all less likely to have only a single site;
x EGSA and PAD were more likely to state they were a large business;
x HHSWA and PAD were more likely to be doing primarily B2C activity, however, EGSA were more likely to be doing primarily B2B activity;
x all three sectors were more likely to report that they were using some type of VAT scheme and were less likely to state that they made quarterly VAT returns.
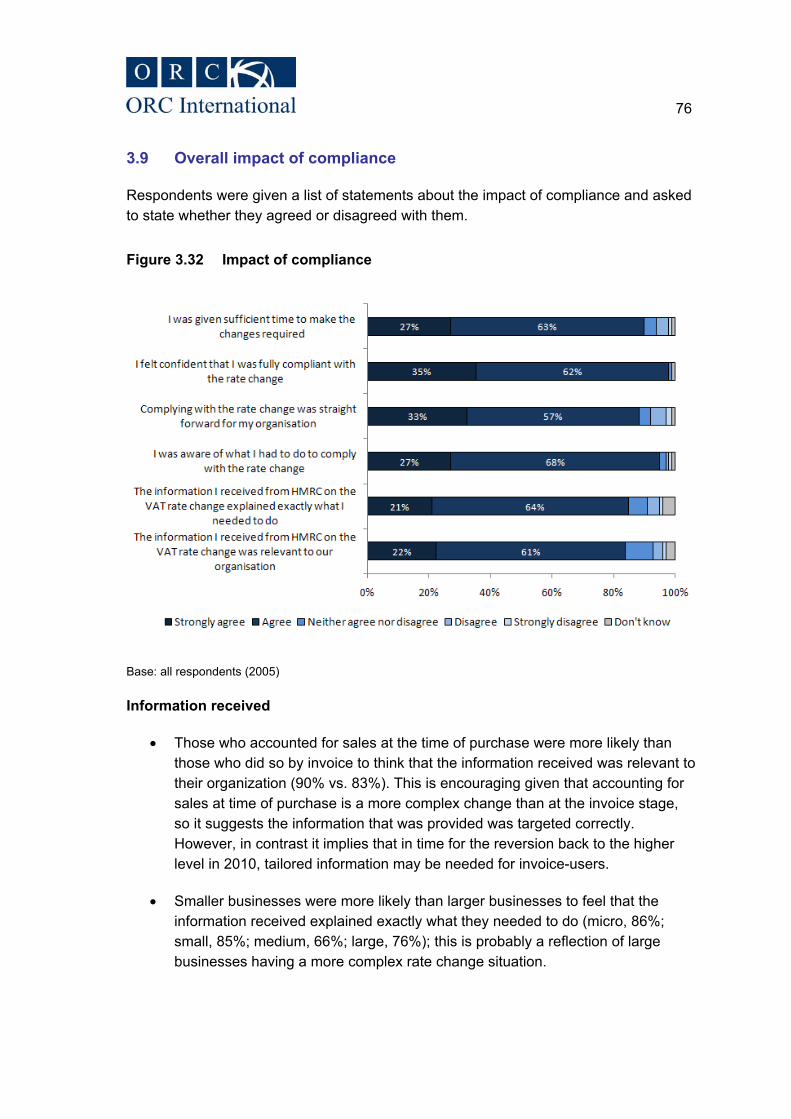
76
3.9 Overall impact of compliance
Respondents were given a list of statements about the impact of compliance and asked to state whether they agreed or disagreed with them.
Figure 3.32 Impact of compliance
Base: all respondents (2005)
Information received
x Those who accounted for sales at the time of purchase were more likely than those who did so by invoice to think that the information received was relevant to their organization (90% vs. 83%). This is encouraging given that accounting for sales at time of purchase is a more complex change than at the invoice stage, so it suggests the information that was provided was targeted correctly. However, in contrast it implies that in time for the reversion back to the higher level in 2010, tailored information may be needed for invoice-users.
x Smaller businesses were more likely than larger businesses to feel that the information received explained exactly what they needed to do (micro, 86%; small, 85%; medium, 66%; large, 76%); this is probably a reflection of large businesses having a more complex rate change situation.

77
Complying was straightforward
x Smaller businesses were also most likely to think that complying was straight-forward for their organisation. Whilst 92% of micro and 83% of small businesses found it straightforward, only 61% of medium and 74% of large businesses did so. One of the main issues for the 2010 reversion to the higher level will be to ensure that these businesses are adequately supported; therefore guidance and support may need to be tailored more towards medium and large businesses.
x Businesses accounting for sales through invoices were more likely than those who did so through a pre-funded account to find it straightforward (90% vs. 82%). The task analyses also highlighted that businesses using pre-funded accounts found it slightly more complex to comply. The issues that businesses faced were to do with changing standing orders and issuing credit notes.
There were several significant differences by industry sector as shown in table 3.41.
Table 3.41 “Complying was straightforward” by industry sector
� Found�it�straightforward�to�
comply�
Did�not�find�it�
straightforward�to�comply�
Agriculture,�forestry�and�fishing� 95� *�
Construction� 94� 1�
Accommodation�and�food�services�activities� 93� 4�
Mining�and�Quarrying� 93� 2�
Arts,�entertainment�and�recreation� 91� 7�
Manufacturing� 91� 5�
Other�service�activities� 89� 11�
Professional,�scientific�and�technical�activities� 89� 6�
Transport�and�storage� 89� 7�
Water�supply,�sewerage,�waste�management�and�
remediation�activities�
89� 9�
Administrative�and�support�service�activities� 88� 8�
Wholesale�and�retail�trade,�repair�of�motor�vehicles�
and�motorcycles�
87� 7�
Real�estate�activities� 86� 13�
Information�and�communication� 83� 12�
Financial�and�insurance�activities� 82� 14�
Education� 81� 11�
Human�health�and�social�work�activities� 77� 17�
Public�administration�and�defence;�compulsory�
social�security�
76� 17�
Electricity,�gas,�steam�and�airͲconditioning�supply� 71� 19�Base: all respondents (2005)

78
Therefore, the same sectors that were reporting that they had taken longer than average on compliance activities were also reporting that it was less straightforward. This meant that nearly 1 in 5 of the following sectors: human health and social work activities (17%), public administration and defence (17%) and electricity, gas, steam and air-conditioning supply (19%) said that it was not straightforward to comply. In contrast, over 90% of agriculture, forestry and fishing, construction, accommodation and food service activities, mining and quarrying, arts, entertainment and recreation, and manufacturing all said that it was straightforward to comply.
Given sufficient time to comply
x Businesses with multiple sites (more than six) were significantly less likely than those with single or only a small number of sites to think that they were given sufficient time to comply (48% vs. 90%)
x Medium and large businesses were also significantly less likely than micro and small businesses to think that they were given sufficient time to comply (micro, 92%; small, 87%; medium, 64%; large, 45%)
x Underpinning these findings, businesses that thought that complying was straightforward for their organization were significantly more likely than those who did not believe they were given sufficient time to comply (94% vs. 42%).
The 5% of businesses who suggested that they were not given enough time to comply were asked what impact this had had on their business. A selection of the responses from businesses is presented in figure 3.33, with impacts including invoice delays and errors, rushed system testing and confusion amongst sub-contractors.

79
Figure 3.33 Impact of not having sufficient time
In the task analyses and the trade association interviews, respondents were asked about the impact of the time-scale they were given. Most interviewees suggested that the time-scale given did not cause them undue problems, as compliance was relatively straightforward. One business even suggested that the short time-scale was a good thing in some ways, as it ‘means that you alert people and they got on with it – if you say it’s going to be in a year’s time, well, after a year, you’ve forgotten all about it’. However, there were a number of negative comments about the specific difficulties created by the timing:
“Four days’ notice, crazy. Just to give you some stats, we have thousands of standard- rated products in our product file, and we could only change so many a day, so you can
imagine the four working days’ notice for the last rate change, very challenging.” (business interview, services, 10m+)
“I guess there was a very different perception between the government intention and the cost which was borne by business … there were similar changes, actually a rise in Germany, and they were given 12 months’ notice and they were saying ‘we took twelve
months to do our changes, how on earth did you guys do it?’” (business interview, services, 10m+)
“The biggest beef I would have about this whole change being thrust upon me is that I suddenly had to start spending hours of my time that I didn’t have changing
everything, because there was virtually no warning of this; thankfully December wasn’t that busy a time.” (business interview, services, 67k-100k)

80
Businesses were also asked what impact the precise timing of the rate change had had on their costs. It was important to assess the implications of a December rate change, particularly as the future rate-reversal will happen at a similar time. In total less than a fifth (18%) thought that it had impacted on their costs.
Figure 3.34 The time of year (before Christmas) affected the costs
Base: all respondents (2005)
The four sectors that were more likely [than average] to say that the time of year affected costs were Construction (25%), Information and Communication (23%), Water, Supply, Sewerage, Waste Management (32%) and Wholesale and Retail (25%). However, it is unclear why these sectors have responded in this way as there is no clear profile emerging here. For example, some have a greater propensity for B2B sales, but others have more diverse sales.
Businesses that have at least half of their sales from consumer activity were significantly more likely than those selling primarily to other businesses to think that the timing of the rate change had affected costs (B2C, 20%; 50-50 split, 26%; B2B, 16%). Micro businesses were also significantly more likely than all other sizes of business to think that the time of year had affected their compliance costs (20% vs. small, 12%; medium, 14%; large, 8%).
3.10 Time and cost-saving initiatives
Businesses were asked if they had done anything that had helped them to save their business time or money whilst complying. The vast majority (93%) had not; it is likely

81
that this is a reflection of the fact that for most of the sampled businesses compliance was straightforward. Figure 3.35 shows a selection of the actions taken by businesses, including speedy communication with staff, using internal people to undertake changes and keeping pre- and post-change invoices separate.
Figure 3.35 Time and cost-saving initiatives
The issue of time and cost-saving initiatives was also covered in the task analyses and the trade association interviews; as with the quantitative findings most businesses reported that they did not do anything. This was either because there was no easy way to minimise burden, or perhaps because it had caused them negligible burden:
“No, there isn’t a shortcut way in my doing it, unless I hand wrote these to save time; I just manually changed everything because that’s the only way I can do it.”
(business interview, services, 67k-100k)
“No, I don’t think we did take any shortcuts – at the end of the day, when the change was being put upon us, we had to do it.” (business interview, services, 10m+)
However, one large Information and Communication business said that they found that pre-emptive communication with customers was important to minimise their burden:
“Essentially we anticipated a lot of the questions and so we actually prepared a very short e-mail and text … we anticipated by saying ‘this is what we are doing’ and pointed them at our website and kept the pressure off the call centre … the amazing thing was I

82
phoned up the Head of Call Centre management to say ‘how did it go?’ and she said, ‘it’s like the world ended, nothing has happened’ (business interview, services, 10m+)
A retail business commented that they did not change all their price labels on the shelves but implemented a point of sale change.
3.11 Conclusion
In spite of businesses having only a week to comply, most found the rate change straightforward, were confident that they had complied correctly, perceived guidance materials to be appropriate and relevant and indicated that they had had enough time to comply. Even so, it is clear from the responses that businesses would appreciate additional time to comply with any future rate changes.
There were a minority of businesses that found compliance less straightforward, notably large businesses and those within the Electricity, Gas, Steam and Air- Conditioning (EGSA), Public Administration and Defence (PAD), and Human Health and Social Work sectors (HHSW).
In total, it took on average (median) 2.5 hours to comply with the rate change and slightly longer (2.7 hours) when business operational activities were included in the calculation. The much higher mean figures show that a minority of businesses found compliance to be much more onerous: these were likely to be large businesses or those within the three aforementioned sectors (EGSA, PAD and HHSW).
The profiles of these sectors suggest that these businesses found it more time-consuming because they were more likely to be large businesses, working from multiple sites, more likely to be using some form of VAT scheme and less likely to make quarterly VAT returns.
Across all businesses, 38% of the compliance time burden was spent on familiarisation, although this rose to 46% for EGSA and 43% for HHSW. Feedback from trade associations and businesses interviewed in the task analysis stage suggests that time spent on familiarisation is the one area that may be slightly lower for the rate reversion.
83
4 Commercial impact
4.1 Introduction
As pointed out in Chapter 2 on the background to the research, this is a survey research report; it is not intended to be a full diagnosis of the impact of the policy change. The findings are based on results from a survey of a sample of businesses and a qualitative study. As such the information is not presented as, or intended to be, exact, indisputable fact but rather, as with all research of this kind, the valid perceptions of the respondents.
Respondents’ answers are based on recall: they are a best-estimate rather than based on objectively collected data. Responses given are what a business said they did as a result of the rate change; it is impossible to say whether they acted in the most efficient way or how much of the costs were driven by enacting just the minimum that HMRC required them to do to comply, or what went beyond that.
The statistics on the impact of the rate change are similarly perceptions. They are valid views from businesses of what they believe the impact on them was. However, the nature of the economic uncertainty at the time of the survey meant there were many different impacts on prices and sales. It is, therefore, difficult to isolate the effect of the VAT rate change on prices or on consumption. It should also be noted that the survey was carried out in spring 2009, only a few months into the rate reduction and, therefore, before the full impact of the rate cut might have been expected to be felt.
4.2 Approach to pricing
The overwhelming majority of organisations stated that they passed on the VAT rate saving to customers (78%) (see figure 4.1).

84
Figure 4.1 Business passed on the VAT saving to customers
Base: all respondents (2005)
Large businesses (see table 4.1), and businesses for whom B2C activity generates at least half of their revenue (see table 4.2), were most likely to have passed on the VAT rate reduction.

85
Table 4.1 Approach to pricing by business size
Yes - passed on
Passed on initially
No Don't know
TOTAL 78% 1% 15% 6% Micro 78% 1% 15% 7% Small 77% 1% 17% 6% Medium 80% *% 15% 4% Large 90% 1% 6% 3%
Base: all respondents (2005)
Table 4.2 Approach to pricing by customer profile
Yes - passed on
Passed on initially
No Don't know
TOTAL 78% 1% 15% 6% B2B 75% *% 17% 8% B2C 79% 1% 16% 4% Equally split between B2B and B2C
87% 3% 9% 1%
Base: all respondents (2005)
In terms of sector, those most likely to have passed on the rate reduction were wholesale, retail and motor vehicles, and transport and storage; the least likely were agriculture, forestry and fishing, and accommodation and food service (see figure 4.2 for the five most likely and five least likely to have passed on savings).

86
Figure 4.2 Business sectors most and least likely to have passed on the savings (% passing on savings)
Base: all respondents (2005)
Businesses were also asked how much of the rate change they passed on to their customers, and generally, they said that they passed on all of the savings (77%). 5% stated that they passed on only 1% and 11% passed on none of the savings (7% did not know).
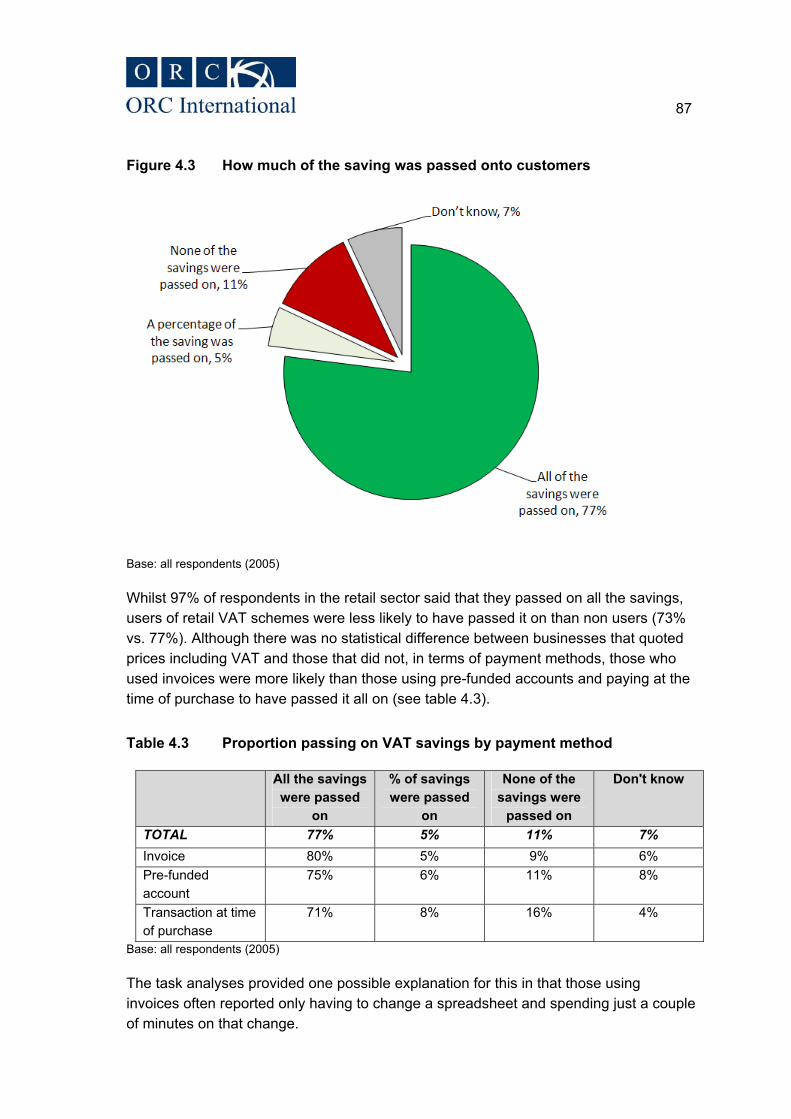
87
Figure 4.3 How much of the saving was passed onto customers
Base: all respondents (2005)
Whilst 97% of respondents in the retail sector said that they passed on all the savings, users of retail VAT schemes were less likely to have passed it on than non users (73% vs. 77%). Although there was no statistical difference between businesses that quoted prices including VAT and those that did not, in terms of payment methods, those who used invoices were more likely than those using pre-funded accounts and paying at the time of purchase to have passed it all on (see table 4.3).
Table 4.3 Proportion passing on VAT savings by payment method
All the savings were passed
on
% of savings were passed
on
None of the savings were
passed on
Don't know
TOTAL 77% 5% 11% 7% Invoice 80% 5% 9% 6% Pre-funded account
75% 6% 11% 8%
Transaction at time of purchase
71% 8% 16% 4%
Base: all respondents (2005)
The task analyses provided one possible explanation for this in that those using invoices often reported only having to change a spreadsheet and spending just a couple of minutes on that change.

88
Respondents were asked why they chose to make the pricing decision that they had. In terms of motivations for passing on all the savings, the most common reasoning was:
x It seemed the right thing to do (43%)
x Our prices are quoted as excluding VAT (30%)
x I thought I had to pass it on (21%)
x It would have been embarrassing if it had been revealed that we did not (7%)
x To help generate business / be more competitive (3%).
The qualitative stage of the fieldwork provided further insight into why businesses chose to pass on the rate change. It was similarly felt that passing on the rate change was simply the right thing to do:
“I don’t think there was a decision, we just did it, a natural process” (business interview, services, 67k-100k)
A franchise financial services provider commented that the decision was made for them:
“It was the way that the [franchises] were going to proceed, so all the franchisees would have done so – I certainly haven’t heard of anyone who hasn’t passed it on.” (business
interview, services, 0-67k)
A local authority suggested that it would have been embarrassing if it was discovered that they had not passed on the rate change. The interviewee commented that they had spent considerable time debating the rate changes with councillors, who were particularly forceful that it must be passed on.
Similarly, a financial services provider suggested that they had changed the prices on one of their smaller products available over the internet, in order to preserve their reputation. Whilst this change was disproportionately costly for their business, it was felt that the reputational cost of not passing this saving back to the customer was higher.
However, one local authority commented that they did not change the prices for their car parks as this would have been too costly. To accurately change the prices, an initial feasibility study found that it would have involved recoding all the machines and changing all the signage to reflect the new prices.
The 11% of the sampled businesses who decided not to pass on any of the savings to their customers were asked what they had used the money on. They were most commonly quite negative about this, with 36% considering that the reduction had had little or no impact. It was also notable that 30% did not know how it had been used. However, some were positive about its impact; 12% said that it had improved cash flow

89
at a difficult time, 5% felt that it had reduced their costs and 4% said it had helped to increase their businesses’ profit.
4.3 Sales impact of rate change
Nearly half of businesses (46%) felt that the rate change had not influenced the sales of goods or services (see figure 4.4).
Figure 4.4 Has the rate change had a positive sales impact?
Base: all respondents (2005)
This perception of the change having no positive sales impact was apparent across all types of business; there was no significant difference between businesses that sold primarily to other businesses (17% agree) and those that sold primarily to consumers (21%). Whilst micro (21%) and medium businesses (19%) were more likely than large businesses (11%) to think that it had had an impact upon sales, this is still only 1 in 5 of businesses that agreed within each business size group.
Businesses that used VAT retail schemes were more likely than those using other VAT accounting methods to state that there had been a positive impact on sales (41% vs. others, 18%). Figure 4.5 shows the differences in perceptions relating to the sales impact of the change by business sector. Even though the accommodation and food services industry was the sector with the lowest percentage that passed on the rate change, a relatively high percentage felt the rate change had had a sales impact.

90
Figure 4.5 Sales impact of the rate change by sectors (% who agreed there was a positive impact)
Base: all respondents (2005)
The trade associations and interviewees from the task analyses stage were similarly sceptical about the impact on sales of the rate change. They tended to feel that it was difficult to identify the difference caused by the rate reduction against that caused by the larger price decreases already happening. As one trade association pointed out:
“I’m tempted to say none … if you reduce the price by such a small amount in such a grip of a recession people can’t see its effect … it’s not a great deal of
money.” (trade association)
Another trade association commented that whilst it was not impossible that at some point in the future the reduction would be shown to have had a positive impact, currently it looked like “our members aren’t seeing it in their bottom lines”. The businesses interviewed in the task analyses were similarly unconvinced; a business within the health sector commented that for their business the slightly lower prices did not change anything for their customers:

91
”If you are a haemophiliac and you need plasma in your veins then the fact that VAT has gone from 17.5% to 15% doesn’t mean you can afford to have more – you need it
when you need it.” (business interview, services, 10m+)
Similarly, a business within the construction sector suggested that it had made little difference to their sales:
“I wouldn’t say generally there are any more sales, the main impact is that the customer is paying a little bit less than they would have done before … there has been no great
benefit to our business … I don’t think I’ve gained business, or that I have lost business because of the change.” (business interview, services, 1m-10m)
4.4 Overall impact of rate change
Businesses were asked about the overall impact that they thought the rate change had had on their organisation and customers. The majority of businesses felt that it had made no difference to their organisations (63%) or their customers (55%) (see figure 4.6 and 4.7).
Figure 4.6 Impact on their organisation
Base: all respondents (2005)

92
Figure 4.7 Impact on their customers
Base: all respondents (2005)
These findings are consistent with the views expressed in the task analyses and trade association interviews; however, a minority did consider the reduction to have had a slightly positive impact on their business. One business, that was partially exempt from VAT, suggested that the reduction in VAT meant a real cost benefit for their business:
“Also it’s a reduction, so for our sales, being partially exempt we’re only getting approximately 40% back, and to have the 2.5% taken off it was worthwhile really. So going back the other way is not going to be so great.” (business interview, services,
10m+)
Another business, similarly only partially exempt from VAT, commented that given that
“VAT is a cost to us, then that cost has come down … we’re only being charged VAT at 15% rather than at 17.5% and therefore we’ve incurred less irrecoverable [charges].”
(business interview, services, 10m+)
Whilst several businesses suggested that the short time-scale that was given for the rate change was logistically challenging, one trade association stated that commercially a short time-scale was essential:
“It was certainly good that it was quick, because a reduction in the VAT range which has any warning to it at all would kill construction projects for the period
running up to the change and would stop cash flow, so if you are going to reduce VAT you have to do it instantly.” (trade association)
93
Inevitably, due to some businesses’ customer profile, the VAT rate change was always going to have minimal impact on either themselves or their clients:
“The VAT just washes through everybody in industry – you could have 100% VAT if you wanted, it doesn’t make any difference to me, it’s only when you go in the shops that
there’s a possible change.” (business interview, services, 67k-100k)
A letting agent commented that they had received no feedback from customers suggesting that it had a positive impact:
“I haven’t had a single reaction from any of my landlord customers who I charge VAT to – none of them have called me up and said ‘Oh, isn’t it brilliant now that I only
get charged 15%’ … I don’t think I’ve had a single conversation with any of them actually.” (business interview, services, 100k-1m)
A trade association suggested that it was difficult to decide what the impact of the rate change had been on businesses:
“Hard to say in a period of such depression … when prices are falling anyway, but they certainly didn’t profit out of it … I don’t know how you decide whether [the reduction
applied] means that they’ve passed it on or not … if we were all in a stable state, you could see where the VAT had gone, but we’re not. I don’t think anybody is booking their
holiday based on the VAT they have managed to keep.” (trade association)
Similarly, a consultancy provider suggested that it had no effect on their organisation and there had been no noticeable difference in their cash flow:
“In terms of the fact that I’m only paying 15% and I’m also receiving 15% from my invoices, it hasn’t made a difference worth noting, it’s not a big enough change … it’s
really such a minor change.” (business interview, services, 67k-100k)
However, another business, a large software provider, suggested that it may have had a negative commercial effect. Not only had the change caused them considerable internal costs but it may actually have deterred business:
“The downside was the struggle to deal with the VAT rate change with so many customers in such a short period of time. How many of our customers took a dim view
of us because we didn’t pick up the phone calls on the Tuesday because we just couldn’t cope? … So in terms of service and what they think of us as
a business … that has to be the greatest concern … ‘[they] weren’t very good on the VAT rate change, I might have to look to buy my software from somewhere else’.”
(business interview, services, 10m+)
One business commented that some of their customers were refusing to pay their invoices at the higher rate, even though the service was provided before the cut-off date:
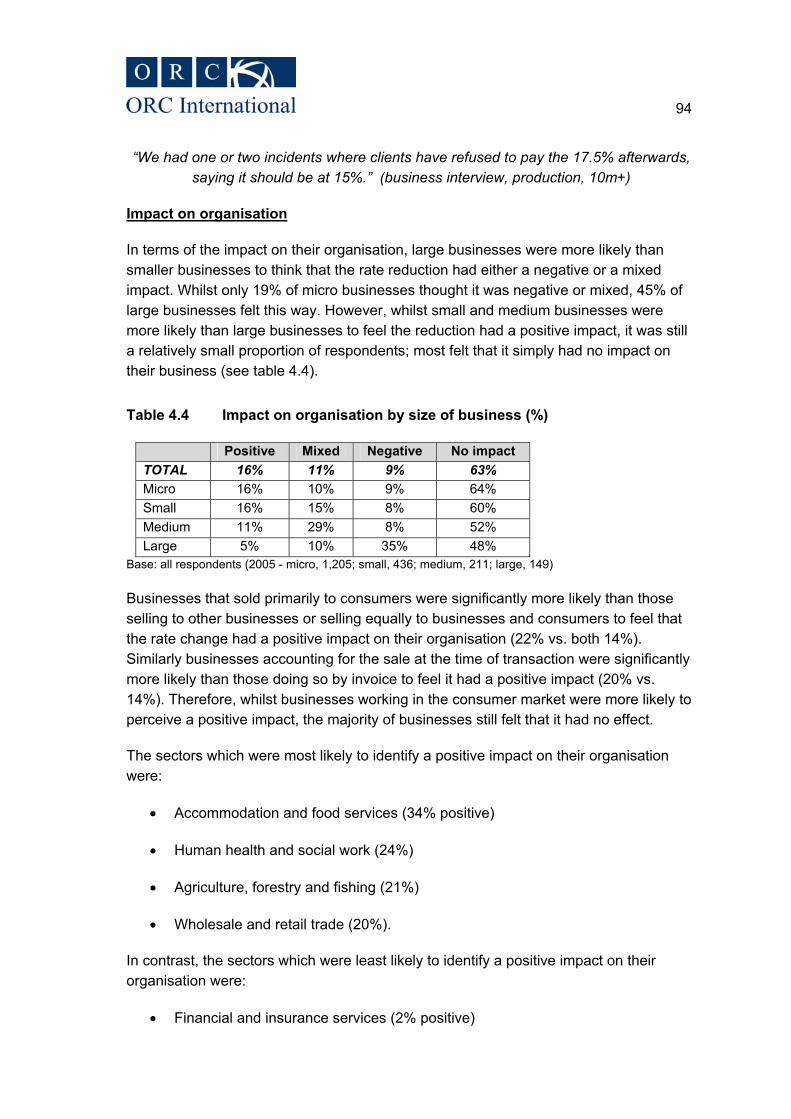
94
“We had one or two incidents where clients have refused to pay the 17.5% afterwards, saying it should be at 15%.” (business interview, production, 10m+)
Impact on organisation
In terms of the impact on their organisation, large businesses were more likely than smaller businesses to think that the rate reduction had either a negative or a mixed impact. Whilst only 19% of micro businesses thought it was negative or mixed, 45% of large businesses felt this way. However, whilst small and medium businesses were more likely than large businesses to feel the reduction had a positive impact, it was still a relatively small proportion of respondents; most felt that it simply had no impact on their business (see table 4.4).
Table 4.4 Impact on organisation by size of business (%)
Positive Mixed Negative No impact TOTAL 16% 11% 9% 63% Micro 16% 10% 9% 64% Small 16% 15% 8% 60% Medium 11% 29% 8% 52% Large 5% 10% 35% 48%
Base: all respondents (2005 - micro, 1,205; small, 436; medium, 211; large, 149)
Businesses that sold primarily to consumers were significantly more likely than those selling to other businesses or selling equally to businesses and consumers to feel that the rate change had a positive impact on their organisation (22% vs. both 14%). Similarly businesses accounting for the sale at the time of transaction were significantly more likely than those doing so by invoice to feel it had a positive impact (20% vs. 14%). Therefore, whilst businesses working in the consumer market were more likely to perceive a positive impact, the majority of businesses still felt that it had no effect.
The sectors which were most likely to identify a positive impact on their organisation were:
x Accommodation and food services (34% positive)
x Human health and social work (24%)
x Agriculture, forestry and fishing (21%)
x Wholesale and retail trade (20%).
In contrast, the sectors which were least likely to identify a positive impact on their organisation were:
x Financial and insurance services (2% positive)

95
x Other service activities (6%)
x Public administration and defence (8%)
x Electricity, gas, steam and air-conditioning (8%).
Given that one of the target groups in terms of the impact of the rate change was the retail sector, it is encouraging that users of retail VAT schemes were more likely to have a positive perception than those using any other method for accounting for their VAT (38% vs. rest, 17%).
Respondents were asked why they felt the way they did about the effect of the rate change on their organisation. The most common reasons why businesses felt positive about its impact were that:
x It benefited their customers (27%)
x It made their products more competitive (20%)
x It reduced the amount of VAT paid (15%)
x There was a slight cost benefit (13%)
x It had made a slight improvement to their business (9%).
Conversely, the most common reasons why businesses felt negative about its impact were to do with the lack of commercial impact and the burden it placed on businesses:
x Had made no difference to their business (30%)
x It was costly (27%)
x It caused additional work (28%)
x Not impacted on their sales (20%).
Impact on customers
In terms of the effect of the rate change on their customers, all sizes of businesses, apart from large businesses, were slightly more positive than they were about the impact on their organisation. Overall 24% thought the impact had been positive on customers compared with 16% thinking there had been positive impact on their organisations. In contrast, fewer than 1 in 10 large organisations were positive about the impact upon customers, with 28% thinking it had a negative impact. (Table 4.5)
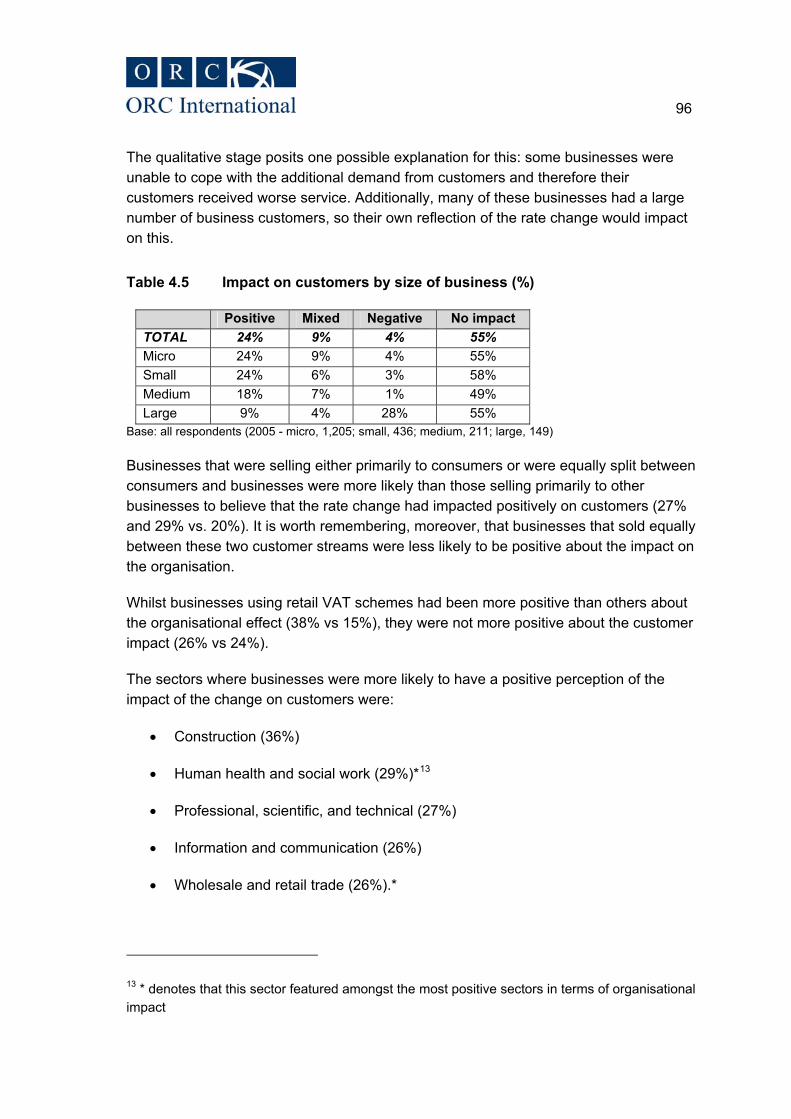
96
The qualitative stage posits one possible explanation for this: some businesses were unable to cope with the additional demand from customers and therefore their customers received worse service. Additionally, many of these businesses had a large number of business customers, so their own reflection of the rate change would impact on this.
Table 4.5 Impact on customers by size of business (%)
Positive Mixed Negative No impact TOTAL 24% 9% 4% 55% Micro 24% 9% 4% 55% Small 24% 6% 3% 58% Medium 18% 7% 1% 49% Large 9% 4% 28% 55%
Base: all respondents (2005 - micro, 1,205; small, 436; medium, 211; large, 149)
Businesses that were selling either primarily to consumers or were equally split between consumers and businesses were more likely than those selling primarily to other businesses to believe that the rate change had impacted positively on customers (27% and 29% vs. 20%). It is worth remembering, moreover, that businesses that sold equally between these two customer streams were less likely to be positive about the impact on the organisation.
Whilst businesses using retail VAT schemes had been more positive than others about the organisational effect (38% vs 15%), they were not more positive about the customer impact (26% vs 24%).
The sectors where businesses were more likely to have a positive perception of the impact of the change on customers were:
x Construction (36%)
x Human health and social work (29%)*13
x Professional, scientific, and technical (27%)
x Information and communication (26%)
x Wholesale and retail trade (26%).*
13 * denotes that this sector featured amongst the most positive sectors in terms of organisational impact

97
Sectors that had the lowest percentage of businesses that were positive about the impact of the rate change on customers were:
x Agriculture, forestry and fishing (15%)
x Electricity, gas, steam and air-conditioning (15%)
x Transport and storage (15%)
x Financial and insurance (14%)
x Accommodation and food services (11%)
x Arts, entertainment and recreation (9%).
4.5 Conclusion
Businesses in the main passed on the rate reduction largely because they felt it was the right thing to do. However, most businesses felt that it had no impact on either their customers (55%) or organisation (63%). This meant that only relatively small proportions were either positive (customers, 24%; organisation, 16%) or negative about its impact (customers, 4%; organisation, 9%).
Businesses were most likely to be positive because they felt the rate change benefited their customers (27%), made products more competitive (20%), and reduced the amount of VAT they had to pay (15%). Conversely they were most likely to be negative about its impact because they felt it had made no difference to their business (30%), was costly to implement (27%), and caused additional work (28%).
Perhaps as a reflection of the greater impact of the rate change, large businesses were notably more negative about the effect (customers, 28%; organisation, 35%) than smaller businesses.
In an open question at the end of the interview, businesses were asked to sum up in their own words the commercial impact of the rate change. Almost half felt that there had been no impact (48%) and a further 13% felt there had been minimal impact. Only 2% commented that it had had a good or positive impact.

98
5 The reversion to 17.5% in 2010
5.1 Comparing time and costs
The original impact assessment assumed that the time spent on and the costs incurred by businesses for the reversion to 17.5% would be slightly less than those incurred for the initial rate change. For example, it was originally assumed that familiarising with the standard rate would be less time-consuming than with a new rate. Similarly, it was expected that businesses would reverse system changes by undoing what they had done to change to 15% and, therefore, this would take less time than the initial rate change.
However, more than three-quarters of businesses (77%) felt that the time and cost of the change back to 17.5% would be the same. In contrast to expectations in the original impact assessment, only 12% thought that it would be less burdensome and 6% that it would be more.
Figure 5.1 How the time and cost of reversal will compare
Base: all respondents (2005)
There was little difference between businesses that were involved in primarily B2B and B2C work; the notable difference was that B2B businesses were slightly more likely to think that the time and costs would be lower (14% vs. 7%). Whilst SMEs generally

99
thought that the time and cost would be the same (see table 5.1 for individual breakdown), large businesses were more divided; 33% thought it would be the same, 43% that it would be more, 20% that it would be less and 4% did not know.
Table 5.1 How the time and cost of reversal will compare by organisation size
Same More Less Don’t know Micro 78 6 11 6 Small 77 7 15 2 Medium 82 2 13 3 Large 33 43 20 4
Base: all respondents (2005 - micro, 1,205; small, 436; medium, 211; large, 149)
Encouragingly, many of the sectors with higher than normal compliance time were slightly more likely to think that the time and cost of the reversal would be lower. Most notably, 29% of financial and insurance, 26% of information and communication, 20% of education, and 18% of public administration businesses thought that the reversal would involve less time and cost (see table 5.2).
Table 5.2 How the time and cost of reversal will compare by organisation sector (%)
Same More Less Don’t know Human health and social work 90 2 3 5 Mining and quarrying 84 4 4 8 Administrative and support services 83 5 9 3 Arts, entertainment, and recreation 83 6 6 5 Construction 83 * 13 4 Professional, scientific, and technical activities
82 4 11 2
Transport and storage 82 7 3 8 Water supply, sewerage, waste management and remediation
82 4 6 9
Other service activities 77 12 7 4 Wholesale and retail 76 6 12 5 Electricity, gas, steam and air conditioning
75 3 16 5
Accommodation and food services 74 18 3 5 Education 74 4 20 2 Public administration and defence 74 4 18 4 Real estate 74 6 13 6 Agriculture, forestry and fishing 73 8 6 13 Manufacturing 69 10 13 8 Information and communication 68 2 26 5 Financial and insurance 63 7 29 *

100
All the businesses interviewed in the task analyses and the trade associations were asked their opinion about how the time and cost of the reversion would compare to the initial change. As with the quantitative analysis, most did not think it would take less time, but rather that it would take a similar amount of time.
However, one business suggested that they might be able to save time by rather than simply ‘reversing what we’ve done … I might be even cleverer than that, I might pick up the models that existed during 2008’. Similarly a trade association commented that there might be a slight reduction of negative impact as businesses would be familiar with the process and would be able to plan their activity:
“It’ll be a repeat of the VAT rate reduction … but at least [the changes] can be done at some point during the year now because we now know it’s going to go back up
on 1st January for certain … the saving is on the technical analysis side really, the first bit, which is you understand the rules, you understand the changes, and you
understand a lot clearer where in your organisation it’s going to have an impact.” (trade association)
The qualitative work also provided further insight into why some businesses may find that the rate reversal will actually be more time-consuming. It was felt that the rate reduction was possible because of the various shortcuts undertaken (point of sale reduction being one); however, a similar point of sale increase would not be possible.
Customers were willing to accept the inconvenience of incorrect marked prices when the price went down when they went to pay, but would not be willing to accept the opposite. It was also felt that it would be problematic from a Trading Standards point of view:
“When you put the VAT rate down you can stick a note saying ‘VAT rate change will be applied at POS’ and customers will live with that … when you’re going the other way … the price is this, but we’re actually going to charge you more at the POS, the answer is
that the customer won’t live with that.” (business interview, services, 10m+)
“My experience with the Trading Standards is they know two colours, black and white, they just don’t deal with grey, and you are either compliant or you’re not compliant.”
(business interview, services, 10m+)
A trade association suggested that the rate increase could cause dissatisfaction and confusion amongst customers. Given the time of year, which is traditionally a time for seasonal reductions, a small increase in prices could be confusing:
“There is concern that putting prices up at that period could lead to consumer confusion, so you’ve got the sales impact, but you would also have running at the
same time some sort of VAT increase impact which, I have to say, if I walked into a shop and saw 20% off and 2.5% on I might sit there and think ‘Why is that going on’ …

101
there is a perception problem, in terms of a [good or service] goes up … a couple of percent, people might be dissuaded from making that purchase in light of that increase.”
(trade association)
5.2 Suitable notice period for a rate change
The VAT rate reduction came in with a week’s notice – whilst only 5% of businesses suggested this time-scale caused them a problem, businesses were also asked what they thought was the minimum acceptable lead time for future rate changes.
This produced important findings for future best practice: 80% of businesses would prefer more than one week’s notice with the largest proportion requesting 4 weeks (33%).
Figure 5.2 Minimum amount of notice businesses would like for rate changes
Base: all respondents (2005)
Medium and large enterprises were more likely to need relatively long lead times (5 or more weeks) for a rate change (53% and 52%, respectively; compared with micro, 37%; small, 32%).

102
Table 5.3 Minimum amount of notice businesses would like for rate changes by organisation size
Micro Small Medium Large 1 week or less 11% 11% 3% 3% 2 weeks 6% 9% 3% 3% 3 weeks 2% 7% 2% 1% 4 weeks 33% 34% 31% 28% 5 or more weeks 37% 32% 53% 52% Don’t know 11% 7% 8% 13%
Base: all respondents (2005 - micro, 1,205; small, 436; medium, 211; large, 149)
Whilst there was no consistent theme between different customer profile groups, businesses that used a retail VAT scheme were more likely to require 5 or more weeks’ notice (51% compared with average, 37%).
The sectors that were most likely to require 5 or more weeks’ notice were in line with the earlier findings relating to which sectors found compliance time-consuming (see table 5.4 for a full breakdown):
x Electricity, gas, steam, air-conditioning (52%)
x Human health and social work (48%)
x Construction (46%)
x Public administration and defence; compulsory social security (46%)
x Real estate (45%)
x Water, supply, sewerage, waste management and remediation (45%)
x Information and communication (43%).

103
Table 5.4 Minimum amount of notice businesses would like for rate changes by organisation sector
1 week or less
2 weeks 3 weeks 4 weeks 5 or more weeks
Don’t know
Accommodation and food service activities
6% 12% 11% 5% 33% 34%
Administrative and support service activities
12% 16% 7% 1% 35% 30%
Agriculture, forestry and fishing
23% 15% 5% 1% 24% 33%
Arts, entertainment and recreation
11% 6% 7% 3% 30% 43%
Construction 15% 8% 7% 1% 24% 46% Education 9% 9% 0% 1% 40% 41% Electricity, gas, steam and air conditioning supply
8% 8% 3% 1% 28% 53%
Financial and Insurance activities
14% 16% 1% 3% 30% 37%
Human health and social work activities
6% 7% 0% 5% 34% 48%
Information and Communication
3% 3% 3%
49% 44%
Manufacturing 6% 8% 7% 0% 42% 36% Mining and Quarrying 10% 4% 10% 42% 35% Other service activities 11% 11% 7% 2% 35% 36% Professional, scientific and technical activities
9% 18% 5% 4% 30% 35%
Public administration and defence; compulsory social security
6% 5% 4% 1% 38% 46%
Real Estate Activities 11% 9% 7% 28% 45% Transport & Storage 17% 9% 1% 3% 33% 37% Water, supply, sewerage, waste mgmt and remediation activities
12% 14% 5% 1% 24% 44%
Wholesale and retail trade; repair of motor vehicles and motorcycles
8% 7% 10% 7% 36% 33%

104
5.3 Help that HMRC / Government could provide for rate reversal
Just over a half of the sampled businesses (55%) said that there was nothing that the Government or HMRC could do to help them prepare for the future rate increase. Of those that did suggest help, responses from businesses were varied, but the most commonly mentioned areas were:
x Provide adequate notice (11%)
x Don’t change it (8%)
x Provide guidance materials (4%)
x Provide financial assistance (2%).
Possible help and the wider logistics of the rate change were also discussed in the qualitative stage.
As with the findings presented above, the main issue raised in most task analyses was that to ensure a smooth change back, sufficient notice of the change was required. So, if the date was changed from 1 January 2010, then they wanted a reasonable14 amount of notice. It was important for businesses to be notified beforehand ‘to tell me what day to change it from’ and that that they ‘need a fair amount of notice’.
Given that the most commonly expressed viewpoint in the task analyses was that the rate reduction was straightforward, there were only limited suggestions for what HMRC could do to help. There is some consistency between the suggestions made in the task analyses, the quantitative stage and those made by the trade associations. The suggestions made in all survey components were:
x Provide a suitable notice period of the date change
x Remind businesses that the change is coming up
x Provide guidance materials on what needs to be done, ensuring that it is in layman’s terms. It should include a frequently asked questions (FAQ) section consisting of questions that HMRC were asked in the initial change
x Change the date from 1 January to a time that is more convenient to businesses. This could involve delaying the time to a month later so as not to
14 The quantitative stage suggests that businesses consider that they require at least 4 weeks notice.

105
overlap with a holiday season and end of financial year for many businesses; or, bringing the date forward.
As detailed above, it was felt both by some of the businesses and trade associations that the precise timing could be problematic. One trade association commented that due to the time of year many businesses would be ‘shut down, there won’t be anybody here, but we can’t shut down because people will have to do this somehow, I don’t know how!’
On a similar theme, a trade association requested that the timing should be delayed by at least a month, as the ‘31st December / 1st January coincides with the post-Christmas sales period, which is one of the most resource-hungry times of year for our members’.
Finally, another business summed up their view as this:
“I think the biggest problem with the change was the lack of notice, so you could say that has been addressed because advance notice has been given and everyone
knows … I think the problem is … that 1st January is a really rubbish time to make the change, … most businesses are very light staffed on 1st January.” (business interview,
services, 10m+)
The trade associations made a number of additional recommendations to HMRC:
x Understand that some businesses will have issued annual VAT schedules which needs to be taken into consideration
x Provide a less prescriptive ‘soft touch’ approach for business to business transactions
x Provide specific industry guidance in terms of what it means for each industry sector and also by size of business
x Take whatever ideas come from the research and action any reasonable points that are made.
106
5.4 Conclusion
Businesses were unconvinced that the future rate reversal would be less time-consuming or costly than the original VAT rate change. However, it should be remembered that the vast majority of businesses found the rate reduction straightforward, were confident that they had complied correctly, and felt that the time-scales given were not problematic.
Businesses felt that a preferable notice period for future changes would be at least four weeks and four-fifths indicated that they wanted longer than the one week given for the rate reduction.
Over half of businesses did not think that there was anything HMRC or the Government could do to help them with the rate reversal, but the most common suggestions were providing adequate notice, not changing the rate and providing guidance materials.

107
6 Conclusion
6.1 Impact of compliance
Just over three quarters (78%) of the sampled businesses familiarised themselves with what they needed to do to comply with the VAT rate change, 71% performed extra bookkeeping checks, 67% changed systems, 43% undertook some form of business operational activity, and 27% re-priced goods/services.
The familiarisation process was the most time-consuming element of overall activity relating to the rate change, accounting for 34% of total time. Extra bookkeeping accounted for 28% of overall time spent, followed by system changes (21%), re-pricing (8%) and business operational activities (9%). The corresponding breakdown for compliance activities (excluding business operational activities) was familiarisation (38%), extra bookkeeping (31%), system changes (23%) and re-pricing (8%).
Within each of the categories of activity, relatively high proportions of businesses involved senior personnel. This was particularly the case for familiarisation with the rate change. No matter whether the business was small, medium or large, senior levels within the organisation tended to be involved. The qualitative fieldwork suggests one possible reason for their involvement was the commercial nature of the rate change.
Larger organisations were more likely than smaller businesses to have had to undertake compliance activities as a result of the rate change. They were also more likely to involve a diverse range of staff, with apart from the familiarisation, involving more junior staff members. As a result of their greater activity, they generally had to spend longer in order to comply with the rate change.
The initial compliance decision of whether to pass on the rate change to consumers was, for many, a complex commercial decision with repercussions for their organisation’s reputation. Senior management were involved in weighing up the cost of implementing changes versus the possible reputational risk of adverse publicity if their organisation failed to pass on the benefits of the reduced rate.
In spite of businesses having only a week to comply, most found the rate change straightforward, were confident that they had complied correctly, that guidance materials were appropriate and relevant and that they had enough time to comply.
Even so, it is clear that additional time to comply with any future rate changes would be appreciated. There were a minority of businesses that found compliance less straight-forward, notably large businesses and those within the Electricity, Gas, Steam and Air- Conditioning supply (EGSA), Public Administration and Defence (PAD), and Human Health and Social Work sectors (HHSW).

108
In total, it took on average (median) 2.5 hours to comply with the rate change and slightly longer (2.7 hours) when business operational activities were included. The much higher mean figures indicate that for a minority of businesses, compliance activity was particularly time-consuming: these were likely to be large businesses or those within the three aforementioned sectors (EGSA, PAD and HHSW).
The profiles of these sectors suggest that these businesses experienced higher time costs because they were more likely to be large businesses, working from multiple sites, and more likely to be using some form of VAT scheme.
The split between different types of activities related to the rate change suggests that there is potential for the future rate reversal to have less of an impact. Indeed, across all businesses, 38% of the compliance time burden was spent on familiarisation – this rose to 46% for EGSA and 43% for HHSW. Feedback from trade associations and businesses interviewed in the task analysis stage suggests that familiarisation is one area that may be slightly less time-consuming for the rate reversal.
6.2 Commercial impact
Although businesses in the main passed on the rate reduction, most businesses felt that it had no impact on either their customers (55%) or organisation (63%). This meant that only relatively small proportions were either positive (customers, 24%; organisation, 16%) or negative about its impact (customers, 4%; organisation 9%).
However, perhaps as a reflection of the fact that large businesses tended to spend proportionately more time on activity related to the rate change, they were notably more negative about either impact (customers, 28%; organisation, 35%) than smaller companies. Approaching half (44%) felt that the overall impact on their business was mixed or negative.
It is understandable (just due to relative size) that larger businesses would have a larger burden; however, further segmentation analysis could provide a greater insight into the views of these businesses to explore any other underlying factors.
Businesses were asked to sum up in their own words what they thought was the commercial impact of the rate change. Almost half felt that there had been no impact (48%) and a further 13% felt there had been minimal impact.
6.3 Rate reversal from 15% to 17.5%
Businesses were not convinced that the future rate reversal would be less time-consuming or costly. However, it should be remembered that the vast majority of businesses found the rate reduction straightforward, were confident that they had complied correctly and that the time-scales given were not problematic.

109
Despite this, businesses felt that a preferable notice period for future changes would be at least four weeks, 80% wanted longer than the one week given for the rate reduction. Over half of businesses did not think that there was anything HMRC or the Government could do to help them with the rate reversal, but the most common suggestions were providing adequate notice, not changing the rate at all and providing guidance materials.

110
Appendix A – Profile
This appendix details the profile of the respondents. It details both weighted and unweighted figures, as it builds the profile of who was actually spoken to.
A.1 Respondents’ role
Firstly, in terms of role in their business; the majority of respondents were a manager or senior official (71% unweighted, 72% weighted).
Figure A.1 Respondents’ role
Base: all respondents (2005)

111
A.2 Number of sites
The majority of businesses interviewed in this research had only one site (77% unweighted, 88% weighted).
Figure A.2 Number of sites
Base: all respondents (2005)
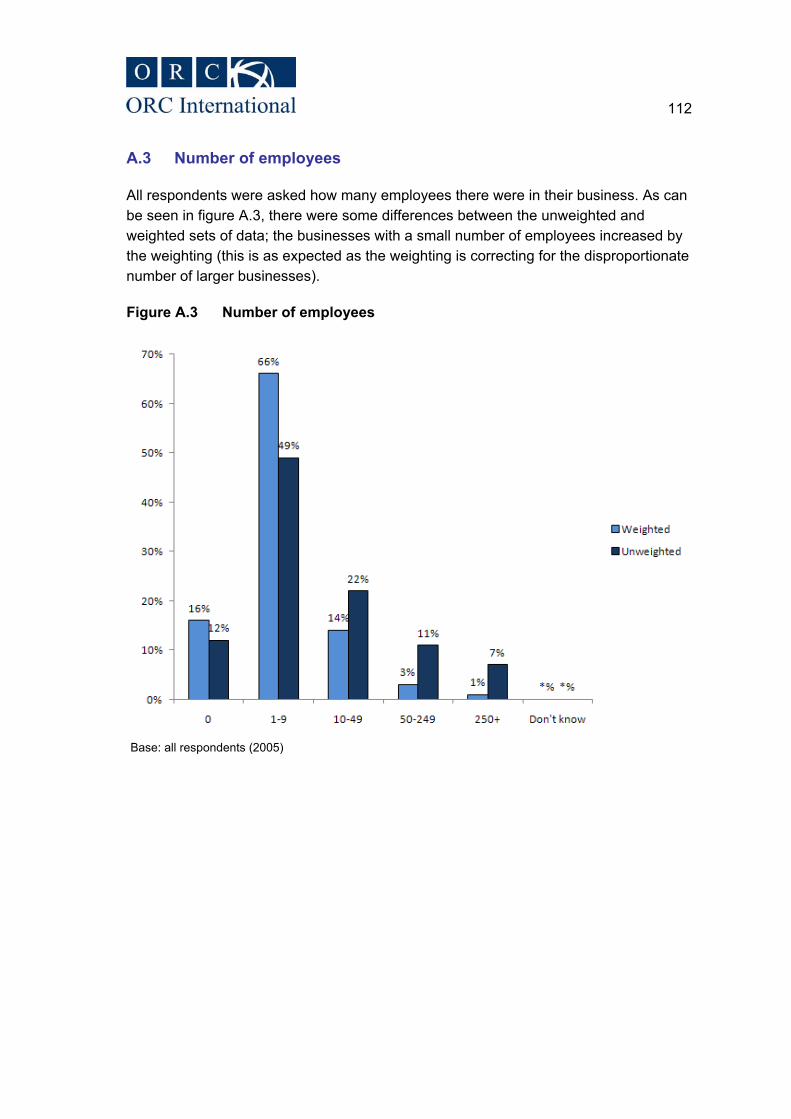
112
A.3 Number of employees
All respondents were asked how many employees there were in their business. As can be seen in figure A.3, there were some differences between the unweighted and weighted sets of data; the businesses with a small number of employees increased by the weighting (this is as expected as the weighting is correcting for the disproportionate number of larger businesses).
Figure A.3 Number of employees
Base: all respondents (2005)

113
A.4 Sales and accounting processes
Respondents were asked a number of questions about their sales and accounting processes. The majority of respondents account for at least some of their sales through invoicing. However, a substantial proportion also account for some sales at the time of purchase (for example in the retail sector). There is little variation between the weighted and unweighted data.
Figure A.4 Types of sales
Base: all respondents (2005)
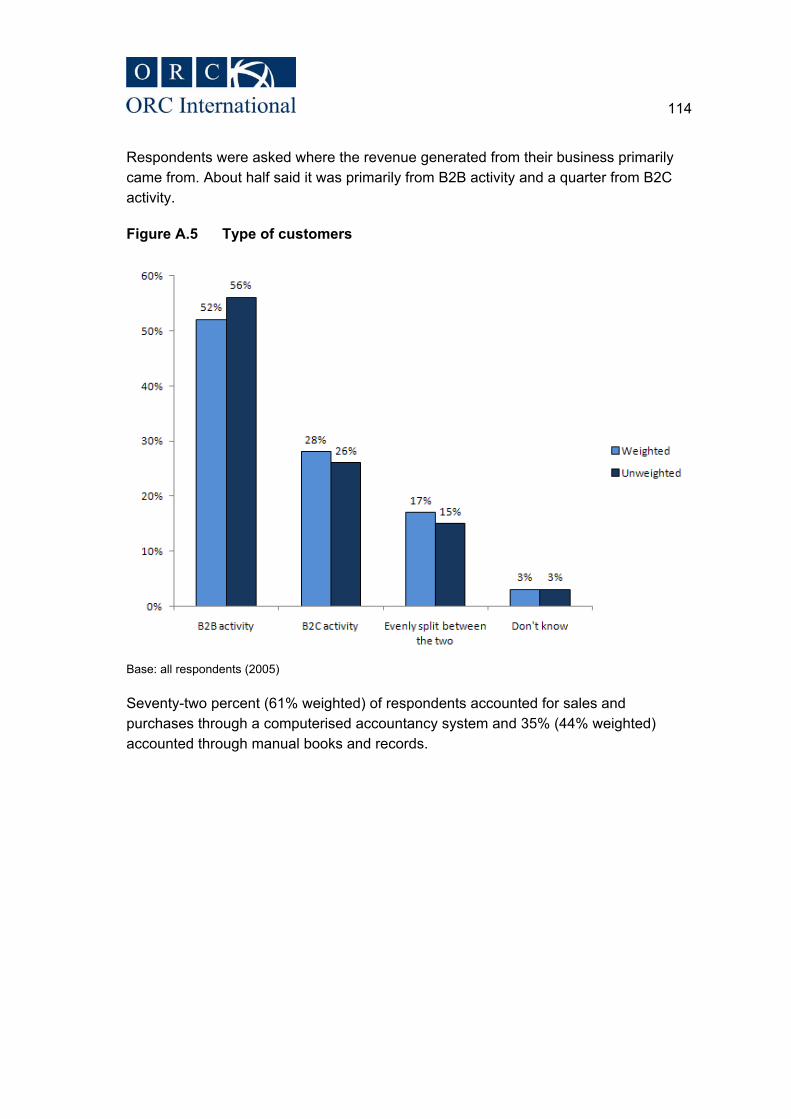
114
Respondents were asked where the revenue generated from their business primarily came from. About half said it was primarily from B2B activity and a quarter from B2C activity.
Figure A.5 Type of customers
Base: all respondents (2005)
Seventy-two percent (61% weighted) of respondents accounted for sales and purchases through a computerised accountancy system and 35% (44% weighted) accounted through manual books and records.

115
Figure A.6 Accounting for sales and purchases
Base: all respondents (2005)

116
Appendix B – Questionnaire
Hello, my name is _________ and I am calling from ORC International, an independent research agency. I am calling on behalf of Her Majesty’s Revenue and Customs (HMRC). IF NECESSARY: You will have recently received a letter from HMRC explaining that we are conducting some research on their behalf to examine the costs to businesses of the reduction in the standard rate of VAT from 17.5% to 15% last December Can I speak to the person within your business that deals with your VAT or tax returns? IF ASKED WHY: We are looking at conducting a number of interviews with businesses to find out about their experiences complying with the VAT rate change. The results of this survey will help the Government to better understand the impact of the change. WHEN THROUGH TO THE RIGHT PERSON Good morning/ afternoon. My name is ......................... and I am working for an independent market research agency called ORC International and am calling on behalf of HM Revenue and Customs. Can I please confirm that you have responsibility for VAT accounting issues within your organisation, including the responsibility of implementing the temporary reduction to the standard rate of VAT from 17.5% to 15%? Can I just confirm that your business makes standard rated sales? If not THANK AND CLOSE ASK ALL: We are conducting research on behalf of HMRC. As you may know the Government announced in the Pre-Budget report a temporary reduction in the standard rate of VAT. You may recall receiving a letter from HMRC about a month ago informing you of this research. This survey will assess the costs to your business of implementing the VAT change from 17.5% to 15% in December 2008. This survey will last about 15 minutes. Are you interested in taking part in the survey? IF WILLING TO PARTICIPATE IN INTERVIEW: CONTINUE WITH MAIN SURVEY IF NOT WILLING TO PARTICIPATE IN INTERVIEW: That’s no problem. Thank you and close.

117
Section A – Demographics I would like to ask you a few questions about the time you spent complying with the VAT rate change. However, before doing so I would like to ask you just a few questions about you and your organisation. 1 What is your job title / position? WRITE IN VERBATIM AND CODE – READ OUT IF NECESSARY
Employee Type Managers and senior officials Professional occupations Associate professional and technical occupations Administrative and secretarial occupations Skilled trades occupations Personal service occupations Sales and customer service occupations Process, plant and machine operatives Elementary occupation Other (specify) IF TYPE IN SAMPLE = WHOLESALE AND RETAIL TRADE; REPAIR OF MOTOR VEHICLES AND MOTORCYCLES 2a Which of the following best describes your business? Sale, maintenance and repair of motor vehicles and motorcycles; retail sale of automotive fuel
1
Wholesale trade and commission trade, except of motor vehicles and motorcycles
2
Retail trade, except of motor vehicles and motorcycles; repair of personal and household goods
3
Don’t know 4 2b How many sites does your business operate from? SINGLE CODE Single Site 1 1 – 5 sites 2 6 – 15 sites 3 16 + sites 4 Don’t know 99 3. To get an idea of the size of your establishment, can you please tell me the turnover of your business in the last year? Please give your best estimate? WRITE IN £THOUSANDS (1-9,999,999,999) AND INTERVIEWER TO CODE TO RANGE FOR EXAMPLE £1 million IS £1,000 £1 billion is £1,000,000 FOR DON’T KNOW, CODE THE FOLLOWING RANGES: SINGLE CODE Less than £67,000 1 £67,000-£99,999 2
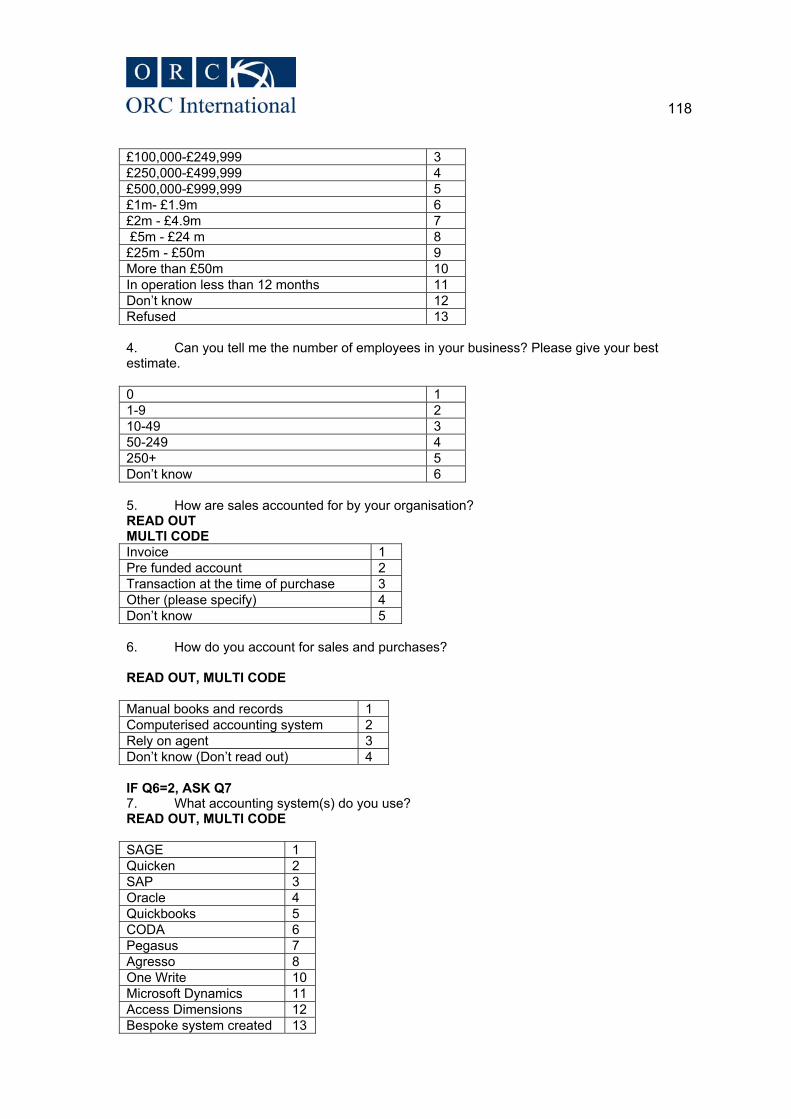
118
£100,000-£249,999 3 £250,000-£499,999 4 £500,000-£999,999 5 £1m- £1.9m 6 £2m - £4.9m 7 £5m - £24 m 8 £25m - £50m 9 More than £50m 10 In operation less than 12 months 11 Don’t know 12 Refused 13 4. Can you tell me the number of employees in your business? Please give your best estimate. 0 1 1-9 2 10-49 3 50-249 4 250+ 5 Don’t know 6 5. How are sales accounted for by your organisation? READ OUT MULTI CODE Invoice 1 Pre funded account 2 Transaction at the time of purchase 3 Other (please specify) 4 Don’t know 5 6. How do you account for sales and purchases? READ OUT, MULTI CODE Manual books and records 1 Computerised accounting system 2 Rely on agent 3 Don’t know (Don’t read out) 4 IF Q6=2, ASK Q7 7. What accounting system(s) do you use? READ OUT, MULTI CODE SAGE 1 Quicken 2 SAP 3 Oracle 4 Quickbooks 5 CODA 6 Pegasus 7 Agresso 8 One Write 10 Microsoft Dynamics 11 Access Dimensions 12 Bespoke system created 13

119
by themselves Bespoke system (created by 3rd party)
14
Other (please specify) 49 Don’t know 50 8. Is the revenue generated by your business primarily through… READ OUT B2B activity 1 B2C activity 2 Evenly split between the two 3 SECTION B – COMPLIANCE COSTS OF VAT RATE CHANGE B1 – VAT RATE CHANGE OVERVIEW The main purpose of this interview, is to find out what impact the VAT Rate Change has had on your organisation. 9. Firstly, can I ask, do your quoted prices for products and/ or services include the standard rate of VAT? SINGLE CODE Yes 1 No 2 Don’t know 3 10. What scheme does your business use for VAT? NOTE TO INTERVIEWER: SOME SCHEMES CAN BE USED IN COMBINATION WITH OTHERS, E.G. FLAT RATE SCHEME AND ANNUAL ACCOUNTING CAN BE USED AT THE SAME TIME. THERE’S NO EASY SINGLE DEFINITION OF ‘SCHEME’ THAT COVERS ALL. SOME ARE HIGH-LEVEL VAT ACCOUNTING METHOD SCHEMES, SOME ARE SPECIFIC TO CERTAIN SYSTEMS OR TYPES OF TRANSACTIONS. MULTI CODE READ OUT LIST Annual Accounting 1 Cash Accounting Scheme 2 Flat rate scheme 3 Apportionment scheme 4 Direct calculation scheme 5 Point of sale scheme 6 Margin schemes 7 Bespoke scheme 8 Other (please specify 9 Don’t know 10 11. How did you first hear that you would have to comply with the VAT Rate Change? DON’T READ OUT, MULTICODE HMRC letter 1 HMRC Website 2 Newspaper 3

120
TV news 4 Radio news 5 Online news 6 Word of mouth within your organisation 7 Word of mouth outside your organisation 8 Consultant 9 Software provider 10 Other (PLEASE SPECIFY) 11 Don’t know 12 Thank you, we would now like to understand what costs your business incurred to comply with the VAT Rate Change, we will be asking you about some tasks that you may have found that you had to do when complying with the rate change, and we will ask you who does them and how long it took. 12. Can you just tell me briefly what your business had to do to comply with the VAT Rate Change? WRITE IN VERBATIM. THIS SHOULD BE A FULL ACCOUNT OF THE PROCESSES THE ORGANISATION WENT THROUGH Open comment READ OUT, CODE ALL THAT APPLY Task Yes No Read materials on rate change Sought advice from others on rate change Preparing briefing materials Briefings and training of staff Deciding what the business had to do to comply Deciding whether the business would pass on the saving Altering price tags and labels Altering catalogues / price guides Altering website / prices Re-issue invoices Any other additional pricing costs Additional time spent on VAT returns Changing budgeted revenue forecasts Additional external accountancy costs Issues with VAT scheme Additional book keeping checks Additional due diligence checks of customers’ invoices Checking invoices from suppliers Getting refunds from suppliers and/or giving refunds to customers Checking VAT returns Adjusting tills Updating and changing manual accounting systems Purchasing new systems Updating and changing computerised accountancy systems Updating and changing non accountancy systems Familiarising yourself with how to change your systems Communicating changes with customers / suppliers Monitoring systems in place Testing systems

121
CATI RULES Task Familiarisation System
changes Changing prices
Book keeping
Operational costs
Read materials on rate change
14
Sought advice from others on rate change
14
Preparing briefing materials
14
Briefings and training of staff
14
Deciding what the business had to do to comply
14
Deciding whether the business would pass on the saving
14
Altering price tags and labels
26
Altering catalogues / price guides
26
Altering website / prices 26 Re-issue invoices 26 Any other additional pricing costs
26
Additional time spent on VAT returns
31
Changing budgeted revenue forecasts
31
Additional external accountancy costs
31
Issues with VAT scheme
31
Additional book keeping checks
31
Additional due diligence checks of invoices
31
Checking invoices from suppliers
31
Checking VAT returns 31 Getting refunds from suppliers and/or giving refunds to customers
31
Adjusting tills 21 Updating and changing systems
21
Purchasing new systems
21
Updating and changing accountancy systems
21
Familiarising yourself with how to change your systems
21
Communicating 36
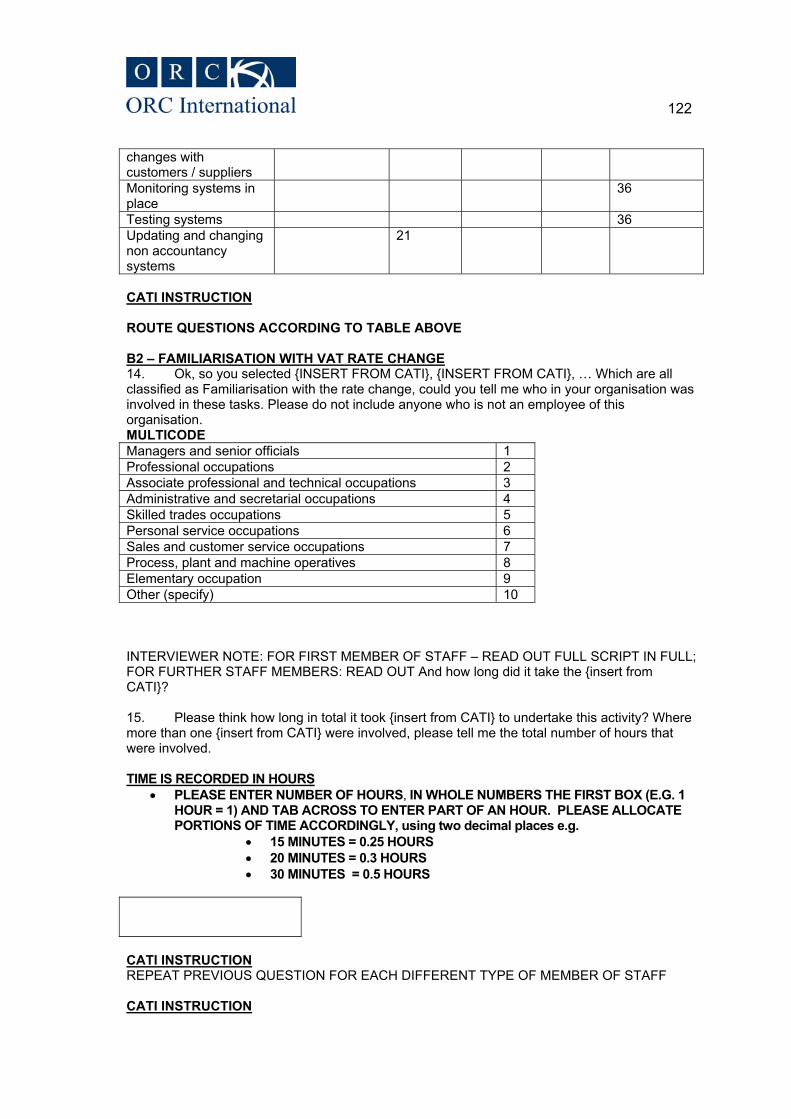
122
changes with customers / suppliers Monitoring systems in place
36
Testing systems 36 Updating and changing non accountancy systems
21
CATI INSTRUCTION ROUTE QUESTIONS ACCORDING TO TABLE ABOVE B2 – FAMILIARISATION WITH VAT RATE CHANGE 14. Ok, so you selected {INSERT FROM CATI}, {INSERT FROM CATI}, … Which are all classified as Familiarisation with the rate change, could you tell me who in your organisation was involved in these tasks. Please do not include anyone who is not an employee of this organisation. MULTICODE Managers and senior officials 1 Professional occupations 2 Associate professional and technical occupations 3 Administrative and secretarial occupations 4 Skilled trades occupations 5 Personal service occupations 6 Sales and customer service occupations 7 Process, plant and machine operatives 8 Elementary occupation 9 Other (specify) 10 INTERVIEWER NOTE: FOR FIRST MEMBER OF STAFF – READ OUT FULL SCRIPT IN FULL; FOR FURTHER STAFF MEMBERS: READ OUT And how long did it take the {insert from CATI}? 15. Please think how long in total it took {insert from CATI} to undertake this activity? Where more than one {insert from CATI} were involved, please tell me the total number of hours that were involved. TIME IS RECORDED IN HOURS
x PLEASE ENTER NUMBER OF HOURS, IN WHOLE NUMBERS THE FIRST BOX (E.G. 1 HOUR = 1) AND TAB ACROSS TO ENTER PART OF AN HOUR. PLEASE ALLOCATE PORTIONS OF TIME ACCORDINGLY, using two decimal places e.g.
x 15 MINUTES = 0.25 HOURS x 20 MINUTES = 0.3 HOURS x 30 MINUTES = 0.5 HOURS
CATI INSTRUCTION REPEAT PREVIOUS QUESTION FOR EACH DIFFERENT TYPE OF MEMBER OF STAFF CATI INSTRUCTION

123
ADD UP THE NUMBER OF HOURS FOR EACH TYPE OF MEMBER OF STAFF FOR THIS CATEGORY OF TASK. 16. So, to confirm, about {total number of hours} were involved for your business in familiarisation with the rate change, does this sound about right? SINGLE CODE Yes 1 CONTINUE No 2 GO BACK AND REPEAT q15 Don’t know 3 GO BACK AND REPEAT Q15 17A. Did you receive any outside guidance to help you understand what you needed to do? Yes 1 CONTINUE No 2 Q19 Don’t know 3 Q19 ASK IF Q17A=1 17B. Where did you go to get this guidance? MULTICODE Another business owner 1 Employee or manager of this business 2 Employee or manager of another business 3 Friend/relatives, generally 4 Solicitor 5 Accountant 6 Bank manager 7 HMRC 8 Businesslink 9 Other government department – SPECIFY 10 Do you use any Other - SPECIFY 11 ASK IF Q17A=1 18. Were there any costs associated with obtaining this guidance? ENTER 0 IF NONE
19. Did your organisation have to purchase any goods or services from external suppliers in order to familiarise your company with what you had to do to comply? MULTICODE None 1 Postage 2 Printing 3 Software 4 Technical equipment / machinery 5 External Accountant 6 External professional services (exc. Accountant) 7 Other (specify) 8 Don’t know 9 Refused 10 WHERE 19=1 GO TO 21; 19 = 2-8, CONTINUE 20. How much did {INSERT FROM CATI} cost?

124
ENTER 0 IF NONE
Section B3 – SYSTEM CHANGES 21. You also selected {CATI insert}, {CATI insert}, all of these activities are what are classified as the system change costs of compliance, so who in your organisation was involved in these tasks, do not include anyone who is not an employee of this organisation. MULTICODE Managers and senior officials 1 Professional occupations 2 Associate professional and technical occupations 3 Administrative and secretarial occupations 4 Skilled trades occupations 5 Personal service occupations 6 Sales and customer service occupations 7 Process, plant and machine operatives 8 Elementary occupation 9 Other (specify) 10 INTERVIEWER NOTE: FOR FIRST MEMBER OF STAFF – READ OUT FULL SCRIPT IN FULL; FOR FURTHER STAFF MEMBERS: READ OUT And how long for {insert from CATI}? 22 Please think how long in total it took {insert from CATI} to undertake the system changes? Where more than one {insert from CATI} were involved, please tell me the total number of hours that were involved. TIME IS RECORDED IN HOURS
x PLEASE ENTER NUMBER OF HOURS, IN WHOLE NUMBERS THE FIRST BOX (E.G. 1 HOUR = 1) AND TAB ACROSS TO ENTER PART OF AN HOUR. PLEASE ALLOCATE PORTIONS OF TIME ACCORDINGLY, using two decimal places e.g.
x 15 MINUTES = 0.25 HOURS x 20 MINUTES = 0.3 HOURS x 30 MINUTES = 0.5 HOURS
CATI INSTRUCTION REPEAT PREVIOUS QUESTION FOR EACH DIFFERENT TYPE OF MEMBER OF STAFF CATI INSTRUCTION ADD UP THE NUMBER OF HOURS FOR EACH TYPE OF MEMBER OF STAFF FOR THIS CATEGORY OF TASK. 23. So, to confirm, about {total number of hours} were involved for your business in terms of system changes, does this sound about right? SINGLE CODE Yes 1 CONTINUE No 2 GO BACK AND REPEAT Q22 Don’t know 3 GO BACK AND REPEAT Q22

125
24. Did your organisation have to purchase any goods or services from external suppliers in order to change your systems? MULTI CODE None 1 Postage 2 Printing 3 Software 4 Technical equipment / machinery 5 External Accountant 6 External professional services (exc. Accountant) 7 Other 8 Don’t know 9 Refused 10 WHERE Q24=1,10 GO TO Q26; Q24 = 2-8, CONTINUE 25. How much did {INSERT FROM CATI} cost? ENTER 0 IF NONE
SECTION B4 – ADJUSTING PRICES OF STANDARD RATED GOODS AND SERVICES 26. You also selected {CATI insert}, {CATI insert}, these tasks are all what are classified as being to do with adjusting the prices of standard rated goods and services. Who was involved at your organisation in these tasks? Again, please do not include anyone who is not an employee of your organisation. MULTI CODE Managers and senior officials 1 Professional occupations 2 Associate professional and technical occupations 3 Administrative and secretarial occupations 4 Skilled trades occupations 5 Personal service occupations 6 Sales and customer service occupations 7 Process, plant and machine operatives 8 Elementary occupation 9 Other (specify) 10 INTERVIEWER NOTE: FOR FIRST MEMBER OF STAFF – READ OUT FULL SCRIPT IN FULL; FOR FURTHER STAFF MEMBERS: READ OUT And how long for {insert from CATI}? 27 Please think how long in total it took {insert from CATI} to undertake this activity? Where more than one {insert from CATI} were involved, please tell me the total number of hours that were involved.
CATI INSTRUCTION

126
REPEAT PREVIOUS QUESTION FOR EACH DIFFERENT TYPE OF MEMBER OF STAFF CATI INSTRUCTION ADD UP THE NUMBER OF HOURS FOR EACH TYPE OF MEMBER OF STAFF FOR THIS CATEGORY OF TASK. 28. So, to confirm, about {total number of hours} were involved for your business in adjusting the prices of standard rated goods and services, does this sound about right? SINGLE CODE Yes 1 CONTINUE No 2 GO BACK AND REPEAT Q27 Don’t know 3 GO BACK AND REPEAT Q27 29. Did your organisation have to purchase any goods or services from external suppliers in order to adjust the prices of standard rated goods? MULTI CODE None 1 Postage 2 Printing 3 Software 4 Technical equipment / machinery 5 External Accountant 6 External professional services (exc. Accountant) 7 Other (specify) 8 Don’t know 9 Refused 10 WHERE Q29=1,9,10 GO TO Q31; Q29 = 2-8, CONTINUE 30. How much did {INSERT FROM CATI} cost? ENTER 0 IF NONE
Section B5 – BOOK KEEPING 31. You also selected {CATI insert}, {CATI insert}, these are all what we term to be book keeping costs of compliance, so again, who in your business would have been involved in this task? Please do not include anyone who is not an employee of your organisation. MULTI CODE Managers and senior officials 1 Professional occupations 2 Associate professional and technical occupations 3 Administrative and secretarial occupations 4 Skilled trades occupations 5 Personal service occupations 6 Sales and customer service occupations 7 Process, plant and machine operatives 8 Elementary occupation 9 Other (specify) 10 INTERVIEWER NOTE: FOR FIRST MEMBER OF STAFF – READ OUT FULL SCRIPT IN FULL; FOR FURTHER STAFF MEMBERS: READ OUT And how long for {insert from CATI}?

127
32. Please think how long in total it took {insert from CATI} to undertake this activity? Where more than one {insert from CATI} were involved, please tell me the total number of hours that were involved.
CATI INSTRUCTION REPEAT PREVIOUS QUESTION FOR EACH DIFFERENT TYPE OF MEMBER OF STAFF CATI INSTRUCTION ADD UP THE NUMBER OF HOURS FOR EACH TYPE OF MEMBER OF STAFF FOR THIS CATEGORY OF TASK. 33. So, in total, you have said that about {total number of hours} additional hours were involved for your business in book keeping, does this sound about right? SINGLE CODE Yes 1 CONTINUE No 2 GO BACK AND REPEAT Q32 Don’t know 3 GO BACK AND REPEAT Q32 34. Did your organisation have to purchase any goods or services from external suppliers in order to prepare and/ or provide for this activity? MULTI CODE None 1 Postage 2 Printing 3 Software 4 Technical equipment / machinery 5 External Accountant 6 External professional services (exc. Accountant) 7 Other (specify) 8 Don’t know 9 Refused 10 WHERE Q34=1,9,10 GO TO Q36; Q34 = 2-8, CONTINUE 35. How much did {INSERT FROM CATI} cost? ENTER 0 IF NONE
Section B6 – OPERATIONAL COSTS 36. You also selected {CATI insert}, {CATI insert}, these are all operational costs of compliance. In terms of these tasks, who in your business would have been involved, again, please do not include anyone who is not an employee of your organisation. MULTI CODE Managers and senior officials 1

128
Professional occupations 2 Associate professional and technical occupations 3 Administrative and secretarial occupations 4 Skilled trades occupations 5 Personal service occupations 6 Sales and customer service occupations 7 Process, plant and machine operatives 8 Elementary occupation 9 Other (specify) 10 INTERVIEWER NOTE: FOR FIRST MEMBER OF STAFF – READ OUT FULL SCRIPT IN FULL; FOR FURTHER STAFF MEMBERS: READ OUT And how long for {insert from CATI}? 37. Please think how long in total it took {insert from CATI} to undertake this activity? Where more than one {insert from CATI} were involved, please tell me the total number of hours that were involved. TIME IS RECORDED IN HOURS
x PLEASE ENTER NUMBER OF HOURS, IN WHOLE NUMBERS THE FIRST BOX (E.G. 1 HOUR = 1) AND TAB ACROSS TO ENTER PART OF AN HOUR. PLEASE ALLOCATE PORTIONS OF TIME ACCORDINGLY, using two decimal places e.g.
x 15 MINUTES = 0.25 HOURS x 20 MINUTES = 0.3 HOURS x 30 MINUTES = 0.5 HOURS
CATI INSTRUCTION REPEAT PREVIOUS QUESTION FOR EACH DIFFERENT TYPE OF MEMBER OF STAFF CATI INSTRUCTION ADD UP THE NUMBER OF HOURS FOR EACH TYPE OF MEMBER OF STAFF FOR THIS CATEGORY OF TASK. 38. So, to confirm, about {total number of hours} were involved for your business in the operational costs of compliance, does this sound about right? SINGLE CODE Yes 1 CONTINUE No 2 GO BACK AND REPEAT Q37 Don’t know 3 GO BACK AND REPEAT Q37 39. Did your organisation have to purchase any goods or services from external suppliers in order to prepare and/ or provide for this activity? MULTI CODE None 1 Postage 2 Printing 3 Software 4 Technical equipment / machinery 5 External Accountant 6

129
External professional services (exc. Accountant) 7 Other (specify) 8 Don’t know 9 Refused 10 WHERE Q39=1,9,10 GO TO Q41; Q39 = 2-8, CONTINUE 40. How much did {INSERT FROM CATI} cost? ENTER 0 IF NONE
Section B7 – ANY OTHER ACTIVITIES IF ROUTED FROM Q40 SHOW THIS TEXT 41. Can you think of any other activities that your business had to do to comply with the VAT change? IF ROUTED FROM Q47 SHOW THIS TEXT 41. What else did your business have to do? INTERVIEWER NOTE: SPLIT RESPONDENTS ANSWER INTO THE SEPARATE ACTIVITIES MENTIONED. SO IF MENTION MORE THAN ONE, PUT EACH ACTIVITY INTO SEPARATE BOX.
42. Ok, so who in your business would have been involved in {INSERT
ACTIVITY 1 FROM Q41}? Please do not include anyone who is not an employee of this organisation. MULTI CODE Managers and senior officials 1 Professional occupations 2 Associate professional and technical occupations 3 Administrative and secretarial occupations 4 Skilled trades occupations 5 Personal service occupations 6 Sales and customer service occupations 7 Process, plant and machine operatives 8 Elementary occupation 9 Other (specify) 10 INTERVIEWER NOTE: FOR FIRST MEMBER OF STAFF – READ OUT FULL SCRIPT IN FULL; FOR FURTHER STAFF MEMBERS: READ OUT And how long for {insert from CATI}?
ACTIVITY 1 (SPECIFY) 1
ACTIVITY 2 (SPECIFY) 2
ACTIVITY 3 (SPECIFY) 3
ACTIVITY 4 (SPECIFY) 4
ACTIVITY 5 (SPECIFY) 5
CONTINUE
NO OTHER ACTIVITIES MENTIONED 6 GO TO Q48

130
43. Please think how long in total it took {insert from CATI} to undertake this activity? Where more than one {insert from CATI} were involved, please tell me the total number of hours that were involved. TIME IS RECORDED IN HOURS
x PLEASE ENTER NUMBER OF HOURS, IN WHOLE NUMBERS THE FIRST BOX (E.G. 1 HOUR = 1) AND TAB ACROSS TO ENTER PART OF AN HOUR. PLEASE ALLOCATE PORTIONS OF TIME ACCORDINGLY, using two decimal places e.g.
x 15 MINUTES = 0.25 HOURS x 20 MINUTES = 0.3 HOURS x 30 MINUTES = 0.5 HOURS
CATI INSTRUCTION REPEAT PREVIOUS QUESTION FOR EACH DIFFERENT TYPE OF MEMBER OF STAFF CATI INSTRUCTION ADD UP THE NUMBER OF HOURS FOR EACH TYPE OF MEMBER OF STAFF FOR THIS CATEGORY OF TASK. 44. So, to confirm, about {total number of hours} additional hours were involved for your business to do this task, does this sound about right? SINGLE CODE Yes 1 CONTINUE No 2 GO BACK AND REPEAT Q43 Don’t know 3 GO BACK AND REPEAT Q43 45. Did your organisation have to purchase any goods or services from external suppliers in order to prepare and/ or provide for this activity? MULTI CODE None 1 Postage 2 Printing 3 Software 4 Technical equipment / machinery 5 External Accountant 6 External professional services (exc. Accountant) 7 Other (specify) 8 Don’t know 9 Refused 10 WHERE Q45=1,9,10 GO TO Q47; Q45 = 2-8, CONTINUE 46. How much did {INSERT FROM CATI} cost? ENTER 0 IF NONE

131
CATI INSTRUCTION REPEAT Q42 - Q46 IF MORE THAN ONE ACTIVITY MENTIONED AT Q41 47. Do you think that we’ve now covered all the tasks that were involved for your organisation to comply with the rate change? SINGLE CODE Yes 1 CONTINUE No 2 REPEAT SECTION FROM Q41 Don’t know 3 CONTINUE SECTION C - COMMERCIAL ASPECT 48. Was there anything that you did when making the rate change that helped you to save time and / or money? OPEN COMMENT ADD IN NOTHING CATEGORY 49. To what extent to you agree or disagree with the following statements? SINGLE CODE FOR EACH Strongly
agree
Agree Neither agree nor disagree
Disagree Strongly disagree
Don’t know
The information I received from HMRC on the VAT rate change was relevant to our organisation
1 2 3 4 5 6
The information I received from HMRC on the rate change explained exactly what I needed to do
1 2 3 4 5 6
I was aware of what I had to do to comply with the rate change
1 2 3 4 5 6
Complying with the rate change was straight-forward for my organisation
1 2 3 4 5 6
I felt confident that I was fully
1 2 3 4 5 6

132
compliant with the rate change I was given sufficient time to make the changes required
1 2 3 4 5 6
IF NOT GIVEN ENOUGH TIME 50. What was the impact, if any, of not having sufficient time? OPEN COMMENT 51a. Thanks for your answers to those questions, I’d now like to turn to the commercial impact of the VAT rate change, did the VAT rate change reduce the prices that your customers pay on standard rated goods or services? RESTATE CONFIDENTIALITY READ OUT RESPONSES IN FULL Yes – The business passed the reduction on 1 The business passed the reduction on initially but has since reverted and is no longer passing the reduction on
2
No – the business did not pass any reduction on to customers
3
51b. So, to confirm how much of the VAT change was reflected in price and passed on to the customers? READ OUT SINGLE CODE All of the savings were passed on 1 A percentage of the saving was passed on 2 None of the savings were passed on 3 Don’t know 4 ASK ALL: 52. Can you explain why you did this? PROMPT Passing on the savings seemed the right thing to do 1 It would have been embarrassing if it was revealed that we did not pass it on
2
Our prices are quoted as excluding VAT 3 I thought I had to pass on the savings 4 We could not afford to pass on the savings 5 It was too complicated to change the price 6 It was too expensive to the business to change the price 7 Other (please specify) 8 Don’t know 9
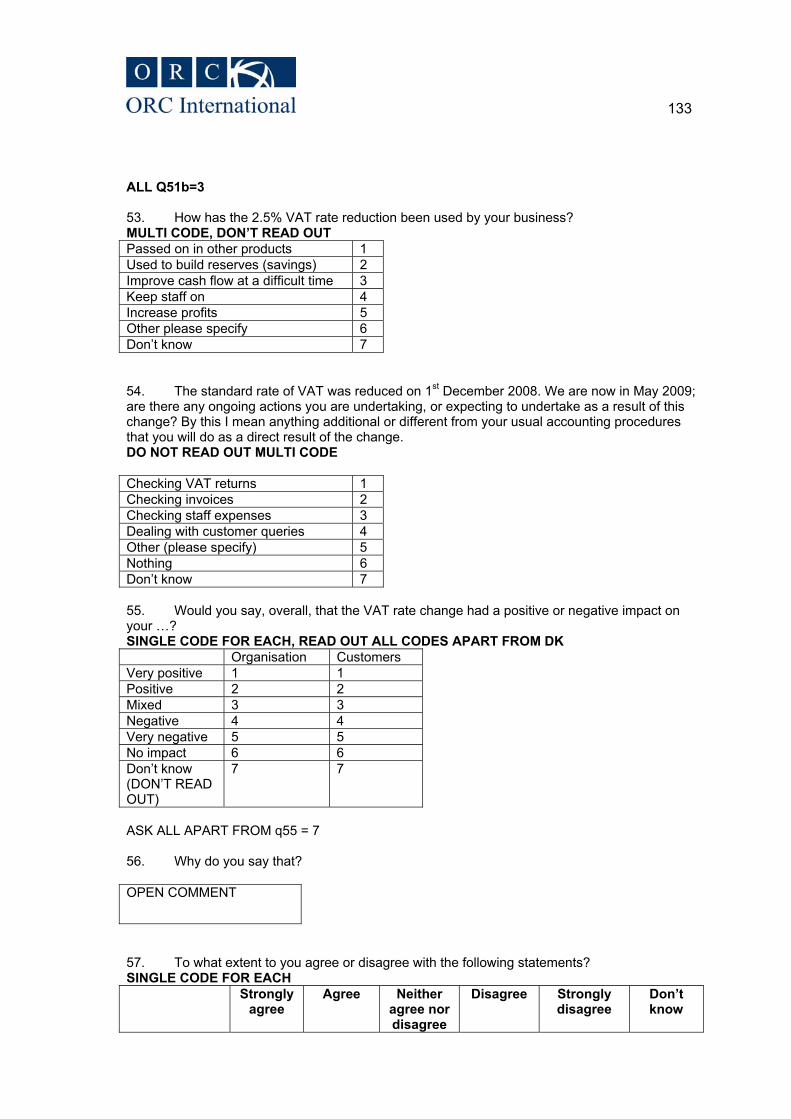
133
ALL Q51b=3 53. How has the 2.5% VAT rate reduction been used by your business? MULTI CODE, DON’T READ OUT Passed on in other products 1 Used to build reserves (savings) 2 Improve cash flow at a difficult time 3 Keep staff on 4 Increase profits 5 Other please specify 6 Don’t know 7 54. The standard rate of VAT was reduced on 1st December 2008. We are now in May 2009; are there any ongoing actions you are undertaking, or expecting to undertake as a result of this change? By this I mean anything additional or different from your usual accounting procedures that you will do as a direct result of the change. DO NOT READ OUT MULTI CODE Checking VAT returns 1 Checking invoices 2 Checking staff expenses 3 Dealing with customer queries 4 Other (please specify) 5 Nothing 6 Don’t know 7 55. Would you say, overall, that the VAT rate change had a positive or negative impact on your …? SINGLE CODE FOR EACH, READ OUT ALL CODES APART FROM DK Organisation Customers Very positive 1 1 Positive 2 2 Mixed 3 3 Negative 4 4 Very negative 5 5 No impact 6 6 Don’t know (DON’T READ OUT)
7 7
ASK ALL APART FROM q55 = 7 56. Why do you say that? OPEN COMMENT
57. To what extent to you agree or disagree with the following statements? SINGLE CODE FOR EACH Strongly
agree
Agree Neither agree nor disagree
Disagree Strongly disagree
Don’t know

134
The sales of some of the goods/ services have been influenced by rate reduction
1 2 3 4 5 6
The time of year (before Christmas) affected the costs
1 2 3 4 5 6
SECTION D - CHANGING BACK TO 17.5% 58. Thinking about the time and cost your business incurred in changing the VAT rate from 17.5% to 15%, how do you think the change on 1 January 2010 will compare? SINGLE CODE Time and cost will be the same 1 Time and cost will be more 2 Time and cost will be less 3 Don’t know 4 ASK ALL WHO q58=2 59. Why do you say that? OPEN COMMENT
60. Is there anything that the government/ HMRC could do that would help you when the rate changes back to 17.5% in 2010? DON’T READ OUT, MULTI CODE Financial assistance 1 More notice 2 Guidance materials 3 Other (please specify) 4 Don’t know 5 61. The optimal lead time for a rate change is probably “as long as possible” but what would be the minimum lead time that would be acceptable for a rate change; from a practical, commercial and cost point of view? WRITE IN WEEKS, DON’T KNOW WRITE IN -1 OPEN COMMENT
62. In your own words, what was the commercial impact of the VAT rate reduction of 17.5% to 15% on December 1st 2008? OPEN COMMENT

135
Name of respondent TYPE IN
THANK AND CLOSE

136
Appendix C – References
HM Treasury (2008) Impact Assessment of changes to the standard rate of VAT, www.hm-treasury.gov.uk/d/pbr08_vat_1845.pdf
Embrey, D. (2000) Task Analysis Techniques http://www.humanreliability.com/articles/Task%20Analysis%20Techniques.pdf