(hl-oio-xi* - dtic.mil fuel vent hole / fuel flow hole ... tables can be converted to either control...
TRANSCRIPT

pi^^^^KÄSw
(HL-oio-xi*
ÄBproved ica, guoue release
Development of Transfer Functions to Relate F-l 11 Aircraft Fatigue Data Analysis System (AFDAS) Strain
Outputs to Loads and Control Point Stresses
G. Swanton and K. Walker
DSTO-TR-0563
19971007 204
APPROVED FOR PUBLIC RELEASE
© Commonwealth of Australia
DEPARTMENT ^ O F DEFENCE
DEFENCE SCIENCE AND TECHNOLOGY ORGANISATION
! TECHNICAL INFORMATION SERVICE
| IS AUTHORISED TO j htPRODUC'c AND SELL THIS REPORT

Development of Transfer Functions to Relate F-lll Aircraft Fatigue Data Analysis System (AFDAS)
Strain Outputs to Loads and Control Point Stresses
G. Swanton and K. Walker
Airframes and Engines Division Aeronautical and Maritime Research Laboratory
DSTO-TR-0563
ABSTRACT
The Aircraft Fatigue Data Analysis System (AFDAS) is a strain based fatigue data collection and analysis system, fitted to several aircraft types including eleven of the RAAF's F-lll fleet. AFD AS gauge strain data from various static strain surveys were used to develop transfer functions which relate strain from the AFD AS gauges to stresses at nearby control points as well as aircraft loading information. Relating the strain to load was a straightforward exercise, and in some cases it was also a simple matter to relate AFDAS strain to control point stress. In many cases however, the process of establishing a link between AFDAS strain and control point stress involved utilising existing load to stress relationships from the manufacturer. This process identified deficiencies/inaccuracies in several of the "manufacturer's stress equations". This report documents the development of the transfer functions, and details the deficiencies in the manufacturer's stress equations. Additional work to develop the transfer functions by direct analysis is recommended.
RELEASE LIMITATION
Approved for public release
DEPARTMENT OF DEFENCE ♦
DEFENCE SCIENCE AND TECHNOLOGY ORGANISATION

Published by
DSTO Aeronautical and Maritime Research Laboratory PO Box 4331 Melbourne Victoria 3001
Telephone: (03) 9626 7000 Fax: (03)9626 7999 © Commonwealth of Australia 1997 AR-010-278 June 1997
APPROVED FOR PUBLIC RELEASE
Development of Transfer Functions to Relate F-lll Aircraft Fatigue Data Analysis System
(AFDAS) Strain Outputs to Loads and Control Point Stresses
Executive Summary
The structural integrity of the Royal Australian Air Force's (RAAF) F-lll aircraft is essential to Australia's strategic defence planning. It is envisaged that the aircraft will continue to operate well into the twenty-first century, and as a result there is an ongoing requirement for investigating and analysing aircraft loads and stresses, as well as for looking for other developments and improvements in flight data collection.
At present, the only on board faculties that record aircraft structural parameters are the fatigue meter (which records vertical acceleration occurrences) and a strain based fatigue data collection and analysis system known as AFDAS (Aircraft Fatigue Data Analysis System). AFDAS is comprised of a central processor and recorder unit known as a Strain Range Pair Counter, and twelve channels for recording data from various locations on the structure. Eleven of the channels are linked to strain sensors placed at fatigue critical regions, and one channel records vertical acceleration. Eleven aircraft of the RAAF F-lll fleet are currently fitted with AFDAS (including both ex F-111A and original F-111C variants).
Structural integrity of the RAAF's F-lll fleet is assured by the implementation of a Durability And Damage Tolerance Assessment (DADTA) program. The DADTA relies on identifying "control points" which are structurally significant locations where fatigue cracking can potentially occur in service. Knowledge of the stress spectrum at these control points is a vital input to the DADTA process. In the past, the control point spectra were obtained from an analogue system known as a Multi Channel Recorder (MCR). The MCR system has been obsolete for several years and is no longer fitted to any RAAF F-lll aircraft. The collection of current spectrum information can now only be achieved by using AFDAS.
To achieve this, transfer functions need to be developed to relate the AFDAS strains to the stresses at a nearby control point. Using measurements from static strain surveys, AFDAS strain data were expressed as a function of load, for example wing pivot bending moment. These loads were then related to the standard manufacturer's load to stress relationships as used in the DADTA process, to produce the required transfer function. This process identified inaccuracies in several of the standard load to stress equations. This report documents the development of the transfer functions. Due to the deficiencies which were discovered, only some of the transfer functions can be used immediately. A recommendation is made to determine the transfer functions for the remaining locations via other means, ie: conventional stress analysis and/or Finite Element Analysis.

Authors
G. T. Swanton Airframes and Engines Division
Mr Swanton graduated from the Royal Melbourne Institute of Technology (RMIT) in 1992 with a Bachelor of Engineering honours degree (Aerospace). Since commencing employment as a contract engineer at the then Aeronautical Research Laboratory in early 1993, Mr. Swanton was assigned to the field of F-lll Structural Integrity, working on the Wing Pivot Fitting analysis studies, full-scale wing testing and the Aircraft Fatigue Data Analysis System (AFDAS) program. He was also assigned to F/A- 18 fatigue test airbag development. Mr. Swanton took up a permanent position in mid 1996, as a member of the F/A-18 International Follow On Structural Test Program (IFOSTP) fatigue group.
K. Walker Airframes and Engines Division
Mr Walker graduated in 1983 with a Bachelor of Aeronautical Engineering (with distinction) from RMIT. He then served for eight years with the RAAF, including a posting to the USA where he gained a Masters of Science in Aeronautics and Astronautics from Purdue University. He then worked for three years in private industry before joining AMRL in early 1994. His work at AMRL has included fatigue and damage tolerance analysis studies and aircraft load spectrum determination using the Aircraft Fatigue Data Analysis System (AFDAS). He is currently also task manager "F-lll Durability and Damage Tolerance Analysis Support".
Contents
NOTATION 2
LIST OF ABBREVIATIONS 3
1. INTRODUCTION 1
2. AFDAS AND DADTA LOCATIONS 2
3. TRANSFER FUNCTIONS DEVELOPMENT 3 3.1 Strain Surveys 4
3.1.1 Strain Gauge Names 5 3.1.2 Loads & Forces 6 3.1.3 Sign Convention 6 3.1.4 Material Properties 7
4. F-lll MODEL STRUCTURAL VARIATIONS 7 4.1 Wing Carry Through Box 7 4.2 Nacelle Tie Link 7
5. TRANSFER FUNCTION CALCULATIONS AND RESULTS 8 5.1 AFDAS location Wl, Channel 0, DADTA Item 86 9 5.2 AFDAS location W3, Channel 1, DADTA Items 87,87a 9 5.3 AFDAS location W5, Channel 2, DADTA Item 73 10 5.4 AFDAS location W6, Channel 6, DADTA Items 92a, 92b 11 5.5 AFDAS location Cl, Channel 3, DADTA Items 136,159 12 5.6 AFDAS location C2, Channel 4, DADTA Items 26,26a, 27,28,29 13 5.7 AFDAS location CF3, Channel 8, DADTA Items 19,19a, 19c, 20,20a, 21 14 5.8 AFDAS location CF5, Channel 9, DADTA Item 24a 15 5.9 AFDAS location FF1, Channel 5, SLMP Control Point FF1 15 5.10 AFDAS location AF2, Channel 10, DADTA Items 36,37a 16 5.11 AFDAS location VT4, Channel 7, DADTA Item 41 17 5.12 AFDAS Vertical Acceleration (Nz) Sensor, Channel 11 17
6. DISCUSSION AND CONCLUSIONS 17
7. ACKNOWLEDGMENTS 20
REFERENCES 21
APPENDICES A-E
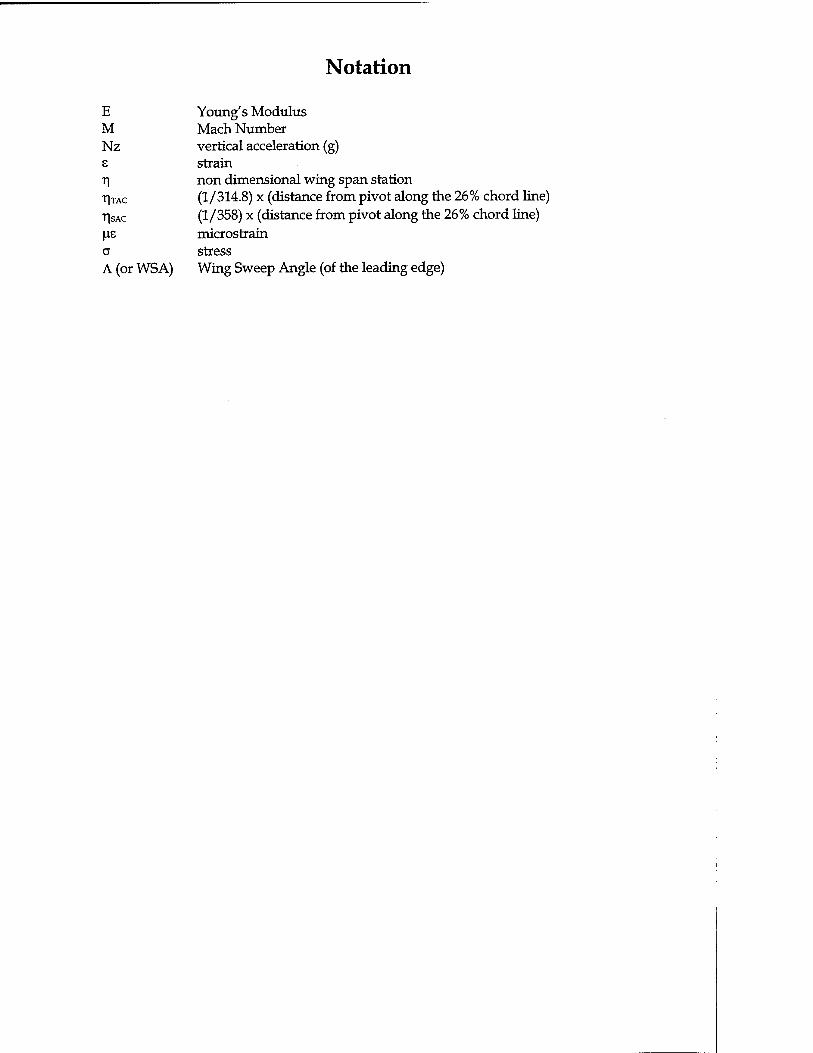
Notation
E Young's Modulus M Mach Number Nz vertical acceleration (g) s strain r\ non dimensional wing span station TITAC (1/314.8) x (distance from pivot along the 26% chord line) T|SAC (1/358) x (distance from pivot along the 26% chord line) |J.E microstrain a stress A (or WS A) Wing Sweep Angle (of the leading edge)

List of abbreviations
a/c aircraft AFDAS Aircraft Fatigue Data Analysis System AMRL Aeronautical & Maritime Research Laboratory B.L. Buttock Line CG. Centre of gravity CPLT Cold Proof Load Test CLBA Columbia (type of strain gauge used for AFDAS) DADTA Durability And Damage Tolerance Assessment dia. diameter DLL Design Limit Load FLBM Fuselage Lateral Bending Moment F.S. Fuselage Station Fus.Shear Fuselage Shear Fus.Torque Fuselage Torque FVBM Fuselage Vertical Bending Moment FVH/FFH Fuel Vent Hole / Fuel Flow Hole GD General Dynamics HTBM Horizontal Tail Bending Moment HTFS Horizontal Tail Pivot Shaft lb pound force LFVH/RFVH Left Fuel Vent Hole / Right Fuel Vent Hole LFWC Lockheed Fort Worth Corporation LH or L/H Left Hand LHLPV/RHLPV Left Hand Low Pressure Valve (similarly for right side) LHRP/RHRP Left Hand Rear Plank (similarly for right side) LHWW1/RHWW1 refers to Left Hand Wing gauge Wl (similarly for right side) MCR Multi Channel Recorder MIP or MIPS Mega inch-pounds (ie: 106x inch-pounds) NTLL Nacelle Tie Link Load psi pounds per square inch RAAF Royal Australian Air Force RH or R/H Right Hand RSS Rear Spar Station SAC Strategic Air Command (long-wing variants: FB-111A,
F-111C/G) SLMP Service Life Monitoring Program SRPC Strain Range Pair Counter TAC Tactical Air Command (short-wing variants: F-111A/E/F) VTBM Vertical Tail Bending Moment WBM Wing Bending Moment WCTB Wing Carry Through Box WPF Wing Pivot Fitting WPBM Wing Pivot Bending Moment WBMxx / WBMyy Wing Bending Moment about the "xx" axis (or "yy" axis) W.L. Water Line WPF Wing Pivot Fitting WPT Wing Pivot Torque WRSF Wing Root Shear Force WSA Wing Sweep Angle
DSTO-TR-0563
1. Introduction
The Aircraft Fatigue Data Analysis System (AFDAS) is an onboard, strain based fatigue data collection and analysis system utilised on several RAAF aircraft types. The system consists of a central processor and recorder (Strain Range Pair Counter, SRPC) and strain gauge sensors placed near fatigue critical locations on the structure. The current version of the system (Mark III) records data from 11 strain channels and one CG. vertical acceleration channel. Although a number of aircraft in the RAAF's F-lll fleet are fitted with the system, the resulting data outputs have not yet been integrated into the aircraft's structural integrity management plans.
The RAAF currently carry out their structural fatigue life analyses based on Durability and Damage Tolerance Assessment (DADTA) techniques. These DADTA calculations use a flight spectrum derived from a series of flights conducted in the mid 1980's, making use of Multi Channel Recorder (MCR) measurements of various flight parameters.
With the MCR no longer in use, AFDAS is the only means of recording multiple channels of in-flight data. It can also provide up-to-date information about current flying practices. Most importantly it can provide data that can be directly linked to aircraft loads and control point stresses. However, in order for the AFDAS data to be utilised, transfer functions are required to relate AFDAS strains to control point (DADTA item) stresses and/or aircraft loads.
AFDAS sensor signals are processed according to a range-pair counting algorithm and the counts are stored in a 120 cell array called a range-pair table. The data in these tables can be converted to either control point (ie: critical structural location) stresses or load information which can then be utilised in fatigue analyses and load spectrum studies respectively. The conversion process however requires knowledge of transfer functions to relate the strain at a particular point to either stress at some adjacent point or to a load such as Wing Pivot Bending Moment (WPBM).
The creation of transfer functions was possible using information from a variety of sources, including strain surveys and load to stress relationships developed from a combination of analysis and test. Numerous strain surveys have already been conducted in Australia and the US, while the load to stress relationships (hereafter referred to as stress equations) were developed by the aircraft's manufacturer, General Dynamics (GD) (References 1,2 and 3).
It is important to note that each strain sensor channel is independently monitored and therefore it is only possible to apply a single scaling factor as the transfer function, ie: it is not possible to use scaling factor relationships which vary with parameters such as wing sweep angle. If the AFDAS sensor is located sufficiently close to the control point where the stress is required, it should respond to combinations of load and configuration in direct proportion to the stress/strain at the control point and a single
DSTO-TR-0563
unique scaling factor should apply. In many cases documented in this report however, the scaling factor which was developed does vary with wing sweep and/ or loading direction. Loading direction can be accommodated by AFDAS in that peaks can be presumed to be associated with one loading direction and troughs with the other direction, so two scaling factors can apply. When the scaling factor varies with wing sweep however, it means that either the strain sensor is located too distant from the control point and/or the manufacturer's stress equation which was used as part of the process is not accurate in that it does not accurately account for wing sweep angle. In many cases examined here the manufacturer's stress equations are believed to be the source of the error.
This report details the work carried out at the Aeronautical & Maritime Research Laboratory (AMRL) in the formulation of transfer functions, which have been developed to suit the AFDAS installation on the Royal Australian Air Force's (RAAF) F-lll aircraft. Unfortunately many of the transfer functions developed are considered to be less accurate than they should be and further work is required to refine them. An important finding has been the discovery that the manufacturer's stress equations appear to be inaccurate in some cases.
Note that imperial units have been used throughout this report to be consistent with the aircraft manufacturer's data.
2. AFDAS and DADTA Locations
The process of integrating AFDAS into the structural integrity management strategy for the F-lll fleet has raised the question of whether the system should be used to provide detailed stress histories for particular control points or for monitoring loads such as WPBM. The present work has revealed that both can be achieved to a degree, although it is limited by the number and location of the strain gauges.
Critical locations in the airframe are analysed and assessed by the DADTA program. (For an overview of the DADTA philosophy and control point determination, see Reference 4). Fracture mechanics methods are employed for crack growth calculations and the determination of inspection intervals. Through the use of transfer functions, AFDAS data can provide actual flight loading information and thereby can be used to investigate fatigue effects at particular control points.
The locations of the strain gauges have already been set and although these can be changed, it was decided to investigate what could be achieved within the constraint of the current gauge installation. The locations of the AFDAS strain gauges and nearby control points for the F-lll are also set out in Reference 4.
It is possible to interpret the information from these strain gauges to provide estimates of both stress at particular control points (DADTA Items) and of certain loads. The
DSTO-TR-0563
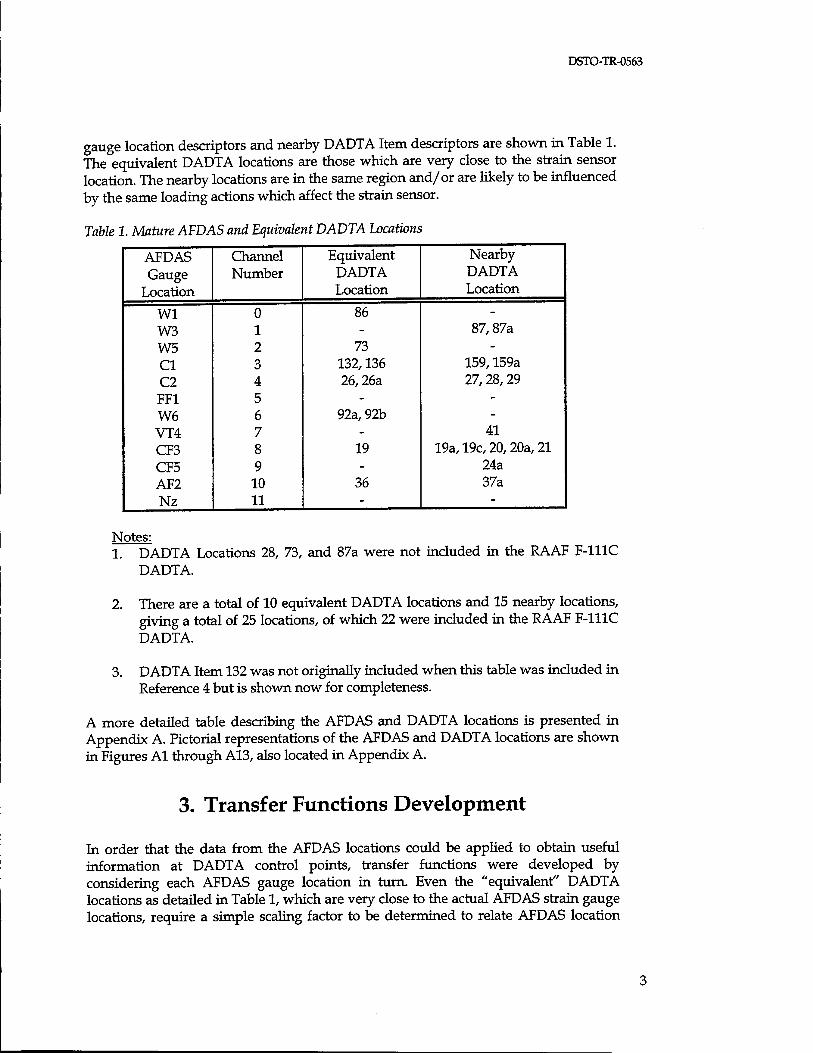
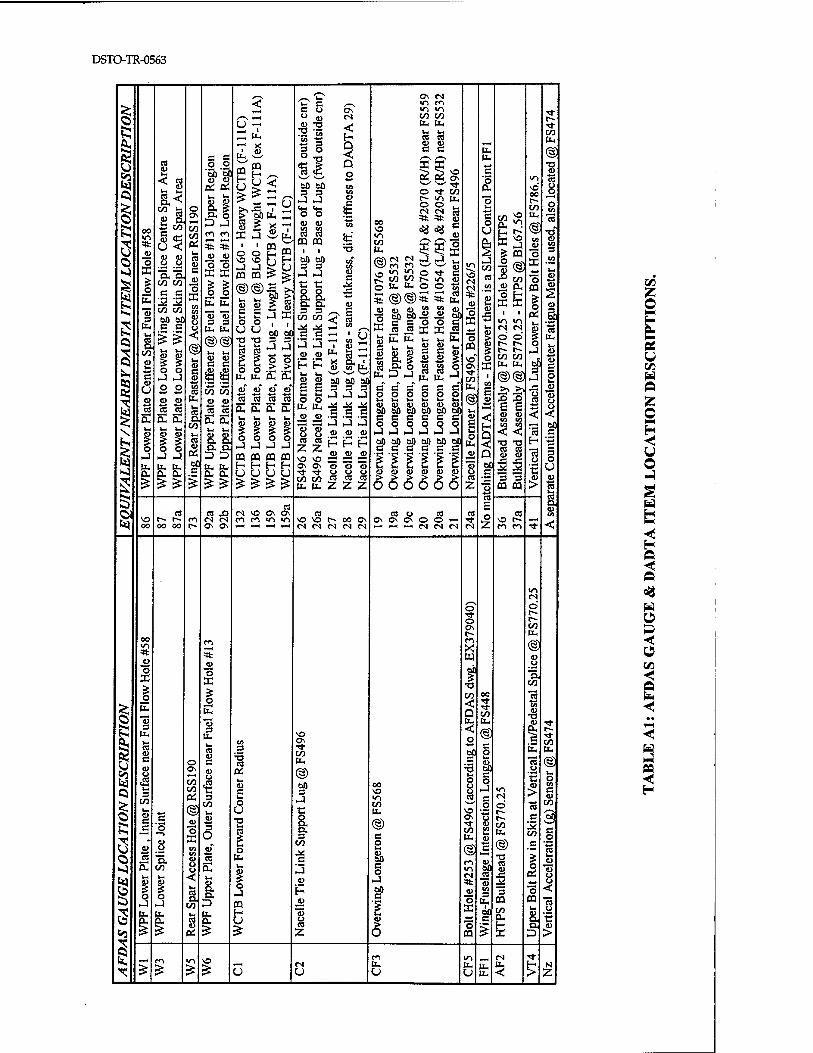
gauge location descriptors and nearby DADTA Item descriptors are shown in Table 1. The equivalent DADTA locations are those which are very close to the strain sensor location. The nearby locations are in the same region and/or are likely to be influenced by the same loading actions which affect the strain sensor.
Table 1. Mature AFDAS and Equivalent DADTA Locations
AFDAS Channel Equivalent Nearby
Gauge Number DADTA DADTA Location Location Location
Wl 0 86 -
W3 1 - 87,87a W5 2 73 -
Cl 3 132,136 159,159a C2 4 26,26a 27,28,29 FF1 5 - -
W6 6 92a, 92b -
VT4 7 - 41 CF3 8 19 19a, 19c, 20,20a, 21 CF5 9 - 24a AF2 10 36 37a Nz 11 - -
Notes: 1. DADTA Locations 28, 73, and 87a were not included in the RAAF F-111C
DADTA.
2. There are a total of 10 equivalent DADTA locations and 15 nearby locations, giving a total of 25 locations, of which 22 were included in the RAAF F-111C DADTA.
3. DADTA Item 132 was not originally included when this table was included in Reference 4 but is shown now for completeness.
A more detailed table describing the AFDAS and DADTA locations is presented in Appendix A. Pictorial representations of the AFDAS and DADTA locations are shown in Figures Al through A13, also located in Appendix A.
3. Transfer Functions Development
In order that the data from the AFDAS locations could be applied to obtain useful information at DADTA control points, transfer functions were developed by considering each AFDAS gauge location in turn. Even the "equivalent" DADTA locations as detailed in Table 1, which are very close to the actual AFDAS strain gauge locations, require a simple scaling factor to be determined to relate AFDAS location
strain to DADTA control point stress. In most cases, this relationship was achieved via an intermediate step of expressing the strain (from static strain surveys) as a function of load (eg: WPBM or percentage of CPLT load, where CPLT stands for Cold Proof Load Test), and then using this to compare with the standard load to stress relationships used in the DADTA process (References 1, 2 and 3). Each AFDAS location was examined on its own merits.
3.1 Strain Surveys
As mentioned in the introduction, the strain data recorded by AFDAS are processed according to a range-pair counting algorithm in the SRPC unit. For the static strain surveys involving the whole aircraft and actual AFDAS gauges, it was necessary that the wiring that linked the AFDAS gauges to the SRPC was disconnected. Instead of the data being recorded by the SRPC, it was diverted to the data acquisition system in use for that particular test.
The strain data used in developing the transfer functions were collated from five separate surveys, ranging from component tests to full scale aircraft tests performed in Australia and the United States, from 1988 through to 1995. It should be noted that it may be possible to refine the transfer functions as more strain data become available from future testing and are added to the database.
The five surveys (with some key information points) are presented in a chronological order as follows:
1. Feb-Mar. 1988 - Wing test (starboard) conducted at the then Aeronautical Research Laboratory (ARL). 80% of positive and negative proof loads applied (as per CPLT distribution). 16° WSA1. See Reference 5.
2. Apr-Jul. 1990 - Full scale aircraft test performed on a/c A8-113 at RAAF Base Amberley, Queensland. Nominal wing loads applied were positive 29,000 lbs (pre- "upper" doubler2) and 25,000 lbs (post- "upper" doubler)- via single jacks on each wing. 16° WSA. See Reference 6.
3. Sep. 1990 - Full scale aircraft CPLT performed on a/c A8-113 at Sacramento Air Logistics Centre (SM-ALC), U.S.A. 100% positive and negative proof loads applied during CPLT, 60% of positive and negative proof loads applied during ambient pre- and post-CPLT surveys. 26° & 56° WSA. See Reference 7.
1 WSA (Wing Sweep Angle) refers to LEADING EDGE sweep. 2 All F-111C aircraft had boron-epoxy doublers fitted to their lower WPF's at time of manufacture. Since their operation in the RAAF, they have also undergone local fitment of doublers on the upper wing surface. These doublers serve to reduce the high strains experienced in the WPF region under severe loadings. It should be noted that the F-111G models recently acquired by the RAAF do not have either lower or upper doublers fitted.
DSTO-TR-0563
4. Apr. 1995 - Wing test (starboard) conducted at AMRL. 100% positive and negative proof loads (as per CPLT distribution), 60% of positive and negative proof loads applied for 16°, 26°, 44° & 56° WSA. See Reference 8.
5. Jul. 1995 - Nacelle Tie Link component test conducted at AMRL. Nominal load of 35,000 lbs (tension) applied. See Reference 9.
The strain survey data (References 5, 6, 7, 8 & 9) are presented in the figures of this report in a graphical form (represented in Figures Bl through B66 in Appendix B). As the strain survey data sets were recorded in different formats, the data sets were transferred to the Microsoft Excel Version 5.0 spreadsheet package, where they were then converted to Microsoft Excel Version 5.0 files. The benefits in doing this were threefold:
1. The data were able to be kept in a consistent format, 2. The data were readily accessible as they were stored on a PC database, and 3. This simplified the process of manipulating data to construct graphs, calculate
DADTA stress equations, perform regressions, etc.
Note that the data points on the graphs have been connected by straight lines, and that the equations appearing next to curves represent the linear regression equation (line of best fit, slope or "trendline") for that curve. The derivation of the transfer functions is presented in section 5.
3.1.1 Strain Gauge Names
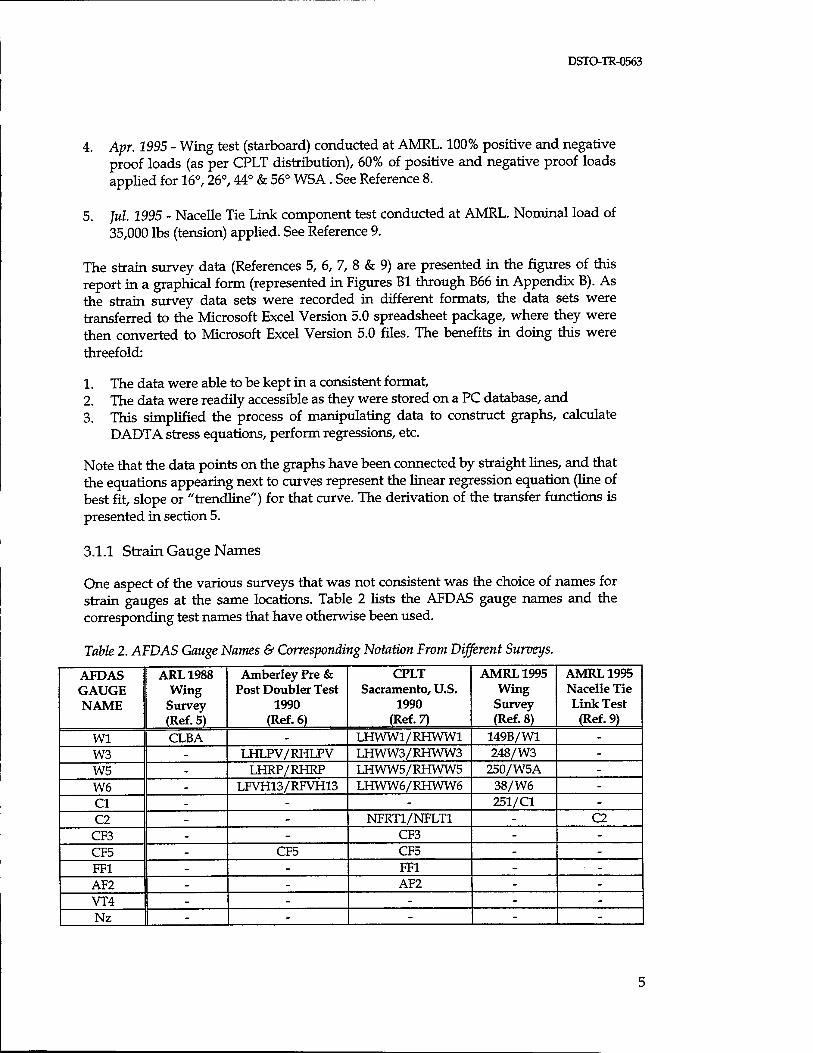
One aspect of the various surveys that was not consistent was the choice of names for strain gauges at the same locations. Table 2 lists the AFDAS gauge names and the corresponding test names that have otherwise been used.
Table 2. AFDAS Gauge Names & Corresponding Notation From Different Surveys.
AFDAS GAUGE NAME
ARL1988 Wing
Survey (Ref. 5)
Amberley Pre & Post Doubler Test
1990 (Ref. 6)
CPLT Sacramento, U.S.
1990 (Ref. 7)
AMRL 1995 Wing
Survey (Ref. 8)
AMRL 1995 Nacelle Tie Link Test
(Ref. 9)
Wl CLBA - LHWW1/RHWW1 149B/W1 - W3 - LHLPV/RHLPV LHWW3/RHWW3 248/W3 - W5 - LHRP/RHRP LHWW5/RHWW5 250/W5A - W6 - LFVH13/RFVH13 LHWW6/RHWW6 38/W6 - Cl - - - 251/C1 - C2 - - NFRT1/NFLT1 - C2
CF3 - - CF3 - - CF5 - CF5 CF5 - - FF1 - - FF1 - ■ -
AF2 - - AF2 - - VT4 - - - - - Nz - - - - -
DSTO-TR-0563
3.1.2 Loads & Forces
The loading arrangements for the full scale aircraft tests at Sacramento and Amberley are summarised in Appendices C and D, respectively. All shear forces and moments subsequently used for this report were calculated based on the APPLIED loads as given in Reference 10 - they are different from the "Net" resultant forces and moments that are also listed in the same reference. It should also be noted here that for calculated load values the following applies:
100% CPLT load = Max. Proof Test Applied Load(s) as per Reference 10.
All subsequent load increment values were interpolated from these figures. For example, the WPBM at 40% CPLT load would be calculated from the 40% value of each applied wing jack load.
The Net loads have been calculated to account for the "dead-weight" of the aircraft when loads are being applied. However, when the aircraft is at rest in the lg condition, the AFDAS gauges have been "zeroed", hence eliminating any strain output due to the dead-weight of the aircraft (as there are no loads being applied). This is why the resultants from the APPLIED loads were used in the DADTA stress equations, such that stress as a function of applied load could then be compared with strain as a function of applied load.
The loadings for the wing tests (References 5 & 8) also make use of the same CPLT load distribution arrangement shown on the wing diagram in Appendix C. This applies to both long and short wing versions.
3.1.3 Sign Convention
The sign conventions used in the strain surveys are:
WRBM and WRSF +ve upwards wing bending -ve downwards wing bending
JACK LOADS +ve upward jack load -ve downward jack load
STRAINS +ve tensile -ve compressive
The sign conventions used for the applied and resulting loads/forces are also shown in Appendices C and D. DADTA Items 24a and 92a make use of wing bending moments about the x-x and y-y axes (with the axes origin at the wing pivot). Appendix E has been included to illustrate an example of how these quantities were calculated, as well as to show the sign convention used.
DSTO-TR-0563
3.1.4 Material Properties
The primary structure of the F-lll consists mainly of two materials - D6ac steel and 2024-T851 aluminium alloy. However, there are cases where an AFDAS gauge location does not occur on the same material as the corresponding DADTA item. Therefore care must be taken to use the correct material properties when working through the calculations for each specific location. The properties are listed as follows:
D6ac steel - E = 29.8 x 10⁶ psi (Reference 2) 2024-T851 Aluminium Alloy - E = 10.7 x 10⁶ psi (Reference 11)
4. F-lll Model Structural Variations
4.1 Wing Carry Through Box
With the exception of the RAAF's recently acquired F-111G models, the RAAF F-lll fleet is comprised of two types: ex F-111A3 models and F-111C models. The main structural variations to be found between the two He in the Wing Carry Through Box (WCTB) area. The ex F-111A aircraft are fitted with a "lightweight" WCTB whereas the F-111C aircraft have the heavy weight WCTB.
Consequently, the stresses experienced by the control points (DADTA items) in this region differ depending on which WCTB is fitted. This is the case with the DADTA items associated with AFDAS gauge Cl. Although the control points are in the same physical location, they are assigned different DADTA item numbers to differentiate between the two types of WCTB used (ie: DADTA Items 132 & 136 are the same control point, but represent F-111C and ex F-111A models respectively. Likewise for DADTA Items 159a & 159). See Appendix A.
4.2 Nacelle Tie Link
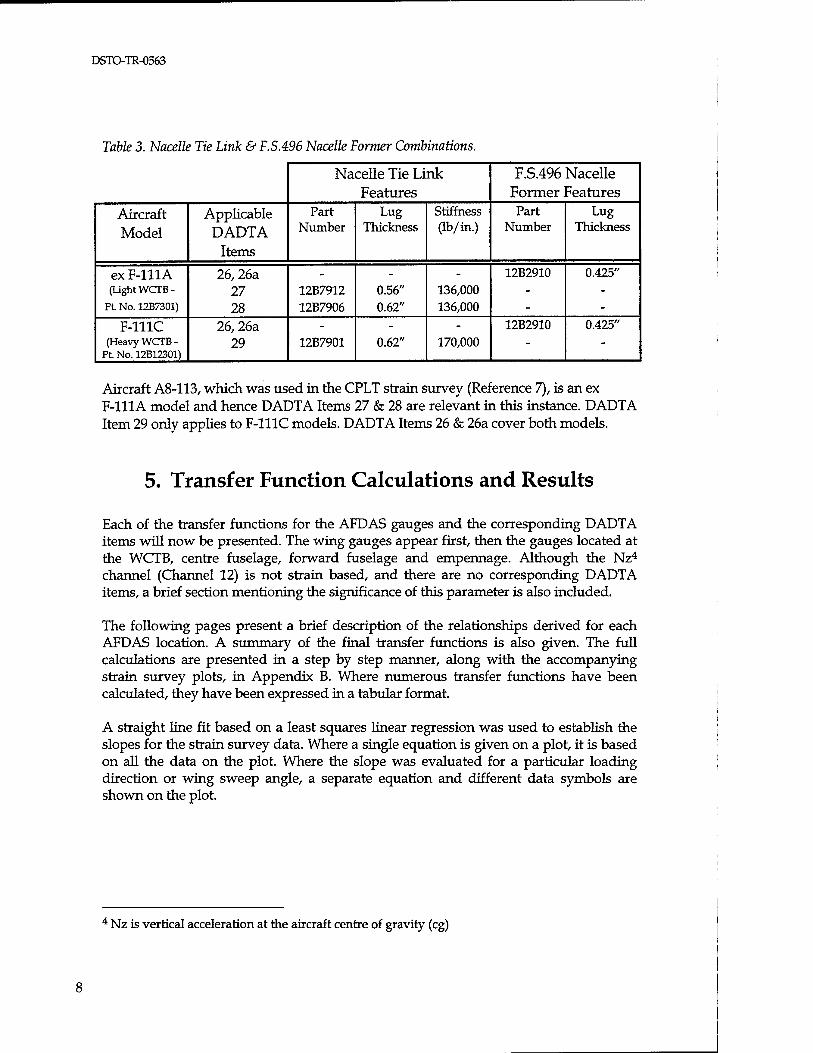
The Nacelle Tie Link is a structural component linking the rear face of the WCTB with the nacelle former at F.S.496. Besides the differences in the WCTB, there are also several types of Nacelle Tie Link as well as attachment fittings (lugs) on the F.S.496 nacelle former. Table 3 presents the varying configurations as found on RAAF aircraft.
3 The ex F-111A models started off as short wing aircraft, as shown in the definition of "TAC" in the "Notation" section. However, these were converted to long wing variants upon entering service with the RAAF.
DSTO-TR-0563
Table 3. Nacelle Tie Link & F.S.496 Nacelle Former Combinations.
Nacelle Tie Link Features
F.S.496 Nacelle Former Features
Aircraft
Model
Applicable
DADTA
Items
Part Number
Lug Thickness
Stiffness (lb/in.)
Part Number
Lug Thickness
ex F-111A (Light WCTB-
Pt. No. 12B7301)
26,26a 27 28
12B7912 12B7906
0.56" 0.62"
136,000 136,000
12B2910 0.425"
F-111C (Heavy WCTB -
Pt. No. 12B12301)
26,26a 29 12B7901 0.62" 170,000
12B2910 0.425"
Aircraft A8-113, which was used in the CPLT strain survey (Reference 7), is an ex F-111A model and hence DADTA Items 27 & 28 are relevant in this instance. DADTA Item 29 only applies to F-111C models. DADTA Items 26 & 26a cover both models.
5. Transfer Function Calculations and Results
Each of the transfer functions for the AFDAS gauges and the corresponding DADTA items will now be presented. The wing gauges appear first, then the gauges located at the WCTB, centre fuselage, forward fuselage and empennage. Although the Nz4
channel (Channel 12) is not strain based, and there are no corresponding DADTA items, a brief section mentioning the significance of this parameter is also included.
The following pages present a brief description of the relationships derived for each AFDAS location. A summary of the final transfer functions is also given. The full calculations are presented in a step by step manner, along with the accompanying strain survey plots, in Appendix B. Where numerous transfer functions have been calculated, they have been expressed in a tabular format.
A straight line fit based on a least squares linear regression was used to establish the slopes for the strain survey data. Where a single equation is given on a plot, it is based on all the data on the plot. Where the slope was evaluated for a particular loading direction or wing sweep angle, a separate equation and different data symbols are shown on the plot.
4 Nz is vertical acceleration at the aircraft centre of gravity (eg)
DSTaiR-0563
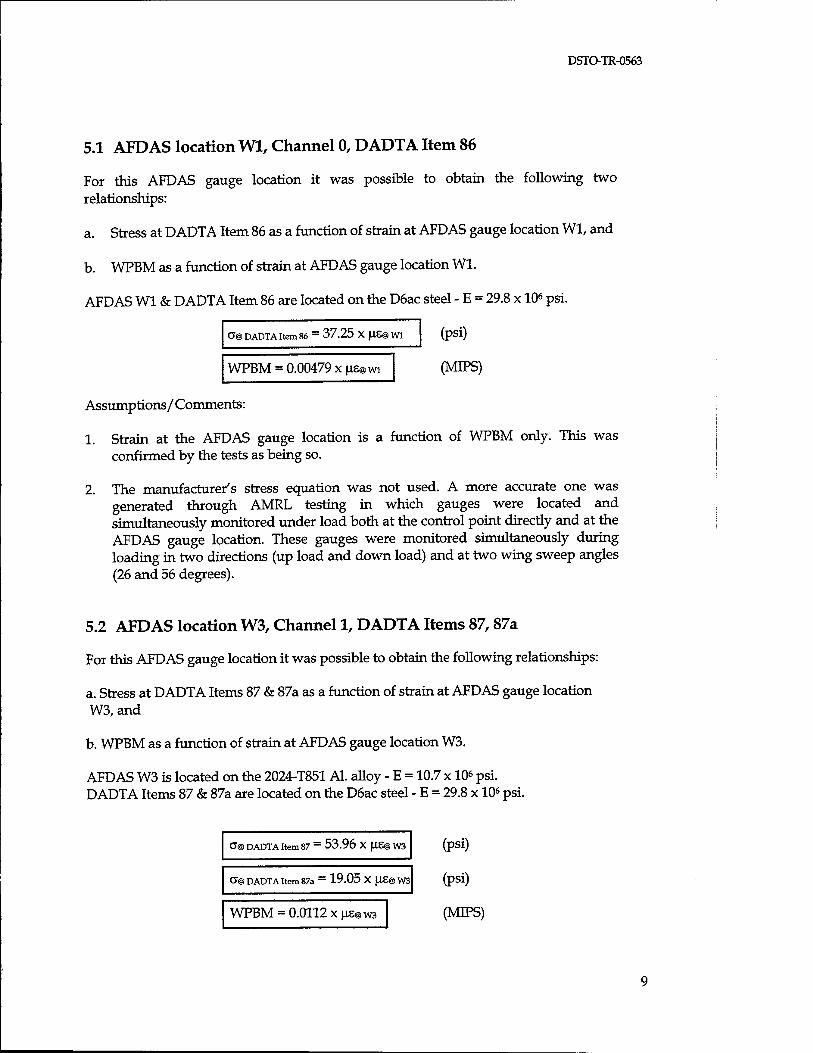
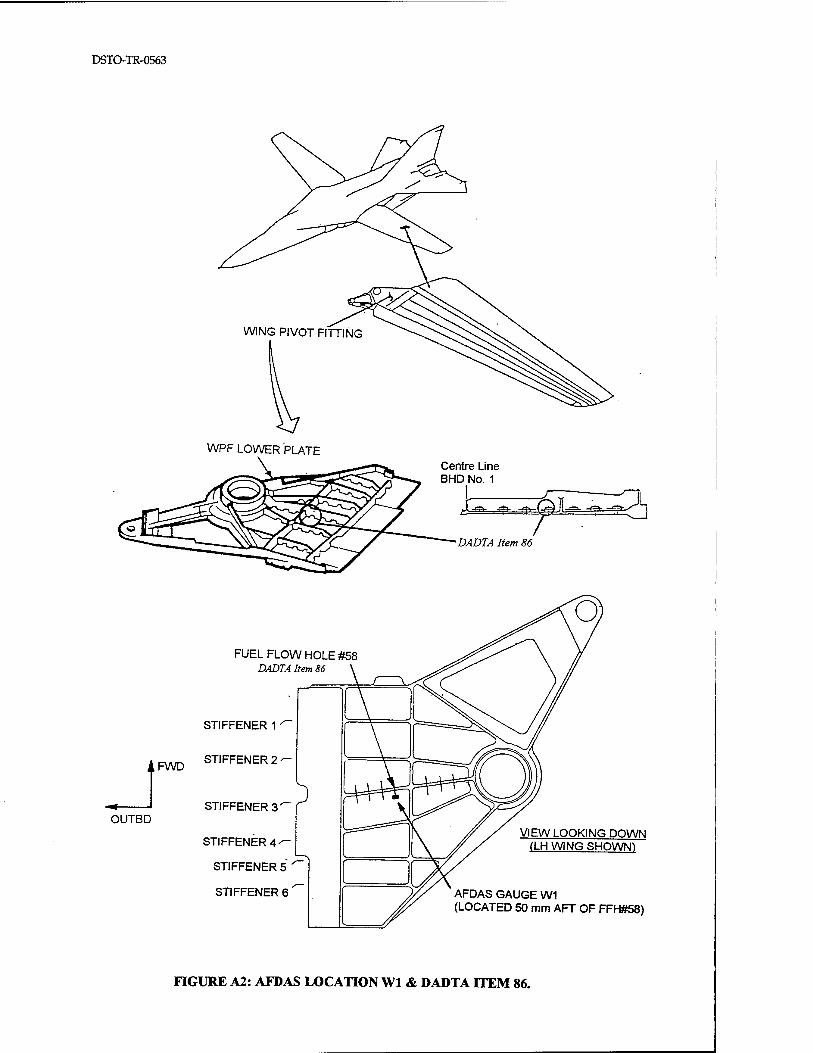
5.1 AFDAS location Wl, Channel 0, DADTA Item 86
For this AFDAS gauge location it was possible to obtain the following two relationships:
a. Stress at DADTA Item 86 as a function of strain at AFDAS gauge location Wl, and
b. WPBM as a function of strain at AFDAS gauge location Wl.
AFDAS Wl & DADTA Item 86 are located on the D6ac steel - E = 29.8 x 10⁶ psi.
(psi) O"® DADTA Item 86 _ 37.25 X |IS@W1
WPBM = 0.00479 x ns@wi (MIPS)
Assumptions/ Comments:
1. Strain at the AFDAS gauge location is a function of WPBM only. This was confirmed by the tests as being so.
2. The manufacturer's stress equation was not used. A more accurate one was generated through AMRL testing in which gauges were located and simultaneously monitored under load both at the control point directly and at the AFDAS gauge location. These gauges were monitored simultaneously during loading in two directions (up load and down load) and at two wing sweep angles (26 and 56 degrees).
5.2 AFDAS location W3, Channel 1, DADTA Items 87,87a
For this AFDAS gauge location it was possible to obtain the following relationships:
a. Stress at DADTA Items 87 & 87a as a function of strain at AFDAS gauge location W3, and
b. WPBM as a function of strain at AFDAS gauge location W3.
AFDAS W3 is located on the 2024-T851 Al. alloy - E = 10.7 x 10⁶ psi. DADTA Items 87 & 87a are located on the D6ac steel - E = 29.8 x 10⁶ psi.
G@ DADTA Item 87 — 53.96 X |IS@ W3
CT@ DADTA Item 87a ~ 19.05 X fJ£@W3
WPBM = 0.0112 x jis@w3
(psi)
(psi)
(MIPS)
DSTO-TR-0563
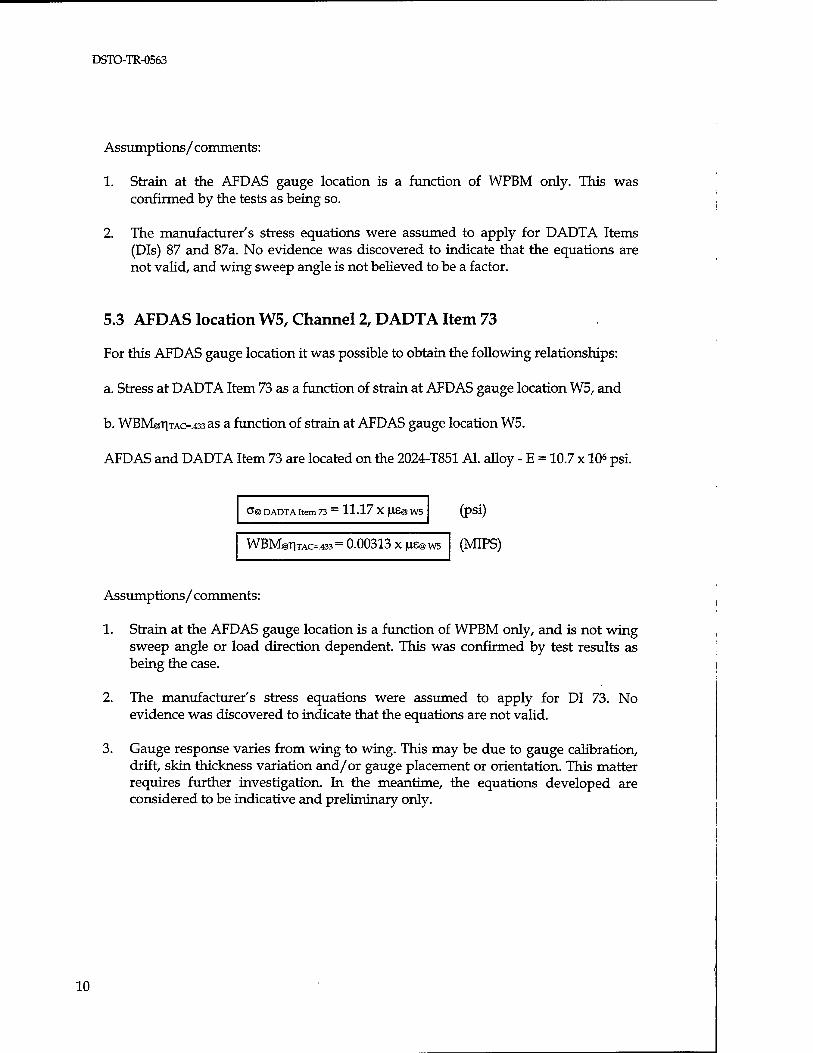
Assumptions/ comments:
1. Strain at the AFDAS gauge location is a function of WPBM only. This was confirmed by the tests as being so.
2. The manufacturer's stress equations were assumed to apply for DADTA Items (DIs) 87 and 87a. No evidence was discovered to indicate that the equations are not valid, and wing sweep angle is not believed to be a factor.
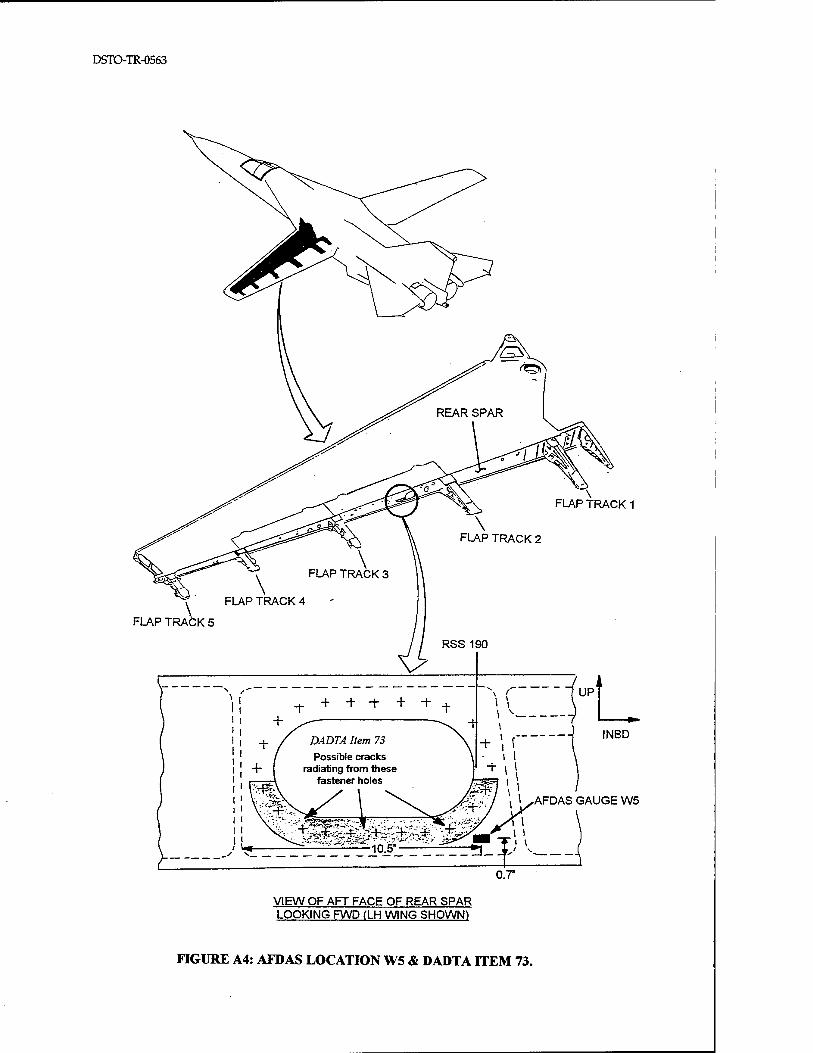
5.3 AFDAS location W5, Channel 2, DADTA Item 73
For this AFDAS gauge location it was possible to obtain the following relationships:
a. Stress at DADTA Item 73 as a function of strain at AFDAS gauge location W5, and
b. WBM@T|TAC=.433 as a function of strain at AFDAS gauge location W5.
AFDAS and DADTA Item 73 are located on the 2024-T851 Al. alloy - E = 10.7 x 10⁶ psi.
0@ DADTA Item 73 — 11.17 X fIS@ W5
WBM@TITAC=.433= 0.00313 x us@w5
(psi)
(MIPS)
Assumptions/ comments:
1. Strain at the AFDAS gauge location is a function of WPBM only, and is not wing sweep angle or load direction dependent. This was confirmed by test results as being the case.
2. The manufacturer's stress equations were assumed to apply for DI 73. No evidence was discovered to indicate that the equations are not valid.
3. Gauge response varies from wing to wing. This may be due to gauge calibration, drift, skin thickness variation and/or gauge placement or orientation. This matter requires further investigation. In the meantime, the equations developed are considered to be indicative and preliminary only.
10

DSTO-TR-0563
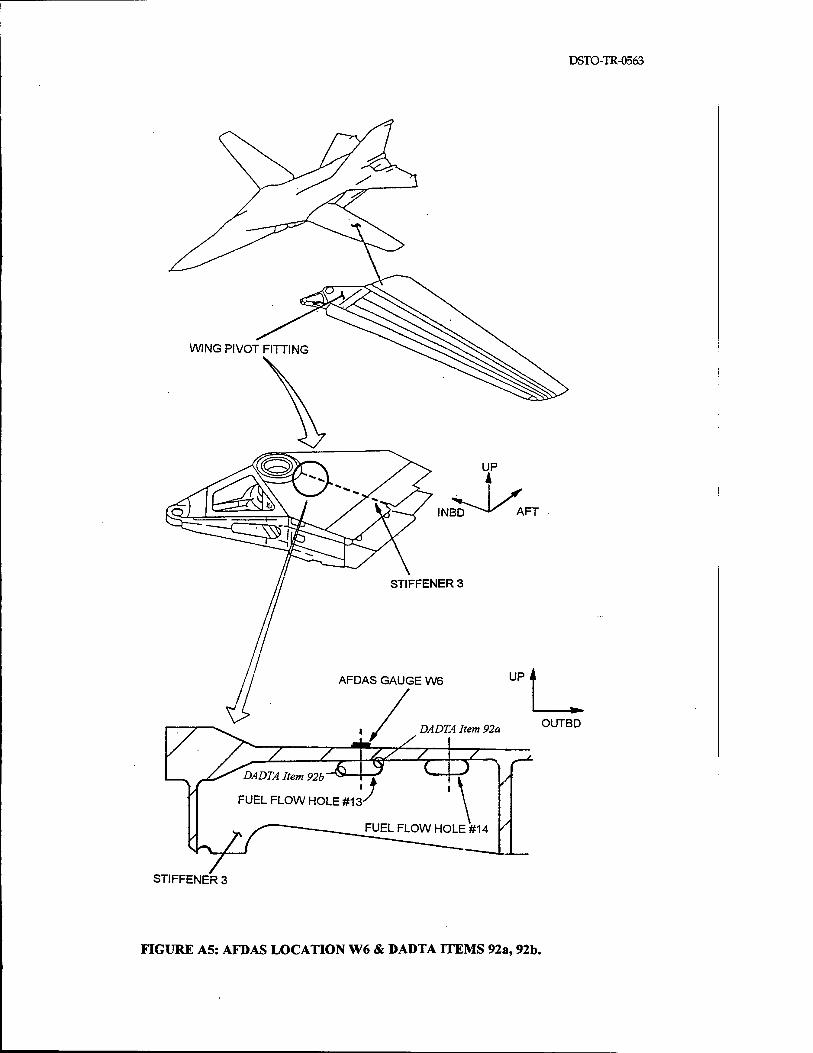
5.4 AFDAS location W6, Channel 6, DADTA Items 92a, 92b
For this AFD AS gauge location it was possible to obtain the following relationships:
a. Stress at DADTA Items 92a & 92b as a function of strain at AFD AS gauge location W6,and
b. WPBM as a function of strain at AFD AS gauge location W6.
AFD AS W6 and DADTA Items 92a & 92b are located on the D6ac steel - E = 29.8 x 10⁶
psi.
COEFFICIENTS UPLOAD or +veWBM (-ve strain) AUWSA
DOWNLOAD or -veWBM
(+ve strain) AUWSA
O"® DADTA Item 92a (pSl) * 44.47 58.01 G@ DADTA Item 92b (psi) * 89.90 113.74 WPBM (MIPS) * -0.00401 -0.00554
*To obtain the stress or WPBM, multiply coefficients by: ue@ WO.
Assumptions/ comments:
1. Strain at the AFD AS gauge location is a function of WPBM only, and is not wing sweep angle dependent. Test results confirmed that this is the case.
2. The manufacturer's load to stress equations are assumed to apply for DIs 92a and 92b. However, it was noted that the relationship between strain at AFD AS gauge W6 and WPBM exhibits a bi-linear response with loading direction. The stress equations for DIs 92a and 92b incorporate a bi-linearity, but it is at a significantly different level. As both the W6 strain gauge and DIs 92a and 92b are located in close proximity, one would expect that the degree of bi-linearity would be simUar for both. It was discovered that for DI 92a a difference of about 6% exists in the slope for the up load and down load segments of the stress equation. The difference for 92b is about 9%. The strain surveys however revealed an average 38% difference in the strain response at W6 for the up load and down load directions.
3. The stresses at DIs 92a and 92b are known to be high, and wiU exceed the yield stress under normal flight loads.
4. Because of 2 and 3, no confidence can be placed in the stress transfer functions which have been developed for this location. The load equation (WPBM=const x us® we) however is considered to be vaKd, provided that the loading direction is taken into account.
11

DSTO-TR-0563
5.5 AFDAS location Cl, Channel 3, DADTA Items 136,159
Note: DADTA Items 132 & 159a can also be covered by AFDAS gauge Cl - however they have been omitted here, as they relate to aircraft with a heavyweight WCTB - the only available strain data (Reference 8) are from a test using the lightweight WCTB.
For this AFDAS gauge location it was theoretically possible to obtain the following two relationships:
a. Stress at DADTA Item 136 & 159 as a function of strain at AFDAS gauge location Cl,and
b. WPBM as a function of strain at AFDAS gauge location Cl.
AFDAS Cl and DADTA Items 136 & 159 are located on the D6ac steel - E = 29.8 x 10* psi.
COEFFICIENTS
G@ DADTA Item 136 (psi) * CJ@ DADTA Item 159 (psi) * WPBM (MIPS) *
WSA UPLOAD DOWNLOAD UPLOAD DOWNLOAD UPLOAD DOWNLOAD
16 22.49 86.94 101.0 390.40 0.0120 0.0463
26 27.98 60.09 55.445 119.075 0.00587 0.0126
44 33.51 43.41 40.17 52.03 0.00372 0.00482
56 37.09 38.87 37.71 39.52 0.00334 0.00350
*To obtain the stress or WPBM, multiply coefficients by: ns@ci.
Assumptions/ comments:
1. DIs 136 and 159 are in sufficient proximity to AFDAS gauge Cl that the stress/ strain at the DI should be directly proportional to the strain gauge output.
2. Strain survey results show that the response varies with wing sweep angle.
3. The manufacturer's stress equation also accounts for wing sweep angle, so if (1) is true, then there should be very little scatter in the coefficients obtained from a range of wing sweep angles. This is not the case and it indicates that the manufacturer's stress equation is not accurate.
12

DSTO-TR-0563
5.6 AFDAS location C2, Channel 4, DADTA Items 26,26a, 27,28,29
For this AFDAS gauge location it was possible to obtain the following relationships:
a. Stress at DADTA Items 26,26a, 27, 28 & 29 as a function of strain at AFDAS gauge location C2, and
b. Nacelle Tie Link Load (NTLL) as a function of strain at AFDAS gauge location C2.
AFDAS C2 and DADTA Items 26,26a, 27,28 & 29 are located on the D6ac steel - E = 29.8 x 10⁶ psi.
Based on the results from strain gauges adjacent to the C2 location, on a part number 12B7912 link, and assuming NTLL = 45,830 lb at 100% CPLT up load at 26° WSA, the following preliminary equations have been developed:
a® DADTA Item 26 ~ 15.37 X JXS@ NR(R/L)T1 + 70000
a® DADTA Item 26a = 5.54 X (XS@ NR(R/L)T1 + 68470
O® DADTA Item 27 = 20.43 X \i£@ NF(R/L)T1
a® DADTA Item 28 = 14.79 X |IS@ NF(R/L)T1
(psi) (26° WSA upload)
(psi) (26° WSA upload)
(psi) (26° WSA upload)
(psi) (26° WSA upload)
Based on the results from a part number 12B7901 link which had a C2 gauge installed and was subjected to calibration away from the aircraft (Reference 9), the following equations were developed:
CT@ DADTA Item 29 - 21.11 X fiS@C2
NTLL = 9.390 x^s@c2
(psi) (positive NTLL)
(lb) (positive NTLL - for part number: 12B7901 only.)
Assumptions/comments:
1. Manufacturers stress equations are assumed to apply.
2. Strain survey data for the installed link was only available for link part number 12B7912, and the exact location of the gauges was not known, but they are thought to have been located adjacent to the C2 location.
3. Strain survey data was available for an uninstalled part number 12B7901 link, and this was used to establish NTLL as a function of strain at the C2 gauge location.
13

DSTO-TR-0563
4. Further work is needed at this location, preferably strain survey data from a CPLT for both types of link and WCTB and also uninstalled load vs strain data for both types of link are required.
5.7 AFDAS location CF3, Channel 8, DADTA Items 19,19a, 19c, 20,20a, 21
For this AFDAS gauge location it was possible to obtain the following relationships:
a. Stress at DADTA Items 19,19a, 19c, 20, 20a & 21 as a function of strain at AFDAS gauge location CF3, and
b. FVBM as a function of strain at AFDAS gauge location CF3.
AFDAS CF3 and DADTA Items 19,19a, 19c, 20,20a & 21 are located on the D6ac steel - E = 29.8 x 10⁶ psi.
COEFFICIENTS UP & DOWN
LOADS
O"® DADTA Item 19 (pSl) * 32.20 CT@ DADTA Item 19a (psi) * 28.17 O® DADTA Item 19c (psi) * 25.41 O"® DADTA Item 20 (pSl) * 45.71 0"@ DADTA Item 20a (pSl) * 31.52 CT@ DADTA Item 21 (psi) * 28.82 FVBM®F.S.496 (MIPS)* -0.0130 FVBM® F.S.531 (MIPS)* -0.0102
*To obtain the stress or FVBM, multiply coefficients by: UE@CF3.
Assumptions/ comments:
1. Manufacturer's stress equations were assumed to apply.
2. The use of the manufacturer's stress equations gave inconsistent results for a WSA of 26° in the down load direction at DADTA Items 20 and 20a. This is either because the AFDAS gauge is located too far away (it is about 7 inches aft of DI 20 and about 34 inches aft of DI 20a) or it indicates a deficiency in the manufacturer's stress equations.
14

DSTO-TR-0563
5.8 AFDAS location CF5, Channel 9, DADTA Item 24a
For this AFDAS gauge location it was possible to obtain the following relationship:
a. Stress at DADTA Item 24a as a function of strain at AFDAS gauge location CF5.
AFDAS CF5 and DADTA Item 24a are located on the D6ac steel - E = 29.8 x 10⁶ psi.
0@ DADTA Item 24a - 89.54 X US® CF5 (psi)
Assumptions/comments:
1. Manufacturer's stress equations are assumed to apply.
2. Reasonable results were obtained.
5.9 AFDAS location FF1, Channel 5, SLMP Control Point FF1
Note: There is no equivalent or nearby DADTA location for AFDAS gauge location FF1. However, there existed a Service Life Monitoring Program (SLMP) Control Point FF1 and related data, which has been subsequently used to derive the following relationships:
a. Stress at SLMP Control Point FF1 as a function of strain at AFDAS gauge location FF1, and
b. FVBM as a function of strain at AFDAS gauge location FF1.
AFDAS FF1 and SLMP Control Point FF1 are located on the 2024-T851 Al. alloy - E = 10.7 xlO6 psi.
COEFFICIENTS UPLOAD 26° WSA
DOWNLOAD 26° WSA
UPLOAD 56° WSA
DOWNLOAD 56° WSA
O® Control Point FF1 (pSl) * -16.14 -15.42 -10.58 -17.53 FVBM®F.S.448 (MIPS)* 0.00815 0.00779 0.00534 0.00885
'To obtain the stress or FVBM, multiply coefficients by: us® AFDASFFI.
15
DSTO-TR-0563
Assumptions/ comments:
1. The manufacturer's stress equation was assumed to apply.
2. Wing sweep angle dependence is evident in the strain survey result, but the stress equation does not account for it. The stress equation is considered to be inaccurate and this has caused poor results.
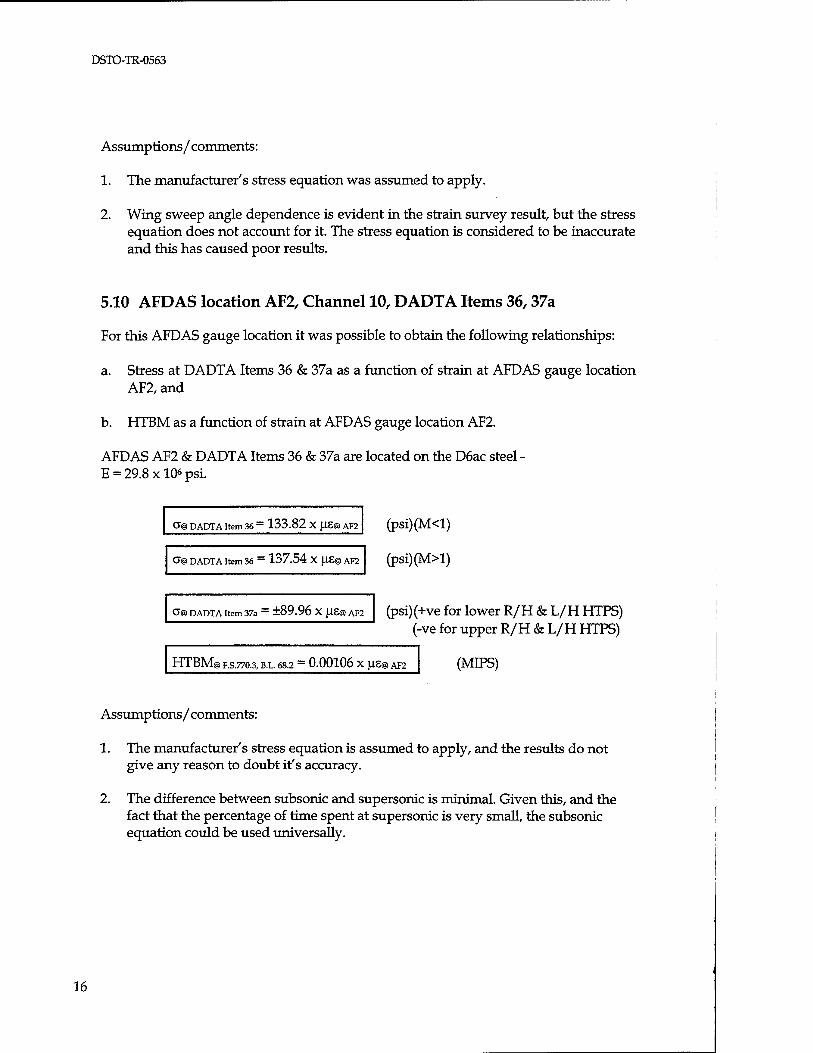
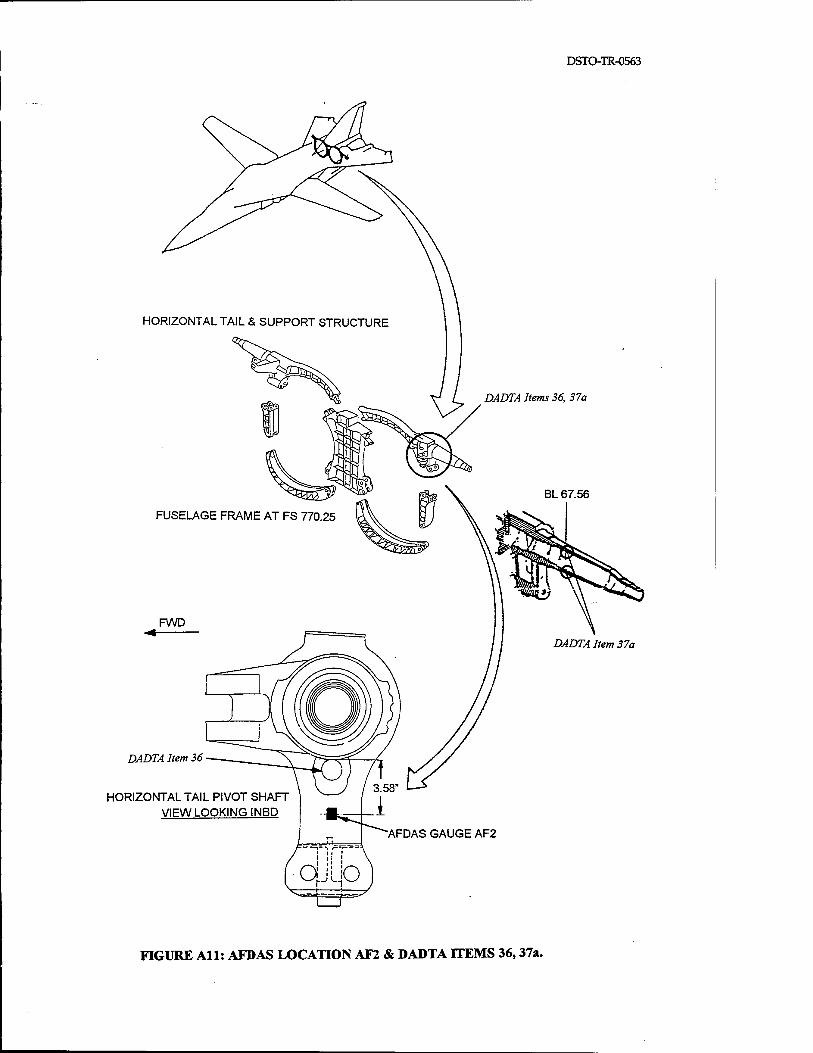
5.10 AFDAS location AF2, Channel 10, DADTA Items 36,37a
For this AFDAS gauge location it was possible to obtain the following relationships:
a. Stress at DADTA Items 36 & 37a as a function of strain at AFDAS gauge location AF2, and
b. HTBM as a function of strain at AFDAS gauge location AF2.
AFDAS AF2 & DADTA Items 36 & 37a are located on the D6ac steel - E = 29.8 x 10⁶ psi.
CT@ DADTA Item 36 - 133.82 X US® AF2
0"@ DADTA Item 36 - 137.54 X US@AF2
(psi)(M<l)
(psi)(M>l)
o@ DADTA item37a = ±89.96 x us@AF2 (psi)(+ve for lower R/H & L/H HTPS) (-ve for upper R/H & L/H HTPS)
HTBM® F.S.770.3, B.L. 68.2 = 0.00106 X US® AF2 (MIPS)
Assumptions/comments:
1. The manufacturer's stress equation is assumed to apply, and the results do not give any reason to doubt it's accuracy.
2. The difference between subsonic and supersonic is minimal. Given this, and the fact that the percentage of time spent at supersonic is very small, the subsonic equation could be used universally.
16
DSTO-TR-0563
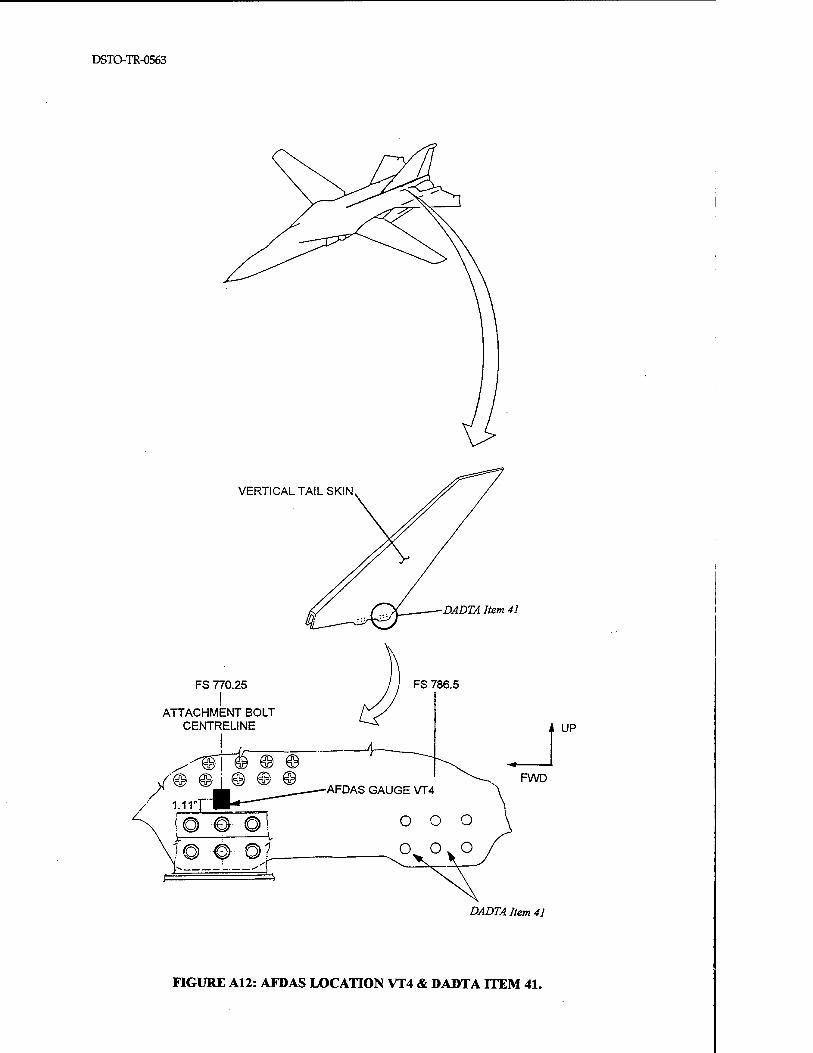
5.11 AFDAS location VT4, Channel 7, DADTA Item 41
AFDAS VT4 and DADTA Item 41 are located on the D6ac steel - E = 29.8 x 10⁶ psi.
As yet, there exists no strain survey data for AFDAS gauge location VT4. The loading conditions applied to the aircraft at CPLT are symmetrical - hence there are no lateral loads applied that would otherwise register a recording at the gauge.
It should be noted that while AFDAS location VT4 is on the forward attachment area of the vertical fin, DADTA Item 41 is located at the aft attachment area. However, the inspected region includes both the forward and aft attachment areas. In time this DADTA item may even become redundant, as the inspection interval is currently set at 18,308 hours (hence critical crack growth life is 36,616 hours). (This can be referred to in the RAAF F-111C DADTA Item 41 results, compiled by Lockheed Fort Worth Corporation, LFWC, dated 17 May 1993 and yet to be published in an official report). These values were calculated from MCR data, gathered from flights during the mid 1980's.
Therefore, although it was initially thought desirable to have an AFDAS gauge to monitor this area, subsequent analysis has shown that it may be unnecessary.
5.12 AFDAS Vertical Acceleration (Nz) Sensor, Channel 11
There is no corresponding DADTA Item for this case. Instead, the data from this channel can be used to compare with the recordings from the primary fatigue meter, which is located close by in the aircraft's main landing gear bay. These fatigue meter counts are recorded on the RAAF's EE360 Fatigue Meter Data sheets.
Although the relationship with DADTA items are not considered here, the function of recording Nz via AFDAS is a very necessary capability. It is the only channel that can be validated (against the EE360 information). The Nz data, once validated, can be used in correlation/calibration work to check the integrity of strain gauges that are primarily Nz driven. Also, AFDAS records Nz data with greater accuracy and frequency than the primary fatigue meter, thus giving greater confidence in resulting exceedance diagrams and other features of spectrum development.
6. Discussion and Conclusions
Strain data from several different static strain surveys have been analysed and combined (where necessary) with the relevant manufacturer's load to stress equations for the purpose of deriving transfer functions for processing AFDAS data. Several simplifying assumptions have also been made. Application of the transfer functions developed to current operational AFDAS data will enable a check of the loads and
17
DSTO-TR-0563
stress spectra generated in the past using MCR and the manufacturer's load and stress equations. The old techniques are known to provide an overly conservative estimate of the stress spectra. The potentially more accurate AFDAS derived spectra should therefore provide an obvious and immediate benefit of extended inspection intervals and an increase in the anticipated airframe life or durability.
The range-pairing process used in AFDAS eliminates time from the records. Also, flight parameters such as airspeed, altitude, dynamic pressure and Wing Sweep Angle are not recorded. The process of converting an AFDAS strain output to either a load or a stress can therefore only involve a simple factoring by a constant. The only refinement possible on this is to take loading direction into account, ie peaks and troughs from AFDAS can be treated separately. The work presented in this report has focussed on determining the scaling factors based on previous work and results already available, ie: static strain surveys to convert AFDAS strain to load, and then to use existing load-to-stress equations (from the manufacturer) to establish the relationship between AFDAS strain and control point stress.
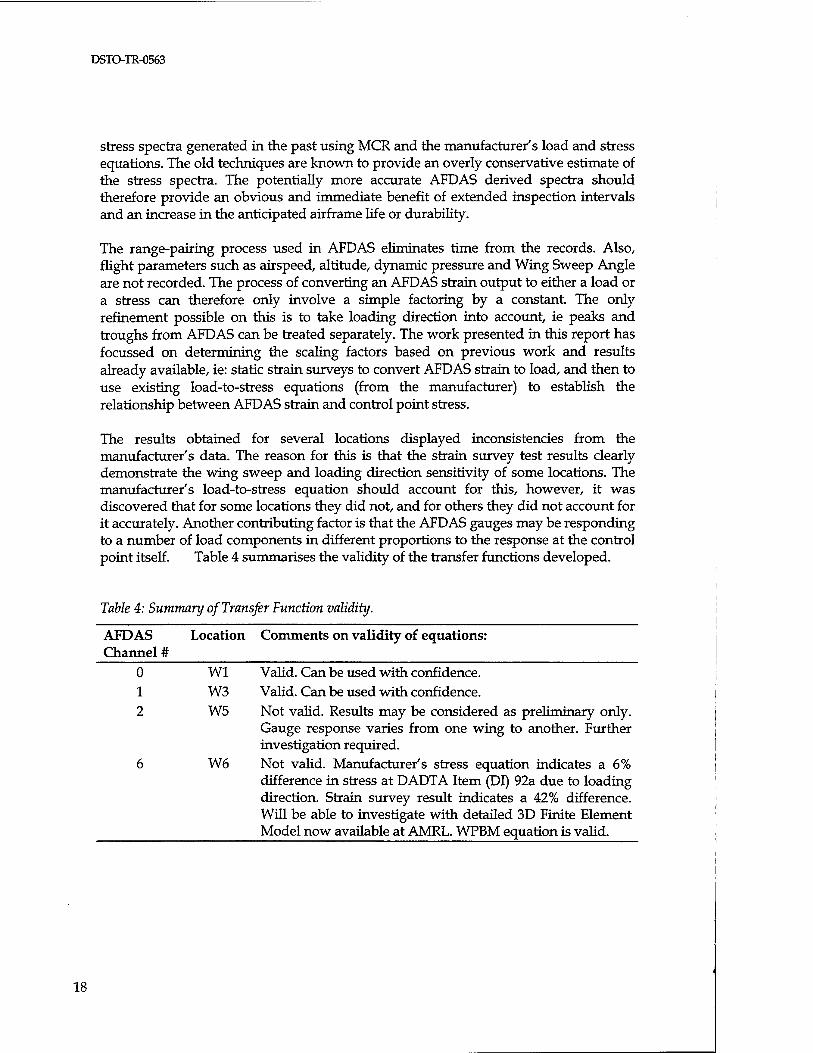
The results obtained for several locations displayed inconsistencies from the manufacturer's data. The reason for this is that the strain survey test results clearly demonstrate the wing sweep and loading direction sensitivity of some locations. The manufacturer's load-to-stress equation should account for this, however, it was discovered that for some locations they did not, and for others they did not account for it accurately. Another contributing factor is that the AFDAS gauges may be responding to a number of load components in different proportions to the response at the control point itself. Table 4 summarises the validity of the transfer functions developed.
Table 4: Summary of Transfer Function validity.
AFDAS Location Comments on validity of equations: Channel #
Valid. Can be used with confidence. Valid. Can be used with confidence. Not valid. Results may be considered as preliminary only. Gauge response varies from one wing to another. Further investigation required.
W6 Not valid. Manufacturer's stress equation indicates a 6% difference in stress at DADTA Item (DI) 92a due to loading direction. Strain survey result indicates a 42% difference. Will be able to investigate with detailed 3D Finite Element Model now available at AMRL. WPBM equation is valid.
0 Wl 1 W3 2 W5
18
DSTO-TR-0563
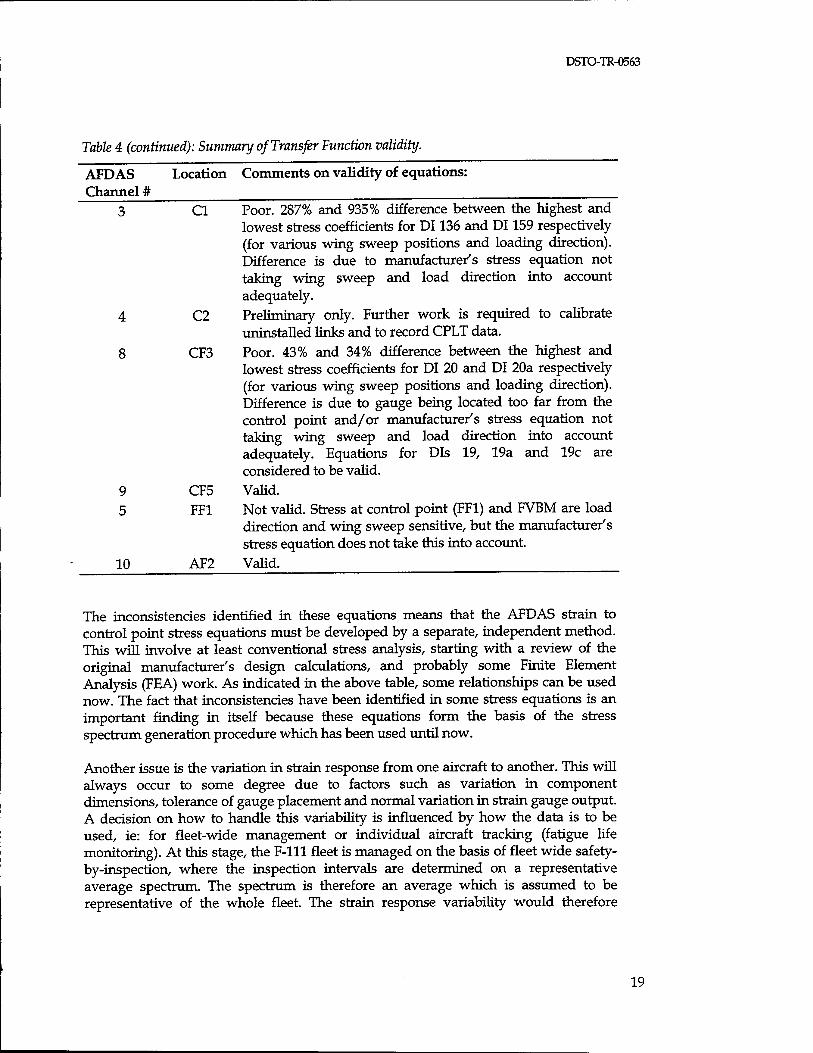
Table 4 (continued): Summary of Transfer Function validity.
AFD AS Location Comments on validity of equations: Channel #
3 Cl Poor. 287% and 935% difference between the highest and lowest stress coefficients for DI136 and DI159 respectively (for various wing sweep positions and loading direction). Difference is due to manufacturer's stress equation not taking wing sweep and load direction into account adequately.
4 C2 Preliminary only. Further work is required to calibrate uninstalled links and to record CPLT data.
8 CF3 Poor. 43% and 34% difference between the highest and lowest stress coefficients for DI 20 and DI 20a respectively (for various wing sweep positions and loading direction). Difference is due to gauge being located too far from the control point and/or manufacturer's stress equation not taking wing sweep and load direction into account adequately. Equations for DIs 19, 19a and 19c are considered to be valid.
9 CF5 Valid. 5 FF1 Not valid. Stress at control point (FF1) and FVBM are load
direction and wing sweep sensitive, but the manufacturer's stress equation does not take this into account.
10 AF2 Valid.
The inconsistencies identified in these equations means that the AFD AS strain to control point stress equations must be developed by a separate, independent method. This will involve at least conventional stress analysis, starting with a review of the original manufacturer's design calculations, and probably some Finite Element Analysis (FEA) work. As indicated in the above table, some relationships can be used now. The fact that inconsistencies have been identified in some stress equations is an important finding in itself because these equations form the basis of the stress spectrum generation procedure which has been used until now.
Another issue is the variation in strain response from one aircraft to another. This will always occur to some degree due to factors such as variation in component dimensions, tolerance of gauge placement and normal variation in strain gauge output. A decision on how to handle this variability is influenced by how the data is to be used, ie: for fleet-wide management or individual aircraft tracking (fatigue life monitoring). At this stage, the F-lll fleet is managed on the basis of fleet wide safety- by-inspection, where the inspection intervals are determined on a representative average spectrum. The spectrum is therefore an average which is assumed to be representative of the whole fleet. The strain response variability would therefore
19
DSTO-TR-0563
logically be part of the overall variability inherent in having an "average representative spectrum".
Recommendations arising from this work are as follows:
a. Review the manufacturer's stress equations for DADTA Items 92a, 92b, 136,159, 20, 20a, and SLMP Control Point FF1 and urgently assess any implications for the current fleet inspection intervals.
b. Finite element analysis be undertaken along with a review of any conventional stress analyses which have been previously done for structural regions in the vicinity of AFDAS gauges W5 (to assess strain gradients), W6 (to quantify the upload/download effects and to quantify the critical stresses/strains at DIs 92a and 92b), Cl (to quantify WSA effects), C2 (to correlate with the preliminary results), CF3 (to determine if the AFDAS gauge is in sufficient proximity to be useful for DIs 20 and 20a) and FF1 (to quantify WSA effects).
c. Compare WPBM spectra obtained from gauges Wl, W3 and W6 from the same aircraft to quantify the degree of consistency and therefore assess the validity of the equations which have been developed.
d. Investigate reasons for wing to wing variability in response for AFDAS gauge W5.
e. Carry out static load calibrations for both types of nacelle tie link (AFDAS gauge C2) and collect data during CPLT loading for both configurations.
f. Consider upgrading the AFDAS system to be able to record wing sweep angle and the existing strain parameters simultaneously to enable the wing sweep angle dependencies to be quantified.
g. Exercise caution when using any of the transfer functions which have been developed here.
7. Acknowledgments
This work was conducted as part of the F-lll Structural Integrity Task sponsored by DTA HQLC RAAF. The desk officer at the time was Squadron Leader Mark Wilkin and his advice and support is gratefully acknowledged. The authors would like to express their appreciation to the following AMRL staff whose inputs and advice were greatly appreciated; Mr Kevin Wärters (Task Manager), Dr Francis Rose (Research Leader) and Mr Lorrie Molent (vetting/technical review).
20

DSTO-TR-0563
References
1. "DADTA: F-111A/E/D/F and FB-111A Final Analysis. Analysis Details (Common to all MDS)" - Revision A, Report FZS-12-495, General Dynamics Fort Worth Division, Texas, USA, May 1987.
2. "F-111C Service Life Monitor Program Basic Data For Airframe Control Points", Report FZS-12-5018, General Dynamics Fort Worth Division, Texas, USA, September 1979.
3. "Airframe Load and Stress Equations For Use in the F-111C Durability and Damage Tolerance Assessment (DADTA) Program", Report FZS-12-5030, General Dynamics Fort Worth Division, Texas, USA, August 1991.
4. Walker, K., "F-lll Aircraft Fatigue Data Analysis System (AFDAS) In Service Development - Progress Report Number One", Aeronautical & Maritime Research Laboratory, DSTO-TR-0118, DSTO, Melbourne, Australia, July 1995.
5. Molent, L., and Swanton, G., "F-lll Fuel Flow Hole #13 Strain Surveys", Aeronautical Research Laboratory, ARL-TN-33, DSTO, Melbourne, Australia, June 1993.
6. Lombardo, D.C, Piperias, P., Patterson, A.K., Ferrarotto, P., and Smith, D., "Preliminary Strain Survey on F-111C Aircraft A8-113", Aeronautical Research Laboratory, ARL-STRUC-TM-566, DSTO, Melbourne, Australia, October 1990.
7. Molent, L., and Patterson, A.K., "Strain Survey of F-111C Aircraft A8-113", Aeronautical Research Laboratory, ARL-STRUC-TM-585, DSTO, Melbourne, Australia, August 1992.
8. Lillingston, K, "F-lll Wing Variable Sweep Strain Survey", Aeronautical & Maritime Research Laboratory, Structures Laboratory Report No. 8/95, DSTO, Melbourne, Australia, October 1995.
9. Lab Book 5/95, pp. 11932 - 11939: used to record data from the "250 kN Instron" machine, Bldg. 2, Aeronautical & Maritime Research Laboratory, Melbourne, Australia, July 1995.
10. "Test Loads and General Test Procedures For F-lll Proof Testing. Phase III Structural Inspection Program. F-lll A/E/D/F/FB-111A", Report FZS-12-360A, General Dynamics Fort Worth Division, Texas, USA, November 1985.
11. MIL-HDBK-5F - "Metallic Materials and Elements for Aerospace Vehicle Structures", Department of Defence, U.S.A., November 1990.
21
DSTO-TR-0563
THIS PAGE INTENTIONALLY BLANK
22

DSTO-TR-0563
Appendix A
DSTO-TR-0563
a p
w o P
Cfi

DSTO-TR-0563
<
K
O P.
O u CO
DSTO-TR-0563
FUEL FLOW HOLE #58 DADTA Item 86
iFWD
OUTBD
STIFFENER 1
STIFFENER 2-"
STIFFENER3'-
STIFFENER 4--
STIFFENER 5
STIFFENER 6
VIEW LOOKING DOWN (LHWINGSHOWm
AFDAS GAUGE W1 (LOCATED 50 mm AFT OF FFH#58)
FIGURE A2: AFDAS LOCATION Wl & DADTA ITEM 86.

DSTO-TR-0563
WING LEADING EDGE
DADTA Item 87a
BORON DOUBLER
DADTA Items 87, 87a
VIEW LOOKING DOWN
AFDAS GAUGE W3
ASTENERHOLE #182
FIGURE A3: AFDAS LOCATION W3 & DADTA ITEMS 87,87a.
DSTO-TR-0563
FLAP TRACK 1
FLAP TRACK 5
RSS 190
+ + + + + + +
DADTA Item 73 Possible cracks
radiating from these fastener holes
I -10.5"
^^L£;: / j ^AFDAS GAUGE W5
o.r VIEW OF AFT FACE OF REAR SPAR LOOKING FWD (LH WING SHOWW
FIGURE A4: AFDAS LOCATION W5 & DADTA ITEM 73.
DSTO-TR-0563
OUTBD
STIFFENER 3
FIGURE A5: AFDAS LOCATION W6 & DADTA ITEMS 92a, 92b.

DSTO-TR-0563
FWD
WING CARRY THROUGH BOX
AFDAS GAUGE C1 (LOCATED 2.5" OUTBD OF VERTICAL WEB & 1.03' AFT OF FWD EDGE OF WCTB LOWER LUG)
DADTA Items 132,136,159,159a
DADTA Item 132/136 (possible cracks)
SECTION A-A
c=3^ 2.0"
SECTION B-B
DADTA Item 1591159a (possible cracks)
FIGURE A6: AFDAS LOCATION Cl & DADTA ITEMS 132,136,159,159a.

DSTO-TR-0563
DADTA Item 26
AFDAS GAUGE C2 (LOCATED ON INNER SURFACE OF NACELLE TIE LINK)
REAR FACE OF WCTB
FS496
FIGURE A7: AFDAS LOCATION C2 & DADTA ITEMS 26,26a, 27,28,29.

DSTO-TR-0563
DADTA Item 20a
FWD
DADTA Item 19c
AFDAS GAUGE CF3 (LOCATED BETWEEN FASTENER HOLES #1076 е, APPROX. 0.5" INBD OF VERTICAL WEB)
LONGERON PART No. 12B1891 (Upper Flange)
FIGURE A8: AFDAS LOCATION CF3 & DADTA ITEMS 19,19a, 19c, 20, 20a, 21.

DSTO-TR-0563
WING CARRY THROUGH BOX ASSEMBLY,
BOLT HOLE #253
FS 496 NACELLE BULKHEAD FORMER
BOLT OLE 226
FWD
AFDAS GAUGE CF5 (LOCATED ON WEB APPROX 1.6" AFT OF REAR OF WCTB)
VIEW LOOKING FWD
FIGURE A9: AFDAS LOCATION CF5 & DADTA ITEM 24a.

DSTO-TR-0563
LONGERON PART No. 12B1740
SIMP Control Point FF1
AFDAS GAUGE FF1" (ACTUAL LOCATION IS 4" FWD OF FS 448) tkl
VIEW LOOKING AFT
FIGURE A10: AFDAS LOCATION FF1 & SLMP CONTROL POINT FF1.
DSTO-TR-0563
DADTA Item 36
HORIZONTAL TAIL PIVOT SHAFT VIEW LOOKING INBD
DADTA Items 36, 37a
AFDAS GAUGE AF2
=rrr
FIGURE All: AFDAS LOCATION AF2 & DADTA ITEMS 36,37a.
DSTOTR-0563
FS 770.25
ATTACHMENT BOLT CENTRELINE
•-^ti£ ii UP
AFDAS GAUGE VT4
O O O
DADTA Item 41
FIGURE A12: AFDAS LOCATION VT4 & DADTA ITEM 41.

DSTO-TR-0563
STRAIN RANGE PAIR COUNTER
FIGURE A13: AFDAS ACCELEROMETER & SRPC LOCATION.
DSTO-TR-0563
THIS PAGE INTENTIONALLY BLANK
DSTO-TR-0563
Appendix B
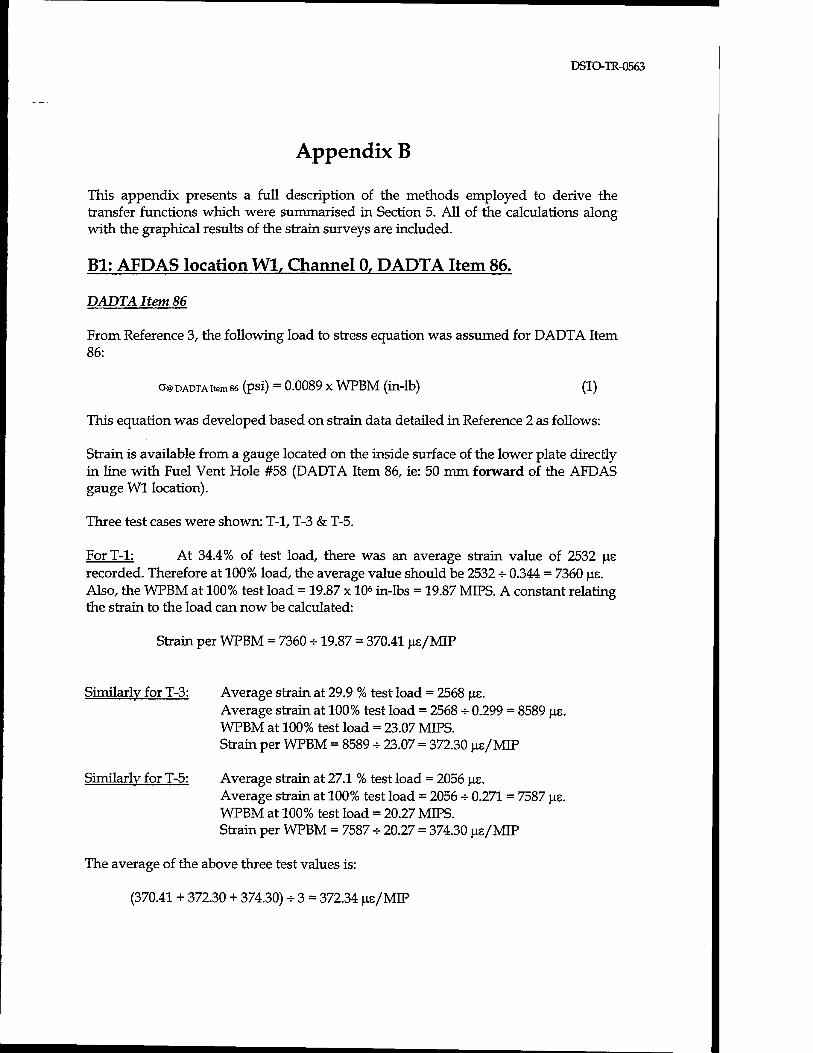
This appendix presents a full description of the methods employed to derive the transfer functions which were summarised in Section 5. All of the calculations along with the graphical results of the strain surveys are included.
Bl: AFP AS location Wl, Channel 0, DADTA Item 86.
DADTA Item 86
From Reference 3, the following load to stress equation was assumed for DADTA Item 86:
a® DADTA item 86 (psi) = 0.0089 x WPBM (in-lb) (1)
This equation was developed based on strain data detailed in Reference 2 as follows:
Strain is available from a gauge located on the inside surface of the lower plate directly in line with Fuel Vent Hole #58 (DADTA Item 86, ie: 50 mm forward of the AFDAS gauge Wl location).
Three test cases were shown: T-l, T-3 & T-5.
For T-l: At 34.4% of test load, there was an average strain value of 2532 us recorded. Therefore at 100% load, the average value should be 2532 + 0.344 = 7360 us. Also, the WPBM at 100% test load = 19.87 x 10⁶ in-lbs = 19.87 MIPS. A constant relating the strain to the load can now be calculated:
Strain per WPBM = 7360 H- 19.87 = 370.41 us/MIP
Similarly for T-3: Average strain at 29.9 % test load = 2568 us. Average strain at 100% test load = 2568 - 0.299 = 8589 us. WPBM at 100% test load = 23.07 MIPS. Strain per WPBM = 8589 - 23.07 = 372.30 us/MIP
Similarly for T-5: Average strain at 27.1 % test load = 2056 us. Average strain at 100% test load = 2056 -*• 0.271 = 7587 us. WPBM at 100% test load = 20.27 MIPS. Strain per WPBM = 7587 - 20.27 = 374.30 us/MIP
The average of the above three test values is:
(370.41 + 372.30 + 374.30) + 3 = 372.34 us/MIP
DSTO-TR-0563
Note that these tests were performed WITHOUT lower plate boron doublers. The stress WITH the doubler is 80% of the stress without the doubler. Assuming a linear relationship between stress and strain, it can be said that the strain will also be reduced by 80%. That is:
Strain® DADTA item86 per WPBM = 372.34 x 0.80 = 297.87 ns/MIP (2)
Using Hooke's Law, this equates exactly to the stress equation (1) quoted above.
Experimental data (References 5-8) are available which give a relationship between strain at the AFDAS Wl gauge location as a function of applied load (WPBM). Using the data from References 5 to 8, the strain response at gauge location Wl was plotted as a function of WPBM. The results are shown in Figures Bl to B5. These plots are considered to reflect accurate, repeatable strain response. It was therefore decided to determine a figure based on the average as follows.
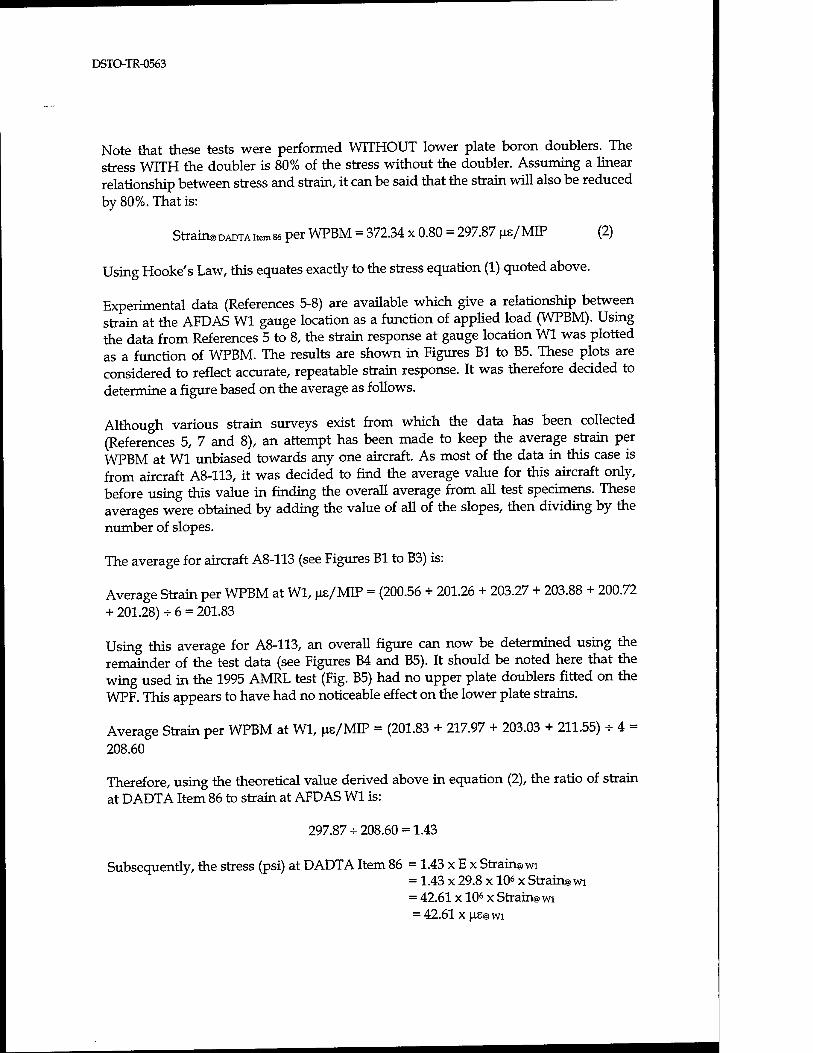
Although various strain surveys exist from which the data has been collected (References 5, 7 and 8), an attempt has been made to keep the average strain per WPBM at Wl unbiased towards any one aircraft. As most of the data in this case is from aircraft A8-113, it was decided to find the average value for this aircraft only, before using this value in finding the overall average from all test specimens. These averages were obtained by adding the value of all of the slopes, then dividing by the number of slopes.
The average for aircraft A8-113 (see Figures Bl to B3) is:
Average Strain per WPBM at Wl, ^is/MIP = (200.56 + 201.26 + 203.27 + 203.88 + 200.72 + 201.28) -e- 6 = 201.83
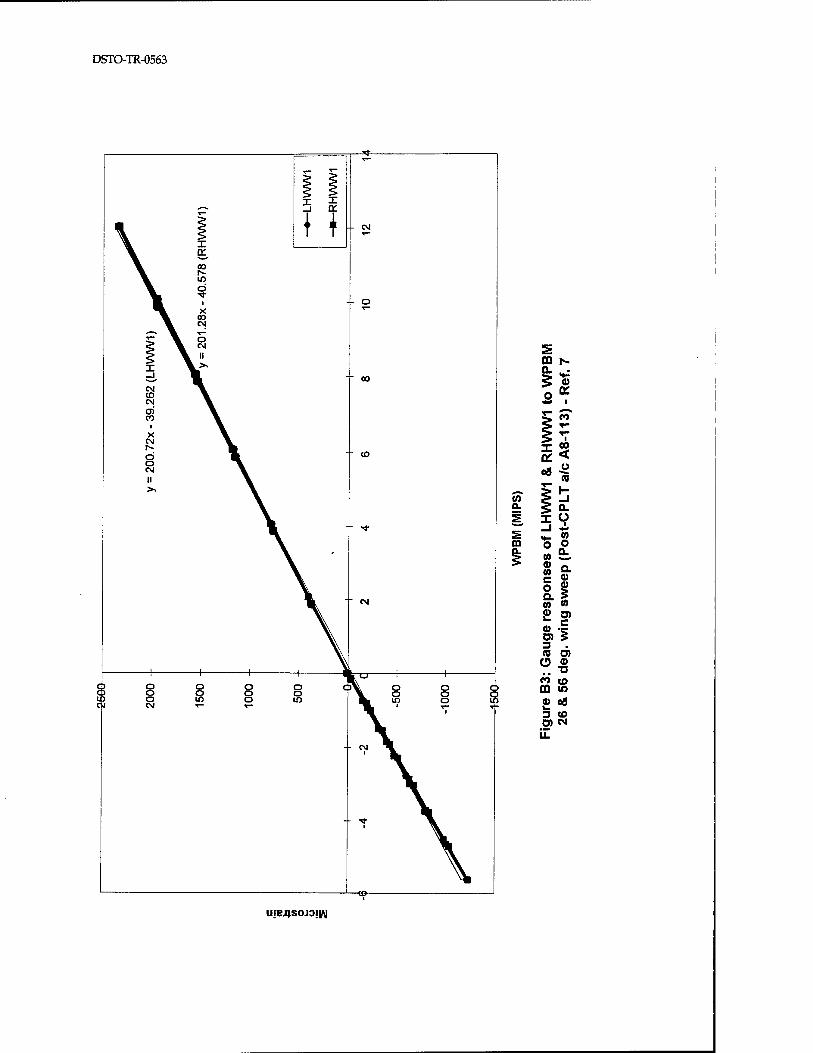
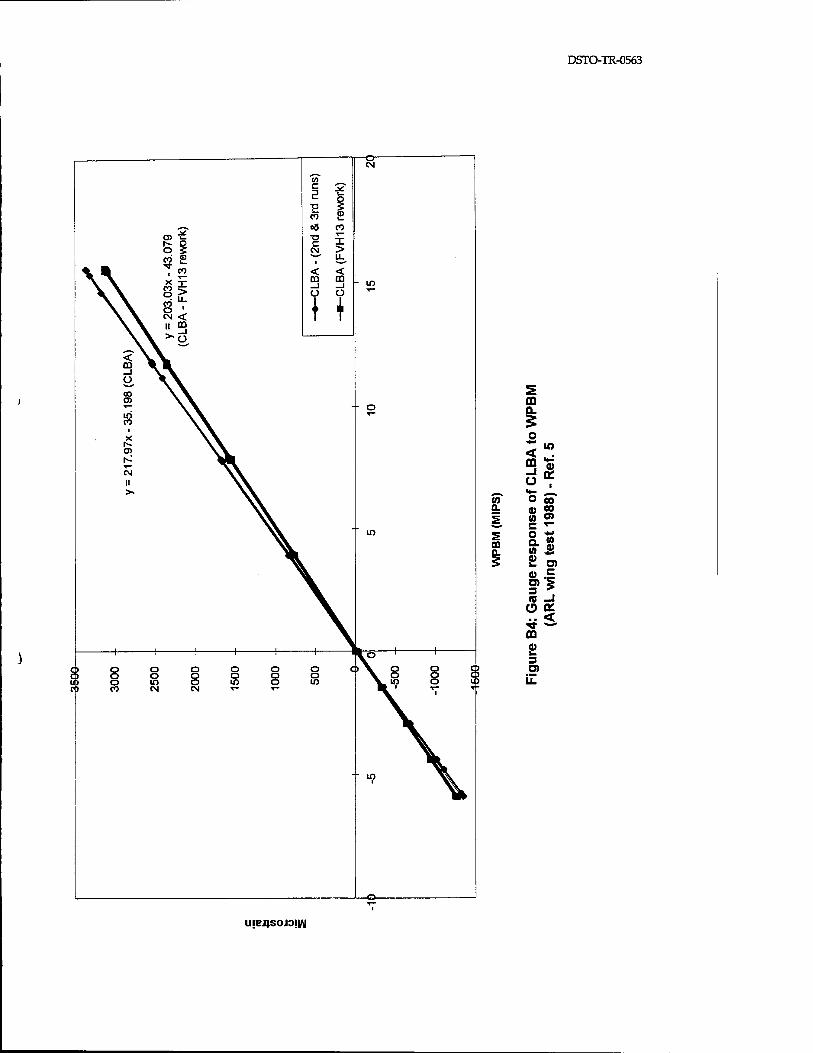
Using this average for A8-113, an overall figure can now be determined using the remainder of the test data (see Figures B4 and B5). It should be noted here that the wing used in the 1995 AMRL test (Fig. B5) had no upper plate doublers fitted on the WPF. This appears to have had no noticeable effect on the lower plate strains.
Average Strain per WPBM at Wl, ^s/MIP = (201.83 + 217.97 + 203.03 + 211.55) - 4 = 208.60
Therefore, using the theoretical value derived above in equation (2), the ratio of strain at DADTA Item 86 to strain at AFDAS Wl is:
297.87-208.60 = 1.43
Subsequently, the stress (psi) at DADTA Item 86 = 1.43 x E x Strain® wi = 1.43 x 29.8 x 106 x Strain® wi = 42.61 x 10⁶ x Strain® wi = 42.61 x |j.s@wi

DSTO-TR-0563
As stated earlier, DADTA Item 86 is located 50 mm forward of the AFDAS gauge Wl location, ie: directly in line with Fuel Vent Hole #58. The strain relationship detailed above (equation 2) was effectively checked or validated on a recent AMRL wing strain survey (Reference 8). A strain gauge (# 149) was located precisely at the DADTA Item 86 location, and the response is plotted in Figure B6. This gives an average slope of 261.76 us/MIP compared with 297.87 us/MIP from equation (2). The figure of 261.76 is considered to be more accurate because it has not used the "doubler reduction" factor of 80%. Indeed the origin of the 80% figure is not known and is not explained in Reference 2. The recent AMRL test was conducted on a wing fitted with a lower plate doubler. Therefore the ratio of strain at DADTA Item 86 to strain at AFDAS Wl is:
261.76 + 208.63 = 1.25
Subsequently, the stress (psi) at DADTA Item 86 = 1.25 x E x Strain® wi = 1.25 x 29.8 x 106 x Strain® wi = 37.25 x 10⁶ x Strain® wi = 37.25 x us® wi
Thus, in summation, we have the following relationships:
G@ DADTA Item 86 — 37.25 X US@W1
WPBM = (1 H- 208.60) x us® wi
(psi)
(MIPS)

DSTO-TR-0563
UjBJJSOJDJIAl

DSTO-TR-0563
CD Q.
Z OS
CO
*<Ä c8 < T- O
CO 5 « Q. < H
s m
Is! o ^r 5 „ Q.
^
nses
w
ee
o w a o) w c £f 0) • O) CJ) 3 » (0 ^ O a, .. W
OQ °S
g>8 3 O)
U!EJ)soj3i|/g
DSTO-TR-0563
CO Q.
ffl
UIBJJSOJD1W
DSTO-TR-0563
m Q.
5 o ;*. m 'S ^
^, n- ^, (0 O 00 Q. A) 00 ^ 10 o>
c ■«-
m re
spo
g te
st
0) = a) 5 3 "* ffi -1 0 Q£ .. < *■ *-"
CD 0) w 3 O)
UIB4SOJ3IVÜ
DSTO-TR-0563
oo
CO (0 IK 0) i
O) 10 c o> n a 4) a 8> <
(0 (0 a)
O) 1- c -i a:
CO s 3 o < 1_ ^^ (0 • > O)
a> 2 <r> — m U) d
M
SdllAI
00 (O
— o N s ** 1
C I _l -1
5 25 a o> ä? t o ^ o t~ T- o CD ^i to c o a
O) 0)
■D CO to 0) U)
08 TO ^r 3 ^- CD K O to
CM
u> <o m *r- © i
3 O)
_J
n LL.
# o <o
UJBJJS0J3IW

DSTO-TR-0563
0) VL
Is O) — C "C (0 a a< 4) ** 0) <0
(0 ^
•5 2 * < «> i 3 JL. o
5^ ■ (O
(0 ? !2 Q. CD ofl s Q. to
s 5- m
49 t
o D
LL
*" S5 o§ a» T- w *^ c -c
espo
de
g.
fc. to 0) U) jjcö « ■* o ^
8 8 «) (O k- T- 3 ■ £>_. U. _l
a £ o CO
ujEJisojaji/y
DSTO-TR-0563
B2: AFP AS location W3, Channel 1, DADTA Items 87,87a.
DADTA Item 87
From Reference 1, the following load to stress equation was assumed for DADTA Item 87:
a@ DADTA item 87 (psi) = 0.004828 x WPBM (in-lb)
DADTA Item 87a
Also from Reference 1, the following load to stress equation was assumed for DADTA Item 87a:
O® DADTA Item 87a (pSl) = 0.001705 X WPBM (Ül-lb)
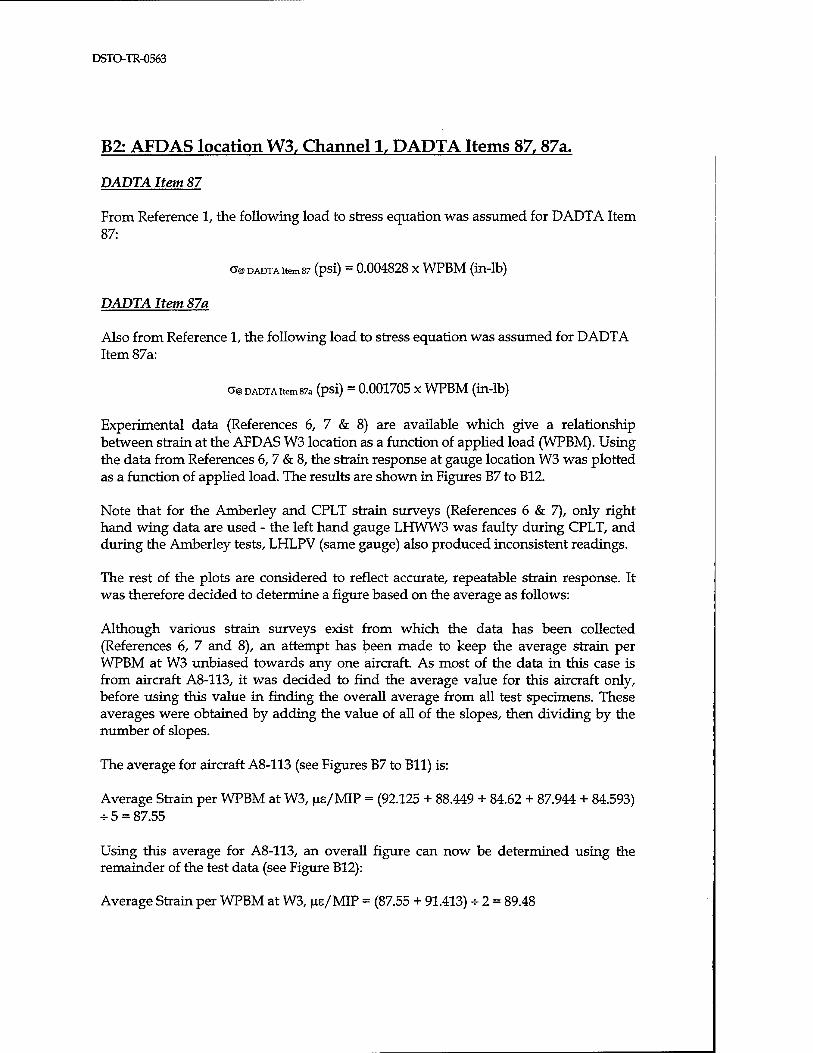
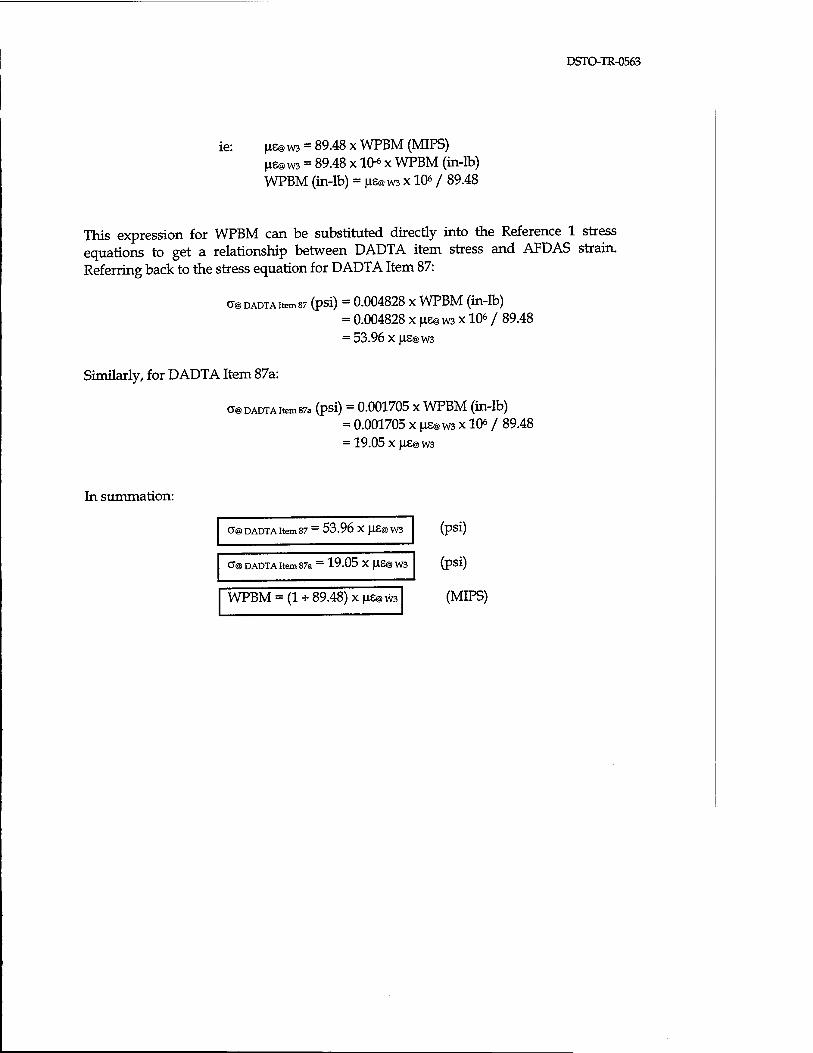
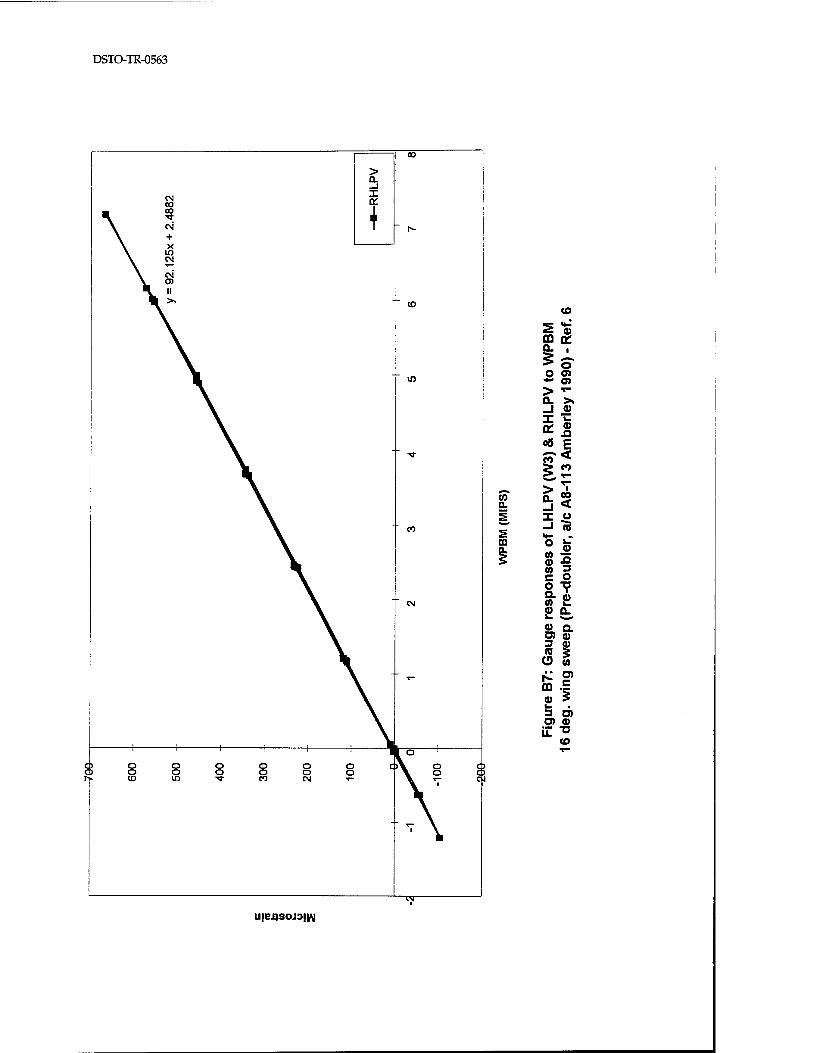
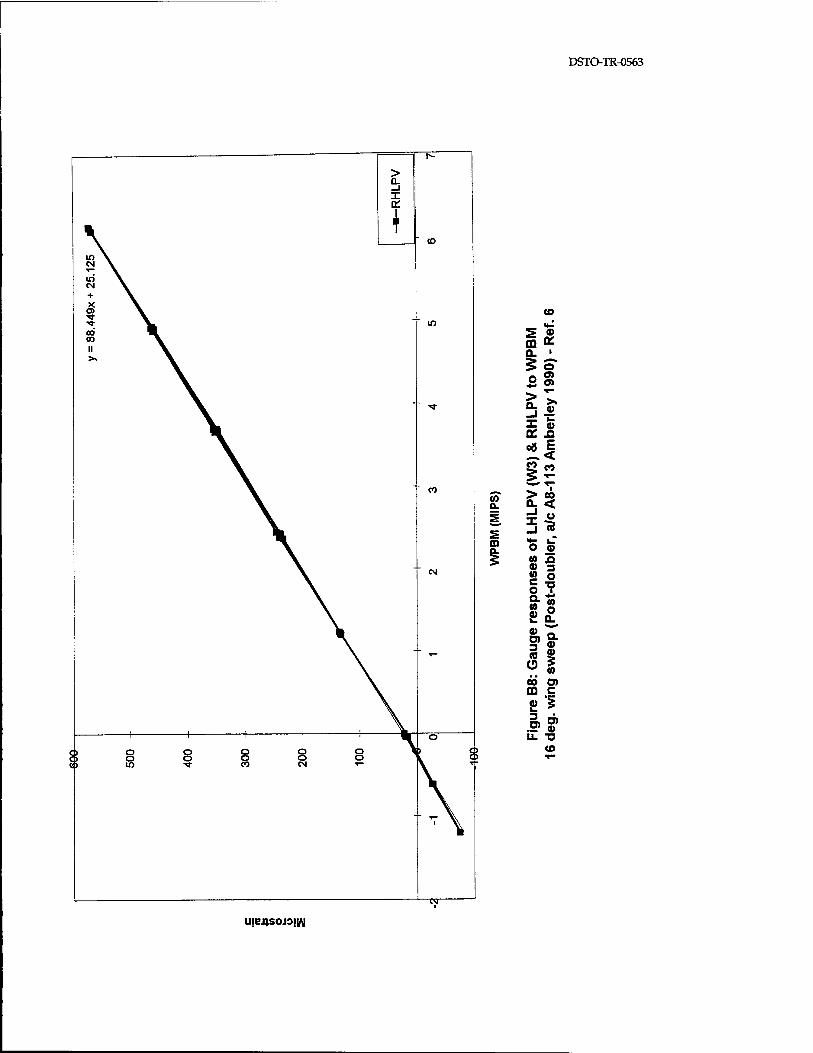
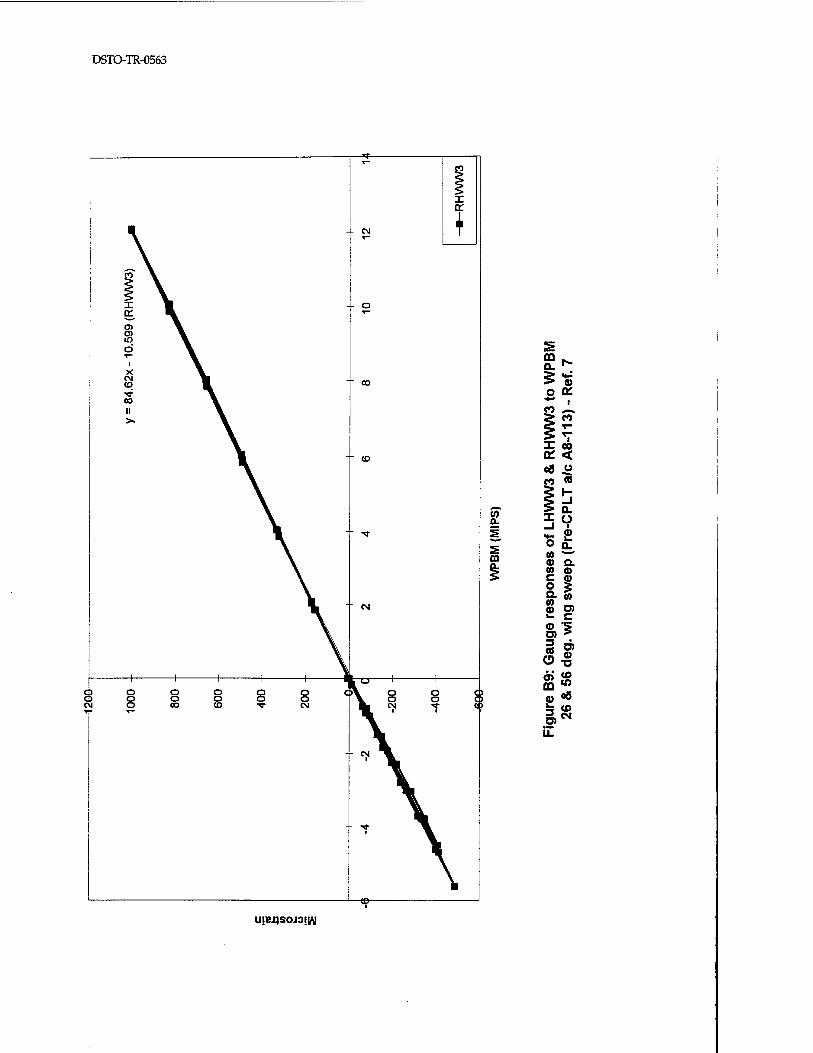
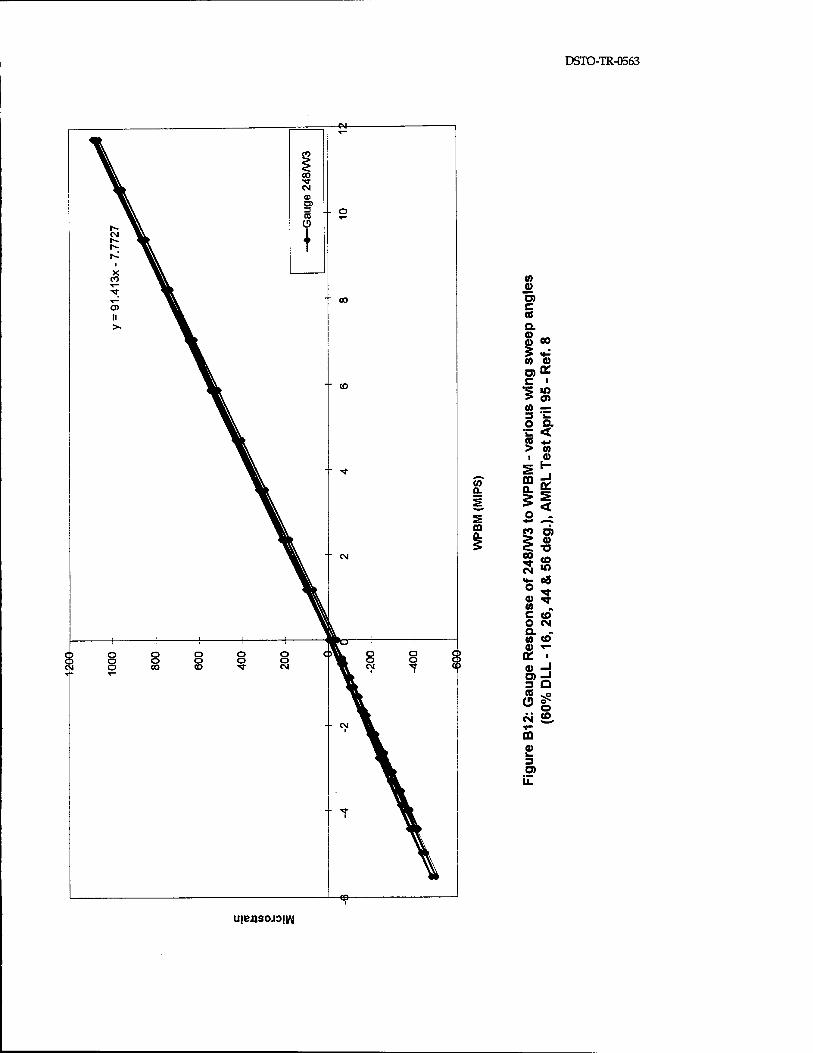
Experimental data (References 6, 7 & 8) are available which give a relationship between strain at the AFDAS W3 location as a function of applied load (WPBM). Using the data from References 6, 7 & 8, the strain response at gauge location W3 was plotted as a function of applied load. The results are shown in Figures B7 to B12.
Note that for the Amberley and CPLT strain surveys (References 6 & 7), only right hand wing data are used - the left hand gauge LHWW3 was faulty during CPLT, and during the Amberley tests, LHLPV (same gauge) also produced inconsistent readings.
The rest of the plots are considered to reflect accurate, repeatable strain response. It was therefore decided to determine a figure based on the average as follows:
Although various strain surveys exist from which the data has been collected (References 6, 7 and 8), an attempt has been made to keep the average strain per WPBM at W3 unbiased towards any one aircraft. As most of the data in this case is from aircraft A8-113, it was decided to find the average value for this aircraft only, before using this value in finding the overall average from all test specimens. These averages were obtained by adding the value of all of the slopes, then dividing by the number of slopes.
The average for aircraft A8-113 (see Figures B7 to Bll) is:
Average Strain per WPBM at W3, JXE/MIP = (92.125 + 88.449 + 84.62 + 87.944 + 84.593) -5 = 87.55
Using this average for A8-113, an overall figure can now be determined using the remainder of the test data (see Figure B12):
Average Strain per WPBM at W3, us/MIP = (87.55 + 91.413) -=- 2 = 89.48
DSTO-TR-0563
ie: |is@w3 = 89.48 x WPBM (MIPS) |is@w3 = 89.48 x 10⁻⁶ x WPBM (in-lb) WPBM (in-lb) = jis@w3 x 10« / 89.48
This expression for WPBM can be substituted directly into the Reference 1 stress equations to get a relationship between DADTA item stress and AFDAS strain. Referring back to the stress equation for DADTA Item 87:
0® DADTAitem87 (psi) = 0.004828 x WPBM (in-lb) = 0.004828 x ne@w3 x 106 / 89.48 = 53.96 xjas@w3
Similarly, for DADTA Item 87a:
a® DADTA item 87a (psi) = 0.001705 x WPBM (in-lb) = 0.001705 x |is@w3 x 106 / 89.48 = 19.05 x jus® W3
In summation:
0@ DADTA Item 87 — 53.96 X JLXS@ W3
0® DADTA Item 87a = 19.05 X fIS@W3
WPBM = (1 + 89.48) x ns@W3
(psi)
(psi)
(MIPS)
DSTO-TR-0563
to
£ « m a. CL ,
*o O <n ** at > *- 0. > -1 V I te * 5 08 E
S?« £2 _. T~
to Q.
P I £ -1 « I> <*- m « • 5 S2
(0 3 c o O T? S- i (0 2. 0 a. w ■_»
«> a Ö) 0) 3 0)
£ » m | k. 3 O) O) a> iZ -o
(O
UjEJ)SOJ3j|A|
DSTO-TR-0563
(O
OQ 0£ Q. ' 5o o g
LPV
Iey1
£ « £ .a OS E — < 5 <o W T-
Q. > CO OL <
s IF LH
L , a
/c
m es
of
uble
r
2 o c "5 O T
resp
P
ost
Gau
ge
swee
p
00 O) m c £ "i I»«? u. -a
to
urensoioyti
DSTO-TR-0563
ö> £
UIBJJSOJDjft]

DSTO-TR-0563
CO
CO Q.
m
UIC4SOJ3!|/\J

DSTO-TR-0563
CO 0.
5 ffi
U!B4SOJD!ift|
DSTO-TR-0563
to d) o> c CO a o> — m CO
5 *; (0 a> o>* c ■ •5 iO
» = 3 C o a c < to *J > to i a>
S1" CO 0. Sg S
!< 5 o . ffi £2 O) | 5 CÜ
5 X3
3 <S 5 «o % «8 «* 2 "* CO » C CO O CM a - to <o a> *-
OL > a> H S)=d s a (0 ^p
CN <£. T~ OQ 0) w 3 O) u.
uje4S0J3!i/\|
DSTO-TR-0563
B3: AFP AS location W5, Channel 2, DADTA Item 73.
DADTA Item 73
From Reference 1, the following load to stress equation was assumed for DADTA Item 73:
0@ DADTA Item 73 (psi) = 0.003572 X WBM@r|TAC=.433 (Ül-lb)
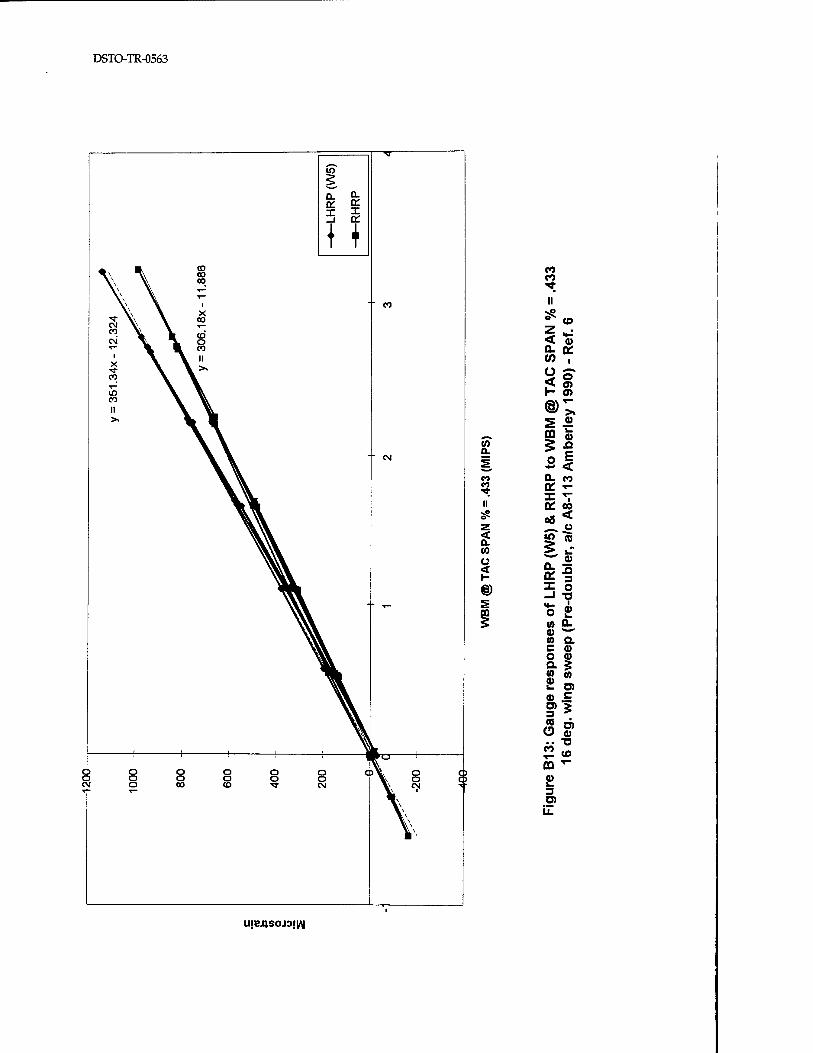
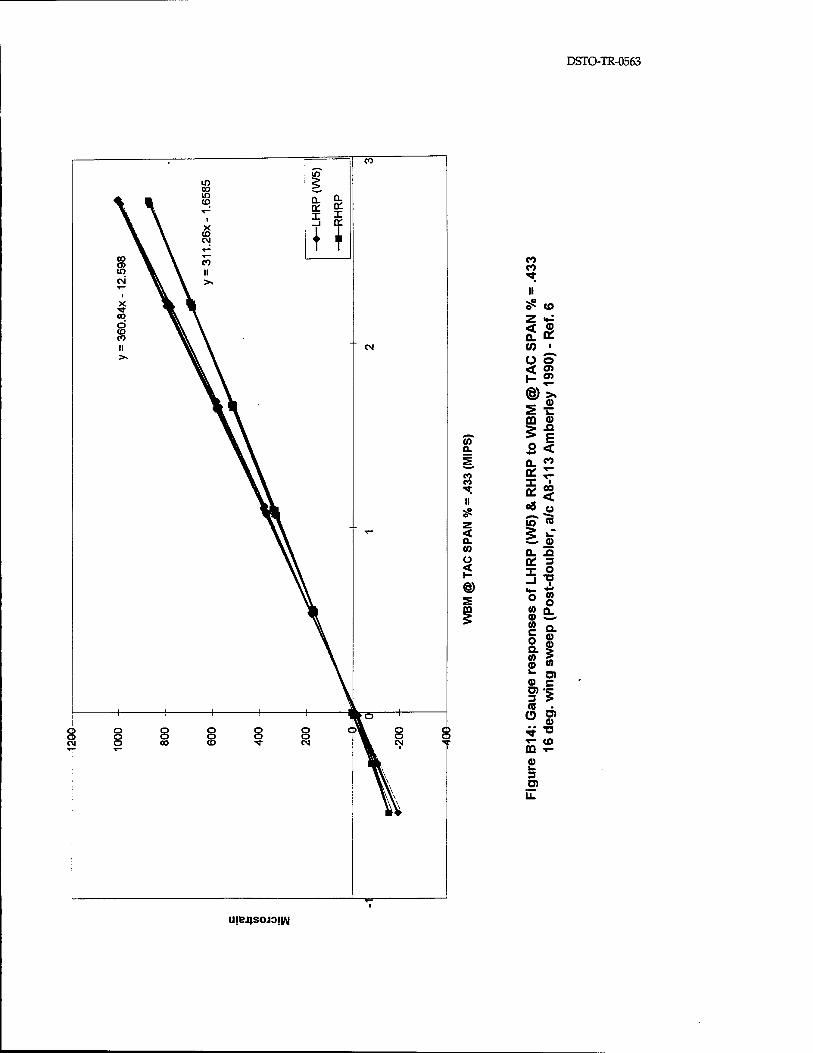
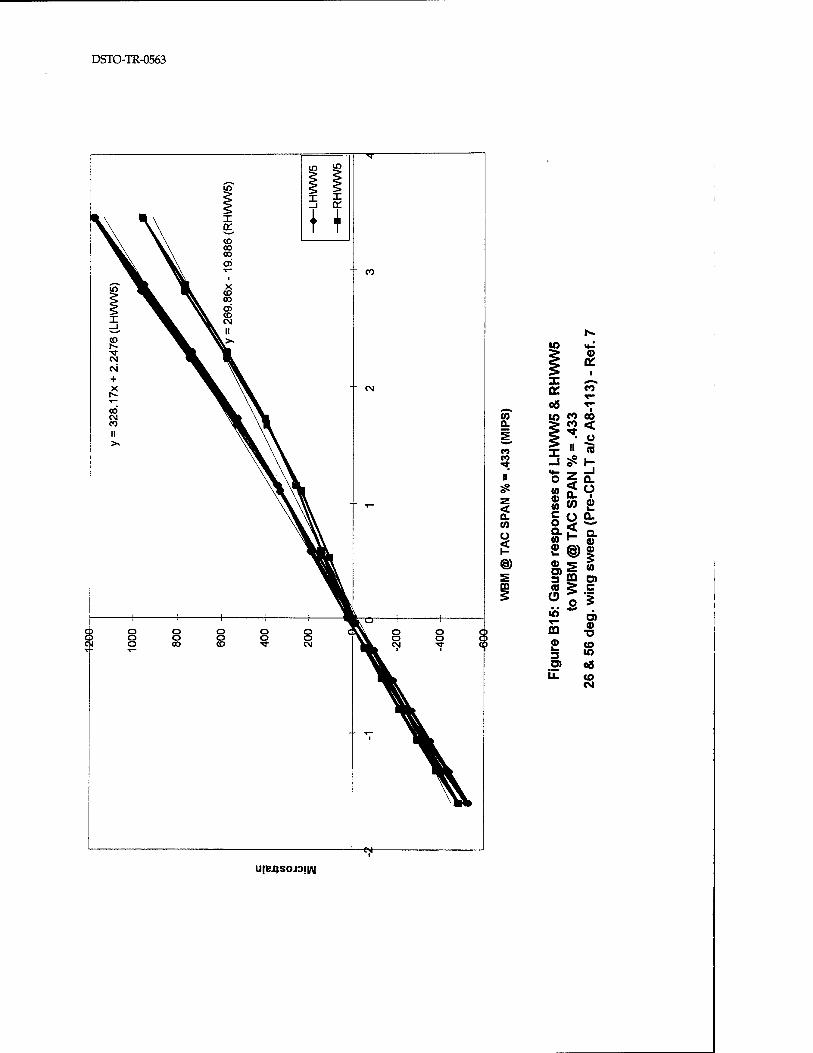
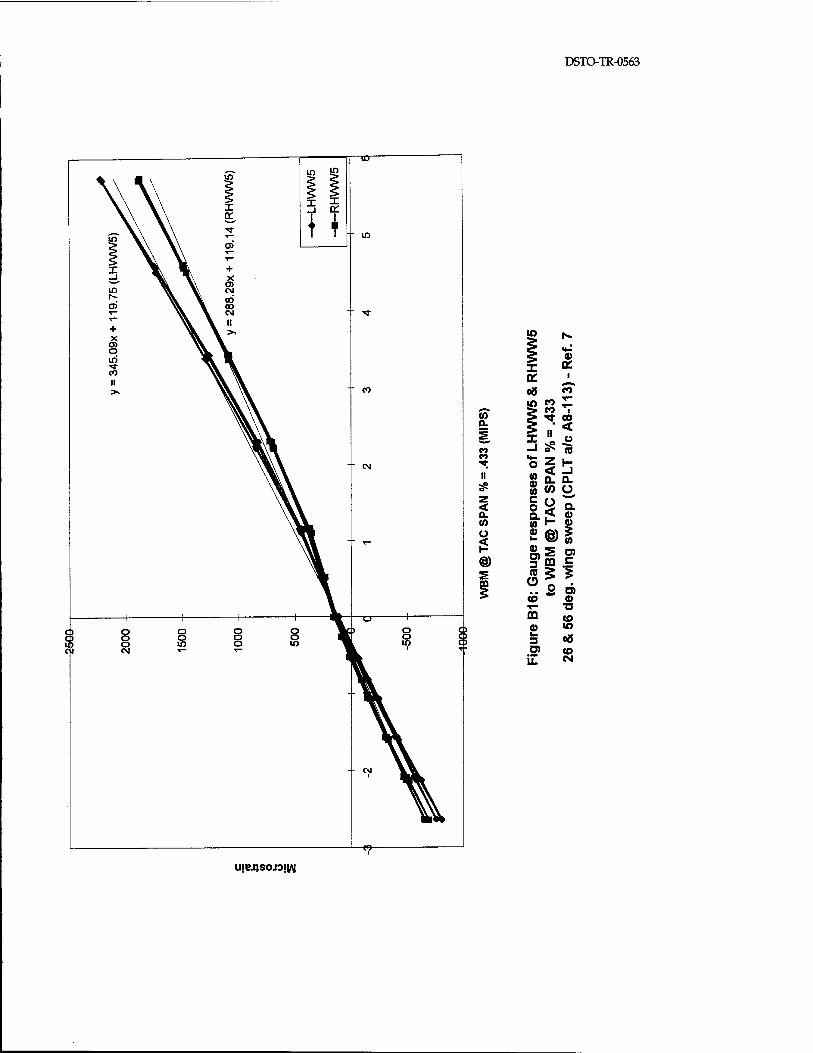
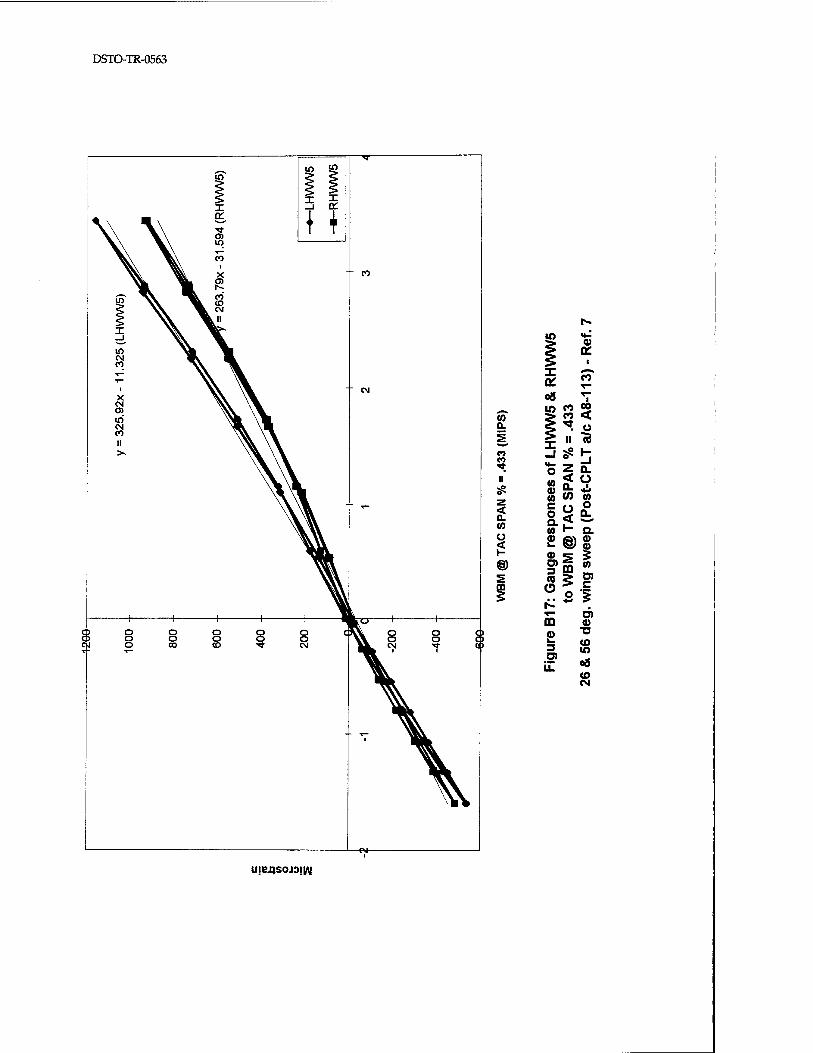
Experimental data (References 6, 7 & 8) are available which give a relationship between strain at the AFDAS W5 location as a function of applied load (Wing Bending Moment, WBM, at a percentage TAC span of 0.433). From the definition of T)TAC in the "Notation" section, this WBM occurs at a distance of 136.4 inches outboard from the pivot along the 26% chord line5. The values of WBM at this spanwise location were interpolated from the figures shown in Appendices C and D. Using these data from References 6, 7 & 8, the strain response at gauge location W5 was plotted as a function of applied load. The results are shown in Figures B13 to B18. Because of the large variability in the strain slopes (ranging from 360.84 us to 263.79 \xz), it was difficult to discern which tests might have produced erroneous results. Therefore, all test results were accepted, and like the previous AFDAS locations, it was decided to determine a figure based on the average.
Although various strain surveys exist from which the data has been collected (References 6, 7 and 8), an attempt has been made to keep the average strain per WBM@TiTAc=.433at W5 unbiased towards any one aircraft. As most of the data in this case is from aircraft A8-113, it was decided to find the average value for this aircraft only, before using this value in finding the overall average from all test specimens. These averages were obtained by adding the value of all of the slopes, then dividing by the number of slopes.
The average for aircraft A8-113 (see Figures B13 to B17) is:
Average Strain per WBM@nTAc=.433 at W5, us/MIP = (351.34 + 306.18 + 360.84 + 311.26 + 328.17 + 269.86 + 345.09 + 288.29 + 325.92 + 263.79) -10 = 315.07
Using this average for A8-113, an overall figure can now be determined using the remainder of the test data (see Figure B18):
Average Strain per WBM@rnAc=.433at W5, us/MIP = (315.07 + 324.31) - 2 = 319.69
5 Although the DADTA stress equation uses a TAC span percentage, the value of 136.4 inches from the pivot still applies to the RAAF F-lll's, which have SAC (Strategic Air Command) span wings. This would be equivalent to: T|SAC - 0.381.

DSTO-TR-0563
ie: \i£@ W5 = 319.69 x WBM@T|TAC=.433 (MIPS) |as@ W5 = 319.69 x 10⁻⁶ x WBM@T|TAC=.433 (in-lb) WBM@TITAC=.433 (in-lb) = |4.s@ ws x 106 / 319.69
This expression for WPBM can be substituted directly into the Reference 1 stress equations to get a relationship between DADTA item stress and AFDAS strain. Referring back to the stress equation for DADTA Item 73:
a® DADTA Item 73 (pSl) = 0.003572 X WBM® r,TAC=.433 (Ül-lb) = 0.003572 x |as@W5 x 10« / 319.69 = 11.17 X|IS@W5
In summation:
<7@DADTAItem73 ~ 11.17 X JXS@W5
WBM@TlTAC=.433= (1 * 319.69) X HS@W5
(psi)
(MIPS)
From the following plots (Figures B13 through to BIT) of aircraft A8-113 strain data, it can be seen that there is a noticeable amount of scatter. Not just between the two tests (Amberley and CPU), but also between the left and right wings. Both right and left wing gauges were functioning correctly at the time, although the right wing gauge was outputting strains that were approximately 15% less than the corresponding left wing gauge. There are several possible reasons that might explain these discrepencies:
- differences in gauge calibration factors; these can vary as much as up to ± 5% of the quoted value. - variability of skin thicknesses from wing to wing. - gauge placement and orientation may not be exactly in the precise location as the corresponding gauge on other wings.
The significance of this scatter is that it will obviously affect the accuracy of the average value used to calculate the ratio of strain at DADTA Item 73 to the strain at AFDAS W5. Until more strain data trends from other aircraft becomes available, it cannot yet be said whether the discrepencies so far encountered are an isolated case or a more general occurrence. The reasons for the variation in response at this AFDAS gauge location require further investigation.
DSTO-TR-0563
i Q- fe Q: £ x Z _i a:
I +
\f
CO 0.
CO CO
z
(0
3
<* II
S" to
a. a. (0 ,
m S3
S I a: T-
t£. oö
1? S. »-^
1 = ■s* to 0. a> w
to a c a> o g> Q- 5 (0 M m C O) 0) .E
*s GQ "-
£
il
UIBJJSOJDIW
DSTOTR-0563
CO co
to
< 0. (0 ■
o o < a> H o>
» >. 2
0)
m ffi £ .Q
F o < 0. CO Q: T 0£ 00
< oS u §f re 5 vT a> Q. .a £ 3 T O _l TJ
O 4-» (0 o
CO a. (1) 10 c o a (0
a CD
1 0) (0 1_ O) a> c 3 re . O O)
^ ■a T~ (O m a> k. 3 O)
UIE4SOJ3JW
DSTO-TR-0563
5 a CO
!2 2 3 > ■ o
O'D.
CO *~ © £ ® |
s G9 en
u o I fi ** ■
m
3
D) CD
CO
10 CM
U!ej}soj3i|fl
DSTO-TR-0563
(0 Q.
CO CO
a. CO u
® 5
a> X OH a: ■
08 CO
■O CO CO ^ ^ 00
^ II
< X o _J 5^ (0
o Z H < _J
10 Q- a. CO ü
c o n
Ü < a
9> n H a> 0) @ (0 0)
3 s a) CO c
(0 5 * u O)
(O 0) T" ■o CO (O a IO
3 oS O) CO
LL CM
u;ej}S0J3!V\|
DSTO-TR-0563
«
< t
UJB4SOJ0Ü/M

DSTO-TR-0563
oo
CO Q.
CO CO
< Q. CO
0) a: u> o>
CO CO >■«
** a o < II ■*•>
Z CO a>
< H a. 1 w a £ s +* < re 2 rn CÜ 0
5 ■a
5 CO
< od jo <*
><* © CO U) CM CM i^ CO o ^ 0> i
CO _l c -1 o n a CO ^ S? o
CO CO ^"•' O) (0 3 0) (0 Ü c • • re CO a m 9? f £ 3 M D) O)
LL c i to 3 o k- re >
ujej}S0J3!v\|

DSTO-TR-0563
B4: AFP AS location W6, Channel 6, DADTA Items 92a, 92b.
For this AFDAS location and DADTA items, there are two ways of deriving the transfer functions. Both make use of the same stress equations and the same experimental data, but one works in relation to WPBM and the other in relation to % CPLT load. Therefore the two methods essentially end up with the same transfer function; the slight discrepancies are attributed to rounding errors. Each method is shown here, starting with the one that refers to WPBM.
DADTA Item 92a
From Reference 1 the following load to stress equations were assumed for DADTA
Item 92a:
a@DADTAitem92a (psi) = - 0.01107 x WPBM (in-lb) (for +ve WPBM)
And,
o-@DADTAitem92a (psi) = - 0.01045 x WPBM (in-lb) (for -ve WPBM)
DADTA Item 92b
Using the same reference as above, the equations for DADTA Item 92b were as follows:
a@DADTAitem92b (psi) = - 0.02238 x WPBM (in-lb) (for +ve WBM)
And,
a@DADTAitem92b (psi) = - 0.02049 x WPBM (in-lb) (for -ve WBM)
Experimental data (References 6, 7 & 8) are available which give a relationship between strain at the AFDAS W6 location as a function of applied load (WPBM). Using these data from References 6, 7 & 8, the strain response at gauge location W6 was plotted as a function of WPBM. The results are shown in Figures B19 to B24. Note that separate slope equations have been derived for positive WPBM (caused by uploads) and negative WPBM (caused by downloads) since each loading case exhibits a different strain response. These plots are considered to reflect accurate, repeatable strain responses. It was therefore decided to determine a figure based on an average as follows:
Although various strain surveys exist from which the data has been collected (References 6, 7 and 8), an attempt has been made to keep the average strain per WPBM at W6 unbiased towards any one aircraft. As most of the data in this case is

DSTO-TR-0563
from aircraft A8-113, it was decided to find the average value for this aircraft only, before using this value in finding the overall average from all test specimens. These averages were obtained by adding the value of all of the slopes, then dividing by the number of slopes.
For +ve WFBM: The average for aircraft A8-113 (see Figures B19 to B23) is:
Average Strain per WPBM at W6, us/MIP = (-245.32 - 248.32 - 253.8 - 256.28 - 245.72 -
249.05) - 6 = -249.75
Using this average for A8-113, an overall figure can now be determined using the remainder of the test data (see Figure B24). Note that although the 1995 AMRL test wing had no upper plate doublers fitted to the WPF, the strain readings for AFDAS gauge W6 do not appear to be affected.
Average Strain per WPBM at W6, us/MIP = (-249.75 - 249.26) - 2 = -249.51
ie: us® we = -249.51 x WPBM (MIPS) us® we = -249.51 x 10⁻⁶ x WPBM (in-lb) WPBM (in-lb) = us® we x 10* / -249.51
For -ve WPBM: The average for aircraft A8-113 (see Figures B19to B23) is:
Average Strain per WPBM at W6, us/MIP = (-186.59 -182.86 - 187.11 -182.78 - 186.13 - 183.39) + 6 = -184.81
Using this average for A8-113, an overall figure can now be determined using the remainder of the test data (see Figure B24):
Average strain per WPBM at W6 (left & right wing), us/MIP = (-184.81 -176.17) - 2 = -180.49
ie: us® we = -180.49 x WPBM (MIPS) us® we = -180.49 x 10^ x WPBM (in-lb) WPBM (in-lb) = us® we x 10* / -180.49
These expressions for WPBM can be substituted directly into the Reference 1 stress equations to get a relationship between DADTA item stress and AFDAS strain. Referring back to the stress equations for DADTA Item 92a:
o@ DADTA item 92a (psi) = - 0.01107 x WPBM (in-lb) (f or +ve WPBM) = - 0.01107 x us@w6 x 106 / -249.51 = 44.37 x us® W6

DSTO-TR-0563
and,
a@ DADTA item 92a (psi) = - 0.01045 x WPBM (iii-lb) (for -ve WPBM) = - 0.01045 x ns@w6 x 106 / -180.49 = 57.90 xfxs@w6
The same exercise can be performed for the stress equations for DADTA Item 92b:
o@ DADTA item 92b (psi) = - 0.02238 x WPBM (in-lb) (for +ve WPBM) = - 0.02238 x ns@w6 x 106 / -249.51 = 89.70 xjxs@w6
and, o@ DADTA item 92b (psi) = - 0.02049 x WPBM (in-lb) (for -ve WPBM)
= - 0.02049 x us@w6 x 10* / -180.49 = 113.52 x|is@w6
It should be noted here that Reference 3 also assumes a stress equation for DADTA Item 92a that contained more variables (WSA, and WBM about the x-x & y-y axes centred at the pivot).
o@ DADTA item 92a (psi) = - 0.009894 x LH WPBM (in-lb) + 0.012762 sin(A - 3.8°) x LH WBMXX (in-lb) + 0.012762 cos(A - 3.8°) x LH WBMyy (in-lb)
This equation can be further reduced to the following form:
a® DADTA item 92a (psi) = - 0.009894 x LH WPBM (in-lb) + 0.012762 x LH Wing Pivot Torque (in-lb)
which makes it independent of WSA. Using the values of WPBM and Wing Pivot Torque (WPT) from CPLT, the equation can be simplified further still (even more than Reference 1, which has separate equations for the upload and download). The following demonstrates how the WPT can be expressed as a function of WPBM, and then substituted into the equation. Note that WPT was calculated using the wing diagram from Appendix C.
This assumes a constant proportion of WPT to WPBM which may not always be the case. However, it is expected that WPT will always be at least an order of magnitude lower than WPBM and therefore any variability in the WPT/WPBM ratio will have a small effect on the overall result.
DSTO-TR-0563
At 100% CPLT. A = 26° and 56° (+7.33g): WPBM = 19.5872 MIPS WPT =-1.0488 MIPS .-. WPT - WPBM = -0.05355
:. a@DADTAitem92a (psi) = - 0.009894 x LH WPBM (in-lb) + 0.012762 x -0.05355 x LH WPBM (in-lb)
/. C@DADTA Item 92a (psi) = - 0.0106 X LH WPBM (in-lb)
The same exercise can be performed for the other two CPLT load cases. That is:
At 100% CPLT. A = 56° f-2.4gV. WPBM =-7.378 MIPS WPT = 0.345 MIPS .-. WPT H- WPBM = -0.0468
/. C@DADTAItem92a (psi) = - 0.009894 X LH WPBM (kl-lb) + 0.012762 x -0.0468 x LH WPBM (in-lb)
a@DADTAItem92a (psi) = - 0.0105 X LH WPBM (in-lb)
At 100% CPLT, A = 56° (-2.4g): WPBM =-9.2226 MIPS WPT = 0.295 MIPS .-. WPT + WPBM = -0.032
.-. o@DADTA item 92a (psi) = - 0.009894 x LH WPBM (in-lb) + 0.012762 x -0.032 x LH WPBM (in-lb)
0@DADTA Item 92a (psi) = - 0.0103 X LH WPBM (in-lb)
The above three coefficients are very similar, indicating that the stress is a function of wing pivot bending only. An average of the three coeffiecients (-0.0106, -0.0105 & - 0.0103) can be taken to give a value of -0.01047. This compares favourably with the values from Reference 1 (-0.01107 & -0.01045).
The complexity of the Reference 3 equation has been shown to be superfluous, as it has been demonstrated that it can be reduced to the same format as those equations presented in Reference 1. Because of this, and the similarity of the coefficients, only the
DSTO-TR-0563
Reference 1 calculations will be presented in this report. Note that Reference 3 does not have an equation for DADTA Item 92b.
The second method of deriving the transfer functions, using % CPLT load rather than WPBM, will now be presented:
The values of WPBM for the corresponding percentages of CPLT load are entered into the above Reference 1 equations, enabling a plot of stress versus % CPLT load to be formulated. The curves are plotted in Figures B25 and B26.
From the strain surveys (References 7 & 8), plots of strain versus % CPLT load were also produced for comparison with the stress plots. The CPLT case generated four curves, and the corresponding wing sweep angles from the AMRL April 1995 test were also chosen to generate four curves (ie: 26° WSA upload, 26° WSA download, 56° WSA upload and 56° WSA download). As expected, the 26° and 56° upload curves were very close, so an average of these two was used - thus resulting in three overall curves.
It is important to note for the plots of strain versus % CPLT load, that there is an "artificial" reason for the different slopes for the download cases. Although the same strain data is being used (as that plotted against WPBM), the different slopes arise due to the fact that the % CPLT load is either a percentage of -2.4g or -3.0g.
Now, the ratios of stress at DADTA Items 92a and 92b to strain at AFDAS W6 for the corresponding cases are as follows. (See Figures B27 to B30 for reference to the values):
26° WSA download:
As done previously, an average for aircraft A8-113 will be determined:
Average strain per % CPLT load, us/%load = (-17.156 -17.268 -17.139) - 3 = -17.188
Using this average for A8-113, an overall figure can now be determined using the remainder of the test data (see Figure B30):
Average strain per % CPLT load, us/%load = (-17.188 -16.417) 4- 2 = -16.803
From Reference 1 and Figure B25, the stress of DADTA Item 92a per % CPLT load, psi/%load =-963.76
So, the stress to strain ratio = (-963.76 -s- -16.803) = 57.36
Therefore, a@ DADTA item 92a = 57.36 x us® W6 (psi)

DSTO-TR-0563
From Reference 1 and Figure B26, the stress of DADTA Item 92b per % CPLT load, psi/%load = -1889.7
So, the stress to strain ratio = (-1889.7 - -16.803) = 112.46
Therefore, a@DADTAitem92b = 112.46 x us@w6 (psi)
56° WS A download:
The average for aircraft A8-113 will be determined:
Average strain per % CPLT load, ue/ %load = (-13.509 -13.667 -13.58) - 3 = -13.34
Using this average for A8-113, an overall figure can now be determined using the remainder of the test data (see Figure B30):
Average strain per % CPLT load, us/%load = (-13.34 -12.854) + 2 = -13.097
From Reference 1 and Figure B25, the stress of DADTA Item 92a per % CPLT load, psi/%load = -771
So, the stress to strain ratio = (-771 -=- -13.097) = 58.87
Therefore, a® DADTA item 92a = 58.87 x us® W6 (psi)
From Reference 1 and Figure B26, the stress of DADTA Item 92b per % CPLT load, psi/%load =-1511.8
So, the stress to strain ratio = (-1511.8 - -13.097) = 115.43
Therefore, a® DADTA item 92b = 115.43 x us@w6 (psi)
26° & 56° WSA upload (combined):
The average for aircraft A8-113 will be determined:
Average strain per % CPLT load, ue/%load = (-47.78 - 48.235 - 49.382 - 50.105 - 47.656 - 48.478) - 6 = -48.61
The average from the AMRL test (Ref. 8) is:
Average strain per % CPLT load, UE/ %load = (- 48.922 - 48.45) - 2 = - 48.69
DSTO-TR-0563
Using these averages for A8-113 and the AMRL test, an overall figure can now be determined:
Average strain per % CPLT load, us/ %load = (-48.61 - 48.69) = -48.65
From Reference 1 and Figure B25, the stress of DADTA Item 92a per % CPLT load, psi/%load =-2168.3
So, the stress to strain ratio = (-2168.3 -e- -48.65) = 44.57
Therefore, a® DADTA item 92a = 44.57 x us® W6 (psi)
From Reference 1 and Figure B26, the stress of DADTA Item 92b per % CPLT load, psi/%load =-4383.6
So, the stress to strain ratio = (-4383.6 + -48.65) = 90.10
Therefore, a® DADTA item 92b = 90.10 x us@w6 (psi)
In summation:
O® DADTA Item 92a = 57.36 X US® W6
a® DADTA Item 92b = 112.46 x us@w6
O"® DADTA Item 92a = 58.87 x us® W6
CJ@ DADTA Item 92b = 115.43 x us@w6
<J@ DADTA Item 92a : = 44.57 x us@w6
O® DADTA Item 92b = 90.10 x us@w6
Altei matively,
0"@ DADTA Item 92a = 44.37 x us® W6
O"® DADTA Item 92b = 89.70 x us® W6
0"@ DADTA Item 92a = 57.90 x us@w6
C@ DADTA Item 92b = 113.52 x us@w6
(psi)(Ref. 1,26° WSA download)
(psi)(Ref. 1,26° WSA download)
(psi)(Ref. 1,56° WSA download)
(psi)(Ref. 1,56° WSA download)
(psi) (Ref. 1,26° & 56° WSA upload)
(psi)(Ref. 1,26° & 56° WSA upload)
(psi) (for +ve WBM)
(psi) (for +ve WBM)
(psi) (for -ve WBM)
(psi) (for -ve WBM)

DSTO-TR-0563
A comparison of the DADTA Item 92a stress coefficient for the upload case for the Reference 1 equation (44.57) agrees very well with the figure of 44.37 derived from the +ve WBM cases. The average of the stress coefficients for the download cases for the Reference 1 equation is: (57.36 + 58.87) -r 2 = 58.12, which also compares quite favourably with 57.90 derived from the -ve WBM cases.
As for the DADTA Item 92b stresses, the value of the upload case for the Reference 1 equation is 90.10. This is very close to the value of 89.70 derived from the +ve WBM cases. The average of the stresses for the download cases for the Reference 1 equations is: (112.46 + 115.43) H- 2 = 113.95, as compared with 113.52 derived from the -ve WBM
cases.
It is therefore considered reasonable to take the average of all the figures quoted above to obtain figures for positive WBM or upload (for all WSA) and for negative WBM or download (also for all WSA). This gives the following:
O® DADTA Item 92a = {(44.57 + 44.37) - 2} X HE@W6
(psi)(for upload or +ve WBM, all WSA) 0@ DADTA Item 92a = 44.47 X \\Z@ W6
0@ DADTA Item 92a = {(58.12 + 57.90) H- 2} X ^S@W6
am DADTA item 92a = 58.01 x |*s® we (psi)(for download or -ve WBM, all WSA)
O® DADTA Item 92b = {(90.10 + 89.70) v2}x \IE@W6
a® DADTA item 92b = 89.90 x ^s® we (psi) (for upload or + ve WBM, all WSA)
O® DADTA Item 92b = {(113.95 + 113.52) + 2} X ^IS@W6
a® DADTA item 92b = 113.74 x fxs® we (psi) (for download or -ve WBM, all WSA)
Also, from the earlier results,
' (MIPS) (for +ve WBM) WPBM = -(1 + 249.51) x us® we
WPBM = -(1 -180.49) x ne@w6 (MIPS) (for -ve WBM)

DSTO-TR-0563
to
(0 Q.
ffl
a> £ #»* o
s 0) a> m
0. 5 o ID
13 CO E X < > CO Li. ^ tt >*- 00 O < 9) o m c re o Q. <» (ft a> n ill 3 (i) O O) ■a 3 *i. (0 » Ü o
0. O) *■"*
*— a en V a> £ £ 3 to O) D)
LL C
1 O) a>
■a CO
uiej)S0J3jLM

DSTO-TR-0563
CO
CO a.
m
cu 0Z
5 o cu o> Q. o> 5 o a>
i a>
E o < ■<r- CO X > T-
u. 00 _l < •^ o o CO (0 CO c o Q. n CO a 0) o £. ■o 0) ■4-" D) CO 3 o n 0. O *-*
a o 0) M 9 m £ « CO i_ D) j r O) il
O) a>
XJ CO
uiej}soj3i|/\|
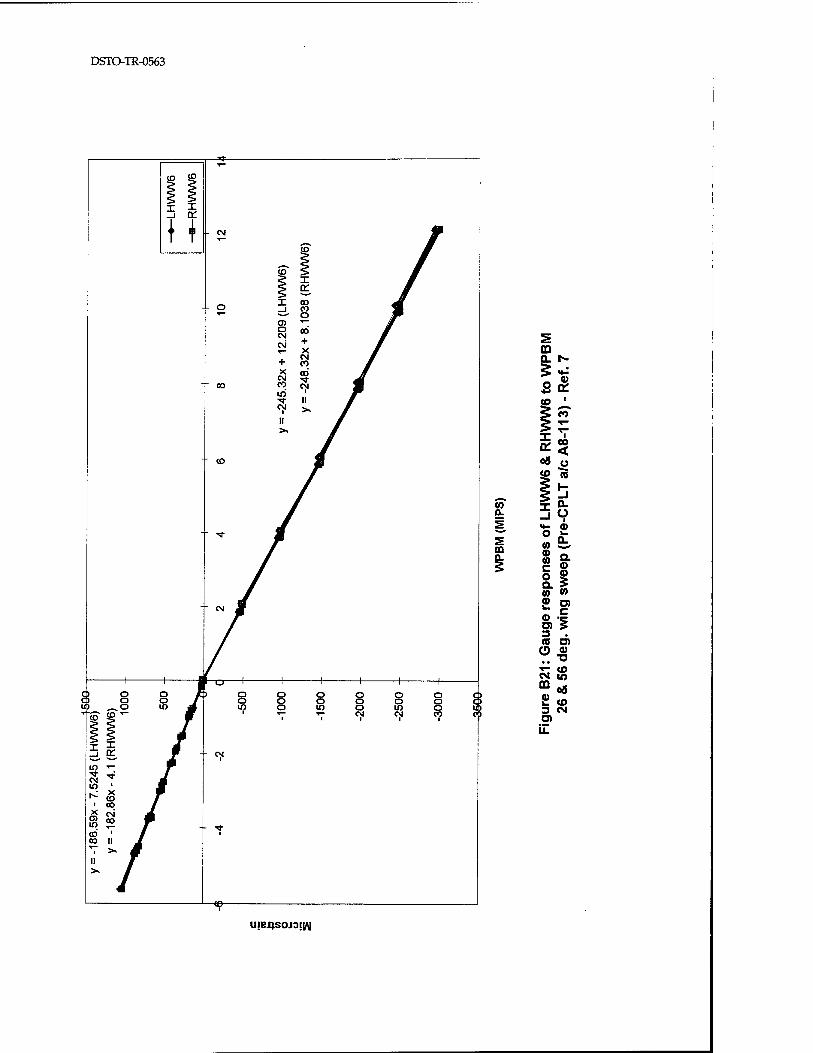
DSTO-TR-0563
o o o o o o o o o o m o 10 o m 1 ■*— *~ CM CM
oö o g « > 1-
OT § _l X ft a J 9 5 «*- fl) ^"" o 2. s m
pons
es
wee
p (P
(0 w £ TO 0) ~
3 IB O)
CD a) „ "O r: <o <N io
?« £ CD 3 CM O)
uie4soj3;i/\|
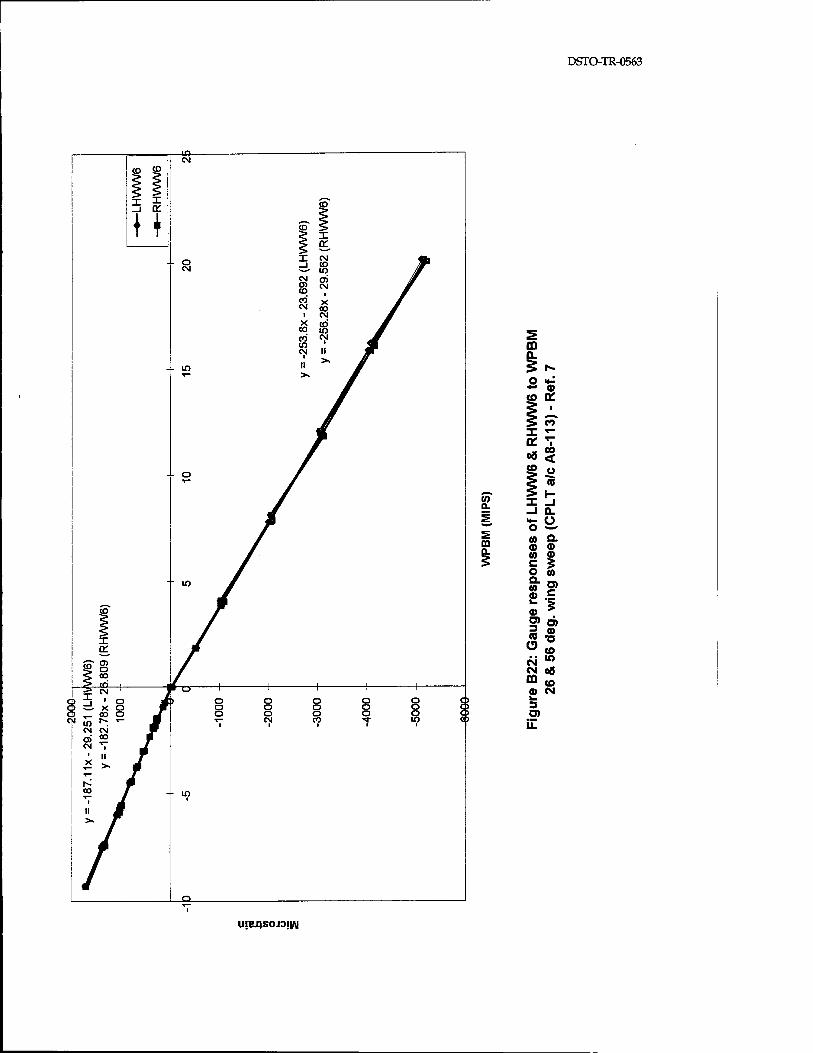
DSTOTR-0563
n
W Q.
m
U1E4S0JDIW

DSTO-TR-0563
£- > 0) o oc *- 1
«o ^~. ££ «5 V X 00 oc < 08 "i to (B
g: I-; <n £o! a. x. O s -J .i
t w s o o m Q.
CO 0- 0) "—■
5 CO Q. C 0) O CD 9- 5 2> co fl> _1 1- Ö)
§>5
Ö 0? ■• TJ
CM f2 CQ «> a) 08
3 tO
UIBJ;SOJOIW
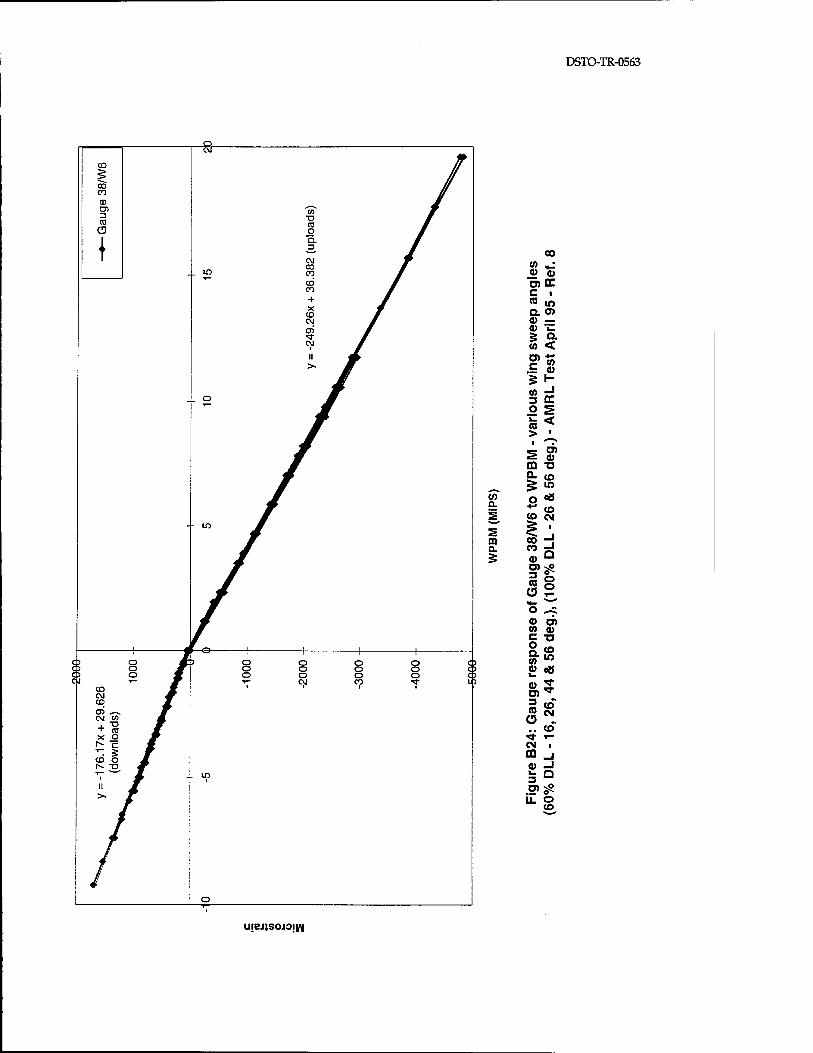
DSTO-TR-0563
oo O) ,J a> o en DC c ■ CO if) Q. O) 0> — <u ~ 5 S- (0 <
.E a> 5 H o d 3 OC .2 S >- < > ■
1 ^*
5 a> CQ "O
S: «o ^^ £ w a. o <*
** co £s CO CM
ffl a 38
/W
ILL
- 5 o) a
Gau
g 10
0%
o ^ 0) O) CO 0) C TJ
« o8
8,5 i » CO rvi
.. CO "5f T~ CM ■ m j 0) -i 5°
.EPS5
u. o CO
uiejisojojifl

DSTO-TR-0563
CO
4t *" Jtä «*J > <D u. cc ® E ■o £ ro *■
° c *- ST J » 0. (0 o s c *i v CO o ^ *- CO CD "
•D Q. i- <0 O eo o
92a
t a/
c A
y- _i a ü E h- A« 0) _J
Ä 0.
< 9. §£ < s Q 3 •»- CO
° o> «0 c CO ~ v 3
o 5? .. fl> m "O CJ to CD in © oS 3 tO O) CM
LL
(jsd) ssajis
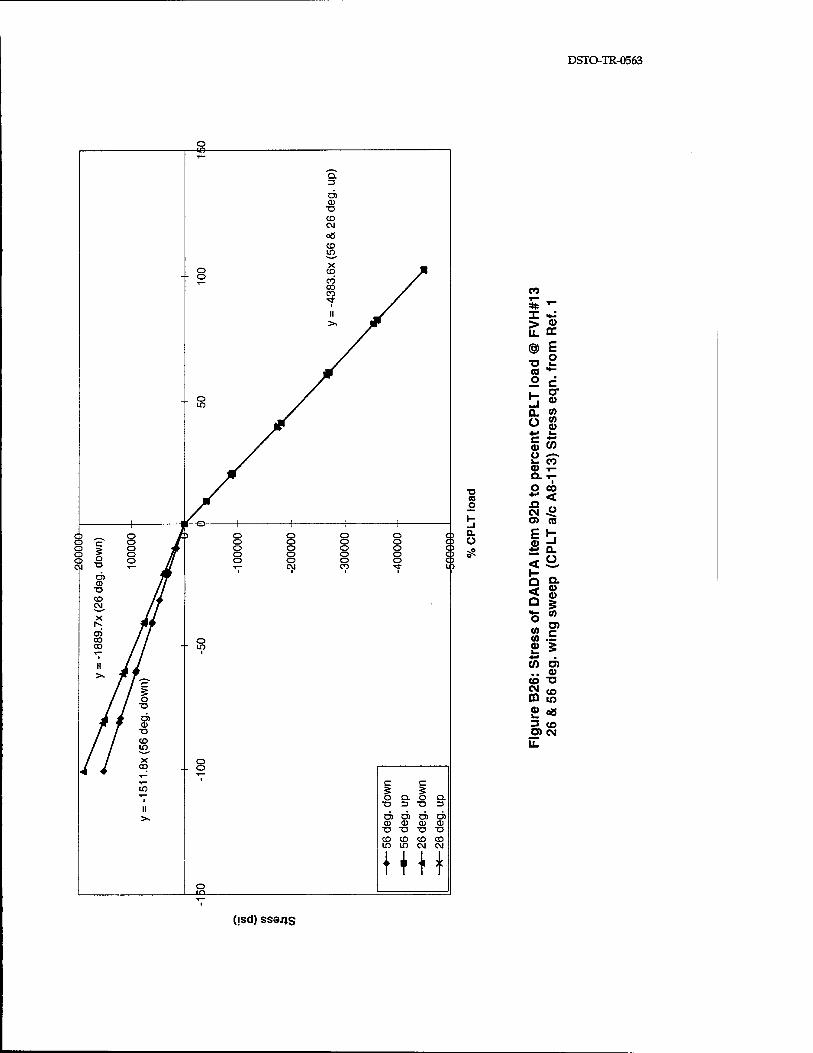
DSTO-TR-0563
ii
o
o in
c c O CL O
■O 3 T3
O) O) O) O) 0) 0) (D <D
"O "O "O "O CO CD CD CD w in (M CM
CO
O O O C3 O L>
* T" X M-: > A IL CC (§> E _ o •o >- to ••- o c 1- °" a. CO O CO *•> »- 5 en o •—»■ »- CO 0) T- Q. 7-
■o (0
O CO z < o ■° f» 1- -1
CM ^ o> CO
Q. E H o V -1 s a.
H „ O £- 3 $ Q I t CO o ' .« o> S.E £ 5 ** (/) O) .. a)
CO "a
CD in £ «8 3 CO a» CM u.
(jsd) ss3j)s
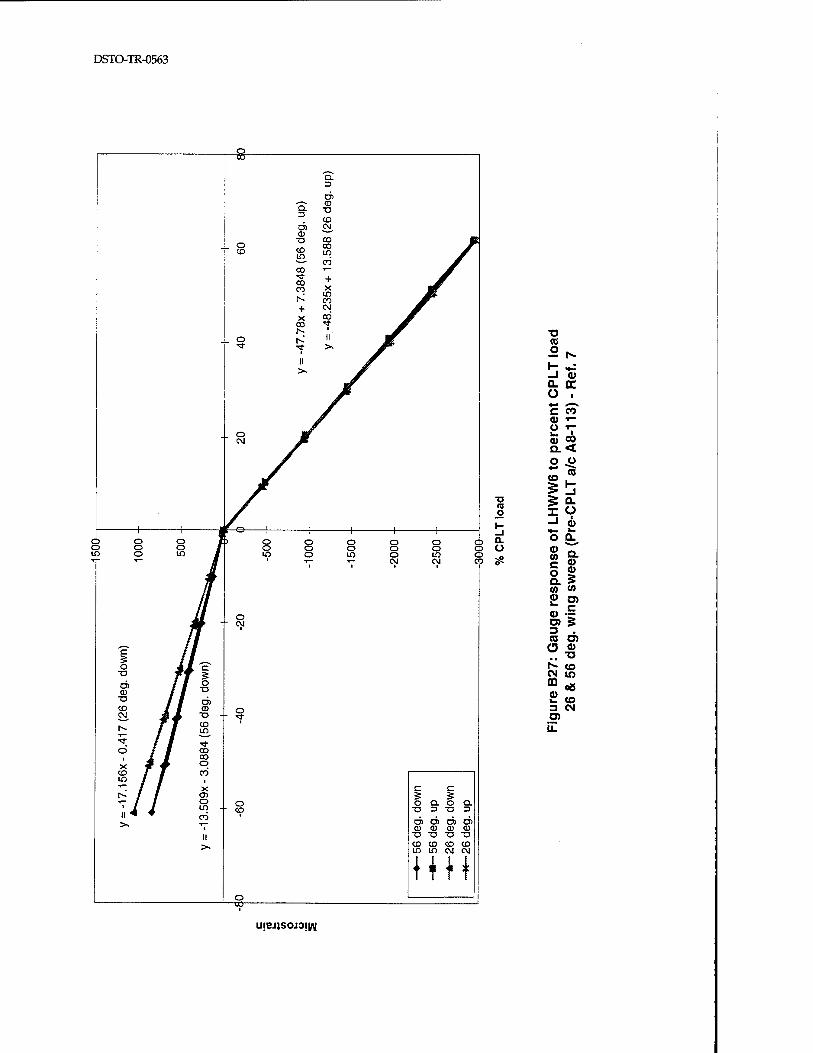
DSTO-TR-0563
XJ «S
SN h *= -1 <D Q- DC O . •*-« *—■*
C CO 0> i- " V o °9 a< o .p ._ to <o .
JÜ en O = 9 J- _i i _l 0. O
pons
e of
w
eep
(Pr
w » £ o) a> •— CO g 3 OS O) o «> 7. ^ N- CO CN m 10 Co o -~ t- CO 3 CM cn u.
ujejjsojojirti
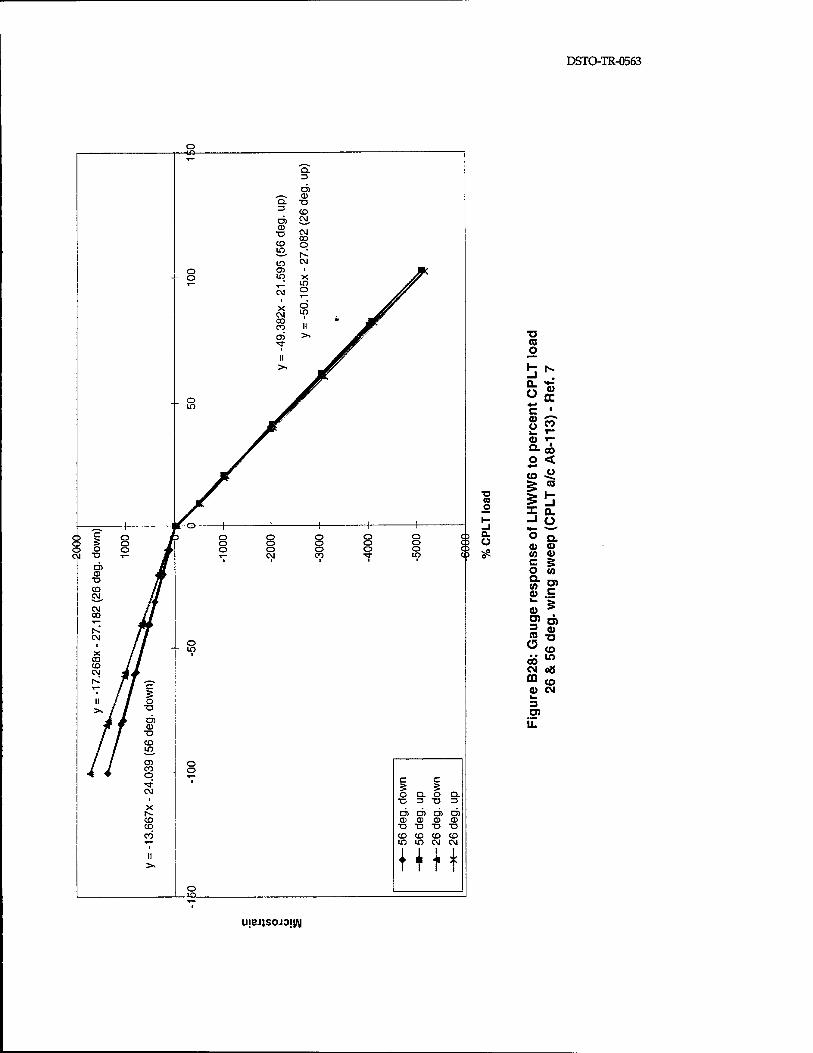
DSTO-TR-0563
CO CO CO
n
o -iß-
o If)
c Q. O 3 -o
O) o> O) O) CD 03 CO CD ■u X3 -a -o
CD CD CD CD in in CM cu
HH
■o
o
c Ü CO
o C3 C3 Cl3
«0 o
Q. Ü
0) T-
Q-oö o<
is -J Ü
O Q. tt> a> (0 v o w
I? s * 5> ri> m «>
^ to «5 w
CM 00
a> CM 1_ 3 O) il
u;ej)SOJ3!i/\|
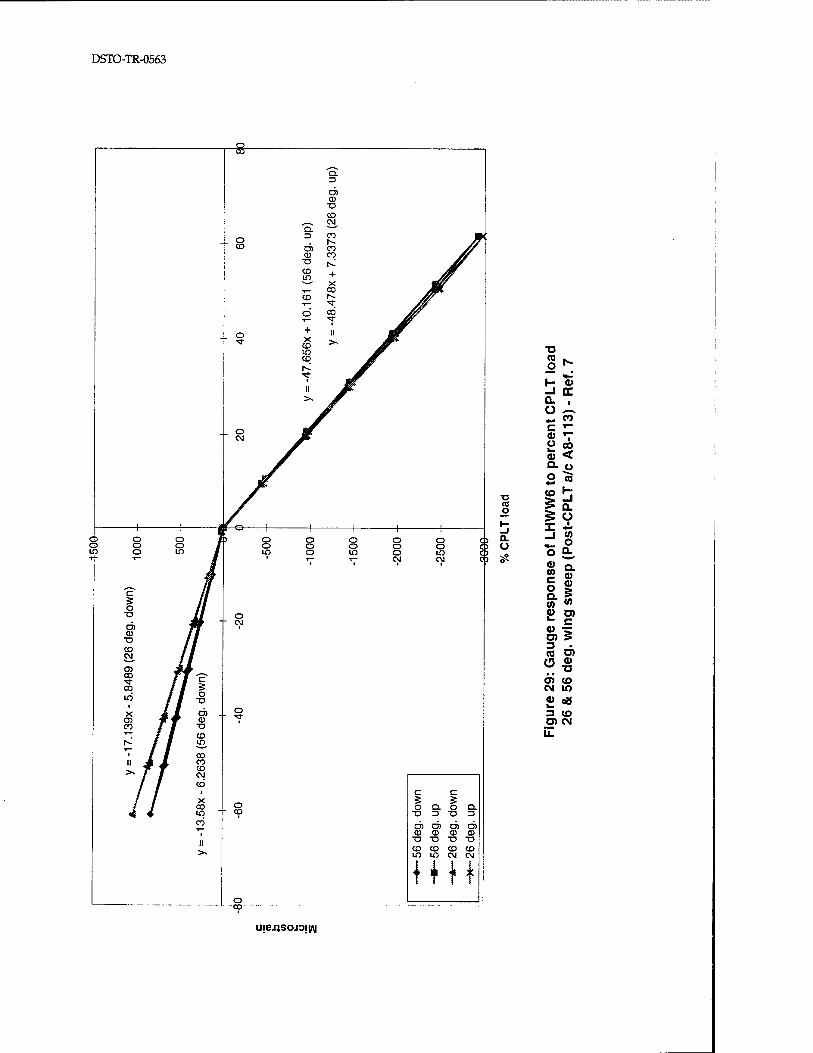
DSTO-TR-0563
o o o
II
Q. 13
O) CD
"O CO ^_^ CM
Q. ' 3 CO o 1^
CO D) CO CD CO X! i-- CD +
X -,_ CO CD r-~
■*
O CO -3-
o + II •sr CD m
CD
1
II
>*
o CM
o "CO
r c 9 5 o Q. O Q.
■o ZJ "O 3
n> O) O) O) 0) CD CD CD
■o T3 X! T3 CD CD CD CD to lO CM CM
HH
CO o
O. O
"O <0 o h-
»■
1- a> _l tt a. o ^», +* CO c T—
a> "T"
ü on V < Q. ü O «i <o H £ CL £ Ü X +* _i (0
o o Q.
a) CO c o CL 0)
Q. V tl)
(0 a> rn ■_ c
5 3 . CO o> Ö 0)
TJ o> CO CM in 0) 00 3 to g> CM
ujejjsojojiAi
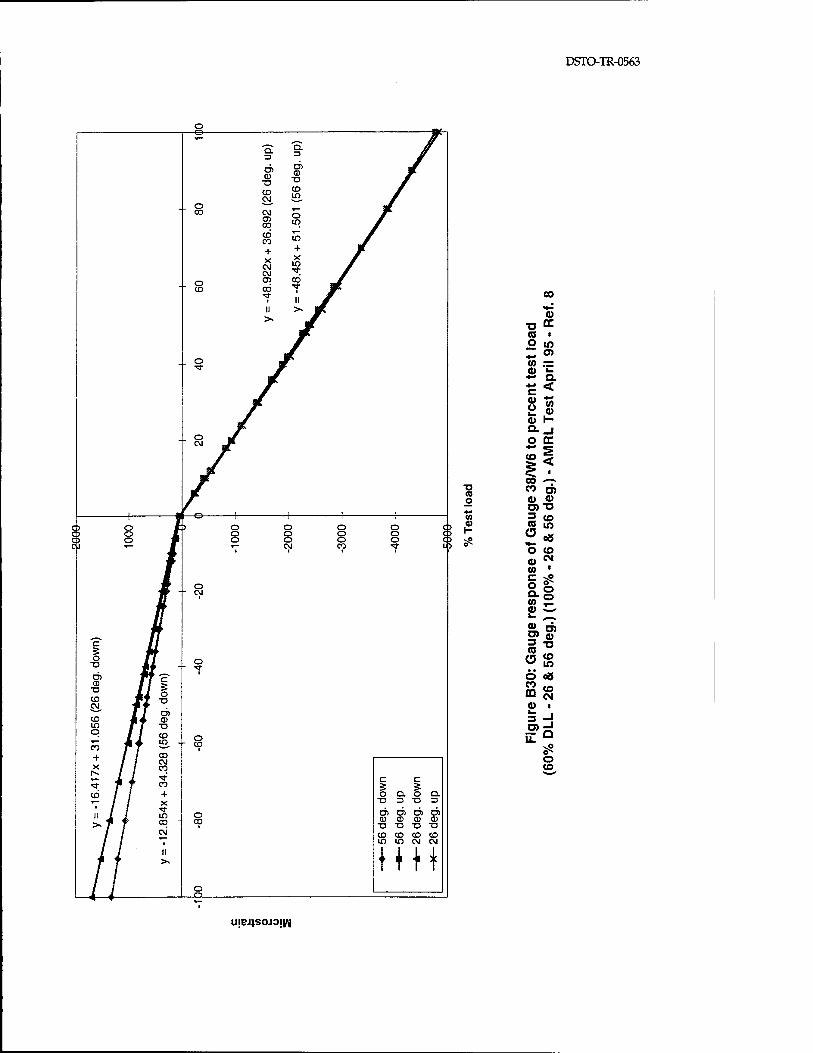
DSTO-TR-0563
c o
■o
c Q. O Q. 3X3 3
CD ■o
O) D) O) ID 0) ID TJ U T!
CD io
CO CD CO m CM CM
1
T Ht
00
<D XJ DC (0 i o *-• a» CO r^r 0) k. +* Q.
c < 0> Ü CO
0) o 1- Q. 1
CO o +■< (0
l-
O DC
|i 00 --? CO o) CU CD
3 <° 2* O CO CO N
CO ■ c aS
3 — CO (3 o CO m 0)
T3 CO m 00 CO CM
E Q
o CO
U!BJ;SOJOJW

DSTO-TR-0563
B5: AFP AS location Cl, Channel 3, DADTA Items 136,159.
For this AFDAS location and DADTA items, two methods are presented for the derivation of the transfer functions. The same approach is used in both cases, except that the load to stress equations are more complex in the Reference 3 equations (involving WPBM and WSA) as opposed to those from Reference 1 (involving only WPBM). Both methods make use of the same experimental data. Therefore the two methods essentially end up with the same transfer function; the slight discrepencies are attributed to rounding errors. Each method is shown here, starting with the simpler, Reference 1 equation.
DADTA Item 136
From Reference 1, the following load to stress equation was assumed for DADTA Item 136:
o@ DADTA item 136 (psi) = 0.004771 x WPBM (in-lb) (for WSA=26°)
and, o@ DADTA item 136 (psi) = 0.0111 x WPBM (in-lb) (for WSA=56°)
DADTA Item 159
Also from Reference 1, the load to stress equation assumed for DADTA Item 159 was:
a® DADTA item 159 (psi) = 0.009454 x WPBM (in-lb) (for WSA=26°)
and, a® DADTA item 159 (psi) = 0.01128 x WPBM (in-lb) (for WSA=56°)
Experimental data (Reference 8) are available which give a relationship between strain at the AFDAS Cl location as a function of applied load (WPBM). Using the data from Reference 8, the strain response at gauge location Cl was plotted as a function of applied load. The results are shown in Figure B31. These plots are considered to reflect accurate, repeatable strain response. Eight curves were obtained (56°, 44°, 26° & 16° WSA for uploads and the same for downloads). The strains per WPBM slopes are as follows.
+7.33 g, WSA=56°: Average strain per MIP, us/MIP = 299.8 ie: ns@ ci = 299.8 x WPBM (MIPS)
us® ci = 299.8 x 10⁻⁶ x WPBM (in-lb) WPBM (in-lb) = us@ci x 106 / 299.8

DSTO-TR-0563
C60% of +7.33 gV WSA=44°: Average strain per MIP, ^is/MIP = 268.79 Similarly, from the example shown above, WPBM (in-lb) = ne@ci x 106 / 268.79
+7.33 g. WSA=26°: Average strain per MIP, p.s/MIP = 170.5 Similarly, from the example shown above, WPBM (in-lb) = us@ci x 10* / 170.5
(60% of +7.33 g>. WSA=16°: Average strain per MIP, \is/MIP = 83.453 Similarly, from the example shown above, WPBM (in-lb) = ^s@ci x 10* / 83.453
-2.4 g, WSA=56°: Average strain per MIP, |xs/ MIP = 286.09 Similarly, from the example shown above, WPBM (in-lb) = ue@ci x 106 / 286.09
(60% of-2.4 %). WSA=44°: Average strain per MIP, ns/MIP = 207.5 Similarly, from the example shown above, WPBM (in-lb) = us@ci x 10* / 207.5
-3.0 g, WSA=26°: Average strain per MIP, ne/MIP = 79.396 Similarly, from the example shown above, WPBM (in-lb) = ns@ci x 106 / 79.396
(60% of -3.0 e). WSA=16°: Average strain per MIP, ns/MIP = 21.59 Similarly, from the example shown above, WPBM (in-lb) = ns@ci x 10& / 21.59
These expressions for WPBM can be substituted directly into the Reference 1 stress equations to get a relationship between DADTA item stress and AFDAS strain. Referring back to the stress equations for DADTA Item 136:
a® DADTA item 136 (psi) = 0.004771 x WPBM (in-lb) = 0.004771 x ns@ci x 10* / 170.5 = 27.98 x ns@ a (for WSA=26° upload)
a® DADTA item 136 (psi) = 0.004771 x WPBM (in-lb) = 0.004771 x ns@ci x 10* / 79.396 = 60.09 x\is@a (for WSA=26° download)
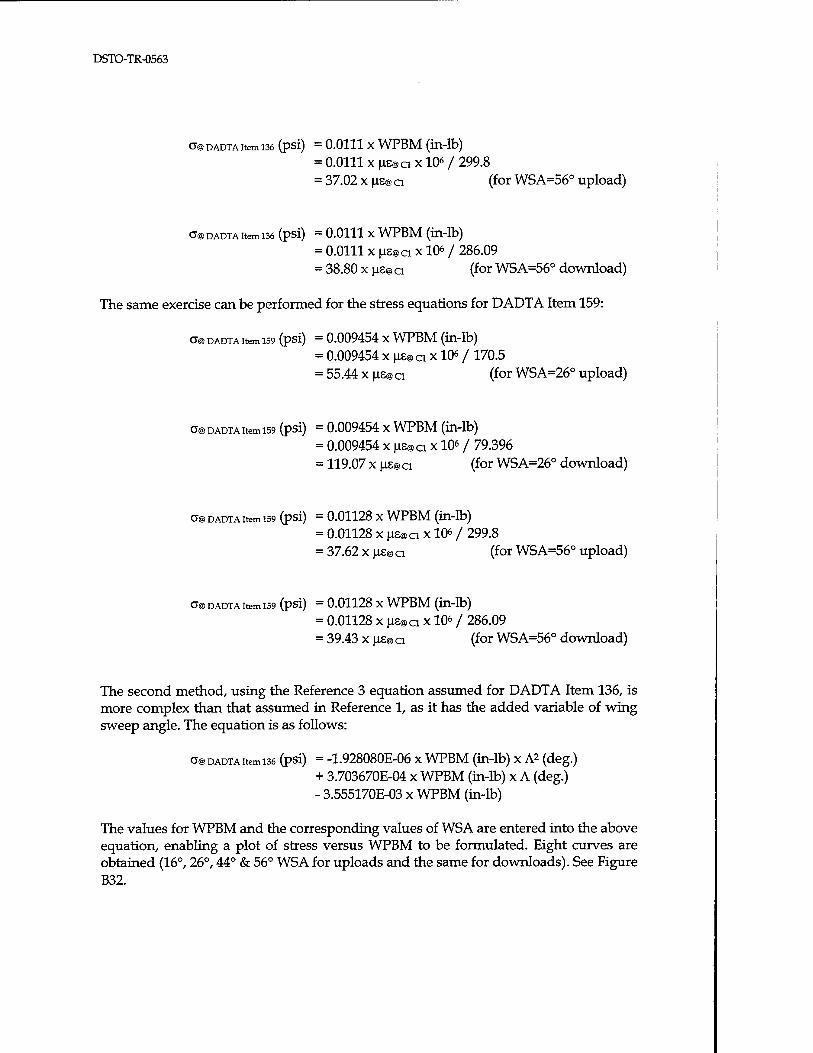
DSTO-TR-0563
a@ DADTA item 136 (psi) = 0.0111 x WPBM (iii-lb) = 0.0111 x ne@ci x 106 / 299.8 = 37.02 x ns@ a (for WSA=56° upload)
a® DADTA item 136 (psi) = 0.0111 x WPBM (iii-lb) = 0.0111 x|i£®ax 106 / 286.09 = 38.80 x ns@ a (for WSA=56° download)
The same exercise can be performed for the stress equations for DADTA Item 159:
a® DADTA item 159 (psi) = 0.009454 x WPBM (in-lb) = 0.009454 x |is@ci x 106 / 170.5 = 55.44 x \m a (for WSA=26° upload)
a® DADTA item 159 (psi) = 0.009454 x WPBM (in-lb) = 0.009454x^ax 10*/ 79.396 = 119.07 x (ise a (for WSA=26° download)
a© DADTA item 159 (psi) = 0.01128 x WPBM (in-lb) = 0.01128 x ns@ a x 106 / 299.8 = 37.62 x (xs@ ci (for WSA=56° upload)
a@ DADTA Item 159 (pSl) = 0.01128 X WPBM (Ül-lb)
= 0.01128 x ns@ci x 10« / 286.09 = 39.43 x us® ci (for WSA=56° download)
The second method, using the Reference 3 equation assumed for DADTA Item 136, is more complex than that assumed in Reference 1, as it has the added variable of wing sweep angle. The equation is as follows:
a® DADTA item 136 (psi) = -1.928080E-06 x WPBM (in-lb) x A* (deg.) + 3.703670E-04 x WPBM (in-lb) x A (deg.) - 3.555170E-03 x WPBM (in-lb)
The values for WPBM and the corresponding values of WSA are entered into the above equation, enabling a plot of stress versus WPBM to be formulated. Eight curves are obtained (16°, 26°, 44° & 56° WSA for uploads and the same for downloads). See Figure B32.
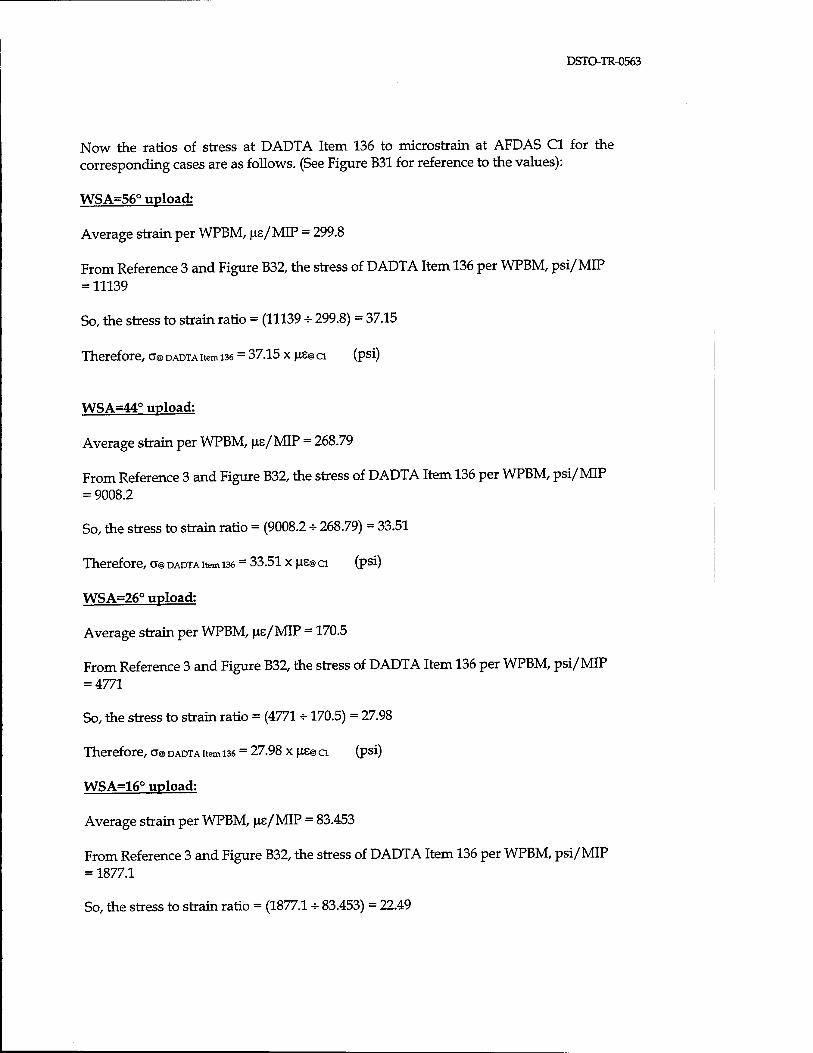
DSTO-TR-0563
Now the ratios of stress at DADTA Item 136 to microstrain at AFDAS Cl for the corresponding cases are as follows. (See Figure B31 for reference to the values):
WSA=56° upload;
Average strain per WPBM, us/MIP = 299.8
From Reference 3 and Figure B32, the stress of DADTA Item 136 per WPBM, psi/MIP =11139
So, the stress to strain ratio = (11139 - 299.8) = 37.15
Therefore, o@ DADTA item 136 = 37.15 x jus® ci (psi)
WSA=44° upload:
Average strain per WPBM, us/MIP = 268.79
From Reference 3 and Figure B32, the stress of DADTA Item 136 per WPBM, psi/MIP = 9008.2
So, the stress to strain ratio = (9008.2 H- 268.79) = 33.51
Therefore, a® DADTA item 136 = 33.51 x us® ci (psi)
WSA=26° upload:
Average strain per WPBM, us/MIP = 170.5
From Reference 3 and Figure B32, the stress of DADTA Item 136 per WPBM, psi/MIP = 4771
So, the stress to strain ratio = (4771 -170.5) = 27.98
Therefore, a® DADTA item 136 = 27.98 x us® ci (psi)
WS A=16° upload:
Average strain per WPBM, us/MIP = 83.453
From Reference 3 and Figure B32, the stress of DADTA Item 136 per WPBM, psi/MIP = 1877.1
So, the stress to strain ratio = (1877.1 -=- 83.453) = 22.49
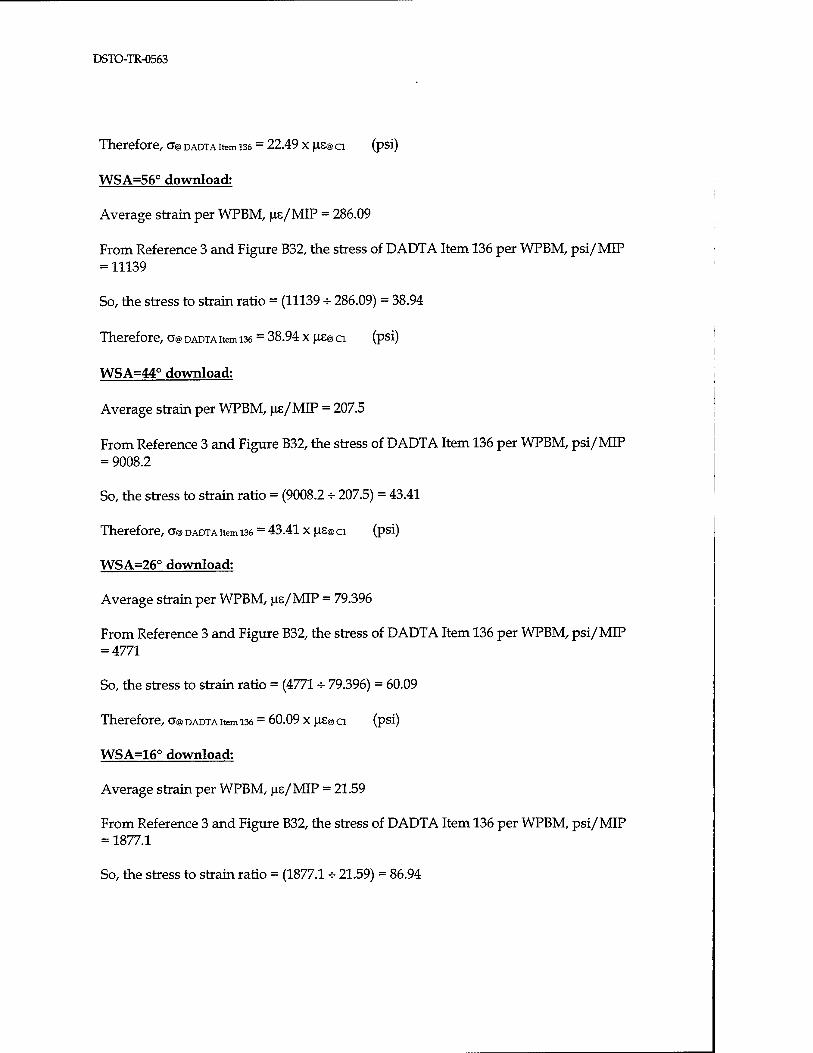
DSTO-TR-0563
Therefore, c@ DADTA item 136 = 22.49 x us® ci (psi)
WSA=56° download:
Average strain per WPBM, us/MIP = 286.09
From Reference 3 and Figure B32, the stress of DADTA Item 136 per WPBM, psi/MIP =11139
So, the stress to strain ratio = (11139 -=- 286.09) = 38.94
Therefore, a@ DADTA item 136 = 38.94 x ue@ ci (psi)
WSA=44° download:
Average strain per WPBM, us/MIP = 207.5
From Reference 3 and Figure B32, the stress of DADTA Item 136 per WPBM, psi/MIP = 9008.2
So, the stress to strain ratio = (9008.2 + 207.5) = 43.41
Therefore, a@ DADTA item 136 = 43.41 x u£@ a (psi)
WSA=26° download:
Average strain per WPBM, us/MIP = 79.396
From Reference 3 and Figure B32, the stress of DADTA Item 136 per WPBM, psi/MIP = 4771
So, the stress to strain ratio = (4771 -=- 79.396) = 60.09
Therefore, o@ DADTA item 136 = 60.09 x us@ ci (psi)
WSA=16° download:
Average strain per WPBM, us/MIP = 21.59
From Reference 3 and Figure B32, the stress of DADTA Item 136 per WPBM, psi/MIP = 1877.1
So, the stress to strain ratio = (1877.1 -=- 21.59) = 86.94
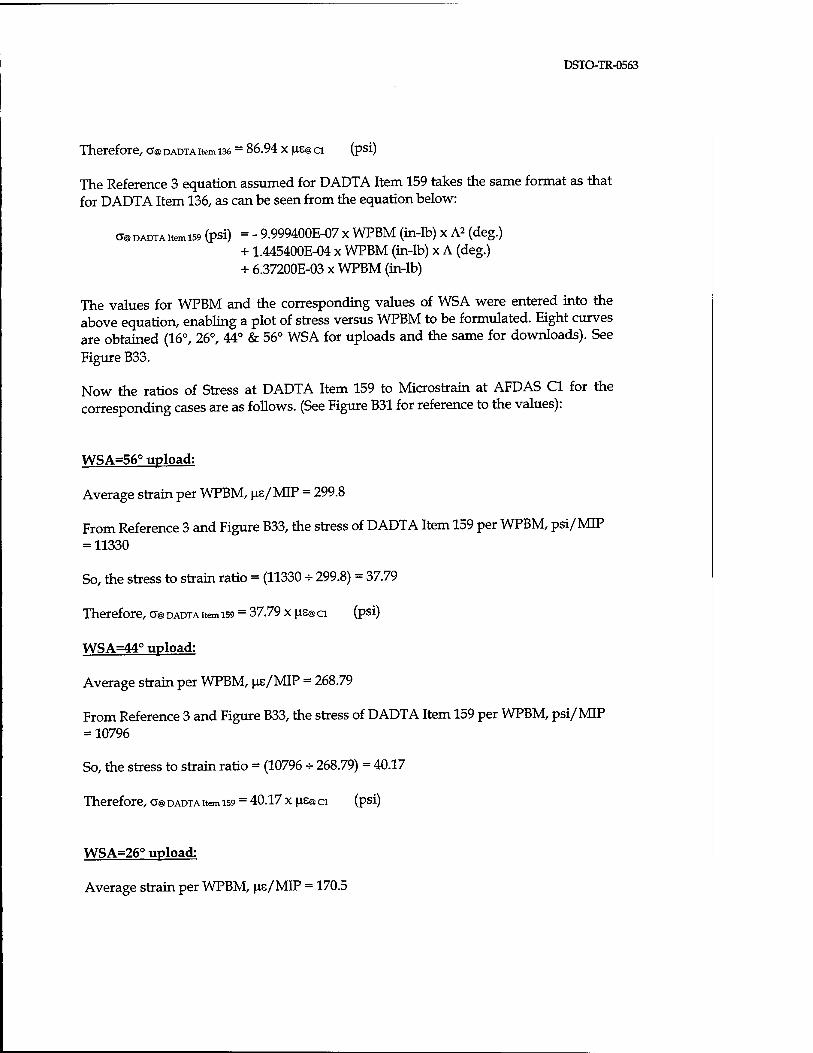
DSTO-TR-0563
Therefore, o@ DADTA item 136 = 86.94 x us® ci (psi)
The Reference 3 equation assumed for DADTA Item 159 takes the same format as that for DADTA Item 136, as can be seen from the equation below:
o@DADTAitemi59 (psi) = - 9.999400E-07 x WPBM (in-lb) x A* (deg.) + 1.445400E-04 x WPBM (in-lb) x A (deg.) + 6.37200E-03 x WPBM (in-lb)
The values for WPBM and the corresponding values of WSA were entered into the above equation, enabling a plot of stress versus WPBM to be formulated. Eight curves are obtained (16°, 26°, 44° & 56° WSA for uploads and the same for downloads). See
Figure B33.
Now the ratios of Stress at DADTA Item 159 to Microstrain at AFDAS Cl for the corresponding cases are as follows. (See Figure B31 for reference to the values):
WSA=56° upload:
Average strain per WPBM, us/MIP = 299.8
From Reference 3 and Figure B33, the stress of DADTA Item 159 per WPBM, psi/MIP =11330
So, the stress to strain ratio = (11330 + 299.8) = 37.79
Therefore, a® DADTA item 159 = 37.79 x us® ci (psi)
WSA=44° upload:
Average strain per WPBM, us/MIP = 268.79
From Reference 3 and Figure B33, the stress of DADTA Item 159 per WPBM, psi/MIP =10796
So, the stress to strain ratio = (10796 + 268.79) = 40.17
Therefore, o@ DADTA item 159 = 40.17 x us® ci (psi)
WSA=26° upload:
Average strain per WPBM, us/MIP = 170.5

DSTO-TR-0563
From Reference 3 and Figure B33, the stress of DADTA Item 159 per WPBM, psi/MIP = 9454.1
So, the stress to strain ratio = (9454.1 * 170.5) = 55.45
Therefore, o@ DADTA item 159 = 55.45 x us® ci (psi)
WSA=16° upload:
Average strain per WPBM, us/MIP = 83.453
From Reference 3 and Figure B33, the stress of DADTA Item 159 per WPBM, psi/MIP = 8428.7
So, the stress to strain ratio = (8428.7 - 83.453) = 101.0
Therefore, a@ DADTA item 159 = 101.0 x us® a (psi)
WSA=56° download:
Average strain per WPBM, us/MIP = 286.09
From Reference 3 and Figure B33, the stress of DADTA Item 159 per WPBM, psi/MIP =11330
So, the stress to strain ratio = (11330 -s- 286.09) = 39.60
Therefore, a® DADTA item 159 = 39.60 x us® ci (psi)
WSA=44° download:
Average strain per WPBM, us/MIP = 207.5
From Reference 3 and Figure B33, the stress of DADTA Item 159 per WPBM, psi/MIP =10796
So, the stress to strain ratio = (10796 -H 207.5) = 52.03
Therefore, a® DADTA item 159 = 52.03 x us® a (psi)
WSA=26° download:
Average strain per WPBM, us/MIP = 79.396
From Reference 3 and Figure B33, the stress of DADTA Item 159 per WPBM, psi/MIP = 9454.1

DSTO-TR-0563
So, the stress to strain ratio = (9454.1 + 79.396) = 119.08
Therefore, a® DADTA item 159 = 119.08 x us® a (psi)
WSA=16° download:
Average strain per WPBM, us/MIP = 21.59
From Reference 3 and Figure B33, the stress of DADTA Item 159 per WPBM, psi/MIP = 8428.7
So, the stress to strain ratio = (8428.7 -=- 21.59) = 390.40
Therefore, a® DADTA item 159 = 390.40 x us® ci (psi)
In summation:
O"® DADTA Item 136 = = 27.98 X US® Cl
O® DADTA Item 136 : = 27.98 x us® ci
ö@ DADTA Item 136 : = 37.02 x us® ci
C"@ DADTA Item 136 ' = 37.15 x us® a
0"@ DADTA Item 136 = 33.51 x us® a
O"® DADTA Item 136 = ZZ.4yxus@a
O® DADTA Item 136 = 38.80 x us® a
O® DADTA Item 136 = 38.94 x us® a
0"@ DADTA Item 136 = 43.41 x us® a
0"@ DADTA Item 136 = 60.09 x us® a
0"@ DADTA Item 136 = 60.09 x us® a
O"® DADTA Item 136 = 86.94 x us® a
(psi)(Ref. 1, WSA=26° upload)
(psi)(Ref. 3, WSA=26° upload)
(psi)(Ref. 1, WSA=56° upload)
(psi)(Ref. 3, WSA=56° upload)
(psi)(Ref. 3, WSA=44° upload)
(psi)(Ref. 3, WSA=16° upload)
(psi)(Ref. 1, WSA=56° download)
(psi)(Ref. 3, WSA=56° download)
(psi)(Ref. 3, WSA=44° download)
(psi)(Ref. 1, WSA=26° download)
(psi)(Ref. 3, WSA=26° download)
(psi)(Ref. 3, WSA=16° download)
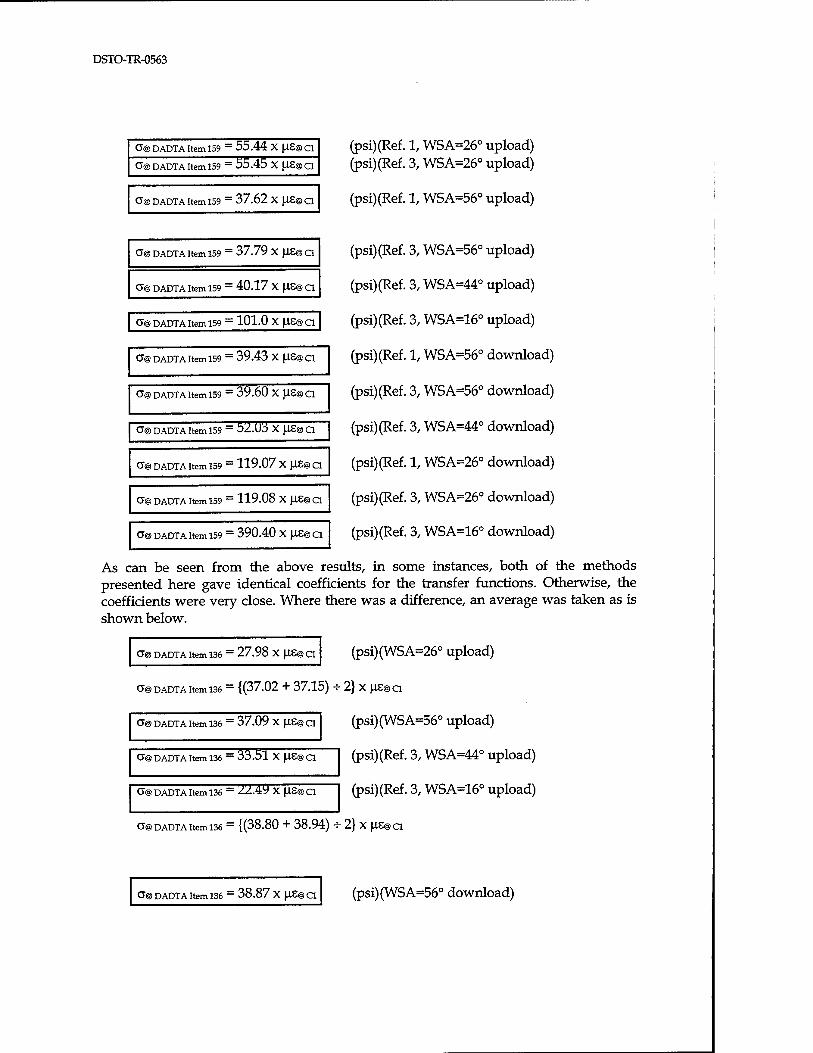
DSTO-TR-0563
(psi)(Ref. 1, WSA=26° upload) (psi)(Ref. 3, WSA=26° upload)
(psi)(Ref. 1, WSA=56° upload)
(psi)(Ref. 3, WSA=56° upload)
(psi)(Ref. 3, WSA=44° upload)
(psi)(Ref. 3, WSA=16° upload)
(psi)(Ref. 1, WSA=56° download)
(psi)(Ref. 3, WSA=56° download)
(psi)(Ref. 3, WSA=44° download)
(psi)(Ref. 1, WSA=26° download)
(psi)(Ref. 3, WSA=26° download)
(psi)(Ref. 3, WSA=16° download)
As can be seen from the above results, in some instances, both of the methods presented here gave identical coefficients for the transfer functions. Otherwise, the coefficients were very close. Where there was a difference, an average was taken as is shown below.
0"@DADTA Item 159 - 55.44 X US@C1
0"@DADTA Item 159 = 55.45 X |1S@C1
G@ DADTA Item 159 = 37.62 X fIS@ Cl
0~@ DADTA Item 159 = 37.79 X fiSigCl
a@ DADTA Item 159 = 40.17 X \IZ@ Cl
CT@ DADTA Item 159 = 101.0 X JJ£@C1
G@ DADTA Item 159 = 39.43 X US® a
0"® DADTA Item 159 = 39.60 X US@C1
G© DADTA Item 159 = 52.U3 X (J.S@C1
O*® DADTA Item 159 = 119.07 X JJ.S® a
G@ DADTA Item 159 = 119.08 X US@C1
0"@ DADTA Item 159 = 390.40 X (IS@C1
G@ DADTA Item 136 ~ 27.98 X [iZ@Cl (psi)(WSA=26° upload)
G@ DADTA Item 136 = {(37.02 + 37.15) -r 2} X |J.8@a
(psi)(WSA=56° upload) 0"@ DADTA Item 136 _ 37.09 X Ji£@a
G@ DADTA Item 136 — 33.51 X US@C1
CJ@ DADTA Item 136 — ZZ.4y X fX£@a
(psi)(Ref. 3, WSA=44° upload)
(psi)(Ref. 3, WSA=16° upload)
G® DADTA Item 136 = {(38.80 + 38.94) -=- 2} X |IS@C1
G@ DADTA Item 136 ~ 38.87 X |J.8@C1 (psi)(WSA=56° download)

DSTOTR-0563
0"@DADTA Item 136 - 43.41 X U£@C1
0"@DADTA Item 136 ~ 60.09 X fiS@Cl
a@DADTA Item 136 ~ 86.94 X US@C1
(psi)(Ref. 3, WSA=44° download)
(psi)(WSA=26° download)
(psi)(Ref. 3, WSA=16° download)
0@DADTA Item 159 = {(55.44 + 55.45) -H 2} x us@ci
= 55.445 x nsJcT] (psi)(WSA=26° upload) 0"@DADTA Item 159 '
a@DADTA Item 159 = {(37.62 + 37.79) +2} X \1Z@CI
(psi)(WSA=56° upload) a@DADTA Item 159 ~ 37.71 X \l£@Cl
a@DADTA Item 159 - 40.17 X ^E@a (psi)(Ref. 3, WSA=44° upload)
a@DADTA item 159 = 101.0xus@ci (psi)(Ref. 3, WSA=16° upload)
a@DADTA Item 159 = {(39.43 + 39.60) * 2} x ns@ci
(psi)(WSA=56° download) G@DADTA Item 159 — 39.52 X (J.S@C1
a@DADTAitemi59 = b2.UJx^@g ] (psi)(Ref. 3, WSA=44° download)
CX@DADTA Item 159 = {(119.07 + 119.08) * 2} X ^Cl
(psi)(WSA=26° download) 0@DADTA Item 159 = 119.075x US@C1
0@DADTA Item 159 = 390.40 X HE® a (psi)(Ref. 3, WSA=16° download)
Also, based on the results from the AMRL strain survey conducted in May 1995 (Reference 8),
(MIPS) (WSA=56° upload)
(MIPS) (WSA=44° upload)
(MIPS) (WSA=26° upload)
(MIPS) (WSA=16° upload)
(MIPS) (WSA=56° download)
WPBM = (1 - - 299.8) x us® ci
WPBM = (1 - - 268.79) x ns@ a
WPBM = (1 - -170.5) x ns@ ci
WPBM = (1 - - 83.453) x|as@ a
WPBM = (1 - ̂ 286.09) x|j.e@ci
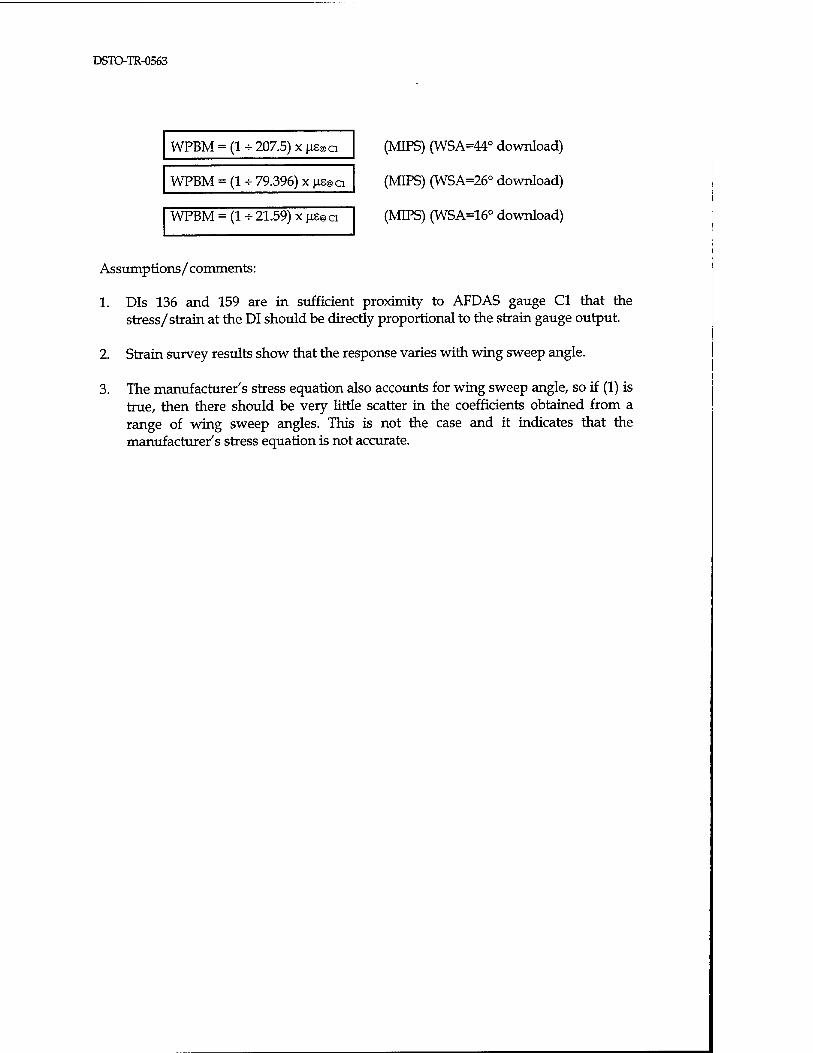
DSTO-TR-0563
WPBM = (1 - - 207.5) xue@ci
WPBM = (1 - - 79.396) xue® a
WPBM = (1 - -21.59) x us@ci
(MIPS) (WSA=44° download)
(MIPS) (WSA=26° download)
(MIPS) (WSA=16° download)
Assumptions/ comments:
1. DIs 136 and 159 are in sufficient proximity to AFDAS gauge Cl that the stress/strain at the DI should be directly proportional to the strain gauge output.
2. Strain survey results show that the response varies with wing sweep angle.
3. The manufacturer's stress equation also accounts for wing sweep angle, so if (1) is true, then there should be very little scatter in the coefficients obtained from a range of wing sweep angles. This is not the case and it indicates that the manufacturer's stress equation is not accurate.

DSTOTR-0563
10 oo
CO 0.
ID a. 5
o •*- 0)
O) cc c m
in Q. O) V
(0 < O) *-> n (0
0) 3 1- CO _l 2 CC o S CO < > ■ ■ *-»*
S CD 0. CO
in o co- 4-« rn o CN
■ ^~ .1 to CM _J
Q O o>^ 3 o CO o O H—
o *-■*
0) oo 0) <u c TJ o to Q. to V) 0) 00
T d) ^r o> 3 to CO CM O „
to T- T-
co 1
m _l 0) _l
D 3 O) ^ IL o
to
ujejjsoj3i|/g
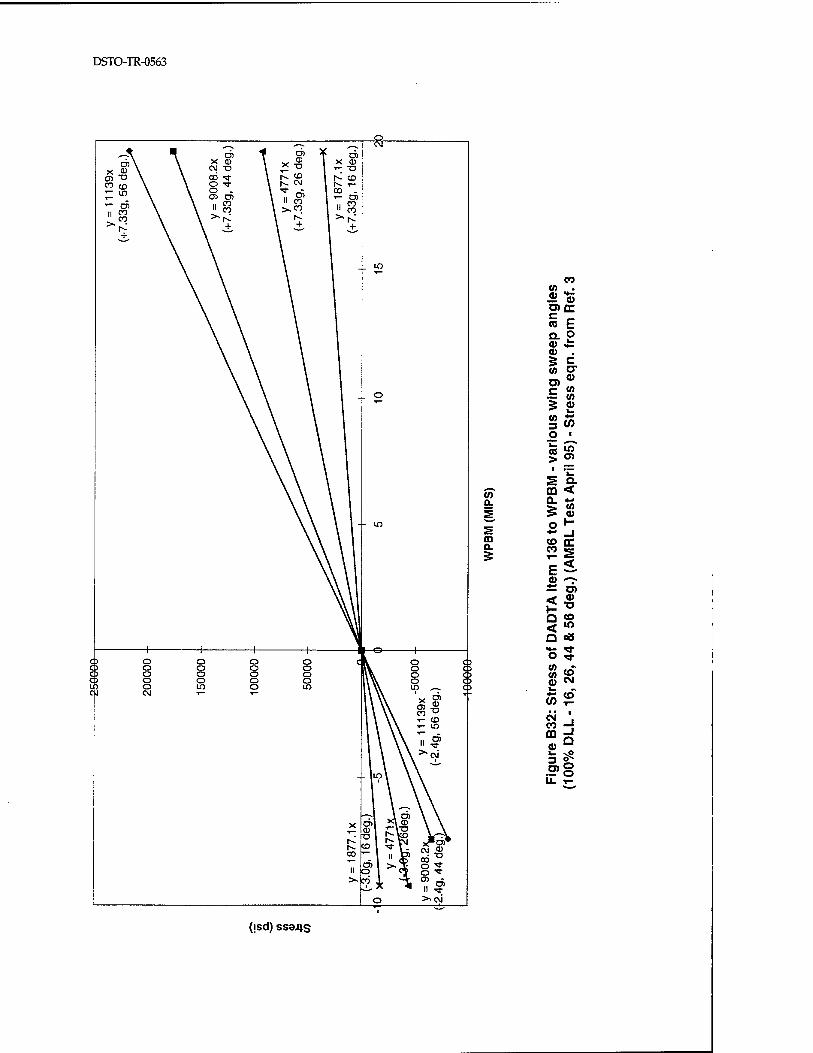
DSTO-TR-0563
CO CO
CD •fr- Cl)
O) oc n CO fc n o CD «►- CD 5 c co IT
U) 0)
r (ft (ft g CD
(ft 3 (0
CO
CO a.
m a. 5
? Q. m < a. 4-*
£ (ft CD
o H •*-# _4 CD rr CO s E < a> ^"^» **
O)
< 0)
n CO
< U)
a o8 •*- Tt o "* CO ro CO CD CM i_ P,
CO
■ a 1
CM CO _J m CD
_l Q
i_
DJ o o U. ^
(;sd) ssajjs
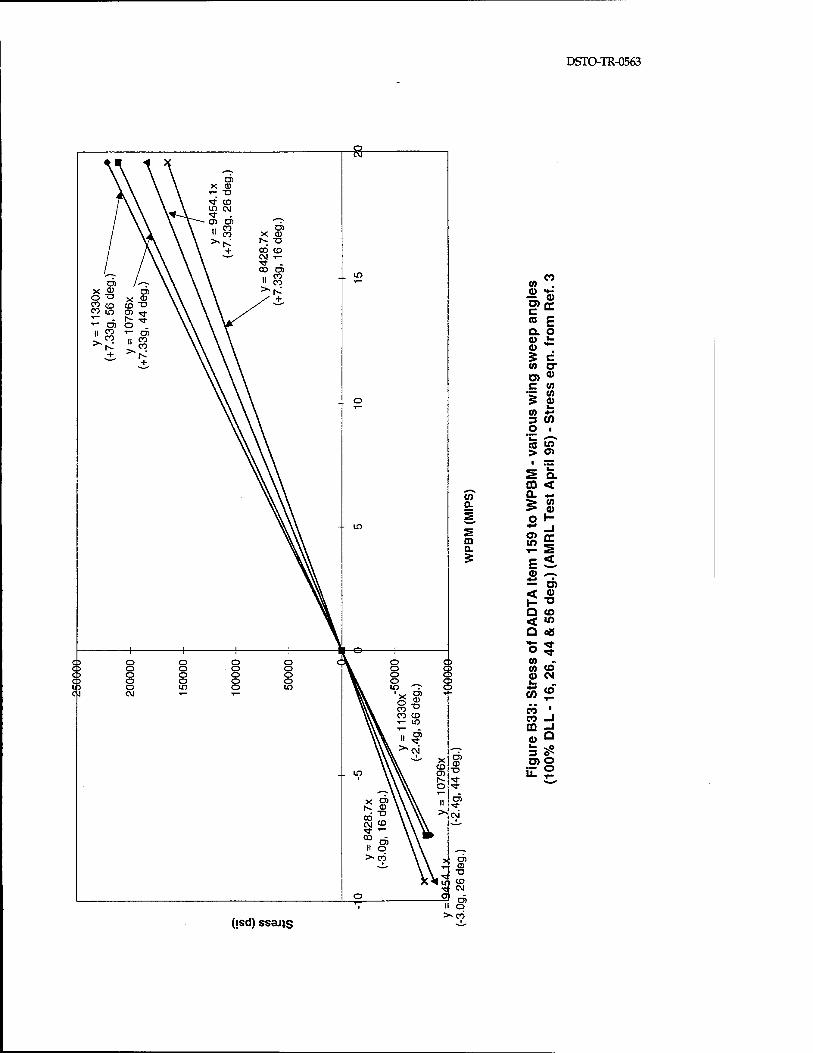
DSTO-TR-0563
CO CO fl) ■*-
0) CO c DC (0 E Q. o CD 5 c CO cr CO V c CO
5 CO ^
CO +* 3 (/) o 1 ^^, CO in > o>
S Q. CO < Q. +* £ CO
0) o h- ** _J
in DC 2
£ < V ^a*,
CO < CD 1- u O CO < Ifl
Q OS
O *a- CO „ CO CO <D CM i_
CO CO
CO i
CO _J m _J CD Q
3 CO o U. o
(isd) ssajjs

DSTO-TR-0563
B6: AFP AS location C2, Channel 4, DADTA Items 26, 26a, 27, 28, 29.
Note that while DADTA Items 26 and 26a are applicable to both heavyweight and lightweight WCTB's, the strain survey information used in this report pertains to a Part No. 12B7912 tie link only (ie: a/c A8-113 is an ex F-111A and is fitted with Part No. 12B7912 links - see Section 4). [As other sets of strain data become available, care must be taken when using them to ensure that the data are from the same type of tie link].
DADTA Item 26
From Reference 3, the following load to stress equation was assumed for DADTA Item 26:
<J@ DADTA item 26 (psi) = 2.336 x NTLL (lbs) + 70000
Also, from Reference 1, the NTLL corresponding to positive 100% CPLT load (26° WSA) is: 45830 lbs. (This value is also applicable for DADTA Items 26a, 27, 28 & 29). Therefore, assuming a linear variation, each value of NTLL can be calculated for its corresponding percentage of CPLT load, and can then be used in the above equation, enabling a plot of stress versus % load CPLT to be formulated.
From the strain survey (Reference 7), plots of strain versus % CPLT load were produced. However, the strain data obtained were NOT from AFDAS gauge C2 (which produced no useable data), but from gauges positioned adjacent to the AFDAS location - NFRT1 on the right hand Nacelle Tie Link, and NFLT1 on the left hand one. However, the precise location of the NFRT1 and NFLT1 gauges was not accurately documented. The results presented here must therefore be treated as preliminary and further tests will be required. Nevertheless, four curves were generated (56° WSA upload, 26° WSA upload, 56° WSA download and 26° download).
Now the ratios of Stress at DADTA Item 26 to strain at gauges NFRT1 & NFLT1 for the 26° WSA upload cases are as follows - (the other load cases are not shown here as the proof NTLL was not available for those cases). (See Figures B34 to B39 for reference to the values):
26° WSA upload:
Average strain per % CPLT load, us/%load = (70.494 + 67.068 + 73 + 69.174 + 70.763 + 67.349) + 6 = 69.64
From Reference 3 and Figure B40, the stress of DADTA Item 26 per % CPLT load, psi/%load = 1070.6

DSTO-TR-0563
So, the stress to strain ratio = (1070.6 + 69.64) = 15.37
Therefore, o@DADTAitem26 = 15.37 x jas@ NF(R/L)TI + 70000 (psi)
DADTA Item 26a
Similarly, from Reference 3, the assumed load to stress equation for DADTA Item 26a is as follows:
o@DADTAitem26a (psi) = 0.842 x NTLL (lbs) + 68470 (psi)
Using the same methodology as in the previous item, each value of NTLL was calculated for its corresponding percentage of CPLT load, and then used in the above equation, enabling a plot of stress versus % load CPLT to be formulated.
Also, using the same strain survey information as for the previous item (Reference 7),the ratios of stress at DADTA Item 26a to strain at gauges NFRT1/NFLT1 for the 26° WSA upload cases are as follows - (the other load cases are not shown here as the proof NTLL was not presented for those cases). (See Figures B34 to B39 for reference to the values):
26° WSA upload:
Average strain per % CPLT load, ^s/%load = (70.494 + 67.068 + 73 + 69.174 + 70.763 + 67.349) - 6 = 69.64
From Reference 3 and Figure B40, the stress of DADTA Item 26a per % CPLT load, psi/%load = 385.89
So, the stress to strain ratio = (385.89 H- 69.64) = 5.54
Therefore, O@DADTA item 26a = 5.54 x US@NF(R/L)TI + 68470 (psi)
DADTA Item 27
As mentioned in Table 3 (section 4.2), DADTA Item 27 only applies to the Nacelle Tie Link with Part No. 12B7912.
For DADTA Item 27, the load to stress equation (Reference 3) was:
G@ DADTA Item 27 (psi) = 3.105 X NTLL (lbs)
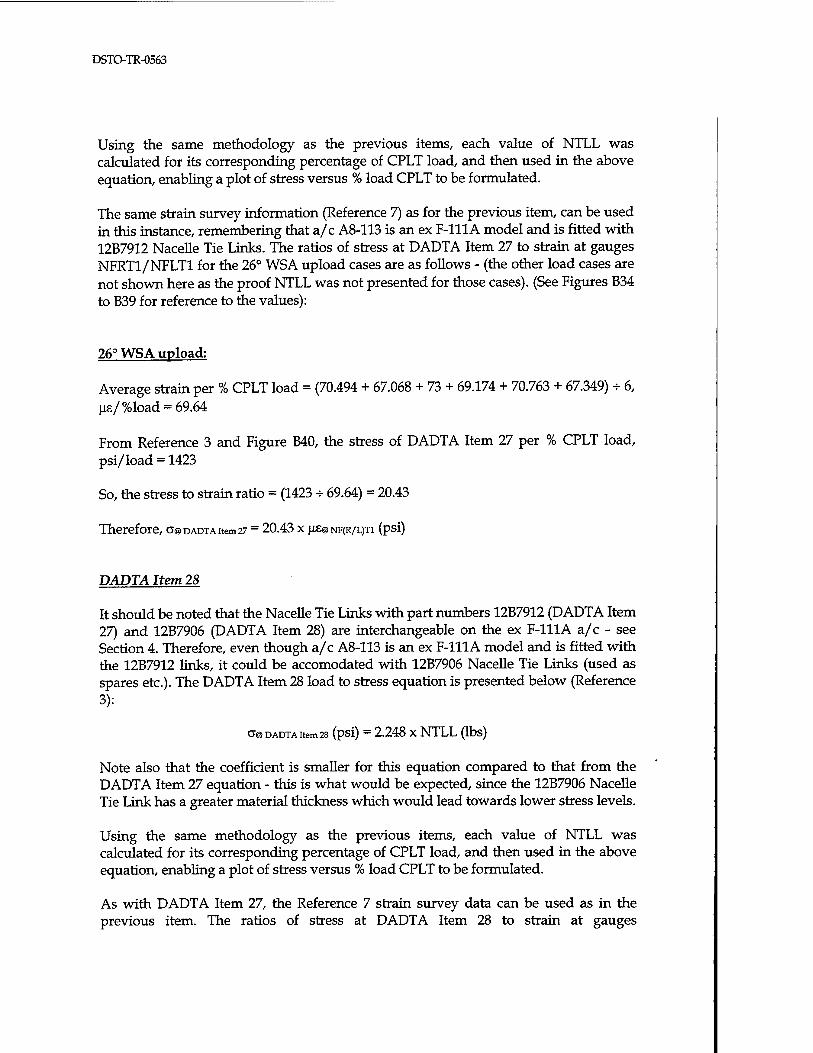
DSTO-TR-0563
Using the same methodology as the previous items, each value of NTLL was calculated for its corresponding percentage of CPLT load, and then used in the above equation, enabling a plot of stress versus % load CPLT to be formulated.
The same strain survey information (Reference 7) as for the previous item, can be used in this instance, remembering that a/c A8-113 is an ex F-111A model and is fitted with 12B7912 Nacelle Tie Links. The ratios of stress at DADTA Item 27 to strain at gauges NFRT1/NFLT1 for the 26° WSA upload cases are as follows - (the other load cases are not shown here as the proof NTLL was not presented for those cases). (See Figures B34 to B39 for reference to the values):
26° WSA upload:
Average strain per % CPLT load = (70.494 + 67.068 + 73 + 69.174 + 70.763 + 67.349) - 6, Hs/%load = 69.64
From Reference 3 and Figure B40, the stress of DADTA Item 27 per % CPLT load, psi/load = 1423
So, the stress to strain ratio = (1423 -H 69.64) = 20.43
Therefore, c@DADTAitem27 = 20.43 x HS@NF(R/L)TI (psi)
DADTA Item 28
It should be noted that the Nacelle Tie Links with part numbers 12B7912 (DADTA Item 27) and 12B7906 (DADTA Item 28) are interchangeable on the ex F-111A a/c - see Section 4. Therefore, even though a/c A8-113 is an ex F-111A model and is fitted with the 12B7912 links, it could be accomodated with 12B7906 Nacelle Tie Links (used as spares etc.). The DADTA Item 28 load to stress equation is presented below (Reference 3):
cr@ DADTA item 28 (psi) = 2.248 x NTLL (lbs)
Note also that the coefficient is smaller for this equation compared to that from the DADTA Item 27 equation - this is what would be expected, since the 12B7906 Nacelle Tie Link has a greater material thickness which would lead towards lower stress levels.
Using the same methodology as the previous items, each value of NTLL was calculated for its corresponding percentage of CPLT load, and then used in the above equation, enabling a plot of stress versus % load CPLT to be formulated.
As with DADTA Item 27, the Reference 7 strain survey data can be used as in the previous item. The ratios of stress at DADTA Item 28 to strain at gauges
DSTO-TR-0563
NFRT1/NFLT1 for the 26° WSA upload cases are as follows - (the other load cases are not shown here as the proof NTLL was not presented for those cases). (See Figures B34 to B40 for reference to the values):
26° WSA upload:
Average strain per % CPLT load = (70.494 + 67.068 + 73 + 69.174 + 70.763 + 67.349) - 6, He/%load = 69.64
From Reference 3 and Figure B40, the stress of DADTA Item 28 per % CPLT load, psi/%load = 1030.3
So, the stress to strain ratio = (1030.3 -s- 69.64) = 14.79
Therefore, a@DADTAitem28 = 14.79 x HS@NF(R/L)TI (psi)
DADTA Item 29
The load to stress equation for DADTA Item 29 is exactly the same as that for DADTA Item 28 (Reference 3), ie:
a® DADTA item 28 (psi) = 2.248 x NTLL (lbs)
Now, DADTA Item 29 is only applicable to the Nacelle Tie Link with Part No. 12B7901, indicating that it is only found on F-111C aircraft. Hence, the strain survey data from a/c A8-113 (Reference 7) cannot be used to derive a relationship between the stress at this DADTA Item and the strain output from the survey.
However, a 12B7901 Nacelle Tie Link (from a/c A8-134) was tested at AMRL in July 1995 (Reference 9), providing the necessary data to derive a transfer function. In this case, it was possible to directly record the applied load and resulting strain output from AFDAS Gauge C2. These applied loads were then used in the stress equation. The strain and stress data are plotted in Figures B41 and B42.
From Figure B41, the strain per NTLL (lbs), ns/NTLL = 0.1065
And from Reference 3 and Figure B42, the stress of DADTA Item 29 per NTLL (lbs), psi/NTLL = 2.248
So the stress to strain ratio = (2.248 + 0.1065) = 21.11
Therefore, o@DADTAitem29 = 21.11 x |j.s@c2 (psi)
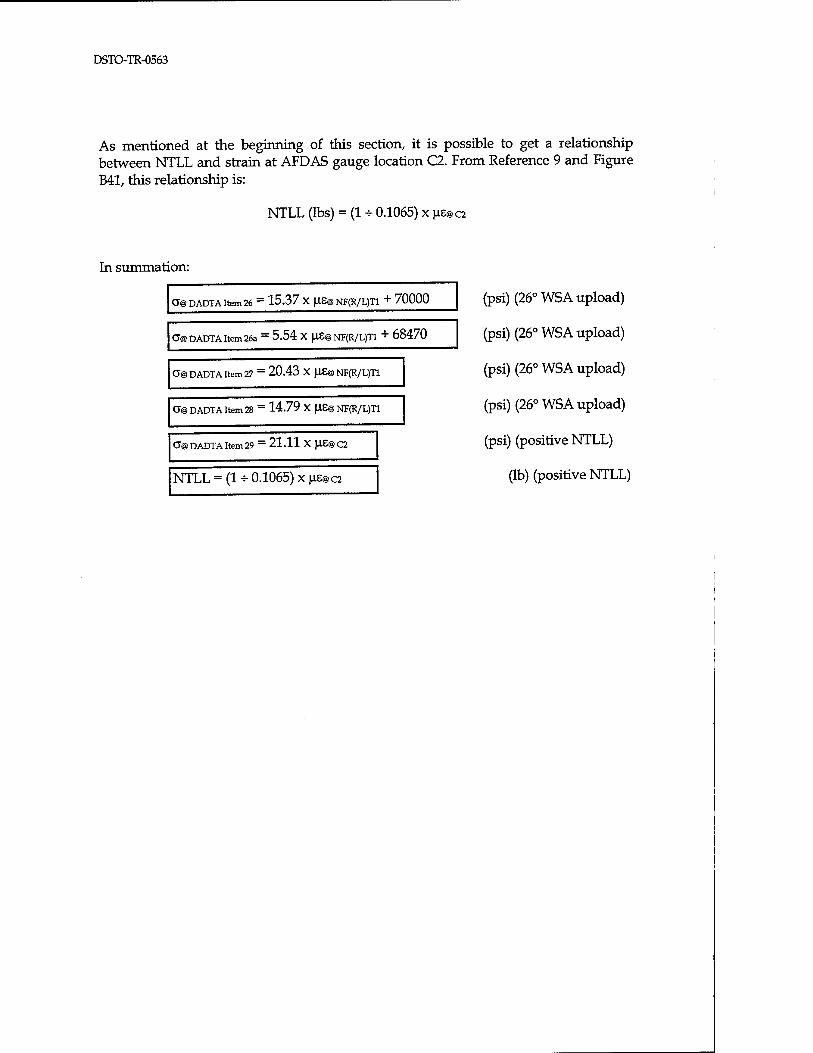
DSTO-TR-0563
As mentioned at the beginning of this section, it is possible to get a relationship between NTLL and strain at AFDAS gauge location C2. From Reference 9 and Figure B41, this relationship is:
NTLL (lbs) = (1 * 0.1065) x us@c2
In summation:
0"@DADTAItem26 = = 15.37 X US® NF(R/L)T1 + 70000
C@DADTA Item 26a = 5.54 x US@NF(R/L)TI + 68470 1 0"@DADTAItem27 : = 20.43 X US® NF(R/L)T1
0"@DADTAItem28 : = 14.79 X|IS@NF(R/L)T1
0"@DADTAItem29 : = 21.11 XUS@C2
NTLL = (1-0 .1065) x US@C2
(psi) (26° WSA upload)
(psi) (26° WSA upload)
(psi) (26° WSA upload)
(psi) (26° WSA upload)
(psi) (positive NTLL)
(lb) (positive NTLL)
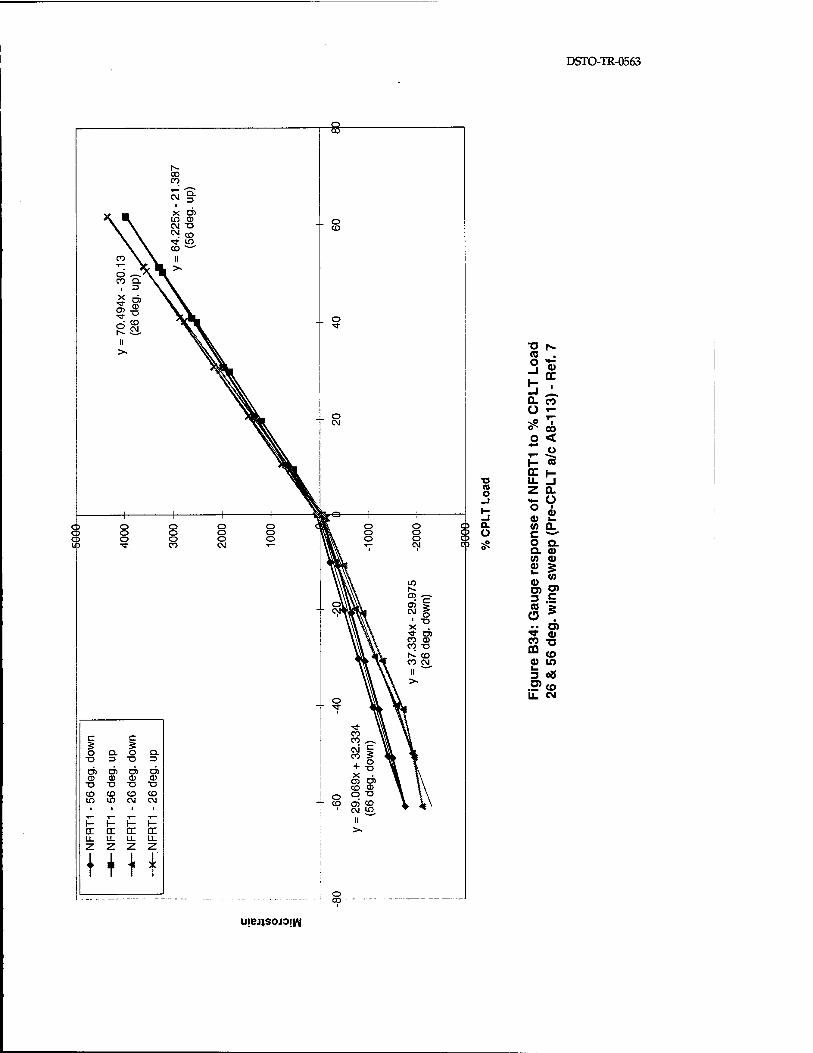
DSTO-TR-0563
CO CO
~f w CD (M "O CM CD ■si- in CD ^"
CO \ \ k_ "
CO Q. \ ■ 3
% ^
1 £
o CD
O
C C
O Q. O Q. ■a 3 -o 3
Ö> O) O) D> CO CO CO CO T3 T3 T3 T3 CD CD CD CD ID ID CM CM
H H I- H cc tr en cc LL Li- Li. LL z z
HU o CO
CJ o O C5
T3 (0 o
GL o
•o r~ (0 o <•— -J fT h- _J __ _ u. CO Ü
■^
■ 00
o < Ü
H "J5 cc H u_ _l z a. H— ü o ■
0> 0) l_
<A a. c ^-^ o a CL 0) CO 0) <D 3
(0 V rn O) 3 c (0 Ü 3 . a O) ^ a>
CO ■n GO to a> to 3 08 g> CO U. CJ
uiej}sojo!i/\|

DSTO-TR-0563
CT> CM •>a- co (M 9- + . x 5"
CD ® in T3 h- CD T^ LO co *"■
CM \ \ II in \ \ >> CM \,\ co ^~. \t
7 = \ X O)
CO CO CD "O q co N CM CD "~~ II >>
D) O) D) CD CD CO
■o -o —
CD
o CO
c c
O Q. O Q. -O 3 "O 3
CD 73 TJ
CD CD CO CD m ID CM CM
H H H I- U. LL
IM
T3 r». co 5'S -1 oc 1- , _i JL. 0. CO Ü *-
5s 00 o < ** Ü P^3 r1 H
"O u- _J (0 Z 0. o
■8 9 ** a> (0 © 2: £ (0 Q.
o Q. Q. 0) CO a)
£ § « ™ o> o> 3 C CO > (3 > " O)
52 « CO *" CD 0) m i_ 3 o8 .5* co U. CM
uiej)S0J3!i/\j
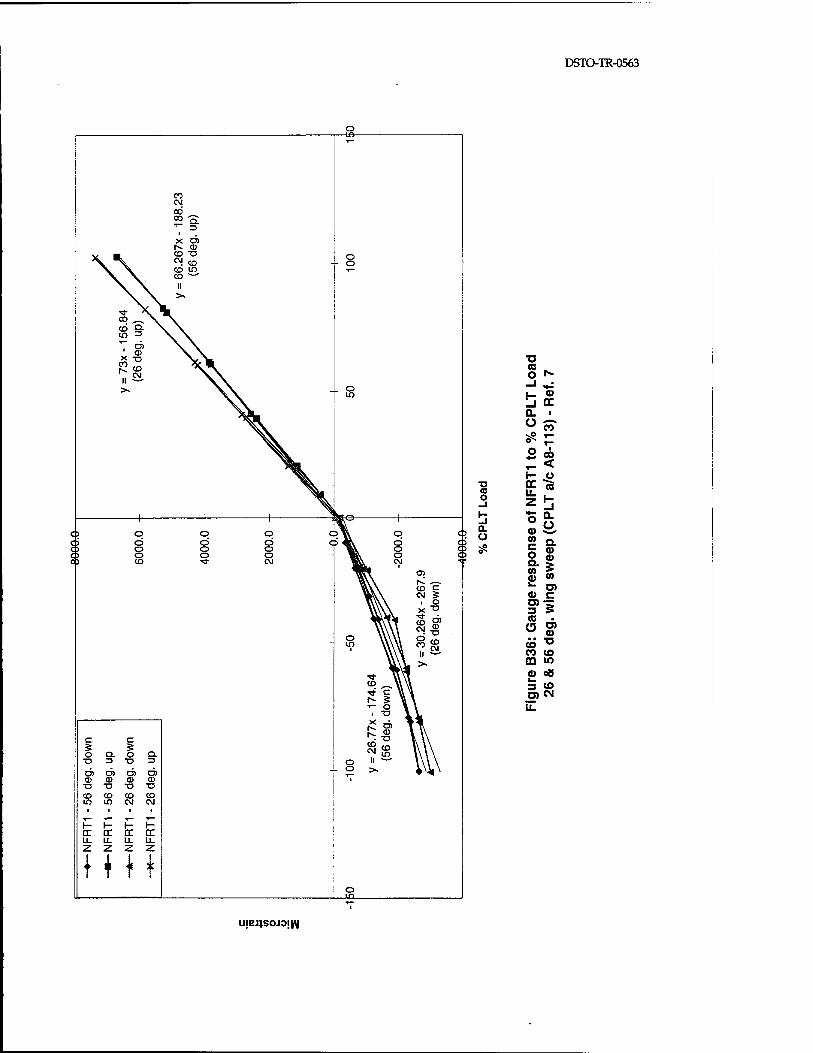
DSTO-TR-0563
o -iß-
o o
o o 8 05
c c O Q. O Q-
Ö) en ri> o) © a> a) CD
T3 "O -O T3 CO <D CO CO in m CM CM
H- I— I— I— OC CC DC DC LL LL LL U-
lilt o in
■D
O Is-
V QC
Q. Ü CO
■a CO o
a. ü
O -i
Z Ü "SS a> Ü (0 c o Q. CO
a 0)
(0 a» c
21 (0
C5 O)
■D CO CO CO 00 w
3 CO
ujensojoiw
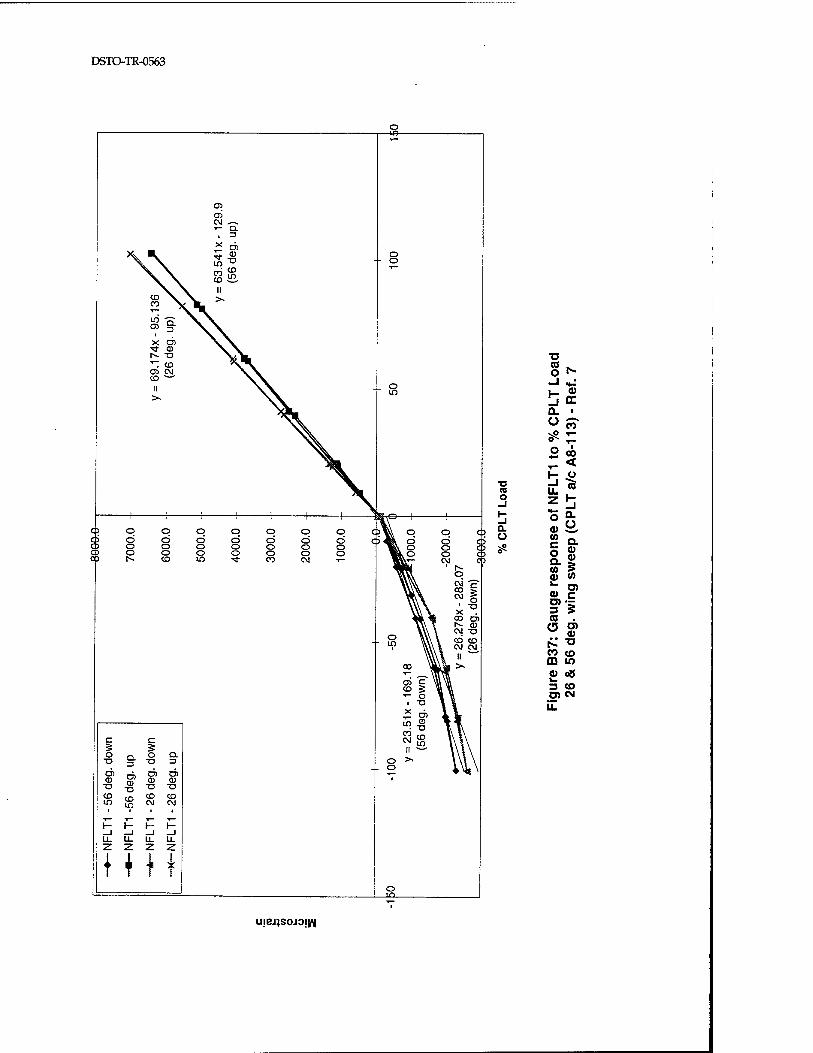
DSTO-TR-0563
■D (0 o
D. O
■o
O f-
Q. •
0) (0 c o Q. CO 0)
Q. 0)
(0
(0
£ xi CO <D OQ m
3 CO
U.
c c 5 5 o o Q.
■o 3 ■o 3
O) o> o> CD ci> a> T3 ■o T3 ■o CD CO CD in • in
i CM CM
1
H K H H _l _l _1 _i LL LL LL LL z 2 2 2
HI i
mejjsoJoiiN
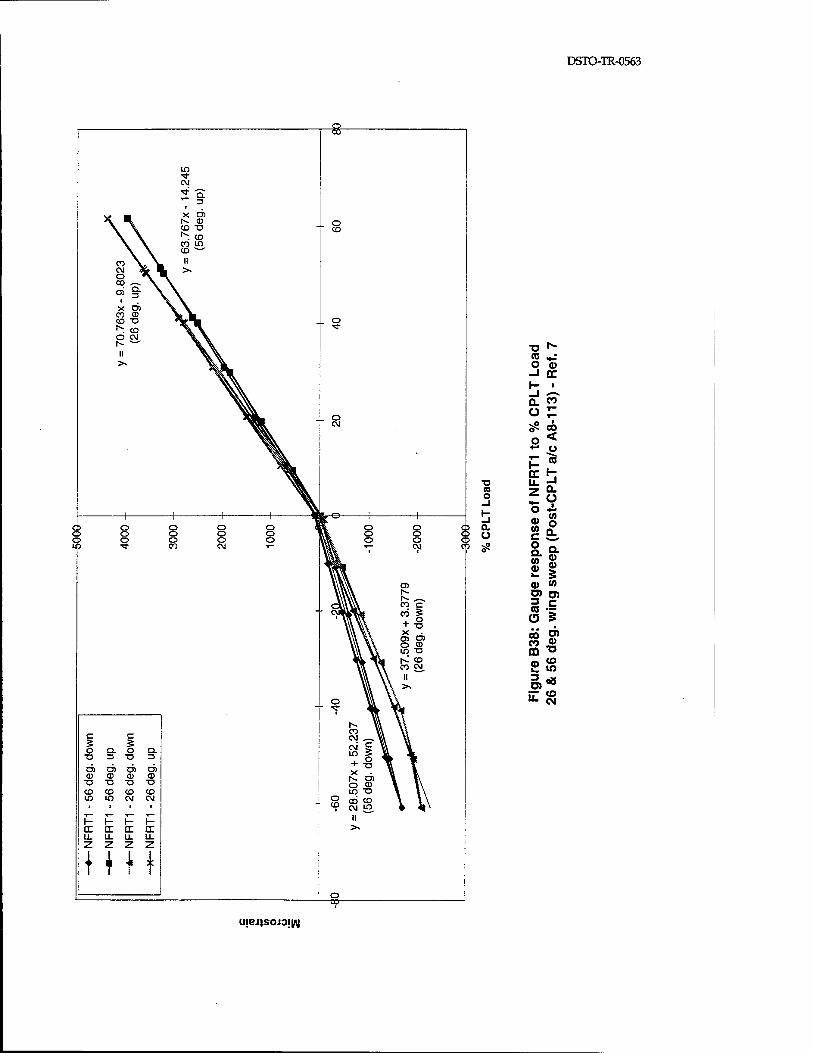
DSTO-TR-0563
Iß -* CM
3
X O) h~ CD CO "D ^. CO co in CD ^
W V \ ii
CM *» 1 L >. o A. 00 ^~. \ a §■ N X O)
CO 0) CO "O ^ CD O CM h- *-' II
o CO
o c> O
c c O Q. O 73 =J 13
O) O) O) C3) CD CD CD CD T3 T3 "O "D CD CD CO CD in in CM c\i
H h- H h- DC CC DC DC LL LL LL U. z z
III!
-8-
o o o C3
■o ^ 5 «H! o o -i CC 1- ■ _J «-* CL to o£ ^ » o< *- o
^2 oc h ■o U- ^ (0 o -1
2 0- Ü
1-
nse
o
(Pos
t
a a re
spo
wee
p
d) (0 g> O) 2 c to ~ O 5 «5 5P eo J> CQ ^
8>8 ä«s rr «3 "- CM
UJEJJSOJOIW

DSTO-TR-0563
CD CD CD in in CM
«a I 3 -a o> O) O) O) CD CD 03 CD -a T5 -o ~~
CD <M
f- h- I— h- I I I I U. LL. LL LL Z Z 2 2
o CO
o o C3 C3
■a •*- (0 nJ O CD -I DC H ■ _l ^ a. <2 o £ ^ 00
o< ** o r "ö Üi-
■o u. r1 (0 o _J - 9 1- O <!• _l a ® O CO — ü c £,
resp
o w
eep
0) CO 5* o> 5 c CO ■—
a 5 ö o> CO fl) CQ TJ 0) CO £. in
a* Eg
uiej}S0J3!i/\|

f^ CM
X e <M CO •■tf ^— ▼~ < II t- >. o
< D
f—
CD CM 08
CO CO CO CO t^ CM CM CM CM M
E E E E CO 0) CD CD
< < < < H h- h- H O Q a O 0 < < < < - 0 a a 0 a *
(III
o CO
■a CO o
a. ü
CO CO
o «*= 1_ °
0- £ ü o *_• *- c *: <D c o o- aj v Q. (A
S 55 08 CO 001:
- 00
CM **" .. O
CO Q.
CO w
E >» 0) c Ä o < -o h- to Q O < Q. Q 3
O Q. CD
CO S * I (0 0)
(/) CD .. c o "> rr >
CD CD V
3-°
000 000 000 000 co co •<r
o o o o o o o o TJ- CM
(isd) SS9JJS
£9S0-Hl-OJSa
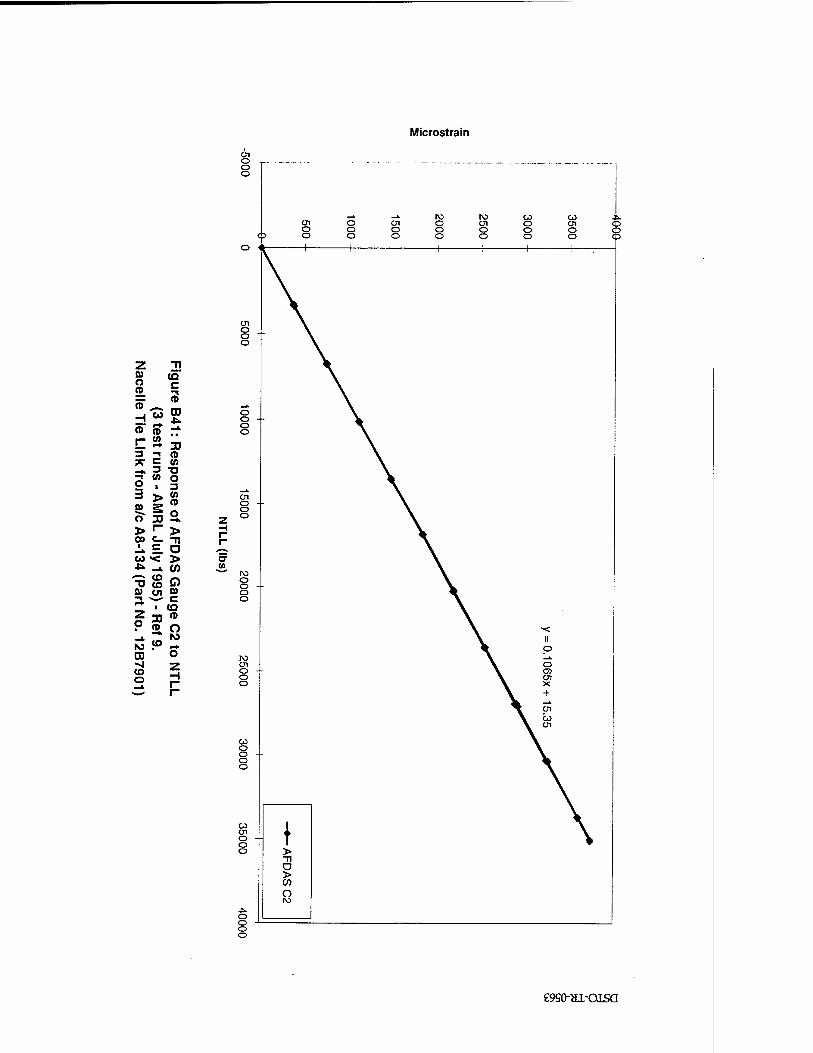
Microstrain
01 o o o
o o
—k. —k N> N> CO CO *. 0 01 O Ol O Ul O 0 0 O O O O Cp 0 0 O O O 0 25
z 3 SU (Q
2. ^ _i co tu
(0 30 (D 3 -1 ..
-* 5 "° 3? S ei i S cT 00 2. > 1- > 00 e_ -n A E D w «< > *>_!.(/) TlloO 0) OI 0»
P 2. o -* JX M
CD ° co f}
£9S0-HI-OISa

DSTO-TR-0563
CO
"Si DC
C cr ©
-i (A -J CO H 0> Z J= o o» +* O) o> CM »-
CO .Q -—' h- o> _J Q « _1 < r. Z Q >•
s- 3 O ~i
ress
Te
st
5>=! .. cc
?>£ 3 - O) c U- TJ
0)
a a (0 (A ro Cfl
"O (0 o
(jsd) ssajjs
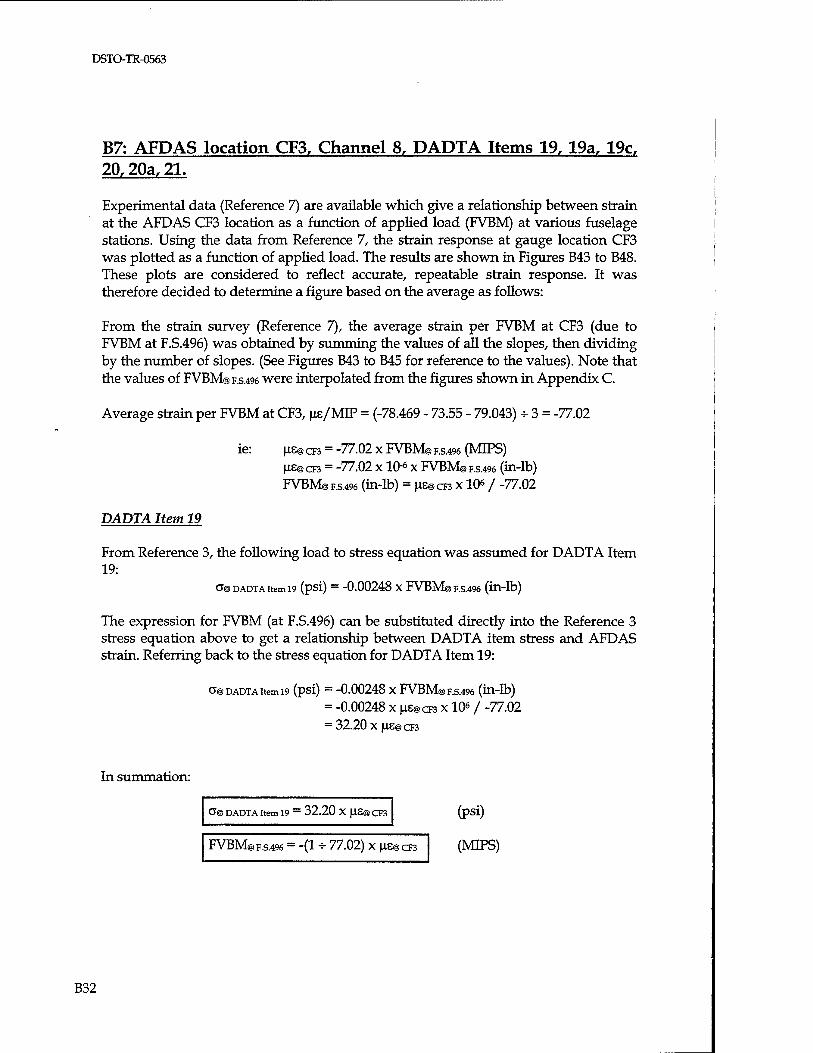
DSTO-TR-0563
B7: AFDAS location CF3, Channel 8, DADTA Items 19, 19a, 19c, 20,20a, 21.
Experimental data (Reference 7) are available which give a relationship between strain at the AFDAS CF3 location as a function of applied load (FVBM) at various fuselage stations. Using the data from Reference 7, the strain response at gauge location CF3 was plotted as a function of applied load. The results are shown in Figures B43 to B48. These plots are considered to reflect accurate, repeatable strain response. It was therefore decided to determine a figure based on the average as follows:
From the strain survey (Reference 7), the average strain per FVBM at CF3 (due to FVBM at F.S.496) was obtained by summing the values of all the slopes, then dividing by the number of slopes. (See Figures B43 to B45 for reference to the values). Note that the values of [email protected] were interpolated from the figures shown in Appendix C.
Average strain per FVBM at CF3, us/MIP = (-78.469 - 73.55 - 79.043) -=- 3 = -77.02
ie: us® CFS = -77.02 x FVBM® F.s.496 (MIPS) US@CF3 = -77.02 x 10⁶ x FVBM® F.S.496 (in-lb) [email protected] (in-lb) = UE@CF3 X 106 / -77.02
DADTA Item 19
From Reference 3, the following load to stress equation was assumed for DADTA Item 19:
o® DADTA item 19 (psi) = -0.00248 x FVBM® F.S.496 (in-lb)
The expression for FVBM (at F.S.496) can be substituted directly into the Reference 3 stress equation above to get a relationship between DADTA item stress and AFDAS strain. Referring back to the stress equation for DADTA Item 19:
a® DADTA item 19 (psi) = -0.00248 x FVBM® F.S.496 (in-lb) = -0.00248 x US@CF3 x 106 / -77.02 = 32.20 x US@CF3
In summation:
O"® DADTA Item 19 — 32.20 X US® CF3
FVBM® F.S.496 = -(1 * 77.02) x US@CF3
(psi)
(MIPS)
B32
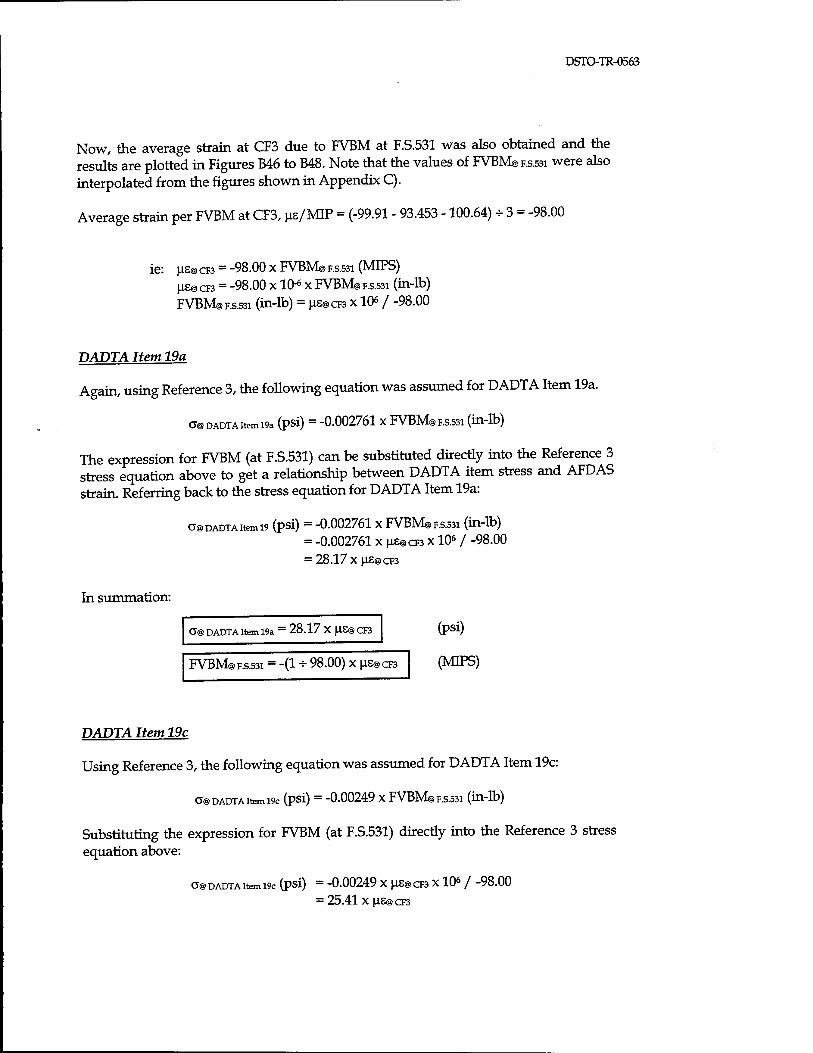
DSTO-TR-0563
Now, the average strain at CF3 due to FVBM at F.S.531 was also obtained and the results are plotted in Figures B46 to B48. Note that the values of FVBM® F.s.531 were also interpolated from the figures shown in Appendix C).
Average strain per FVBM at CF3, us/MIP = (-99.91 - 93.453 -100.64) ^ 3 = -98.00
ie: us® CFS = -98.00 x FVBM® F.s.531 (MIPS) US@CF3 = -98.00 x 10^ x FVBM® F.s.531 (in-lb) FVBM® F.s.531 (in-lb) = us® CFS X 106 / -98.00
DADTA Item 19a
Again, using Reference 3, the following equation was assumed for DADTA Item 19a.
a® DADTA Item 19a (pSl) = -0.002761 X FVBM® F.S.531 (Ül-lb)
The expression for FVBM (at F.S.531) can be substituted directly into the Reference 3 stress equation above to get a relationship between DADTA item stress and AFDAS strain. Referring back to the stress equation for DADTA Item 19a:
a® DADTA item 19 (psi) = -0.002761 x FVBM® F.s.531 (in-lb) = -0.002761 x US@CF3 x 106 / -98.00 = 28.17 x us@cF3
In summation:
0® DADTA Item 19a - 28.17 X US® CF3
FVBM® F.s.531 = -(1 -5- 98.00) x US@CF3
(psi)
(MIPS)
DADTA Item 19c
Using Reference 3, the following equation was assumed for DADTA Item 19c:
O® DADTA Item 19c (pSl) = -0.00249 X [email protected] (Ül-lb)
Substituting the expression for FVBM (at F.S.531) directly into the Reference 3 stress equation above:
a® DADTA item i9c (psi) = -0.00249 x us® CF3 x 10« / -98.00 = 25.41 x us® cF3
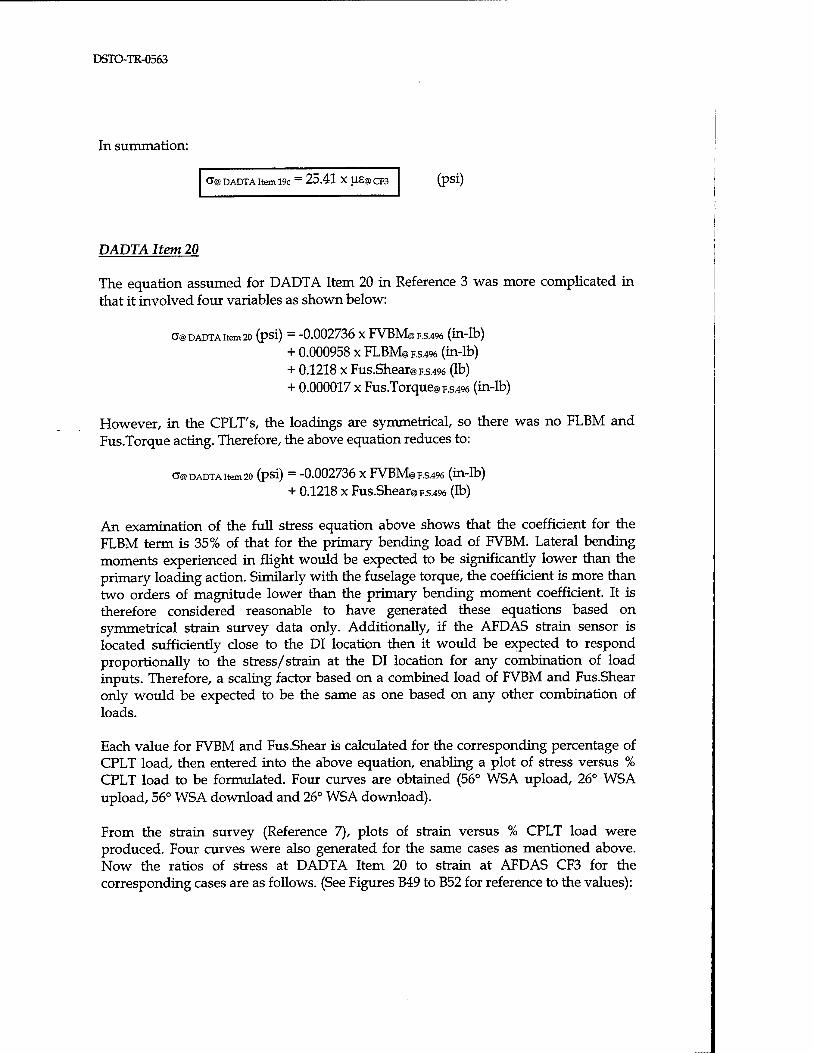
DSTO-TR-0563
In summation:
O"® DADTA Item 19c _ 25.41 X US@CF3 (psi)
DADTA Item 20
The equation assumed for DADTA Item 20 in Reference 3 was more complicated in that it involved four variables as shown below:
a@ DADTA item 20 (psi) = -0.002736 x [email protected] (in-lb) + 0.000958 x [email protected] (in-lb) + 0.1218 x [email protected] (lb) + 0.000017 x [email protected] (in-lb)
However, in the CPLT's, the loadings are symmetrical, so there was no FLBM and Fus.Torque acting. Therefore, the above equation reduces to:
a@ DADTA item 20 (psi) = -0.002736 x [email protected] (in-lb) + 0.1218 x [email protected] (lb)
An examination of the full stress equation above shows that the coefficient for the FLBM term is 35% of that for the primary bending load of FVBM. Lateral bending moments experienced in flight would be expected to be significantly lower than the primary loading action. Similarly with the fuselage torque, the coefficient is more than two orders of magnitude lower than the primary bending moment coefficient. It is therefore considered reasonable to have generated these equations based on symmetrical strain survey data only. Additionally, if the AFDAS strain sensor is located sufficiently close to the DI location then it would be expected to respond proportionally to the stress/strain at the DI location for any combination of load inputs. Therefore, a scaling factor based on a combined load of FVBM and Fus.Shear only would be expected to be the same as one based on any other combination of loads.
Each value for FVBM and Fus.Shear is calculated for the corresponding percentage of CPLT load, then entered into the above equation, enabling a plot of stress versus % CPLT load to be formulated. Four curves are obtained (56° WSA upload, 26° WSA upload, 56° WSA download and 26° WSA download).
From the strain survey (Reference 7), plots of strain versus % CPLT load were produced. Four curves were also generated for the same cases as mentioned above. Now the ratios of stress at DADTA Item 20 to strain at AFDAS CF3 for the corresponding cases are as follows. (See Figures B49 to B52 for reference to the values):
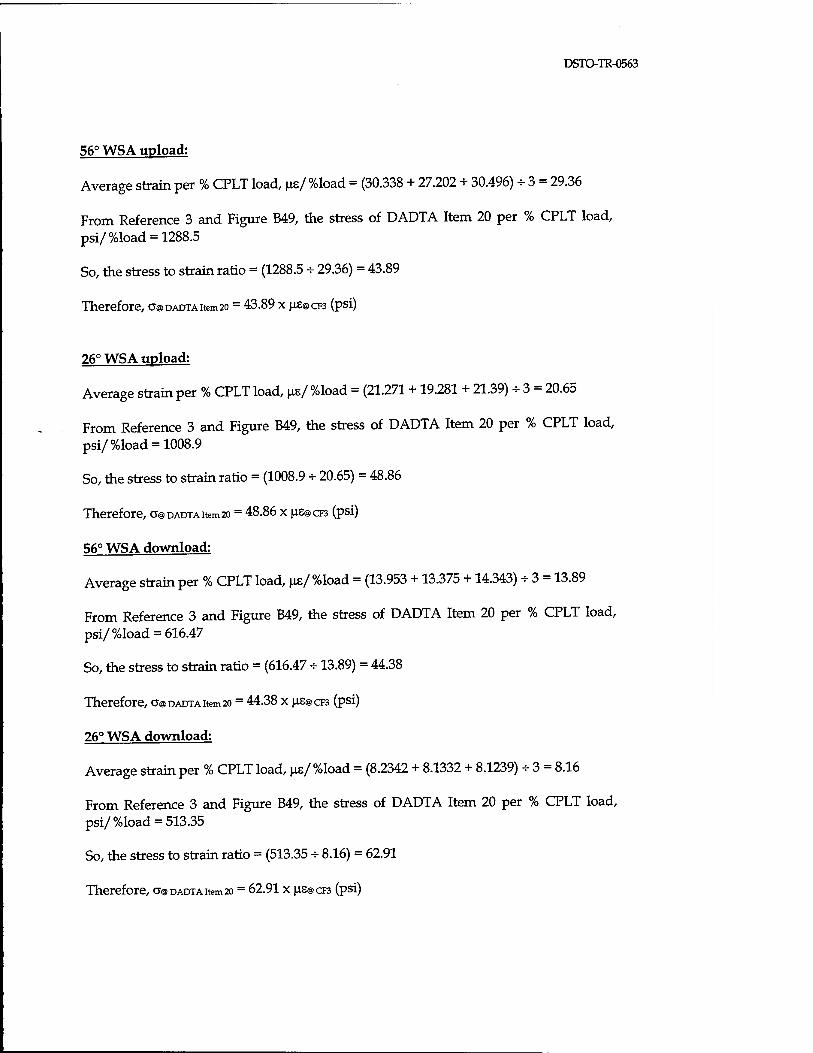
DSTO-TR-0563
56° WS A upload:
Average strain per % CPLT load, \iz/ %load = (30.338 + 27.202 + 30.496) + 3 = 29.36
From Reference 3 and Figure B49, the stress of DADTA Item 20 per % CPLT load, psi/%load = 1288.5
So, the stress to strain ratio = (1288.5 * 29.36) = 43.89
Therefore, a@DADTAitem20 = 43.89 x |IE@CF3 (psi)
26° WS A upload:
Average strain per % CPLT load, ^s/%load = (21.271 +19.281 + 21.39) * 3 = 20.65
From Reference 3 and Figure B49, the stress of DADTA Item 20 per % CPLT load, psi/%load = 1008.9
So, the stress to strain ratio = (1008.9 - 20.65) = 48.86
Therefore, a@DADTAitem20 = 48.86 x |4.S@CF3 (psi)
56° WS A download:
Average strain per % CPLT load, us/ %load = (13.953 +13.375 +14.343) + 3 = 13.89
From Reference 3 and Figure B49, the stress of DADTA Item 20 per % CPLT load, psi/%load = 616.47
So, the stress to strain ratio = (616.47 -=-13.89) = 44.38
Therefore, a@DADTAitem20 = 44.38 x US@CF3 (psi)
26° WS A download:
Average strain per % CPLT load, us/%load = (8.2342 + 8.1332 + 8.1239) * 3 = 8.16
From Reference 3 and Figure B49, the stress of DADTA Item 20 per % CPLT load, psi/ %load = 513.35
So, the stress to strain ratio = (513.35 H- 8.16) = 62.91
Therefore, o-@DADTAitem2o = 62.91 x US@CF3 (psi)
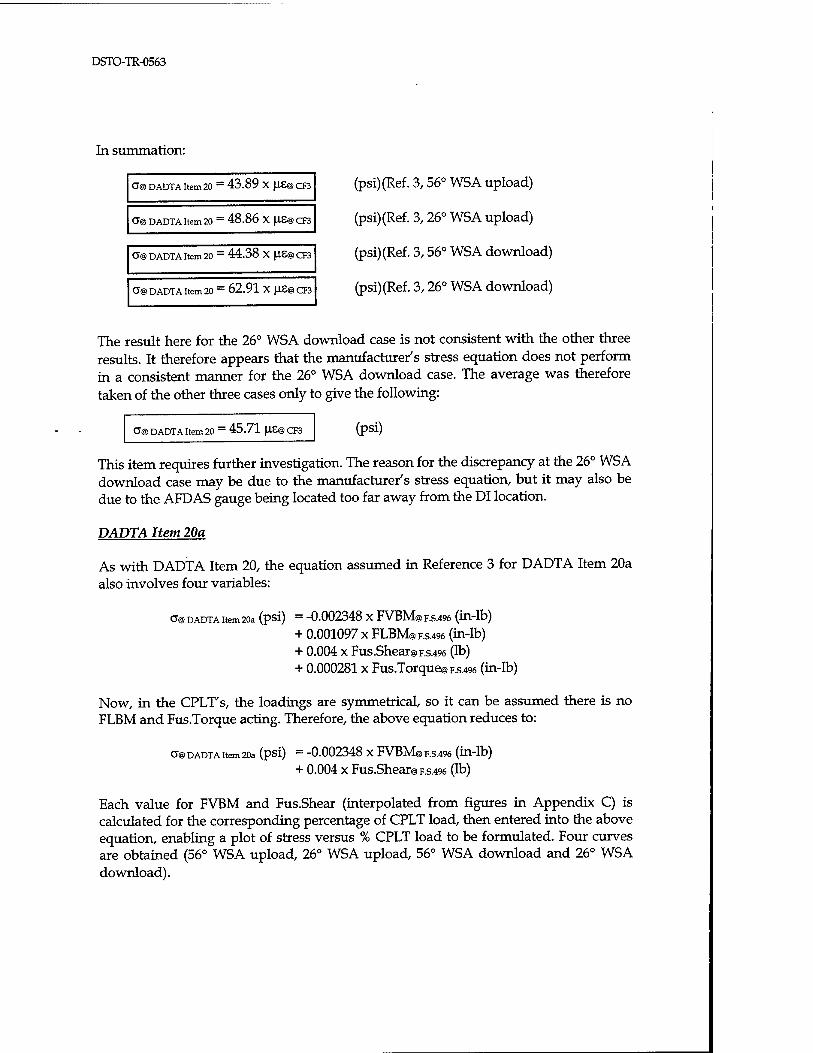
DSTO-TR-0563
In summation:
0® DADTA Item 20 — 43.89 X US@CF3
O"® DADTA Item 20 ~ 48.86 X US@CF3
CT@ DADTA Item 20 _ 44.38 X |1S@CF3
CJ@ DADTA Item 20 ~ 62.91 X U£@CF3
(psi)(Ref. 3,56° WSA upload)
(psi)(Ref. 3,26° WSA upload)
(psi)(Ref. 3,56° WSA download)
(psi)(Ref. 3,26° WSA download)
The result here for the 26° WSA download case is not consistent with the other three results. It therefore appears that the manufacturer's stress equation does not perform in a consistent manner for the 26° WSA download case. The average was therefore taken of the other three cases only to give the following:
CT@ DADTA Item 20 — 45.71 US@CF3 (psi)
This item requires further investigation. The reason for the discrepancy at the 26° WSA download case may be due to the manufacturer's stress equation, but it may also be due to the AFDAS gauge being located too far away from the DI location.
DADTA Item 20a
As with DADTA Item 20, the equation assumed in Reference 3 for DADTA Item 20a also involves four variables:
C7@ DADTA Item 20a (pSl) = -0.002348 X FVBM® F.S.496 (Ül-lb)
+ 0.001097 x FLBM® F.s.496 (in-lb) + 0.004 x Fus.Shear® F.S.496 (lb) + 0.000281 x Fus.Torque® F.S.496 (in-lb)
Now, in the CPLT's, the loadings are symmetrical, so it can be assumed there is no FLBM and Fus.Torque acting. Therefore, the above equation reduces to:
a® DADTA Item 20a (psi) = -0.002348 X FVBM® F.S.496 (Ül-lb)
+ 0.004 x Fus.Shear® F.S.496 (lb)
Each value for FVBM and Fus.Shear (interpolated from figures in Appendix C) is calculated for the corresponding percentage of CPLT load, then entered into the above equation, enabling a plot of stress versus % CPLT load to be formulated. Four curves are obtained (56° WSA upload, 26° WSA upload, 56° WSA download and 26° WSA download).

DSTO-TR-0563
Using the same strain survey plots as used for the DADTA Item 20/AFDAS CF3 relationships (Figures B50 to B52) , the ratios of stress at DADTA Item 20a to Microstrain at AFDAS CF3 for the corresponding cases were deduced as follows:
56° WS A upload:
Average strain per % CPLT load, pis/ %load = (30.338 + 27.202 + 30.496) * 3 = 29.36
From Reference 3 and Figure B53, the stress of DADTA Item 20a per % CPLT load, psi/%load = 884.72
So, the stress to strain ratio = (884.72 - 29.36) = 30.13
Therefore, c@DADTAitem20a = 30.13 x jis@cF3 (psi)
26° WS A upload:
Average strain per % CPLT load, ^s/%load = (21.271 + 19.281 + 21.39) -r 3 = 20.65
From Reference 3 and Figure B53, the stress of DADTA Item 20a per % CPLT load, psi/%load = 666.72
So, the stress to strain ratio = (666.72 - 20.65) = 32.29
Therefore, a@DADTAitem20a = 32.29 x |as@cF3 (psi)
56° WS A download:
Average strain per % CPLT load, us/ %load = (13.953 + 13.375 + 14.343) + 3 = 13.89
From Reference 3 and Figure B53, the stress of DADTA Item 20a per % CPLT load, psi/%load = 446.45
So, the stress to strain ratio = (446.45 -13.89) = 32.14
Therefore, a@DADTAitem20a = 32.14 x JLIS@CF3 (psi)
26° WS A download:
Average strain per % CPLT load, \xz/ %load = (8.2342 + 8.1332 + 8.1239) H- 3 = 8.16
From Reference 3 and Figure B53, the stress of DADTA Item 20a per % CPLT load, psi/ %load = 329.75
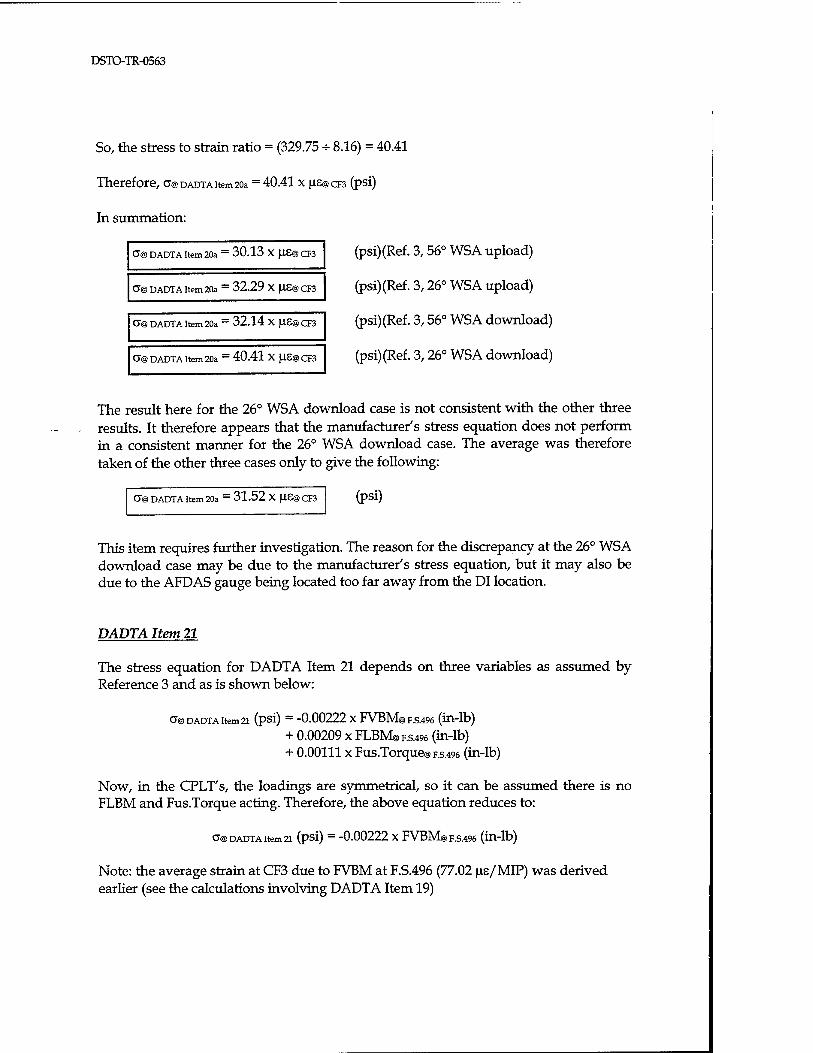
DSTO-TR-0563
So, the stress to strain ratio = (329.75 -^ 8.16) = 40.41
Therefore, O@DADTA item 20a = 40.41 x (XE@CF3 (psi)
In summation:
' (psi)(Ref. 3,56° WSA upload)
(psi)(Ref. 3,26° WSA upload)
(psi)(Ref. 3,56° WSA download)
(psi)(Ref. 3,26° WSA download)
The result here for the 26° WSA download case is not consistent with the other three results. It therefore appears that the manufacturer's stress equation does not perform in a consistent manner for the 26° WSA download case. The average was therefore taken of the other three cases only to give the following:
O"® DADTA Item 20a = 30.13 X JIE@ CF3
Cvg DADTA Item 20a = 32.29 X |J.S@CF3
0"@DADTA Item 20a = 32.14 X|IS@CF3
0"@ DADTA Item 20a = 40.41 X fJ.S@ CF3
0"@ DADTA Item 20a — 31.52 X }J.S@ CR3 (psi)
This item requires further investigation. The reason for the discrepancy at the 26° WSA download case may be due to the manufacturer's stress equation, but it may also be due to the AFDAS gauge being located too far away from the DI location.
DADTA Item 21
The stress equation for DADTA Item 21 depends on three variables as assumed by Reference 3 and as is shown below:
0@ DADTA Item 21 (pSl) = -0.00222 X [email protected] (in-lb)
+ 0.00209 x [email protected] (in-lb) + 0.00111 x [email protected] (in-lb)
Now, in the CPLT's, the loadings are symmetrical, so it can be assumed there is no FLBM and Fus.Torque acting. Therefore, the above equation reduces to:
o@ DADTA item 2i (psi) = -0.00222 x [email protected] (in-lb)
Note: the average strain at CF3 due to FVBM at F.S.496 (77.02 ns/MIP) was derived earlier (see the calculations involving DADTA Item 19)

DSTO-TR-0563
So, using subtitution, the stress at DADTA Item 21 as a function of the strain at AFDAS CF3 can be expressed thus:
a@ DADTA item 21 (psi) = -0.00222 x [email protected] (in-lb)
= -0.00222 x us® a* x 10* / -77.02 = 28.82 xu.s@cF3
In summation:
O"® DADTA Item 21 ~ 28.82 X |4.S@CF3 (psi)
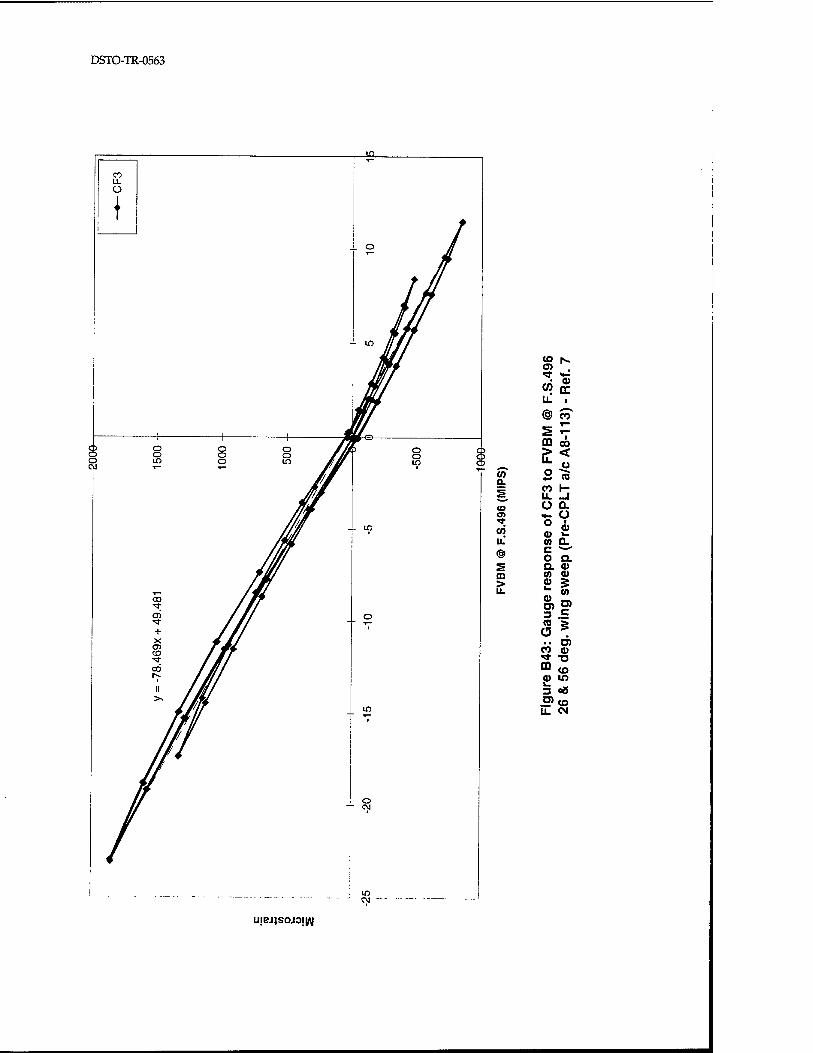
DSTO-TR-0563
to fs. o> . "* f CO c U. i
@ m «■
2 V CO cö r* <
Q. 2 ra
(O
co H O Q.
O) *- O T O J. to 0) >- UL (0 D.
© c —' o a
? a v ID to a> > £ 5 U. *- to
3 .E (0 >
■ ■ O) CO <D S "o m to a> in 5 08
iZ CM
ujej)soj3iini
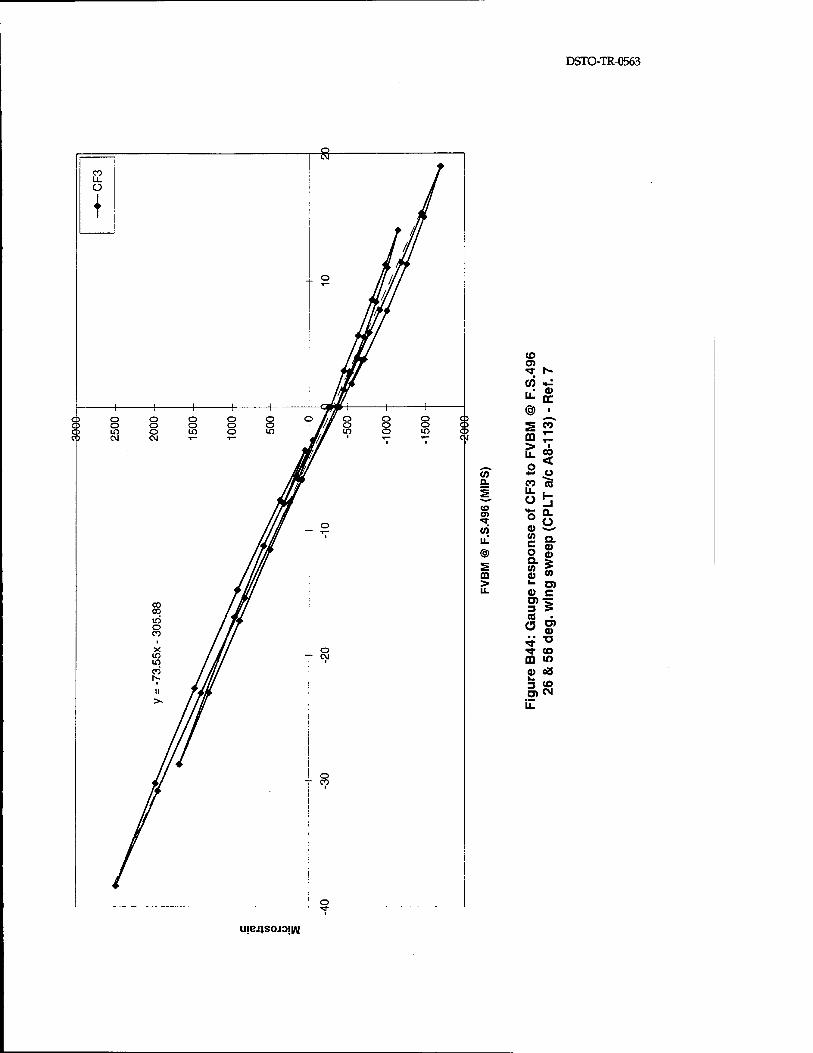
DSTO-TR-0563
CO <n <*■ 1*-
0) M-:
^£ <§) ■
S w CO r
£3 «-■■» o «« CO 4- Ü 0. CO "Jg £ &1 CO
!& *T
(0 a) ^^ u.
O a) @ 2 CD 0) CO > »- c> U. V c »5
(0 • £5 O)
^- to CD in O 08 3 CO 0)CX
UjBJlSOJOjW
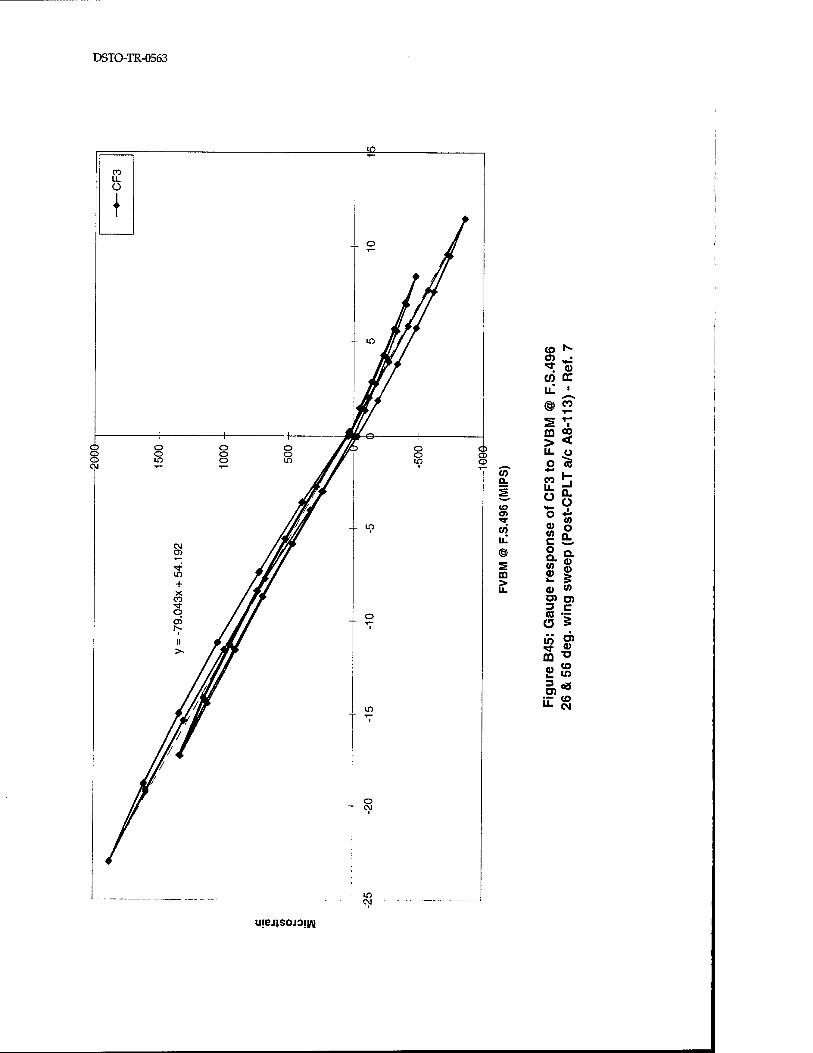
DSTO-TR-0563
(O Is"
^ CD 0) cc
CO
CO Q.
SO O) «sr CO
m >
m 00 > < IL u O «?
CO li. Ü
-1 a. ü
o *v> CO o o
CO c a. o Q. CO V Im
a
5 tt) CO O) O) 3 c CO O ss in Ö) *t CD m 13
CO lO
3 o3
u. CO CM
u)ej}SOJ3!|/\|

DSTO-TR-0563
*~ r» co . Ifl *r .Ji CO (0 tc U. i
@ CO ^™
S v CD co r* <
CO D.
•*■ ü
2 ro s co H
LL _l Ü OL
CO H- O in CO ° i
CO »_ u. CO OL
© c w
o a 5= Q. CO CD CO CO > £ 5 u. CO
&» = .E CO §
.. O) CO CO S "o CD <o co u) 3 oB o> <e u_ CM
U|BJ}SOJO!W

DSTO-TR-0563
CO
(/) *: ill £
CO
(0 a.
CO m to
m >
> II
i CO
o < 4-» o CO «5 LL Ü _l O a.
o CU 10 c o (1) Q. CO V (A
a» 3 CO
C5 O) a>
N- TJ *tf CO ffl IT)
V oB v. 3 CO O) CM
UIBJ;SOJO|W

DSTO-TR-0563
CO a.
m to
m > UL
T- N-
in «
@ <2
> < u. o O "Ä
£9 0 «J
CO 0) 0 (A C CL O Q. 10 0)
Q. (U a> 3
0) (0 G> O) 3 c (0 Ö 3 Of) 0 ^- (L) CO U
V 1-
CD in
3 08
u. CO CM
ujejjsojojw
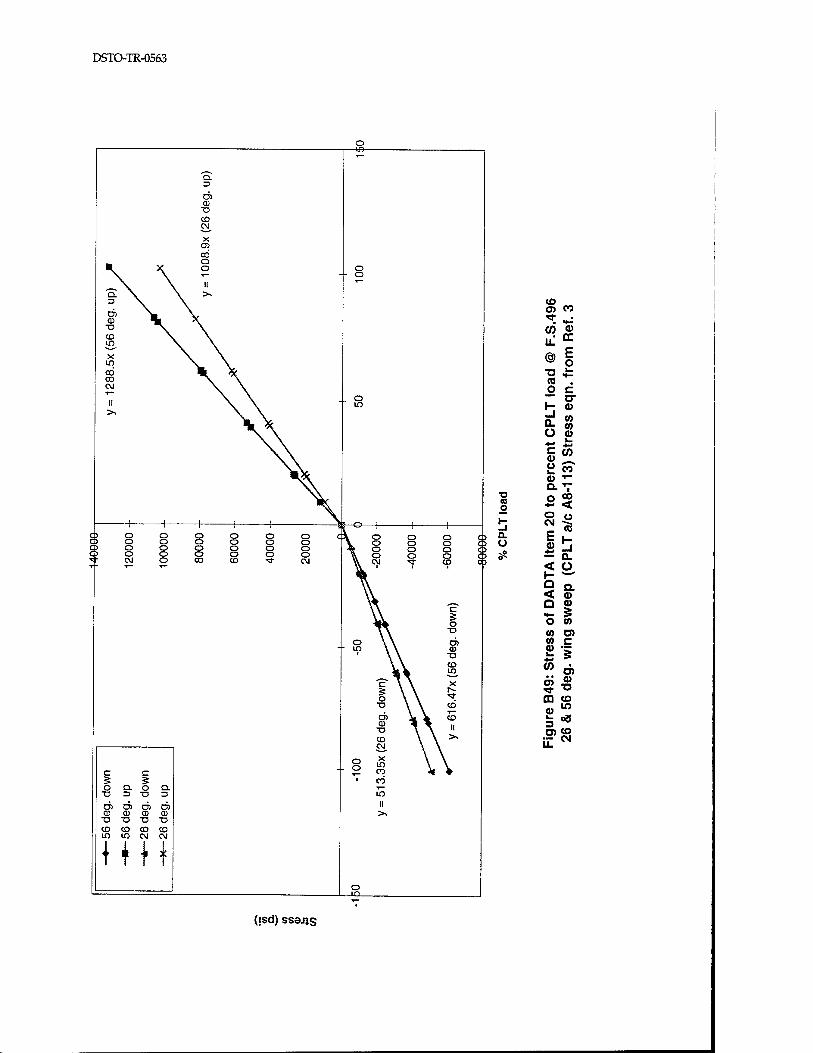
DSTO-TR-0563
Q. 3
O) CD
■o CD CM
X CT>
CO o o
o -ts-
o o
o o CD O q5 o
(M
o o o o o o o o o o o o O 00 CD
c c O Q. O Q.
T3 3 "O 3
0)0)0)0) CO CU CD 0) -a -o -o T> CD CO CO CO lO lO N W
Hit
o ID
o o o o o o o o c\j ■*r
o o
CD ■o
CO
X m CO
CO
iS II ><
o o o o CD
c o
■o
o> CD
X5
CD
i2-
CO
CO II
C) o o C3
■D CO o
a Ü
CO CO CO *3- . (f) o LL cc @ E
o TJ 1-
(0 , O c ~™ cx H CO _J Q. tO
CO U CO 4-"
I-
c (1)
(/) Ü CO CO T—
a. T-
o 00 +■■ < o a CM "» fc H U) _J
a. < ü 1- ^-^ Q o < CO D CO «f- 5 o to to o> (0 c 0) 3 (0 d) en CO
m CO 4) in
3 aS ro CO
CM
o m
Qsd) ssBjjs

DSTO-TR-0563
o C3
C C 5 5 0 Q. O Q.
0)0)0)0) 01 ID (D ID ■D T3 T3 "O CD CD CD CO ID ID CM CM
O 00
■D IB o
a. ü
"O CO 1». o m
H—
_l DC a. ■
ü CO •*-■ T— c T— 0) 1 Ü CO
<D <
Q. .o O CO *•* H-
CO _l u. Q. u Ü ■ o 0) CD Q. CO c O. o CD a CD CO 03 CO
a> O) O) c 3 CO 3 Ö O) ■ a 0) O ID TJ
ffl CO in
0) cS 3
5>S
u!EJ}soao!K\|
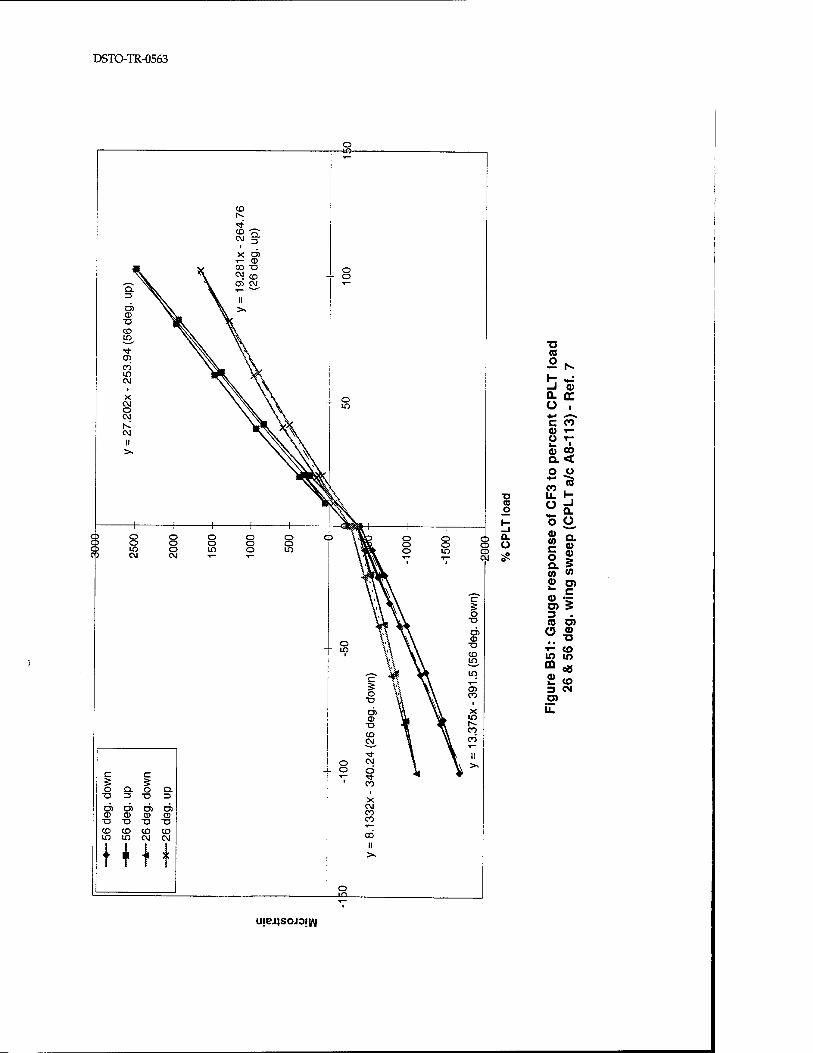
DSTO-TR-0563
Q. 3
© •o CD in
CD
CO in CM
CM O CM
CM
II
CO K •>* CD CM 3
X O) T— a) CO ■a CM CO CD CM ^ II ><
o -to-
o o
c o
■o
o o o o o o o o o o in o in o w CM CM i—
c a. o a. 3 T3 3
o> O) o> o> CD CD CD CD
■O "O -D -O
CD CD CD CO in in CM CM
O o
(0 o
Q. Ü
X. CM CO CO
CO
II
o in
T3 CO O
N 1- _l O a. a ü i
** ^■s
c CO CD T-
o T"
<1> 00 a < o o *■» Jfi CO LL 1- Ü
o
_l a. ü
CO c o a
Q. a> a> 3
CO CO
c a> O) £ 3 . CD O) Ö 0)
^ <o in m ffl oS
CO 3 CM O) li.
u!ej}sojo|i/\i
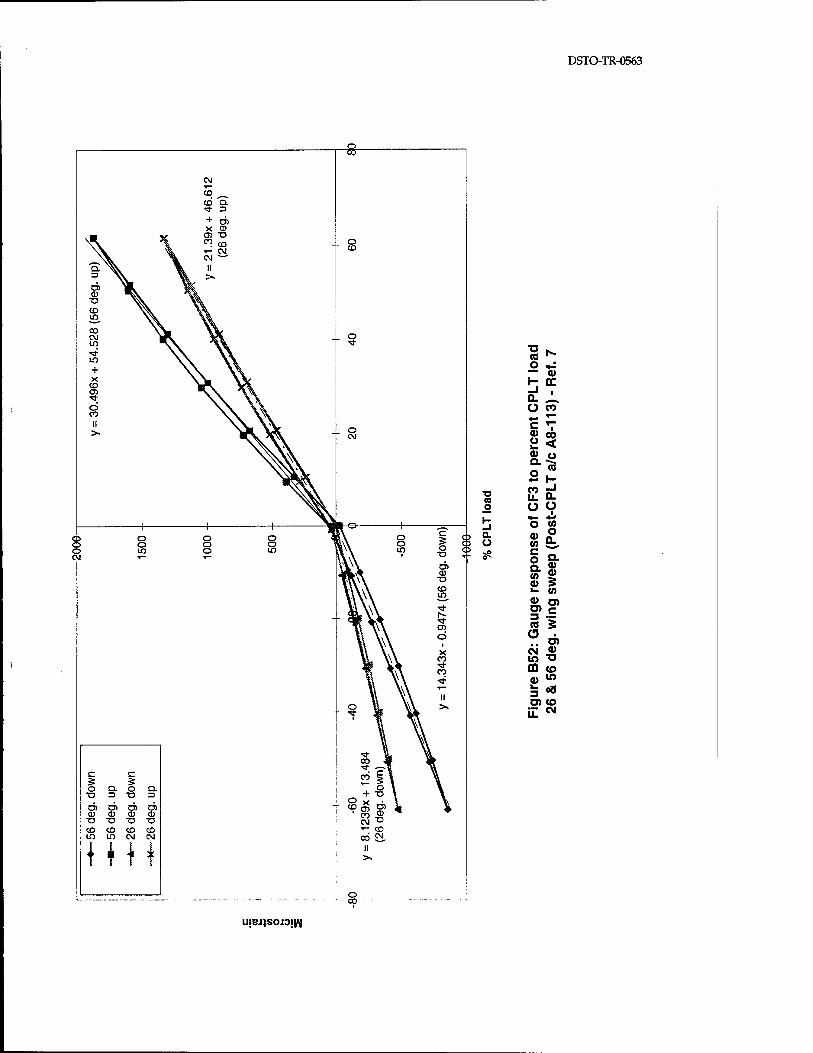
DSTO-TR-0563
c o
■o
c
0)0)0)0) 0)0)03 0 "O T3 X3 "O CD CO CO CD ID m CM CM
lilt o CO
■o (0 o
Q. U
o M-: — 0)
a. ^ o CO
c V o> 00 e < d) o
°2 +" I—
u. a. o o «t- *•> O «
• s. w !£, § D. Q. ° 0) 3
& o> = 1 .. O)
CM «J in ^ CD to 0) w 5* D> CO il CM
uiej)S0J3iyg
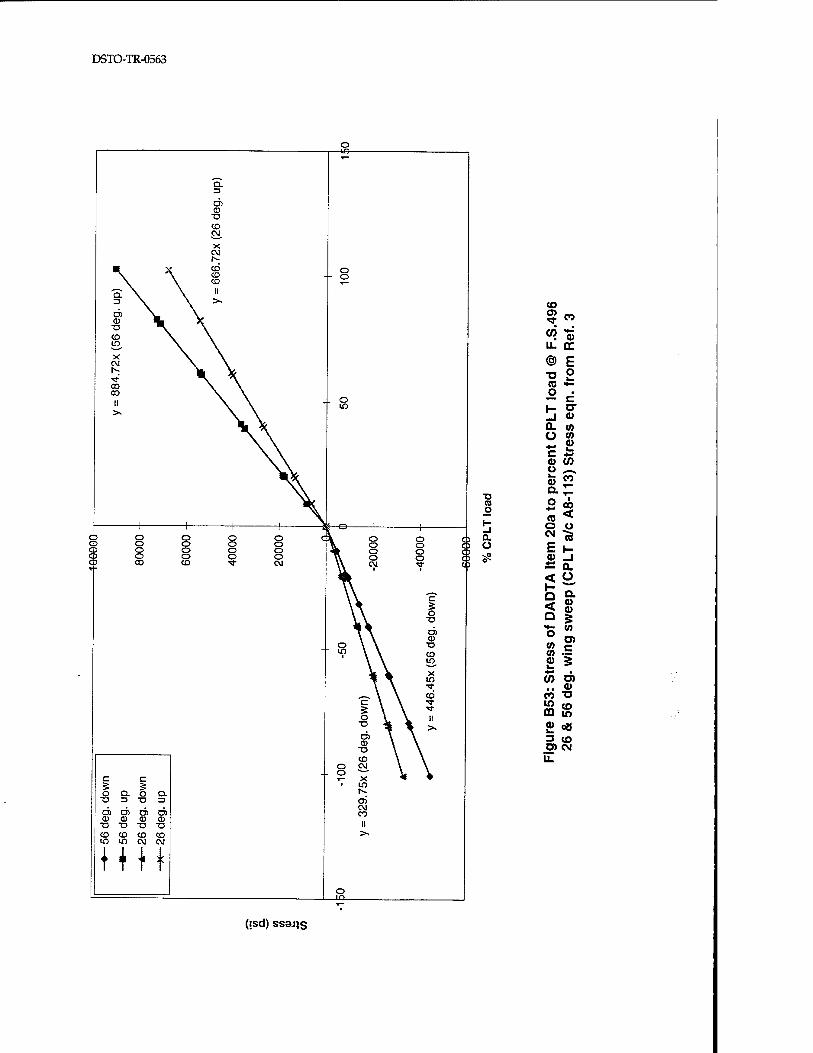
DSTO-TR-0563
o -te-
er c
O Q- O Q. "O D T3 3
d) o> d) d) ID ID 0) $
TJ -o XJ n CD CD CO CD W W CM CM
C3 O C3 O
O
CO
S« °? 'S UL CE
<§> E
"2 2 «5 *- o ^ — c 1- p* _j a> Q. en Ü «)
CD
V to o ^_ a? co
■o CL £
(0 o
_l Q.
o u N "J8
O E h- s? O _J
ä a. < o »- "~* Q 9- % 8 Q 3 •r w O _ .1 o> 2 c (0 .= £ ^ «-* (/) O) .. o
eo "o
00 in
£ oB 3 <o CO tN u.
(isd) ssajis
DSTOTR-0563
B8: AFP AS location CF5, Channel 9, DADTA Item 24a.
DADTA Item 24a
From Reference 3, the following load to stress equation was assumed for DADTA Item
24a:
O® DADTA Item 24a (psl) = -0.00834 X WBMyy (in-lb)
+ 0.20 x Wing Shear® Kvot (lb)
Each value of WBMyy and Wing Shear® Pivot was calculated for its corresponding percentage CPLT load and then entered into the above equation, enabling a plot of stress versus % CPLT load to be produced. An example of how to calculate WBMyy is given in Appendix E. Four curves are obtained (56° WSA upload, 26° WSA upload, 56° WSA download and 26° WSA download).
From the strain survey (Reference 7), plots of strain versus % CPLT load were produced. Four curves were also generated for the same cases as mentioned above. Now the ratios of stress at DADTA Item 24a to Microstrain at AFDAS CF5 for the corresponding cases are as follows. (See Figures B54 to B56 for reference to the values):
56° WSA upload:
Average strain per % CPLT load, us/ %load = (17.212 +17.233 +16.978) * 3 = 17.141
From Reference 3 and Figure B57, the stress of DADTA Item 24a per % CPLT load, psi/%load = 1584.6
So, the stress to strain ratio = (1584.6 -=-17.141) = 92.45
Therefore, a® DADTA item 24a = 92.45 x us® ere (psi)
26° WSA upload:
Average strain per % CPLT load, us/%load = (10.769 +11.191 + 10.836) + 3 = 10.932
From Reference 3 and Figure B57, the stress of DADTA Item 24a per % CPLT load, psi/%load = 935.83
So, the stress to strain ratio = (935.83 -=-10.932) = 85.60
Therefore, a® DADTA item24a = 85.60 x US@CFS (psi)
DSTO-TR-0563
56° WSA download:
Average strain per % CPLT load, us/ %load = (6.5276 + 5.735 + 6.6185) + 3 = 6.29
From Reference 3 and Figure B57, the stress of DADTA Item 24a per % CPLT load, psi/%load = 611.22
So, the stress to strain ratio = (611.22 -=- 6.29) = 97.17
Therefore, a@DADTAitem24a = 97.17 x US@CF5 (psi)
26° WSA download:
Average strain per % CPLT load, us/%load = (5.3628 + 5.0056 + 5.3584) + 3 = 5.24
From Reference 3 and Figure B57, the stress of DADTA Item 24a per % CPLT load, psi/%load = 446.34
So, the stress to strain ratio = (446.34 + 5.24) = 85.18
Therefore, a@DADTAitem24a = 85.18 x USOCFS (psi)
In summation:
(psi)(Ref. 3,56° WSA upload) 0"@ DADTA Item 24a ~ 92.45 X US@CF5
O"® DADTA Item 24a — 85.60 X US@GF5
0"@ DADTA Item 24a ~ 97.17 X US@CF5
0"@ DADTA Item 24a — 85.18 X US@CF5
(psi)(Ref. 3,26° WSA upload)
(psi)(Ref. 3,56° WSA download)
(psi)(Ref. 3,26° WSA download)
Strain data for AFDAS gauge CF5 was also obtained in the Pre & Post doubler tests performed at Amberley in 1990. However, only one wing sweep angle was tested - wings forward with L.E. sweep = 16°. Also, only one jack point was used per wing to apply the loads - "Jack H". See Reference 6.
A relationship between the AFDAS CF5 strain data due to the Amberley test loads and the DADTA Item 24a stresses from Reference 3 (caused by the same loads) was formulated.
From the strain survey (Reference 6) and the plots generated in Figures B58 and B59, the average strain at AFDAS CF5 per % Test load will be:
DSTO-TR-0563
Average strain per % Test load = (2.2221 + 2.3327) + 2 = 2.2774 us
From Reference 3, the stress of DADTA Item 24a per % Test load (see Figure B60), psi/%load = (198.81 - 2.2774) = 87.29
Therefore, in summation:
a@DADTAitem24a= 87.29 X^CFS | (psi)(Ref. 3,16° WSA up & down loads)
Since only one relationship can be used to cover all WSA and load directions, it was considered reasonable to determine the average of all five equations giving the
following:
O® DADTA Item 24a = 89.54 X ^S@CF5 (psi)
It should be noted that the loads and stresses in this area are complex and the AFDAS strain gauge is not located directly at the DADTA Item 24a location. It is entirely possible that the strain response at the AFDAS gauge location will respond in different proportions to the strain response at DADTA Item 24a with variations in parameters such as wing sweep angle and loading direction. The average relationship determined here is considered to be the best estimate based on the available data.
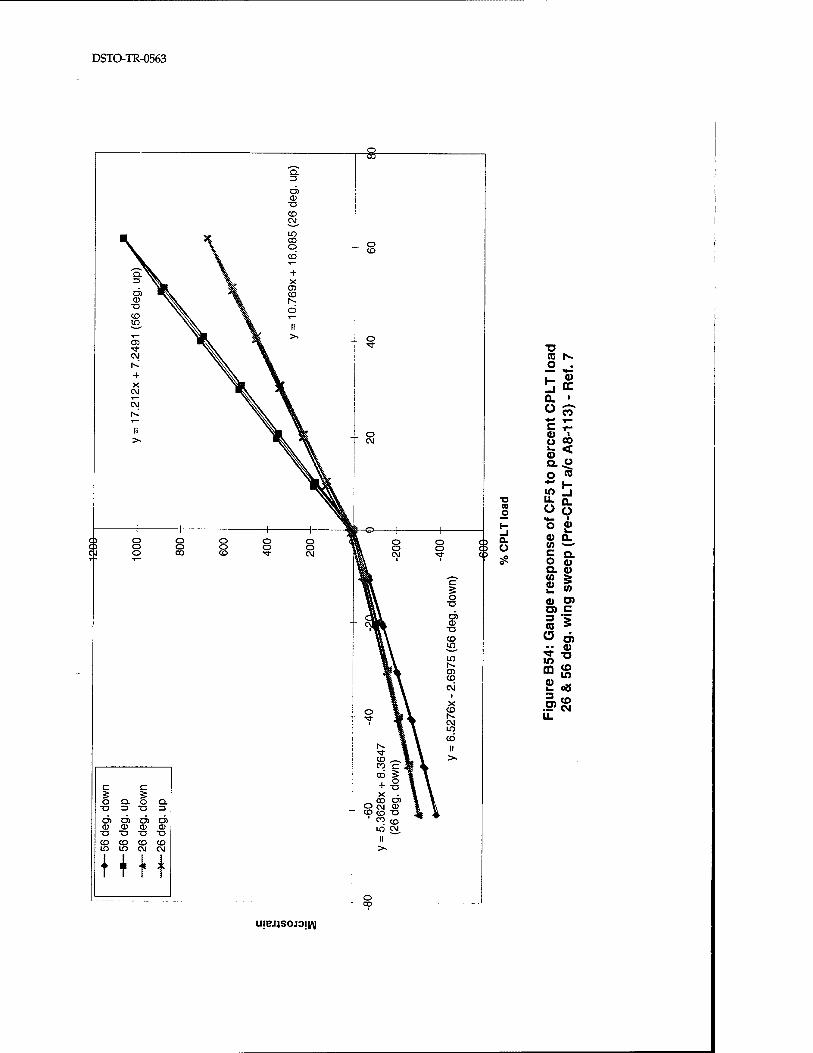
DSTO-TR-0563
o O
O Q. O Q. T3 3 "O 3
d> o> o> d> CD 0) CD CD
•D TJ T! TJ CO CO CO CD m m CM CM
? CO IT) CNJ,
II >>
T3 CO |v O . — M—
LJ DC Ct <
o« +■* T— c ,- 0) -L o <5 *- < Q..O o *3 ** h- fO -I
T3 U_ Q. CO o o ü
*- J 1- o £ _l Q. a> 0. O CO >-'
c Q. ^ O Q) a. Q) (0 > £ v> 0) o> CO c
3 * C5 d) " 0) in "
*g £<* =» ,« »S
o oo
UjEJiSOJOjW
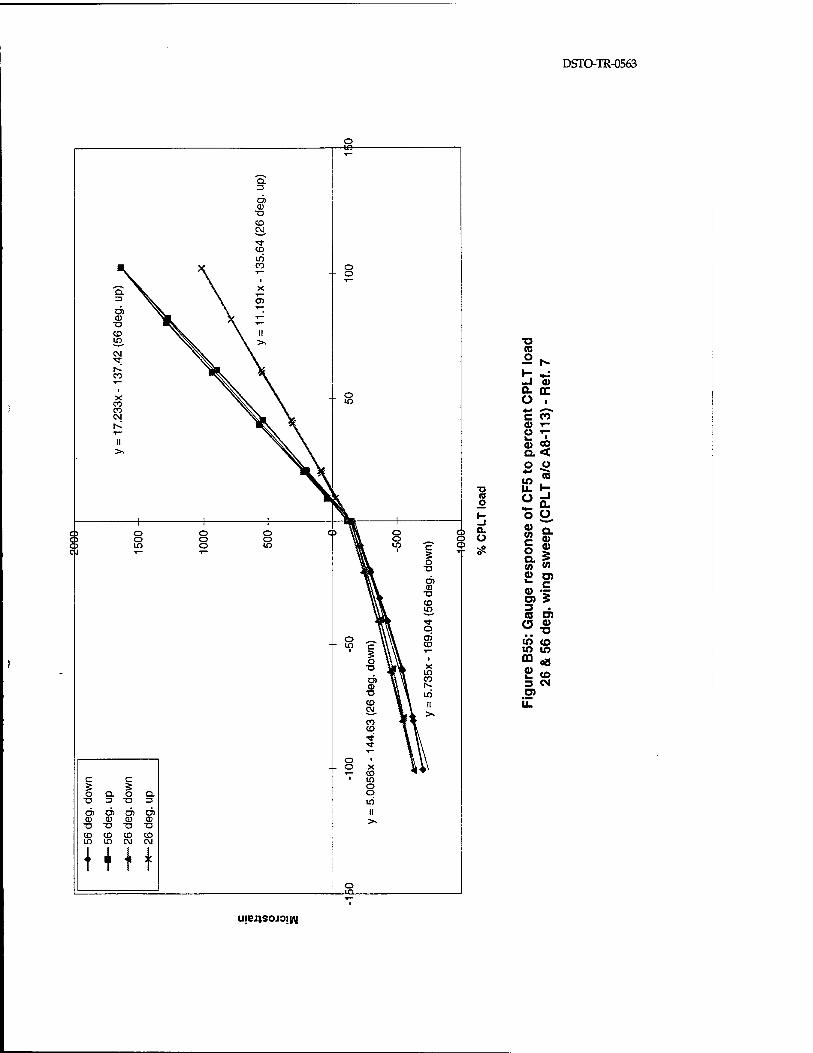
DSTO-TR-0563
o o <P CJ
c o
■o
c a. o a. 3 T3 3
O) O) 0> O) a) 0) o) a)
■O "O T3 "O CD CD CD CD W in CvJ CM
lilt
o -tf»-
o in
(8 O
a. o
T3 CO
■Si*. h -^ ~l CD a. a o . c CO
tu 00 Q.< O Ü
"- *-. °EL
® Q. C ® § | Q. > (0 w
a) 5 3 ■ (0 o>
<5 o Ü) (O m m CO oj,
£ (O 3 CM O) E
u;ej;soj3i|/\|

DSTO-TR-0563
10 o
a ü
O +1 — 0)
Ü? Q- JL. ü CO *- *-
0) oö
°£ +* t—
LL Q. ÜÜ «•— *•> o <n
i * Q. «> w ® a> 3 »- w & o>
"I to <u in "O CO to a> "o 5* O) to
c c 3 & o a. o a.
o> öl d> Ö) CD CD CD CD
■o T3 -a -o CO CO CD CD m lO CM CM
uiensojoiyy
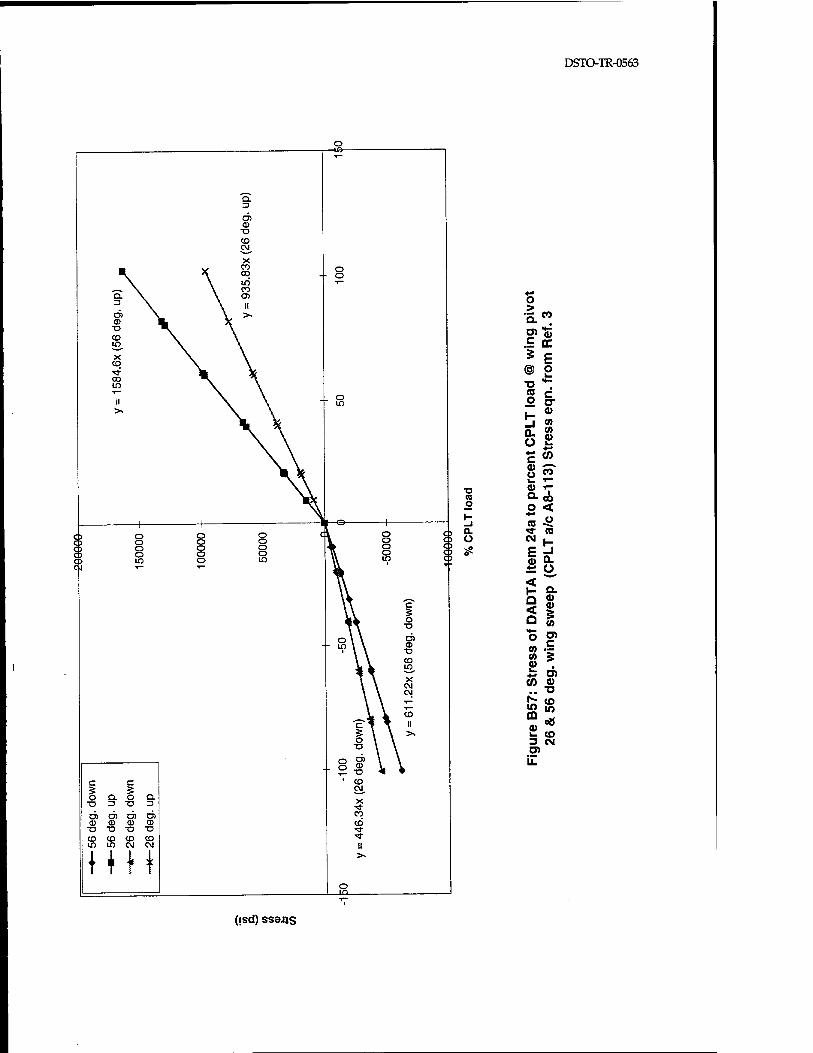
DSTO-TR-0563
o -ts-
8 g> C4
c c O Q. O Q.
o> d> o> o> CD CD CD CD
■D 73 -D T3 CD CO CD CO Iß ID CM CM
Hit
o •| CO
* E ® Q
CO o
Q. Ü
C ty a» CO CO o
0)
C) o O o
■c RS o
0. Ü
§ CO 0) *- Q-cö o< co -S>
■* CO
eg Si Q § *■" «««
CO CO 0)
0) 0) ■D
3 CO CM
o in
(;sd) SS3JJS
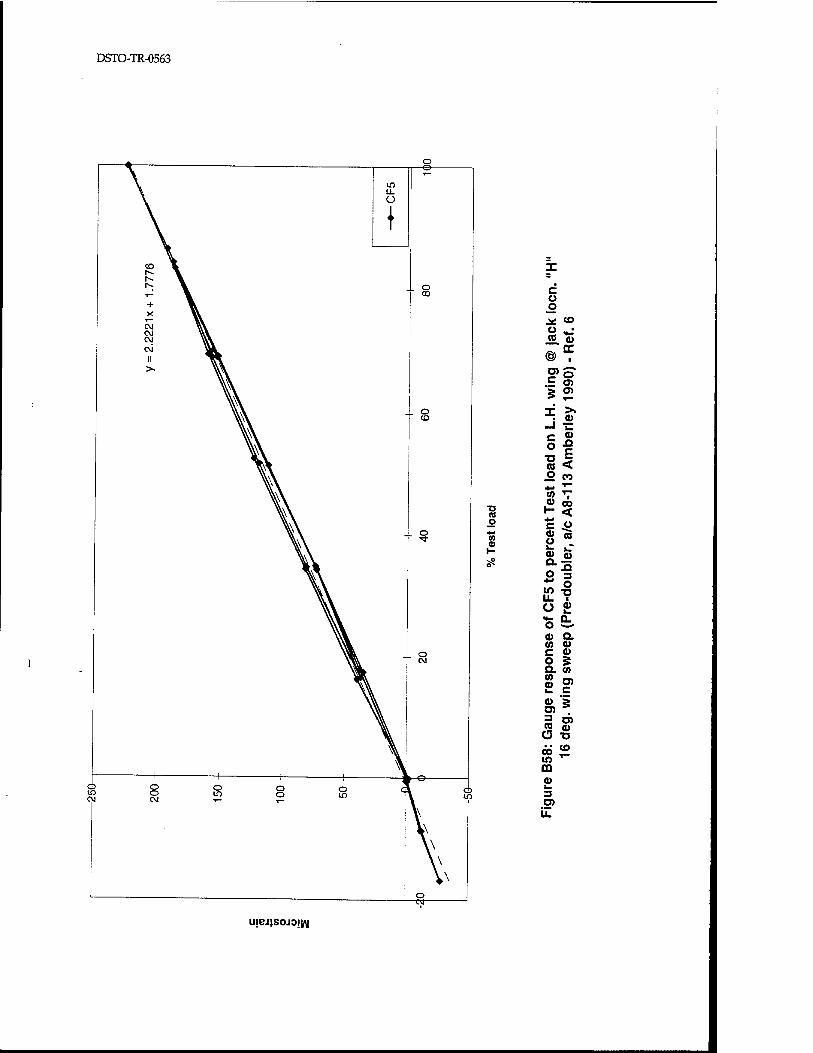
DSTO-TR-0563
■o (0 o *-• 05 0)
c Ü o J£ CO o -S. @
0)
O) o" c O)
5 a>
X >. _l t_
c o
CD
•a (0
b <
o CO T"
CO ■
CD on H < c 0)
.o m
Ü ^ CD o> CL
J3 O n +* o
UL ■ Ü V
•^ n O o Q. (0 O c CD o g Q. CO CO 0) O)
L: a> «: O) 3 IT) (0 (1) Ü •o eö in
CO T—
CO 0)
3 a> u.
uieijsojoi^
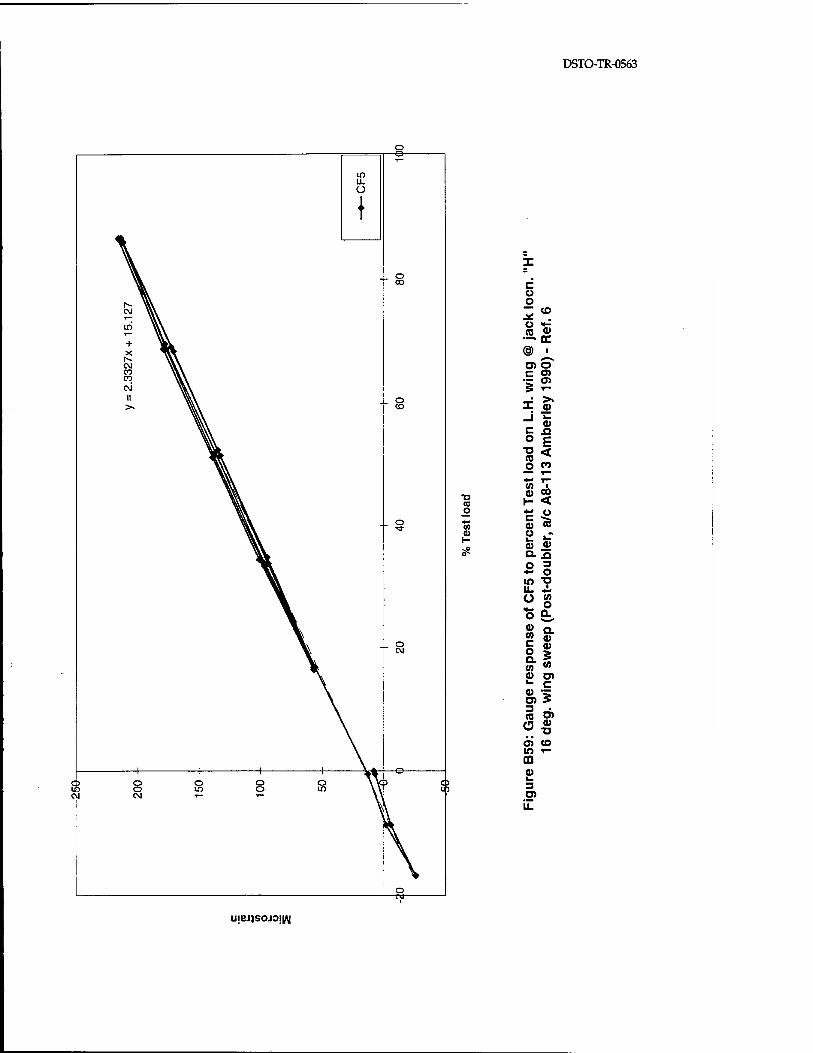
DSTO-TR-0563
c o o — to ^c o t: eo J2> — DC @ ■
O) o c o> •= o> 5 T- _: >» x © -1 i: _ <J> C Si
° E "S < (0 o co ^™ ^~ +■• T— OT ' Q) 00
es H < O ** ü (0 0) (5 o o - t- *- i; 0) 0)
o 3 *- o in "9 U. <!. w o o Q-
<n g-
a> ci *- c o) 5 3 (0 5» a£
<3> (O If) T- ffl 0) 1_ 3 o> u.
uiej;soj3!im
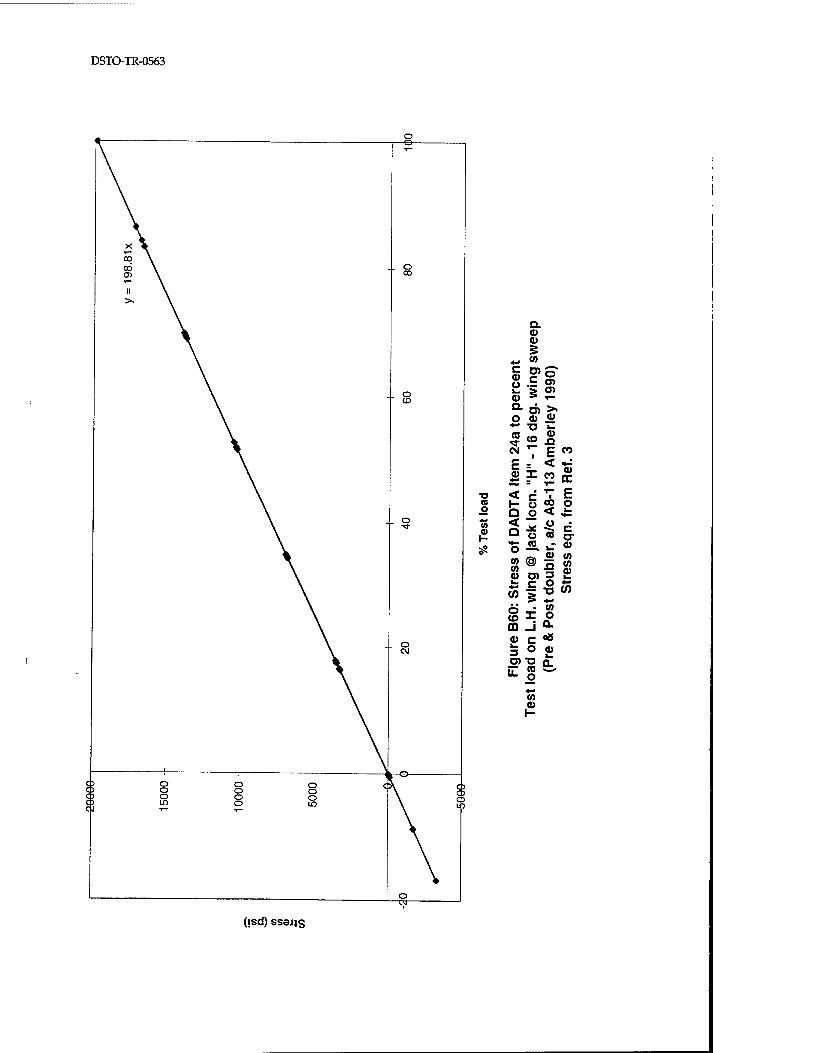
DSTO-TR-0563
a. a> CU S
+•* CO c cu o c
5
o O) O)
o T-
Q. ni >. O a> o ♦■» "D ^. (0 CO
cu XI
CM F CO
E - < DC 05 X CO
■a < c 1-
■ E 2 1- n CO o o Q o < 1M
o 1 c rr
s? o CO vT 0)
co CO
0> £1 3
CO CO cu v.
(0 c '5
o ■o *-•
(0
o CO X
CO o
03 _l a. V c: o8 v. 3 o o
Fig
load
a
4-* CO cu
(isd) ssajjs

DSTO-TR-0563
B9: AFP AS location FFI, Channel 5, SLMP Control Point FF1.
SIMP Control Point FFL
It should be noted that the stress equation for this control point gives no allowance for wing sweep. However, the plots from A8-113 (Figures B61 to B63) indicate a noticeable wing sweep dependency, suggesting that the equation may in fact have a deficiency. [Also, the slope from the following stress equation is negative, whereas the slopes from the strain survey are all positive]. Even though these factors do not inspire great confidence in the results, the calculations are still presented below for completeness.
From Reference 2, the following load to stress equation was assumed for SLMP Control Point FF1:
Control Point FFI (pa) = -0.00198 X [email protected] (Ül-lb) ± 0.00048 x [email protected] (in-lb)
Since only symmetrical loads are applied in the CPLT's, it can be assumed that there is no FLBM acting, so the above equation reduces to:
0®ControlPointFFl (psi) = -0.00198 X [email protected] (Ül-lb)
Experimental data (Reference 7) was available which gave a relationship between strain at the AFDAS FF1 location as a function of applied load (FVBM at F.S.448). The values of [email protected] were interpolated from the figures shown in Appendix C. Using the data from Reference 7, the strain response at gauge location FF1 was plotted as a function of applied load. The results are shown in Figures B61 to B63. These plots are considered to reflect accurate, repeatable strain response. It was therefore decided to determine a figure based on the average as follows:
56° WS A upload:
Average strain per FVBM®F.s.448, us/MIP = (188.21 + 182.76 + 190.54) + 3 = 187.17
ie: us® AFDAS FFI = 187.17 x FVBM® FS.448 (MIPS) us® AFDAS FFI = 187.17 x 10-« x FVBM® F.S.44S (in-lb) FVBM® F.S.448 (in-lb) = us® AFDAS FFI X 106 / 187.17
Using direct substitution into the Reference 2 stress equation:
a® Control Point FFI (pSl) = -0.00198 X FVBM® F.S.448 (Ül-lb) = -0.00198 X US® AFDAS FFI x 106 / 187.17
= 10.58 X (IS® AFDAS FFI
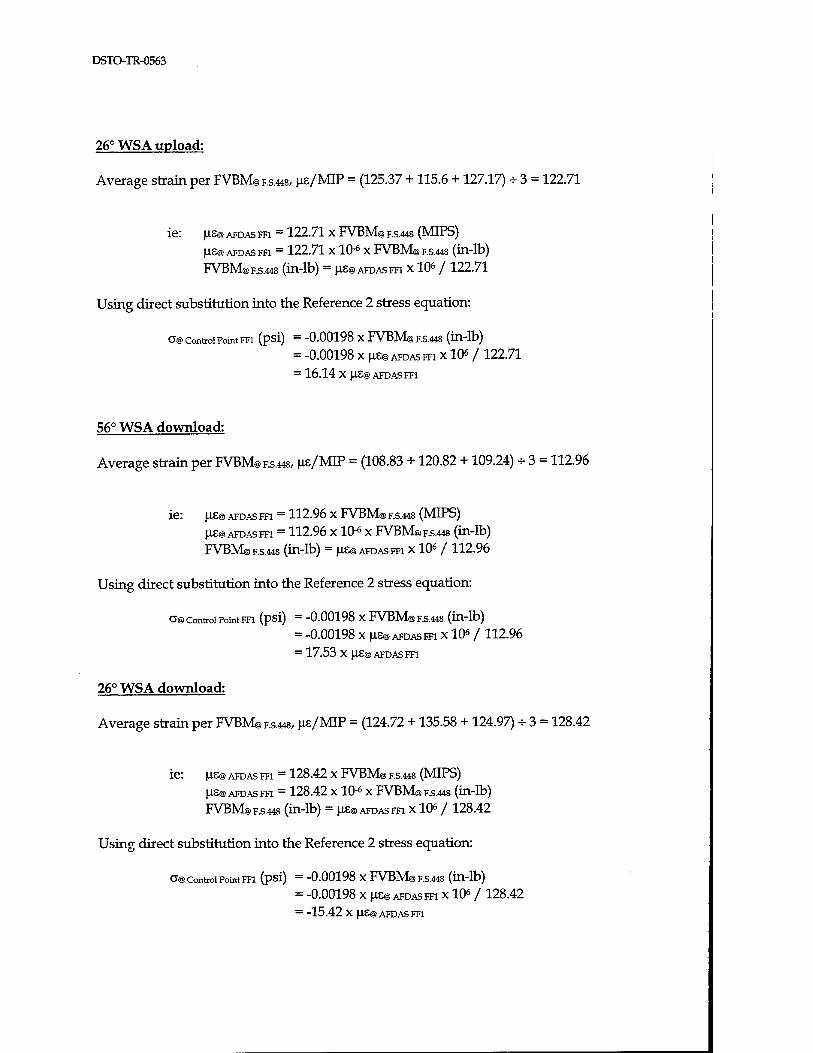
DSTO-TR-0563
26° WSA upload:
Average strain per [email protected], us/MIP = (125.37 + 115.6 +127.17) ■*- 3 = 122.71
ie: us® AFDAS FFI = 122.71 x FVBM® F.S.448 (MIPS) us® AFDAS m = 122.71 x 10"6 x FVBM® F.S.448 (in-lb) FVBM® F.S.448 (in-lb) = us® AFDAS FFI X 106 / 122.71
Using direct substitution into the Reference 2 stress equation:
a® control Point FFI (psi) = -0.00198 x FVBM® F.S.448 (in-lb)
= -0.00198 X US® AFDAS FFI x 106 / 122.71
= 16.14 X US® AFDAS FFI
56° WSA download:
Average strain per FVBM® F.S.448, US/MIP = (108.83 +120.82 +109.24) -s- 3 = 112.96
ie: us© AFDAS FFI = 112.96 x FVBM® F.S.448 (MIPS) US® AFDAS FFI = 112.96 X 10"* X [email protected] (Ül-lb)
FVBM® F.S.448 (in-lb) = us® AFDAS FFI X 106 / 112.96
Using direct substitution into the Reference 2 stress equation:
a® Control Point FFI (psi) = -0.00198 X FVBM® F.S.448 (Ül-lb) = -0.00198 x us® AFDAS FFI x 106 / 112.96 = 17.53 x us® AFDAS FFI
26° WSA download:
Average strain per FVBM® F.S.448, us/MIP = (124.72 +135.58 + 124.97) -s- 3 = 128.42
ie: us® AFDAS FFI = 128.42 x FVBM® F.S.448 (MIPS) us® AFDAS FFI = 128.42 x 10⁻⁶ x [email protected] (in-lb) FVBM® F.S.448 (in-lb) = us® AFDAS FFI X 106 / 128.42
Using direct substitution into the Reference 2 stress equation:
o@ control Point FFI (psi) = -0.00198 x FVBM® F.S.448 (in-lb) = -0.00198 x us® AFDAS FFI X 106 / 128.42 = -15.42 x us® AFDAS FFI
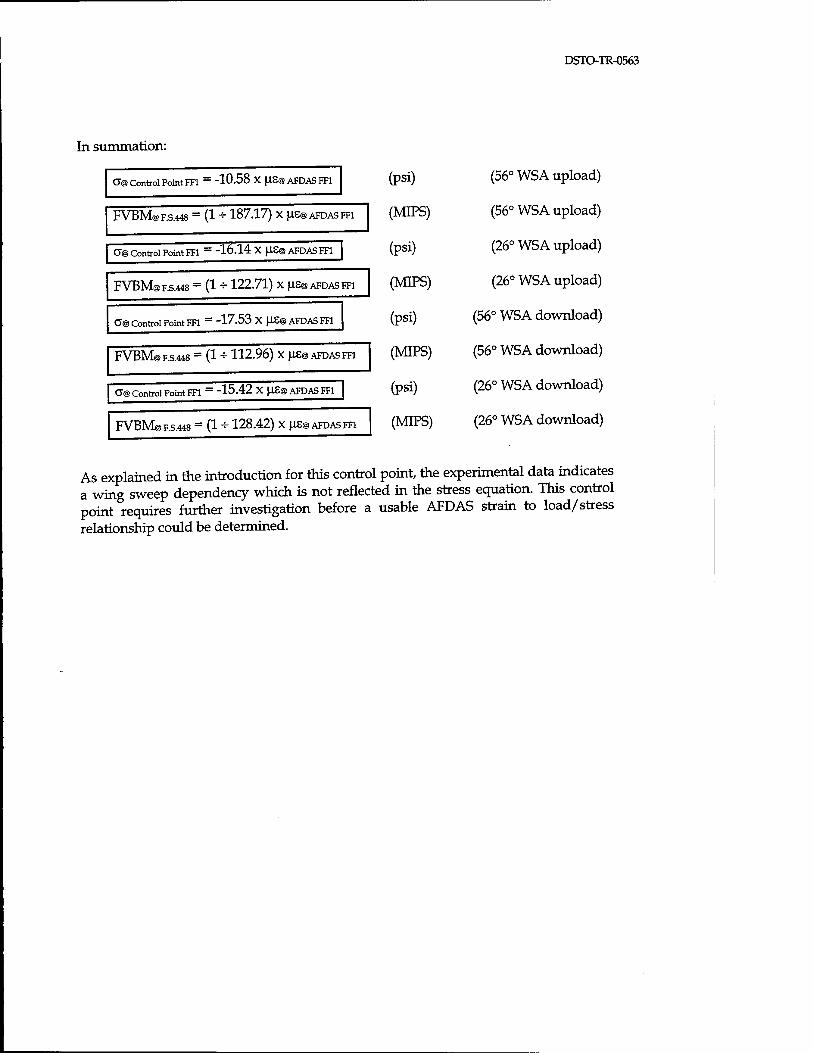
DSTO-TR-0563
In summation:
(psi)
(MIPS)
(psi)
(MIPS)
(psi)
(MIPS)
(psi)
(MIPS)
0@ Control Point FF1 = "10.58 X (IS® AFDAS FF1 1 (56° WSA upload)
[email protected] = (1 +187.17) x JJ.S@ AFDASFFI (56° WSA upload)
(26° WSA upload) O® Control Point FF1 = "16.14 X |IS@ AFDAS FF1
[email protected] = (1 -:-122.71) x \is@ AFDASFFI (26° WSA upload)
CT@ Control Point ITl = "17.53 X |iE@ AFDAS FF1 (56° WSA download)
[email protected] = (1 +112.96) x ^SOAFDAS FF1
1
(56° WSA download)
(26° WSA download) CT@ Control Point FF1 = "15.42 X US@ AFDAS FF1
[email protected] - (1 * 128.42) x ps@ AFDASFFI (26° WSA download)
As explained in the introduction for this control point, the experimental data indicates a wing sweep dependency which is not reflected in the stress equation. This control point requires further investigation before a usable AFDAS strain to load/stress relationship could be determined.
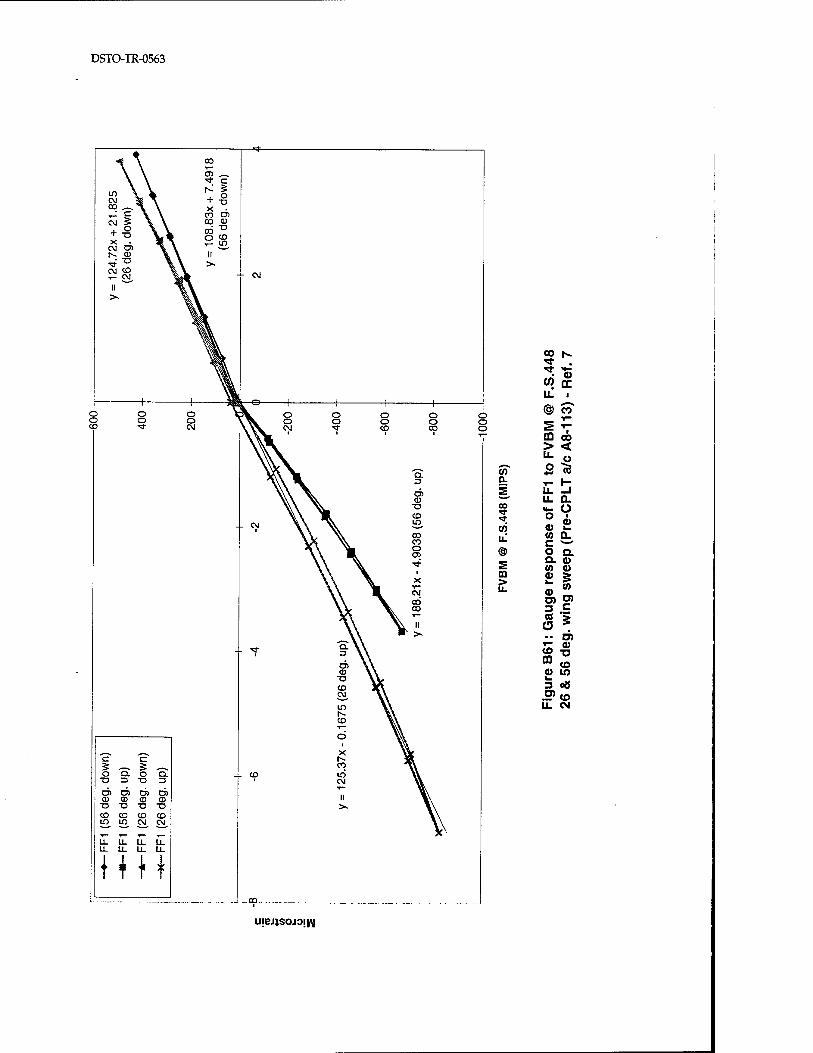
DSTO-TR-0563
O O 35
CD CD
^ . • v
C/> a:
CO
c c O Q. O Q. X3 3 T3 3
D) D) D) Ö) CD CD CD CD T3 T3 -O "O CD CO CD CO in in CM CM
LL U. U. li. LL LL LL LL.
CD oo > < "- ü
<n o 75 a. T- 1- P U. -1
U. Q. CO
eof
re-C
** to LL V) Q.
C «-' W o a. £ a. o)
CO cu m > £ 5 UL
Ö) O)
Gau
.w
in
.. o> T <u £ "o m to (0 lO I- „ 3 08 J? to U. W
u;ensoj3!v\|
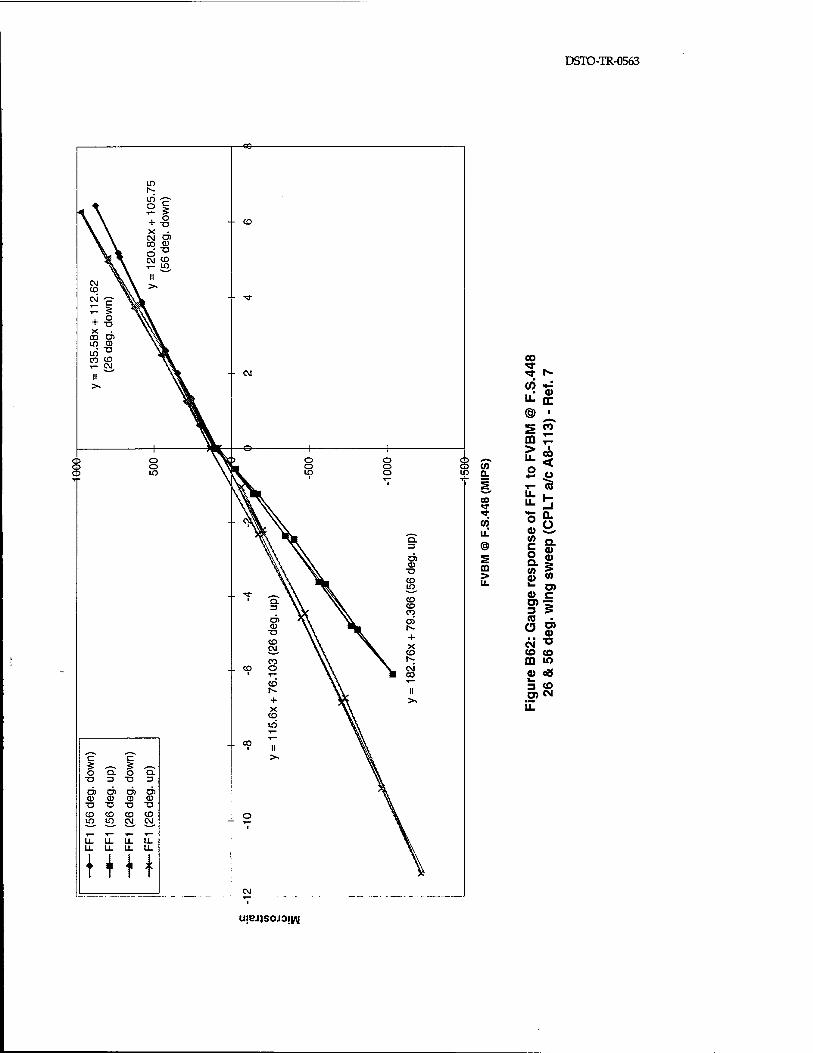
DSTO-TR-0563
lO 1^- lO -^-
2* + -B X •
CM O) 00 CD
°"S CM CO T~ m
i II
CD \ \ >'
4. ° + T5 X .
CO O) m CD in-0
CO CO T- CM
II >>
o c>
c c S ~ 5 ~ O Q. O Q. -o 3 -a => 0)0)0)0) CO CD CD CO -O T3 -O -O CD CD CO CD in ID CM CM
LL LL LL LL U. Li. U. U.
{HI
C5 *~* O Cfl Lp Q.
CO
to
> IL
00 •«*■ «* N-
</) <»- (1)
Li. cc » I
m CO
> u. 1
00 < o u
^™ CO u. u. Ü o Q.
C> CD in c o a (A
a a> a> 5
a> CO imm O) a> c 3 5 (0 ■
C5 a> CM ■o CO CO m to CD 08 ^ 3 CO O) CM
LL
ujejisojoji/v

DSTO-TR-0563
o c 5
+ o X3
X <sr O) CM CD o> X5 o CO
in II >N
O O
c c O Q. O
T3 3 t5 O) O) O) O) CD (D CU CD ■D -D "O T3 CD CO CO CD ID If) CM C\J
LL U- LL. LL LL LL LL. LL.
IIH
00 r- 2 *: ^" fl) (0 oc IL J^ <§> J2 S V CQ fO > < u. o
to o "c3 a _ 1- S CO
fcs! Ü
o +■■
S 8 tn u. 2^ 2 Ig ffi o 2 > S g u_ 0) co
o) en 3 c (0 — a 5 w 5? to o fl} T
£S §>* ES
u!Ei;sojoi|/\|
DSTO-TR-0563
BIO: AFP AS location AF2, Channel 10, DADTA Items 36,37a.
Experimental data (Reference 7) are available which give a relationship between strain at the AFDAS AF2 location as a function of applied load (HTBM at F.S.770.3 and B.L.68.2). The values of HTBM were derived from the figures shown in Appendix C. Using the data from Reference 7, the strain response at gauge location AF2 was plotted as a function of applied load. The results are shown in Figures B64 to B66. These plots are considered to reflect accurate, repeatable strain response. It was therefore decided to determine a figure based on the average as follows:
Average strain per HTBM® F.S.T7O..3 at AF2, us/MIP = (938.25 + 942.81 + 943.56) * 3 =
941.54
ie: us® AF2 = 941.54 x HTBM® F.s.770.3 (MIPS) US@AF2 = 941.54 x 10⁻⁶ x HTBM® F.s.770.3 (in-lb) HTBM® F.s.770.3 (in-lb) = us® AF2 X 10« / 941.54
DADTA Item 36
From Reference 3, it can be seen that two load to stress equations were assumed for DADTA Item 36 - one for subsonic flight and one for supersonic flight. Both are presented here, but it should be noted that approximately 97% of the RAAF's F-lll flying is performed at subsonic speed.
Mach No. <1 am DADTAitemse (psi) = 0.12600 x R/H HTBM (in-lb)
The expression for HTBM at F.S.770.3 can be substituted directly into the above Reference 3 stress equation as such (noting that HTBM® F.s.770.3 is equivalent to R/H HTBM):
a@DADTAitem36 (psi) = 0.12600 x R/H HTBM (in-lb) = 0.12600 x us® AF2 x 106 / 941.54 = 133.82 xue@AF2
Mach No. >1 o@ DADTA item 36 (psi) = 0.12950 x R/H HTBM (in-lb)
The same exercise is repeated again:
a® DADTAitemse (psi) = 0.12950 x R/H HTBM (in-lb) = 0.12950 x us® AF2 x 106 / 941.54 = 137.54 XUS@AF2
DSTO-TR-0563
DADTA Item 37a
The equation assumed for DADTA Item 37a, also given in Reference 3, is as follows:
a@DADTAitem37a (psi) = ± 0.08470 x R/H or L/H HTBM (in-lb)
The expression for HTBM at F.S.770.3 can be substituted directly into the above Reference 3 stress equation as such:
a® DADTAitem37a (psi) = ± 0.08470 x R/H or L/H HTBM (in-lb) = ± 0.08470 x us® AF2 x 106 / 941.54 = ± 89.96 X|IS@AF2
In summation:
O"® DADTA Item 36 — 133.82 X US® AF2
O"® DADTA Item 36 ~ 137.54 X US® AF2
C?@ DADTA Item 37a = ± 89.96 X US® AF2
(psi)(M<l)
(psi)(M>l)
(psi)(+ve for lower R/H & L/H HTPS) (-ve for upper R/H & L/H HTPS)
HTBM® F.S.770.3, BX. 68.2 - (1 + 941.54) X|1S@AF2 (MIPS)
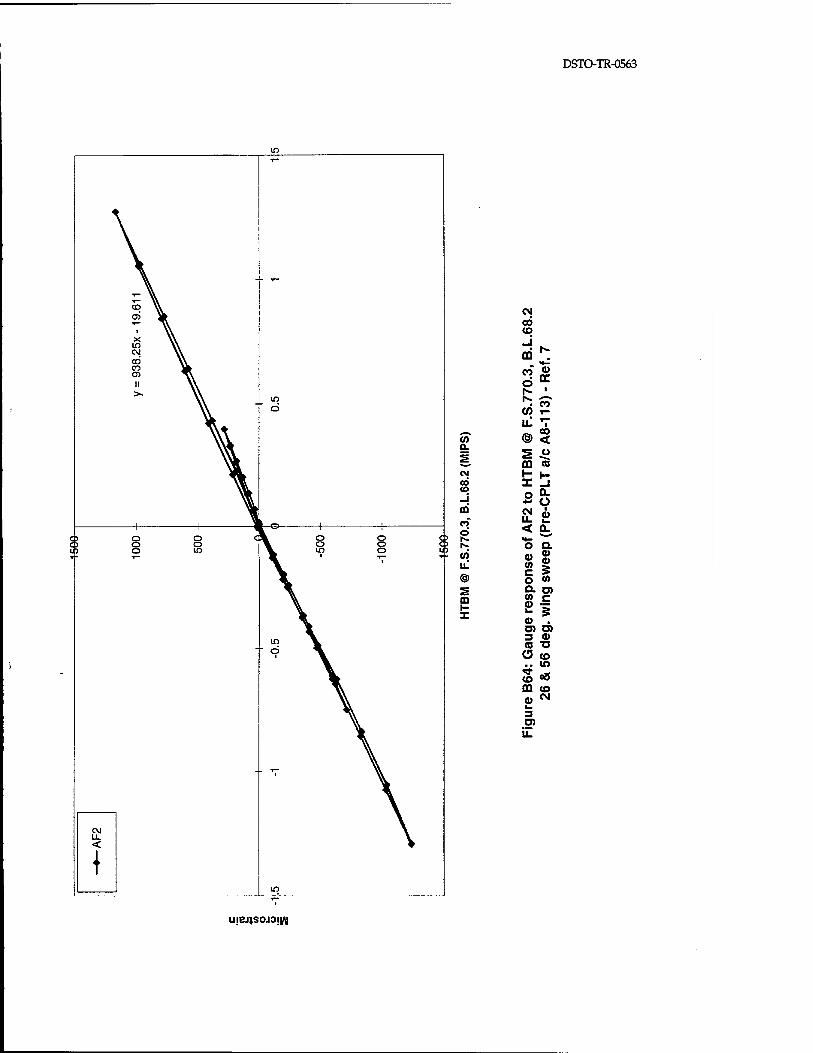
DSTO-TR-0563
CM CO
J m n cu 0
m h- ■ l»- CO (0 u. 1
<§> 00 <
00 Ü "A
h- h- X _i 0 0. ** 0 CM li. < a. »*- 0 a
(0 c:
CD 0)
0 (0 a en CO c a> V. $ a> O) O) 3 a> <Q ■o a CO
B, 10
to 08 m CO a> CM k.
3 O)
UjBJlSOJOJW
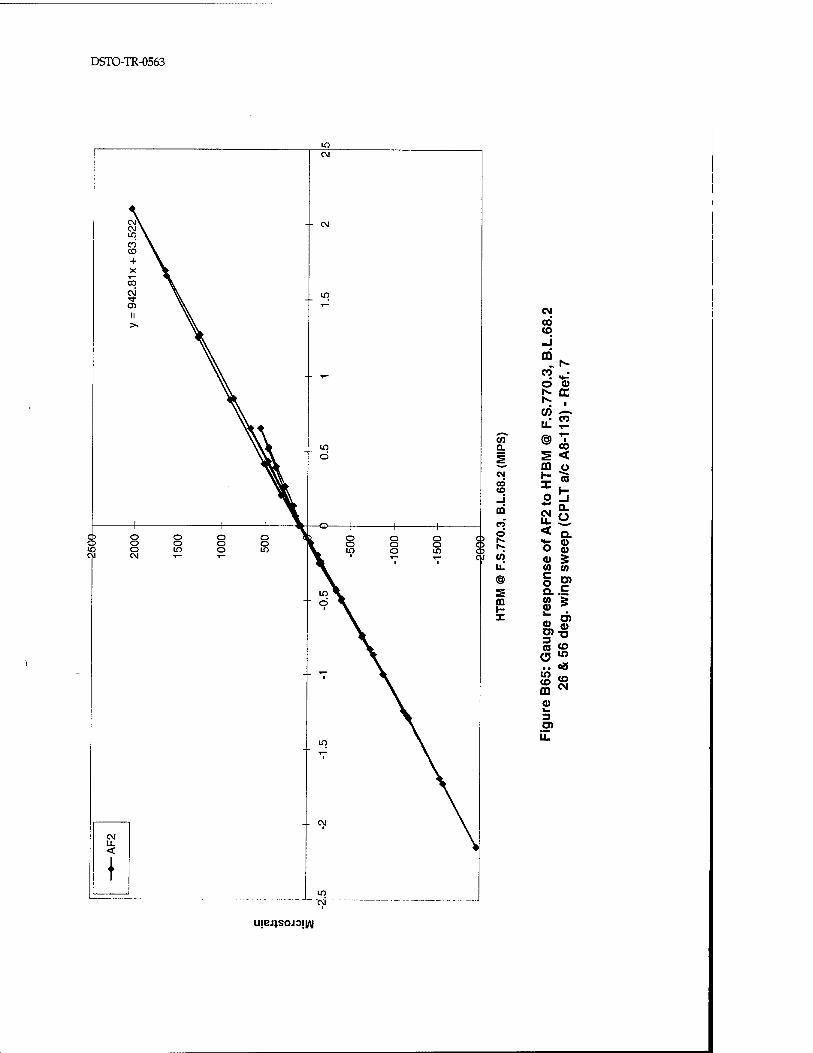
DSTO-TR-0563
CN cd CO
o <u
w ST
CO s < m c> H (TJ X 1- ü _l
n CM U. ü < Q. «^ C> u CO CO g CO CO c o D> a 1- CO CO 5
a) Cl) fl> O) ■n 3 m CO O m
oS m CO ffl
CO CN
CO L.
3 o> u.
UjBJlSOJOJW
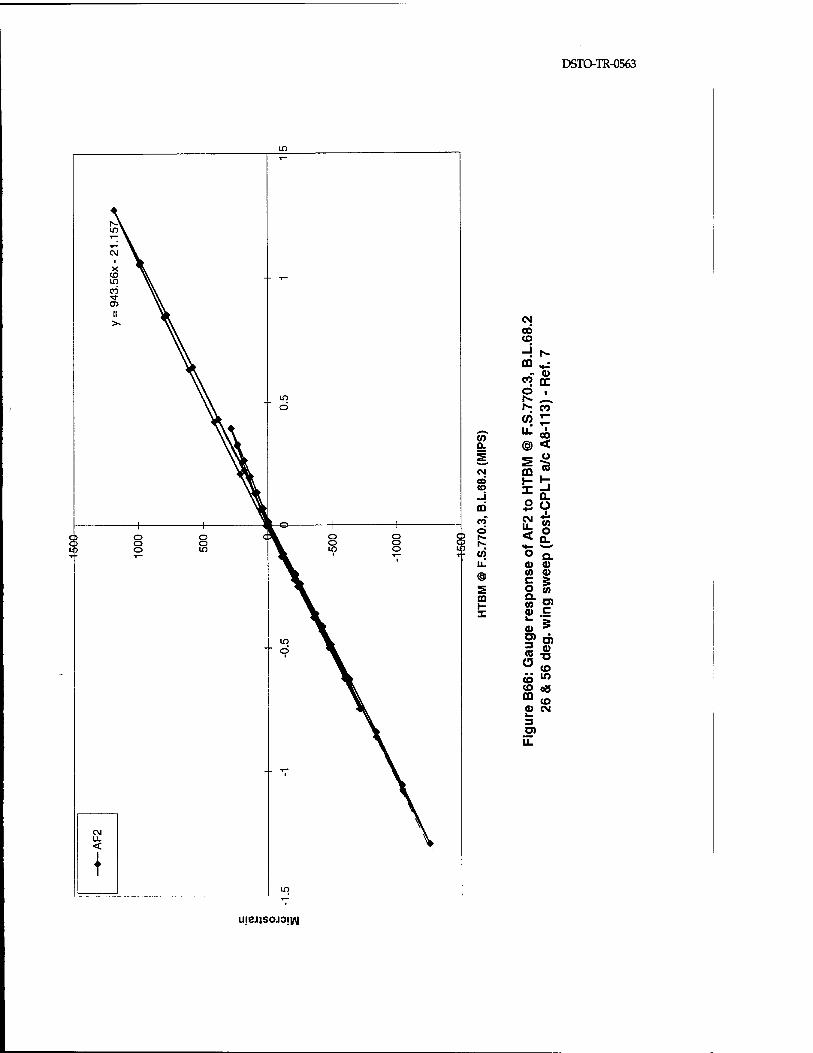
DSTO-TR-0563
CM cd to -! r^ DQ „j
co (E
£~ Is: co v) £ ^ CO @ < _ o
73 CD
SI «•— •*•* O Q. CO CD (0 o c 5 O CO
Si" Sä
CO «> 52 °8 m co d) CN L. 3 O) il
ujensojoivu
DSTO-TR-0563
Bll: AFP AS location VT4, Channel 7, DADTA Item 41.
In order for transfer functions to be derived for this location, a ground calibration test will have to be performed. For a known lateral load on the vertical fin (that results in a known VTBM @ W.L.205), the strain output from AFDAS gauge location VT4 can be measured. Using Hooke's Law, this strain can then be converted to a stress, and thus be compared with the stress predicted by the DADTA stress equations.
Although, as already stated in section 5.11, that this DADTA item will probably become redundant, the stress equations will still be presented for completeness.
DADTA Item 41
From Reference 3, the following load to stress equations are assumed for DADTA Item 41:
a@ DADTA item 4i (psi) = + 0.03394 x VTBM® W.L.205 (in-lbs) (Tension: +ve L/H, -ve R/H)
and,
CT@ DADTA Item 41 (psi) = + 0.03086 X VTBM® W.L.205 (Ül-lbs) (Compn: +ve L/H, -ve R/H)

DSTO-TR-0563
Appendix C
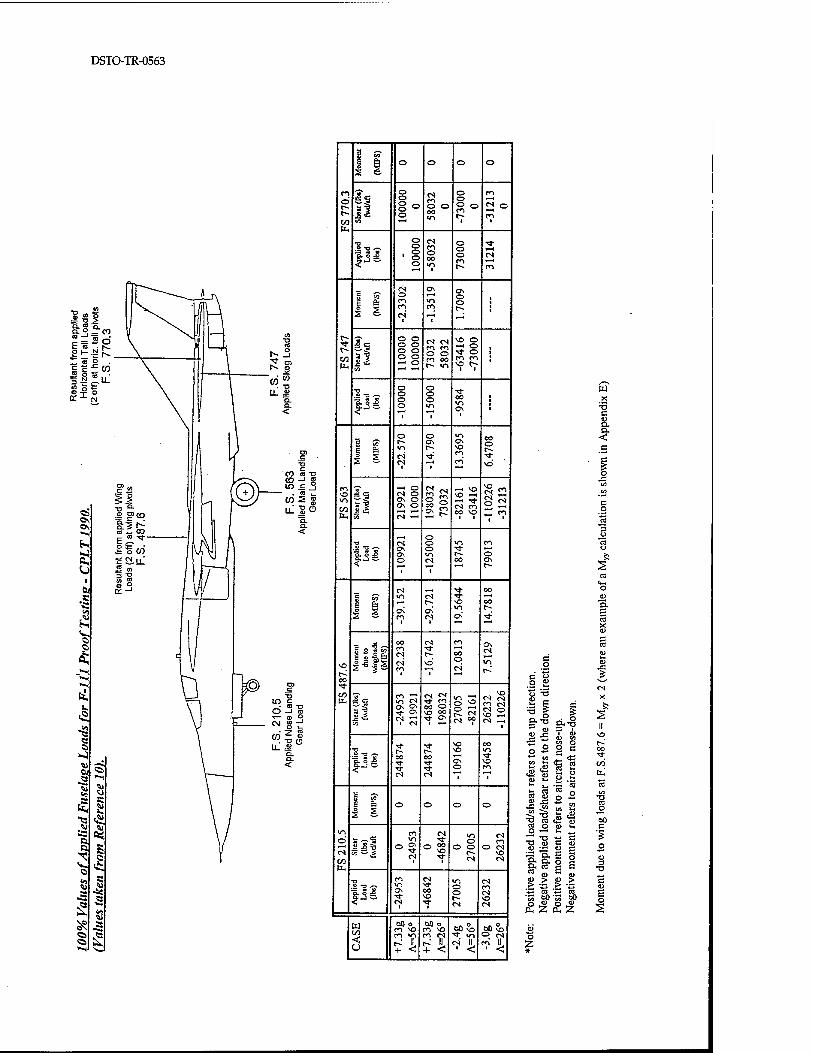
DSTO-TR-0563
c £ *S
c> ■a °-
&'Sfe ©V
"«I co *- 00
««; t oW s SEtlL
■ 2 to
a ° a:-1
s *vd <«n «1
fc-< <v. O ©
£ •»< *•< "-< bS. k.
«s <n ts « O
•») «11 e< VÖ « "«<
« c b. s ts ^ %> VV)
t< & I ^
S^ o «fc
s £ *^s «
ft £ 8 « .s « a ^ »X
iS€.
S 6
.2 "O '-»
ss
o o
©
o o o o o o o o ■— o
= 'S 'S"
<
S © •• W
12
nl
ill
»i o CM o Ov o Cv o
o o oo
CS CM ro co o o n oo
01 CM
OS P
o o S o
VO O —< o Tf O en co VO C~
Ov o> ■» Ov
O £>
CM CM
00 o vo oo Tf Ov
60 o rn vo m »n
+ •<
-< vo vo —< rt •<*■
CM p-> 00 vo
2°
^2
S3 CM °?
o o o
00 o c> vo ei CM
?4:
, vo CM CM C1 CM CM o VO —. CM _i
CM Cl
O CM VO CM
00 vo
CM II 1 < 00 vo O CM
wo f- £ 2 « oo
.2 c —
a, z a. Z
o Z
00 c
£ o 2
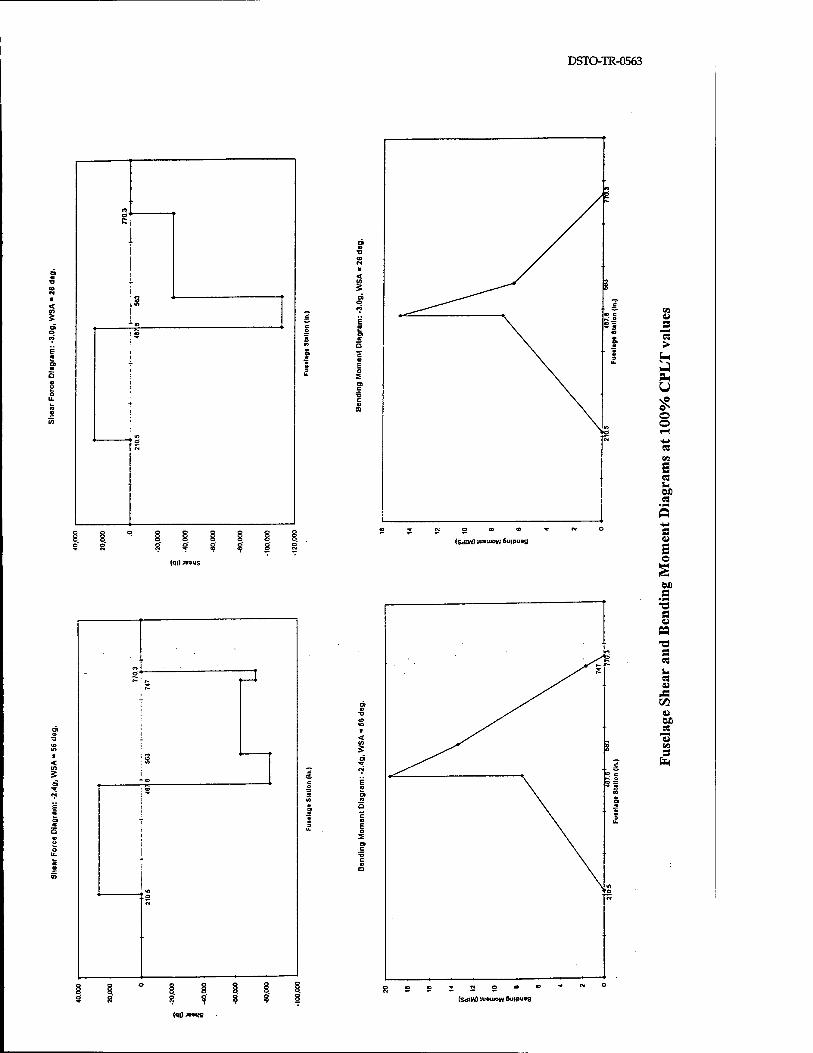
DSTO-TR-0563
n
s 1 i
i
1 m>
o
ESdtH) 1U3UJ0H 6u|puag
(qi) J»a«s
BO
s >
PL) u o o
R
es DJD
a
o
p
•8 1
— a» ■
i
? ?' §
a •a a «
P5 "O a w s- «
I» w M a
"3 09 s
(SdIW) 1UKUOH Bu|PU»g
(<ll)JM«S
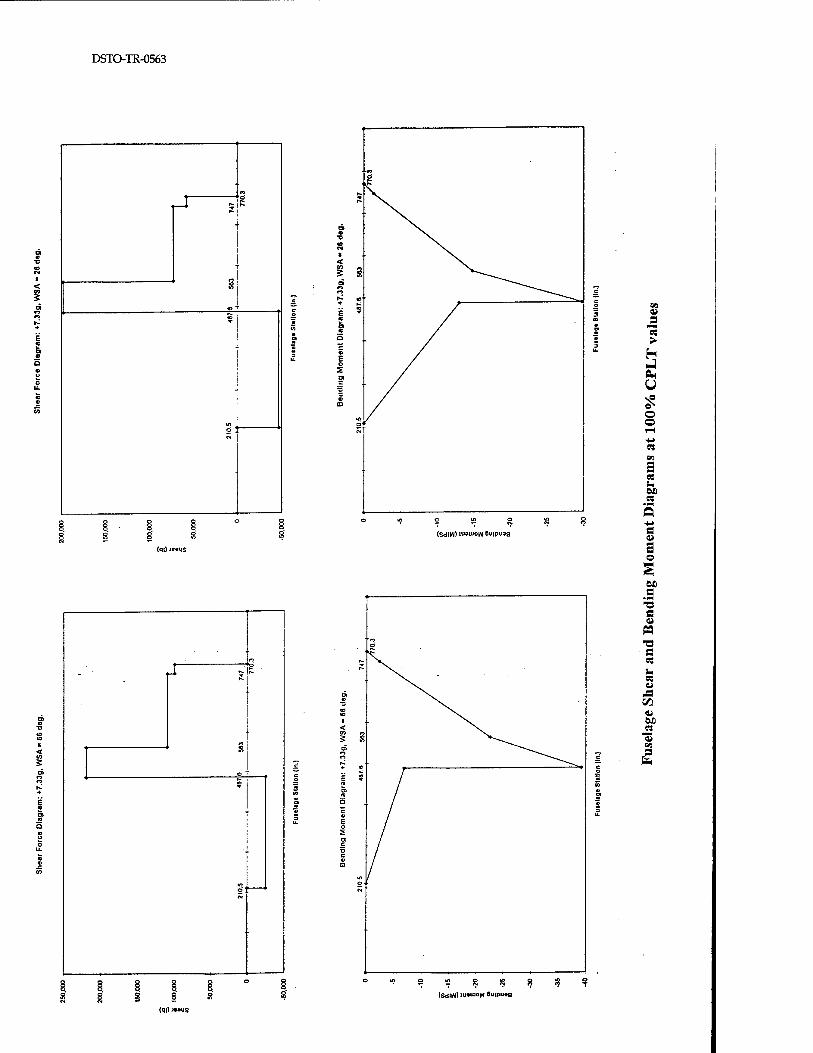
DSTO-TR-0563
n o
' pi ■
■
3
o ',
8 S (II) J"1S
(SdlH) luowow 6uipu»a
09 U
"(3 >
5 OH Ü
o o
S3 u 00 C5
a o
M .g •3 S3
« - S3 «
•- R U
JS c»
<u bJO
*« 3
fa
(SdlW) lutulOH Sl>|pu»a
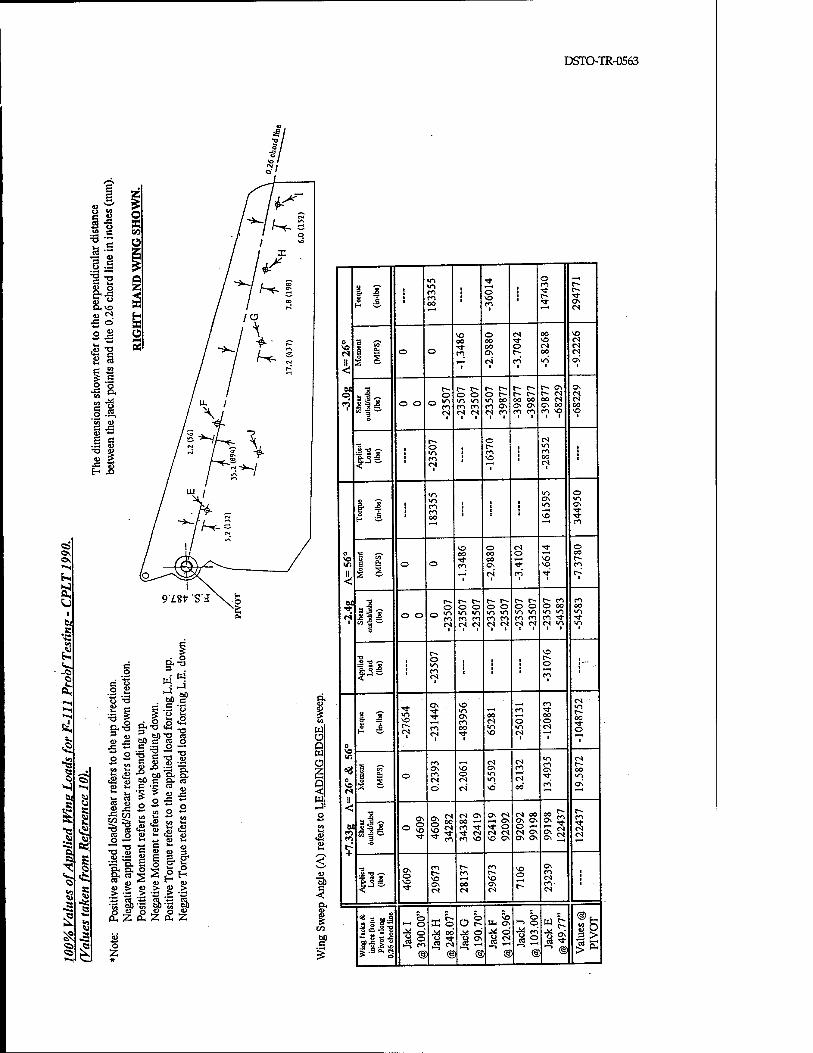
DSTO-TR-0563
Tf o t
1 1 t
i ■
co co oo
1 ■ 1
o so CO
1
1 1
1
Tf c- ■<r Os cs
\n o cs 00 SO
» £ CO Tt <■€> CS 00 o cs cs
r* 1 § O O CO Os r- 00 cs
^ i £ f
CS 1
CO 1
VI 1
Os 1
61
Shou
ou
lbd/
inbd
(l
bs)
r~ 1— r- t» C- r- c- r- Os Os O o r> r> O t- c- c~- f] o o o >n in vi tn oo
CO OS 00 00 Os Os
00 OS
cs CO
cs 00
CS cs i
cs cs co i i
CO CO ■ i
CO 1
so 1 1
o cs
App
liec
Loi
d ("
») 1 1
1
o V> en cs
1
i
i
co SO
1
■ i
CO 00 cs
1 1
■
VI o
1 1 1 1 CO
i
1 1
■ ■ i
OS V> Os
£ -s 1 CO SO Tl- CO
SO o cs Tl- o o •3 ^s CO o I—<
so SO C-- m o o CO Os •* so co II ■—< cs CO TT c- < 1
2 r~ r- c- r-- t- r~ r- CO CO
cs o o o o o o o o
o o o v> wo vi tn wo CO CO
vi v-i CO CO CO
VI VI
cs i
cs cs ■
cs cs cs cs t i
cs 1 ■
so
App
liec
Loi
d (l
b.) 1
1 o w-i ■ ■ i o 1 _..
1 CO es
i ■ i CO
■
1
1 1 os SO
v> OS CO
cs
CO
o
CO
00 o
cs »n c- oo
o 1
£ ■£ CO V) VI cs
0
1 i 1 so cs
1 1
0 so CS
61 CO
1 « CO OS SO
cs Os
cs CO
V) CO
cs c—
§ a ° s 2 =•
o CO es ©
o cs cs'
v> *o'
cs oo' co'
vs os'
•W Os o SO
cs 00 cs
cs 00 CO
Os
cs
Os cs —< Os rt O cs cs
CS 00 Os Os O —i CS OS
00 Os
Os
r- CO TJ- CS
r- co Tf cs
PI OT 3 co CO SO so OS OS Os OS
£
App
lied
Loa
d (l
b.) os
o so
CO
so Os CS
CO
CO cs
CO C^ SO OS CS
SO o
r-
Os CO cs CO cs
1 ■ 1 ■
*M-I Ö >-c o Ä o o o . So Ü- OS -/§ w r~ S3 B
1^ •— o •* ja »■« § ° .a a * » > .3 &. r* > o
—t co <§
3 CO •<* cs
@ 1 o
OS 3 - •^ co'
u a >—> Os'
®
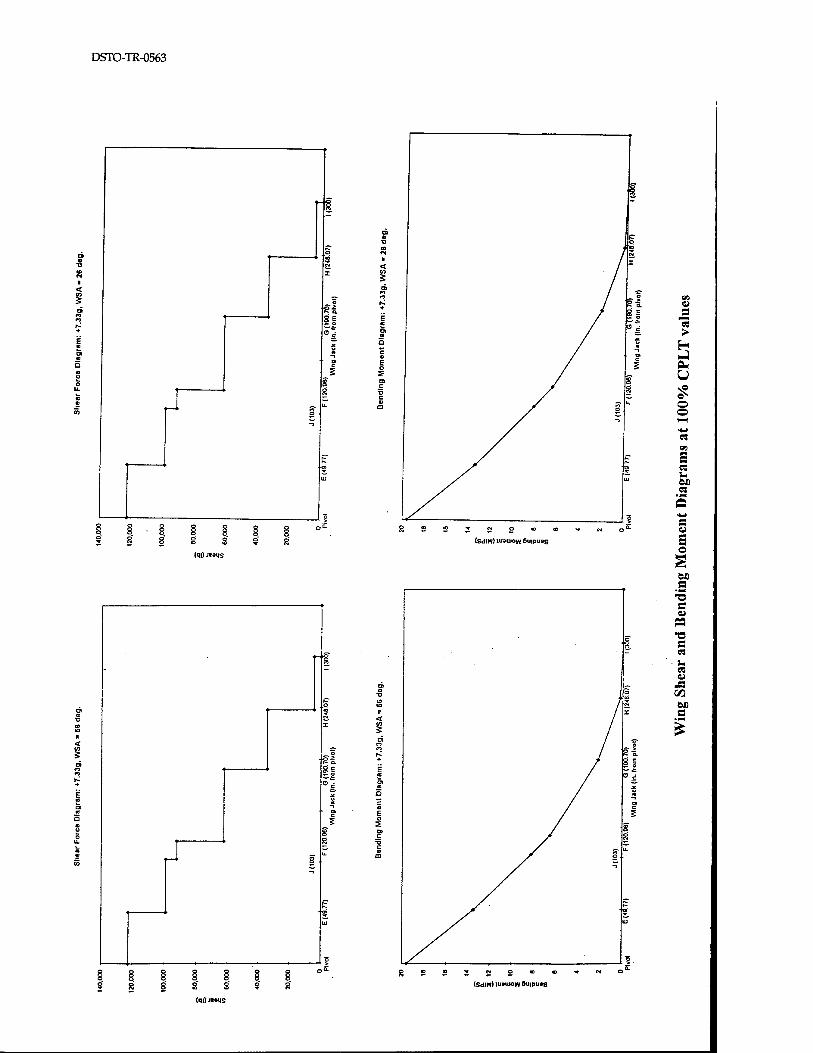
DSTO-TR-0563
rs
Si
(SdlW) 1U9IUOH 6uipuag
(q|) Jt»l|S
«J a
"eS >
u o o
S es u W) es
a a o
OX) g ■3 s a M •o S3
• la es 4)
-S GO W) a
ISdIN) 1IJXUOH 0<l|PU»a
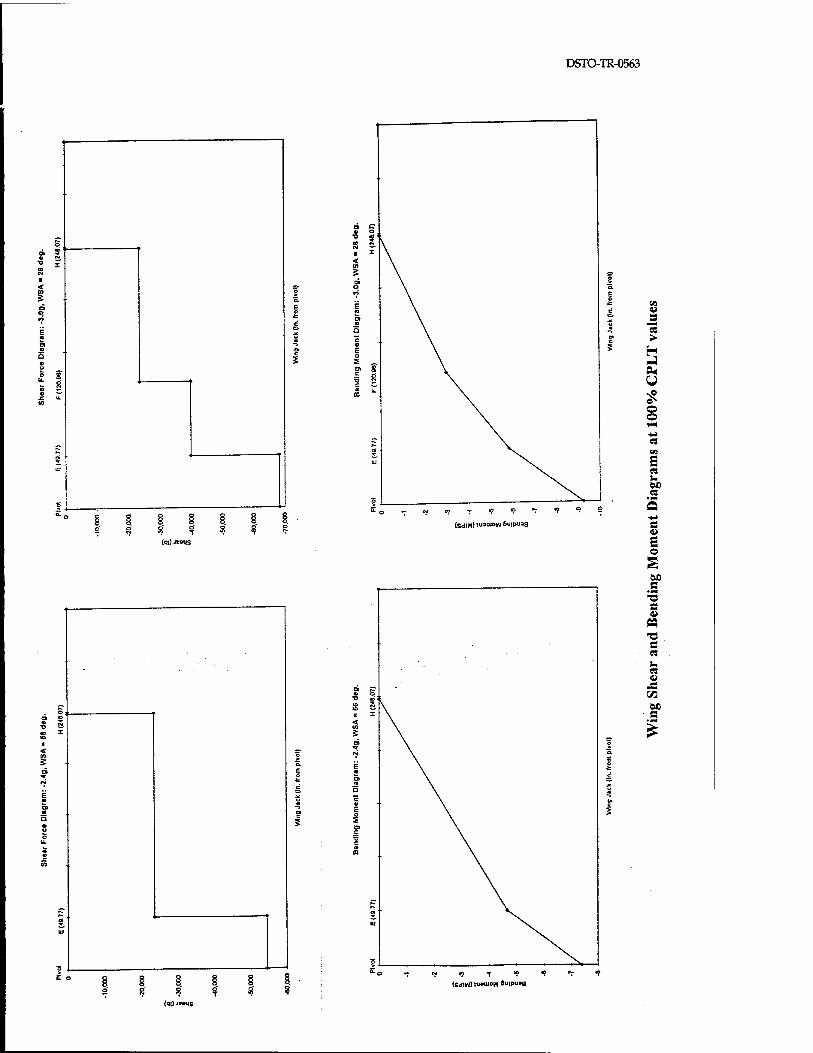
DSTO-TR-0563
■■' —
..
3 ? (q|) JIM|S
(SdlW) nrau»w Bu!P«»a
-
es • * 3 ■o " <e * IO
I
< CO
5 a "«r ri
E « ■ Q 0 o o u. • •> £ to
■
at
UJ
15
IO —
93 V
J3
>
a*
0s
O O
u C5
a a o s a
*"3 s M 'S a S3
s. c: o
M ■ O
(q|) J»»MS

DSTO-TR-0563
100% Values of Applied Horizontal Tail Loads for F-lll Proof Testing - CPLT1990.
Walues taken from Reference 10).
♦Note: Positive applied load/Shear refers to the up direction. Negative applied load/Shear refers to the down direction. Positive Moment refers to horiz. tail bending up. Negative Moment refers to horiz. tail bending down.
Horizontal Tail Pivot Shaft
B.L. 68.2
F.S. 770.3
B.L. 110
RIGHT HAND SIDE SHOWN
View looking Forward Line of Load Application
B.L. 0
FS 770.3, BL 110 CASE Applied Load
(lbs) Shear (lbs) outbd/Inbd
Moment @ HTPS
(MIPS)
+7.33g A=56°
-50000 0 -50000
-2.09
+7.33g A=26°
-29016 0 -29016
-1.213
-2.4g A=56°
50000 0 50000
2.09
-3.0g A=26°
15607 0 15607
0.652
* Note that the applied Fuselage Load given for this condition is 73000 lb. This is due to a negative applied skeg load of 27000 lb also acting at F.S. 770.3. ie: [2 x 50000] - 27000 = 73000 lb.
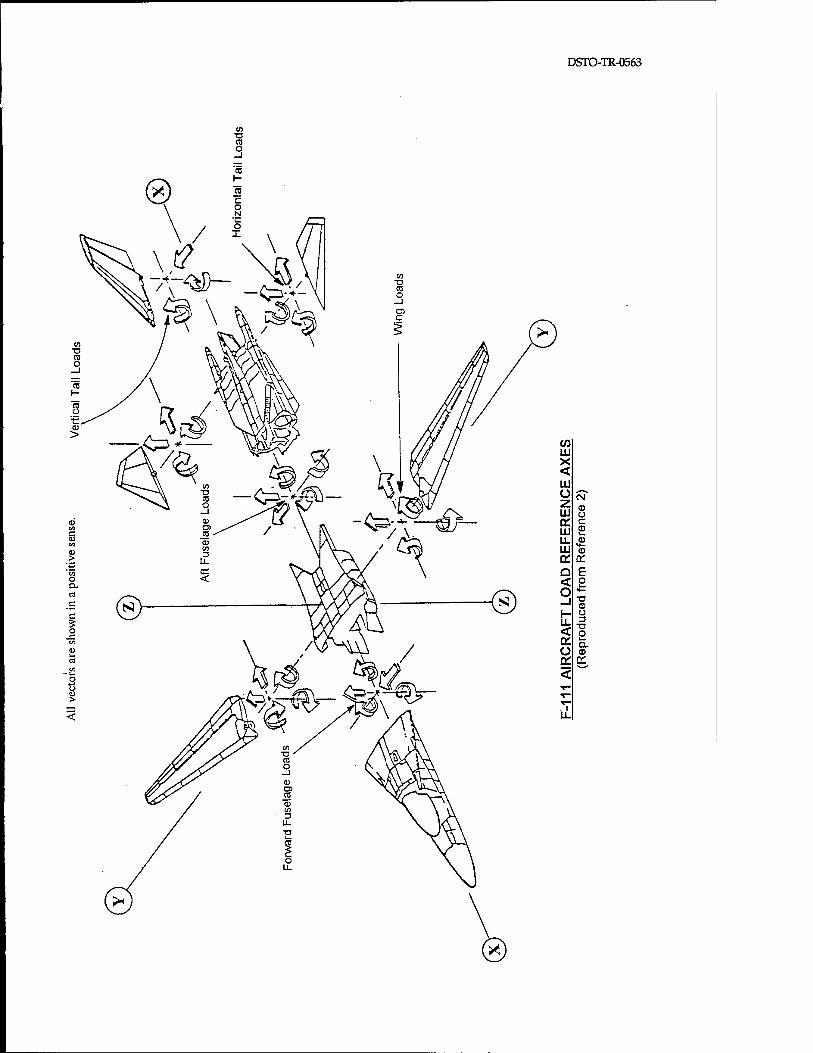
CO 13 «J O
DSTO-TR-0563
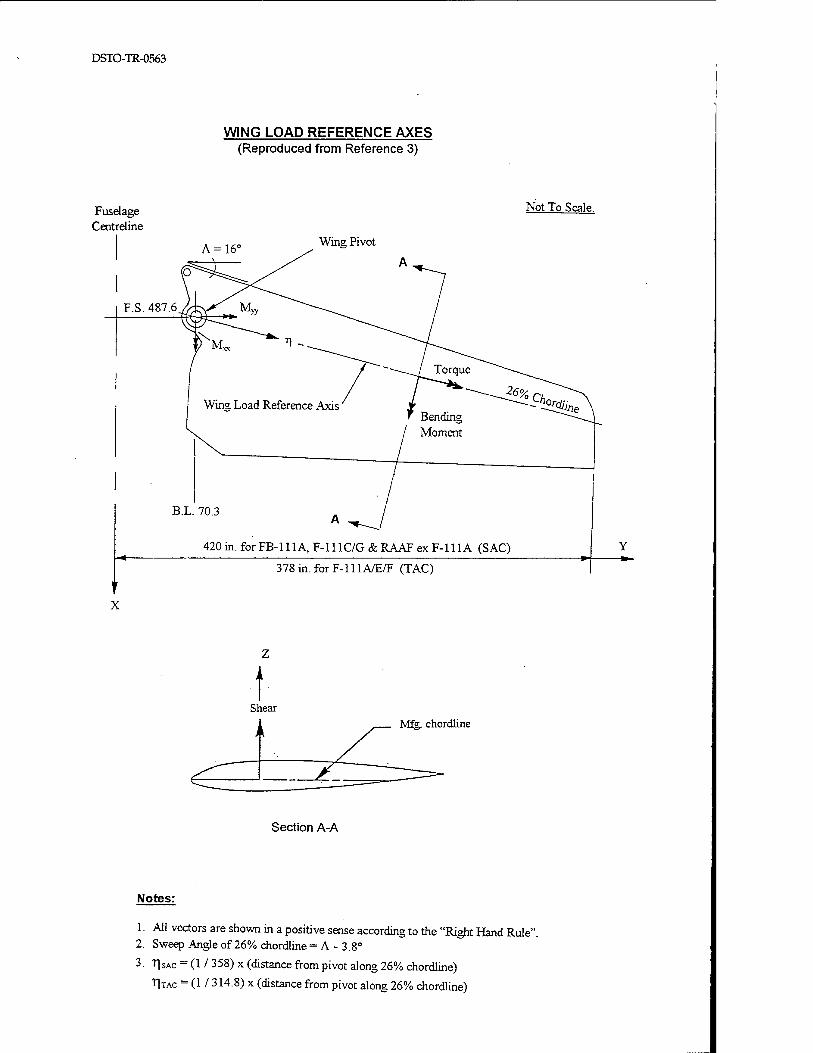
DSTO-TR-0563
WING LOAD REFERENCE AXES (Reproduced from Reference 3)
Fuselage Centreline
Not To Scale.
A = 16° Wins; Pivot
F.S. 487.6
B.L. 70.3
420 in. for FB-111 A, F-l 11C/G & RAAF ex F-l 11A (SAC)
X
378 in. for F-111A/E/F (TAC)
Mfg. chordline
Section A-A
Notes:
1. All vectors are shown in a positive sense according to the "Right Hand Rule". 2. Sweep Angle of 26% chordline = A - 3.8°
3. T|SAC = (1 / 358) x (distance from pivot along 26% chordline)
TITAC = (1 / 314.8) x (distance from pivot along 26% chordline)

DSTO-TR-0563
HORIZONTAL & VERTICAL TAIL AND RUDDER LOAD REFERENCE AXES
(Reproduced from References 3 & 10)
F.S. 770.3
B.L. 110
RIGHT HAND SIDE SHOWN
View looking Forward
B.L. 0
FWD
Line of Load Application
Moment vectors shown in a positive sense according to "Right Hand Rule".
RIGHT HORIZONTAL TAIL
B.L. 68.2
+ve HTBM Horizontal Tail Pivot Shaft
W.L. 205
Notes
1. +ve Fy acts to the right looking forward. 2. +ve Hinge Moment acts clockwise looking down. 3. Moment vectors shown in a positive sense according to "Right Hand Rule"

DSTO-TR-0563
Appendix D

DSTO-TR-0563
•Si a
I «8
54 §
»3 y
o ,£2
n o o c> •a CU k-
•5 *-• o
IX T1 c 3 a> o
■^_j li. ■o *-* o ^ CO O co ci.
CO S-L VI 1«! w (!) Ml «a <I>
bO C
"5t o cO (1> cu
CO
T3
J3 co
co
CO CO
C4-I
co O (11 *-* o u
■ ' Tt +-I c Tt <1) C cu
CU cu F= a, a, a, m B
E
0 E
co <i> <r>
tU > CU > _> a
_> s>
o cu o OH
a»
<i>
o Z *
-j -i ^
E & o 5: 2 &
s-J 1?
fc.ä
in o t-
00 CN
DC o
«5 CN
CO ?-\ CO tJ 3 > « FT1
r-
Mom
en
(MIP
S)
00
0 s© 1—1
O Os
II <
O 3 CN CN
<; 0 Sh
ea
tbd/
ir
(lbs
)
O m Tt
co Tt
j O
»^ 0 Q -1 J CO*-*
H-s-f J |2
CN CO 00 Tt
f
1 1 1 1
1 M O 00
1 & 0 SO 0 5
SO
| Tt Tt S .5 <-. SO SO
She
bd/
(lbs 0 00
Tt CO Tt
3 0 CN CN
•0 0 s© T-<
II iied
Loa
Hw
ing
(lbs
) Tt so 00
1 1 1 1
<! <
CN
Q < O g ST
Os
►4 1 & 0 00
s O 5;
SO
2 00 OO S.S " (N CN
She
bd/
(lbs 0 Os
Tt Os Tt
3 0 CN CN
•0
3.$^ 00 CN
, 0^ 7, * JS Os ■
App
li L/
H (1 Tt
CN ■
a 1 Lo
adin
g Po
ints
&
inch
es fr
om
Pivo
t
^! 0 co —>
r- 0 00 Tt CN
®
S3 8

DSTO-TR-0563
Appendix E
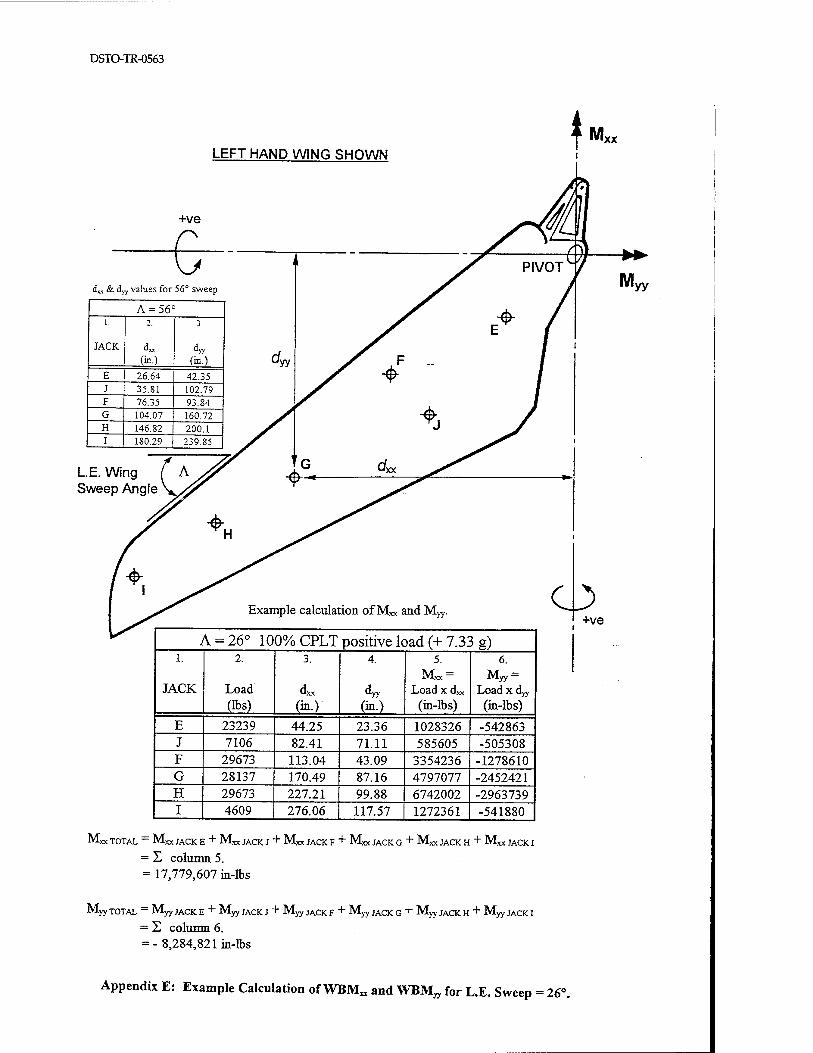
DSTO-TR-0563
LEFT HAND WING SHOWN
d„ & d»y values for 56° sweep.
A = 56° l.
JACK
2
d*< (in.)
3.
d,v (in.)
E 26.64 42.35 J 35.81 102.79 F 76.35 93.84 G 104.07 160.72 H 146.82 200.1 I 180.29 239.85
LE. Wing ( A Sweep Angle
Example calculation of Mxx and M.
A = 26° 100% CPLT positive load (+ 7.33 g) l.
JACK
2.
Load (lbs)
3.
d« (in.)
4.
dyy
(in.)
5. Mxx =
Load x dxx (in-lbs)
6.
Load x djy
(in-lbs)
E 23239 44.25 23.36 1028326 -542863 J 7106 82.41 71.11 585605 -505308 F 29673 113.04 43.09 3354236 -1278610 G 28137 170.49 87.16 4797077 -2452421 H 29673 227.21 99.88 6742002 -2963739 I 4609 276.06 117.57 1272361 -541880
Mxx TOTAL - Mxx JACK E + Mxx JACK J + Mxx JACK F + Mxx JACK G + Mxx JACK H + M„ JACK I
= E column 5. = 17,779,607 in-lbs
Myy TOTAL = Myy JACK E + Myy JACK J + Myy JACK F + Myy JACK G + Myy JACK H + Myy JACK I
= E column 6. = -8,284,821 in-lbs
Appendix E: Example Calculation of WBMn and WBMW for L.E. Sweep = 26°.
DISTRIBUTION LIST
Development of Transfer Functions to Relate F-lll Aircraft Fatigue Data Analysis System (AFDAS) Strain Outputs to Loads and Control Point Stresses
G. Swanton and K. Walker
AUSTRALIA
DEFENCE ORGANISATION
Task Sponsor DTA
S&T Program Chief Defence Scientist 1 FAS Science Policy f shared copy AS Science Corporate Management J Director General Science Policy Development Counsellor Defence Science, London (Doc Data Sheet) Counsellor Defence Science, Washington (Doc Data Sheet) Scientific Adviser to MRDC Thailand (Doc Data Sheet) Director General Scientific Advisers and Trials/Scientific Adviser Policy and
Command (shared copy) Navy Scientific Adviser (Doc Data Sheet and distribution list only) Scientific Adviser - Army (Doc Data Sheet and distribution list only) Air Force Scientific Adviser Director Trials
Aeronautical and Maritime Research Laboratory Director
Chief of Airframes and Engines Division F. Rose K. Wärters G. Swanton K. Walker
DSTO Library Library Fishermens Bend Library Maribyrnong Library Salisbury (2 copies) Australian Archives Library, MOD, Pyrmont (Doc Data sheet only)
Capability Development Division Director General Maritime Development (Doc Data Sheet only) Director General Land Development (Doc Data Sheet only) Director General C3I Development (Doc Data Sheet only)

Army ABCA Office, G-l-34, Russell Offices, Canberra (4 copies) SO (Science), DJFHQ(L), MILPO Enoggera, Queensland 4051 (Doc Data Sheet only) NAPOC QWG Engineer NBCD c/- DENGRS-A, HQ Engineer Centre Liverpool
Military Area, NSW 2174 (Doc Data Sheet only)
Air Force Wing Commander E. Wilson, OICASI, HQLC, RAAF Williams, Laverton, VIC Flight Lieutenant J. Agius, ASI2A, HQLC, RAAF Williams, Laverton, VIC Flight Lieutenant S. White, SRLMSQN, RAAF Amberley, QLD
Intelligence Program DGSTA Defence Intelligence Organisation Library, Defence Signals Directorate (Doc Data Sheet only)
Corporate Support Program (libraries) OIC TRS, Defence Regional Library, Canberra Officer in Charge, Document Exchange Centre (DEC), 1 copy *US Defence Technical Information Center, 2 copies *UK Defence Research Information Centre, 2 copies *Canada Defence Scientific Information Service, 1 copy *NZ Defence Information Centre, 1 copy National Library of Australia, 1 copy
UNIVERSITIES AND COLLEGES
Australian Defence Force Academy Library Head of Aerospace and Mechanical Engineering
Senior Librarian, Hargrave Library, Monash University Librarian, Flinders University
OTHER ORGANISATIONS
NASA (Canberra) AGPS
OUTSIDE AUSTRALIA
ABSTRACTING AND INFORMATION ORGANISATIONS INSPEC: Acquisitions Section Institution of Electrical Engineers Library, Chemical Abstracts Reference Service Engineering Societies Library, US Materials Information, Cambridge Scientific Abstracts, US Documents Librarian, The Center for Research Libraries, US
INFORMATION EXCHANGE AGREEMENT PARTNERS Acquisitions Unit, Science Reference and Information Service, UK Library - Exchange Desk, National Institute of Standards and Technology, US National Aerospace Laboratory, Japan National Aerospace Laboratory, Netherlands

DSTO-TR-0563
SPARES (10 copies)
Total number of copies: 59

Page classification: UNCLASSIFIED
_DEFENCE SCIENCE AND TECHNOLOGY ORGANISATION DOCUMENT CONTROL DATA
2. TITLE
Development of Transfer Functions to Relate F-lll Aircraft Fatigue Data Analysis System (AFDAS) Strain Outputs to Loads
and Control Point Stresses
4. AUTHOR(S)
G. Swanton and K. Walker
6a. DSTO NUMBER DSTO-TR-0563
8. FILE NUMBER Ml/9/371
6b. AR NUMBER AR-010-278
9. TASK NUMBER AIR97/095
1. PRIVACY MARKING/CAVEAT (OF DOCUMENT)
3. SECURITY CLASSIFICATION (FOR UNCLASSIFIED REPORTS THAT ARE LIMITED RELEASE USE (L) NEXT TO DOCUMENT CLASSIFICATION)
Document Title Abstract
(U) (U) (U)
5. CORPORATE AUTHOR
Aeronautical and Maritime Research Laboratory PO Box 4331 Melbourne Vic 3001
6c. TYPE OF REPORT Technical Report
10. TASK SPONSOR DTA
13. DOWNGRADING/DELIMITING INSTRUCTIONS
None
7. DOCUMENT DATE June 1997
11. NO. OF PAGES 168
12. NO. OF REFERENCES 11
14. RELEASE AUTHORITY
Chief, Airframes and Engines Division
15. SECONDARY RELEASE STATEMENT OF THIS DOCUMENT
Approved for public release
OVERSEAS ENQUIRIES OUTSIDE STATED LIMITATIONS SHOULD BE REFERRED THROUGH DOCUMENT EXCHANGE CENTRE, DIS NETWORK OFFICE, DEFT OF DEFENCE, CAMPBELL PARK OFFICES, CANBERRA ACT 2600
16. DELIBERATE ANNOUNCEMENT
No Limitations
17. CASUAL ANNOUNCEMENT 18. DEFTEST DESCRIPTORS
Yes
F-lll aircraft, aircraft fatigue data analysis system, strain gages
19. ABSTRACT The Aircraft Fatigue Data Analysis System (AFDAS) is a strain based fatigue data collection and analysis system, fitted to several aircraft types including eleven of the RAAF's F-lll fleet. AFDAS gauge strain data from various static strain surveys were used to develop transfer functions which relate strain from the AFDAS gauges to stresses at nearby control points as well as aircraft loading information. Relating the strain to load was a straightforward exercise, and in some cases it was also a simple matter to relate AFDAS strain to control point stress. In many cases however, the process of establishing a link between AFDAS strain and control point stress involved utilising existing load to stress relationships from the manufacturer. This process identified deficiencies/inaccuracies in several of the "manufacturer's stress equations". This report documents the development of the transfer functions, and details the deficiencies in the manufacturer's stress equations. Additional work to develop the transfer functions by direct analysis is recommended.
Page classification: UNCLASSIFIED