hkkjr ljdkj - cea.nic.incea.nic.in/reports/others/planning/pdm/growth_2017.pdf · iv v ravindra...
TRANSCRIPT
i
Hkkjr ds fo|qr {ks= dk 1947 ls 2017 rd dks lao/kZuGROWTH OF ELECTRICITY SECTOR IN INDIA FROM 1947-2017
Hkkjr ljdkjGOVERNMENT OF INDIA
fo|qr ea=ky;MINISTRY OF POWER
dsUnzh; fo|qr izkf/kdj.kCENTRAL ELECTRICITY AUTHORITY
ubZ fnYyhNEW DELHI
ebZ] 2017MAY, 2017

ii iii

ii iii
jfoUæ dqekj oekZ v/;{kdsUæh; fo|qr çkf/kdj.k Hkkjr ljdkj
çkDdFku
dsUæh; fo|qr çkf/kdj.k }kjk okf’kZd :i ls çdkf”kr iqfLrdk ÞHkkjr esa fo|qr {ks= dh lao`f)** fofHkUu o’kksaZ esa Hkkjrh; fo|qr {ks= dh lao`f) dk foLr`r ifj–”; miyC/k djkrh gSA çklafxd lwpuk vkSj lkaf[;dh vkys[kksa] ikbZ&pkVZ] ekufp=ksa vkSj lkjf.k;ksa ds :i esa çLrqr dh xbZ gSaA iapo’khZ; ;kstukokj fodkl ds vkjaHk gksus ds ckn ls Hkkjrh; fo|qr {ks= us cgqr çxfr dh gSA ;g çdk”ku egRoiw.kZ fodkl ladsrdksa tSls LFkkfir fo|qr mRiknd {kerk] fo|qr ÅtkZ mRiknu] ikjs’k.k vkSj laforj.k usVodZ] dSfIVo fo|qr la;a=ksa vkSj fo|qr [kir ds iSVuZ vkfn dh lao`f) ds fooj.k miyC/k djkrk gSA
bl çdk”ku ds fy, vkadM+s lHkh ;qfVfyfV;ksa vkSj xSj&;qfVfyfV;ksa ls çkIr fd, x, gSaA çfr O;fä fo|qr [kir] [kir dh fofHkUu Jsf.k;ksa dk çfr”krkad fgLlk] ikjs’k.k vkSj laforj.k gkfu vkfn tSlh egRoiw.kZ lkaf[;dh dh dqN fodflr vkSj fodkl”khy jk’Vªksa ds vkadM+ksa ds lkFk rqyuk dh xbZ gSA vk”kk gS fd ;g iqfLrdk Hkkjrh; fo|qr {ks= ij laf{kIr vkSj ykHknk;d lwpuk miyC/k djkus esa cgqr mi;ksxh fl) gksxhA
ebZ] 2017 ¼jfoUæ dqekj oekZ½

iv v
Ravindra Kumar VermaChairpersonCentral Electricity AuthorityGovt. of India
FOREWORD
The booklet “Growth of Electricity Sector in India” published annually by Central Electricity Authority provides panoramic view of growth of the Indian Power Sector over the years. The relevant information and statistics have been presented in the form of graphs, pie-charts, maps and tables. The Indian Electricity sector has come a long way ever since 5 year plan wise development was initiated. This publication provides details of the growth of vital development indicators like installed electricity generating capacity, electrical energy generation, transmission and distribution network, captive power plants and pattern of electricity consumption etc.
The data for this publication has been sourced from all utilities and non-utilities. The important statistics like per capita electricity consumption, percentage share of different categories of consumption, transmission and distribution losses etc., have been compared with the data of some of the developed and developing nations. I hope that this booklet will be very helpful in providing concise & useful information on the Indian Electricity Sector.
May, 2017 (Ravindra Kumar Verma)

iv v
iadt c=k lnL; ¼;kstuk½ dsaæh; fo|qr çkf/kdj.kHkkjr ljdkj
çLrkouk
Lora=rk ds i”pkr ls Hkkjr esa fo|qr {ks= esa LFkkfir fo|qr mRiknu {kerk vkSj ikjs’k.k o forj.k ¼Vh ,aM Mh½ ç.kkyh nksuksa esa mYys[kuh; o`f) gqbZ gSA dqy fo|qr mRiknu {kerk ¼;wfVfyfV vkSj xSj&;wfVfyfV dh½ 1947 esa ek= 1362 esxkokV ls c<+dj ekpZ var] 2017 esa yxHkx 377 xhxk okV gks xbZA çfrO;fä fctyh dh [kir tks 1947 esa dsoy 16-3 ;wfuV Fkh] 2016&17 esa c<+dj 1122 ;wfuV gks xbZ gSA blds ckotwn] fctyh dh ekax esa o`f) fo|qr vkiwfrZ ls T;knk c<+ xbZ gS vkSj gekjk ns”k foxr o’kksaZ ls gqbZ fo|qr mRiknu {kerk esa dbZ xquk o`f) ds ckotwn] vf/kdre fo|qr ekax ds nkSjku fo|qr dh deh dk lkeuk dj jgk gSA fiNys rhu o’kksaZ esa ;|fi fo|qr~ deh dkQh gn rd de gqbZ gSA vktdy gekjs ikl vfrfjä mRiknu {kerk gSA ;g eq[; :i ls dqN jkT;ksa ds mi&ikjs’k.k ,oa forj.k ç.kkyh esa ck/;rkvksa rFkk mudh çfrdwy foÙkh; fLFkfr ds dkj.k gSA bldks /;ku esa j[krs gq, Hkkjr ljdkj us jkT; fo|qr forj.k ;wfVfyVh ds foÙkh; VuZvjkmaM ds fy, mTToy fMLd‚e ,”;ksjSal ;kstuk ¼mn;½ dk “kqHkkjEHk fd;k gS] tgk¡ foÙkh; ?kkVs dks de djus ds fy, jkT; ljdkjsa ftEesokj gksaxhA dqN y{; fu/kkZfjr fd, x, gSa ftuds iw.kZ gksus ij jkT; ljdkjsa Hkfo’; esa dsaæ ljdkj ls ykHk ds fy, gdnkj gksaxhA Hkkjr ljdkj us Vh ,aM Mh gkfu esa deh rFkk lalk/kuksa ds b’Vre mi;ksx ds fy, ekax i{k çca/ku ij fo’ks”k cy fn;k gSA lHkh ds fy, fo|qr miyC/k djokus ds fy, VSfjQ vk/kkfjr cksyh ij fo|qr ifj;kstukvksa dk fodkl] ikjs’k.k {ks= esa futh {ks= dh Hkkxhnkjh] ÅtkZ n{krk c<+kus ij jk’Vªh; vfHk;ku ] uohdj.kh; ÅtkZ lzksrksa ¼vkj- bZ- ,l-½ vkSj vYVªk esxk fo|qr ifj;kstukvksa ¼;w,eihih½ ds fodkl ij ladsaæ.k] fctyh dh dher de djus ds fy, dks;yk laca/kksa dh vnyk cnyh ,oa dq”ky fo|qr la;a=ksa ds mi;ksx tSlh ;kstukvksa ds ek/;e ls la;qä ç;kl tkjh gSA
ds-fo-çk- us bl laca/k esa vxz.kh Hkwfedk fuHkkbZ gS rFkk fo|qr {ks= ds fofHkUu fof”k’V {ks=ksa esa tSls fd ubZ çkS|ksfxfd;ksa dks vkjaHk djuk] ifj;kstukvksa dks rduhdh&vkfFkZd Loh—fr çnku djus ¼igys½ gkbZMªks ;kstukvksa ij lgefr ¼ckn esa½] gfjr ÅtkZ d‚jhMksj lfgr mRiknu vkSj ikjs’k.k ;kstuk rFkk ifj;kstukvksa ds çpkyu vkSj fuekZ.k dh e‚fuVfjax djuk] fMtkbu rFkk bathfu;fjax ,oa MkVk o lwpuk dk çlkj }kjk fodkl ds jk’Vªh; ç;kl esa vR;f/kd ;ksxnku fn;k gSA
ds-fo-çk- }kjk çdkf”kr orZeku iqfLrdk ,d fu;fer çLrqfr gS ftlesa xzkQ] ikbZ&pkVZ] uD”kksa vkSj lkjf.k;ksa ds :i esa egRoiw.kZ lwpuk varfuZfgr gSA lwpuk esa fofHkUu egRoiw.kZ ladsrdksa tSls laLFkkfir fo|qr mRiknd {kerk] ty fo|qr {kerk] ns’k dh fctyh dh ekax dh jkT;okj iwokZuqeku] fctyh ÅtkZ mRiknu ikjs’k.k o laforj.k usVodZ] fo|qr vkiwfrZ dh fLFkfr] dSfIVo i‚oj IykaV~l] ns”k dh fctyh dh [kir rFkk çfr O;fä miHkksx iSVuZ ds fy, fu’ikfnr o`f) dk iap o’khZ; ;kstukokj ¼igys ;kstuk vo/kh dgykrk Fkk½ iSVuZ “kkfey gSA iqfLrdk esa jkT;okj LFkkfir fo|qr mRiknu {kerk dks n”kkZus okys uD”ks Hkh lfEefyr gSa] bl çdkj ;g gekjs ns”k dk ,d fo”kky ifj–”; çLrqr djrh gSA
vk”kk gS fd ;g y?kq iqfLrdk lHkh fgr/kkjdksa ds fy, mi;ksxh fl) gksxhA
ebZ] 2017 ¼iadt c=k½

vi vii
Pankaj BatraMember(Planning)Central Electricity AuthorityGovt. of India
PREFACE PowerSectorinIndiahasgrownsignificantlysinceindependence,bothintheinstalledelectricitygeneratingcapacityandtransmission&distribution(T&D)system. The total power generating capacity of (utilities & non utilities) has increased from a meagre 1362 MW in 1947 to about 377 GW at the end of March, 2017.The percapitaelectricityconsumptionwhichwasamere16.3unitsin1947,hasincreasedto1122unitsin2016-17.Despitethis,thegrowthofelectricitydemandhasbeensurpassing the power supply and our country has been facing power shortages during peak electricity demand, in spite of the manifold growth in Installed Capacity over the years. In the last 3 years, however, the shortages have reduced substantially. At present, we have unutilized generating capacity. This is mainly because of constraints inthesub-transmissionanddistributionsysteminsomeoftheStates,aswellasadversefinancialpositionofmanyoftheStates.Takingthisintoaccount,theGovernmentofIndiahaslaunchedtheUjwalDiscomAssuranceYojna(UDAY)SchemeforfinancialturnaroundoftheStateDistributionutilities,wheretheStateGovernmenthasbeenmaderesponsibleforreductionoffinanciallosses.Certaintargetshavebeenset,which,ifachieved,wouldentitletheStateGovernmenttofurtherbenefitsfromtheCentralGovernment.GovernmentofIndialaysspecialemphasisonreductionofT&Dlossesanddemandsidemanagementtooptimallyutilizetheresources.Concertedeffortsaregoingontomakepoweravailabletoallthroughpolicyinitiatives,suchasDevelopmentofPowerProjectsthroughTariffbasedbidding,PrivateSectorPartic-ipationinTransmissionsector,NationalMissiononEnhancedEnergyEfficiency,FocusondevelopmentofRenewableEnergySources(RES),developmentoftheUltraMegaPowerProjects(UMPP),swappingofcoallinkagestoreducethecostofpowerandflexibleuseofmostefficientplantstoreducecostofpower.
CEAhastakenaleadandimmenselycontributedinthenationalendeavourofdevelopmentofpowersectorinvariousspecificareassuchasintroductionofnewtechnologies, techno-economic clearance of projects earlier and later concurrence of hydro projects, generation & transmission planning including green energy corridors and operation & construction monitoring of projects, design & engineering and dissemination of data & information.
The present booklet brought out by CEA is a regular feature, which contains vital information in the form of graphs, pie charts, maps and tables. The information covers 5 yearly (earlier called Plan period) pattern of growth accomplished for various important indicators like installed generating capacity, hydroelectric potential, state wise forecast of electricity demand of the country, electrical energy generation, transmission & distribution network, power supply position, captive power plants, pattern of electricity consumption of the country as well as per capita consumption. The booklet also contains maps showing state wise Installed Electricity Generating Capacity, thus affording a panoramic view of our country.I am hopeful that this handy booklet would prove to be useful to all stakeholders.
May, 2017 (Pankaj Batra)

vi vii

viii ix
viii ix
CONTENTSS. N. Table No. TITLE Pg. No.
1. Table : 1 Plan wise Growth of Electricity Sector in India (Utilities) 12. Chart : 1 Plan wise Growth of Installed Generating Capacity in the Country (Utilities) 23. Chart : 2A Plan wise Growth of Transmission Lines in the Country 66 kV and above 34. Chart : 2B Plan wise Growth of Transmission Lines in the Country below 66 kV 45. Chart : 3 Plan wise Growth of Number of Villages Electrified in the Country 56. Chart : 4 Plan wise Growth of Per Capita Consumption of Electricity in the Country 67. Chart : 5 Per Capita Electricity Consumption in Various Countries in 2013 & 2014. 78. Table : 2 Plan wise Growth of Installed Generating Capacity in India - Mode wise (Utilities) 89. Chart : 6 Plan wise Growth of Installed Generating Capacity in India Hydro Electric Power Stations 9
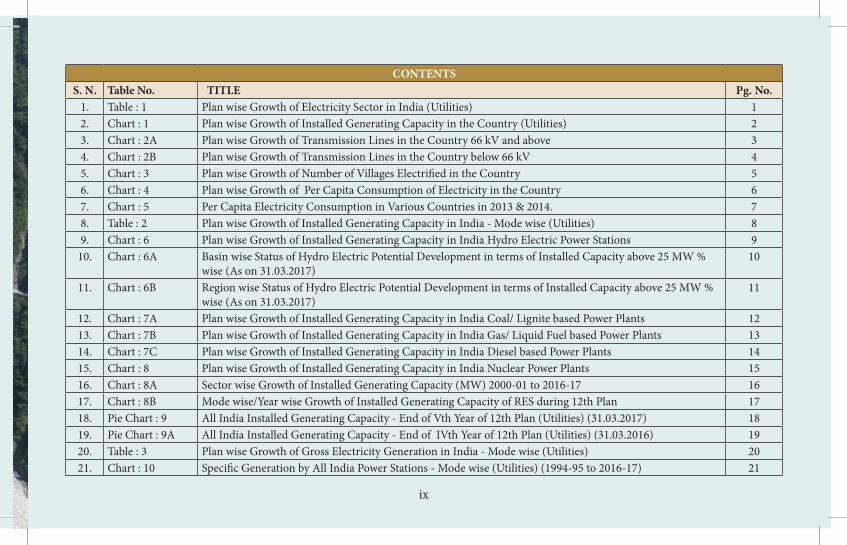
10. Chart : 6A Basin wise Status of Hydro Electric Potential Development in terms of Installed Capacity above 25 MW % wise (As on 31.03.2017)
10
11. Chart : 6B Region wise Status of Hydro Electric Potential Development in terms of Installed Capacity above 25 MW % wise (As on 31.03.2017)
11
12. Chart : 7A Plan wise Growth of Installed Generating Capacity in India Coal/ Lignite based Power Plants 1213. Chart : 7B Plan wise Growth of Installed Generating Capacity in India Gas/ Liquid Fuel based Power Plants 1314. Chart : 7C Plan wise Growth of Installed Generating Capacity in India Diesel based Power Plants 1415. Chart : 8 Plan wise Growth of Installed Generating Capacity in India Nuclear Power Plants 1516. Chart : 8A Sector wise Growth of Installed Generating Capacity (MW) 2000-01 to 2016-17 1617. Chart : 8B Mode wise/Year wise Growth of Installed Generating Capacity of RES during 12th Plan 1718. Pie Chart : 9 All India Installed Generating Capacity - End of Vth Year of 12th Plan (Utilities) (31.03.2017) 1819. Pie Chart : 9A All India Installed Generating Capacity - End of IVth Year of 12th Plan (Utilities) (31.03.2016) 1920. Table : 3 Plan wise Growth of Gross Electricity Generation in India - Mode wise (Utilities) 2021. Chart : 10 Specific Generation by All India Power Stations - Mode wise (Utilities) (1994-95 to 2016-17) 21

x xi
CONTENTSS. N. Table No. TITLE Pg. No.22. Chart : 11 Plan wise Growth of Electricity Generation in India Hydro Electric Power Stations 2223. Chart : 12A Plan wise Growth of Electricity Generation in India Coal/ Lignite based Power Plants 2324. Chart : 12B Plan wise Growth of Electricity Generation in India Gas/ Liquid Fuel based Power Plants 2425. Chart : 12C Plan wise Growth of Electricity Generation in India Diesel based Power Plants 2526. Chart : 13 All India PLF (%) of Thermal Power Stations (Coal and Lignite Based) 2627. Chart : 14 Plan wise Growth of Electricity Generation in India Nuclear Power Plants 2728. Chart : 15 Plan wise Growth of All India Electricity Generation (Utilities) 2829. Chart : 15A Sector wise Growth of Energy Generation (GWh) (2000-01 to 2016-17) 2930. Pie Chart : 16 Gross Electricity Generation in India Mode wise - End of Vth Year of 12th Plan (Utilities) (31.03.2017) 3031. Pie Chart : 16A Gross Electricity Generation in India Mode wise - End of IVth Year of 12th Plan (Utilities) (31.03.2016) 3132. Chart : 17 Gross Electricity Generation in various Countries Mode wise in 2014 3233. Chart : 18 Mode wise % Share in Electricity Generation in various countries in 2014 3334. Table 4 Plan wise/ Category wise Growth of Electricity Consumption in India (Utilities & Non-Utilities) 3435. Chart : 19 Plan wise Growth of Electricity Consumption in India - Domestic Sector 3536. Chart : 20 Plan wise Growth of Electricity Consumption in India - Commercial Sector 3637. Chart : 21 Plan wise Growth of Electricity Consumption in India - Industrial Sector 3738. Chart : 22 Plan wise Growth of Electricity Consumption in India - Traction Sector 3839. Chart : 23 Plan wise Growth of Electricity Consumption in India - Agriculture Sector 3940. Chart : 24 Plan wise Growth of Electricity Consumption in India - Miscellaneous Sector 4041. Chart : 25 Plan wise Growth of All India Total Electricity Consumption (Utilities & Non-Utilities) 4142. Chart : 25A Trend of Category wise Energy Consumption 2000-01 to 2016-17 4243. Pie Chart : 26 All India Electricity Consumption Sector wise - End of Vth Year of 12th Plan (Utilities & Non-Utilities)
(31.03.2017)43

x xi
CONTENTSS. N. Table No. TITLE Pg. No.44. Pie Chart : 26A All India Electricity Consumption Sector wise - End of IVth Year of 12th Plan (Utilities & Non-Utilities)
(31.03.2016)44
45. Chart : 27 Category wise Electricity Consumption in various Countries - 2014 4546. Chart : 28 Category wise % Shares in Electricity Consumption in various Countries - 2014 4647. Table : 5 Per Capita Electricity Consumption - 2013 & 2014 and T&D Losses - 2012 & 2013 of various Countries 4748. Chart : 29 All India Transmission and Distribution Losses (%) 4849. Chart : 30 T & D Losses of various Countries in 2012 & 2013 (%) 4950. Table : 6 Plan wise Growth of Installed Generating Capacity of Captive Power Plants in Industries having Demand of
1MW & Above - Mode wise50
51. Pie Chart : 31 Installed Generating Capacity of Captive Power Plants in Industries having Demand of 1MW & Above - Mode wise - End of Vth Year of 12th Plan (31.03.2017)
51
52. Pie Chart : 31A Installed Generating Capacity of Captive Power Plants in Industries having Demand of 1MW & Above - Mode wise - End of IVth Year of 12th Plan (31.03.2016)
52
53. Chart : 32 Plan wise Growth of All India Installed Generating Capacity of Captive Power Plants in Industries having Demand of 1MW & Above
53
54. Table : 7 Plan wise Growth of Energy Generated by Captive Power Plants in Industries having Demand of 1MW & Above - Mode wise
54
55. Pie Chart:33 All India Electrical Energy Generated by Captive Power Plants in Industries having Demand of 1MW & Above - Mode wise - End of Vth year 12th Plan (31.03.2017)
55
56. Pie Chart:33A All India Electrical Energy Generated by Captive Power Plants in Industries having Demand of 1MW & Above - Mode wise - End of IVth year 12th Plan (31.03.2016)
56
57. Chart : 34 Plan wise Growth of Energy Generated by Captive Power Plants in Industries having Demand of 1MW & Above
57
58. Chart : 35 Capacity Addition Programme during 2017-18 58

xii 1
CONTENTSS. N. Table No. TITLE Pg. No.59. Chart : 36 Forecast of All India Peak Electricity Demand (Utilities) (As per 18th & 19th Electric Power Survey) in MW 5960. Chart : 37 Forecast of All India Electrical Energy Requirement (Utilities) (As per 18th Electric Power Survey) in GWh 6061. Chart : 37A 18th Electric Power Survey of India (Volume –II) - Annual Electric Peak Load (in MW) of Mega Cities at
Power Station Bus Bar (For the Year 2011-12, 2016-17 & 2021-22)61
62. Chart : 37B 18th Electric Power Survey of India (Volume –II) - Electrical Energy Requirement (in MU) of Mega Cities (For the Year 2011-12, 2016-17 & 2021-22)
62
63. Chart : 37C 18th Electric Power Survey of India (Volume –II) - Electrical Energy Consumption (in MU) of Mega Cities (For the Year 2011-12, 2016-17 & 2021-22)
63
64 Table : 8 All India Power Supply Position Energy wise & Peak wise (Utilities) (1984-85 to 2016-17) 64-6565. Table : 8A Region wise Summary of EER & APEL For the Year 2017-18 and 2021-22 As per 19th EPS (Volume-I) 6666. Table : 8B Category wise Forecast of Electrical Energy Requirement For the Year 2017-18 and 2021-22 As per 19th EPS
(Volume-I)67
67. Table : 8C Forecast of Electrical Energy Consumption (in MU) of NCR For the Year 2017-18 and 2021-22 As per 18th EPS (Volume-III)
68
68. Table : 8D Forecast of Electrical Energy Requirement (in MU) of NCR For the Year 2017-18 and 2021-22 As per 18th EPS (Volume-III)
69
69. Chart : 38 All India Peak & Energy Deficit (Utilities) (1984-85 to 2016-17) 7070. Chart : 39 Forecast of Electrical Energy Consumption (in MU) of NCR For the Year 2017-18 and 2021-22 7171. Chart : 40 Forecast of Electrical Energy Requirement (in MU) of NCR For the Year 2017-18 and 2021-22 7272. Map : 1 Map of India showing Installed Generating Capacity State wise/ Mode wise as on 31.03.2017 7373. Map : 2 Map of India showing Installed Generating Capacity State wise as on 31.03.2017 74

xii 1
Table 1Plan wise Growth of Electricity Sector in India
(Utilities)Sl. No. As on / during financial year ending with Installed Capacity
(MW)No.of villages
electrifiedLength of T & D Lines
(Ckt. kms.)(#)Per Capita Consump-
tion ($) (kWh)1 31.12.1947 1362 N.A. 23238 162 31.12.1950 1713 3061 29271 183 31.03.1956 (End of 1st Plan) 2886 7294 85427 314 31.03.1961 (End of 2nd Plan) 4653 21754 157887 465 31.03.1966 (End of 3rd Plan) 9027 45148 541704 746 31.03.1969 (End of 3 Annual Plans) 12957 73739 886301 987 31.03.1974 (End of 4th Plan) 16664 156729 1546097 1268 31.03.1979 (End of 5th Plan) 26680 232770 2145919 1729 31.03.1980 (End of Annual Plan) 28448 249799 2351609 172
10 31.03.1985 (End of 6th Plan) 42585 370332 3211956 22911 31.03.1990 (End of 7th Plan) 63636 470838 4407501 32912 31.03.1992 (End of 2 Annual Plans) 69065 487170 4574200 34813 31.03.1997 (End of 8th Plan) 85795 498836 5141413 46514 31.03.2002 (End of 9th Plan) 105046 512153 6030148 55915 31.03.2007 (End of 10th Plan ) 132329 482864 6939894 67216 31.03.2012 (End of 11th Plan ) 199877 556633 8726092 88417 31.03.2013 (Ist yr of 12th Plan) 223344 560552 9080556 91418 31.03.2014 (IInd yr of 12th Plan) 248554 575442 9312634 95719 31.03.2015 (IIIrd yr of 12th Plan) 274904 578957 9972918 101020 31.03.2016 (IVth yr of 12th Plan) 305162 586065 10316547 107521 31.03.2017 (End of 12th Plan) 326833 592136@ 10667859@ 1122(*)
N.A. Not Available. (*) Provisional. (@) Estimated Rural electrification is based on revised definition of village electrification and 2011 Census.($ ) Per Capita Consumption=Gross Electrical Energy Availability/Mid Year Population(#) Includes 440 Volts Distribution Lines.

2 3
1362 1713 2886 4653 9027 12957 16664
26680 28448 42585
63636 69065 85795
105046
132329
199877
223344
245259
274904
305162
326833
0
50000
100000
150000
200000
250000
300000
350000
31.12
.47
31.12
.50
End o
f 1st
Plan (
31.03
.56)
End o
f 2nd
Plan
(31.0
3.61)
End o
f 3rd Pl
an (3
1.03.6
6)
End o
f 3 Ann
ual P
lans (31
.03.69
)
End o
f 4th Pl
an (3
1.03.7
4)
End o
f 5th Pl
an (3
1.03.7
9)
End o
f Ann
ual P
lan (3
1.03.8
0)
End o
f 6th Pl
an (3
1.03.8
5)
End o
f 7th Pl
an (3
1.03.9
0)
End o
f 2 Ann
ual P
lans (31
.03.92
)
End o
f 8th Pl
an (3
1.03.9
7)
End o
f 9th Pl
an (3
1.03.0
2)
End o
f 10th P
lan (3
1.03.0
7)
End o
f 11th P
lan (3
1.03.1
2)
End o
f Ist
yr of
12th Pl
an (3
1.03.1
3)
End o
f IInd y
r of 1
2th P
lan (3
1.03.1
4)
End o
f IIIrd y
r of 1
2th P
lan (3
1.03.1
5)
End o
f IVth y
r of 1
2th P
lan (3
1.03.1
6)
End o
f 12th P
lan (3
1.03.1
7)
Insta
lled C
apacity
(MW)
Plan/Year
Plan wise Growth of Installed GeneraKng Capacity in the Country (UKliKes)
Chart : 1

2 3
6430 8271 16552 26706
46033 63311
83225 108694
115031 155921
192288 215903
254613
304258
376829
446055 477420
513857
555615 572605 592104@
0
100000
200000
300000
400000
500000
600000
31.12.47
31.12.50
End of 1st Plan (31.03.56)
End of 2nd Plan (31.03.61)
End of 3rd Plan (31.03.66)
End of 3 Annual Plans (31.03.69)
End of 4th Plan (31.03.74)
End of 5th Plan (31.03.79)
End of Annual Plan (31.03.80)
End of 6th Plan (31.03.85)
End of 7th Plan (31.03.90)
End of 2 Annual Plans (31.03.92)
End of 8th Plan (31.03.97)
End of 9th Plan (31.03.02)
End of 10th Plan (31.03.07)
End of 11th Plan (31.03.12)
End of Ist yr of 12th Plan (31.03.13)
End of IInd yr of 12th Plan (31.03.14)
End of IIIrd yr of 12th Plan (31.03.15)
End of IVth yr of 12th Plan (31.03.16)
End of 12th Plan (31.03.17)
Circuit km
Plan/Year
Plan wise Growth of Transmission Lines in the Country 66 kV and above
@ EsOmated
Chart : 2A

4 5
16808 21000 68875 131181 495671 771990
1435659 2037225
2236578 3056035
4215213 4358297 4886800
5725890
6563065
8280037 8603136 8798777
9417303 9743942
10075755@
0
2000000
4000000
6000000
8000000
10000000
12000000
31.12.47
31.12.50
End of 1st Plan (31.03.56)
End of 2nd Plan (31.03.61)
End of 3rd Plan (31.03.66)
End of 3 Annual Plans (31.03.69)
End of 4th Plan (31.03.74)
End of 5th Plan (31.03.79)
End of Annual Plan (31.03.80)
End of 6th Plan (31.03.85)
End of 7th Plan (31.03.90)
End of 2 Annual Plans (31.03.92)
End of 8th Plan (31.03.97)
End of 9th Plan (31.03.02)
End of 10th Plan (31.03.07)
End of 11th Plan (31.03.12)
End of Ist yr of 12th Plan (31.03.13)
End of IInd yr of 12th Plan (31.03.14)
End of IIIrd yr of 12th Plan (31.03.15)
End of IVth yr of 12th Plan (31.03.16)
End of 12th Plan (31.03.17)
Circuit kms
Plan/Year
Plan wise Growth of Transmission Lines in the Country below 66 kV
Chart : 2B
@ EsPmated

4 5
3061 7294 21754 45148
73739
156729
232770 249799
370332
470838 487170
498836 512153 482864
556633 560552 575442
578957 586065
592136@
0
100000
200000
300000
400000
500000
600000
700000
31.12.50
End of 1st Plan (31.03
.56)
End of 2nd
Plan (31.03
.61)
End of 3rd Plan (31.03
.66)
End of 3 Ann
ual P
lans (3
1.03
.69)
End of 4th Plan (31.03
.74)
End of 5th Plan (31.03
.79)
End of Ann
ual P
lan (31.03
.80)
End of 6th Plan (31.03
.85)
End of 7th Plan (31.03
.90)
End of 2 Ann
ual P
lans (3
1.03
.92)
End of 8th Plan (31.03
.97)
End of 9th Plan (31.03
.02)
End of 10th Plan
(31.03
.07)
End of 11th Plan
(31.03
.12)
End of Ist y
r of 1
2th Plan
(31.03
.13)
End of IInd
yr of 1
2th Plan
(31.03
.14)
End of IIIrd
yr of 1
2th Plan
(31.03
.15)
End of IV
th yr
of 1
2th Plan
(31.03
.16)
End of 12th Plan
(31.03
.17)
Numbe
r of Villa
ges
Plan/Year
Plan wise Growth of Number of Villages Electrified in the Country Chart : 3
@ EsOmated

6 7
16 18 31 46 74 98
126 172 172
229
329 348
465
559
672
884 912 917
1010 1075
1122*
0
200
400
600
800
1000
1200
31.12.47
31.12.50
End of 1st Plan (31.03
.56)
End of 2nd
Plan (31.03
.61)
End of 3rd Plan (31.03
.66)
End of 3 Ann
ual P
lans (3
1.03
.69)
End of 4th Plan (31.03
.74)
End of 5th Plan (31.03
.79)
End of Ann
ual P
lan (31.03
.80)
End of 6th Plan (31.03
.85)
End of 7th Plan (31.03
.90)
End of 2 Ann
ual P
lans (3
1.03
.92)
End of 8th Plan (31.03
.97)
End of 9th Plan (31.03
.02)
End of 10th Plan
(31.03
.07)
End of 11th Plan
(31.03
.12)
End of Ist y
r of 1
2th Plan
(31.03
.13)
End of IInd
yr of 1
2th Plan
(31.03
.14)
End of IIIrd
yr of 1
2th Plan
(31.03
.15)
End of IV
th yr
of 1
2th Plan
(31.03
.16)
End of 12th Plan
(31.03
.17)
kWh
Plan/Year
Plan wise Growth of Per Capita ConsumpLon of Electricity in the Country Chart : 4
* Provisional

6 7
Canada USA Australia Japan France Germany Korea UK Russia Italy South Africa Brazil China India* World
2014 15544 12962 10002 7829 6955 7035 10564 5131 6603 5002 4240 2578 3927 1010 3030
2013 15520 12987 10067 7836 7382 7022 10428 5409 6562 5124 4328 2583 3766 957 3026
0
2000
4000
6000
8000
10000
12000
14000
16000 kW
h Per Capita Electricity ConsumpNon in Various Countries in 2013 & 2014 Chart : 5
Source : IEA publicaNon 'Key World Energy StaNsNcs 2014 website (other than India) * Per capita consumpNon = (gross electrical energy avaibality /mid year populaNon)

8 9
Table 2Plan wise Growth of Installed Generating Capacity in India - Mode wise
(Utilities)(MW)
Sl. No. As on Hydro Thermal Nuclear RES TotalCoal/Lignite Gas Diesel Total
1 31.12.47 508 756 0 98 854 0 0 13622 31.12.50 560 1004 0 149 1153 0 0 17133 31.03.56 (End of 1st Plan) 1061 1597 0 228 1825 0 0 28864 31.03.61 (End of 2nd Plan) 1917 2436 0 300 2736 0 0 46535 31.03.66 (End of 3rd Plan) 4124 4417 134 352 4903 0 0 90276 31.03.69 (End of 3 Annual Plans) 5907 6640 134 276 7050 0 0 129577 31.03.74 (End of 4th Plan) 6966 8652 165 241 9058 640 0 166648 31.03.79 (End of 5th Plan) 10833 14875 168 164 15207 640 0 266809 31.03.80 (End of Annual Plan) 11384 15991 268 165 16424 640 0 28448
10 31.03.85 (End of 6th Plan) 14460 26311 542 177 27030 1095 0 4258511 31.03.90 (End of 7th Plan) 18308 41237 2343 165 43745 1565 18 6363612 31.03.92 (End of 2 Annual Plans) 19194 44791 3095 168 48054 1785 32 6906513 31.03.97 (End of 8th Plan) 21658 54154 6562 294 61010 2225 902 8579514 31.03.02 (End of 9th Plan) 26269 62131 11163 1135 74429 2720 1628 10504615 31.03.07 (End of 10th Plan) 34654 71121 13692 1202 86015 3900 7760 13232916 31.03.12 (End of 11th Plan) 38990 112022 18381 1200 131603 4780 24504 19987717 31.03.13 (End of Ist yr of 12th Plan) 39491 130221 20110 1200 151531 4780 27542 22334418 31.03.14 (End of IInd yr of 12th Plan) 40531 145273 21782 1200 168255 4780 34988 24855419 31.03.15 (End of IIIrd yr of 12th Plan) 41267 164636 23062 1200 188898 5780 38959 27490420 31.03.16 (End of IVth yr of 12th Plan) 42783 185173 24509 994 210675 5780 45924 30516221 31.03.17 (End of 12th Plan) 44478 192163 25329 838 218330 6780 57244 326833
(#) RES:-Renewable Energy Sources also includes Hydro capacity of 25.00 MW and below as reported by MNRE.

8 9
508 560 1061 1917 4124
5907 6966
10833 11384
14460
18308 19194 21658
26269
34654
38990 39491 40532 41267 42783
44478
0
5000
10000
15000
20000
25000
30000
35000
40000
45000
31.12.47
31.12.50
End of 1st Plan (31.03.56)
End of 2nd Plan (31.03.61)
End of 3rd Plan (31.03.66)
End of 3 Annual Plans (31.03.69)
End of 4th Plan (31.03.74)
End of 5th Plan (31.03.79)
End of Annual Plan (31.03.80)
End of 6th Plan (31.03.85)
End of 7th Plan (31.03.90)
End of 2 Annual Plans (31.03.92)
End of 8th Plan (31.03.97)
End of 9th Plan (31.03.02)
End of 10th Plan (31.03.07)
End of 11th Plan (31.03.12)
End of Ist yr of 12th Plan (31.03.13)
End of IInd yr of 12th Plan (31.03.14)
End of IIIrd yr of 12th Plan (31.03.15)
End of IVth yr of 12th Plan (31.03.16)
End of 12th Plan (31.03.17)
MW
Plan/Year
Plan wise Growth of Installed GeneraHng Capacity in India Hydro Electric Power StaHons
Chart : 6
10 11
Indus Ganga Central Indian Rivers
West Flowing Rivers
East Flowing Rivers
Brahamputra Basin All India
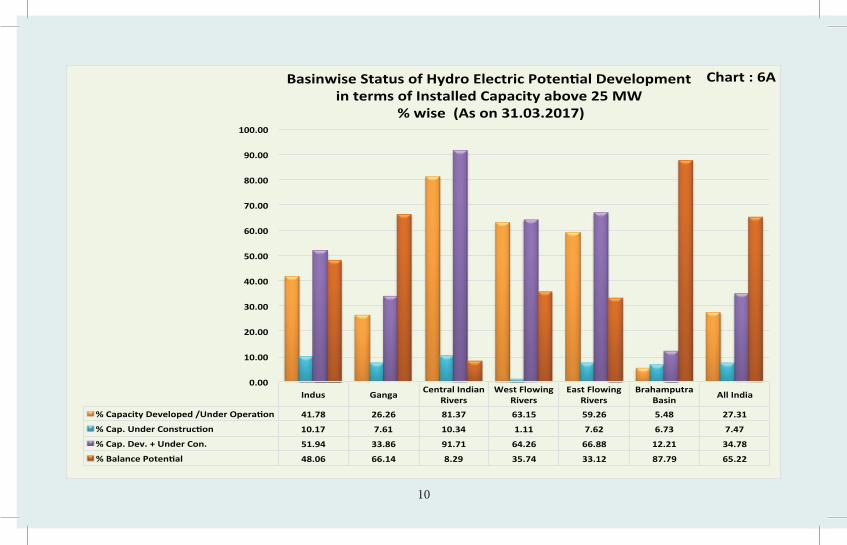
% Capacity Developed /Under OperaCon 41.78 26.26 81.37 63.15 59.26 5.48 27.31
% Cap. Under ConstrucCon 10.17 7.61 10.34 1.11 7.62 6.73 7.47
% Cap. Dev. + Under Con. 51.94 33.86 91.71 64.26 66.88 12.21 34.78
% Balance PotenCal 48.06 66.14 8.29 35.74 33.12 87.79 65.22
0.00
10.00
20.00
30.00
40.00
50.00
60.00
70.00
80.00
90.00
100.00
Basinwise Status of Hydro Electric PotenCal Development in terms of Installed Capacity above 25 MW
% wise (As on 31.03.2017)
Chart : 6A

10 11
Northern Region Western Region Southern Region Eastern Region North Eastern Region All India
% Capacity Developed /Under Opera@on 35.45 68.28 60.75 44.18 2.13 27.31
%Cap. Under Construc@on 9.37 4.92 7.24 13.54 5.06 7.47
%Cap. Dev. +Under Construc@on 44.82 73.20 67.99 57.72 7.19 34.78
% Capacity yet to be Developed 55.18 26.80 32.01 42.28 92.81 65.22
0.00
10.00
20.00
30.00
40.00
50.00
60.00
70.00
80.00
90.00
100.00
Region wise Status of Hydro Electric Poten@al Development in terms of Installed Capacity above 25 MW
% wise (As on 31.03.2017)
Chart : 6B
12 13
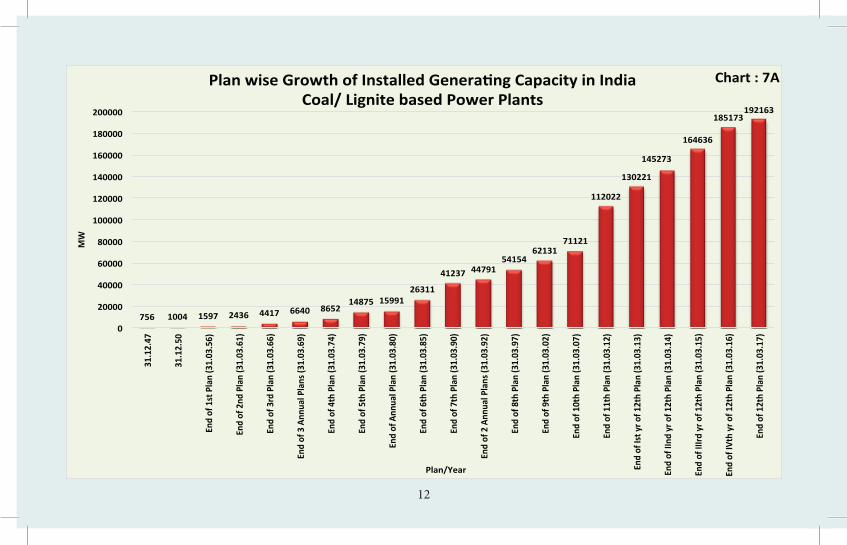
756 1004 1597 2436 4417 6640 8652
14875 15991 26311
41237 44791 54154
62131 71121
112022
130221
145273
164636
185173 192163
0
20000
40000
60000
80000
100000
120000
140000
160000
180000
200000
31.12.47
31.12.50
End of 1st Plan (31.03.56)
End of 2nd Plan (31.03.61)
End of 3rd Plan (31.03.66)
End of 3 Annual Plans (31.03.69)
End of 4th Plan (31.03.74)
End of 5th Plan (31.03.79)
End of Annual Plan (31.03.80)
End of 6th Plan (31.03.85)
End of 7th Plan (31.03.90)
End of 2 Annual Plans (31.03.92)
End of 8th Plan (31.03.97)
End of 9th Plan (31.03.02)
End of 10th Plan (31.03.07)
End of 11th Plan (31.03.12)
End of Ist yr of 12th Plan (31.03.13)
End of IInd yr of 12th Plan (31.03.14)
End of IIIrd yr of 12th Plan (31.03.15)
End of IVth yr of 12th Plan (31.03.16)
End of 12th Plan (31.03.17)
MW
Plan/Year
Plan wise Growth of Installed GeneraHng Capacity in India Coal/ Lignite based Power Plants
Chart : 7A

12 13
0 0 0 0 134 134 165 168 268 542 2343
3095
6562
11163
13692
18381 20110
21782 23062
24509 25329
0
3000
6000
9000
12000
15000
18000
21000
24000
27000
31.12.47
31.12.50
End of 1st Plan (31.03.56)
End of 2nd Plan (31.03.61)
End of 3rd Plan (31.03.66)
End of 3 Annual Plans (31.03.69)
End of 4th Plan (31.03.74)
End of 5th Plan (31.03.79)
End of Annual Plan (31.03.80)
End of 6th Plan (31.03.85)
End of 7th Plan (31.03.90)
End of 2 Annual Plans (31.03.92)
End of 8th Plan (31.03.97)
End of 9th Plan (31.03.02)
End of 10th Plan (31.03.07)
End of 11th Plan (31.03.12)
End of Ist yr of 12th Plan (31.03.13)
End of IInd yr of 12th Plan (31.03.14)
End of IIIrd yr of 12th Plan (31.03.15)
End of IVth yr of 12th Plan (31.03.16)
End of 12th Plan (31.03.17)
MW
Plan/Year
Plan wise Growth of Installed GeneraHng Capacity in India Gas/ Liquid Fuel based Power Plants
Chart : 7B

14 15
98 149
228 300 352
276 241 164 165 177 165 168
294
1135 1202 1200 1200 1200 1200
994
838
0
100
200
300
400
500
600
700
800
900
1000
1100
1200
1300
31.12.47
31.12.50
End of 1st Plan (31.03.56)
End of 2nd Plan (31.03.61)
End of 3rd Plan (31.03.66)
End of 3 Annual Plans (31.03.69)
End of 4th Plan (31.03.74)
End of 5th Plan (31.03.79)
End of Annual Plan (31.03.80)
End of 6th Plan (31.03.85)
End of 7th Plan (31.03.90)
End of 2 Annual Plans (31.03.92)
End of 8th Plan (31.03.97)
End of 9th Plan (31.03.02)
End of 10th Plan (31.03.07)
End of 11th Plan (31.03.12)
End of Ist yr of 12th Plan (31.03.13)
End of IInd yr of 12th Plan (31.03.14)
End of IIIrd yr of 12th Plan (31.03.15)
End of IVth yr of 12th Plan (31.03.16)
End of 12th Plan (31.03.17)
MW
Plan/Year
Plan wise Growth of Installed GeneraHng Capacity in India Diesel based Power Plants
Chart : 7C

14 15
0 0 0 0 0 0
640 640 640 1095 1565
1785 2225
2720
3900
4780 4780 4780
5780 5780
6780
0
1000
2000
3000
4000
5000
6000
7000
31.12.47
31.12.50
End of 1st Plan (31.03
.56)
End of 2nd
Plan (31.03
.61)
End of 3rd Plan (31.03
.66)
End of 3 Ann
ual P
lans (3
1.03
.69)
End
of 4
th Plan (31.03
.74)
End of 5th Plan (31.03
.79)
End of Ann
ual P
lan (31.03
.80)
End of 6th Plan (31.03
.85)
End of 7th Plan (31.03
.90)
End
of 2
Ann
ual P
lans (3
1.03
.92)
End of 8th Plan (31.03
.97)
End of 9th Plan (31.03
.02)
End of 10th Plan
(31.03
.07)
End of 11th Plan
(31.03
.12)
End of Ist y
r of 1
2th Plan
(31.03
.13)
End of IInd
yr o
f 12th Plan
(31.03
.14)
End of IIIrd
yr o
f 12th Plan
(31.03
.15)
End of IV
th yr o
f 12th Plan
(31.03
.16)
End of 12th Plan
(31.03
.17)
MW
Plan/Year
Plan wise Growth of Installed GeneraHng Capacity in India Nuclear Power Plants
Chart : 8

16 17
2001 2002 2003 2004 2005 2006 2007 2008 2009 2010 2011 2012 2013 2014 2015 2016 2017 State 63721 65512 66582 67505 69161 73235 73579 77523 79309 82905 87417 85919 89125 92265 95079 101790 103967
Private 9936 10800 11351 12325 13718 14135 16713 20511 22879 29014 35450 54276 68859 88164 107304 127076 142608
Central 27969 28734 29944 32854 35547 36917 42037 45027 45777 47479 50759 59682 65360 68126 72521 76297 80257
6372
1
6551
2
6658
2
6750
5
6916
1
7323
5
7357
9
7752
3
7930
9
8290
5
8741
7
8591
9
8912
5
9226
5
9507
9
1017
90
1039
67
9936
1080
0
1135
1
1232
5
1371
8
1413
5
1671
3
2051
1
2287
9
2901
4
3545
0
5427
6 6885
9
8816
4
1073
04 12
7076
1426
08
2796
9
2873
4
2994
4
3285
4
3554
7
3691
7
4203
7
4502
7
4577
7
4747
9
5075
9 5968
2 6536
0
6812
6
7252
1
7629
7
8025
7
0
20000
40000
60000
80000
100000
120000
140000
160000
Sector wise Growth of Genera>on Capacity (MW) 2000-‐01 to 2016-‐17
Chart : 8A

16 17
2007-‐08 2008-‐09 2009-‐10 2010-‐11 2011-‐12 2012-‐13 2013-‐14 2014-‐15 2015-‐16 2016-‐17 SHP 2045.07 2160.48 2604.92 2913.00 3410.52 3643.17 3803.68 4055.36 4273.47 4379.86
WIND 7666.84 9344.13 10647.45 12806.54 16896.60 18484.99 21042.58 23354.35 26777.40 32279.77
BIOMASS 1325.63 1650.43 2167.73 2600.13 3135.33 3601.03 7419.23 7714.90 8019.75 8181.70
U & I 85.75 85.25 95.01 102.46 119.68 126.08 90.58 90.58 90.58 114.08
SOLAR 2.12 2.12 6.00 32.39 941.31 1686.44 2631.93 3743.97 6762.85 12288.83
0
3000
6000
9000
12000
15000
18000
21000
24000
27000
30000
33000
MW
Mode wise/Year wise Growth of GeneraLng Capacity of RES
during 12th Plan Chart : 8B

18 19
Hydro 44478 MW
13.61%
Coal/Lignite 192163 MW
58.80%
Gas 25329 MW
7.75%
Diesel 838 MW 0.26%
Nuclear 6780 MW
2.07%
RES 57244 MW
17.51%
All India Installed GeneraJng Capacity -‐ End of Vth Year of 12th Plan (UJliJes)
(31.03.2017)
Hydro Coal/Lignite Gas Diesel Nuclear RES
Total =326833 MW
Pie Chart : 9

18 19
Hydro 42783 MW
14.02%
Coal/Lignite 185173 MW
60.68%
Gas 24509 MW
8.03%
Diesel 994 MW 0.33%
Nuclear 5780 MW
1.89%
RES 45924 MW
15.05%
All India Installed GeneraJng Capacity -‐ End of IVth Year of 12th Plan (UJliJes)
(31.03.2016)
Hydro Coal/Lignite Gas Diesel Nuclear RES
Total = 305162 MW
Pie Chart : 9A

20 21
Table 3Plan wise Growth of Gross Electricity Generation in India - Mode wise
(Utilities)(GWh)
Sl. No. During financial year Hydro Thermal Nuclear RES TotalCoal/Lignite Gas Diesel Total
1 1947 2195 1733 0 144 1877 0 0 40732 1950 2519 2387 0 200 2587 0 0 51063 1955-56 (End of 1st Plan) 4295 5134 0 233 5367 0 0 96624 1960-61 (End of 2nd Plan) 7837 8732 0 368 9100 0 0 169375 1965-66 (End of 3rd Plan) 15225 17372 69 324 17765 0 0 329906 1968-69 (End of 3 Annual Plans) 20723 26394 123 194 26711 0 0 474337 1973-74 (End of 4th Plan) 28972 34853 343 125 35321 2396 0 666898 1978-79 (End of 5th Plan) 47159 52024 515 55 52594 2770 0 1025239 1979-80 (End of Annual Plan) 45478 55720 500 53 56273 2876 0 104627
10 1984-85 (End of 6th Plan) 53948 96957 1834 45 98836 4075 0 15685911 1989-90 (End of 7th Plan) 62116 172643 5962 85 178690 4625 6 24543812 1991-92 (End of 2 Annual Plans) 72757 197163 11450 95 208708 5525 38 28702913 1996-97 (End of 8th Plan) 68901 289378 26985 679 317042 9071 876 39588914 2001-02 (End of 9th Plan) 73580 370884 47099 4317 422300 19475 2085 51743915 2006-07 (End of 10th Plan) 113502 461794 64157 2539 528490 18802 9860 67065416 2011-12 (End of 11th Plan) 130511 612497 93281 2649 708427 32287 51226 92245117 2012-13 (Ist yr of 12th Plan) 113720 691341 66664 2449 760454 32866 57449 96448918 2013-14 (IInd yr of 12th Plan) 134847 745533 44522 1999 792054 34228 65520 102664919 2014-15 (IIIrd yr of 12th Plan) 129244 835291 41075 1575 877941 36102 61785 110507220 2015-16 (IVth yr of 12th Plan) 121377 895340 47122 551 943013 37413 65781 116758421 2016-17 (End of 12th Plan)* 122378 944861 49094 275 994230 37916 81869 1236392
Note: * Provisional1. BBMB generation has been considered in State Sector. 2. RES Generation upto 2013-2014 as per normative generation.3. RES Generation during 2014-2015 onwards are as per actual generation received from utilities.

20 21
1994-‐95
1995-‐96
1996-‐97
1997-‐98
1998-‐99
1999-‐00
2000-‐01
2001-‐02
2002-‐03
2003-‐04
2004-‐05
2005-‐06
2006-‐07
2011-‐12
2012-‐13
2013-‐14
2014-‐15
2015-‐16
2016-‐17
Hydro 4.01 3.47 3.23 3.42 3.74 3.49 3.03 2.86 2.41 2.67 2.80 3.21 3.39 3.35 2.90 3.37 3.16 2.89 2.80
Coal/Lignite 4.80 5.18 5.38 5.46 5.44 5.66 5.91 6.02 6.18 6.32 6.39 6.39 6.61 5.47 5.71 5.41 5.39 5.12 5.01
Gas/Liquid 3.51 4.18 4.21 4.84 4.96 5.28 4.80 4.36 4.62 4.94 5.18 4.94 4.86 5.07 3.46 2.13 1.83 1.98 1.97
Nuclear 2.67 3.59 4.08 4.53 5.36 5.40 6.10 6.98 7.13 6.54 6.20 5.65 5.18 6.75 6.88 7.16 6.84 6.47 6.04
All Types 4.44 4.62 4.68 4.82 4.92 5.03 5.02 5.01 5.00 5.12 5.14 5.14 5.23 4.62 4.32 4.19 4.07 3.87 3.78
0.00
1.00
2.00
3.00
4.00
5.00
6.00
7.00
8.00 Sp
ecifi
c Gen
eraH
on (G
Wh/
MW
)
Years
Specific GeneraHon by All India Power StaHons -‐ Mode wise (UHliHes)
1994-‐95 to 2016-‐17
Chart : 10
22 23
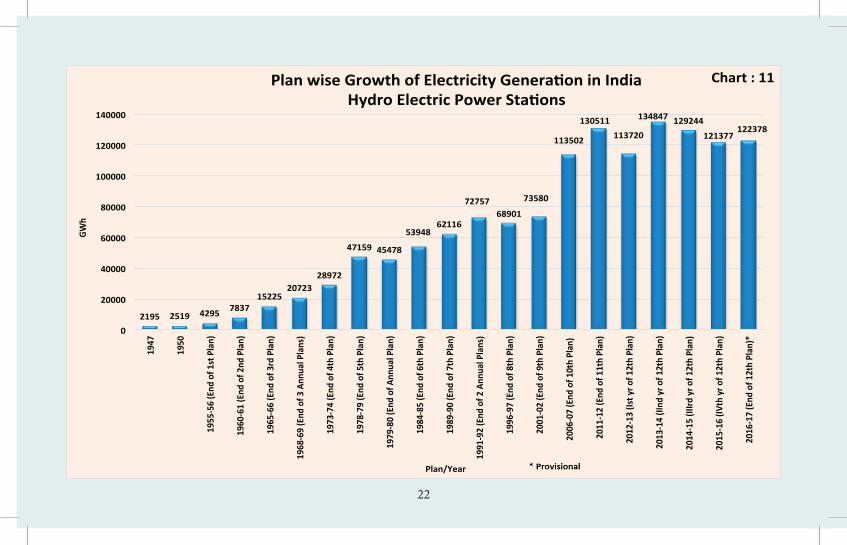
2195 2519 4295 7837 15225
20723 28972
47159 45478
53948 62116
72757 68901
73580
113502
130511 113720
134847 129244
121377 122378
0
20000
40000
60000
80000
100000
120000
140000
1947
1950
1955
-‐56
(End
of 1
st P
lan)
1960
-‐61
(End
of 2
nd P
lan)
1965
-‐66
(End
of 3
rd P
lan)
1968
-‐69
(End
of 3
Ann
ual P
lans
)
1973
-‐74
(End
of 4
th P
lan)
1978
-‐79
(End
of 5
th P
lan)
1979
-‐80
(End
of A
nnua
l Pla
n)
1984
-‐85
(End
of 6
th P
lan)
1989
-‐90
(End
of 7
th P
lan)
1991
-‐92
(End
of 2
Ann
ual P
lans
)
1996
-‐97
(End
of 8
th P
lan)
2001
-‐02
(End
of 9
th P
lan)
2006
-‐07
(End
of 1
0th
Plan
)
2011
-‐12
(End
of 1
1th
Plan
)
2012
-‐13
(Ist y
r of 1
2th
Plan
)
2013
-‐14
(IInd
yr o
f 12t
h Pl
an)
2014
-‐15
(IIIrd
yr o
f 12t
h Pl
an)
2015
-‐16
(IVth
yr o
f 12t
h Pl
an)
2016
-‐17
(End
of 1
2th
Plan
)*
GWh
Plan wise Growth of Electricity GeneraGon in India
Hydro Electric Power StaGons Chart : 11
Plan/Year

22 23
1733 2387 5134 8732 17372 26394 34853 52024 55720 96957
172643 197163
289378
370884
461794
612497
691341 746087
835838
895340 944861
0
100000
200000
300000
400000
500000
600000
700000
800000
900000
1000000
1947
1950
1955
-‐56
(End
of 1
st P
lan)
1960
-‐61
(End
of 2
nd P
lan)
1965
-‐66
(End
of 3
rd P
lan)
1968
-‐69
(End
of 3
Ann
ual P
lans
)
1973
-‐74
(End
of 4
th P
lan)
1978
-‐79
(End
of 5
th P
lan)
1979
-‐80
(End
of A
nnua
l Pla
n)
1984
-‐85
(End
of 6
th P
lan)
1989
-‐90
(End
of 7
th P
lan)
1991
-‐92
(End
of 2
Ann
ual P
lans
)
1996
-‐97
(End
of 8
th P
lan)
2001
-‐02
(End
of 9
th P
lan)
2006
-‐07
(End
of 1
0th
Plan
)
2011
-‐12
(End
of 1
1th
Plan
)
2012
-‐13
(Ist y
r of 1
2th
Plan
)
2013
-‐14
(IInd
yr o
f 12t
h Pl
an)
2014
-‐15
(IIIrd
yr o
f 12t
h Pl
an)
2015
-‐16
(IVth
yr o
f 12t
h Pl
an)
2016
-‐17
(End
of 1
2th
Plan
)*
GWh
Plan/Year
Plan wise Growth of Electricity GeneraHon in India Coal/ Lignite based Power Plants
Chart : 12A

24 25
0 0 0 0 69 123 343 515 500 1834 5962
11450
26985
47099
64157
93281
66664
44522 41075
47122 49094
0
10000
20000
30000
40000
50000
60000
70000
80000
90000
100000
1947
1950
1955-‐56 (End of 1st Plan)
1960-‐61 (End of 2nd Plan)
1965-‐66 (End of 3rd Plan)
1968-‐69 (End of 3 Annual Plans)
1973-‐74 (End of 4th Plan)
1978-‐79 (End of 5th Plan)
1979-‐80 (End of Annual Plan)
1984-‐85 (End of 6th Plan)
1989-‐90 (End of 7th Plan)
1991-‐92 (End of 2 Annual Plans)
1996-‐97 (End of 8th Plan)
2001-‐02 (End of 9th Plan)
2006-‐07 (End of 10th Plan)
2011-‐12 (End of 11th Plan)
2012-‐13 (Ist yr of 12th Plan)
2013-‐14 (IInd yr of 12th Plan)
2014-‐15 (IIIrd yr of 12th Plan)
2015-‐16 (IVth yr of 12th Plan)
2016-‐17 (End of 12th Plan)*
GWh
Plan/Year
Plan wise Growth of Electricity GeneraIon in India Gas/ Liquid Fuel based Power Plants
Chart : 12B

24 25
144 200 233 368 324
194 125 55 53 45 85 95
679
4317
2539 2649 2449
1868
1407
551 275
0
500
1000
1500
2000
2500
3000
3500
4000
4500
1947
1950
1955
-‐56
(End
of 1
st P
lan)
1960
-‐61
(End
of 2
nd P
lan)
1965
-‐66
(End
of 3
rd P
lan)
1968
-‐69
(End
of 3
Ann
ual P
lans
)
1973
-‐74
(End
of 4
th P
lan)
1978
-‐79
(End
of 5
th P
lan)
1979
-‐80
(End
of A
nnua
l Pla
n)
1984
-‐85
(End
of 6
th P
lan)
1989
-‐90
(End
of 7
th P
lan)
1991
-‐92
(End
of 2
Ann
ual P
lans
)
1996
-‐97
(End
of 8
th P
lan)
2001
-‐02
(End
of 9
th P
lan)
2006
-‐07
(End
of 1
0th
Plan
)
2011
-‐12
(End
of 1
1th
Plan
)
2012
-‐13
(Ist y
r of 1
2th
Plan
)
2013
-‐14
(IInd
yr o
f 12t
h Pl
an)
2014
-‐15
(IIIrd
yr o
f 12t
h Pl
an)
2015
-‐16
(IVth
yr o
f 12t
h Pl
an)
2016
-‐17
(End
of 1
2th
Plan
)*
GWh
Plan/Year
Plan wise Growth of Electricity GeneraIon in India Diesel based Power Plants
Chart : 12C

26 27
52.4
0
53.2
0 56.5
0
55.0
0
56.5
0
53.9
0
55.3
0
57.1
0 61.0
0
60.0
0
63.0
0
64.4
0
64.7
0
64.6
0
67.3
0
69.0
0
69.9
0
72.2
0
72.7
0
74.8
0
74.3
0
77.2
7
78.6
2
77.2
7
77.6
8
74.9
7
73.4
7
70.1
3
65.5
6
64.2
5
62.2
4
59.8
8
0
10
20
30
40
50
60
70
80
90 19
85-‐86
1986
-‐87
1987
-‐88
1988
-‐89
1989
-‐90
1990
-‐91
1991
-‐92
1992
-‐93
1993
-‐94
1994
-‐95
1995
-‐96
1996
-‐97
1997
-‐98
1998
-‐99
1999
-‐00
2000
-‐01
2001
-‐02
2002
-‐03
2003
-‐04
2004
-‐05
2005
-‐06
2006
-‐07
2007
-‐08
2008
-‐09
2009
-‐10
2010
-‐11
2011
-‐12
2012
-‐13
2013
-‐14
2014
-‐15
2015
-‐16
2016
-‐17
PLF
(%)
YEARS
All India PLF (%) of Thermal Power StaGons (Coal and Lignite based)
Chart : 13

26 27
0 0 0 0 0 0 2396 2770 2876
4075 4625 5525
9071
19475 18802
32287 32866 34228
36102 37413 37916
0
5000
10000
15000
20000
25000
30000
35000
40000
1947
1950
1955
-‐56 (End
of 1
st Plan)
1960
-‐61 (End
of 2
nd Plan)
1965
-‐66 (End
of 3
rd Plan)
1968
-‐69 (End
of 3
Ann
ual P
lans
)
1973
-‐74 (End
of 4
th Plan)
1978
-‐79 (End
of 5
th Plan)
1979
-‐80 (End
of A
nnua
l Plan)
1984
-‐85 (End
of 6
th Plan)
1989
-‐90 (End
of 7
th Plan)
1991
-‐92 (End
of 2
Ann
ual P
lans
)
1996
-‐97 (End
of 8
th Plan)
2001
-‐02 (End
of 9
th Plan)
2006
-‐07 (End
of 1
0th Plan
)
2011
-‐12 (End
of 1
1th Plan
)
2012
-‐13 (Is
t yr o
f 12th Plan
)
2013
-‐14 (IInd
yr o
f 12th Plan
)
2014
-‐15 (IIIrd
yr o
f 12th Plan
)
2015
-‐16 (IV
th yr o
f 12th Plan
)
2016
-‐17 (End
of 1
2th Plan
)*
GWh
Plan/Year
Plan wise Growth of Electricity GeneraIon in India Nuclear Power Plants
Chart : 14

28 29
4073 5106 9662 16937 32990 47433 66689 102523 104627
156859 245438
287029
395889
517439
670654
922451 964489
1021167 1105446
1167584 1236392
0
200000
400000
600000
800000
1000000
1200000
1400000
1947
1950
1955
-‐56 (End
of 1
st Plan)
1960
-‐61 (End
of 2
nd Plan)
1965
-‐66 (End
of 3
rd Plan)
1968
-‐69 (End
of 3
Ann
ual P
lans
)
1973
-‐74 (End
of 4
th Plan)
1978
-‐79 (End
of 5
th Plan)
1979
-‐80 (End
of A
nnua
l Plan)
1984
-‐85 (End
of 6
th Plan)
1989
-‐90 (End
of 7
th Plan)
1991
-‐92 (End
of 2
Ann
ual P
lans
)
1996
-‐97 (End
of 8
th Plan)
2001
-‐02 (End
of 9
th Plan)
2006
-‐07 (End
of 1
0th Plan
)
2011
-‐12 (End
of 1
1th Plan
)
2012
-‐13 (Is
t yr o
f 12th Plan
)
2013
-‐14 (IInd
yr o
f 12th Plan
)
2014
-‐15 (IIIrd
yr o
f 12th Plan
)
2015
-‐16 (IV
th yr o
f 12th Plan
)
2016
-‐17 (End
of 1
2th Plan
)*
GWh
Plan/Year
Plan wise Growth of All India Electricity GeneraIon (UIliIes)
Chart : 15

28 29
2001 2002 2003 2004 2005 2006 2007 2008 2009 2010 2011 2012 2013 2014 2015 2016 2017 State 278980 290244 291360 304647 315365 327731 350844 368888 374209 380371 386038 391547 394947 400126 407817 389815 367632
Private 43981 43116 48045 55372 58616 61763 66803 80932 89798 119918 140877 199400 230793 281858 350074 408275 445586
Central 178243 184079 193288 205082 220475 234326 253007 272806 277160 299562 317833 331505 338748 344665 358959 369494 423174
2789
80
2902
44
2913
60
3046
47
3153
65
3277
31
3508
44
3688
88
3742
09
3803
71
3860
38
3915
47
3949
47
4001
26
3668
03
3898
15
3676
32
4398
1
4311
6
4804
5
5537
2
5861
6
6176
3
6680
3
8093
2
8979
8 1199
18
1408
77 19
9400
2307
93 2818
58
2817
60
4082
75
4455
86
1782
43
1840
79
1932
88
2050
82
2204
75
2343
26
2530
07
2728
06
2771
60
2995
62
3178
33
3315
05
3387
48
3446
65
3951
02
3694
94
4231
74
0
50000
100000
150000
200000
250000
300000
350000
400000
450000
Sector wise Growth of Energy GeneraAon (GWh) 2000-‐01 to 2016-‐17
Chart : 15A
30 31
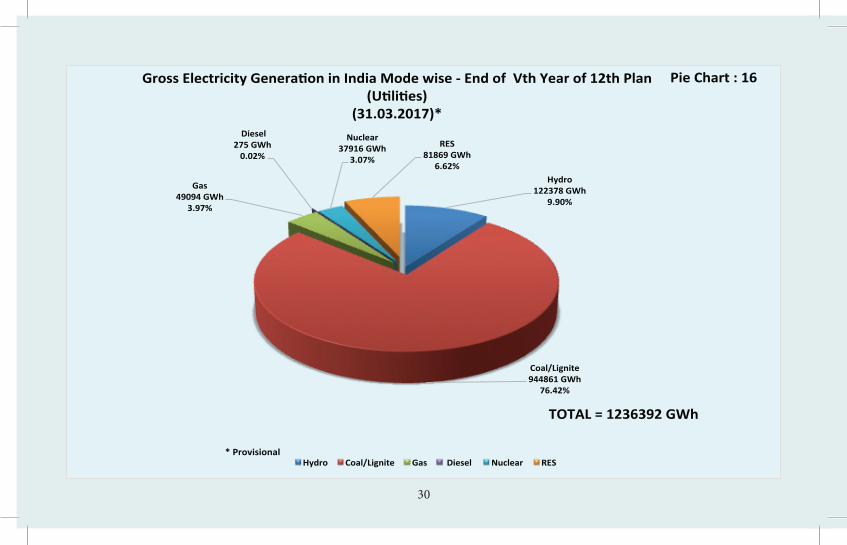
Hydro 122378 GWh
9.90%
Coal/Lignite 944861 GWh
76.42%
Gas 49094 GWh
3.97%
Diesel 275 GWh 0.02%
Nuclear 37916 GWh
3.07%
RES 81869 GWh
6.62%
Gross Electricity GeneraHon in India Mode wise -‐ End of Vth Year of 12th Plan (UHliHes)
(31.03.2017)*
Hydro Coal/Lignite Gas Diesel Nuclear RES
Pie Chart : 16
TOTAL = 1236392 GWh
* Provisional

30 31
Hydro 121377 GWh
10.40%
Coal/Lignite 895340 GWh
76.68%
Gas 47122 GWh
4.04%
Diesel 551 GWh 0.05%
Nuclear 37413 GWh
3.20%
RES 65781 GWh
5.63%
Gross Electricity GeneraHon in India Mode wise -‐ End of IVth Year of 12th Plan (UHliHes)
(31.03.2016)
Hydro Coal/Lignite Gas Diesel Nuclear RES
TOTAL = 1167584 GWh
Pie Chart : 16A

32 33
United States
People's Republic of China
Japan Russian Federa:o
n India Germany Canada France Korea United
Kingdom Italy Australia South Africa Brazil
Others 313312 242833 67644 3374 73563 152382 31926 31118 7353 62055 65247 18622 2493 58202
Hydro 261473 1051137 81796 181151 129244 19587 382463 62829 2752 5885 58545 18386 975 373439
Nuclear 830584 132538 0 172508 36102 97129 107678 436474 156407 63748 0 0 13794 15378
Gas 1161333 114505 420825 529974 41075 62270 61355 12738 130458 100670 93637 54394 0 81075
Oil 39877 9517 85460 8693 1575 5659 7974 1806 17395 1670 14163 5013 189 35423
Coal 1712577 4115215 379805 161889 835291 284911 64718 12014 231500 102014 46524 151849 232020 26754
0
1000000
2000000
3000000
4000000
5000000
6000000
GWh
Gross Electricity Genera:on in various Countries Mode wise in 2014
Chart : 17
Source : -‐ Interna:onal Energy Agency (IEA) except India

32 33
United States
People's Republic of China
Japan Russian Federa:o
n India Germany Canada France Korea United
Kingdom Italy Australia South Africa Brazil
Others 7.25 4.29 6.53 0.32 6.59 24.50 4.87 5.59 1.35 18.47 23.46 7.50 1.00 9.86
Hydro 6.05 18.55 7.90 17.13 11.57 3.15 58.29 11.28 0.50 1.75 21.05 7.41 0.39 63.27
Nuclear 19.23 2.34 0.00 16.31 3.23 15.62 16.41 78.36 28.65 18.97 0.00 0.00 5.53 2.61
Gas 26.89 2.02 40.64 50.11 3.68 10.01 9.35 2.29 23.90 29.96 33.67 21.91 0.00 13.74
Oil 0.92 0.17 8.25 0.82 0.14 0.91 1.22 0.32 3.19 0.50 5.09 2.02 0.08 6.00
Coal 39.65 72.63 36.68 15.31 74.79 45.81 9.86 2.16 42.41 30.36 16.73 61.16 93.00 4.53
0.00
10.00
20.00
30.00
40.00
50.00
60.00
70.00
80.00
90.00
100.00
Percent (%
)
Mode wise % Share in Electricity Genera:on in various Countries in 2014
Chart : 18
Source : -‐ Interna:onal Energy Agency ( IEA) except India.

34 35
Table 4Plan wise/ Category wise Growth of Electricity Consumption in India
(Utilities & Non-Utilities)(GWh)
Sl. No.
During financial year Domes-tic
% to Total
Com-mercial
% to Total
Indus-trial
% to Total
Trac-tion
% to Total
Agricul-ture
% to Total
Misc. % to Total
Total
1 1947 423 10.11 178 4.26 2960 70.78 277 6.62 125 2.99 219 5.24 41822 1950 525 9.36 309 5.51 4057 72.32 308 5.49 162 2.89 249 4.44 56103 1955-56 (End of 1st Plan) 934 9.20 546 5.38 7514 74.03 405 3.99 316 3.11 435 4.29 101504 1960-61 (End of 2nd Plan) 1492 8.88 848 5.05 12547 74.67 454 2.70 833 4.96 630 3.75 168045 1965-66 (End of 3rd Plan) 2355 7.73 1650 5.42 22596 74.19 1057 3.47 1892 6.21 905 2.97 304556 1968-69 (End of 3 Annual Plans) 3184 7.69 2126 5.14 29931 72.31 1247 3.01 3465 8.37 1439 3.48 413927 1973-74 (End of 4th Plan) 4645 8.36 2988 5.38 37791 68.02 1531 2.76 6310 11.36 2292 4.13 555578 1978-79 (End of 5th Plan) 7576 9.02 4330 5.15 54440 64.81 2186 2.60 12028 14.32 3445 4.10 840059 1979-80 (End of Annual Plan) 8402 9.85 4657 5.46 53206 62.35 2301 2.70 13452 15.76 3316 3.89 8533410 1984-85 (End of 6th Plan) 15506 12.45 6937 5.57 73520 59.02 2880 2.31 20961 16.83 4765 3.83 12456911 1989-90 (End of 7th Plan) 29577 15.16 9548 4.89 100373 51.45 4070 2.09 44056 22.58 7474 3.83 19509812 1991-92 (End of 2 Annual Plans) 35854 15.51 12032 5.20 110844 47.94 4520 1.96 58557 25.33 9394 4.06 23120113 1996-97 (End of 8th Plan) 55267 17.53 17519 5.56 139253 44.17 6594 2.09 84019 26.65 12642 4.01 31529414 2001-02 (End of 9th Plan) 79694 21.27 24139 6.44 159507 42.57 8106 2.16 81673 21.80 21551 5.75 37467015 2006-07 (End of 10th Plan) 111002 21.12 40220 7.65 241216 45.89 10800 2.05 99023 18.84 23411 4.45 52567216 2011-12 (End of 11th Plan) 171104 21.79 65381 8.33 352291 44.87 14206 1.81 140960 17.95 41252 5.25 78519417 2012-13 (Ist year of 12th Plan) 183700 22.29 72794 8.83 365989 44.40 14100 1.71 147462 17.89 40256 4.88 82430118 2013-14 (IInd year of 12th Plan) 199842 22.86 74247 8.49 384418 43.97 15540 1.78 152744 17.47 47418 5.42 87420919 2014-15 (IIIrd year of 12th Plan) 217405 22.92 78391 8.26 418346 44.11 16177 1.71 168913 17.81 49290 5.20 94852220 2015-16 (IVth year of 12th Plan) 238876 23.86 86037 8.59 423523 42.30 16594 1.66 173185 17.30 62976 6.29 100119121 2016-17 (End of 12th Plan)@ 259311 24.32 98333 9.22 426665 40.01 17217 1.61 195473 18.33 69269 6.50 1066268
(@) Estimated

34 35
423 525 934 1492 2355 3184 4645 7576 8402 15506 29577 35854
55267 79694
111002
171104 183700
199842 217405
238876 259311
0
50000
100000
150000
200000
250000
300000
1947
1950
1955
-‐56 (End
of 1
st Plan)
1960
-‐61 (End
of 2
nd Plan)
1965
-‐66 (End
of 3
rd Plan)
1968
-‐69 (End
of 3
Ann
ual P
lans)
1973
-‐74 (End
of 4
th Plan)
1978
-‐79 (End
of 5
th Plan)
1979
-‐80 (End
of A
nnua
l Plan)
1984
-‐85 (End
of 6
th Plan)
1989
-‐90 (End
of 7
th Plan)
1991
-‐92 (End
of 2
Ann
ual P
lans)
1996
-‐97 (End
of 8
th Plan)
2001
-‐02 (End
of 9
th Plan)
2006
-‐07 (End
of 1
0th Plan
)
2011
-‐12 (End
of 1
1th Plan
)
2012
-‐13 (Is
t yea
r of 1
2th Plan
)
2013
-‐14 (IInd
yea
r of 1
2th Plan
)
2014
-‐15 (IIIrd
yea
r of 1
2th Plan
)
2015
-‐16 (IV
th yea
r of 1
2th Plan
)
2016
-‐17 (End
of 1
2th Plan
)@
GWh
Plan wise Growth of Electricity ConsumpJon in India DomesJc Sector
Chart : 19
Plan/Year @ EsJmated
Year 1947-‐50 1950-‐60 1960-‐70 1970-‐80 1980-‐90 1990-‐2000 2000-‐10 2010-‐17 % Growth 11.87 10.14 9.73 9.18 13.41 9.08 7.21 9.57

36 37
178 309 546 848 1650 2126 2988 4330 4657 6937 9548 12032 17519
24139
40220
65381
72794 74247 78391
86037
98333
0
10000
20000
30000
40000
50000
60000
70000
80000
90000
100000
1947
1950
1955
-‐56
(End
of 1
st P
lan)
1960
-‐61
(End
of 2
nd P
lan)
1965
-‐66
(End
of 3
rd P
lan)
1968
-‐69
(End
of 3
Ann
ual P
lans
)
1973
-‐74
(End
of 4
th P
lan)
1978
-‐79
(End
of 5
th P
lan)
1979
-‐80
(End
of A
nnua
l Pla
n)
1984
-‐85
(End
of 6
th P
lan)
1989
-‐90
(End
of 7
th P
lan)
1991
-‐92
(End
of 2
Ann
ual P
lans
)
1996
-‐97
(End
of 8
th P
lan)
2001
-‐02
(End
of 9
th P
lan)
2006
-‐07
(End
of 1
0th
Plan
)
2011
-‐12
(End
of 1
1th
Plan
)
2012
-‐13
(Ist y
ear o
f 12t
h Pl
an)
2013
-‐14
(IInd
yea
r of 1
2th
Plan
)
2014
-‐15
(IIIrd
yea
r of 1
2th
Plan
)
2015
-‐16
(IVth
yea
r of 1
2th
Plan
)
2016
-‐17
(End
of 1
2th
Plan
)@
GWh
Plan wise Growth of Electricity ConsumpJon in India Commercial Sector
Chart : 20
Plan/Year @ EsJmated
Year 1947-‐50 1950-‐60 1960-‐70 1970-‐80 1980-‐90 1990-‐2000 2000-‐10 2010-‐17 % Growth 3.18 9.50 11.78 7.15 7.45 8.28 11.47 7.69

36 37
2960 4057 7514 12547 22596 29931 37791
54440 53206 73520
100373 110844 139253 159507
241216
352291 365989 384418
418346 423523 426665
0
50000
100000
150000
200000
250000
300000
350000
400000
450000
1947
1950
1955
-‐56
(End
of 1
st P
lan)
1960
-‐61
(End
of 2
nd P
lan)
1965
-‐66
(End
of 3
rd P
lan)
1968
-‐69
(End
of 3
Ann
ual P
lans
)
1973
-‐74
(End
of 4
th P
lan)
1978
-‐79
(End
of 5
th P
lan)
1979
-‐80
(End
of A
nnua
l Pla
n)
1984
-‐85
(End
of 6
th P
lan)
1989
-‐90
(End
of 7
th P
lan)
1991
-‐92
(End
of 2
Ann
ual P
lans
)
1996
-‐97
(End
of 8
th P
lan)
2001
-‐02
(End
of 9
th P
lan)
2006
-‐07
(End
of 1
0th
Plan
)
2011
-‐12
(End
of 1
1th
Plan
)
2012
-‐13
(Ist y
ear o
f 12t
h Pl
an)
2013
-‐14
(IInd
yea
r of 1
2th
Plan
)
2014
-‐15
(IIIrd
yea
r of 1
2th
Plan
)
2015
-‐16
(IVth
yea
r of 1
2th
Plan
)
2016
-‐17
(End
of 1
2th
Plan
)@
GWh
Plan wise Growth of Electricity ConsumpJon in India Industrial Sector
Chart : 21
Plan/Year @ EsJmated
Year 1947-‐50 1950-‐60 1960-‐70 1970-‐80 1980-‐90 1990-‐2000 2000-‐10 2010-‐17 % Growth 11.08 10.40 11.57 5.02 6.55 4.43 10.36 4.70

38 39
277 308 405 454 1057 1247 1531 2186 2301 2880
4070 4520
6594 8106
10800
14206 14100 15540 16177 16594
17217
0
2000
4000
6000
8000
10000
12000
14000
16000
18000
20000
1947
1950
1955
-‐56 (End
of 1
st Plan)
1960
-‐61 (End
of 2
nd Plan)
1965
-‐66 (End
of 3
rd Plan)
1968
-‐69 (End
of 3
Ann
ual P
lans)
1973
-‐74 (End
of 4
th Plan)
1978
-‐79 (End
of 5
th Plan)
1979
-‐80 (End
of A
nnua
l Plan)
1984
-‐85 (End
of 6
th Plan)
1989
-‐90 (End
of 7
th Plan)
1991
-‐92 (End
of 2
Ann
ual P
lans)
1996
-‐97 (End
of 8
th Plan)
2001
-‐02 (End
of 9
th Plan)
2006
-‐07 (End
of 1
0th Plan
)
2011
-‐12 (End
of 1
1th Plan
)
2012
-‐13 (Is
t yea
r of 1
2th Plan
)
2013
-‐14 (IInd
yea
r of 1
2th Plan
)
2014
-‐15 (IIIrd
yea
r of 1
2th Plan
)
2015
-‐16 (IV
th yea
r of 1
2th Plan
)
2016
-‐17 (End
of 1
2th Plan
)@
GWh
Plan wise Growth of Electricity ConsumpJon in India TracJon Sector
Chart : 22
Plan/Year @ EsJmated
Year 1947-‐50 1950-‐60 1960-‐70 1970-‐80 1980-‐90 1990-‐2000 2000-‐10 2010-‐17 % Growth 3.60 12.71 48.63 4.74 5.87 7.10 4.33 4.17
38 39
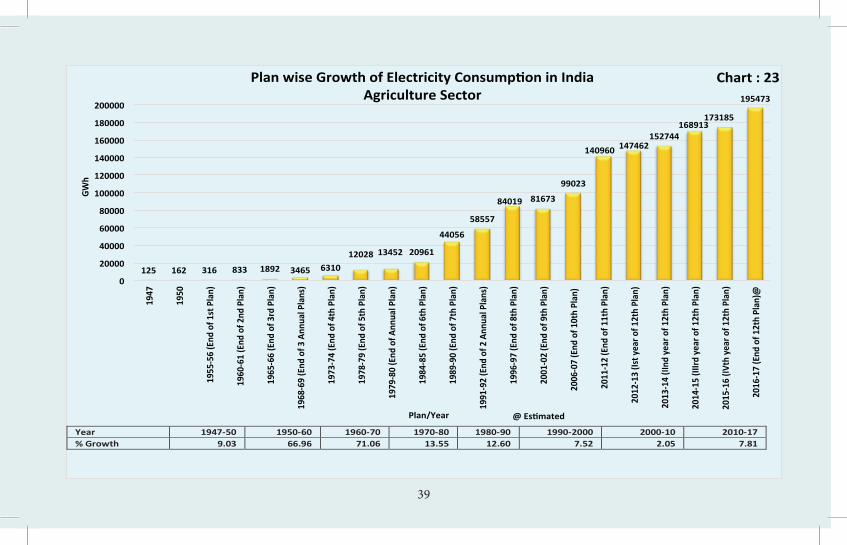
125 162 316 833 1892 3465 6310 12028 13452 20961
44056
58557
84019 81673
99023
140960 147462 152744
168913 173185
195473
0
20000
40000
60000
80000
100000
120000
140000
160000
180000
200000
1947
1950
1955
-‐56 (End
of 1
st Plan)
1960
-‐61 (End
of 2
nd Plan)
1965
-‐66 (End
of 3
rd Plan)
1968
-‐69 (End
of 3
Ann
ual P
lans)
1973
-‐74 (End
of 4
th Plan)
1978
-‐79 (End
of 5
th Plan)
1979
-‐80 (End
of A
nnua
l Plan)
1984
-‐85 (End
of 6
th Plan)
1989
-‐90 (End
of 7
th Plan)
1991
-‐92 (End
of 2
Ann
ual P
lans)
1996
-‐97 (End
of 8
th Plan)
2001
-‐02 (End
of 9
th Plan)
2006
-‐07 (End
of 1
0th Plan
)
2011
-‐12 (End
of 1
1th Plan
)
2012
-‐13 (Is
t yea
r of 1
2th Plan
)
2013
-‐14 (IInd
yea
r of 1
2th Plan
)
2014
-‐15 (IIIrd
yea
r of 1
2th Plan
)
2015
-‐16 (IV
th yea
r of 1
2th Plan
)
2016
-‐17 (End
of 1
2th Plan
)@
GWh
Plan wise Growth of Electricity ConsumpJon in India Agriculture Sector
Chart : 23
Plan/Year @ EsJmated
Year 1947-‐50 1950-‐60 1960-‐70 1970-‐80 1980-‐90 1990-‐2000 2000-‐10 2010-‐17 % Growth 9.03 66.96 71.06 13.55 12.60 7.52 2.05 7.81

40 41
219 249 435 630 905 1439 2292 3445 3316 4765
7474 9394 12642
21551 23411
41252 40256
47418 49290
62976
69269
0
10000
20000
30000
40000
50000
60000
70000
1947
1950
1955
-‐56 (End
of 1
st Plan)
1960
-‐61 (End
of 2
nd Plan)
1965
-‐66 (End
of 3
rd Plan)
1968
-‐69 (End
of 3
Ann
ual P
lans)
1973
-‐74 (End
of 4
th Plan)
1978
-‐79 (End
of 5
th Plan)
1979
-‐80 (End
of A
nnua
l Plan)
1984
-‐85 (End
of 6
th Plan)
1989
-‐90 (End
of 7
th Plan)
1991
-‐92 (End
of 2
Ann
ual P
lans)
1996
-‐97 (End
of 8
th Plan)
2001
-‐02 (End
of 9
th Plan)
2006
-‐07 (End
of 1
0th Plan
)
2011
-‐12 (End
of 1
1th Plan
)
2012
-‐13 (Is
t yea
r of 1
2th Plan
)
2013
-‐14 (IInd
yea
r of 1
2th Plan
)
2014
-‐15 (IIIrd
yea
r of 1
2th Plan
)
2015
-‐16 (IV
th yea
r of 1
2th Plan
)
2016
-‐17 (End
of 1
2th Plan
)@
GWh
Plan/Year
Plan wise Growth of Electricity ConsumpLon in India Miscellaneous Sector
Chart : 24
@ EsLmated
40 41
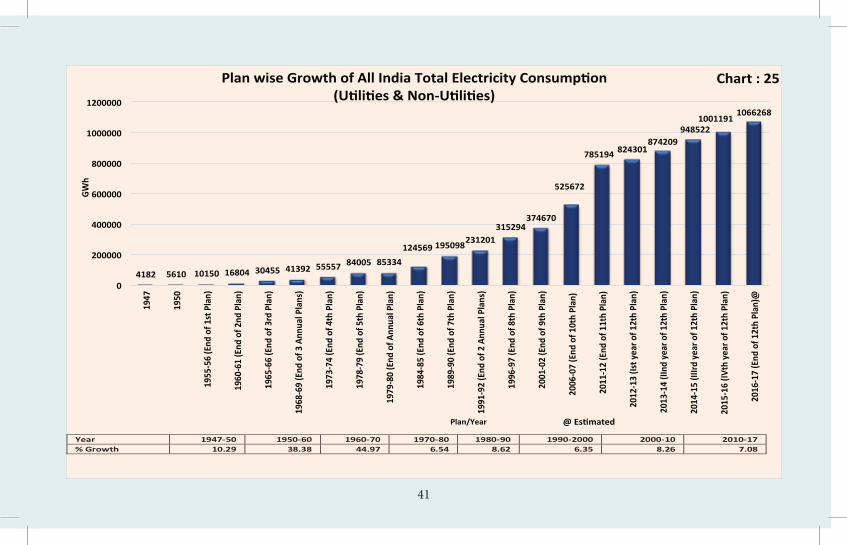
4182 5610 10150 16804 30455 41392 55557 84005 85334
124569 195098 231201
315294 374670
525672
785194 824301 874209
948522 1001191
1066268
0
200000
400000
600000
800000
1000000
1200000
1947
1950
1955-‐56 (End of 1st Plan)
1960-‐61 (End of 2nd Plan)
1965-‐66 (End of 3rd Plan)
1968-‐69 (End of 3 Annual Plans)
1973-‐74 (End of 4th Plan)
1978-‐79 (End of 5th Plan)
1979-‐80 (End of Annual Plan)
1984-‐85 (End of 6th Plan)
1989-‐90 (End of 7th Plan)
1991-‐92 (End of 2 Annual Plans)
1996-‐97 (End of 8th Plan)
2001-‐02 (End of 9th Plan)
2006-‐07 (End of 10th Plan)
2011-‐12 (End of 11th Plan)
2012-‐13 (Ist year of 12th Plan)
2013-‐14 (IInd year of 12th Plan)
2014-‐15 (IIIrd year of 12th Plan)
2015-‐16 (IVth year of 12th Plan)
2016-‐17 (End of 12th Plan)@
GWh
Plan/Year
Plan wise Growth of All India Total Electricity ConsumpMon (UMliMes & Non-‐UMliMes)
Chart : 25
@ EsMmated
Year 1947-‐50 1950-‐60 1960-‐70 1970-‐80 1980-‐90 1990-‐2000 2000-‐10 2010-‐17 % Growth 10.29 38.38 44.97 6.54 8.62 6.35 8.26 7.08

42 43
2001 2002 2003 2004 2005 2006 2007 2008 2009 2010 2011 2012 2013 2014 2015 2016 2017 Domes1c 75629 79694 83355 89736 95659 100090 111002 120918 130056 144246 156016 171104 183700 199842 217405 238876 259311
Commercial 22545 24140 25437 28201 31381 35965 40220 46685 53543 59297 68719 65381 72794 74247 78391 86037 98333
Industrial 159306 159507 168821 181970 199449 214121 241216 265407 279656 290255 301256 352291 365989 384418 418346 423523 426665
Agriculture 84729 81673 84486 87089 88555 90292 99023 104182 107776 119320 123389 140960 147462 152744 168913 173185 195473
Trac1on 8213 8106 8797 9210 9495 9944 10800 11108 11808 12407 13086 14206 14100 15540 16177 16594 17217
75629 79694 83355 89736 95659 100090 111002 120918
130056 144246
156016 171104
183700 199842
217405 238876
259311
22545 24140 25437 28201 31381 35965 40220 46685 53543 59297 68719 65381 72794 74247 78391 86037 98333
159306 159507 168821 181970
199449 214121
241216 265407
279656 290255
301256
352291 365989
384418
418346 423523 426665
84729 81673 84486 87089 88555 90292
99023 104182 107776 119320 123389
140960 147462 152744
168913 173185 195473
8213 8106 8797 9210 9495 9944 10800 11108 11808 12407 13086 14206 14100 15540 16177 16594 17217
0
50000
100000
150000
200000
250000
300000
350000
400000
450000
Trend of Category wise Energy Consump1on 2000-‐01 to 2016-‐17
Chart : 25A

42 43
Domes&c 259311 GWh
24.32%
Commercial 98333 GWh
9.22%
Industrial 426665 GWh
40.01%
Trac&on 17217 GWh
1.61% Agriculture
195473 GWh 18.33%
Misc. 69269 GWh
6.50%
All India Electricity Consump&on Sector wise -‐ End of Vth Year of 12th Plan (U&li&es & Non-‐U&li&es)
(31.03.2017)@
Domes&c Commercial Industrial Trac&on Agriculture Misc.
TOTAL = 1066268 GWh
Pie Chart : 26

44 45
Domes&c 238876 GWh
23.86%
Commercial 86037 GWh
8.59%
Industrial 423523 GWh
42.30%
Trac&on 16594 GWh
1.66% Agriculture
173185 GWh 17.30%
Misc. 62976 GWh
6.29%
All India Electricity Consump&on Sector wise -‐ End of IVth Year of 12th Plan (U&li&es & Non-‐U&li&es)
(31.03.2016)
Domes&c Commercial Industrial Trac&on Agriculture Misc.
TOTAL = 1001191 GWh
Pie Chart : 26A

44 45
Australia Canada France German
y Italy Japan Korea United Kingdom
United States
South Africa Brazil
People's Republic of China
Russian FederaC
on
European Union -‐28
India
Non-‐specified (other) 0 28832 1667 0 0 20699 0 0 164571 3266 0 390818 0 8923 49290
Agriculture/forestry 2461 9390 8767 0 5373 2767 13556 3728 27671 5562 26735 101339 16180 46014 168913
Commercial and public services 63310 104305 131610 142868 88489 340634 148741 93168 1349929 27455 133266 285587 151774 806700 78391
ResidenCal 58031 161568 149426 129600 64255 273938 62928 108881 1416977 37777 132049 717610 145919 785157 217405
Transport 4770 4925 12473 11594 10463 17826 2003 4260 7605 3773 2794 59706 90256 62077 16177
Industry 79483 180219 111382 228773 112918 295623 259606 93526 821040 120260 205932 3160638 333701 997438 418346
0
600000
1200000
1800000
2400000
3000000
3600000
4200000
4800000
GWh
Category wise Electricity ConsumpCon in various Countries -‐ 2014
Chart : 27
Source: -‐ InternaConal Energy Agency (IEA) except India

46 47
Australia Canada France German
y Italy Japan Korea United Kingdom
United States World South
Africa Brazil
People's Republic of China
Russian FederaD
on
European Union -‐28
India
Non-‐specified (other) 0.00 5.89 0.40 0.00 0.00 2.18 0.00 0.00 4.34 4.07 1.65 0.00 8.29 0.00 0.33 5.20
Agriculture/forestry 1.18 1.92 2.11 0.00 1.91 0.29 2.78 1.23 0.73 2.84 2.81 5.34 2.15 2.19 1.70 17.81
Commercial and public services 30.43 21.32 31.69 27.86 31.44 35.80 30.55 30.69 35.64 22.06 13.86 26.61 6.06 20.57 29.81 8.26
ResidenDal 27.89 33.02 35.98 25.27 22.83 28.79 12.93 35.87 37.41 26.99 19.07 26.37 15.22 19.78 29.01 22.92
Transport 2.29 1.01 3.00 2.26 3.72 1.87 0.41 1.40 0.20 1.53 1.90 0.56 1.27 12.23 2.29 1.71
Industry 38.20 36.84 26.82 44.61 40.11 31.07 53.33 30.81 21.68 42.52 60.71 41.12 67.02 45.23 36.86 44.11
0.00
10.00
20.00
30.00
40.00
50.00
60.00
70.00
80.00
90.00
100.00 Percent (%)
Category wise % Shares in Electricity ConsumpDon in various Countries -‐ 2014 Chart : 28
Source: -‐ InternaDonal Energy Agency (IEA) except India

46 47
Table 5Per Capita Electricity Consumption - 2013 & 2014 and
T & D Losses - 2012 & 2013 of various Countries
MWSl.
No.Per Capita Consumption (kWh) Sl.
No.T & D Losses (%)
Name of the Country 2013 2014 Name of the Country 2012 20131 Canada 15520 15544 1 Korea 3.47 3.472 USA 12987 12962 2 Japan 4.79 4.873 Australia 10067 10002 3 Germany 4.46 4.514 Japan 7836 7829 4 Italy 6.61 6.875 France 7382 6955 5 Australia 5.68 6.696 Germany 7022 7035 6 South Africa 10.19 9.887 Korea 10428 10564 7 France 7.99 7.868 UK 5409 5131 8 China 6.56 6.529 Russia 6562 6603 9 USA 6.73 6.32
10 Italy 5124 5002 10 Canada 8.19 10.4011 South Africa 4328 4240 11 UK 8.26 7.8012 Brazil 2583 2578 12 Russia 12.59 12.5713 China 3766 3927 13 Brazil 16.63 16.1114 India* 957 1010 14 India 23.65 23.0415 World 3026 3030 15 World 8.89 8.91
Note :- Basic data obtained from IEA Website (except) India.* Per Capita Consumption= (Gross Electrical Energy Availability/Midyear Population).

48 49
14.88
15.20
13.80
15.20
14.60 17
.00
20.50
20.00
20.40
21.50 23.30
22.90
22.80 24.50
33.98
32.54
32.53
31.25
30.42
28.65
27.20
25.47
25.39
23.97
23.65
23.04
22.84
22.77
21.81
0
5
10
15
20
25
30
35
40 19
47
1950
1955
-‐56
1960
-‐61
1965
-‐66
1968
-‐69
1973
-‐74
1978
-‐79
1979
-‐80
1984
-‐85
1989
-‐90
1991
-‐92
1996
-‐97
2000
-‐01
2001
-‐02
2002
-‐03
2003
-‐04
2004
-‐05
2005
-‐06
2006
-‐07
2007
-‐08
2008
-‐09
2009
-‐10
2010
-‐11
2011
-‐12
2012
-‐13
2013
-‐14
2014
-‐15
2015
-‐16
% Lo
sses
Years
All India Transmission and DistribuBon Losses (%)
Chart : 29

48 49
Korea Japan Germany Italy Australi
a South Africa France China USA Canada UK Russia Brazil India World
2012 3.47 4.79 4.46 6.61 5.68 10.19 7.99 6.56 6.73 8.19 8.26 12.59 16.63 23.65 8.89
2013 3.47 4.87 4.51 6.87 6.69 9.88 7.86 6.52 6.32 10.40 7.80 12.57 16.11 23.04 8.91
0.00
5.00
10.00
15.00
20.00
25.00
% Lo
ss
T & D Losses of Various Countries in 2012 & 2013 (%)
2012 2013
Chart : 30
Source: -‐ InternaUonal Energy Agency (IEA) (except India)
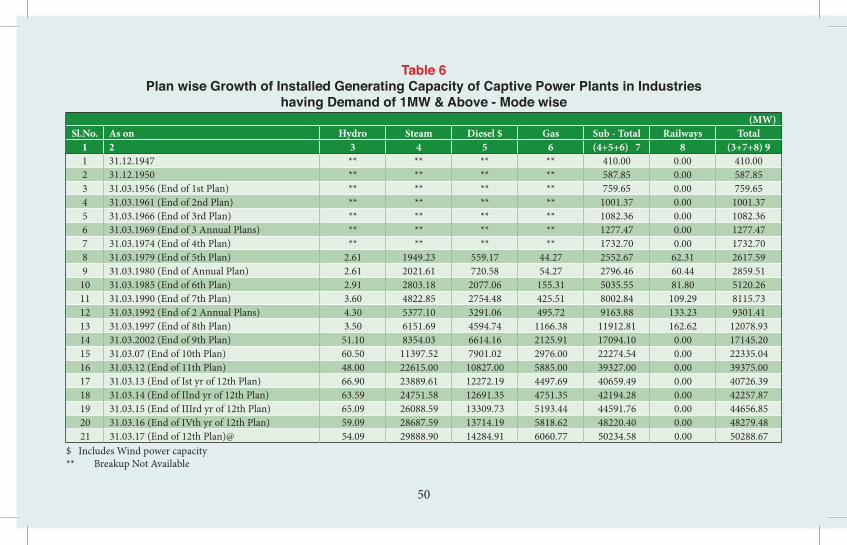
50 51
Table 6Plan wise Growth of Installed Generating Capacity of Captive Power Plants in Industries
having Demand of 1MW & Above - Mode wise(MW)
Sl.No. As on Hydro Steam Diesel $ Gas Sub - Total Railways Total1 2 3 4 5 6 (4+5+6) 7 8 (3+7+8) 91 31.12.1947 ** ** ** ** 410.00 0.00 410.002 31.12.1950 ** ** ** ** 587.85 0.00 587.853 31.03.1956 (End of 1st Plan) ** ** ** ** 759.65 0.00 759.654 31.03.1961 (End of 2nd Plan) ** ** ** ** 1001.37 0.00 1001.375 31.03.1966 (End of 3rd Plan) ** ** ** ** 1082.36 0.00 1082.366 31.03.1969 (End of 3 Annual Plans) ** ** ** ** 1277.47 0.00 1277.477 31.03.1974 (End of 4th Plan) ** ** ** ** 1732.70 0.00 1732.708 31.03.1979 (End of 5th Plan) 2.61 1949.23 559.17 44.27 2552.67 62.31 2617.599 31.03.1980 (End of Annual Plan) 2.61 2021.61 720.58 54.27 2796.46 60.44 2859.51
10 31.03.1985 (End of 6th Plan) 2.91 2803.18 2077.06 155.31 5035.55 81.80 5120.2611 31.03.1990 (End of 7th Plan) 3.60 4822.85 2754.48 425.51 8002.84 109.29 8115.7312 31.03.1992 (End of 2 Annual Plans) 4.30 5377.10 3291.06 495.72 9163.88 133.23 9301.4113 31.03.1997 (End of 8th Plan) 3.50 6151.69 4594.74 1166.38 11912.81 162.62 12078.9314 31.03.2002 (End of 9th Plan) 51.10 8354.03 6614.16 2125.91 17094.10 0.00 17145.2015 31.03.07 (End of 10th Plan) 60.50 11397.52 7901.02 2976.00 22274.54 0.00 22335.0416 31.03.12 (End of 11th Plan) 48.00 22615.00 10827.00 5885.00 39327.00 0.00 39375.0017 31.03.13 (End of Ist yr of 12th Plan) 66.90 23889.61 12272.19 4497.69 40659.49 0.00 40726.3918 31.03.14 (End of IInd yr of 12th Plan) 63.59 24751.58 12691.35 4751.35 42194.28 0.00 42257.8719 31.03.15 (End of IIIrd yr of 12th Plan) 65.09 26088.59 13309.73 5193.44 44591.76 0.00 44656.8520 31.03.16 (End of IVth yr of 12th Plan) 59.09 28687.59 13714.19 5818.62 48220.40 0.00 48279.4821 31.03.17 (End of 12th Plan)@ 54.09 29888.90 14284.91 6060.77 50234.58 0.00 50288.67
$ Includes Wind power capacity** Breakup Not Available

50 51
Hydro 54.09 MW
0.11%
Steam 29888.90 MW
59.43%
Diesel $ 14284.91 MW
28.41%
Gas 6060.77 MW
12.05%
Installed GeneraBng Capacity of CapBve Power Plants in Industries having Demand of 1MW & Above -‐ Mode wise -‐ End of Vth Year of 12th Plan
(31.03.2017)@
Hydro Steam Diesel $ Gas @-‐EsBmated
Pie Chart : 31
TOTAL = 50228.67 MW
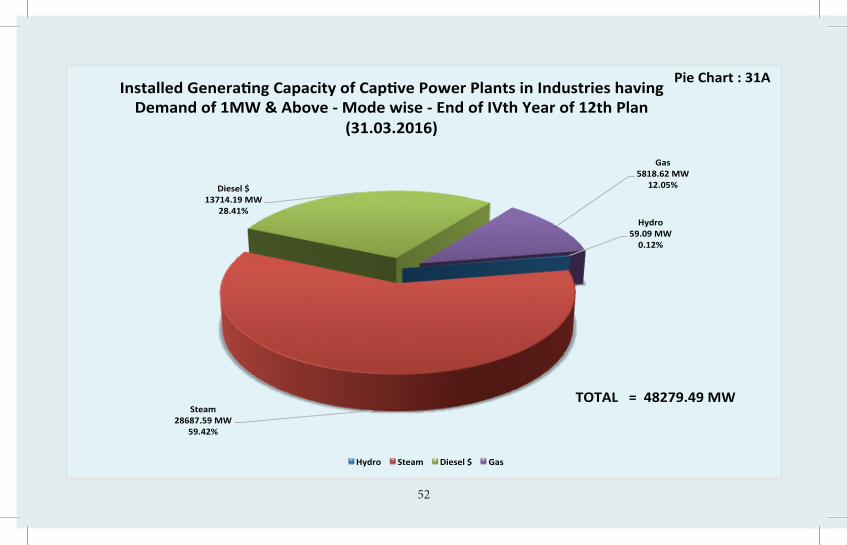
52 53
Hydro 59.09 MW
0.12%
Steam 28687.59 MW
59.42%
Diesel $ 13714.19 MW
28.41%
Gas 5818.62 MW
12.05%
Installed GeneraBng Capacity of CapBve Power Plants in Industries having Demand of 1MW & Above -‐ Mode wise -‐ End of IVth Year of 12th Plan
(31.03.2016)
Hydro Steam Diesel $ Gas
TOTAL = 48279.49 MW
Pie Chart : 31A

52 53
410 588 760 1001 1082 1277 1733 2618 2860 5120
8116 9301 12079
17145
22335
39375 40726 42258
44657 48279
50289
0 2000 4000 6000 8000 10000 12000 14000 16000 18000 20000 22000 24000 26000 28000 30000 32000 34000 36000 38000 40000 42000 44000 46000 48000 50000 52000 54000
31.12.1947
31.12.1950
31.03.1956 (End
of 1st Plan)
31.03.1961 (End
of 2nd
Plan)
31.03.1966 (End
of 3rd Plan)
31.03.1969 (End
of 3 Ann
ual Plans)
31.03.1974 (End
of 4th Plan)
31.03.1979 (End
of 5th Plan)
31.03.1980 (End
of A
nnual Plan)
31.03.1985 (End
of 6th Plan)
31.03.1990 (End
of 7th Plan)
31.03.1992 (End
of 2 Ann
ual Plans)
31.03.1997 (End
of 8th Plan)
31.03.2002 (End
of 9th Plan)
31.03.07 (End
of 10th Plan)
31.03.12 (End
of 11th Plan)
31.03.13 (End
of Ist yr o
f 12th Plan)
31.03.14 (End
of IInd yr of 12th Plan)
31.03.15 (End
of IIIrd yr of 12th Plan)
31.03.16 (End
of IVth yr of 12th Plan)
31.03.17 (End
of 12th Plan)@
MW
Plan/Year
Plan wise Growth of All India Installed GeneraIng Capacity of CapIve Power Plants in Industries having Demand of 1MW & Above
Chart : 32
@ EsImated

54 55
Table 7Plan wise Growth of Energy Generated by Captive Power Plants in Industries
having Demand of 1MW & Above - Mode wise(GWh)
Sl.No. During financial year ending with Hydro Steam Diesel $ Gas Sub - Total Railways Total1 2 3 4 5 6 (4+5+6) 7 8 (3+7+8) 91 1947 ** ** ** ** 856.91 ** 856.912 1950 ** ** ** ** 1467.81 0.00 1467.813 1955-56 (End of 1st Plan) ** ** ** ** 2184.82 0.00 2184.824 1960-61 (End of 2nd Plan) ** ** ** ** 3186.10 0.00 3186.105 1965-66 (End of 3rd Plan) ** ** ** ** 3733.19 0.00 3733.196 1968-69 (End of 3 Annual Plans) ** ** ** ** 4136.06 0.00 4136.067 1973-74 (End of 4th Plan) ** ** ** ** 6067.47 0.00 6067.478 1978-79 (End of 5th Plan) 13.22 7211.30 299.13 48.97 7559.40 34.47 7607.099 1979-80 (End of Annual Plan) 15.06 7225.60 825.71 90.67 8141.98 35.67 8192.71
10 1984-85 (End of 6th Plan) 18.29 9966.55 2001.18 317.03 12284.76 42.80 12345.8511 1989-90 (End of 7th Plan) 15.83 19110.46 2757.27 1313.29 23181.02 29.07 23225.9212 1991-92 (End of 2 Annual Plans) 17.57 23409.35 3247.81 1905.24 28562.40 22.52 28602.4913 1996-97 (End of 8th Plan) 28.84 29127.94 6619.01 5039.22 40786.17 25.07 40840.0814 2001-02 (End of 9th Plan) 116.59 41853.85 10875.19 8835.19 61564.23 0.00 61680.8215 2006-07 (End of 10th Plan) 217.81 56184.04 10190.74 15207.17 81581.95 0.00 81799.7616 2011-12 (End of 11th Plan) 131.28 104862.65 7422.48 21971.57 134256.70 0.00 134387.9817 2012-13 (Ist year of 12th Plan) 118.18 113166.95 9955.64 20768.88 143891.47 0.00 144009.6518 2013-14 (IInd year of 12th Plan) 129.06 118178.44 10769.08 19911.64 148859.16 0.00 148988.2219 2014-15 (IIIrd year of 12th Plan) 144.69 128401.06 12376.00 21135.25 161912.31 0.00 162057.0020 2015-16 (IVth year of 12th Plan) 110.09 136720.54 10458.24 21083.29 168262.07 0.00 168372.1621 2016-17 (End of 12th Plan)@ 128.80 159966.74 12236.43 24668.03 196871.20 0.00 197000.00
$ Includes RES capacity** Breakup Not Available @ Estimated

54 55
Hydro 128.80 GWh
0.07%
Steam 159966.74 GWh
81.20%
Diesel $ 12236.43 GWh
6.21%
Gas 24668.03 GWh
12.52%
All India Electrical Energy Generated by CapIve Power Plants in Industries having Demand of 1MW and Above -‐ Mode wise
End of Vth Year of 12th Plan (31.03.2017)@
Hydro Steam Diesel $ Gas
Total = 197000 GWh
Pie Chart : 33
@ EsImated

56 57
Hydro 110.09 GWh
0.07%
Steam 136720.54 GWh
81.20%
Diesel $ 10458.24 GWh
6.21%
Gas 21083.29 GWh
12.52%
All India Electrical Energy Generated by CapIve Power Plants in Industries having Demand of 1MW and Above -‐ Mode wise
End of IVth Year of 12th Plan (31.03.2016)
Hydro Steam Diesel $ Gas
Total = 168372 GWh
Pie Chart : 33A
@ EsImated

56 57
857 1468 2185 3186 3733 4136 6067 7607 8193 12346 23226 28602
40840
61681
81800
134388 144010 148988
162057 168372
197000
0
50000
100000
150000
200000
250000
1947
1950
1955
-‐56 (End
of 1
st Plan)
1960
-‐61 (End
of 2
nd Plan)
1965
-‐66 (End
of 3
rd Plan)
1968
-‐69 (End
of 3
Ann
ual P
lans)
1973
-‐74 (End
of 4
th Plan)
1978
-‐79 (End
of 5
th Plan)
1979
-‐80 (End
of A
nnua
l Plan)
1984
-‐85 (End
of 6
th Plan)
1989
-‐90 (End
of 7
th Plan)
1991
-‐92 (End
of 2
Ann
ual P
lans)
1996
-‐97 (End
of 8
th Plan)
2001
-‐02 (End
of 9
th Plan)
2006
-‐07 (End
of 1
0th Plan
)
2011
-‐12 (End
of 1
1th Plan
)
2012
-‐13 (Is
t yea
r of 1
2th Plan
)
2013
-‐14 (IInd
yea
r of 1
2th Plan
)
2014
-‐15 (IIIrd
yea
r of 1
2th Plan
)
2015
-‐16 (IV
th yea
r of 1
2th Plan
)
2016
-‐17 (End
of 1
2th Plan
)@
GWh
Plan/Year
Plan wise Growth of Energy Generated by CapLve Power Plants in Industries having Demand of 1MW & above
Chart : 34
@ EsLmated

58 59
4880
3546
.15
2940
1136
6.15
800
300 205
1305
500
500
0
2000
4000
6000
8000
10000
12000
14000
CENTRAL STATE PRIVATE TOTAL
Capacity Addi?on Programme during 2017-‐18
THERMAL HYDRO NUCLEAR
MW
Chart : 35
Total = 6180 MW
Total = 3846.15 MW
Total =3145 MW
Total = 13171.15 MW

58 59
2006-‐07 2007-‐08 2008-‐09 2009-‐10 2011-‐12 2012-‐13 2013-‐14 2014-‐15 2015-‐16 2016-‐17 Forecast 104867 113059 121891 121891 152746 135453 156208 169491 183902 161834
Actual 100715 107791 109809 109809 130006 143967 135918 148166 153366 159542
0
20000
40000
60000
80000
100000
120000
140000
160000
180000
200000
220000
PEAK LO
AD (M
W)
Years
Forecast of All India Peak Electricity Demand (ULliLes)
As Per 18th & 19th Electric Power Survey in MW
Forecast Actual
Chart : 36

60 61
2006-‐07 2007-‐08 2008-‐09 2009-‐10 2011-‐12 2012-‐13 2013-‐14 2014-‐15 2015-‐16 2016-‐17 Forecast 697961 744515 794561 794561 968659 1007600 1084610 1167731 1257589 1160429
Actual 690587 737052 774324 774324 937199 995500 1002257 1068943 1114235 1142928
0
220000
440000
660000
880000
1100000
1320000
1540000
Electrica
l Energy Requ
irement (GW
h)
Years
Forecast of All India Energy Requirement (UJliJes)
As Per 18th & 19th Electric Power Survey in GWh
Forecast Actual
Chart : 37

60 61
Nagpur Indore Kanpur Lucknow Jaipur Surat Ahmedabad Pune Bengaluru Chennai Kolkata Hyderaba
d Greater Mumbai
2011-‐12 315 391 580 750 771 1309 1320 1173 2090 2291 2577 2134 3605
2016-‐17 481 621 765 1119 1329 1802 1869 2091 2805 3370 3512 3375 4985
2021-‐22 812 950 976 1594 2103 2556 2827 3544 3717 4334 4674 5039 7225
0
1000
2000
3000
4000
5000
6000
7000
8000
18th Electric Power Survey of India (Volume -‐ II) Annual Electric Peak Load (in MW) of Mega CiTes at Power StaTon Bus Bar
(For the Year 2011-‐12, 2016-‐17 & 2021-‐22)
Chart :37A

62 63
Nagpur Indore Kanpur Lucknow Jaipur Surat Ahmedabad Pune Bengaluru Chennai Kolkata Hyderabad
Greater Mumbai
2011-‐12 2311 2007 3046 4840 3905 8029 7862 7760 12300 15273 15528 13528 22107
2016-‐17 3193 3325 4023 6796 6743 11053 11133 12819 16260 21434 20006 20652 30568
2021-‐22 4820 5292 5131 9074 10683 15225 16097 21111 21219 26236 25588 29730 43039
0
5000
10000
15000
20000
25000
30000
35000
40000
45000
18th Electric Power Survey of India (Volume -‐ II) Electrical Energy Requirement (in MU) of Mega CiVes
(For the Year 2011-‐12, 2016-‐17 & 2021-‐22)
Chart : 37B

62 63
Nagpur Indore Kanpur Lucknow Jaipur Surat Ahmedabad Pune Bengaluru Chennai Kolkata Hyderaba
d Greater Mumbai
2011-‐12 1829 1528 2315 3679 3484 7325 7117 7000 10917 13034 13483 11127 19472
2016-‐17 2655 2780 3259 5504 6023 10099 10102 11625 14465 18537 17470 17967 27346
2021-‐22 4200 4691 4361 7803 9553 13940 14665 19241 18972 23346 22471 26757 39023
0
5000
10000
15000
20000
25000
30000
35000
40000
18th Electric Power Survey of India (Volume -‐ II) Electrical Energy ConsumpTon (in MU) of Mega CiTes
(For the Year 2011-‐12, 2016-‐17 & 2021-‐22)
Chart : 37C

64 65
Table 8All India Power Supply Position Energy wise & Peak wise (Utilities)
1984-85 to 2016-17Year Energy Peak Demand
Requirement Availability Deficit Deficit Demand Availability Deficit Deficit(GWh) (GWh) (GWh) (%) (MW) (MW) (MW) (%)
1984-85 155432 145013 10419 6.70 25810 22800 3010 11.661985-86 170746 157262 13484 7.90 28090 24215 3875 13.791986-87 192356 174276 18080 9.40 30850 26924 3926 12.731987-88 210993 187976 23017 10.91 31990 28242 3748 11.721988-89 223194 205909 17285 7.74 36245 31713 4532 12.501989-90 247762 228151 19611 7.92 40385 33658 6727 16.661990-91 267632 246560 21072 7.87 44005 37171 6834 15.531991-92 288974 266432 22542 7.80 48055 39027 9028 18.791992-93 305266 279824 25442 8.33 52805 41984 10821 20.491993-94 323252 299494 23758 7.35 54875 44830 10045 18.311994-95 352260 327281 24979 7.09 57530 48066 9464 16.451995-96 389721 354045 35676 9.15 60981 49836 11145 18.281996-97 413490 365900 47590 11.51 63853 52376 11477 17.971997-98 424505 390330 34175 8.05 65435 58042 7393 11.301998-99 446584 420235 26349 5.90 67905 58445 9460 13.931999-00 480430 450594 29836 6.21 72669 63691 8978 12.35
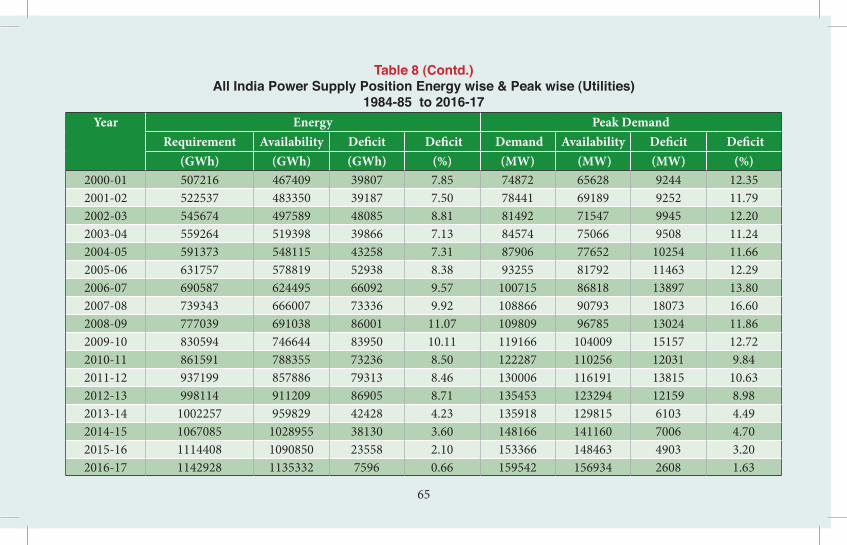
64 65
Table 8 (Contd.)All India Power Supply Position Energy wise & Peak wise (Utilities)
1984-85 to 2016-17Year Energy Peak Demand
Requirement Availability Deficit Deficit Demand Availability Deficit Deficit(GWh) (GWh) (GWh) (%) (MW) (MW) (MW) (%)
2000-01 507216 467409 39807 7.85 74872 65628 9244 12.352001-02 522537 483350 39187 7.50 78441 69189 9252 11.792002-03 545674 497589 48085 8.81 81492 71547 9945 12.202003-04 559264 519398 39866 7.13 84574 75066 9508 11.242004-05 591373 548115 43258 7.31 87906 77652 10254 11.662005-06 631757 578819 52938 8.38 93255 81792 11463 12.292006-07 690587 624495 66092 9.57 100715 86818 13897 13.802007-08 739343 666007 73336 9.92 108866 90793 18073 16.602008-09 777039 691038 86001 11.07 109809 96785 13024 11.862009-10 830594 746644 83950 10.11 119166 104009 15157 12.722010-11 861591 788355 73236 8.50 122287 110256 12031 9.842011-12 937199 857886 79313 8.46 130006 116191 13815 10.632012-13 998114 911209 86905 8.71 135453 123294 12159 8.982013-14 1002257 959829 42428 4.23 135918 129815 6103 4.492014-15 1067085 1028955 38130 3.60 148166 141160 7006 4.702015-16 1114408 1090850 23558 2.10 153366 148463 4903 3.202016-17 1142928 1135332 7596 0.66 159542 156934 2608 1.63

66 67
Table 8ARegion wise Summary of EER & APEL
For the Year 2017-18 and 2021-22As Per 19th EPS (Volume-I)
Region/Year EER (MU) APEL(MW)2017-18 2021-22 2017-18 2021-22
Northern 376550 468196 58899 73770Western 377343 481501 54673 71020Southern 330336 420753 48635 62975Eastern 138862 171228 22849 28046North East 17261 23809 3252 4499A & N Island 356 475 73 97Lakshdweep 54 62 10 11All India Total 1240760 1566023 176897 225751
NOTE : EER : - Electrical Energy Reuirement APEL : - Annual Peak Electric Load EPS :- Electric Power Survey

66 67
Table 8BCategory wise Forecast of Electrical Energy Consumption
For the Year 2017-18 and 2021-22As Per 19th EPS (Volume-I)
Category Year Year 2017-18 2021-22
Domestic 283253 386790Commercial 98333 128888Irrigation 213983 276277Industries 300482 386450Others 98331 122081Total 994382 1300486

68 69
Table 8CForecast of Electrical Energy Consumption (in MU) of NCR
For the Year 2017-18 to 2021-22As Per 18th EPS (Volume-III)
Consumption Category 2017-18 2021-22Domestic 28858 39278Commercial & Misc. 14022 18588Public lighting 745 937Public Water Works 2080 2687Irrigation 8263 9781Industries LT 6820 9101Industries HT 20568 28189Railway traction 799 993Bulk Supply 2799 3830Total (Energy Consumption) 84952 113384

68 69
Table 8DForecast of Electrical Energy Requirement (in MU) of NCR
For the Year 2017-18 and 2021-22As Per 18th EPS (Volume-III)
NCR Sub Region 2017-18 2021-22Delhi 40176 52930Haryana 31099 37864Rajasthan 8101 10868Uttar Pradesh 22003 30192NCR - Total 101379 131854

70 71
0
5
10
15
20
25
1984
-‐85
1985
-‐86
1986
-‐87
1987
-‐88
1988
-‐89
1989
-‐90
1990
-‐91
1991
-‐92
1992
-‐93
1993
-‐94
1994
-‐95
1995
-‐96
1996
-‐97
1997
-‐98
1998
-‐99
1999
-‐00
2000
-‐01
2001
-‐02
2002
-‐03
2003
-‐04
2004
-‐05
2005
-‐06
2010
-‐11
2011
-‐12
2012
-‐13
2013
-‐14
2014
-‐15
2015
-‐16
2016
-‐17
Year
Defic
it (%
) -‐-‐>
Years
All India Peak and Energy Deficit (UFliFes)
1984-‐85 to 2016-‐17
Energy Deficit% Peak Deficit%
Chart : 38

70 71
Domes&c Commercial & Misc.
Public ligh&ng
Public Water Works Irriga&on Industries LT Industries HT Railway
trac&on Bulk Supply
2017-‐18 28858 14022 745 2080 8263 6820 20568 799 2799
2021-‐22 39278 18588 937 2687 9781 9101 28189 993 3830
0
5000
10000
15000
20000
25000
30000
35000
40000
Forecast of Electrical Energy Consump&on (in MU) of NCR For the Year 2017-‐18 and 2021-‐22
Chart :39

72 73
Delhi Haryana Rajasthan U1ar Pradesh 2017-‐18 40176 31099 8101 22003
2021-‐22 52930 37864 10868 30192
0
10000
20000
30000
40000
50000
60000
Forecast of Electrical Energy Requirement (in MU) of NCR For the Year 2017-‐18 and 2021-‐22
Chart : 40

72 73
SHOWING
STATEWISE
Including
allocated
share
sinJointandC
entralSector
AllIndiaC
apacity:3,26,832.53M
W
(Ason31.03.2017,FiguresinMW
)
[Mapnottoscale]
MAP
OFINDIA
Andaman
& Nicoba
r
(0.71)
(51.86)
(7823.00)
(11056.16)(3892.72)
(3273.58)
(14162.15)
(19776.32)
(23662.41)
(3313.45)
(176.92)
(540.56)
(181.56)(30
716.47)
(19618.28)
(12059.84)
(41409.84)
(241.82)
(11501.28)
(21316.59)
(4998.94)
(29112.27)
(366.98)
(100.00)
(3607.54)
(2237.06)
(10382.78)
(7721.24)
(8538.27)
(758.14)
(1599.65)(27
3.84)
(518.32)
(727.33)
(233.38)
(154.87)
(136.92)
Andhra
Prades
h(22298.30)
HYDRO
THERMA
LNUCLEAR
RES
TOTAL
914.22
6461.92
915.03
0.00
8291.17
CENTRALUNALLOCATED

740.00
229.85
9.00
2.97
241.82
SHOWING
STATEWISE/MODEWISE
Including
allocatedsha
resinJointandC
entral
Sector
AllIndiaC
apacity:3,26,832.53MW
(Ason31.03.2017,Fig
uresinMW
)
[Mapnotbescale]
MAPOF
INDIA
Jammu
&Kash
mir
Kerala
NLC
Bihar
DVC
Jharkhand We
stBeng
al
Odisha
Arunac
halPra
desh
Assam
Sikkim
Mizoram
Nagalan
d
Manipu
r
Tripura
Laksha
dweep
Megha
laya
TamilNadu
Puduch
erry
Uttarakhan
d UttarPr
adesh
Chandig
arh
Goa
Daman&D
iuGujarat
Madhy
aPradesh
Chhattis
hgarh
Maharash
tra
Dadra&
NagarH
aveli
Karnataka
AndhraPra
desh
Himach
al
Punjab
Delhi
Haryan
aRaj
asthan
Sri Lanka
Andaman
& Nicoba
rALLINDIA
HYDRO
THERMA
LNUCLEAR
RES
TOTAL
44478.42
218329.88
6780.00
57244.23
326832.53
723.09
6940.81
102.83
56.27
7839.00
1948.21
8755.72
109.94
251.30
2798.48
232.75
28.95
832.54
3892.72
2278.98
767.23
67.98
159.39
3273.58
0.00
164.10
7.00
10.46
181.56
772.00
22713.58
559.00
6671.89
30716.47
120.00
11458.98
48.00
432.86
12059.84
3223.66
12583.73
273.00
3537.89
19618.28
3781.65
9030.59
196.81
1153.10
14162.15
19776.32
6237.80
11050.81
1930.97
556.74
3231.03
17842.07
289.48
2299.83
23662.41
1815.69
950.71
31.24
515.81
3313.45
101.71
49.88
8.01
17.32
176.92
0.00
513.80
26.00
0.76
540.56
3331.84
29740.40
690.00
7647.60
41409.84
1747.93
14258.68
127.27
6164.42
22298.30
3599.80
9560.82
698.00
7457.97
21316.59 18
81.50
2416.72
362.00
338.72
4998.94
2203.20
14836.07
1448.00
10625.00
29112.27
0.00
100.00
0.00
0.00
100.00
0.00
280.90
86.00
0.08
366.98
0.00
40.05
0.00
11.81
51.86
0.00
0.00
0.00
0.71
0.71
34.19
61.16
0.00
41.57
136.92
53.37
70.33
0.00
31.17
154.87
88.93
138.97
0.00
5.48
233.38
62.38
643.85
0.00
21.10
727.33
347.19
140.09
0.00
31.04
518.32
97.45
71.52
0.00
104.87
273.84
431.23
1122.53
0.00
45.89
1599.65
619.00
87.03
0.00
52.11
758.14
2150.92
6192.90
0.00
194.45
8538.27
186.20
7535.04
0.00
0.00
7721.24
1396.00
424.64
10382.78
191.00
2018.74
0.00
27.32
2237.06
110.00
3205.33
0.00
292.22
3607.54
HYDRO
THERMA
LNUCLEAR
RES
TOTAL
914.22
6461.92
915.03
0.00
8291.17
CENTRALUNALLOCATED
Telanga
na
0.00
2306.60
7500.07
148.73
1545.88
11501.28
11056.16
8562.15