historical participation in rrs by ufr-type load resources
DESCRIPTION
Historical Participation in RRS by UFR-type Load Resources. Paul Wattles, Kenneth Ragsdale FAST Feb. 7, 2014. Background. These slides show the levels of participation in Responsive Reserve Service by Load Resources controlled by high-set Under Frequency Relays - PowerPoint PPT PresentationTRANSCRIPT

Historical Participation in RRS by UFR-type Load Resources
Paul Wattles, Kenneth Ragsdale
FAST
Feb. 7, 2014

2
Background
• These slides show the levels of participation in Responsive Reserve Service by Load Resources controlled by high-set Under Frequency Relays
• Covers calendar years 2011, 2012 and 2013• Some data is presented chronologically• Some is presented in descending order of participation
• Participation in RRS by UFR-type LRs is capped at 50% of the total RRS requirement– 1150 MW (50% of 2300) effective 2011 through March 31, 2012– 1400 MW (50% of 2800) effective April 1, 2012 through 2013
UFR-RRS data for FASTFeb. 7, 2014

3
2011 capacity on the table (descending order)
UFR-RRS data for FASTFeb. 7, 2014
0
200
400
600
800
1000
1200
1400
1600
1 744 1487 2230 2973 3716 4459 5202 5945 6688 7431 8174
MW
Hours
2011 LR-UFR Offers and Self-Arranged Amounts and Responsibilities
Maximum That Could be Procured Offered and Self-Arranged (on the table) Responsiibiity
Offer prices exceeded MCPC

4
2011 capacity on the table (chronological)
UFR-RRS data for FASTFeb. 7, 2014
0
200
400
600
800
1000
1200
1400
1600
1 744 1487 2230 2973 3716 4459 5202 5945 6688 7431 8174
MW
Hours
2011 LR-UFR Offers and Self-Arranged Amounts and Responsibilities
Maximum That Could be Procured chronological Offers and SA

5
2012 capacity on the table (descending order)
UFR-RRS data for FASTFeb. 7, 2014
0
200
400
600
800
1000
1200
1400
1600
1 744 1487 2230 2973 3716 4459 5202 5945 6688 7431 8174
MW
Hours
2012 LR-UFR Offers and Self-Arranged Amounts and Responsibilities
Maximum That Could Be Procured Offered and Self-Arranged (on the table) Responsiibiity
Offer prices exceeded MCPC

6
2012 capacity on the table (chronological)
UFR-RRS data for FASTFeb. 7, 2014
0
200
400
600
800
1000
1200
1400
1600
1 744 1487 2230 2973 3716 4459 5202 5945 6688 7431 8174
MW
Hours
2012 LR-UFR Offers and Self-Arranged Amounts and Responsibilities
Maximum That Could Be Procured Chronological Offers and SA

7
2013 capacity on the table (descending order)
UFR-RRS data for FASTFeb. 7, 2014
0
200
400
600
800
1000
1200
1400
1600
1800
1 744 1487 2230 2973 3716 4459 5202 5945 6688 7431 8174
MW
Hours
2013 LR-UFR Offers and Self-Arranged Amounts and Responsibilities
Maximum That Could Be Procured Offered and Self-Arranged (on the table) Responsiibiity
Offer prices exceeded MCPC

8
2013 capacity on the table (chronological)
UFR-RRS data for FASTFeb. 7, 2014
0
200
400
600
800
1000
1200
1400
1600
1800
1 744 1487 2230 2973 3716 4459 5202 5945 6688 7431 8174
MW
Hours
2013 LR-UFR Offers and Self-Arranged Amounts and Responsibilities
Maximum That Could Be Procured chronological Offers and SA
9
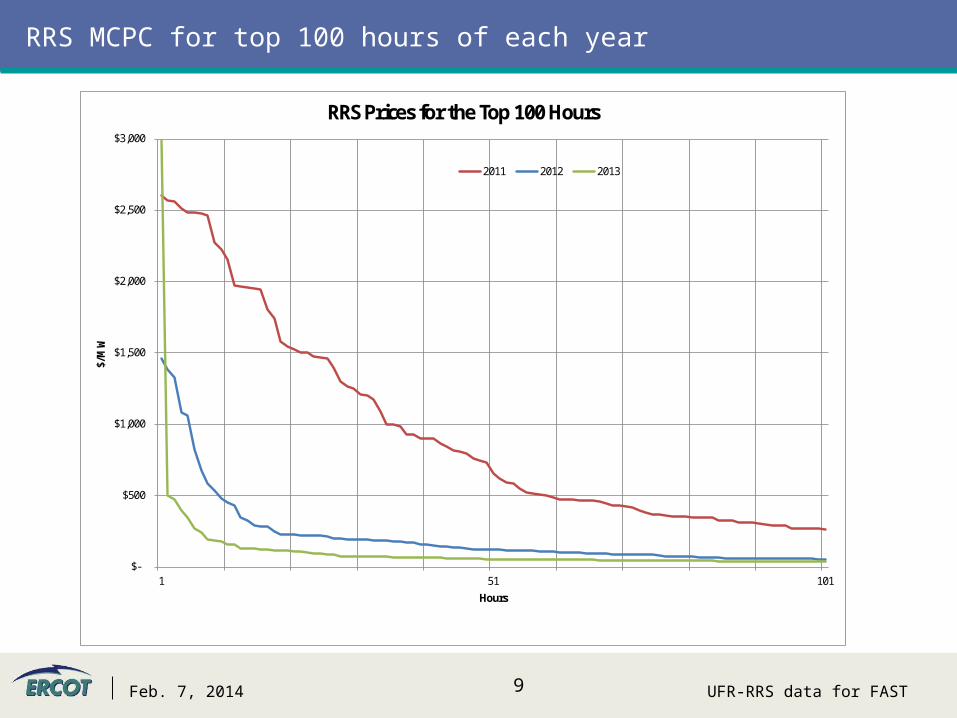
RRS MCPC for top 100 hours of each year
UFR-RRS data for FASTFeb. 7, 2014
$-
$500
$1,000
$1,500
$2,000
$2,500
$3,000
1 51 101
$/M
W
Hours
RRS Prices for the Top 100 Hours
2011 2012 2013

10 UFR-RRS data for FASTFeb. 7, 2014
ON
OFF
Questions?