historical logging, productivity, and structural ... · 429 silva fennica 39(3) research articles...
TRANSCRIPT

429
Silva Fennica 39(3) research articles
Historical Logging, Productivity, and Structural Characteristics of Boreal Coniferous Forests in Norway
Ken Olaf Storaunet, Jørund Rolstad, Ivar Gjerde and Vegard S. Gundersen
Storaunet, K.O., Rolstad, J., Gjerde, I. & Gundersen, V.S. 2005. Historical logging, productivity, and structural characteristics of boreal coniferous forests in Norway. Silva Fennica 39(3): 429–442.
Conservation of forest biodiversity has brought about an interest in evaluating the natu-ralness of forests, and to locate and protect semi-natural and old-growth forests in the Fennoscandian countries. However, it is not always clear how natural these forests really are, and how the past management history has affected their present structural composi-tion. We studied the relationships between cut stumps from historical logging activity (50−100 years ago) and forest structural characteristics of today in a total of 385 0.25 ha plots in three boreal coniferous forests which are parts of National Nature Reserves in Norway. We also studied how forest productivity influenced these relationships. In plots with negligible logging impact we found the amount of living trees, dead wood, and size of the oldest trees mainly to increase with increasing productivity, whereas the age of the oldest trees decreased. The amount of deciduous trees was generally low irrespective of productivity. The intensity of logging did not consistently influence most of these forest structural variables, neither at low- nor at high-productive sites. The only consistent rela-tionship in all study areas was a decreasing amount of dead wood with increasing logging intensity at high-productive sites. Also, the decay class distribution of dead wood was more right-skewed (indicating on-going accumulation of dead wood) the more logging had occurred at high-productive sites. Except from the effects on dead wood, previous logging does not show up as a major determinant of other stand structures of today.
Keywords boreal forest, dead trees, decaying wood, forest history, naturalness, selective logging, stand structureAuthors’ addresses Storaunet & Rolstad: Norwegian Forest Research Institute, Høgskole-vegen 8, NO-1432 Ås, Norway; Gjerde & Gundersen: Norwegian Forest Research Institute, Fanaflaten 4, NO-5244 Fana, NorwayE-mail [email protected] 31 January 2005 Revised 17 June 2005 Accepted 12 September 2005Available at http://www.metla.fi/silvafennica/full/sf39/sf393429.pdf

430
Silva Fennica 39(3) research articles
1 Introduction
Recent emphasis on the protection of forest bio-diversity has brought about a need to locate and protect semi-natural and old-growth forests in all the Fennoscandian countries (Parviainen 1999, Angelstam and Anderssson 2001). However, it is not always clear how natural these forests are and how the past management history has affected their present structural composition. The natural-ness of forests is often considered an important conservation measure on its own. During recent years the presence of decayed stumps from selec-tive logging events has been used to indicate the degree of naturalness of forests (Uotila et al. 2001, Siipilehto and Siitonen 2004, Rouvinen et al. 2005), and also often implicitly as a surrogate measure of biodiversity. Yet, relatively few stud-ies have looked into how former selective logging has influenced the forest stand structures of today (but see Siitonen et al. 2000, Uotila et al. 2001, 2002, Siipilehto and Siitonen 2004, Rouvinen et al. 2005).
Presence of different types of dead wood is an important factor promoting biodiversity in forest ecosystems, and organisms dependent on dead wood for their existence are found at different tro-phic and taxonomic levels (e.g. mammals, birds, insects, fungi). Centuries of logging activities in Fennoscandian boreal forests have seriously depleted the amount of dead wood, and many associated organisms are considered threatened today. For example, in Norway at least 37% of all red-listed forest-living species depend on dead wood (Gundersen and Rolstad 1998). Secur-ing biodiversity in Fennoscandian boreal forests therefore largely depends on a wise management of different types of dead wood.
Commercial utilization of timber inevitably diminishes the amount of dead wood, and imply that trees are removed from the forest that other-wise would have died and decomposed at the site. Clearcutting practice with short rotation cycles disrupts the continuous availability of dead wood in different decay stages by depleting the initial volume and by postponing accumulation of dead wood in future regenerating stands. The average volume of dead wood in Fennoscandian old-growth forests has been assessed to 60–90 m3ha−1
(Siitonen 2001), compared to a mere 2−10 m3ha−1 in managed landscapes, depending on forest type, region, and management regime (Fridman and Walheim 2000, Siitonen 2001). This means that the amount of dead wood at the landscape level may have been reduced by as much as 90−98% compared with old-growth conditions.
The management regime in Fennoscandian boreal forests has changed during the centuries. In the early days single-tree cutting predominated, and only trees that held certain quality and size criteria were cut. Different methods of selective cutting continued with increasing intensity until the mid-20th century when clearcutting took over as the dominant logging regime. The regenerating stands from the last 50 years of clearcutting have therefore not yet reached the stages of maturity, implying that mature stands of today are largely remnants from the selective logging period. These remnant stands have had time to gain volume, and to conceal possible relationships between past logging intensity and present stand structures. However, forest growth and decomposition of dead trees occurs at different rates at different sites. Therefore, the recovery of stands from past logging may take varying time in different regions and forest site types depending on productivity.
The present study is part of a comprehensive research project were the general aims are to gain knowledge on the distribution and abundance of rare and threatened species in Norwegian for-ests, and to improve forestry planning procedures (Gjerde and Baumann 2002, Gjerde et al. 2004, 2005, Rolstad et al. 2004, Sætersdal et al. 2005). Two basic hypotheses motivate our study. The intensity of past logging may have affected the present stand structure, and the forest productivity may influence the time required for the stand to recover from past logging. More specifically, we therefore aimed at 1) quantifying the amounts of living trees, logging stumps, and dead wood in different forest types and study areas, 2) describ-ing the relationships between the amount of cut stumps and forest structure in terms of amount, composition, and distribution of living trees and dead wood, and 3) assessing how these relation-ships depend on forest productivity.

431
Storaunet, Rolstad, Gjerde and Gundersen Historical Logging, Productivity, and Structural Characteristics of Boreal Coniferous Forests …
2 Material and Methods
2.1 Study Areas
During 1997−1999 comprehensive field work was conducted to survey forest-dwelling organisms and forest stand structure in six study areas cover-ing a variety of forest regions of Norway (Gjerde and Baumann 2002, Gjerde et al. 2004, 2005). For the purpose of this study we selected three of these areas that were dominated by boreal coniferous forest, each covering ~200 ha: Grong, Ringerike, and Sigdal study areas. All three study areas were situated in the mid-boreal vegetation zone (Moen 1999), and parts of them were located within National Nature Reserves. The study areas were composed of productive mature forest (~60%), young forest (22−28%), non-productive forest (3−9%), and bogs and lakes (5−16%) (Gjerde et al. 2005) (Fig. 1). For the present study, only data from productive mature forest was utilized.
The Grong study area (190 ha, 64º32’N, 12º24’E) in Central Norway is dominated by Norway spruce (Picea abies (L.) Karst.), but with Scots pine (Pinus sylvestris L.) at higher altitudes. A marked west-facing slope separates the study area in a western lower part (altitude range 80−120 m above sea level), situated below the marine sedimentary limit and termed ‘coastal spruce forest’, and an eastern part consisting both of spruce and pine forests (altitude range 120−340 m above sea level) (Fig. 1). The annual tempera-ture averages +3ºC, with mean January and July temperatures of −6ºC and +14ºC, respectively (Moen 1999). Mean annual precipitation aver-ages 1300 mm and is relatively evenly distributed through the year (Moen 1999). The coastal spruce forest has high conservation value mainly due to the presence of a unique lichen community embracing several redlisted species (Holien and Tønsberg 1996, Rolstad et al. 2001, Gjerde et al. 2004), even though the forests have been heav-ily influenced by logging activity for centuries (Storaunet et al. 2000, Rolstad et al. 2001).
The Ringerike study area (197 ha, 60º05’N, 10º32’E) in south-central Norway is dominated by Norway spruce with scattered patches of birch (Betula pubescens Ehrh.) and rowan (Sorbus aucuparia L.). The topography is steep and
broken, ranging between 500 and 700 m above see level (Fig. 1). Mean annual temperature is +3ºC, with January and July temperatures of −5 and +14ºC, respectively, whereas mean annual precipitation is approximately 1200 mm (Moen 1999). Parts of the study area are old-growth forest where small-scale gap dynamics are domi-nating (Ohlson and Tryterud 1999, Storaunet and Rolstad 2002, 2004). Several redlisted lichens and polypore fungi inhabit the study area (Gjerde et al. 2004, Rolstad et al. 2004).
The Sigdal study area (195 ha, 60º02’N, 09º26’E) is situated in south-central Norway 65 km west of Ringerike and approximately 500 km south of Grong, and comprises mixed conifer forest of Norway spruce and Scots pine. An east-facing slope with high-productive spruce forests distinguishes from the surrounding areas with bogs and stands of low-productive spruce and pine forests. Altitude ranges 400−650 m above sea level (Fig. 1), and mean annual temperature is +4ºC, with January and July means of −4ºC and +15ºC, respectively. Mean annual precipitation is 800 mm (Moen 1999). The study area hosts several redlisted lichens and many polypore fungi (Gjerde et al. 2004, Rolstad et al. 2004).
Based on ages and abrupt growth increases in living trees in different parts of the study areas, we assume the study areas were selectively logged at several different time periods: Grong study area: 1848, 1868, 1900, 1926, 1945; Ringerike study area: 1872, 1888, 1900, 1923; and Sigdal study area: 1899–1909, 1921–30, 1955 (bold-faced years indicate high-intensity logging event) (K.O. Storaunet, unpublished data). Storaunet et al. (2000) and Groven et al. (2002) showed that stumps after logging from about the same areas may require as much as ~100 years to decompose completely. For a more detailed description of the study areas and results from the species surveys, see Gjerde and Baumann (2002), Gjerde et al. (2004, 2005) and Rolstad et al. (2004).
2.2 Field Work, Sample Plot Categorizing, and Statistics
The study areas were divided into a grid net of 1-ha cells, of which the southeast quarter of the cells were subject to detailed field registrations, giving

432
Silva Fennica 39(3) research articles
Fig. 1. Amounts (basal area, m2ha−1) of cut stumps (A, C, E) and dead wood (both snags and logs) (B, D, F) in 0.25-ha plots in Grong (A and B), Ringerike (C and D), and Sigdal (E and F) study areas. Color legend: dark green: mature spruce forest, light green: mature pine forest, yellow: young forest, grey: non-productive forest. Contour intervals: 5 m.

433
Storaunet, Rolstad, Gjerde and Gundersen Historical Logging, Productivity, and Structural Characteristics of Boreal Coniferous Forests …
sample plots of 50 × 50 m. In cases when more than 50% of a sample plot was covered by other than mature productive forest (e.g. young forest, non-productive forest, mires, or ponds), the plot was rejected. In other cases only forested area was included for measurements. Thus, data for mature productive forest was available from 114, 138, and 133 plots from Grong, Ringerike, and Sigdal study areas, respectively. In each sample plot, all dead wood ≥ 10 cm in diameter 1.3 m from the root end, and all logging stumps ≥ 10 cm at stump height were recorded and categorized into 10 cm size classes and according to degree of decay. For both dead trees and stumps we applied the first 7 decay classes of the 8-grade decay classification system described by Groven et al. (2002), where decay class 1 is recently dead/cut, and decay class 7 is fragmented wood with the log (or stump) partly buried in the forest floor. To reduce field work, class eight was omitted since this class describes wood completely buried in the forest floor and therefore was too laborious to survey in the field. Two to four of the oldest or biggest trees in each sample plot were selected for age and size measurements. These were DBH (diameter at breast height) measured, and age cored with an increment corer at breast height. The annual tree rings were counted, giving ages of the oldest trees in each sample plot. Productivity (H40-index) and basal area of the growing stock were recorded during a parallel forest inventory. The H40 is a productivity site index which indicates the height of trees at the age of 40 years (Tveite and Braastad 1981). The basal area (m2ha−1) of living trees was measured with a relascope. Within the coniferous forested areas, different deciduous tree species were present as groups of trees or single trees, including birch, grey alder (Alnus incana (L.) Moench), aspen (Populus tremula L.), rowan, and goat willow (Salix caprea L.). The relascope measurement was not categorized to tree species since the amount of deciduous trees in each plot generally was low. The deciduous component of the plots was therefore assessed as percentage of the growing stock, and recalculated to basal area.
All dead wood and logging stumps were recal-culated to basal area (m2ha−1) in the plots, based on the counts and the recorded sizes. The mid-point of each 10-cm size class was used as the
average size of stumps and logs. The assumed circular area of all stumps and logs were summed, and divided by the sample plot size, giving basal area. Stump and log basal areas are not directly comparable since they were measured in stump height and breast height, respectively. Sample plots were categorized according to productivity and logging impact. We categorized the forest in low-productive (H40 = 6, 8, and 11) and high-productive forest (H40 = 14 and 17). According to logging impact the sample plots were categorized as follows; low impact: basal area of stumps < 4 m2ha−1, medium impact: 4−12 m2ha−1, and high impact: > 12 m2ha−1.
We used the non-parametric Spearman rank correlation coefficient to evaluate relationships between productivity categories and the different forest stand characteristics, whereas simple and multiple linear regression models were used to assess how productivity and logging influenced the other stand characteristics.
3 Results
The amount of living trees, dead wood, and stumps varied considerably among study areas and forest types (Figs. 1 and 2). Generally, the growing stock of living trees increased with increasing productivity, although not as much as might be expected from the productivity site index in spruce forests in Ringerike and Sigdal (Fig. 2A). The amount of deciduous trees was generally low in Grong, decreased with increas-ing productivity in Ringerike, and increased with productivity in Sigdal (Fig. 2B). Average percent-age of deciduous trees was 3, 7, and 4% of the growing stock in Grong, Ringerike, and Sigdal, respectively. Amount of dead wood peaked at medium productivity in Grong and Ringerike, but increased steeply with productivity in Sigdal (Fig. 2C). The amount of stumps increased with increasing productivity in Grong and Ringerike, but remained constant or decreased slightly in Sigdal. Although the average degree of cutting showed relatively distinct trends (Fig. 2D), there were large variations among plots in different study areas and productivity categories (Fig. 3). Finally, age of the oldest trees decreased, whereas

434
Silva Fennica 39(3) research articles
the size of these trees increased with increasing productivity (Fig. 2E, 2F).
3.1 Influence of Productivity
Because amount of logging varied with productiv-ity (Fig. 2D, Fig. 3), plots with no or negligible logging impact (basal area of logging stumps <4 m2ha−1) were selected to evaluate how productiv-ity influenced the stand characteristics (Fig. 4). In
Grong most plots were heavily logged, rendering only a few plots on low-productive sites available for this analysis. It should also be noted that even if plots had few logging stumps they may have been influenced by logging further back in time, rendering stumps completely decomposed and invisible today.
The amount of living trees increased with increasing productivity, but leveled off above category H40 > 11 (Ringerike: spearman rank correlation (rs) = 0.50, p < 0.001; Sigdal: rs = 0.71,
0
5
10
15
20
25living trees (A)
0123 (B) living deciduous trees
0
5
10 (C) dead trees
0
5
10
15
20
25(D) cut stumps
100
200
300
400 age(E)
20
30
40
50
60
6 8 11 8 11 14 17 6 8 11 14 17 6 8 11 8 11 14 17
Pine Spruce Spruce Pine Spruce
Grong Ringerike Sigdal
DBH(F)
mcy
raes
m2 h
a–1m
2 ha–1
m2 h
a–1m
2 ha–1
Fig. 2. Amounts (basal area, m2ha−1) of living trees (A), living decidu-ous trees (B), dead wood (C), and cut stumps (D); age (years) (E) and size (DBH, cm) of oldest trees (F) in the different study areas, forest types, and produc-tivity categories. Grey bars and open diamonds: pine forest; black bars and filled diamonds: spruce forest. The upper white part of bars in (C) indicates the amount of dead standing trees. SDs indi-cated with vertical lines.
435
Storaunet, Rolstad, Gjerde and Gundersen Historical Logging, Productivity, and Structural Characteristics of Boreal Coniferous Forests …
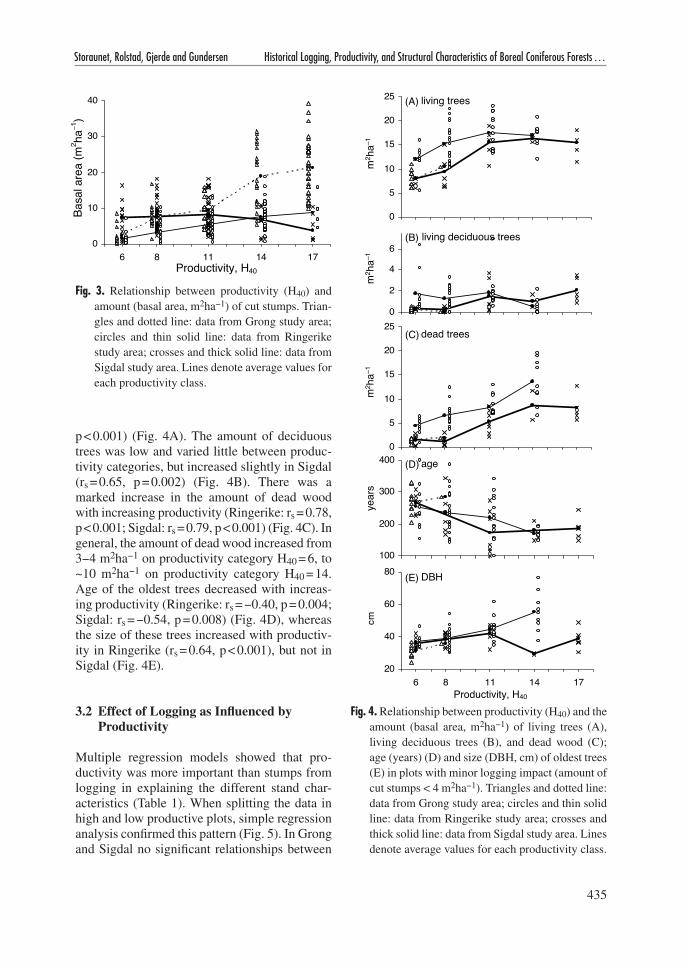
p < 0.001) (Fig. 4A). The amount of deciduous trees was low and varied little between produc-tivity categories, but increased slightly in Sigdal (rs = 0.65, p = 0.002) (Fig. 4B). There was a marked increase in the amount of dead wood with increasing productivity (Ringerike: rs = 0.78, p < 0.001; Sigdal: rs = 0.79, p < 0.001) (Fig. 4C). In general, the amount of dead wood increased from 3−4 m2ha−1 on productivity category H40 = 6, to ~10 m2ha−1 on productivity category H40 = 14. Age of the oldest trees decreased with increas-ing productivity (Ringerike: rs = −0.40, p = 0.004; Sigdal: rs = −0.54, p = 0.008) (Fig. 4D), whereas the size of these trees increased with productiv-ity in Ringerike (rs = 0.64, p < 0.001), but not in Sigdal (Fig. 4E).
3.2 Effect of Logging as Influenced by Productivity
Multiple regression models showed that pro-ductivity was more important than stumps from logging in explaining the different stand char-acteristics (Table 1). When splitting the data in high and low productive plots, simple regression analysis confirmed this pattern (Fig. 5). In Grong and Sigdal no significant relationships between
0
10
20
30
40
6 8 11 14 17Productivity, H40
a lasaBr
m( a e2
ah�1 )
Fig. 3. Relationship between productivity (H40) and amount (basal area, m2ha−1) of cut stumps. Trian-gles and dotted line: data from Grong study area; circles and thin solid line: data from Ringerike study area; crosses and thick solid line: data from Sigdal study area. Lines denote average values for each productivity class.
Fig. 4. Relationship between productivity (H40) and the amount (basal area, m2ha−1) of living trees (A), living deciduous trees (B), and dead wood (C); age (years) (D) and size (DBH, cm) of oldest trees (E) in plots with minor logging impact (amount of cut stumps < 4 m2ha−1). Triangles and dotted line: data from Grong study area; circles and thin solid line: data from Ringerike study area; crosses and thick solid line: data from Sigdal study area. Lines denote average values for each productivity class.
0
5
10
15
20
25 (A) living trees
0
2
4
6living deciduous trees (B)
m2 h
a–1
0
5
10
15
20
25(C) dead trees
100
200
300
400 (D) age
20
40
60
80
6 8 11 14 17Productivity, H40
(E) DBH
cmm
2 ha–1
m2 h
a–1ye
ars

436
Silva Fennica 39(3) research articles
amount of stumps and amount of living trees was present. In Ringerike the amount of living trees increased with increasing logging both at low- and high-productive sites (low: r = 0.45, p < 0.001; high: r = 0.44, p < 0.001) (Table 1, Fig 5A, 5B). The amount of deciduous trees showed no relationships with logging when productivity was accounted for. The exception was at high-productive sites in Sigdal in the simple regression analysis, where deciduous trees decreased with increasing logging (r = −0.43, p = 0.01) (Table 1, Fig. 5C, 5D). The amount of dead wood showed a negative interaction term between productiv-ity and stumps both in Ringerike and in Sigdal
(Table 1), and the simple regression analyses confirmed this pattern by showing negative rela-tionship between dead wood and logging intensity at high productive sites in all study areas (Grong: r = −0.29, p = 0.02; Ringerike: r = −0.37, p = 0.003; Sigdal: r = −0.55, p < 0.001) (Fig. 5F). However, this was not evident at the low-productive sites (all p-values > 0.20) (Fig. 5E). Age of oldest trees was also only related to productivity (Table 1), except at high-productive sites in Grong, where a slightly negative trend with increasing amount of logging was present (r = −0.27, p = 0.03) (Fig. 5G, 5H). Finally, DBH of the oldest trees was not related to logging intensity when productivity
Table 1. Summary of multiple regression analyses for different forests structural variables as dependent variables and amount (m2ha–1) of stumps and productivity (H40) as explanatory variables, and the interaction between the two.
Dependent variable Grong Ringerike Sigdal
Independent variables: Coefficient t-value p-value Coefficient t-value p-value Coefficient t-value p-value
Living trees Intercept –7.4±2.2 –3.30 0.0014 9.4±1.9 5.06 <0.001 3.95±1.6 2.45 0.015 Stumps 0.35±0.22 1.62 0.107 1.21±0.32 3.72 <0.001 0.045±0.21 0.22 0.83 Productivity 1.9±0.18 10.5 <0.001 0.52±0.17 3.02 0.003 0.75±0.15 4.97 <0.001 Interaction –0.02±0.01 –1.26 0.21 –0.06±0.03 –2.3 0.02 0.009±0.02 0.42 0.67 R2 = 0.83; F = 162; p < 0.001 R2 = 0.34; F = 22.5; p < 0.001 R2 = 0.40; F = 27.8; p < 0.001
Deciduous trees Intercept –0.08±0.42 –0.19 0.85 1.88±0.75 2.52 0.013 –0.82±0.32 –2.57 0.011 Stumps 0.04±0.04 1.01 0.32 0.06±0.13 0.44 0.65 0.028±0.04 0.67 0.50 Productivity 0.07±0.03 2.11 0.04 –0.05±0.07 –0.78 0.44 0.17±0.03 5.72 <0.001 Interaction –0.004±0.003 –1.61 0.11 –0.004±0.01 –0.43 0.67 –0.006±0.004 –1.48 0.14 R2 = 0.08; F = 2.99; p = 0.035 R2 = 0.029; F = 1.31; p = 0.28 R2 = 0.38; F = 25.5; p < 0.001
Dead trees Intercept 0.42±2.0 0.22 0.83 1.31±1.65 0.79 0.43 –4.87±0.99 –4.93 <0.001 Stumps 0.08±0.19 0.41 0.68 0.65±0.29 2.25 0.026 0.15±0.13 1.22 0.23 Productivity 0.45±0.16 2.79 0.006 0.66±0.15 4.28 <0.001 0.85±0.09 9.24 <0.001 Interaction –0.015±0.012 –1.20 0.23 –0.07±0.023 –3.16 0.002 –0.027±0.013 –2.15 0.033 R2 = 0.11; F = 4.34; p = 0.006 R2 = 0.14; F = 7.16; p < 0.001 R2 = 0.61; F = 64.5; p < 0.001
Age Intercept 355.5±26.4 13.5 <0.001 308.1±29.7 10.4 <0.001 318.4±35.9 8.88 <0.001 Stumps –3.75±2.54 –1.48 0.14 –8.44±5.18 –1.63 0.11 –0.54±4.61 –0.12 0.91 Productivity –9.06±2.16 –4.21 <0.001 –8.50±2.76 –3.08 0.0025 –10.7±3.35 –3.19 0.0018 Interaction 0.20±0.17 1.18 0.24 0.62±0.41 1.50 0.14 0.20±0.46 0.43 0.67 R2 = 0.43; F = 24.9; p < 0.001 R2 = 0.12; F = 5.90; p < 0.001 R2 = 0.18; F = 9.03; p < 0.001
DBH Intercept 21.5±3.90 5.52 <0.001 24.4±4.36 5.60 <0.001 31.9±3.68 8.65 <0.001 Stumps 0.58±0.37 1.54 0.13 2.11±0.76 2.79 0.006 0.44±0.47 0.93 0.36 Productivity 0.86±0.32 2.71 0.008 1.85±0.41 4.54 <0.001 0.52±0.34 1.50 0.14 Interaction –0.03±0.02 –1.09 0.28 –0.17±0.061 –2.77 0.007 –0.04±0.05 –0.84 0.40 R2 = 0.29; F = 14.0; p < 0.001 R2 = 0.19; F = 9.81; p < 0.001 R2 = 0.02; F = 0.90; p = 0.44

437
Storaunet, Rolstad, Gjerde and Gundersen Historical Logging, Productivity, and Structural Characteristics of Boreal Coniferous Forests …
0
10
20
30living trees (A) (B)
0
2
4
6
8
0
10
20
living deciduous trees (C) (D)
100
200
300
400
dead trees (E) (F)
20
40
60
80
0 10 20 0 10 20 30 40
DBH
age
(I)
(G) (H)
(J)
m2 h
a–1m
2 ha–1
m2 h
a–1ye
ars
cm
low-productive high-productiveAmount of cut stumps (m2ha–1)
Fig 5. Relationship between the amount (basal area, m2ha−1) of stumps and the amount (basal area, m2ha−1) of living trees (A and B), living deciduous trees (C and D), and dead wood (E and F); age (years) (G and H) and size (DBH, cm) of oldest trees (I and J), in low-productive plots (A, C, E, G, and I) and high-productive plots (B, D, F, H, and J). Blue dots and lines: data from Grong study area; black dots and lines: data from Ringerike study area; red dots and lines: data from Sigdal study area. Lines show the simple linear regression between variables, and thick lines indicates regression lines significant at 5% level.

438
Silva Fennica 39(3) research articles
was accounted for except in Ringerike (Table 1), where size of these trees increased at low-pro-ductive sites (r = 0.26, p = 0.03) (Fig. 5I, 5J). The only relationship that showed a consistent pattern across all three study areas was the decreasing amount of dead wood with increasing logging impact at high-productive sites.
The decay class distributions of dead wood were more skewed to the right (tail to the right) on high-productive than on low-productive sites (Fig. 6A, 6B). Also, on high-productive sites the dead wood distributions were more skewed to the right on plots with higher logging impact
(Fig. 6B). A distribution of dead wood on decay classes skewed to the right indicates that the amount of dead wood during the recent decades is accumulating. The amount of dead wood relative to the amount of living trees (D/L-values, Fig. 6) decreased with increasing logging impact on high-productive sites, but this relationship was not as evident on low-productive sites.
Fig. 6. Decay class distribution of dead wood (y-axes show basal area, m2ha−1) in different study areas and different logging intensity groups, in low-productive plots (A) and high-productive plots (B). Log-ging intensity groups: low (upper): basal area of cut stumps < 4 m2ha−1, medium (middle): 4−12 m2ha−1, high (lower): >12 m2ha−1. The D/L-percentage indicates the ratio between amount of dead wood and amount of living trees. Grey and black part of bars indicates the amount of snags and fallen logs, respectively.
(A) Low-productiveGrong Ringerike Sigdal
3
2
1
03
2
1
0
hgih muide
m
wol
1 2 3 4 5 6 7 1 2 3 4 5 6 7 3
2
1
01 2 3 4 5 6 7
Decay class
(B) High-productiveGrong Ringerike Sigdal
3
2
1
03
2
1
0
hgihmuide
m
wo l
3
2
1
0 1 2 3 4 5 6 7 1 2 3 4 5 6 7 1 2 3 4 5 6 7
Decay class
D/L = 36% D/L = 43% D/L = 16%
D/L = 41% D/L =11%D/L = 41%
D/L = 12%
D/L = 53% D/L = 46%
D/L = 22% D/L = 33% D/L = 34%
D/L = 16% D/L = 24% D/L = 16%
logg
ing
inte
nsity
logg
ing
inte
nsity

439
Storaunet, Rolstad, Gjerde and Gundersen Historical Logging, Productivity, and Structural Characteristics of Boreal Coniferous Forests …
4 Discussion
Both the amount of living trees and logging stumps were mainly found to increase with increasing productivity. For obvious reasons, the short term relationship between logging intensity and still standing trees should be negative; i.e., the more trees cut the less would be left. However, because the selective logging took place several decades ago (mainly 50 to 100 years ago) the forest stands have gained volume over the years, and with higher growth rates at high-productive than at low-productive sites. These stands are today in the process of producing dead wood, and will therefore, in an interim phase, probably contain more living trees and less dead wood than their old-growth counterparts.
The amount of dead wood is expected to increase with increasing productivity, as both shown on plots with negligible logging impact and with the positive productivity coefficient in the multiple regression analyses (cf. Fig. 4C and Table 1). Correspondingly, Sippola et al. (1998) reported a positive relationship between dead wood and productivity in old-growth forests in Finland. Two factors control the biomass (or amount) of dead wood; input (tree mortality) and decay (Harmon et al. 1986, Siitonen 2001). In steady-state conditions the input of dead wood will increase with increasing productivity as more wood is produced, and the question is how decay varies with productivity.
With data from northern Sweden, both Jons-son (2000) and Kruys et al. (2002) found that dead wood of Norway spruce may use approx. 60–70 years to decompose completely, whereas Storaunet and Rolstad (2002) found the decom-position time to be > 100 years. The latter study was conducted in the same Nature Reserve as our study area in Ringerike. None of these stud-ies related decomposition rates to productivity. Decay rates of logging stumps from earlier selec-tive loggings have been shown to approximate 100 years (Storaunet et al. 2000, Groven et al. 2002), but neither these studies focused on dif-ferences in productivity. These studies were also from about the same locations as two of our study areas. However, it is known that decomposition rate increases with temperature (up to a certain
level) (Harmon et al. 1986), and productivity usually increases with temperature, resulting in increased decomposition rates. Small-scale dif-ferences in topography and sunlight exposition may therefore result in differences in decay rates. Thus, there are higher turnover on high- compared to low-productive sites. This may be the reason why few stumps were found in the slope of high-productive spruce forest in Sigdal study area. Here we found few stumps and high amounts of dead wood, indicating old-growth conditions. However, ages and abrupt growth increases of living trees in this part of the study area strongly indicated that the area had been subject to inten-sive selective logging approximately 100 years ago (K.O. Storaunet, unpublished data), giving time for most stumps to decompose completely and dead wood to accumulate.
In a review article Siitonen (2001) found the average volume of dead wood in Fennoscandian old-growth boreal forests to be 60−90 m3ha−1. On plots with negligible logging impact we found the amount of dead wood to average 3−4 m2ha−1 (approx. 20−40 m3ha−1) on low-productive sites, increasing to 10−12 m2ha−1 (approx. 70−120 m3ha−1) on high-productive sites (transformed from m2ha−1 to m3ha−1 by functions from Vest-jordet (1959), without correcting for increased height/diameter ratio). On plots with high logging impact we found the average amounts of dead wood to be 2−5 m2ha−1 (approx. 10−50 m3ha−1), about the same as reported from forest inventory data from over-mature boreal forests in Sweden (Fridman and Walheim 2000). Our results also correspond well with results from studies model-ing the amounts of dead wood in Fennoscandian spruce-dominated forests, both in old-growth and managed forests (Ranius et al. 2003, 2004).
Our results showed that the historical logging activity has reduced the present amount of dead wood at high-productive sites. This corresponds to other historical-structural studies from Fen-noscandian boreal forests (Bader et al. 1995, Sippola et al. 1998, 2001, Siitonen et al. 2000, Storaunet et al. 2000), whereas Rouvinen et al. (2005) found no significant relationship between logging and dead wood. However, at low-produc-tive sites no such relationship was detected. These contrasting patterns on high- and low-produc-tive sites may have several explanations. First,

440
Silva Fennica 39(3) research articles
the logging impact was considerably lower at low- compared to high-productive sites. Second, since mortality is lower on low-productive sites (Eid and Tuhus 2001) (implying a lower input of dead trees), it takes longer to produce dead wood than at high-productive sites. Third, if decay rate of dead wood is lower on low-productive sites, this could increase such a time lag (i.e., the dead wood already present at harvesting leaves the system at lower rates). Also, at low-productive sites there were higher proportions of Scots pine, which has lower mortality and decay rates than spruce (Eid and Tuhus 2001, Tarasov and Birdsey 2001). Finally, if most trees die because of natural disturbance events and not because of senescence and old age, this may lead to low or no correlation between dead wood and logging.
The decay class distribution of dead wood depends on the logging and disturbance history of the forest stand, and also on residence time of dead wood in each decay class. Some studies have found relatively more dead wood in young and middle decay classes in old-growth forests (Jonsson 2000, Siitonen et al. 2000, Rouvinen and Kouki 2002), but it is also shown that earlier selectively logged forests often have a skewed decay class distribution of dead wood, most likely indicating accumulation of dead wood after selec-tively logging ceased (Kruys et al. 1999, Storau-net et al. 2000). However, we also found skewed distributions on high-productive sites with low amounts of logging stumps in Sigdal. This pre-sumably was due to stumps being completely decomposed. Thus, the presumed 100 year old logging event in Sigdal may have caused the skewed decay class distribution.
On plots with negligible logging impact, the amount of deciduous trees was found to be invari-ably low. In relation to logging impact, no general relationship was detected. Nevertheless, topog-raphy and productivity explained parts of the deciduous component, since most deciduous trees were found on steep slopes in Grong, and on steep slopes at high-productive sites in Sigdal. In Ring-erike the deciduous trees were most commonly found in flat parts at higher altitudes with low-productive forests. Siitonen et al. (2000) found highest volume of deciduous trees in old-growth sites, averaging 13%, compared to 8% and 3% in over-mature and mature managed forests. The
latter figures corresponds well to our basal-area-percentages of 2−9%.
Age of the oldest trees was found to decrease with increasing productivity, from 260−280 years at productivity H40 = 6, to 170−180 years at productivity H40 ≥ 14, whereas logging was not found to influence these ages. This corresponds well to higher mortality rates at high-produc-tive sites (Eid and Tuhus 2001). The size of the oldest trees tended to increase with increasing productivity in plots with low logging impact, probably because trees are growing faster at high-productive sites. Also for this stand-character, the relationships with logging were mainly non-significant, although slightly increasing trends were detected at low-productive sites in Grong and Ringerike. The latter may be due to growth releases after logging events.
Forest naturalness is often considered an impor-tant measure in conservation (Parviainen 1999). However, the term is often used without quantify-ing how natural the forests really are, and thus, Fennoscandian boreal forest reserves are often influenced by former selective logging activity (Uotila et al. 2002). Our study emphasizes that several of the forest stand characteristics were only slightly influenced by the intensity of the selective logging the last 50−100 years, as meas-ured by presence of partly decayed stumps. The only consistent substantial influence of the log-ging was reduced amounts of dead wood on high-productive sites. However, our study also suggests how earlier logging activity may have influenced forest structures and characteristics long after obvious signs of such (i.e., logging stumps) are no longer visible in field inventories. When assessing the naturalness of forests, one should therefore take into account both the amounts and decom-position rates of logging stumps and dead wood, but also the decay class distribution of the dead wood. When repeated selective logging ceases, the forest will use time to recover until the stand starts to produce dead wood. It will still take more time until dead wood in late decay stages is present. The decay class distribution is there-fore probably the final stand character to recover from former selective logging activity, implying that the forest has not returned to a natural state until this distribution has leveled off. Neither presence of significant amounts of dead wood

441
Storaunet, Rolstad, Gjerde and Gundersen Historical Logging, Productivity, and Structural Characteristics of Boreal Coniferous Forests …
nor the lack of logging stumps does necessarily imply that the forest has not been influenced by logging activity.
Acknowledgements
We are grateful to three anonymous referees for generously improving the clarity of the manu-script. Thanks to J.K. Gussiås, B. Heidenreich, and E. Rolstad for participating in the field work, and to R. Groven for commenting on an early version of the manuscript. This study was part of the project “Biodiversity in Norwegian For-ests (Miljøregistrering i Skog)” of the Norwegian Forest Research Institute, financed by the Norwe-gian Ministry of Agriculture.
References
Angelstam, P. & Andersson, L. 2001. Estimates of the needs for forest reserves in Sweden. Scandinavian Journal of Forest Research Suppl. 3: 38–51.
Bader, P., Jansson, S. & Jonsson, B.G. 1995. Wood-inhabiting fungi and substratum decline in selec-tively logged boreal spruce forests. Biological Conservation 72: 355–362.
Eid, T. & Tuhus, E. 2001. Models for individual tree mortality in Norway. Forest Ecology and Manage-ment 154: 69–84.
Fridman, J. & Walheim, M. 2000. Amount, structure, and dynamics of dead wood on managed forestland in Sweden. Forest Ecology and Management 131: 23–36.
Gjerde, I. & Baumann, C. (eds.). 2002. Miljøregistre-ring i skog – biologisk mangfold. Hovedrapport. Norwegian Forest Research Institute, Ås. 224 p. ISBN 82-7169-993-8. (In Norwegian).
— , Sætersdal, M., Rolstad, J., Blom, H.H. & Storau-net, K.O. 2004. Fine-scale diversity and rarity hotspots in northern forests. Conservation Biology 18: 1032–1042.
— , Sætersdal, M., Rolstad, J., Storaunet, K.O., Blom, H.H., Gundersen, V. & Heegaard, E. 2005. Produc-tivity-diversity relationships for plants, bryophytes, lichens, and polypore fungi in six northern forest landscapes. Ecography 28: 705–720.
Groven, R., Rolstad, J., Storaunet, K.O. & Rolstad, E. 2002. Using forest stand reconstructions to assess the role of structural continuity for late-succes-sional species. Forest Ecology and Management 164: 39–55.
Gundersen, V. & Rolstad, J. 1998. Truete arter i skog. Norwegian Forest Research Institute, OR no. 6/98. (In Norwegian).
Harmon, M.E., Franklin, J.F., Swanson, F.J., Sollins, P., Gregory, S.V., Lattin, J.D., Anderson, N.H., Cline, S.P., Aumen, N.G., Sedell, J.R., Lienkaem-per, G.W., Cromack Jr., K. & Cummins, K.W. 1986. Ecology of coarse woody debris in temper-ate ecosystems. Advances in Ecological Research 15: 133–302.
Holien, H. & Tønsberg, T. 1996. Boreal regnskog i Norge – habitatet for trøndelagselementets lavarter. Blyttia 54: 157–177. ISSN 0006-5269. (In Norwe-gian with English summary).
Jonsson, B.G. 2000. Availability of coarse woody debris in a boreal old-growth Picea abies forest. Journal of Vegetation Science 11: 51–56.
Kruys, N., Fries, C., Jonsson, B.G., Lämås, T. & Ståhl, G. 1999. Wood-inhabiting cryptogams on dead Norway spruce (Picea abies) trees in managed Swedish boreal forests. Canadian Journal of Forest Research 29: 178–186.
— , Jonsson, B.G. & Ståhl, G. 2002. A stage-based matrix modell for decay-class dynamics of woody debris. Ecological Applications 12: 773–781.
Moen, A. 1999. National atlas of Norway: Vegetation. Norwegian Mapping Authority, Hønefoss. 200 p. ISBN 82-7945-000-9.
Ohlson, M. & Tryterud, E. 1999. Long-term spruce forest continuity – a challenge for a sustainable Scandinavian forestry. Forest Ecology and Man-agement 124: 27–34.
Parviainen, J. 1999. Strict forest reserves in Europe – Efforts to enhance biodiversity and strengthen research related to natural forests in Europe. In: Parviainen, J., Little, D., Doyle, M., O’Sullivan, A., Kettunen, M. & Korhonen, M. (eds.). Research in forest reserves and natural forests in European countries – Country reports for the COST Action E4: Forest reserves research network. EFI Proceed-ings 16. p. 7–33. ISBN 952-9844-31-X.
Ranius, T., Kindvall, O., Kruys, N. & Jonsson, B.G. 2003. Modelling dead wood in Norway spruce stands subject to different management regimes. Forest Ecology and Management 182: 13–29.
442
Silva Fennica 39(3) research articles
— , Jonsson, B.G. & Kruys, N. 2004. Modeling dead wood in Fennoscandian old-growth forests dom-inated by Norway spruce. Canadian Journal of Forest Research 34: 1025–1034.
Rolstad, J., Gjerde, I., Storaunet, K.O. & Rolstad, E. 2001. Epiphytic lichens in Norwegian coastal spruce forest: historic logging and present forest structure. Ecological Applications 11: 421–436.
— , Sætersdal, M., Gjerde, I. & Storaunet, K.O. 2004. Wood-decaying fungi in boreal forest: are species richness and abundances influenced by small-scale spatiotemporal distribution of dead wood? Biologi-cal Conservation 117: 539–555.
Rouvinen, S. & Kouki, J. 2002. Spatiotemporal avail-ability of dead wood in protected old-growth for-ests: A case study from boreal forests in eastern Finland. Scandinavian Journal of Forest Research 17: 317–329.
— , Rautiainen, A. & Kouki, J. 2005. A relation between historical forest use and current dead woody material in a boreal protected old-growth forest in Finland. Silva Fennica 39(1): 21–36.
Siipilehto, J. & Siitonen, J. 2004. Degree of previous cutting in explaining the differences in diameter distributions between mature managed and natu-ral Norway spruce forests. Silva Fennica 38(4): 425–435.
Siitonen, J. 2001. Forest management, coarse woody debris and saproxylic organisms: Fennoscandian boreal forests as an example. Ecological Bulletins 49: 11–41.
— , Martikainen, P., Punttila, P. & Rauh, J. 2000. Coarse woody debris and stand characteristics in mature managed and old-growth boreal mesic forests in southern Finland. Forest Ecology and Management 128: 211–225.
Sippola, A.-L., Siitonen, J. & Kallio, R. 1998. Amount and quality of coarse woody debris in natural and managed coniferous forests near the timberline in Finnish Lapland. Scandinavian Journal of Forest Research 13: 204–214.
— , Lehesvirta, T. & Renvall, P. 2001. Effects of selec-tive logging on coarse woody debris and diversity of wood-decaying polypores in eastern Finland. Ecological Bulletins 49: 243–254.
Storaunet, K.O. & Rolstad, J. 2002. Time since death and fall of Norway spruce logs in old-growth and selectively cut boreal forest. Canadian Journal of Forest Research 32: 1801–1812.
— & Rolstad, J. 2004. How long do Norway spruce snags stand? Evaluating four estimation methods. Canadian Journal of Forest Research 34: 376–383.
— , Rolstad, J. & Groven, R. 2000. Reconstructing 100–150 years of logging history in coastal spruce forest (Picea abies) with special conservation values in Central Norway. Scandinavian Journal of Forest Research 15: 591–604.
Sætersdal, M., Gjerde, I. & Blom, H.H. 2005. Indicator species and the problem of spatial inconsistency in nestedness patterns. Biological Conservation 122: 305–316.
Tarasov, M.E. & Birdsey, R.A. 2001. Decay rate and potential storage of coarse woody debris in Len-ingrad Region. Ecological Bulletins 49: 137–147.
Tveite, B. & Braastad, H. 1981. Bonitering av gran, furu og bjørk. Norsk Skogbruk 27(4): 17–22. ISSN 0029-2087. (In Norwegian).
Uotila, A., Maltamo, M., Uuttera, J. & Isomäki, A. 2001. Stand structure in semi-natural and managed forests in eastern Finland and Russian Karelia. Ecological Bulletins 49: 149–158.
— , Kouki, J., Kontkanen, H. & Pulkkinen, P. 2002. Assessing the naturalness of boreal forests in east-ern Fennoscandia. Forest Ecology and Manage-ment 161: 257–277.
Vestjordet, E. 1959. Bestandsvolumtabeller for gran og bjørk. Norwegian Forest Research Institute, Ås. Internal Report. 67 p. (In Norwegian).
Total of 37 references