historical and current stand structure
TRANSCRIPT

Unpublished Report
1
Historical and current stand structure in
Douglas-fir and ponderosa pine forests
Peter Ohlson and Richard Schellhaas, USDA Forest Service, Okanogan and Wenatchee
National Forests, Wenatchee Forestry Science Lab, 1133 N. Western Ave, Wenatchee, WA
98801.
ACKNOWLEDGMENTS
The authors would like to thank the following people for their contributions with this project. Field
data collection: Stina Booth, Ron Gross, Don Spurbeck and Bonnie Shanafelt. Core counting,
data entry and analysis: Anne Conway, Stina Booth and Bonnie Shanafelt. Manuscript review:
Ann Camp, Chad Oliver, John Townsley, John Lehmkuhl, Tom Leuschen, John Daily and Tom
Ketcham.
Unpublished Report
2
Historical and current stand structure in
Douglas-fir and ponderosa pine forests
ABSTRACT: A comparison of historic and current stand structure and species composition was
made in Douglas-fir (Pseudotsuga menziesii) and ponderosa pine (Pinus ponderosa) forest
series on the eastern slopes of the Cascade Mountains. We used tree ring analysis of 1,192
tree cores from the Okanogan National Forest to reconstruct historical tree diameter and inferred
structural attributes during the past 100 years. Sampled stands currently have more trees per
acre and more basal area than were found historically. Overall stand density has increased
307% for Douglas-fir, 81% for ponderosa pine and 138% for Engelmann spruce (Picea
engelmannii). Western larch (Larix occidentalis) was the only tree species that decreased in
density (-48%). Average basal area has also increased 81% above historical levels. Changes in
stand density have not been uniform over the past 100 years. The maximum number of trees
per acre for most of these stands occurred 40 to 50 years ago, which indicates a shift toward a
stem exclusion stage of stand development in recent decades.
INTRODUCTION
Forests in the Douglas-fir and ponderosa pine series (Franklin and Dyrness 1988) on the
eastern slope of the Washington Cascades historically developed under a predominantly high-
frequency, low-severity fire regime, although fires of moderate and high severity also occurred
(Agee 1994, Everett et al. 1999b). Previous studies on the Okanogan National Forest found
historical mean fire-free intervals of 10 to 24 years (Finch 1984), 7.5 to 7.7 years (Ohlson 1996),
and 6.3 to 11.4 years (Everett et al., work in progress). These frequent, low-intensity fires
prevented large amounts of fuel from accumulating and limited the establishment of young trees
while causing minimal mortality to the established overstory trees (Agee 1994). Resulting forest
stands were open and park-like (Plummer 1902, Cowlin et al. 1942, Gorman 1899). During the
last century, fires have been excluded from many of these stands. As a result, surface fuels and

Unpublished Report
3
thickets of small trees have developed to a point where high-intensity, stand-replacing fires are
becoming increasingly common (Covington and Moore 1994, Arno et al. 1995, Camp 1999).
Thinning and prescribed fire are management tools that are commonly used to reduce the
potential for catastrophic wildfires (Graham et al. 1999). They may also be useful in restoring
historical stand conditions in these dry forests.
Quantifying historical stand conditions on a site-by site basis at a far removed point in time is
not possible with the data currently available. However, by utilizing tree-ring analysis we were
able to reconstruct stand conditions for the last 100 years. The most direct and presumably most
accurate approach to reconstruct pre-settlement vegetation is through the use of live and dead
plant materials (Bonnicksen and Stone 1982). We chose this time frame because there were no
historical fires recorded after 1899 and assessing stand conditions any further back in time would
return biased results due to the loss of the tree record and the confounding effects of past fires.
One hundred years ago these forests were not affected by the changes in the inherent fire
regimes that began shortly after 1900 (Arno et al. 1995).
The goal of this study is to quantify historical diameter distributions, tree densities and
species compositions that were found in the Douglas-fir and ponderosa pine series prior to 1900.
These series include forest stands where Douglas-fir or ponderosa pine are the most shade
tolerant, climax conifer species (Lillybridge et al. 1995, Agee 1994). Historical stocking levels
along with their inherent fire regimes can be used as a benchmark for forest management (Fulé
et al 1997). To define historic conditions we first need to define what we call “historic”.
Information about the specific forest structure and composition of historic stands is limited and
other studies of historic forest conditions in this area have defined historic as early as 1935
(Harrod et al. 1999) and as late as 1956 (Huff et al. 1995). Because fire suppression had
already affected forest structure and composition by the mid 1900’s (Huff et al. 1995, McNeil and
Zobel 1980), we believe an earlier point of reference would better represent historic forest
conditions. By the mid 1900’s these forests were already 4-7 fire intervals out of synchrony with
their inherent fire regime (Ohlson 1996, Everett et al 1999b, Finch 1984).

Unpublished Report
4
SITE SELECTION
In order to sample a wide range of conditions and the various plant association groups
(PAGs) found within the Douglas-fir and ponderosa pine series on the Okanogan National Forest
we stratified these landscapes based on aspect (north-facing or south-facing) and slope (0-30%,
30-50% & >50%). We refer to these aspect and slope pairs as land types. The majority of the
Douglas-fir and ponderosa pine series on the Okanogan NF occurs in the 30–50% slope class;
therefore we focused our sampling within this class. Three or more replicates of each land type
were randomly selected for sampling. These selected land type areas were mapped at the stand
level for canopy cover and evidence of past harvest using 1:16,000 aerial photographs. Stand
crown cover classes used were: <10 %, 10-40%, 40-70% and >70%. We considered stands
having <10% crown cover as being non-forest and eliminated them from the sampling pool.
Sample locations were randomly selected from those areas where past logging or prescribed fire
impacts were minimal or non-existent as past harvest could confound our ability to reconstruct
historical stand conditions. However, we did sample some stands where past timber harvest had
occurred. We included these stands because harvest impacts were limited to a few widely
scattered stumps. A total of 26 stumps were present on 14 of 52 plots. This represents 1.7% of
the 1569 individual items (trees, snags, logs and stumps) recorded on all 52 plots.
Two plot locations were selected randomly within each stand sampled. Occasional
adjustments were made if the plot location was not representative of the overall stand conditions
(i.e. a small rock outcrop, clearing, road, etc.). A total of 52, 1/10th acre fixed radius plots were
installed as follows: 6 on north aspect/>70% cover, 6 on south aspect/>70% cover, 6 on north
aspect/40-70% cover, 6 on south aspect/40-70%, 12 on north aspect/10-40% cover, and 16 on
south aspect/10-40% cover. Based on the variability in total trees per acre observed from 2490
previously installed plots for similar forest types this sampling intensity would provide results with
a 90% confidence interval (+/- 20% of the mean).
FIELD METHODS
On each plot, we recorded the following data: elevation, aspect, percent slope,
topographic position (ridgetop, valley bottom, etc.), plant association, percent crown cover,
Unpublished Report
5
percent cover for indicator shrubs, herbs and grasses, and evidence of biotic and abiotic
disturbances. All live trees were identified to species and measured for diameter (dbh) and
height. Estimates were made for crown diameter and ratio. Increment cores were collected at
breast height on the upslope side of all live trees greater than 2 inches dbh. Cross-sectional
wedges were cut from a subsample of live trees less than 2 inches dbh. In all, 1,192 trees were
cored or sectioned. Snags, logs, and stumps were identified to species and measured for
diameter, height, and decay class. The decay classes used were adapted from Thomas et al.
(1979). A class 1 snag or log is recently dead and class 5 is fully decomposed. Where cut
stumps were present, a minimum of two live trees per species were measured for diameter
outside the bark at breast height (dbh) and at stump height (usually 1-2 feet above the ground) to
determine a ratio to adjust stump diameters to dbh.
To assess historical stand conditions for a site it is essential to know something of the
inherent fire regime. Fire scars were located within sampled land type areas and cut from live
trees, snags, logs and stumps using the methods described by Arno and Sneck (1977). These
fire scar samples provide important information about the historic fire-free interval and the time of
the last fire in each area.
ANALYSIS METHODS
Tree rings were mounted in wooden trays, sanded and examined occularly or with the
aid of a dissecting microscope. Ten-year growth increments were marked and measured using
digital calipers. Diameters at each decadal increment were calculated for the past 100 years (or
the life span for trees less than 100 years). Snag, log, and stump data were adjusted for time
since death. For stumps, the date of harvest was inferred from “release” dates noted on cores of
adjacent trees (Oliver and Larson, 1996) and confirmed by Forest Service harvest records. For
snags and logs, time of death was based on decay class.
Everett et al. (1999a) examined snags and logs resulting from past fires of known dates
and calculated the average time required to reach decay classes 1 through 5 for different species
and size classes. We used this information to infer the mean time since death. For example: an
18” dbh Douglas-fir snag would require an average of 20 years to reach class 3 and 85 years to

Unpublished Report
6
class 5. In this case we would indicate the decay class 3 snag resulted from a tree that died in
1979 and the decay class 5 snag from a tree that died in 1914. Decadal growth increments and
tree diameter would be calculated prior to those times. We based time of death on mean rates of
decay but recognize that these rates may be variable (Harmon et al 1985). To assess the effects
of this variability on overall historical stand density we completed a sensitivity analysis (modified
from Fulé et al. 1997). In this analysis, the number of live trees in the historical stands that were
derived from current snags and logs was increased by 25%, 50%, 75% and 100%. We found no
significant difference (p<0.05) in the overall historical live trees per acre even when increased by
100%. Growth increments for snags, logs, and stumps were inferred from average decadal
growth rates from cored, live trees of the same species, size class, and stand. Growth
increments for live trees less than or equal to 2” dbh were inferred from average decadal growth
rates observed on the cross-sections of trees of the same species and stand. Basal area was
calculated for each tree based on diameter at each decade. Stand conditions are reported in
terms of number of trees and basal area (square feet) per acre.
The exact number of trees in historical stands may never be known, especially in the
smaller size classes. Based on the inherent fire regimes and the difficulty observed in the
successful establishment of natural regeneration for these forests, the number of small trees was
likely to have been low (White 1985). Prior to 1900, most of the small, understory trees that
became established during a short fire-free interval were killed by subsequent fires (Agee 1994).
Historical accounts of forests in this area also make reference to the lack of understory trees
(Plummer 1902, Gorman 1899).
The results of this study were summarized by plant association groups to allow forest
managers to make comparisons and develop management options for other stands in the
Douglas-fir and ponderosa pine series. These PAGs consist of individual plant associations and
are arranged so that similar associations are grouped along a temperature and moisture gradient
(Lillybridge et al. 1995, Williams et al. 1995). The use of PAGs provides a more practical unit of
scale than do individual plant associations (Harrod et al. 1999). While an individual forest stand
may contain areas with different plant associations, that entire stand will typically fall within the

Unpublished Report
7
same PAG. The PAGs and individual plant associations included in this analysis are listed in
Table 1.
Fire scar samples were dated using the cross-dating procedure as described by Stokes
and Smiley (1968). Composite mean fire-free intervals were calculated for each sample land
type area.
RESULTS AND DISCUSSION
Fire History
We examined 40 fire scar samples that recorded a total of 164 fire events to determine
historical fire regimes for each land type area sampled. Composite mean fire-free interval for
each area ranged from a low of 6.3 years to a high of 38 years. The site with the longest historic
fire-free interval (38 years) was dominated by forest stands in the WDTS PAG. Historically,
forests in this PAG experienced a mixed severity fire regime. When fire-free periods were
longer, an increased accumulation of fuel led to areas of higher fire severity. In these areas
some historic fires would burn hotter than others. In all other sampled PAGs mean fire-free
intervals were between 6.3 and 19 years. The last recorded fire for each of the sample areas
were between 1866 and 1898.
Stand Density and Structure
While there was considerable variability among PAGs, there was an overall increase in
tree density, measured in terms of trees/acre and total basal area, between historical and current
conditions (Table 2, Figures 1 and 2). In the WMSH group, there was a substantial decrease in
seedlings (0-1 inch). We believe this difference results from a pulse of seedling establishment
following a documented fire that burned through several of our WMSH stands in 1886. The
WMSH group is the most moist of the PAG’s in the Douglas-fir series (Lillybridge et al. 1995) and
in the absence of disturbance we would expect higher amounts of seedling establishment
compared with the drier PAGs. In the decades following establishment, a portion of the trees in
this post-fire cohort died from competition-induced mortality (White, 1985). Even though there
are fewer seedlings today than were found in 1899, the WMSH group has experienced a 43%

Unpublished Report
8
increase in mean total trees/acre over the last 100 years. Increase in mean total trees/acre in
the other PAGs were: HDSG, +100%; WDSH, +209%; WDTS, +12%; and CDG +92%.
The change in the distribution of trees/acre by diameter class is readily apparent in the
WDSH and CDG groups. A paired t-test of difference for all trees less than 5 inches dbh
indicated a significant increase (p=0.044) over historical levels for plots in the CDG group. In this
PAG, the average number of trees/acre less than 5” dbh increased by 156 (a 217% increase).
The WDSH group also had a significant increase in the number of trees/acre in this size class
(p=0.092). In this PAG, the number of trees less than 5” dbh increased by an average of 201
trees/acre (a 341% increase).
The increase in tree density has not been uniform over the last 100 years. Many stands
reached their maximum density 40 to 50 years ago (Figure 1). McNeil and Zobel (1980) also
noted that by 1960 effective fire suppression had resulted in young trees occupying all growing
space in dry, mixed-conifer forests. The increase in density throughout the early 1900s
represents an understory reinitiation phase of stand development following fire exclusion (Oliver
and Larson 1990, O’Hara et al. 1996). Under the historical fire regime, recruitment of new
cohorts likely occurred in pulses following fires; however, with the exception of a few individuals,
these cohorts would have been destroyed during subsequent fires. In the absence of repeated
fires since 1899, these post-fire cohorts have persisted. Many of these stands are now in a stem
exclusion stage (Oliver and Larson 1990, O’Hara et al. 1996) where total tree density is declining
because of competition for site resources. Arno et al. (1995) also report losses of live trees in
recent decades on plots in similar forest types in western Montana. Losses from timber harvest
were a minor factor in this analysis because the criteria for site selection eliminated stands where
substantial past tree harvest occurred.
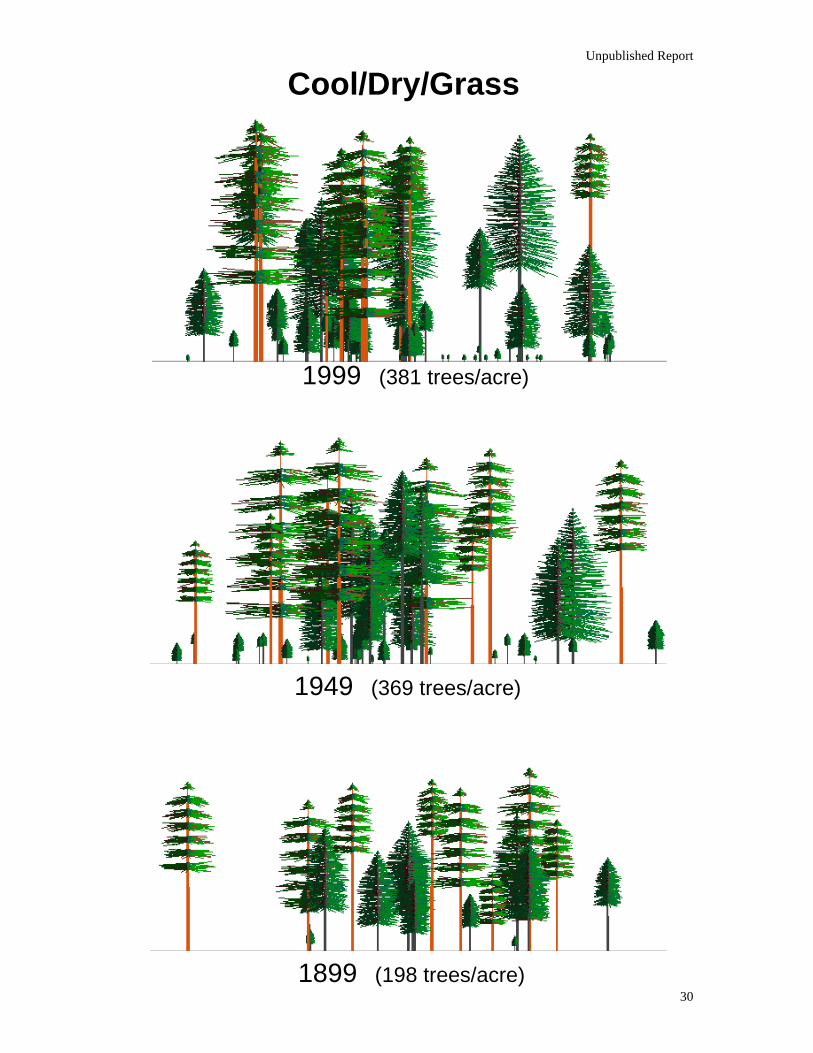
To help visualize conditions for the different PAGs, graphic displays of reconstructions
for representative stands within each PAG were completed using Stand Visualization System
software (McGaughey 1994). These display stand structure, density, and species composition
for conditions in 1999, 1949 and 1899 (Figure 4a-e).
Unpublished Report
9
Basal Area
Even though we found a reduction in tree density over the last 40 to 50 years in all
PAGs, total basal area continues to increase (Figure 2). This increase indicates a shift toward
fewer, but larger trees. Across all PAGs there has been approximately a 250% increase of trees
16 inches DBH and greater during the past 100 years. Current basal areas have increased
significantly (P<0.05) since 1899 in all PAGs. For each of the PAGs the increase in basal area
is: HDSG, 108%; WDSH, 145%; WDTS, 41%; WMSH, 187%; and CDG, 69%. This finding is
similar to those found by Arno et al. (1995) in western Montana.
Species Composition
Mean densities of Douglas-fir and ponderosa pine increased since 1899 in all PAGs.
The only species to significantly decrease (p=0.007) was western larch in the WDTS group. In
this PAG western larch is an early seral species that is predominantly found only in a dominant or
codominant diameter class (Table 2). The increasing density of stands in this PAG has excluded
new cohorts of this very shade-intolerant species (Fiedler and Lloyd 1992, Williams et al. 1995).
Mortality of mature larch has occurred due to increasing competition with Douglas-fir and from
heavy infestations of dwarf mistletoe (Jim Hadfield, pers. comm.). Western larch requires nearly
full sunlight and exposed mineral soil or burned seed-beds for successful regeneration (Schmidt
and Shearer 1995). Historically these conditions were provided by wildfire. Following maximum
historical fire-free intervals, enough time had passed to allow the understory regeneration to
reach sufficient numbers and height to create ladder fuels in some areas. Subsequent fires
would burn with higher intensity and would result in areas of stand replacement where western
larch could become established, which often occur on north aspects (Everett et al. 1999b).
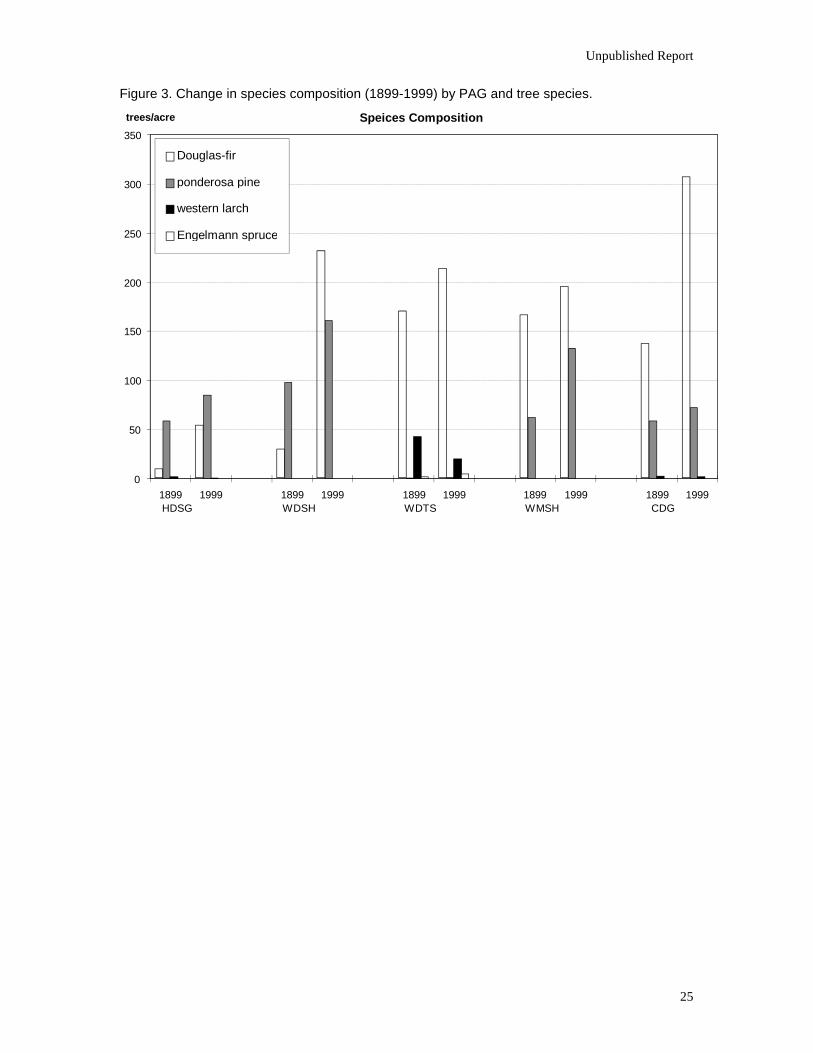
The most notable shift in species composition over the last 100 years has been the
increase in the proportion of Douglas-fir relative to ponderosa pine (Figure 3, Tables 2 and 3).
This shift occurred in all PAGs except the WMSH, where the 1886 fire resulted in the
establishment of a large cohort of Douglas-fir. Ohlson (1996) found similar changes in the
proportions of tree species for current and historical stands in the HDSG group (current Douglas-
fir 41% and ponderosa pine 59%, historical Douglas-fir 21% and ponderosa pine 79%). Our

Unpublished Report
10
findings on historic species compositions are in accord with observations made by Gorman
(1899), were he observed that forests in the ”yellow pine zone” were composed of 85%
ponderosa pine, 12% Douglas-fir and 3% of a few other species.
CONCLUSIONS
The primary reason for the difference between the historical and current stand structure
in these forests has been the change in the disturbance regime. Fire history research in the area
indicates that current conditions reflect an absence of fire that is from 9 to 16 times longer than
at any time since the 16th century (Finch 1984, Ohlson 1996, Everett et al. work in progress).
Forest stand structures and species compositions have been dramatically altered since
1899. All sampled PAGs within the Douglas-fir and ponderosa pine series have had increases in
trees/acre with a shift toward stand domination by a more shade tolerant tree species. Our
conclusions agree with other research in the eastern Cascades indicating current stand density
increases of 2 - 7 fold over historical conditions (Everett et al. 1996, Ohlson 1996, Camp 1999).
The increase is likely a result of decreased mortality of small trees in the absence of fire over the
past century. What were once open stands of predominantly ponderosa pine are now dominated
by a dense layer of Douglas-fir. These younger cohorts have also breached the discontinuity
between ground and crown fuels that existed under the historical disturbance regime, increasing
the potential for stand replacement crown fires.
Where it occurs, western larch is being eliminated. Increased stand density has
resulted in higher rates of mortality for the shade intolerant larch and natural regeneration of this
species in these fully-stocked stands is very unlikely (Schmidt and Shearer 1995). Sampled
areas where larch was present had longer mean composite fire-free intervals than other sampled
areas. This would suggest that higher intensity fires associated with longer fire-free intervals
helped create the canopy openings and seed beds necessary for the establishment of new
cohorts of western larch.
Changes in stand density over the past century reflect the timing of the last historical fire
event in individual stands. Seedling establishment following the last fire continued until stands
were fully stocked by the mid-1900’s. During the past few decades, stand density has decreased

Unpublished Report
11
in many stands while basal area has continued to increase. This competition-induced mortality
has also added to fuel loads in these stands.
Douglas-fir and ponderosa pine forest stands are no longer in synchrony with their
inherent disturbance regimes. Increased stand density predisposes these sites to catastrophic
wildfires or insect and disease outbreaks. Silvicultural thinning from “below”, followed by slash
treatments and prescribed fire are tools that can restore historical forest stand structure and
species composition. These management activities can also be used to reduce the homogeneity
of fuel across the landscape, reducing the potential spread of high severity fires. Where western
larch is being eliminated it will be necessary to create adequate openings to ensure the
successful natural or artificial regeneration and establishment of this seral species (Schmidt and
Shearer 1992). In the long term, these treatments should improve ecosystem integrity by
creating forest structure that is sustainable under the inherent disturbance regime (Agee and
Johnson 1988, Everett et al. 1999b).
Unpublished Report
12
REFERENCES
Agee, J.K. and D.J. Johnson. 1988. Ecosystem management for parks and wilderness.
University of Washington Press, Seattle, WA.
Agee, J.K. 1994. Fire and weather disturbances in terrestrial ecosystems of the eastern
Cascades. Gen. Tech. Rep. PNW-GTR-320. Portland, OR: US Dept. of Agriculture, Forest
Service, Pacific Northwest Research Station. 52p.
Arno, S.F., J.H. Scott and M.G. Hartwell. 1995. Age-class structure of old growth ponderosa
pine/Douglas-fir stands and its relationship to fire history. Res. Pap. INT-RP-481. Ogden, UT:
U.S. Department of Agriculture, Forest Service, Intermountain Research Station. 25 p.
Arno, S.F. and K.M. Sneck. 1977. A method for determining fire history in coniferous forest of the
mountain west. INT-GTR-42. Ogden, UT: U.S. Department of Agriculture, Forest Service,
Intermountain Research Station.
Barrett, J.W. 1978. Height growth and site index curves for managed, even-aged stands of
ponderosa pine in the Pacific Northwest. Res. Pap. PNW-232. Portland, OR: U.S. Department of
Agriculture.
Bonnicksen, T.M. and E.C. Stone. 1982. Reconstruction of a presettlement giant sequoia-mixed
conifer forest community using the aggregation approach. Ecology, 63(4): 1134-1148.
Camp, A.E. 1999. Age structure and species composition changes resulting from altered
disturbance regimes on the eastern slopes of the Cascades Range, Washington. Journal of
Sustainable Forestry, 9(3/4): 39-67.
Covington, W.W. and M.M. Moore. 1994. Southwestern ponderosa forest structure: changes
since Euro-American settlement. J. For. 92: 39-47.

Unpublished Report
13
Cowlin, R.W., P.A. Briegleb, and F.L. Moravets. 1942. Forest resources of the ponderosa pine
region of Washington and Oregon. U.S. Department of Agriculture, Forest Service. Misc. Publ.
#490. 99 p.
Everett, R.L., R. Schellhaas, P. Ohlson, D. Spurbeck and D. Keenum. Work in progress.
Continuity in fire disturbance between riparian and adjacent sideslopes in the Douglas-fir forest
series.
Everett, R.L., J. Lehmkuhl, R. Schellhaas, P. Ohlson, D. Keenum, H. Riesterer and D. Spurbeck.
1999a. Snag dynamics in a chronosequence of 26 wildfires on the east slope of the Washington
Cascades. International Journal of Wildland Fire, 9(4): 223-234.
Everett, R.L., R. Schellhaas, D. Keenum, D. Spurbeck, P. Ohlson. 1999b. Fire History in the
Ponderosa Pine/Douglas-Fir Forests on the East Slope of the Washington Cascades. Forest
Ecology and Management, 129: 207-225.
Everett, R.L., A. Camp and R. Schellhaas. 1996. Building a new forest with fire protection in
mind. In: Proceedings of the Society of American Foresters National Convention, Portland, ME,
Oct. 28 - Nov. 1, 1995. Bethesda, MD, Society of American Foresters. pp. 192-199.
Fiedler, C.E. and D.A. Lloyd. 1992. Autecology and synecology of western larch. In: Schmidt,
W.C. and K.J. McDonald, comps. 1995. Ecology and management of Larix forests: a look ahead.
Proceedings of an international symposium; 1992 October 5-9; Whitefish, MT. Gen. Tech. Rep.
INT-GTR-319. Ogden, UT: U.S. Department of Agriculture, Forest Service, Intermountain
Research Station. 521 p.
Finch, R.B. 1984. Fire history of selected sites on the Okanogan National Forest. Okanogan,
WA: U.S. Department of Agriculture, Forest Service, Okanogan National Forest. 22 p.

Unpublished Report
14
Franklin, J.F. and C.T. Dyrness. 1988. Natural Vegetation of Oregon and Washington. O.S.U.
Press, Corvallis, OR. 452 pp.
Fulè, P.Z., W.W. Covington and M.M. Moore. 1997. Determining reference conditions for
ecosystem management of southwestern ponderosa pine forests. Ecological Applications, 7(3):
895-908.
Gorman, M.W. 1899. Eastern part of the Washington forest reserve. 19th annual report, part V.
Washington D.C. U.S. Department of the Interior, Geological survey. pp. 315-350.
Graham, R.T., A.E. Harvey, T.B. Jain and J.R. Tonn. 1999. The effects of thinning and similar
stand treatments on fire behavior in Western forests. Gen. Tech. Rep. PNW-GTR-463. Portland,
OR: U.S. Department of Agriculture, Forest Service, Pacific Northwest Research Station. 27 p.
Harmon, M.E., J.F. Franklin, F.J. Swanson, P. Sollins, S.V. Gregory, J.D. Lattin, N.H. Anderson,
S.P. Cline, N.G. Aumen, J.R. Sedell, G.W. Lienkaemper, K. Cromack, Jr., and K.W. Cummins.
1985. Ecology of coarse woody debris in temperate ecosystems. Advances in Ecological
Research 15:133-302.
Harrod, R.J., B.H. McRae and W.E. Hartl. 1999. Historical stand reconstruction in ponderosa
pine forests to guide silvicultural prescriptions. Forest Ecology and Management, 114: 433-446.
Huff, M.H., R.D. Ottmar, E. Alvarado, R.E. Vihnanek, J.F. Lehmkuhl, P.F. Hessburg and R.L.
Everett. 1995. Historical and current forest landscapes in eastern Oregon and Washington. Part
II: Linking vegetation characteristics to potential fire behavior and related smoke production.
Gen. Tech. Rep. PNW-GTR-355. Portland, OR: U.S. Department of Agriculture, Forest Service,
Pacific Northwest Research Station. 43 p.

Unpublished Report
15
Lillybridge, T.R., B.L Kovalchik, C.K Williams and B.G. Smith. 1995. Field guide for forested plant
associations of the Wenatchee National Forest. Gen. Tech. Rep. PNW-GTR-359. Portland, OR:
U.S. Department of Agriculture, Forest Service, Pacific Northwest Research Station. 335 p.
McGaughey, B. 1994. Stand visualization system 1.50. Portland, OR: U.S. Department of
Agriculture, Forest Service, Pacific Northwest Research Station.
McNeil, R.C. and D.B. Zobel. 1980. Vegetation and fire history of a ponderosa pine and white fir
forest in Crater Lake National Park. Northwest Science, 54: 30-46.
O’Hara, K.L., P. Latham, P. Hessburg and B. Smith. 1996. A structural classification for inland
northwest forest vegetation. Western Journal of Applied Forestry, 11(3): 97-102.
Ohlson, T.H. 1996. Fire regimes of the ponderosa pine-Douglas-fir/beardless bluebunch
wheatgrass plant association in the Methow Valley of North Central Washington. MS thesis,
Pullman, WA: Washington State University. 87 p.
Oliver, C.D. and B.C. Larson. 1996. Forest stand dynamics. New York, Wiley, 520 pp.
Plummer, F.G., 1902. Forest conditions of the Cascade Range, Washington. Professional paper
No. 6. Series H, Forestry. U.S. Department of Interior, U.S. Geological survey. Gov. printing
office, Washington, DC.
Thomas, J.W., R.G. Anderson, C. Maser and E.L. Bull. 1979. Snags. In: Wildlife habitats in
managed forests, the Blue Mountains of Oregon and Washington (J.W. Thomas, editor). U.S.
Department of Agriculture, Forest Service. Agriculture handbook No. 553. Washington D.C. pp
60-77.

Unpublished Report
16
Schmidt, W.C. and R.C. Shearer. 1992. Larix occidentalis: a pioneer of the North American west.
In: Schmidt, W.C. and K.J. McDonald, comps. 1995. Ecology and management of Larix forests: a
look ahead. Proceedings of an international symposium; 1992 October 5-9; Whitefish, MT. Gen.
Tech. Rep. INT-GTR-319. Ogden, UT: U.S. Department of Agriculture, Forest Service,
Intermountain Research Station. 521 p.
Stokes, M.A. and T.L. Smiley. 1968. An introduction to tree-ring dating. The University of
Chicago Press, Chicago, IL.
White, Alan S. 1985. Presettlement regeneration patterns in a southwestern ponderosa pine
stand. Ecology, 66(2): 589-594.
Williams, C.K., B. Kelly, B. Smith and T. Lillybridge. 1995. Forested plant associations of the
Colville National Forest. Gen. Tech. Rep. PNW-GTR-360. Portland, OR: U.S. Department of
Agriculture, Forest Service, Pacific Northwest Research Station. 375 p.

Unpublished Report
17
LIST OF TABLES
Table 1. Plant Association Groups (PAGs) with respective Plant Associations
Table 2. Mean live trees/acre - 1899 and 1999 by PAG, species and diameter class.
Table 3. Species composition - mean percentage of live trees.
Table 4. Mean change in live trees/acre by species and PAG from 1899 to 1999.

Unpublished Report
18
LIST OF FIGURES
Figure 1. Mean trees/acre by PAG over 100 years.
Figure 2. Mean basal area (ft2/acre) by PAG over 100 years.
Figure 3. Change in species composition (1899-1999) by PAG and tree species.
Figure 4(a-e). Graphic visualizations of stand structure in 1899, 1949 and 1999 for representative
plots within each PAG.

Unpublished Report
19
Table 1. Plant Association Groups (PAGs) with respective Plant Associations
Hot/Dry/Shrub/Grass (HDSG) n=10
Pinus ponderosa/Agropyron spicatum
Pseudotsuga menziesii/Agropyron spicatum
Pinus ponderosa/Purshia tridentata/Agropyron spicatum
Pseudotsuga menziesii/Purshia tridentata/Agropyron spicatum
Pseudotsuga menziesii/Symphoricarpos albus/Agropyron spicatum
Warm/Dry/Shrub/Herb (WDSH) n=10
Pseudotsuga menziesii/Arctostaphylos uva-ursi
Pseudotsuga menziesii/Arctostaphylos uva-ursi/Purshia tridentata
Pseudotsuga menziesii/Spirea betulifolia var. lucida
Warm/Dry/Tall Shrub (WDTS) n=14
Pseudotsuga menziesii/Physocarpus malvaceus
Pseudotsuga menziesii/Physocarpus malvaceus/Linaea borealis var. longiflora
Warm/Mesic/Shrub/Herb (WMSH) n=4
Pseudotsuga menziesii/Symphoricarpos albus
Pseudotsuga menziesii/Symphoricarpos albus/Calamagrostis rubescens
Cool/Dry/Grass (CDG) n=14
Pseudotsuga menziesii/Arctostaphylos uva-ursi/Calamagrostis rubescens
Pseudotsuga menziesii/Purshia tridentata/Calamagrostis rubescens
Pseudotsuga menziesii/Spirea betulifolia var. lucida/Calamagrostis rubescens
(n = number of sample plots)
Mean site index (height in feet) for each PAG are: HDSG 79, CDG 83, WDSH 85, WMSH 91 and
WDTS 92. Site index values are base 100 for ponderosa pine as developed by Barrett (1978).

Unpublished Report
20
Table 2. Mean live trees/acre - 1899 and 1999 by PAG, species and diameter class.
PAG 0-1” 1-5” 5-9” 9-16” 16-25” 25+” Total tpa
1899 1999 1899 1999 1899 1999 1899 1999 1899 1999 1899 1999 1899 1999
HDSG LAOC 0.0 0.0 1.0 0.0 0.0 0.0 1.0 0.0 0.0 1.0 0.0 0.0 2.0 1.0
(n=10) PIPO 5.0 6.0 13.0 14.0 17.0 18.0 14.0 24.0 10.0 18.0 0.0 5.0 59.0 85.0
PSME 1.0 27.0 2.0 5.0 0.0 8.0 3.0 7.0 2.0 5.0 1.0 2.0 9.0 54.0
Total 6.0 33.0 16.0 19.0 17.0 26.0 18.0 31.0 12.0 24.0 1.0 7.0 70.0 140.0
SE 2.6 14.3 2.1 10.3 3.3 9.7 3.3 2.1 2.7 3.0 0.7 1.8 9.7 24.6
WDSH PIPO 16.0 28.0 30.0 42.0 30.0 37.0 15.0 27.0 6.0 24.0 1.0 3.0 98.0 161.0
(n=10) PSME 3.0 135.0 10.0 55.0 2.0 25.0 11.0 10.0 2.0 6.0 1.0 0.0 29.0 231.0
Total 19.0 163.0 40.0 97.0 32.0 62.0 26.0 37.0 8.0 30.0 2.0 3.0 127.0 392.0
SE 4.9 52.3 5.8 18.5 7.9 10.0 4.8 4.1 2.4 2.5 0.9 0.9 6.9 66.6
WDTS LAOC 1.4 0.0 8.6 0.0 10.7 5.7 19.3 7.9 2.1 5.7 0.7 0.7 42.9 20.0
(n=14) PIEN 1.4 2.1 0.7 1.4 0.0 1.4 0.0 0.0 0.0 0.0 0.0 0.0 2.1 5.0
PIPO 0.0 0.7 0.0 0.0 0.0 0.0 0.7 0.0 0.0 0.7 0.0 0.0 0.7 1.4
PSME 19.3 70.0 56.4 47.1 33.6 20.0 46.4 43.6 12.1 30.0 1.4 2.9 169.3 213.6
Total 22.1 72.9 65.7 48.6 44.3 27.1 66.4 51.4 14.3 36.4 2.1 3.6 215.0 240.0
SE 11.7 22.2 17.9 9.9 4.5 7.7 7.9 7.1 2.2 3.5 1.0 1.5 29.7 38.7
WMSH PIPO 25.8 0.0 10.5 22.5 0.0 47.5 18.4 40.0 4.8 20.0 3.0 2.5 62.5 132.5
(n=4) PSME 136.5 22.5 10.5 57.5 11.0 60.0 5.2 40.0 3.2 12.5 0.0 2.5 166.4 195.0
Total 162.3 22.5 21.0 80.0 11.0 107.5 23.6 80.0 8.0 32.5 3.0 5.0 228.9 327.5
SE 7.25 8.85 9.85 3.55 2.8 19.45 0.8 17.7 3.15 5.3 0.35 0 31.9 37.1
CDG LAOC 0.0 0.0 0.7 0.0 1.4 0.0 0.7 2.1 0.0 0.0 0.0 0.0 2.9 2.1
(n=14) PIPO 0.7 14.3 15.0 12.9 19.3 13.6 15.0 14.3 7.1 11.4 1.4 5.7 58.6 72.1
PSME 10.7 97.9 45.0 103.6 50.0 50.0 27.9 43.6 2.9 11.4 0.0 0.0 136.4 306.4
Total 11.4 112.1 60.7 116.4 70.7 63.6 43.6 60.0 10.0 22.9 1.4 5.7 197.9 380.7
SE 4.1 29.1 21.1 22.2 11.9 16.7 6.7 6.8 2.7 3.8 0.6 1.4 31.8 46.0
*n = the number of sampled plots in each PAG SE - Standard Error LAOC - Larix occidentalis - Western Larch PSME - Pseudotsuga menziesii - Douglas-fir
PIPO - Pinus ponderosa - Ponderosa pine PIEN - Picea Engelmannii - Engelmann spruce

Unpublished Report
21
Table 3. Species composition - mean percentage of live trees.
PAG 1899 1999
PSME PIPO LAOC PIEN PSME PIPO LAOC PIEN
HDSG 13 84 3 38 61 1
WDSH 23 77 - 59 41 -
WDTS 78 1 20 1 89 1 8 2
WMSH 72 28 - 60 40 -
CDG 68 30 2 80 19 1
LAOC - Larix occidentalis - Western Larch PIPO - Pinus ponderosa - Ponderosa pine PSME - Pseudotsuga menziesii - Douglas-fir PIEN - Picea Engelmannii - Engelmann spruce

Unpublished Report
22
Table 4. Mean change in live trees/acre by species and PAG from 1899 to 1999.
PAG % change PSME % change PIPO % change LAOC % change PIEN
HDSG +500% +44% -50%
WDSH +696% +64% -
WDTS +26% +100% -53% +138%
WMSH +17% +112% -
CDG +125% +23% -28%
LAOC - Larix occidentalis - Western Larch PIPO - Pinus ponderosa - Ponderosa pine PSME - Pseudotsuga menziesii - Douglas-fir PIEN - Picea Engelmannii - Engelmann spruce

Unpublished Report
23
Figure 1. Mean trees/acre by PAG over 100 years.
Mean Trees/Acre Change
0
100
200
300
400
500
600
700
800
1899 1909 1919 1929 1939 1949 1959 1969 1979 1989 1999year
trees/acre
HDSG
WDSH
WDTS
WMSH
CDG

Unpublished Report
24
Figure 2. Mean basal area, by PAG over 100 years (sq. ft/acre).
Basal Area Change
0
20
40
60
80
100
120
140
160
180
200
1899 1909 1919 1929 1939 1949 1959 1969 1979 1989 1999year
basal area(sq ft/acre)
HDSG
WDSH
WDTS
WMSH
CDG
Unpublished Report
25
Figure 3. Change in species composition (1899-1999) by PAG and tree species.
Speices Composition
0
50
100
150
200
250
300
350
1899 HDSG
1999 1899 WDSH
1999 1899 WDTS
1999 1899 WMSH
1999 1899 CDG
1999
trees/acre
Douglas-fir
ponderosa pine
western larch
Engelmann spruce

Unpublished Report
26
Hot/Dry/Shrub/Grass
1999 (140 trees/acre)
1949 (113 trees/acre)
1899 (70 trees/acre)

Unpublished Report
27
Warm/Dry/Shrub/Herb
1999 (392 trees/acre)
1949 (460 trees/acre)
1899 (127 trees/acre)

Unpublished Report
28
Warm/Dry/Tall Shrub
1999 (240 trees/acre)
1949 (238 trees/acre)
1899 (215 trees/acre)

Unpublished Report
29
Warm/Mesic/Shrub/Herb
1999 (328 trees/acre)
1949 (708 trees/acre)
1899 (229 trees/acre)
Unpublished Report
30
Cool/Dry/Grass
1999 (381 trees/acre)
1949 (369 trees/acre)
1899 (198 trees/acre)