hispanic/latinomarket profilehispanicartscouncilstl.org/hispanic latino market...
TRANSCRIPT

Drawing on Diversity for Successful Marketing
Hispanic/Latino Market Profile


Hispanic/Latino MARKET PROFILE
Dynamics of Changing Populations
As the U.S. population continues to diversify, advertising and
marketing professionals need all the more to understand the changing
markets and major trends affecting their clients/customers, products
and services. Magazine Publishers of America created the Market
Profiles series to provide advertisers, agencies and MPA members
with an in-depth look at demographic groups that are at the core of
the United States’ changing populations.
The Market Profiles gather and synthesize the most recent findings
from dozens of sources in order to help marketers communicate more
effectively with these important consumer segments. The series
includes profiles of the Hispanic/Latino, African-American, Asian-
American and Teen markets.
This profile focuses on the impact of the Hispanic/Latino market,
which is changing at a rapid pace. How is it changing? A few
examples include:
• Population—Estimated to grow 126.4% from 1990 to 2011
• Purchasing power —Estimated to have reached $798 billion
dollars in 2006
• Spending power — Expected to reach $1.2 trillion in 2011,
exceeding the $212 billion reported in 1990 by 457%
The Hispanic/Latino Market Profile provides insights on this
expanding market, offering an overview of Hispanic/Latino
geographic trends, language preference, media use and a roundup
of advertising spending data.
To access additional copies of this and other market profiles, please visit MPA’s
website, www.magazine.org/marketprofiles. For further detail on content, please
e-mail [email protected].
C O N T E N T S
Market Definitions 2
Snapshot of the Hispanic/Latino Market 3
Market Segmentation 4
Language Preference 6
Population Growth Trends
by Country of Origin 7
Areas of Geographic Concentration
by Country of Origin 8
Areas of Geographic Concentration
by U.S. City 9
Consumer Profile 10
Teen and Youth Markets 11
Hispanic/Latino Magazine Readers 12
Hispanic/Latino Magazine Engagement 13
Hispanics/Latinos and Magazine
Advertising Engagement 14
Hispanic/Latino Magazine
Reading Preferences 15
Advertising to the Hispanic/Latino Market 16
Top Advertisers to Hispanics/Latinos 17
Top Hispanic/Latino Advertising Agencies 18
Summary 19
Sources: U.S. Census Bureau; Synovate U.S. Diversity Markets Report 2006; Selig Center’s Multicultural
Economy Report 2006
Hispanic/Latino MARKET PROFILE
www.magazine.org/marketprofiles 1

Hispanic/Latino M A R K E T P R O F I L E
2 www.magazine.org/marketprofiles
Market Definitions
Hispanic: Relating to or derived from the people, speech or culture of Spain or PortugalWidespread usage of the term “Hispanic” dates back to the 1970s, when the Census asked
Hispanics to self-identify as Mexican, Puerto Rican, Cuban, Central/South American or “other
Hispanic.” Origin can be viewed as the heritage, nationality group, lineage, or country of birth
of the person or the person’s parents or ancestors before their arrival in the United States.
People who identify their origin as Spanish, Hispanic, or Latino may be of any race
(Black/African-American, White/Caucasian, Asian, Native American) or mixed race.
Latino: People of “Latin-American” descentWhile the terms Hispanic and Latino are used interchangeably, they do have different
connotations. The Latino National Survey found that 35% of respondents preferred the term
“Hispanic,” whereas 13.4% preferred the term “Latino.” More than 32% of respondents said
either term was acceptable, and 18.1% indicated they did not care.
This report uses both terms to refer to the same group, except when quoting sources directly.
Did You Know? • “Hispanic” is an ethnicity, not a race.
• The Census tracks six races: White, Black, Asian, American Indian/Alaska Native,
Native Hawaiian/Pacific Islander and “some other race.”
• The 2000 Census was the first that allowed Americans to self-identify as multicultural.
Seven million respondents designated themselves as multicultural:
•• 48% of Hispanics identified as “White only”
•• 42% of Hispanics identified as “Some other race”
•• 2% of Hispanics identified as “Black only”
•• 17% of Hispanics also reported belonging to two or more races
Sources: Webster’s 3rd International Dictionary, U.S. Census Bureau 2000; Latino National Survey 2006

Hispanic/Latino MARKET PROFILE
www.magazine.org/marketprofiles 3
Snapshot of the Hispanic/Latino Market
The influence of Hispanics/Latinos is evident throughout American culture: music, dance, food
and fashion are just a few examples of the powerful effect this market segment has on
mainstream America. Given the sheer size and economic impact of the market, it’s no wonder.
Now 44.8 million strong, Hispanics/Latinos are a fast-growing, diverse population in the United
States. With growth surging nearly 58% from 1990 to 2000—more than four times the growth
rate of the U.S. population—and approximately 23% from 2000 to 2006, Hispanics/Latinos
comprised 14.7% of the total population in 2006.
More significantly, the community is expected to keep growing at a strong and steady clip—
by 2010, it is estimated that there will be 50 million Hispanics/Latinos or 16% of the total U.S.
population. By 2050, 28% of the entire U.S. population is projected to be Hispanic/Latino
(estimated to be 122 million).
From 2000 to 2006, the purchasing power of Hispanics/Latinos climbed more than 63% to
$798 billion. By 2011, it will top $1.2 trillion, according to the University of Georgia’s Selig
Center for Economic Growth. The estimated 8.7% compound annual growth from 2000 to
2007 is 80% greater than that of the rest of the U.S. population.
While the challenges of marketing to Hispanics/Latinos are great, largely because of the
range of cultures from which Hispanics/Latinos hail and their varying degree of language
preferences, the opportunities are vast.
Hispanic/Latino Market Opportunities• Size, growth and spending power
• Skews younger than the U.S. population—particularly strong teen market
• Urban population concentrations (roughly 55% of Hispanics/Latinos live in the
top 10 urban areas) allows relatively easy geographic targeting
• Pan-Latino identity: bound by common language (Spanish) and/or common
immigrant experiences
Hispanic/Latino Market Challenges • Hispanics/Latinos hail from 22 different countries—each with its own cultural nuances
• Varying levels of acculturation, language usage and assimilation, which can
influence language preference
Sources: Selig Center for Economic Growth 2006; Synovate U.S. Diversity Markets Report 2006
Hispanic/Latino MARKET PROFILE

Hispanic/Latino M A R K E T P R O F I L E
4 www.magazine.org/marketprofiles
Market Segmentation
Traditionally researchers have segmented the Hispanic/Latino market by country of origin.
Today, however, marketers and their agencies use a variety of factors, including length of
U.S. residency, degree of acculturation and language preference/usage, to determine their
communication strategies.
Hispanic/Latino ResidencyAccording to the Synovate U.S. Markets Report, the average length of residency among
foreign-born Hispanics/Latinos nationally is more than 17 years, while 62% of all foreign-born
Hispanic/Latino adults have lived in the United States 15 years or less. Most foreign-born
Hispanics/Latinos from Puerto Rico, Cuba or the Dominican Republic have lived in the
United States 15 years or longer.
Acculturation LevelsThe Hispanic/Latino market is often divided by levels of acculturation: mostly acculturated or
U.S. dominant; partially acculturated (also called “assimilated” or bicultural); or relatively
unacculturated (“isolated” or Hispanic dominant). Surveys may produce different findings.
For example, the People en Español Hispanic Opinion Tracking (HOT) Study found that of
Hispanics/Latinos in the United States:
• 55% are relatively unacculturated • 23% are partially acculturated• 22% are mostly acculturated
Source: People en Español HOT Study 2006
55%
22%
23%

Hispanic/Latino MARKET PROFILE
www.magazine.org/marketprofiles 5
Hispanics/Latinos with low cultural tension may:• Have friends and family in the
United States
• Seek out exposure to non-Hispanic things
• Feel comfortable among non-Hispanics
Source: Synovate U.S. Diversity Markets Report 2006
Hispanics/Latinos who feel high cultural tension may:• Maintain ties with family and
friends abroad
• Join Hispanic organizations
• Emphasize the uniqueness of Hispanics and Hispanic culture in the United States
Hispanic/Latino Acculturation Levels
Acculturated (minimal to no cultural tension)
9%
28%
21%
17%
19%
6%
0 6 12 18 24 30
Partially Acculturated New Latinos (low cultural tension)
American Latinos (medium cultural tension)
Traditionals (high cultural tension)
Unacculturated Unacculturated Stable (low cultural tension)
Unacculturated Traditionals (medium to high cultural tension)
Source: Synovate U.S. Diversity Markets Report 2006
Market Segmentation continued
On the other hand, according to Synovate’s research, three-quarters of Hispanics/Latinos are
acculturated or partially acculturated; one-quarter fall into the unacculturated category.
Within the three groups—acculturated, partially acculturated and unacculturated—Hispanics
experience differing levels of cultural tension. Synovate uses this concept of cultural tension to
explain why and how people acculturate and to what extent. For example, a new immigrant
without well-developed support mechanisms must learn to survive and thrive in the U.S.
economy. The more unlike the host culture (i.e., the U.S. dominant culture), the more the
immigrant must adapt to resolve the internal conficts about how to work, eat, find shelter,
socialize and realize dreams. As acculturation is necessary to meet these basic needs, tension
builds unless it is resolved, i.e., acculturating.

Hispanic/Latino M A R K E T P R O F I L E
6 www.magazine.org/marketprofiles
Language Preference
As marketers make choices on how to communicate with the Hispanic/Latino market—in
English or Spanish—they often look at the consumer’s first language, physical location, degree
of acculturation and/or age. Bilingualism, especially among acculturated Hispanics/Latinos,
is of particular interest to marketers. It continues to be a point of discussion on whether to
advertise in Spanish or English.
Language use varies widely among Hispanics/Latinos according to whether they are at home
or work. The longer Hispanics/Latinos have lived in the United States, the more likely they
are to speak English primarily.
Source: Synovate U.S. Diversity Markets Report 2006
At Home
Spanish 56%
English 18
Both 26
Source: Hispanic Fact Pack, 2006
Out of Home
Spanish Only 16%
Mostly Spanish 24
English Only 16
Mostly English 33
Both Equally 6
No Answer 5
Source: Hispanic Fact Pack, 2006
Language Preference
First Generation Second Generation
Spanish Dominant 18% 6%
English Dominant 67 80
Bilingual 12 10
No Answer 3 4
Source: Synovate U.S. Diversity Markets Report 2006
Primary Language Among Latinos by Generation in the United States Spoken at Work:
Speaking at Home Speaking at Work
Spanish 56% 31%
English 18 51
Both 26 15
No Answer 0 3
Source: Synovate U.S. Diversity Markets Report 2006
Language Usage by Hispanic Adults
Cheskin Research found that Hispanic/Latino teens respond best to bilingual ad messages—
especially from English-language celebrities “who happen to slip in some Spanish”—because
it mirrors their own usage patterns.
Sources: Synovate U.S. Diversity Markets Report 2006; People en Español HOT Study, 2001

Population Growth Trends by Country of Origin
The three largest Hispanic/Latino nationalities represented in the United States are from
Mexico, Puerto Rico and Cuba. Mexicans represent nearly 67% of the entire Hispanic/Latino
population. However, all of these segments charted double-digit growth surges from 1990 to
2006. Some specific examples to note include:
• The Mexican population segment has grown the most since 1990, steadily increasing
at an overall rate above or near 50%
• Though increasing only 19% from 1990 to 2000, Cuban Hispanics/Latinos showed
the second highest percent of growth of the groups overall between 2000 to 2006,
increasing 37%
• “Other Hispanics” increased 82.7% overall from 1990 to 2006, but experienced
a -7% decrease from 2000 to 2006. This category is extremely diverse, comprised
of 19 countries, which may account for its growth volatility over the years
U.S. Hispanics by Country of OriginCountry 1990 2000 1990-2000 2006 2000-2006
(millions) (millions) Percent Growth (millions) Percent Growth
Mexico 13.5 20.6 53% 30.0 45%
Puerto Rico 2.7 3.4 25 3.9 14
Cuban 1.0 1.2 19 1.7 37
Other Hispanics 5.0 10.0 97 9.3 -7
Source: Synovate U.S. Diversity Markets Report 2006
In terms of Hispanic/Latino market composition, the ranking of the three major groups
within the Hispanic/Latino population did not change from 2000 to 2006. Some specifics
to note include:
• The percentage of the overall Hispanic/Latino population of Mexican descent
increased by 8.3 percentage points
• The percentage of the total Hispanic/Latino population of Puerto Rican descent
decreased by one percentage point, though their total population grew by nearly
500,000 or 14%
U.S. Hispanics by Country of Origin by Percent of Total Hispanic Population1990 2000 2006
Mexico 60.3% 58.5% 66.8%
Puerto Rico 12.2 9.6 8.6
Cuban 4.7 3.5 3.8
Other Hispanic 22.8 28.4 20.8
Source: Synovate U.S. Diversity Markets Report 2006
Hispanic/Latino MARKET PROFILE
www.magazine.org/marketprofiles 7
Sources: Synovate U.S. Diversity Markets Report 2006; Selig Center Multicultural Economy Report 2006
Where Do OtherHispanics/Latinos Hail From?
(millions)
Central America 4.1
South America 2.4
Dominican Republic 1.4
Other 1.5
Source: Synovate U.S. Diversity Markets Report 2006
Did You Know? • By 2011, nearly one person out of every six living in the United States will be
of Hispanic/Latino origin.

Areas of Geographic Concentration by Country of Origin
The three primary country groups show affinities for different regions, creating their own
areas of concentration nationwide. For example, more than three-quarters of all Cubans
reside in the South.
Market clustering allows marketers to capitalize on regional/cultural nuances by fine-tuning
product, distribution and/or ad messaging. For instance, in New England, Cingular Wireless
converted stores to serve the growing Hispanic/Latino consumer market better by converting
signage and communications to both English and Spanish. Bilingual salespeople were
employed to serve customers in both languages and to handle the needs of Hispanic/Latino
consumers. Cingular Wireless took the bilingual concept nationwide, converting more than 420
stores, which were selected according to Hispanic population density in the neighboring area.
Relative to the general population, Hispanic households are much more likely to be located in
metropolitan areas. In the past 10 years, however, Hispanic household growth has been most
heavily concentrated in the suburbs. The number of Hispanic households in the suburbs
nearly doubled between 1993 and 2003; in urban areas, the number of Hispanic households
only increased by half for the same period. Even so, the increase in Hispanic households in
the central cities of metropolitan areas accounted for all of the growth within these cities.
Overall, central cities would have experienced an overall decrease in the number of
households were it not for growth in the Hispanic/Latino population.
Hispanic/Latino M A R K E T P R O F I L E
8 www.magazine.org/marketprofiles
Sources: U.S. Census Bureau 2005; Synovate U.S. Diversity Markets Report 2006; PR Newswire US, 9/20/2006; “HispanicHousing in the United States,” Institute for Latino Studies 2006; U.S. Census Bureau News 8/11/05
Geographic Distribution of Hispanic/Latino PopulationNortheast Midwest South West
Mexican 3% 9% 33% 55%
Cuban 12 3 77 8
Puerto Rican 59 9 26 6
Source: U.S. Census Bureau 2005 Northeast
Midwest
South
West
Key: Central City Suburban Towns Rural
1993 51% 40% 5% 4%
2003 45% 47% 4% 4%
Distribution of Hispanic and Non-Hispanic Households in Urban, Suburban and Non-Metropolitan Towns and Rural Areas, 1993 and 2003
Hispanic
Non-Hispanic1993 30% 47% 8% 15%
2003 28% 51% 7% 14%
Source: “Hispanic Housing in the United States,” Institute for Latino Studies 2006

Areas of Geographic Concentration by U.S. City
Hispanics/Latinos tend to settle in the 10 metropolitan areas listed below. These 10 markets
alone comprise 60% of the entire U.S. Hispanic/Latino population. And, because they number
more than one million in each of the top 10 cities, Hispanic/Latino residents greatly contribute
to the cultural and economic fabric in these locations.
Top 10 U.S. Hispanic/Latino MarketsGeneral Percent of Buying Primary
Population Market Area’s Power Percent U.S. Country of Origin(millions) Rank Population (billions) Born by Market
Los Angeles 8.4 2 46.7% 128 18% Mexico 80%
New York 4.3 1 20.7 78 29 Puerto Rico 31
Miami 2.1 14 48.6 41 14 Cuba 46
Chicago 1.9 3 19.5 31 20 Mexico 81
Houston 1.9 9 33.6 27 26 Mexico 81
San Francisco 1.7 5 23.7 37 16 Mexico 76
Dallas/Fort Worth 1.6 6 24.5 23 20 Mexico 88
Phoenix 1.2 12 26.6 18 20 Mexico 93
San Antonio 1.2 35 53.8 16 57 Mexico 91
Rio Grande Valley 1.1 — — — 42 Mexico 96
Source: Synovate U.S. Diversity Markets Report 2006
Hispanic/Latino MARKET PROFILE
www.magazine.org/marketprofiles 9
Sources: Synovate U.S. Diversity Markets Report 2006
Did You Know? • If the Hispanic/Latino population of the top 10 markets were combined, they would
represent 8.5% of the total U.S. population.
• New York features the greatest diversity of Hispanics/Latinos: 31% are Puerto Rican;
21% are Dominican; 11% are Mexican. Also, Hispanics/Latinos in New York have the
highest level of acculturation and speak English at work most frequently compared
to the rest of the nation.
• Laredo, Texas, has the highest percentage of Hispanic/Latino residents in the entire
United States: 95%.

Hispanic/Latino Consumer Profile: Young andIncreasingly Affluent
The Hispanic/Latino market skews younger than the rest of the U.S. population, giving
advertisers solid access to some of the most coveted demographic groups. The median age
of the Hispanic/Latino population in 2006 was much younger (27.2 years) compared to that of
the population as a whole (36.4 years). In fact, about half of Hispanic/Latino males and
females fall into the 20- to 49-year-old age bracket.
About a third of the Hispanic/Latino population was under 18, compared with one-fourth of
the total population. And with Hispanic/Latino birth rates increasing 75% from 1995 to 2005,
both the Hispanic/Latino and overall youth market are expected to continue to thrive.
While the Hispanic/Latino median income is lower than the U.S. average, sources affirm
that more Hispanics/Latinos are moving into the middle class (earning at least $40,000).
In fact, in the top 85 metropolitan areas in 2001, 14.3% of Hispanics/Latinos aged 18 to 34
earned household incomes of $50,000 or more versus 13.6% of the general population
aged 18 to 34 in the same 85 metropolitan areas.
Also, Hispanics/Latinos are an increasing proportion of the total affluent market (defined as
adults with household incomes of $100,000 or more). From 1991 to 2000, the growth of
affluent Hispanics/Latinos rose 126%.
Hispanic/Latino Median Household Income2003 2006 Percent Change
United States $43,318 $46,326 6.9%
Hispanic/Latino $33,103 $35,967 8.7
Source: U.S. Census Bureau, American Community Survey, August 2006
Hispanic/Latino M A R K E T P R O F I L E
10 www.magazine.org/marketprofiles
Sources: U.S. Census Bureau 2003/2006; Selig Center’s Multicultural Economy Report 2006; Sales & Marketing Management, 2001;Survey Buying Power; Tomas Rivera Policy Institute; American Baby Group 2000; Synovate U.S. Diversity Markets Report 2006
Hispanics/Latinos Median AgeUnited States 36.4
Hispanics/Latinos 27.2
Mexicans 25.5
Puerto Ricans 29.2
Central Americans 28.9
Dominicans 28.6
South Americans 33.5
Spaniards 35.6
Cubans 40.5
Source: U.S. Census Bureau, AmericanCommunity Survey, August 2006
Did You Know? • Seventy-six percent of Hispanics/Latinos in Chicago are employed, followed by
67% in Los Angeles and 64% in New York.
• Eighty-one percent of Hispanic/Latino adults in Miami have completed high school.
Hispanic/Latino Teen and Youth Markets
Teens (12- to 19-year-olds), in general, are sought after as the ultimate consumers and creators of
trends. The Hispanic teen segment may be one of the most important markets for future-oriented
marketers to understand, according to Cheskin Research. Cheskin Research reported that:
Hispanic teens “provide rich insights into larger issues affecting the future of the
American consumer identity. . . . And with a current spending power of $20 billion
and a projected growth rate six times higher than the rest of the teen market,
Hispanic teens are a force in and of themselves.”
The Hispanic/Latino teen influence is evident in virtually every product category, from food
to personal care to fashion. In response, a broad range of companies are playing to Hispanics/
Latinos’ preferences and purchasing power. For example, Neutrogena and Aveeno Active
Naturals, owned by Johnson & Johnson, now offer a scrub, a peel, a night treatment, an eye
cream and moisturizer to attract Hispanic consumers looking for skin care products tailored to
their needs. Hostess brand launched Las Delicias de Hostess in 2005, a line of 10 new snack
cake products catering to the Hispanic/Latino consumer, appearing in San Diego, Dallas and
Phoenix. The new line of snacks features “pastelitos” or cakes flavored with pineapple, strawberry
or chocolate; “panque” or mini-pound cakes, with strawberry and pineapple fillings; cupcakes
with pineapple or “dulce de leche” fillings, and “concha,” a chewy yeast roll with sugar topping.
The Hispanic/Latino culture pulses with music that is routinely at the top of the mainstream
charts and Hispanic/Latino styles permeate American culture. In fact, marketers predict that
Hispanic/Latino-influenced fashion will soon generate at least half the sales of the urban
market (African-American, Hispanic/Latino and/or Asian-American). The Hispanic/Latino focus
on image is also core to this group’s heavy consumption of beauty products.
Hispanic/Latino MARKET PROFILE
www.magazine.org/marketprofiles 11
Sources: Cheskin Research, “Hispanic Teens Are the New Avatars of Cool,” 2006; Selig Center’s Multicultural Economy Report 2006; Cheskin Research, Nuestro Futuro: Hispanic Teens in Their Own Words 2006; Juan Tornoe, Learning to Speak to LatinoComplexions, Hispanic Trending 2006; "New Interstate Bakeries Snacks Target Hispanics”, New York Times, “Latino Style IsCool…” 4-15-01; Kansas City Business Journal 8/2005; Cheskin Research, Nuestro Futuro: Hispanic Teens in Their Own Words,2006; AHAA Knows Latinos Conference 2006; Cheskin Research, The Wonderful and Lucrative Enigma of the Hispanic Teens 2006
Did You Know? • In 2020, the Hispanic/Latino teen market will balloon 62% larger than today—growing
six times faster than the rest of the teen market.
• In 2006, Hispanic/Latino teens constituted 20% (an estimated 6.3 million) of the
U.S. teen population.
• In 2006, Hispanics/Latinos under the age of 20 accounted for more than 38% of the
total Hispanic population in the United States.
• The average percentage of the Hispanic teen population in the top 10 Hispanic/Latino
markets is 43.1%.
• Eighty percent of the teen population in Los Angeles is Hispanic/Latino.

Hispanic/Latino Magazine Readers
More than 75% of adult Hispanics/Latinos read magazines—more than 11 issues read per
month, which is similar to the U.S. average. Mirroring the overall Hispanic/Latino population,
these adult Hispanic/Latino readers are significantly younger, which impacts their income level
and the presence of children at home.
Hispanic/Latino and Total Adult Population Magazine ReadersTotal Adults Hispanic/Latino Adults
Read Magazines 84.3% 75.4%
Average Number of Issues Read in a Month 11.2 11.6
Age
18 – 34 32.3% 53.1%
35 – 49 30.6% 29.4%
50+ 37.1% 17.5%
Median Age 43.7 33.6
Household Income
Median Household Income $56,728 $45,192
Education
Graduated High School or More 87.9% 67.3%
Attended College or More 56.6% 37.2%
Employment
Employed 66.4% 71.5%
Not Employed: Retired 15.4% 5.4%
Home Ownership
Own Home 70.4% 46.5%
Marital Status
Married 56.8% 49.4%
Children <18 Living at Home
1+ Children in Household 41.7% 60.6%
Base: Magazine readers Source: MRI Fall 2006
Hispanic/Latino M A R K E T P R O F I L E
12 www.magazine.org/marketprofiles
Sources: Simmons Market Research Bureau 2005; Teenage Research Unlimited; Telenacion; MRI Fall 2006; NCS/NCHS Fall 2003
Adults Full-Year Unified; Cheskin Research, POV on Growth Strategies—Hispanic Teens, 2006; MRI 2006 Teenmark Study
Did You Know? • Eighty percent of Hispanic/Latino teens are magazine readers, a rate that is similar
to that of total U.S. teens (78%).
• Hispanic/Latino teen magazine readers have a median of $85.64 in spending money
per month, not including spending money from a job—7.4% higher than the median
of $79.72 per month for all U.S. teens.

Hispanic/Latino Magazine Engagement
When looking at consumer engagement across media, researchers have found that Hispanics
engage more with magazines than with other major media. Research conducted by Synovate
Research for the Hispanic Magazine Coalition found that the relationship Hispanics have with
magazines differs from the relationships they have with other media. For example:
• For Hispanics/Latinos, magazines are the medium that most provide practical advice
and “makes me smarter”
• Three out of four (72%) Hispanics/Latinos view TV as an entertaining medium.
However, when answering the question, “How would you compare reading your favorite
magazine to your experience in watching television?,” 75% of Hispanics/Latinos agreed
that they feel that TV is more for “zoning” or “vegging out” than magazines
Hispanic Experiences Across Media Magazines TV Radio Internet
Provides me with practical advice 57% 51% 42% 47%
It makes me smarter 44 37 34 36
It entertains me 63 72 61 52
Source: Synovate Research 2006 for Hispanic Magazine Coalition
The top experiences that drive magazine engagement are similar overall for Hispanics/Latinos
and the general market—six out of the top 10 are the same, particularly when it comes to
experiences of relaxing and sharing information in social situations. A few differences between
Hispanics/Latinos and the general market’s top 10 experiences include:
• Experiences of community and emotional connection rank higher for Hispanics/Latinos
• A desire for accuracy, truth and objectivity ranks higher for the general market
Hispanic/Latino MARKET PROFILE
www.magazine.org/marketprofiles 13
Rank Hispanic Magazine Readers
1 It is a quiet time
2 My goal is to relax with the magazine
3 Gives me something to talk about
4 It features people who make you proud
5 Helps me to see that there are good people in the world
6 I bring up things I’ve read in this magazinein conversations with many other people
7 I show things in this magazine to friends or family members
8 I like to kick back and wind down with the magazine
9 I like to have the magazine around so that others might read it
10 Some articles in this magazine touch me deep down
Note: Bold type indicates statements unique to reader segment.Source: Synovate Research 2006 for Hispanic Magazine Coalition
General Market Readers
I trust magazines to tell the truth
It is a quiet time
I really like the tips in this magazine
I show things in this magazine to friends or family members
Gives me something to talk about
I bring up things I’ve read in this magazine in conversationswith many other people
My goal is to relax with the magazine
I don’t have to worry about accuracy with this magazine
Is unbiased in its reporting
I like to kick back and wind down with the magazine
Ranking of Statements about Favorite Magazine by Level of Engagement
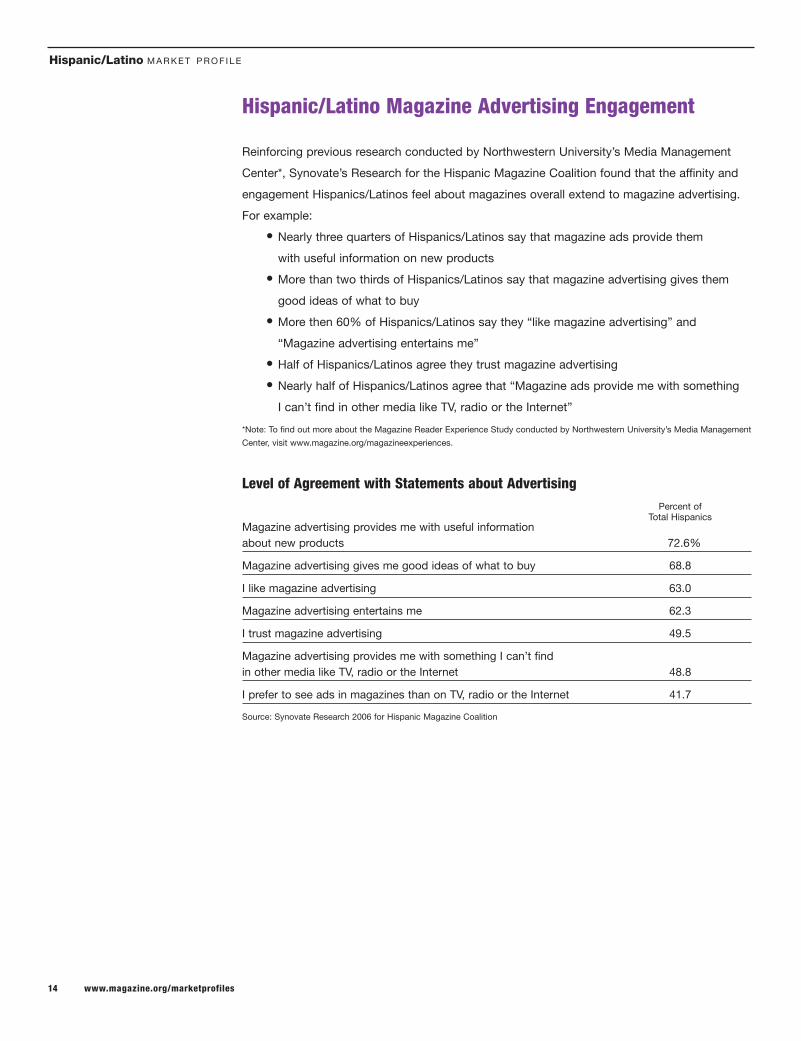
Hispanic/Latino Magazine Advertising Engagement
Reinforcing previous research conducted by Northwestern University’s Media Management
Center*, Synovate’s Research for the Hispanic Magazine Coalition found that the affinity and
engagement Hispanics/Latinos feel about magazines overall extend to magazine advertising.
For example:
• Nearly three quarters of Hispanics/Latinos say that magazine ads provide them
with useful information on new products
• More than two thirds of Hispanics/Latinos say that magazine advertising gives them
good ideas of what to buy
• More then 60% of Hispanics/Latinos say they “like magazine advertising” and
“Magazine advertising entertains me”
• Half of Hispanics/Latinos agree they trust magazine advertising
• Nearly half of Hispanics/Latinos agree that “Magazine ads provide me with something
I can’t find in other media like TV, radio or the Internet”
*Note: To find out more about the Magazine Reader Experience Study conducted by Northwestern University’s Media Management
Center, visit www.magazine.org/magazineexperiences.
Level of Agreement with Statements about AdvertisingPercent of
Magazine advertising provides me with useful information Total Hispanics
about new products 72.6%
Magazine advertising gives me good ideas of what to buy 68.8
I like magazine advertising 63.0
Magazine advertising entertains me 62.3
I trust magazine advertising 49.5
Magazine advertising provides me with something I can’t find in other media like TV, radio or the Internet 48.8
I prefer to see ads in magazines than on TV, radio or the Internet 41.7
Source: Synovate Research 2006 for Hispanic Magazine Coalition
Hispanic/Latino M A R K E T P R O F I L E
14 www.magazine.org/marketprofiles
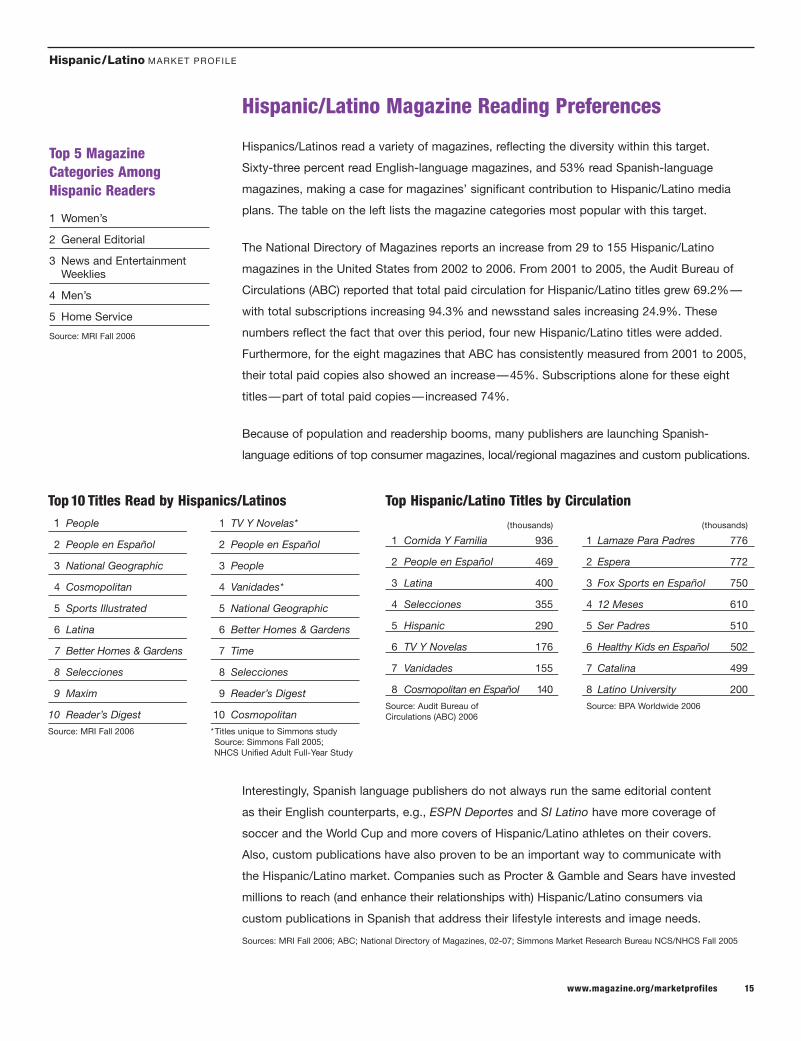
Hispanic/Latino Magazine Reading Preferences
Hispanics/Latinos read a variety of magazines, reflecting the diversity within this target.
Sixty-three percent read English-language magazines, and 53% read Spanish-language
magazines, making a case for magazines’ significant contribution to Hispanic/Latino media
plans. The table on the left lists the magazine categories most popular with this target.
The National Directory of Magazines reports an increase from 29 to 155 Hispanic/Latino
magazines in the United States from 2002 to 2006. From 2001 to 2005, the Audit Bureau of
Circulations (ABC) reported that total paid circulation for Hispanic/Latino titles grew 69.2%—
with total subscriptions increasing 94.3% and newsstand sales increasing 24.9%. These
numbers reflect the fact that over this period, four new Hispanic/Latino titles were added.
Furthermore, for the eight magazines that ABC has consistently measured from 2001 to 2005,
their total paid copies also showed an increase—45%. Subscriptions alone for these eight
titles—part of total paid copies—increased 74%.
Because of population and readership booms, many publishers are launching Spanish-
language editions of top consumer magazines, local/regional magazines and custom publications.
Hispanic/Latino MARKET PROFILE
www.magazine.org/marketprofiles 15
Top 5 MagazineCategories AmongHispanic Readers
1 Women’s
2 General Editorial
3 News and Entertainment Weeklies
4 Men’s
5 Home Service
Source: MRI Fall 2006
Top Hispanic/Latino Titles by Circulation
(thousands) (thousands)
1 Comida Y Familia 936 1 Lamaze Para Padres 776
2 People en Español 469 2 Espera 772
3 Latina 400 3 Fox Sports en Español 750
4 Selecciones 355 4 12 Meses 610
5 Hispanic 290 5 Ser Padres 510
6 TV Y Novelas 176 6 Healthy Kids en Español 502
7 Vanidades 155 7 Catalina 499
8 Cosmopolitan en Español 140 8 Latino University 200
Source: Audit Bureau of Source: BPA Worldwide 2006Circulations (ABC) 2006
Interestingly, Spanish language publishers do not always run the same editorial content
as their English counterparts, e.g., ESPN Deportes and SI Latino have more coverage of
soccer and the World Cup and more covers of Hispanic/Latino athletes on their covers.
Also, custom publications have also proven to be an important way to communicate with
the Hispanic/Latino market. Companies such as Procter & Gamble and Sears have invested
millions to reach (and enhance their relationships with) Hispanic/Latino consumers via
custom publications in Spanish that address their lifestyle interests and image needs.
Sources: MRI Fall 2006; ABC; National Directory of Magazines, 02-07; Simmons Market Research Bureau NCS/NHCS Fall 2005
Top10 Titles Read by Hispanics/Latinos1 People 1 TV Y Novelas*
2 People en Español 2 People en Español
3 National Geographic 3 People
4 Cosmopolitan 4 Vanidades*
5 Sports Illustrated 5 National Geographic
6 Latina 6 Better Homes & Gardens
7 Better Homes & Gardens 7 Time
8 Selecciones 8 Selecciones
9 Maxim 9 Reader’s Digest
10 Reader’s Digest 10 Cosmopolitan
Source: MRI Fall 2006 *Titles unique to Simmons studySource: Simmons Fall 2005; NHCS Unified Adult Full-Year Study

Hispanic/Latino M A R K E T P R O F I L E
16 www.magazine.org/marketprofiles
Advertising to the Hispanic/Latino Market
The potential of the Hispanic/Latino market has advertisers dedicating major dollars to reach
them—and those dollars are growing at a very significant pace. In 2001, advertisers spent
$2.7 billion to reach Hispanics/Latinos through Hispanic/Latino media properties—and in
2005 that spending nearly doubled to close to $4.9 billion. Growth occurred across categories,
ranging from automotive to food, from beverages and candy to financial services. Government,
Politics and Organizations and Automotive are the largest advertising categories.
Top10 Advertising Categories Hispanic Media General MediaDollars Percent of Dollars Percent of
Rank (millions) Media Share Rank (millions) Media Share
Government, Politics and Organizations 1 617.1 12.7% 13 3,790.0 2.9%
Automotive, Automotive Accessories and Equipment 2 502.9 10.4 1 13,709.7 10.4
Direct Response Companies 3 493.8 10.2 8 5,483.3 4.1
Communications 4 349.5 7.2 4 7,690.3 5.8
Audio and Video Equipment and Supplies 5 334.1 6.9 17 1,918.0 1.4
Retail 6 308.8 6.4 2 12,262.0 9.3
Restaurants 7 221.8 4.6 12 4,532.6 3.4
Miscellaneous Services and Amusements 8 187.4 3.9 7 6,579.2 5.0
Media and Advertising 9 165.1 3.4 3 8,858.4 6.7
Financial 10 132.8 2.7 5 7,507.9 5.7
Total of Top Ten Categories 3,313.3 68.3 72,331.5 54.7
Total of All Categories 4,851.9 100.0 132,277.3 100.0
Source: TNS Media Intelligence 2007. Hispanic media include Spanish language network TV (3 networks); and Spanish language cable (1 network), Spanish language spot TV (43 stations), Hispanic magazines (42 publications), and Hispanic newspapers (61 publications)
According to 2006 estimates released by the Bureau of Labor Statistics, in 2004, Hispanics/
Latinos spent more per household on the following categories than non-Hispanic/Latino
consumers: groceries, phone services, major appliances, vehicles, children’s clothing,
and footwear. In addition:
• Hispanics/Latinos are 14% more likely to plan to purchase a new car in the next two
years than the general population
• The average Hispanic/Latino family spends 46% more on weekly groceries than
the general market
• While total telecom spending is expected to rise 5.2% between 2006 and 2011,
telecom spending by Hispanics/Latinos is set to jump more than 7%
Sources: TNS Media Intelligence; Advertising Age; Selig Center’s Multicultural Economy Report 2006; Marketing to the Emerging Majorities; People en Español HOT Study, Hispanic Opinion Tracker 2005; Wachovia, “The Next Demographic Boom” 2006; The Insight Research Group

Top10 Magazine Advertisers to the Hispanic/Latino Market
Most of the top spending brands targeting Hispanics/Latinos reflect the categories with the
highest spending to this market, including automotive, retail, media and entertainment and
telecommunications.
Hispanic/Latino MARKET PROFILE
www.magazine.org/marketprofiles 17
Top 10 Advertisers to Hispanics/LatinosCompany 2005 (millions)
Lexicon Marketing Corporation $ 182.5
Procter & Gamble Company 159.9
Univision Communications Inc. 158.2
General Motors Corporation 110.9
Sears Holdings Corporation 84.8
Johnson & Johnson 70.8
McDonalds Corporation 69.4
Pepsico Inc. 68.6
Cisneros Group of Companies 67.9
Ford Motor Company 66.4
Source: TNS Media Intelligence 2007
Top 10 Hispanics/Latinos Magazine AdvertisersCompany 2005 (millions)
Procter & Gamble Company $7.2
General Motors Corporation 6.4
DaimlerChrysler AG 3.3
U.S. Government 3.1
Johnson & Johnson 3.1
Ford Motor Company 2.4
L'Oreal SA 1.9
McDonalds Corporation 1.6
Grupo Televisa SA 1.6
Kimberly-Clark Corporation 1.5
Source: TNS Media Intelligence 2007

Top10 Hispanic/Latino Ad Agencies by U.S. Revenue
Based on the growth of the Hispanic/Latino market, many marketers are forging relationships
with Hispanic/Latino advertising agencies to insure success, resulting in an increase in both
the number of ad agencies and billings. In 2004, the total revenue for the top 10 agencies was
$235 million. In 2005, the revenue for the top 10 rose to $267 million—a gain of 13.6%.
Also of interest are the locations of these agencies—the top 10 generally can be found in the
same locations as those with the highest Hispanic/Latino populations.
Top 10 Hispanic/Latino Advertising Agency Revenue 20052005 Revenue Percent of Change
Agency Headquarters (millions) 2004-2005
Bromley Communications San Antonio 40.0 1.3%
Bravo Group New York 39.4 5.1
GlobalHue Southfield, MI 36.3 17.5
Dieste, Harmel and Partners Dallas 35.0 12.9
Vidal Partnership New York 23.9 84.2
Accentmarketing Coral Gables, FL 21.0 15.6
Lopez Negrete Communications Houston 20.3 22.7
Lapiz Chicago 18.2 11.7
Zubi Advertising Services Coral Gables, FL 18.0 5.9
La Agenica de Orci and Asociados Los Angeles 15.2 7.9
Source: Figures are Advertising Age estimates, May 2005 and May 2006
Hispanic/Latino MARKET PROFILE
18 www.magazine.org/marketprofiles

Summary
The Hispanic/Latino market has already influenced many facets of American
culture overall—and its impact is projected to increase, given the market’s
estimated growth. As a result, advertisers and marketers will likely continue
to recognize, study and communicate with the Hispanic/Latino population in
order to be effective.
The Hispanic/Latino Market Profile offers advertisers and marketers an
overview of key facets of the Hispanic/Latino market, providing insights on
how to evolve marketing efforts to reach this group successfully.
As more information becomes available, updates will be featured on the MPA
website at www.magazine.org/marketprofiles.
For additional copies of this document or for information on other MPA Market
Profiles and resources, please contact MPA at [email protected].
Hispanic/Latino MARKET PROFILE
www.magazine.org/marketprofiles 19
Acknowledgment
Special thanks to Mediamark Research Inc. and Quebecor World for their
generous support of the Hispanic/Latino Market Profile.
Cover photos courtesy of Getty Images.
Front cover, left to right: 200417498-001/Photodisc Red/Phil Boorman; 57443034/Stockdisc Premium/Stockdisc;
10142604/The Image Bank/Brooklyn Productions; 57448736/Stockbyte Platinum/Stockbyte; skd25342sdc/Stockdisc
Premium/Stockdisc; 3701-001976/Photonica/Veer Florian Franke; 10159978/Riser/China Tourism Press.
Back cover, left to right: 6476-000229/photonica/john-francis bourke; 200409493-002/Iconica/Jerome Tisne;
WA4903-001/Allsport Concepts/Mike Powell; 200156747-001/Image Bank/Todd Pearson; 200255530-004/Stone/Erik Dreyer;
10196150/Image Bank/Julia Fishkin; 6528-000440a/Photonica/White Packert.

Additional MPA Resources
Market Profiles (available at www.magazine.org/marketprofiles)
In addition to the Hispanic/Latino Market Profile, MPA also offers profiles that
consolidate advertising and media usage research on the African-American,
Asian-American and Teen markets.
Magazine Handbook provides facts and figures about how magazines—
alone or with other media—can help advertisers achieve marketing goals.
Accountability: A Guide to Measuring ROI and ROO Across Mediaprovides an easy-to-understand overview of accountability: what it is, how it
is measured, and what has been learned to date.
Engagement: Understanding Consumers’ Relationships with Mediaaddresses how consumers connect with advertising-supported media:
television, newspapers, radio, the Internet and magazines.
Case Studies (more than 100 available at www.magazine.org/casestudies)showcase how advertisers across categories have successfully used magazines.
Additional resources on accountability, engagement, readership and circulation
are available at www.magazine.org or by e-mailing [email protected].
Magazine Publishers of America
810 Seventh Avenue, 24th Floor
New York, NY 10019
212.872.3700
www.magazine.org
Hispanic/Latino Market Profile© Copyright 2007 Magazine Publishers of America
Hispanic/Latino MARKET PROFILE
20 www.magazine.org/marketprofiles


What makes us UNIQUE makes us Extraordinary
Ideas. Perspective. Talents. Individuality.
The attributes that make an individual unique
are crucial to making a magazine successful. That’s why the magazine industry
is committed to valuing—and reflecting— the unique qualities
that every person has to offer.
Find out how magazines engage across cultures at
www.magazine.org/diversity.
www.magazine.org