highway safety plan - virginia department of transportation · old dominion university ... virginia...
TRANSCRIPT


2012-2016 strategic highway safety plan
Commonwealth of Virginia
2012-2016 STRATEGICHIGHWAY SAFETY PLAN

2012-2016 strategic highway safety plan
Thank YouThe update of Virginia’s Strategic Highway Safety Plan (SHSP) was accomplished through the hard work and dedication of safety stakeholders throughout the Commonwealth. The Virginia Department of Transportation extends a sincere thank you to the following agen-cies and organizations that took the time to comment and shape the future of transporta-tion safety in Virginia.AAA Mid-Atlantic
AAA Tidewater
Accomack Public Schools
Arlington Department of Transportation
Capital Concrete
Chesapeake Health Department
Chesterfield County Police Department
Children’s Hospital of Richmond
City of Richmond
Davis Corner Volunteer Fire/Rescue
Eastern Virginia Medical School
Fairfax Advocates for Better Bicycling
Fairfax County Department of Transportation
Federal Highway Administration
Hampton Roads TransportationPlanning Organization
Inova Fairfax Hospital
Isle of Wight County
James River High School
Martin Enterprises & Associates
Metropolitan Washington Council of Governments
Mothers Against Drunk Driving
National Highway Traffic Safety Administration,Region III
National Motorists Association
Newport News Police Department
New Kent County Sheriff’s Office
New River Valley Planning District Commission
Northern Virginia Regional Commission
Office of the Chief Medical Examiner
Old Dominion University
Roanoke Police Department
Rockingham County Public Schools
Suffolk Police Department
URS Corporation
VCU/Transportation Safety Center
Virginia Alcohol Safety Action Program
Virginia Association of Chiefs of Police
Virginia Bicycling Federation
Virginia Center for TransportationInnovation & Research
Virginia Department of Education
Virginia Department of Fire Programs
Virginia Department of Health
Virginia Department of Motor Vehicles
Virginia Department of Railand Public Transportation
Virginia Department of Transportation
Virginia Office of Emergency Medical Services
Virginia State Police
VHB | Vanasse Hangen Brustlin, Inc.
Washington Regional Alcohol Program
Wythe County Sheriff’s Office
YOVASO

2012-2016 strategic highway safety plan
Table of Contents
Background . . . . . . . . . . . . . . . . . . . . . . . . . . . . . . . . . . . . . . . . . . . . . . . . . . . . . . 2
Updating Virginia’s Strategic Highway Safety Plan . . . . . . . . . . . . . . . . . . . . . . . . . . . . . . . . . . . 4
State of Traffic Safety in Virginia in 2012 . . . . . . . . . . . . . . . . . . . . . . . . . . . . . . . . . . . . . . 4
The SHSP Update Process . . . . . . . . . . . . . . . . . . . . . . . . . . . . . . . . . . . . . . . . . . . . . 6
2012 to 2016 SHSP Plan Elements . . . . . . . . . . . . . . . . . . . . . . . . . . . . . . . . . . . . . . . . . . . 9
Speeding Emphasis Area Plan . . . . . . . . . . . . . . . . . . . . . . . . . . . . . . . . . . . . . . . . . . . . 10
Overview . . . . . . . . . . . . . . . . . . . . . . . . . . . . . . . . . . . . . . . . . . . . . . . . . . . . 10
The Problem . . . . . . . . . . . . . . . . . . . . . . . . . . . . . . . . . . . . . . . . . . . . . . . . . . 10
Objectives . . . . . . . . . . . . . . . . . . . . . . . . . . . . . . . . . . . . . . . . . . . . . . . . . . . . 12
The Solution . . . . . . . . . . . . . . . . . . . . . . . . . . . . . . . . . . . . . . . . . . . . . . . . . . 13
Young Driver Emphasis Area Plan . . . . . . . . . . . . . . . . . . . . . . . . . . . . . . . . . . . . . . . . . . 14
Overview . . . . . . . . . . . . . . . . . . . . . . . . . . . . . . . . . . . . . . . . . . . . . . . . . . . . 14
The Problem . . . . . . . . . . . . . . . . . . . . . . . . . . . . . . . . . . . . . . . . . . . . . . . . . . 14
Objectives . . . . . . . . . . . . . . . . . . . . . . . . . . . . . . . . . . . . . . . . . . . . . . . . . . . . 16
The Solution . . . . . . . . . . . . . . . . . . . . . . . . . . . . . . . . . . . . . . . . . . . . . . . . . . 17
Occupant Protection Emphasis Area Plan . . . . . . . . . . . . . . . . . . . . . . . . . . . . . . . . . . . . . . 18
Overview . . . . . . . . . . . . . . . . . . . . . . . . . . . . . . . . . . . . . . . . . . . . . . . . . . . . 18
The Problem . . . . . . . . . . . . . . . . . . . . . . . . . . . . . . . . . . . . . . . . . . . . . . . . . . 18
Objectives . . . . . . . . . . . . . . . . . . . . . . . . . . . . . . . . . . . . . . . . . . . . . . . . . . . . 20
The Solution . . . . . . . . . . . . . . . . . . . . . . . . . . . . . . . . . . . . . . . . . . . . . . . . . . 21
2012-2016 strategic highway safety plan
Table of Contents (Continued)
Impaired Driving Emphasis Area Plan . . . . . . . . . . . . . . . . . . . . . . . . . . . . . . . . . . . . . . . . 22
Overview . . . . . . . . . . . . . . . . . . . . . . . . . . . . . . . . . . . . . . . . . . . . . . . . . . . . 22
The Problem . . . . . . . . . . . . . . . . . . . . . . . . . . . . . . . . . . . . . . . . . . . . . . . . . . 22
Objectives . . . . . . . . . . . . . . . . . . . . . . . . . . . . . . . . . . . . . . . . . . . . . . . . . . . . 24
The Solution . . . . . . . . . . . . . . . . . . . . . . . . . . . . . . . . . . . . . . . . . . . . . . . . . . 25
Roadway Departure Emphasis Area Plan . . . . . . . . . . . . . . . . . . . . . . . . . . . . . . . . . . . . . . . 26
Overview . . . . . . . . . . . . . . . . . . . . . . . . . . . . . . . . . . . . . . . . . . . . . . . . . . . . 26
The Problem . . . . . . . . . . . . . . . . . . . . . . . . . . . . . . . . . . . . . . . . . . . . . . . . . . 26
Objectives . . . . . . . . . . . . . . . . . . . . . . . . . . . . . . . . . . . . . . . . . . . . . . . . . . . . 28
The Solution . . . . . . . . . . . . . . . . . . . . . . . . . . . . . . . . . . . . . . . . . . . . . . . . . . 29
Intersection Emphasis Area Plan . . . . . . . . . . . . . . . . . . . . . . . . . . . . . . . . . . . . . . . . . . 30
Overview . . . . . . . . . . . . . . . . . . . . . . . . . . . . . . . . . . . . . . . . . . . . . . . . . . . . 30
The Problem . . . . . . . . . . . . . . . . . . . . . . . . . . . . . . . . . . . . . . . . . . . . . . . . . . 30
Objectives . . . . . . . . . . . . . . . . . . . . . . . . . . . . . . . . . . . . . . . . . . . . . . . . . . . . 32
The Solution . . . . . . . . . . . . . . . . . . . . . . . . . . . . . . . . . . . . . . . . . . . . . . . . . . 33
Data Emphasis Area Plan . . . . . . . . . . . . . . . . . . . . . . . . . . . . . . . . . . . . . . . . . . . . . . 34
Overview . . . . . . . . . . . . . . . . . . . . . . . . . . . . . . . . . . . . . . . . . . . . . . . . . . . . 34
The Solution . . . . . . . . . . . . . . . . . . . . . . . . . . . . . . . . . . . . . . . . . . . . . . . . . . 34
Implementation and Evaluation . . . . . . . . . . . . . . . . . . . . . . . . . . . . . . . . . . . . . . . . . . . 36
Leadership and Collaboration . . . . . . . . . . . . . . . . . . . . . . . . . . . . . . . . . . . . . . . . . . 36
Evaluation . . . . . . . . . . . . . . . . . . . . . . . . . . . . . . . . . . . . . . . . . . . . . . . . . . . 37
Marketing and Communications . . . . . . . . . . . . . . . . . . . . . . . . . . . . . . . . . . . . . . . . . 37
Funding . . . . . . . . . . . . . . . . . . . . . . . . . . . . . . . . . . . . . . . . . . . . . . . . . . . . . 37
Appendix . . . . . . . . . . . . . . . . . . . . . . . . . . . . . . . . . . . . . . . . . . . . . . . . . . . . . . 38
SHSP Steering Committee . . . . . . . . . . . . . . . . . . . . . . . . . . . . . . . . . . . . . . . . . . . . 38

2012-2016 strategic highway safety plan
List of Figures
Figure 1. Virginia Traffic Deaths and Severe Injuries 2001 to 2010 . . . . . . . . . . . . . . . . . . . . . . . . . . . 4
Figure 2. Virginia Average Annual Deaths By Highway System, 2001 to 2010 . . . . . . . . . . . . . . . . . . . . . . 5
Figure 3. Virginia Average Annual Severe Injuries By Highway System, 2001 to 2010 . . . . . . . . . . . . . . . . . . 5
Figure 4. Virginia Average Annual Deaths By Roadway Type, 2001 to 2010 . . . . . . . . . . . . . . . . . . . . . . . 5
Figure 5. Virginia Deaths and Severe Injuries Percent of Total, 2005 to 2008 . . . . . . . . . . . . . . . . . . . . . . . 6
Figure 6. Traffic Death (2001 to 2010) and Goals (2011 to 2016) . . . . . . . . . . . . . . . . . . . . . . . . . . . . 8
Figure 7. Traffic Severe Injuries (2001 to 2010) and Goals (2011 to 2016) . . . . . . . . . . . . . . . . . . . . . . . 8
Figure 8. Percentage of Deaths and Severe Injuries 2005 to 2008 . . . . . . . . . . . . . . . . . . . . . . . . . . . . 9
Figure 9. Virginia Speeding Deaths and Severe Injuries 2001 to 2010 . . . . . . . . . . . . . . . . . . . . . . . . . 10
Figure 10. Virginia Speeding Deaths and Severe Injuries By Driver Age and Gender, 2001 and 2010 . . . . . . . . . . 11
Figure 11. Virginia Speeding Deaths and Severe Injuries By Location, 2001 to 2010 . . . . . . . . . . . . . . . . . . 11
Figure 12. Virginia Speeding-Related Deaths and Severe Injuries By Month, 2001 to 2010 . . . . . . . . . . . . . . . 12
Figure 13. Virginia Speeding Deaths and Severe Injuries By Collision Type, 2001 to 2010 . . . . . . . . . . . . . . . 12
Figure 14. Objectives Virginia Speeding Deaths and Severe Injuries, 2010 to 2016 . . . . . . . . . . . . . . . . . . . 12
Figure 15. Virginia Young Driver Involved Deaths 2001 to 2010 . . . . . . . . . . . . . . . . . . . . . . . . . . . . 14
Figure 16. Virginia Young Driver Involved Severe Injuries 2001 to 2010 . . . . . . . . . . . . . . . . . . . . . . . . 14
Figure 17. Young Driver Involved Deaths and Severe Injuries By Driver Gender, 2001 to 2010 . . . . . . . . . . . . . 15
Figure 18. Young Driver Involved Death and Severe Injuries, 2001 to 2010 . . . . . . . . . . . . . . . . . . . . . . 15
Figure 19. Young Driver Involved Deaths and Severe Injuries By Month, 2001 to 2010 . . . . . . . . . . . . . . . . . 16
Figure 20. Young Driver Involved Deaths and Severe Injuries By Collision Type, 2001 to 2010 . . . . . . . . . . . . . 16
Figure 21. Objectives Virginia Young Driver Involved Deaths and Severe Injuries, 2010 to 2016 . . . . . . . . . . . . 16
Figure 22. Unrestrained Deaths and Severe Injuries 2001 to 2010 . . . . . . . . . . . . . . . . . . . . . . . . . . . 18
Figure 23. Unrestrained Deaths and Severe Injuries By Driver Age and Gender, 2001 to 2010 . . . . . . . . . . . . . 19
Figure 24. Unrestrained Deaths and Severe Injuries By Location, 2001 to 2010 . . . . . . . . . . . . . . . . . . . . 19

2012-2016 strategic highway safety plan
List of Figures (Continued)
Figure 25. Unrestrained Deaths and Severe Injuries By Month, 2001 to 2010 . . . . . . . . . . . . . . . . . . . . . 20
Figure 26. Unrestrained Deaths and Severe Injuries By Collision Type, 2001 to 2010 . . . . . . . . . . . . . . . . . 20
Figure 27. Objectives – Virginia Unrestrained Deaths and Severe Injuries 2010 to 2016 . . . . . . . . . . . . . . . . 20
Figure 28. Virginia Safety Belt Use Objective . . . . . . . . . . . . . . . . . . . . . . . . . . . . . . . . . . . . . 20
Figure 29. Alcohol Impaired Driving Deaths and Severe Injuries 2001 to 2010 . . . . . . . . . . . . . . . . . . . . 22
Figure 30. Alcohol Impaired Deaths and Severe Injuries By Driver Age and Gender, 2001 to 2010 . . . . . . . . . . . 23
Figure 31. Alcohol Impaired Deaths and Severe Injuries By Location, 2001 to 2010 . . . . . . . . . . . . . . . . . . 23
Figure 32. Alcohol Impaired Driving Deaths and Severe Injuries By Month, 2001 to 2010 . . . . . . . . . . . . . . . 24
Figure 33. Alcohol Impaired Driving Deaths and Severe Injuries By Collision Type, 2001 to 2010 . . . . . . . . . . . 24
Figure 34. Objectives Virginia Alcohol Impaired Deaths and Severe Injuries, 2010 to 2016 . . . . . . . . . . . . . . . 24
Figure 35. Roadway Departure Deaths and Severe Injuries 2001 to 2010 . . . . . . . . . . . . . . . . . . . . . . . 26
Figure 36. Roadway Departure Deaths and Severe Injuries By Driver Age and Gender, 2001 to 2010 . . . . . . . . . . 27
Figure 37. Roadway Departure Deaths and Severe Injuries By Location, 2001 to 2010 . . . . . . . . . . . . . . . . . 27
Figure 38. Roadway Departure Deaths and Severe Injuries By Month, 2001 to 2010 . . . . . . . . . . . . . . . . . . 28
Figure 39. Roadway Departure Deaths and Severe Injuries By Collision Type, 2001 to 2010 . . . . . . . . . . . . . . 28
Figure 40. Objectives Virginia Roadway Departure Deaths and Severe Injuries, 2010 to 2016 . . . . . . . . . . . . . 28
Figure 41. Intersection Deaths and Severe Injuries 2001 to 2010 . . . . . . . . . . . . . . . . . . . . . . . . . . . 30
Figure 42. Intersection Deaths and Severe Injuries By Driver Age and Gender, 2001 to 2010 . . . . . . . . . . . . . . 31
Figure 43. Intersection Deaths and Severe Injuries By Location, 2001 to 2010 . . . . . . . . . . . . . . . . . . . . . 31
Figure 44. Intersection Deaths and Severe Injuries By Month, 2001 to 2010 . . . . . . . . . . . . . . . . . . . . . . 32
Figure 45. Intersection Deaths and Severe Injuries By Collision Type, 2001 to 2010 . . . . . . . . . . . . . . . . . . 32
Figure 46. Objectives Virginia Intersection Deaths and Severe Injuries, 2010 to 2016 . . . . . . . . . . . . . . . . . 32
Figure 47. Virginia SHSP Organization Chart . . . . . . . . . . . . . . . . . . . . . . . . . . . . . . . . . . . . . 36

2012-2016 strategic highway safety plan
Executive Summary
In 2011, Virginia made a decision to examine the State’s Strategic Highway Safety Plan (SHSP) and determined the need for the plan to be updated. The SHSP is a statewide document that provides a comprehensive approach aimed at reducing deaths and severe injuries on all of Virginia’s public roads. The plan is the result of a collaborative effort developed in partnership with representatives from Federal, state, regional, and local levels along with private-sector stakeholders. This update builds on the first SHSP created in consultation with safety stakeholders in 2006. Since then, traffic deaths in Virginia have fallen by 23 percent and severe injuries have decreased by 45 percent.
With the significant reductions in deaths and severe inju-ries, Virginia took this opportunity to reexamine the latest safety data and identify areas where improvements hold the greatest potential for continuing the progress. The plan addresses roadway environment, driver behavior, and the response to incidents by integrating the 4 E’s of transpor-tation safety: engineering, enforcement, education, and emergency response. Based on the review of safety data, Virginia identified the following seven emphasis areas for the updated plan:
» Speeding
» Young Drivers
» Occupant Protection
» Impaired Driving
» Roadway Departures
» Intersections
» Data Collection, Management, and Analysis
» Raise public awareness and enhance education to develop a safer driving culture; » Focus on young drivers, aggressive drivers, impaired drivers, and unrestrained occupants through education, enforce-ment, and adjudication;
» Improve intersection safety for all users; » Keep vehicles on the roadway and minimize the consequences if they depart the roadway; and » Continue to improve safety-related data collection, management, and analysis to target resources where they will have the most benefit.
The updated plan’s goal is to reduce deaths and severe injuries by half by 2030, which is consistent with the goal for the Toward Zero Deaths: a National Strategy on Highway Safety. Virginia has adopted Toward Zero Deaths (TZD) as the vision for the SHSP. To achieve that vision, emphasis area teams met to establish measurable objectives for deaths and severe inju-ries, and determined the strategies and action steps in the plan to achieve these objectives. The updated SHSP also initiates a comprehensive evaluation plan to track progress and effectiveness.Virginia now has a better understanding of what improvements are necessary to achieve continued reductions in crashes. The plan addresses all aspects of traffic safety, including the events before, during, and after crashes to achieve the highest level of road safety. The primary strategies identified to reduce deaths and injuries on Virginia’s highways are:
1

2012-2016 strategic highway safety plan2
Virginia’s Strategic Highway Safety Plan, or SHSP, is a statewide, comprehensive safety plan that provides a coordinated framework for reducing deaths and severe injuries on all of Virginia’s public roads. The SHSP strategically establishes statewide goals and identifies critical emphasis areas which were developed in con-sultation with Federal, state, local, and private-sector safety stakeholders. Highway safety is critically important to Virginia’s trans-portation system. The vision and goals of Virginia’s multimodal long-range transportation plan (VTRANS 2035) include highway safety along with the key mea-sures from the SHSP to reduce traffic injuries and deaths in Virginia. Virginia believes every roadway user should arrive safely at their destination. That is why the Commonwealth adopted Toward Zero Deaths: a National Strategy on Highway Safety as a long-term goal. Virginia joins approximately 25 states and many national organiza-tions, including the American Association of State Highway and Transportation Officials (AASHTO), the Governors Highway Safety Association (GHSA), and the American Association of Motor Vehicle Administrators (AAMVA) in supporting Toward Zero Deaths (TZD).In the summer of 2011, representatives from the Virginia Department of Transportation (VDOT), the Department of Motor Vehicles (DMV), and the Virginia State Police (VSP) with support from other state agencies and private-sector associations began work on updating the SHSP to ensure it targets Virginia’s current traffic safety problems. A com-plete list of all agencies and organizations involved in the SHSP update process appears at the beginning of the plan. The purpose of the SHSP is to reduce motor vehicle crashes and the resulting deaths and injuries by combining and sharing resources and targeting efforts to areas with the greatest potential for improvement. By involving the 4 E’s of safety, (e.g., engineering, enforcement, education, and emergency response) the plan makes certain all aspects of traffic safety are fully committed to the task. Over the past two years, deaths and severe injuries from motor vehicle crashes have dropped to an historic low. This does not mean, however, that Virginia can rest on its laurels. Now is the time to make sure the positive trend in reducing crashes continues.
Background
In 2006, Virginia, like all other states, developed an SHSP in accordance with Federal requirements. The 2006 plan notes, “Motor vehicle crashes affect our citizens, particularly our youth. Crash victims are often working age adults, which can leave families without a primary source of financial support. Crashes substantially affect the local community, rob our families of their dreams and aspirations, and replace them with unforeseen economic burdens, physical disabilities, and mental anguish.”A Surface Transportation Safety Executive Committee led the development of the 2006 plan to ensure consis-tent communication and cooperation among all safety stakeholders in the Commonwealth. The plan introduced highway safety as a health issue and included injuries and deaths from traffic crashes as safety measures. The Committee determined the plan’s goal would be to reduce the annual number of injuries and deaths due to motor vehicle crashes in Virginia by 100 deaths and 4,000 inju-ries from the 2005 levels by 2010. It is important to note that the 2006 plan focused on all injuries, not just severe injuries. The development of the 2006 SHSP was a data-driven process that identified the following three major emphasis areas and nine subareas:
Human Factors
» Driver behavior » Special users » Pedestrian and bicyclist safety
Environmental
» Intersection safety » Roadway departures » Work zone safety » Pedestrian and bicycle safety
Fundamental
» Traffic records » Transportation safety planning

32012-2016 strategic highway safety plan
Background
The following safety accomplishments were achieved from 2006 to 2010:
» A 23 percent reduction in traffic deaths from 961 in 2006 to 740 in 2010 and a 45 percent reduction in severe injuries from 21,260 in 2006 to 11,736 in 2010; exceeding the goals in the 2006 plan.
» Significant decreases in alcohol-related and young driver involved deaths. Between 2006 and 2010,alcohol-related deaths dropped by 27 percent and young driver involved deaths decreased by 44 percent.
» Speed-related deaths decreased by 29 percent. » Safety belt use increased to more than 81 percent. » Improved statewide programs
• Enhanced the graduated drivers’ license law and drivers’ education requirements;
• Checkpoint Strikeforce, an annual sobriety checkpoint program, resulted in 6,000 arrests by state troopers in 2009;
• An Interstate patrol program issued more than 150,000 traffic summons to aggressive drivers; and
• Highway safety investments were targeted at high-crash intersections and roadway corridors.
» Over 250 law enforcement agencies joined the “Click It or Ticket” campaign to increase safety belt use in Virginia resulting in 41,000 summonses for safety belt violations from 2005 to 2010 during the two-week enforcement period in May.
» Completed the first phase of the Traffic Records Elec-tronic Data System (TREDS) automated crash data col-lection system resulting in more complete, timely, and accurate crash reports.
» Developed web-based crash reporting tools. » Improved the Crash Outcome Data Evaluation System (CODES) to capture additional input and improved linkage with crash reports.
» Improved child passenger safety by:• Increasing the minimum age from six to eight
years in which children are to be properly secured in a child safety seat;
• Increasing the number of certified child passen-ger safety technicians from 48 in 2005 to 1,023;
• Distributing over 680,000 pieces of child pas-senger safety educational materials from 2007 to 2010 through the Virginia Department of Health (VDH);
• Operating the VDH Low-Income Safety Seat Distribution and Education Program and pro-viding education and free safety seats to approx-imately 79,000 income-eligible children at 147 program sites statewide; and
• Inspecting over 2,600 child safety seats from 2006 to 2010 at 177 Community Safety Seat Check events throughout Virginia.
» Trained over 580 health and physical education teachers using the Bike Smart Basics program from 2006 to 2010.

2012-2016 strategic highway safety plan4
Updating Virginia’s Strategic Highway Safety Plan
State of Traffic Safety in Virginia in 2012The crash data that appears throughout the updated SHSP was provided by DMV, and summarized by VDOT. The state of traffic safety in Virginia is improving as evidenced by the significant reduction in traffic-related deaths and severe injuries between 2006 and 2010. Since 2006, the number of traffic-related deaths has fallen by 23 percent while the number of severe injuries has been reduced by 45 percent as shown in Figure 1. While this achievement is remarkable, Figure 1 shows that traffic safety can still be improved in Virginia. In 2010, more than 700 people died on Virginia’s roadways and nearly 12,000 suffered severe injuries.
Traffic Deaths and Severe Injuries2001 to 2010 1
Source: Virginia Association of Chiefs of Police.

52012-2016 strategic highway safety plan
Updating Virginia’s Strategic Highway Safety Plan
An analysis of the crash data over this 10-year time period shows that while crashes occur throughout Virginia, the majority of crashes are concentrated in the more populous areas of the Commonwealth, including Northern Virginia, Richmond, and Hampton Roads. However, the majority of deaths and severe injuries do not occur on the 1,100 miles of Virginia’s Interstates, but rather on primary and second-ary roadways (Figures 2 and 3). The primary system has more than 8,000 miles of roadways and accounts for the most severe crashes occurring in Virginia. Virginia’s sec-ondary system of highways, consisting of almost 49,000 miles of roads, accounts for the second highest number of severe crashes. Secondary roads can range from rural high-speed highways, to multilane suburban thoroughfares, to low-speed residential streets. Urban system roads, found in Virginia’s cities, have a similar mix of highways as the secondary road system, but have fewer deaths. However, urban roadways still account for a large percentage of the severe injury crashes occurring in Virginia.In addition to the number of severe crashes occurring on the primary and secondary system, Virginia has a large number of crashes occurring on its rural roadways. Of the 69,900 miles of roadways in Virginia, 40,000 miles (57 percent) are in rural areas. Figure 4 shows the number of deaths occurring by roadway type and environment.
Average Annual Deaths By Highway System2001 to 2010 2
Average Annual Severe Injuries By Highway System2001 to 2010 3
Average Annual Deaths By Roadway Type2001 to 2010 4

2012-2016 strategic highway safety plan6
Updating Virginia’s Strategic Highway Safety Plan
The SHSP Update Process The Federal government recommends SHSPs be updated every five years, and Virginia has joined a num-ber of other states to reexamine its data and identify areas where there are opportunities to make improve-ments for continuing progress in enhancing safety. The process used to update Virginia’s plan included several important steps:
» Established a Steering Committee to provide the over-all leadership for the plan and its implementation;
» Obtained input from safety stakeholders; » Conducted data analysis and identified emphasis areas with the greatest potential for improvement;
» Identified leadership for each emphasis area team; » Examined the literature on countermeasure effec-tiveness and added new countermeasures where appropriate;
» Presented a draft SHSP update to stakeholders and incorporated their input;
» Ensured compliance with Federal SHSP guidelines; » Developed and presented the final updated plan to the Steering Committee; and
» Institutionalized a process to track the implemen-tation of the SHSP.
To keep Virginia moving forward with improving highway safety, the SHSP update process involved the following activities:
» Formed an organizational structure for the SHSP and reached out to partner agencies to gain their input into and support for the SHSP;
» Scheduled meetings with the SHSP Steering Committee;
» Reached agreement on the vision, mission, goals, and emphasis areas; and
» Conducted a series of regional meetings to gain input on strategies and action steps.
The Plan’s stakeholders agreed early on in the process to focus efforts on reducing deaths and severe injuries. The 2012 SHSP used a data-driven process to identify changes in the emphasis areas for the next five years. Figure 5, which stakeholders used to select emphasis areas for the 2012 SHSP, shows traffic safety problem areas from the 2006 SHSP and the percent of the total number of deaths and severe injuries associated with that spe-cific area. The data available at the time was for the 2005 to 2008 timeframe. While the crash causation factors are often interrelated, the critical areas to target are evident. For example, roadway departure crashes, which represent the highest crash type, may include inappropriate speed, unrestrained occupants, and a distracted driver.Based on a review of the safety data, the Steering Committee selected the following six emphasis areas:
Deaths and Severe Injuries Percent of Total2005 to 2008 5
» Speeding; » Young Drivers; » Occupant Protection; » Alcohol-Related Incidents; » Roadway Departure; and » Intersections.

72012-2016 strategic highway safety plan
Updating Virginia’s Strategic Highway Safety Plan
Because crash data is central to the SHSP process, the Steering Committee added another emphasis area to focus attention specifically on data collection, management, and analysis. The Steering Committee also discussed having distracted and aggressive driving as a potential emphasis area, but determined that the appropriate strategies to address these issues should be included in the other emphasis areas already identified. At the beginning of the SHSP update process, the Steering Committee considered several new vision and mission statements along with a number of alternative short- and long-term goals. The vision, mission, and goal developed for the 2012 to 2016 Plan are as follows:
Virginia adopts the vision of Toward Zero Deaths. All roadway users should arrive safely at their destinations.Vision
The mission of the Strategic Highway Safety Plan is to save lives and reduce motor vehicle crashes and injuries through a data-driven, strategic approach that uses enforcement, education, engineering, and emergency response strategies.
Mission
The goal of the Strategic Highway Safety Plan is to reduce deaths and severe inju-ries by half by the year 2030 (an average decline of approximately three percent per year).
Goal
2012-2016 strategic highway safety plan8
Updating Virginia’s Strategic Highway Safety Plan
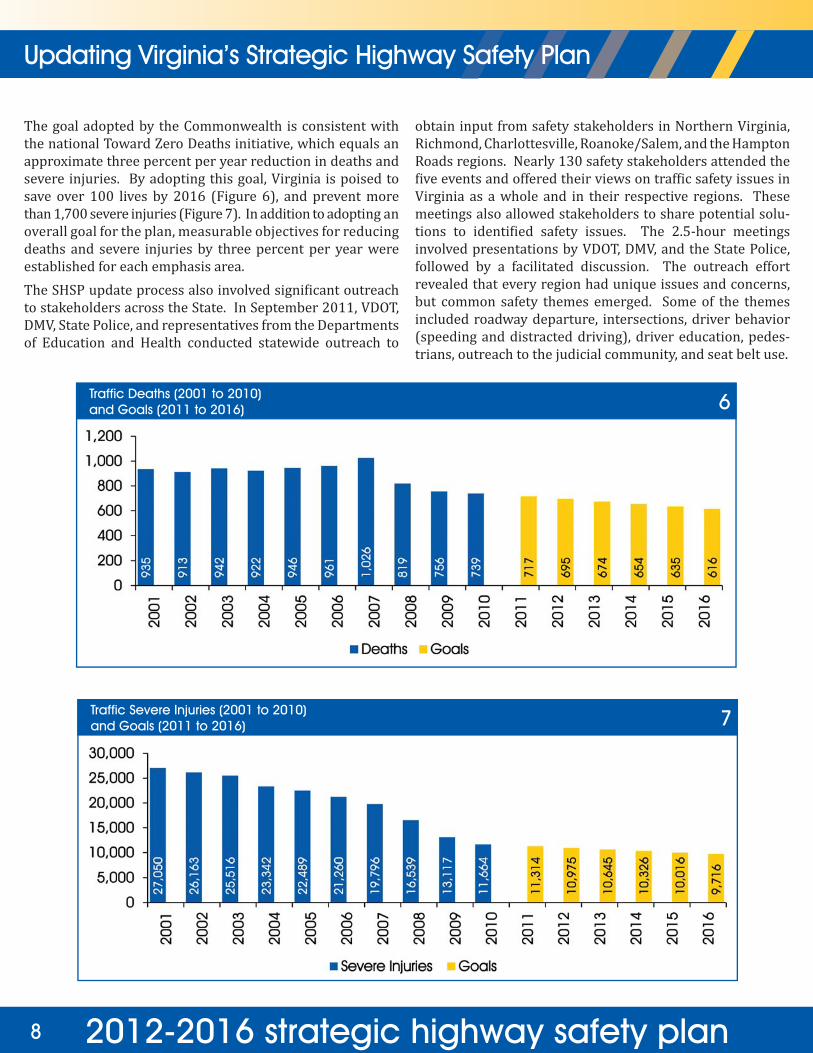
Traffic Deaths (2001 to 2010)and Goals (2011 to 2016) 6
Traffic Severe Injuries (2001 to 2010)and Goals (2011 to 2016) 7
The goal adopted by the Commonwealth is consistent with the national Toward Zero Deaths initiative, which equals an approximate three percent per year reduction in deaths and severe injuries. By adopting this goal, Virginia is poised to save over 100 lives by 2016 (Figure 6), and prevent more than 1,700 severe injuries (Figure 7). In addition to adopting an overall goal for the plan, measurable objectives for reducing deaths and severe injuries by three percent per year were established for each emphasis area.The SHSP update process also involved significant outreach to stakeholders across the State. In September 2011, VDOT, DMV, State Police, and representatives from the Departments of Education and Health conducted statewide outreach to
obtain input from safety stakeholders in Northern Virginia, Richmond, Charlottesville, Roanoke/Salem, and the Hampton Roads regions. Nearly 130 safety stakeholders attended the five events and offered their views on traffic safety issues in Virginia as a whole and in their respective regions. These meetings also allowed stakeholders to share potential solu-tions to identified safety issues. The 2.5-hour meetings involved presentations by VDOT, DMV, and the State Police, followed by a facilitated discussion. The outreach effort revealed that every region had unique issues and concerns, but common safety themes emerged. Some of the themes included roadway departure, intersections, driver behavior (speeding and distracted driving), driver education, pedes-trians, outreach to the judicial community, and seat belt use.

92012-2016 strategic highway safety plan
2012 to 2016 SHSP Plan Elements
The 2012 to 2016 SHSP targeted seven emphasis areas (including data) to focus attention on reducing deaths and severe injuries. Based on the available safety data reviewed by the Steering Committee at the beginning of the update process, the emphasis areas selected accounted for more than 75 percent of the deaths and severe injuries occurring on Virginia’s roadways between 2005 and 2008. The corresponding percentage of deaths and severe injuries were: Roadway Departure 19 percent; Speeding 16 percent; Intersection 14 percent; Young Drivers 11 percent; Unrestrained Occupants 9 percent; and Alcohol Involved at 8 percent (Figure 8).
Elements of the updated SHSP include an overview of each emphasis area, data, information about the respective emphasis area, its measurable objectives, and the strategies and action steps intended to achieve the objectives for reducing deaths and severe injuries. For each emphasis area, additional data was provided to inform stakeholders of the crash issues relative to the emphasis area and to give them a greater under-standing of the traffic safety issues in Virginia. In addition to the number of deaths and severe injuries over the past 10 years, data provided to each empha-sis area team included identification of the gender of the crash victim, geographical representation of crash location, the month when the crash took place, and documentation of the type of collision. The emphasis area teams used this information to develop the strat-egies and action steps found in this plan.The emphasis area action plans found in the 2012 to 2016 SHSP are multidisciplinary. The symbols next to each action step indicate which of the 4 E’s (engi-neering, enforcement, education, and emergency response) the step applies to along with the agency responsible for implementing the step.
Engineering
Enforcement
Education
Emergency Response
Percentage of Deaths and Severe Injuries 2005 to 2008 8

2012-2016 strategic highway safety plan10
Speeding Emphasis Area Plan
OverviewA crash is considered to be speed related when a driver is driving too fast for conditions or exceeding the posted speed limit. According to the National Highway Traffic Safety Administration (NHTSA), speed is a factor in nearly one-third of all fatal crashes nationwide. Speeding reduces a driver’s ability to steer safely around other vehicles, curves, or objects in the roadway, extends the distance necessary to stop a vehicle, increases the distance a vehicle travels when a driver reacts to a dangerous situation, and exponentially increases the impact energy and risk of death in the event of a crash. The effectiveness of restraint devices like air bags and seat belts also decline as the impact speed increases. Few drivers consider speeding as an immediate threat to their personal safety or the safety of others.
Source: Virginia Department of Transportation.
The ProblemIn the last decade (2001 to 2010), nearly 3,770 people died in speeding-related crashes on Virginia roads, and more than 72,000 were severely injured (Figure 9). Nearly one in two roadway deaths occurred due to speed-related crashes and one in three crashes resulted in severe injuries.
Speeding Deaths and Severe Injuries 2001 and 2010 9

112012-2016 strategic highway safety plan
Speeding Emphasis Area Plan
Who?Male drivers age 16 to 20 were involved in the highest number of speed death and severe injury crashes. From 2001 to 2010, over 17,000 young people (age 16 to 20) died or suffered severe injuries in this type of crash. Male drivers accounted for nearly 64 percent of the deaths and severe injuries (Figure 10).
Speeding Deaths and Severe InjuriesBy Driver Age and Gender, 2001 to 2010 10
Where?Six counties in Virginia, including Fairfax, Loudoun, Prince William, Henry, Augusta, and Chesterfield had the highest num-ber of speed-related deaths and severe injury crashes (Figure 11). Three cities, Virginia Beach, Norfolk, and Richmond, also reported high numbers of this type of crash.
Speeding Deaths and Severe Injuries By Location2001 to 2010 11

2012-2016 strategic highway safety plan12
Speeding Emphasis Area Plan
When?The majority of speeding deaths and severe injuries happened from May to August (Figure 12). The month of July has the greatest number of speed-related deaths and severe injuries, followed by August. Speed-related crashes resulted in about 21 deaths and severe injuries a day.
Speeding-Related Deaths and Severe Injuries By Month, 2001 to 2010 12
What?Figure 13 shows that the majority of speed-related deaths and severe injuries occurred when a vehicle hit a fixed object, such as a tree or telephone pole. Other deaths and severe injuries involved angle and rear-end collisions, which typically occurred at interchanges, intersections, and driveway locations.
Speeding Deaths and Severe Injuries By Collision Type, 2001 to 2010 13
Objectives To address the speeding problem, the SHSP includes the following objectives using 2010 data as a baseline:
» Reduce deaths by three percent each year from 294 in 2010 to 245 by 2016 (Figure 14). » Reduce severe injuries by three percent each year from 3,997 in 2010 to 3,329 by 2016 (Figure 14).
Speeding Deaths and Severe Injuries2010 to 2016 14Source: Virginia Department of Transportation.

132012-2016 strategic highway safety plan
Speeding Emphasis Area Plan
Strategy 1. Implement engineering countermeasures to synchronize traffic flow to prevailing conditions and sur-roundings with particular attention to high-crash locations.
1.1 Set appropriate speed limits based on Virginia/national standards and prevailing conditions. (VDOT)
1.2 Install rumble strips and stripes, signing, markings, or other innovations, for example, traffic calming, to enhance user’s perception of vehicle speed and reduce speeds where appropriate. (VDOT)
1.3 Implement appropriate timing and synchronization of traffic signal systems to minimize stops and starts while harmonizing traffic flow to the prevailing conditions. (VDOT)
1.4 Investigate the additional use of the Active Traffic Management System (ATMS) practices on freeway corridors. (VDOT)
Strategy 2. Develop and implement a speed campaign incorporating media, enforcement, education, and evalu-ation where speed-related deaths and severe injuries are elevated.
2.1 Identify, publicize, and implement enforcement countermeasures in areas where speeding is a problem. (DMV)
2.2 Determine the most effective messages targeting individuals most involved in speed-related crashes through research, literature reviews, and focus groups. (DMV)
2.3 Teach children the rules of the road before they get behind the wheel, i.e., review bicycle curriculum. (DMV)
2.4 Educate the judicial community on the need for consistent application of the law on speed-related offenses. (DMV)
2.5 Enhance the education of police officers on the need for speed enforcement. (DMV)
2.6 Provide grant funding for speed enforcement in areas where data indicate a speed problem. (DMV)
Strategy 3. Identify and implement effective speed management measures.
3.1 Identify and evaluate advanced tools and techniques to reduce speeding and where necessary, work with the General Assembly to explore the use of these tools. (VDOT)
3.2 Implement variable speed limits (VSL) where permitted and feasible. (VDOT)

2012-2016 strategic highway safety plan14
Young Driver Emphasis Area Plan
The ProblemIn the decade between 2001 and 2010, over 1,700 peo-ple died in young driver crashes (Figure 15) on Virginia roads, and more than 54,000 were severely injured (Figure 16). Nearly one in five roadway deaths and one in four severe injuries occurred in young driver involved crashes. The term “young driver involved” means the crash involved a driver who was between the ages of 15 and 20 years old.
OverviewMotor vehicle crashes continue to be the number one killer of young people age 15 to 20. Young drivers lack experience behind the wheel, which sometimes results in poor decision-making when con-fronted with unknown or unfavorable traffic or roadway conditions. Some young drivers have a skewed perception of risk that often leads to risk-taking behavior, such as driving while impaired or speeding. In the past, major efforts to improve young driver safety included driver education and training, graduated driver licensing laws, and stronger enforcement. While those techniques continue to have merit, reaching young drivers today is a more complex task given the availability of information and entertainment from multiple sources. The challenge requires an understanding of young people’s learning styles and their attitudes along with knowledge of research findings on effective methods for changing young driver attitudes and behavior.
Virginia Young Driver Involved Deaths2001 to 2010 15
Virginia Young Driver Involved Severe Injuries2001 to 2010 16

152012-2016 strategic highway safety plan
Where?Seven counties in Virginia, including Fairfax, Chesterfield, Prince William, Loudoun, Henrico, Augusta, and Spotsylvania, had the highest number of young driver deaths and severe injuries (Figure 18). Five cities also reported a high number of young driver deaths and severe injuries, including Virginia Beach, Norfolk, Chesapeake, Newport News, and Richmond. While the urban areas of the State showed the highest number of young driver involved crashes, the number of deaths and severe injuries rural jurisdictions (e.g., eastern shore, Halifax, Highland counties) can be overrepresented and may require different approaches to address the issues.
Who?Young male drivers accounted for nearly 58 percent of the deaths and severe injuries. Deaths and severe injury crashes involving these drivers decreased by 72 percent over the last decade. The decrease for female young drivers was 69 percent during the same time (Figure 17).
Young Driver Involved Deaths and Severe Injuries By Driver Gender, 2001 to 2010
Note: When more than one driver in a crash is in the specified age group and they are different genders, the number of deaths and severe injuries are counted for each gender resulting in double counting. There also is some undercounting because the driver gender is not recorded in some crashes. That is why the impact of gender should be considered separately and not combined for a given age group.
17
Young Driver Involved Death and Severe Injuries2001 to 2010 18
Young Driver Emphasis Area Plan

2012-2016 strategic highway safety plan16
When?Figure 19 shows the warmer months have the highest number of roadway deaths and severe inju-ries involving young drivers. The month with the highest number of deaths and severe injuries was August. Young driver-related crashes result in nearly 15 deaths and severe injuries a day.
What?The majority of deaths and severe injuries involving young drivers occur when a vehicle collides with a fixed object (Figure 20). Young driver involved crashes also resulted in a high number of angle and rear-end crashes. One of the strategies in the emphasis area plan is to improve Virginia’s driver education program by addressing these crash types and the appropriate avoidance techniques.
Objectives To address the young driver involved crash problem, the SHSP includes the following objectives using 2010 as a baseline.
» Reduce deaths by three percent per year from 117 in 2010 to 97 by 2016 (Figure 21). » Reduce severe injuries by three percent per year from 2,448 in 2010 to 2,040 by 2016 (Figure 21).
Young Driver Involved Deaths and Severe InjuriesBy Month, 2001 to 2010 19 Young Driver Involved Deaths and Severe Injuries
By Collision Type, 2001 to 2010 20
Virginia Young Driver Involved Deathsand Severe Injuries2010 to 2016
21
Young Driver Emphasis Area Plan

172012-2016 strategic highway safety plan
The SHSP Solution
Strategy 1. Review and make recommendations as necessary to improve Virginia’s Graduated Driver Licensing (GDL) law.
1.1 Review and make recommendations as necessary in the length of the learner’s permit and the amount of super-vised hours. (DMV)
1.2 Review and make recommendations as necessary on the elements of passenger and nighttime restrictions. (DMV)
1.3 Provide updated information on young driver traffic injury prevention best practices to all relevant safety partners. (DMV)
1.4 Provide updated research to the public, parents, and edu-cators about best practices for improving young driver safety. (DMV)
Strategy 2. Review and recommend changes to enhance the effectiveness of Virginia’s driver edu-cation process.
2.1 Review the driver education curriculum to update con-tent and teaching methods with attention to information and training on SHSP emphasis areas, such as speeding, roadway departure, intersections, and other related top-ics (work zone safety, distracted driving etc.). (DOE)
2.2 Examine driver education instructor training and certi-fication to determine the need for improvement. (DOE)
2.3 Review standards of learning (SOL) requirements to identify gaps in content that the State Board of Education should address. (DOE)
2.4 Examine the content and delivery of driver’s education curriculum by public/private schools and commercial providers to determine the level of consistency and quality. (DMV)
2.5 Conduct a review of in-car testing best practices. Report findings and make recommendations as necessary. (DMV)
Strategy 3. Develop and implement strategic and effective educational messages.
3.1 Review research and data to develop effective educa-tional messages. (DMV)
3.2 Obtain input from a diverse, comprehensive, and reasonably representative sample of young people on proposed research-based interventions and other approaches. (DOE)
3.3 Identify evidence-based programs for changing youth behaviors and attitudes and disseminate as appropriate. (DMV)
3.4 Identify evidence-based approaches to increase parental involvement in young driver safety. (DMV)
3.5 Develop and implement approaches that encourage involvement in evidence based and empirically sup-ported young driver safety programs. (DMV)
3.6 Use bicycle and pedestrian safety as a way to promote traffic safety early in the education process prior to formal driver’s education. (VDOT)
Strategy 4. Provide information to judges on young driver issues.
4.1 Review judicial licensing ceremonies and determine strategies for improving content and consistency. (DMV)
4.2 Incorporate strategies into judicial licensing cer-emony and send to appropriate contacts across the State. (DMV)
Strategy 5. Implement programs focused on behavior and attitude change on traffic safety among 18- to 20-year olds.
5.1 Conduct a survey of Virginia colleges and universi-ties to determine which are conducting effective programs that change the attitudes and behaviors of college age students toward safe driving. (DOE)
5.2 Package and disseminate information to all colleges, universities, and safety partners about proven effec-tive programs that change the attitudes and behaviors of college age students toward safe driving. (DMV)
Young Driver Emphasis Area Plan

2012-2016 strategic highway safety plan18
Occupant Protection Emphasis Area Plan
The ProblemThere were 4,119 unrestrained occupants killed in crashes on Virginia roads from 2001 to 2010, and another 38,751 unre-strained motorists severely injured during this same time-period (Figure 22). Nearly one in two deaths and one in five severe injuries were unrestrained occupants involved in motor vehicle crashes.
OverviewA safety belt, when worn properly, is the single most effective way to save lives and reduce injuries in crashes. Safety belts keep motorists in their seats during a crash and spread the crash forces across the stronger parts of the upper body. These restraints also can prevent injuries in the secondary collision inside the vehicle and prevent ejection from the vehicle. According to NHTSA, safety belts reduce the risk of fatal injury to front seat occupants by 45 percent and the risk of moderate-to-critical injury by 50 percent.
Safety belt use has been found to be at its lowest among young males and drivers who have consumed alcohol. National studies also show nearly two-thirds of motorists killed in nighttime crashes are unrestrained in contrast to less than half of motor-ists killed in daytime crashes. High-visibility enforcement campaigns, higher fines for safety belt violations, and primary safety belt laws have all contributed to the increase in safety belt use in the U.S. NHTSA estimates safety belt and child restraint use saved more than 13,000 lives in 2009.
Unrestrained Deaths and Severe Injuries 2001 to 2010 22
Source: Virginia Association of Chiefs of Police.

192012-2016 strategic highway safety plan
Where?Seven counties in Virginia (Fairfax, Chesterfield, Prince William, Henrico, Augusta, Henry, and Pittsylvania) have the highest number of unrestrained deaths and severe injuries. Also included in the list are four cities that reported a high number of unrestrained deaths and severe injuries (Virginia Beach, Richmond, Chesapeake, and Norfolk) (Figure 24).
Who?The majority of unrestrained occupants killed or severely injured in crashes involved male drivers between the ages of 16 and 20 years old. As shown in Figure 23, male drivers accounted for nearly 70 percent of the unrestrained occupant deaths and severe injuries.
Unrestrained Deaths and Severe Injuries By Driver Age and Gender, 2001 to 2010 23
Unrestrained Deaths and Severe Injuries By Location2001 to 2010 24
Occupant Protection Emphasis Area Plan

2012-2016 strategic highway safety plan20
When?Figure 25 shows unrestrained occupant deaths and serious injuries start to increase when the weather gets warmer. Nearly 12 unrestrained deaths and severe injuries occur each day in Virginia.
Why?The majority of unrestrained deaths and severe injuries occur when a vehicle collides with a fixed object. Rear end and angle crashes also are a problem (Figure 26).
Objectives To address the unrestrained occupant problem, the SHSP includes the following objectives using 2010 as a baseline:
» Reduce deaths by three percent per year from 305 in 2010 to 254 by 2016 (Figure 27).
» Reduce severe injuries by three percent per year from 1,926 in 2010 to 1,604 by 2016 (Figure 27).
» Increase safety belt use from 81.8 percent to 86 percent by 2016 (Figure 28).
Unrestrained Deaths and Severe Injuries By Month, 2001 to 2010 25 Unrestrained Deaths and Severe Injuries
By Collision Type, 2001 to 2010 26
Virginia Unrestrained Deaths and Severe Injuries2010 to 2016 27
Virginia Safety Belt Use Objective 28
Occupant Protection Emphasis Area Plan
Source: Virginia Association of Chiefs of Police.

212012-2016 strategic highway safety plan
The SHSP Solution
Strategy 1. Educate the public on the importance of using safety belts.
1.1 Review the data to determine which population groups are at highest risk for not wearing safety belts, determine why if possible. (DMV)
1.2 Explore culturally relevant public education and outreach to increase awareness of the benefits of safety belt use among low-use groups. (DMV)
1.3 Provide information on safety belt use and the expected fatality and severe injury reductions that could be achieved with higher belt use. (DMV)
Strategy 2. Conduct high-visibility safety belt enforcement campaigns, e.g., “Click It or Ticket.”
2.1 Continue and enhance high-visibility enforcement campaigns. (DMV)
2.2 Explore and implement feasible alternative countermeasures. (DMV)
Strategy 3. Improve child occupant protection through education, outreach, and enforcement.
3.1 Identify locations with low adult and child occupant restraint use and target education and outreach efforts in those areas. (VDH)
3.2 Advocate enforcement of secondary occupant protection laws and promote zero tolerance of child occupant protection violations. (DMV)
3.3 Continue and increase child occupant protection education programs, such as “First Ride, Safe Ride” and “Make it Click.” (VDH)
3.4 Continue to operate and promote the expansion of safety seat check stations and publicize child occupant protection inspection events statewide. (VDH)
3.5 Increase the number of certified child passenger safety technicians/instructors. (VCU)
3.6 Continue programs and services aimed at increasing occupant protection among low-income populations. (VDH)
Occupant Protection Emphasis Area Plan

2012-2016 strategic highway safety plan22
The ProblemFrom 2001 to 2010, 3,455 people died in alcohol impaired crashes on Virginia roads and more than 33,700 were severely injured (Figure 29). Nearly one in three roadway deaths and one in six severe injuries occurred in an alcohol impaired crash.
OverviewAlcohol impaired driving deaths represent about a third of all motor vehicle traffic deaths in the U.S. As the blood alcohol concentration (BAC) level goes up in the human body, the physi-ological effects range from loss of judgment and altered mood to reduced muscle control and deteriorating reaction times. The repercussions of impaired driving are a decline in visual functions and multitasking, reduced concentration, impaired perception, and an inability to respond quickly to emergencies. In Virginia, alcohol-related crashes are those where the police report indi-cates the driver, bicyclist, or pedestrian were drinking before the incident. Driving under the influence (DUI) is when the driver’s BAC is 0.08 or higher. Drivers under 21 years old may be arrested for DUI with a BAC of 0.02 or higher. The frequency of impaired driving crashes is highest at night and on weekends.
Alcohol Impaired Driving Deaths and Severe Injuries 2001 to 2010 29
Source: Virginia Association of Chiefs of Police.
Impaired Driving Emphasis Area Plan

232012-2016 strategic highway safety plan
Where?Four counties in Virginia (Fairfax, Chesterfield, Prince William, and Henrico) had the highest number of alcohol impaired driving deaths and severe injuries. Three cities also reported a high number of alcohol impaired driving deaths and severe injuries (Virginia Beach, Richmond, and Norfolk) (Figure 31).
Who?From 2001 to 2010, drivers between the age of 26 and 35 had the most deaths and severe injuries as a result of alcohol impaired traffic crashes than any other age group. Male drivers accounted for nearly 77 percent of the deaths and severe injuries (Figure 30).
Alcohol Impaired Deaths and Severe Injuries by Driver Age and Gender2001 to 2010 30
Alcohol Impaired Deaths and Severe Injuries By Location2001 to 2010 31
Impaired Driving Emphasis Area Plan

2012-2016 strategic highway safety plan24
When?Figure 32 shows that the alcohol impaired deaths and severe injuries in Virginia remain at a fairly constant level between April and August. Alcohol impaired crashes result in nearly 10 deaths and severe injuries each day.
Why?The majority of alcohol impaired driving deaths and severe injuries occurred when a vehicle collided with a fixed object (Figure 33).
Objectives To address impaired driving, the SHSP includes the following objectives using 2010 as a baseline:
» Reduce deaths by three percent per year from 274 in 2010 to 228 by 2016 (Figure 34). » Reduce severe injuries by three percent per year from 1,957 in 2010 to 1,630 by 2016 (Figure 34).
Alcohol Impaired Driving Deathsand Severe Injuries By Month, 2001 to 2010
32Alcohol Impaired Driving Deathsand Severe InjuriesBy Collision Type, 2001 to 2010
33
Alcohol Impaired Deaths and Severe Injuries2010 to 2016 34
Impaired Driving Emphasis Area Plan
Source: Virginia Department of Transportation.

252012-2016 strategic highway safety plan
The SHSP Solution
Strategy 1. Identify and promote initiatives to prevent impaired driving.
1.1 Study the effectiveness of the Administrative License Revocation penalties and explore possible recommendations for change. (DMV)
1.2 Study the possible advantages of adopting an open container law in accordance with NHTSA recommended criteria. (DMV)
1.3 Study and report on the advantages of adopting innovative technology solutions to address impaired driving. (DMV)
Strategy 2. Strengthen DUI/DUID enforcement programs.
2.1 Increase the number of people trained in standardized DUI/DUID detection and apprehension. (DMV)
2.2 Expand the frequency of saturation patrols and checkpoints in areas where DUI/DUID incidents are prevalent. (DMV)
2.3 Continue and enhance high-visibility enforcement campaigns. (DMV)
2.4 Increase the number of officers trained in the Advanced Roadside Impaired Driving Enforcement (ARIDE). (DMV)
2.5 Study the effectiveness and implementation of the Drug Recognition Technician program. (DMV)
Strategy 3. Conduct education and training on impaired driving.
3.1 Increase the number of alcohol servers and sellers participating in the statewide alcohol server education program promoting respon-sible alcohol service and consumption. (ABC)
3.2 Continue and enhance effective, evidence-based community impaired driving prevention programs. (DMV)
Strategy 4. Develop and implement programs to reduce underage drinking and driving.
4.1 Promote and enhance enforcement, training, and education programs for alcohol servers and sellers to prevent underage purchases of alcohol. (ABC)
4.2 Review community and college/university approaches to prevent underage drinking and determine their effectiveness. (ABC)
4.3 Collect input from judges at the annual Judicial Conference on the effectiveness of Virginia’s Use/Lose law in preventing underage drinking and driving. (DMV)
Strategy 5. Develop and implement programs to decrease recidivism.
5.1 Continue to provide information to prosecutors and judges on the value of fully prosecuting DUI offenders. (DMV)
5.2 Monitor high BAC and repeat offenders through VASAP and recommend incarceration when appropriate. (VASAP)
5.3 Conduct an evaluation of victim impact panels to determine effectiveness in reducing recidivism. (VASAP)
5.4 Evaluate the effectiveness of DUI courts in reducing recidivism and communicate the results to stakeholders. (VASAP)
Impaired Driving Emphasis Area Plan

2012-2016 strategic highway safety plan26
The ProblemFrom 2001 to 2010, more than 5,100 people were killed in roadway departure crashes on Virginia roads and another 80,000 were severely injured (Figure 35). Nearly one in two roadway deaths and one in three severe injuries occurred in a roadway departure crash.
OverviewRoadway departure crashes involve vehicles leaving the travel lane, encroaching into the opposite lanes, or onto the shoulder and roadside environment. The result of this maneuver is the vehicle hits an oncoming vehicle or hits a fixed object such as bridge walls, poles, embank-ments, guardrails, parked vehicles, or trees. Some of the contributing factors include driver inattention or fatigue, roadway surface condi-tions, impaired driving, lack of familiarity with the road, and speeding. Engineering improvements such as flattening curves, installing shoulder rumble strips, installing centerline rumble strips, improving shoulders, removing hazards, and providing guardrail can prevent roadway departure crashes or lessen their severity.
Roadway Departure Deaths and Severe Injuries2001 to 2010 35
Roadway Departure Emphasis Area Plan
Source: Virginia Department of Transportation.

272012-2016 strategic highway safety plan
Where?Eleven counties in Virginia (Fairfax, Loudoun, Prince William, Augusta, Henrico, Chesterfield, Washington, Bedford, Albemarle, Franklin, and Pittsylvania) experience the highest number of roadway departure deaths and severe injuries. Two cities also reported a high number of roadway departure death and severe injury crashes (Virginia Beach and Chesapeake) (Figure 37).
Who?From 2001 to 2010, drivers between the ages of 16 and 20 years old had the most deaths and severe injuries (19,440) as a result of roadway departure crashes. Male drivers accounted for nearly 64 percent of the deaths and severe injuries from this type of crash (Figure 36).
Roadway Departure Deaths and Severe Injuries By Driver Age and Gender, 2001 to 2010 36
Roadway Departure Deaths and Severe Injuries By Location2001 to 2010 37
Roadway Departure Emphasis Area Plan

2012-2016 strategic highway safety plan28
When?Figure 38 shows most of the deaths and severe inju-ries resulting from roadway departure crashes occurred during the summer months with a peak in July. Roadway departure crashes resulted in nearly 23 deaths and severe injuries a day.
What?The majority of roadway departure deaths and severe injuries occur when a vehicle collides with a fixed object (Figure 39). One of the strategies in this empha-sis area plan is to implement low-cost traffic control and pavement safety improvements to help keep vehi-cles on the roadway.
Objectives To address the roadway departure problem, the SHSP includes the following objectives using 2010 as a baseline:
» Reduce deaths by three percent per year from 433 in 2010 to 361 by 2016 (Figure 40). » Reduce severe injuries by three percent from 4,957 in 2010 to 4,129 by 2016 (Figure 40).
Roadway Departure Deaths and Severe Injuries By Month, 2001 to 2010 38 Roadway Departure Deaths and Severe Injuries
By Collision Type, 2001 to 2010 39
Virginia Roadway Departure Deaths and Severe Injuries2010 to 2016 40
Roadway Departure Emphasis Area Plan
Source: Virginia Department of Transportation.

292012-2016 strategic highway safety plan
The SHSP Solution
Strategy 1. Reduce the likelihood of vehicles leaving the travel lane(s) at high-crash and risk locations by improving the roadway, the roadside, and traffic control devices.
1.1 Identify locations with a disproportion-ately large number of actual and potential crashes for roadway departures. Promote and implement Highway Safety Manual analyses and Road Safety Assessments, with multidisciplinary teams, at identified high-crash corridors or locations. Review roadway operations, maintenance, and project development processes to reduce roadway departure crashes. (VDOT)
1.2 Post suitable speed limits for roadway geo-metric and traffic conditions. Ensure speed limit and warning signs are installed and visible at appropriate intervals. Consider variable speed limits, advisory speeds, and speed feedback devices, as well as mea-sures to reduce speed variance. (VDOT)
1.3 Enhance policy and standards and expand the installation and maintenance of center-line, edge line, and shoulder rumble strips. (VDOT)
1.4 Improve related engineering element stan-dards and specifications. Expand the use of and maintain existing roadway delineation and visibility features, which include pave-ment markings, markers, signs, and other devices. Consider the use of highway light-ing and ITS technology where cost effective, appropriate, and practical. (VDOT)
1.5 Upgrade and improve shoulders where possible. Maintain shoulders to reduce debris and edge drop-offs. Use beveled pavement edges, particularly on higher speed roadways. Identify opportunities to widen shoulders to provide additional recovery areas for vehicles that leave the lane. Reduce nonmotorized user exposure to traffic and vehicle speed differentials. (VDOT)
1.6 Improve roadway geometry (cross section, alignment, and sight distance) where cost effective and practical. (VDOT)
1.7 Continue to research advances in pavement designs to enhance pavement friction. Seek opportunities to install high-friction pavements where appropriate, cost effec-tive, and practical. (VDOT)
Strategy 2. Minimize the adverse consequences of leaving the roadway by improving the roadside, safety equipment and traffic control devices.
2.1 Review, improve, and expand the use of roadside safety devices, where appropriate. (VDOT)
2.2 Develop and implement guidance to improve ditch and back slope designs to minimize crash severity at high-crash locations. Modify roadside clear zones and/or cross slopes particularly near obstacles. (VDOT)
2.3 Remove, relocate, shield, or delineate trees, utilities, and other fixed objects where cost effective. (VDOT)
2.4 Improve median cross section and/or install barriers where left side road-way departure crashes occur. (VDOT)
Strategy 3. Educate roadway users to understand the contributing factors in roadway departure crashes comply with traffic control devices and provide proper right-of-way to all users.
3.1 Develop effective content and messages to target education and outreach regarding roadway departure crashes and safety. (DOE)
3.2 Work collaboratively with partner agencies and others to integrate new content into the driver education curriculum and driver manual. (DOE)
3.3 Disseminate roadway departure safety information to schools, colleges, universities, media, law enforcement, the judiciary, public officials, and other safety partners. (DOE)
3.4 Raise awareness about the dangers of texting and other distractions while driving by sharing effective messages with all safety partners. (DMV)
Strategy 4. Develop an effective, consistent, and coordinated incident response program in accordance with the NationalIncident Management System (NIMS) at the state and local level to ensure timely response and incident clearance to reduce sec-ondary crashes.
4.1 Work with state and local fire, EMS, law enforcement, and incident response personnel to develop localized incident management plans consistent with the Code of Virginia. (VSP/VDOT/VDFP/VDH)
4.2 Work with state and local fire, EMS, law enforcement, and incident response personnel to identify opportunities for reducing secondary inci-dents through coordinated incident response. (VSP/VDOT/VDFP/VDH)
4.3 Work with state and local fire, EMS, law enforcement, and incident response personnel to emphasize the benefits of internal and multiagency after action reviews and reports for crashes involving roadway depar-tures. (VSP/VDOT/VDFP/VDH)
4.4 Work with state and local fire, EMS, law enforcement, and incident response personnel to establish a statewide committee to develop a proposed quick clearance policy for consideration and implementation.(VSP/VDOT/VDFP/VDH)
Roadway Departure Emphasis Area Plan

2012-2016 strategic highway safety plan30
The ProblemBetween 2001 and 2010, over 2,200 people were killed in intersection-related crashes on VDOT maintained roads in Virginia, and over 59,000 were severely injured (Figure 41). Intersection crashes are those that have occurred within 250 feet of the junction. Nearly one in four deaths and one in three severe injuries occurred in an intersection-related crash.
OverviewIntersections involve two or more roads crossing or merging, which creates opportunities for conflict when vehicles and pedestrians turn left, turn right, or cross over. These actions require road users to uti-lize the same space, which may result in crashes if they arrive at the same time. Research indicates nearly 40 percent of all the crashes and 20 percent of fatal crashes in the nation are intersection related. Crashes may be attributed to an illegal maneuver, inattention while crossing over, obstructed view while turning, and misjudging the gap in traffic or the speed of oncoming vehicles. Good geometric design, traffic control, and safe driving behavior result in safe and efficient intersections. Improved access management near intersec-tions, including closure, relocation, and driveway restrictions typically within 250 feet of intersections also can improve safety.
Intersection Deaths and Severe Injuries 2001 to 2010 41
Source: Virginia Department of Transportation.
Intersection Emphasis Area Plan

312012-2016 strategic highway safety plan
Where?Three counties in Virginia (Fairfax, Prince William, and Chesterfield) had the highest number of intersection-related deaths and severe injuries on VDOT’s highway system (Figure 43).
Who?From 2001 to 2010, drivers between the age of 26 and 35 had the most deaths and severe injuries (11,997) in intersection-related crashes (Figure 42). Male drivers accounted for nearly 57 percent of the deaths and severe injuries.
Intersection Deaths and Severe InjuriesBy Driver Age and Gender, 2001 to 2010 42
Intersection Deaths and Severe Injuries By Location2001 to 2010 43
Intersection Emphasis Area Plan

2012-2016 strategic highway safety plan32
When?Figure 44 shows most of the deaths and severe injuries resulting from intersection crashes occurred during the summer months from June to August. Intersection-related crashes resulted in nearly 17 deaths and severe injuries a day on VDOT’s highway system.
What?The majority of intersection-related deaths and severe injuries occur when a vehicle collides with another vehicle during a turning or merging maneu-ver. A fifth of intersection deaths and severe injuries involved rear-end crashes (Figure 45).
Objectives To address the intersection safety problem, the SHSP includes the following objectives using 2010 as a baseline:
» Reduce deaths by three percent per year from 131 in 2010 to 109 by 2016 (Figure 46). » Reduce severe injuries by three percent per year from 2,580 in 2010 to 2,149 by 2016 (Figure 46).
Intersection Deaths and Severe Injuries By Month, 2001 to 2010 44 Intersection Deaths and Severe Injuries
By Collision Type, 2001 to 2010 45
Virginia Intersection Deaths and Severe Injuries2010 to 2016 46
Intersection Emphasis Area Plan
Source: Virginia Department of Transportation.

332012-2016 strategic highway safety plan
The SHSP Solution
Strategy 1. Reduce the frequency and severity of crashes at intersections and interchanges by limiting conflicts through geometric design, traffic control, and lighting improvements.
1.1 Regularly review and implement appropriate yellow change and all red clearance intervals and pedestrian change inter-vals at signalized intersections. (VDOT)
1.2 Apply state-of-the-art access management practices through standards and ordinances. (VDOT)
1.3 Institute and promote Highway Safety Manual analyses and Roadway Safety Assessments using multidisciplinary teams to review the operations and safety for all intersec-tion users. (VDOT)
1.4 Deploy a review program to assess high-crash interchanges and unsignalized intersections for alternative geometric design and traffic control; such as a roundabout or traf-fic signal; signing and marking, visibility and conspicuity of traffic control devices; sight distance and geometric improvements; and ITS enhancements. (VDOT)
1.5 Develop or enhance policies and procedures to consider and use traditional and alternative designs and technology to reduce conflict risks, such as lengthening acceleration and deceleration lanes, innovative interchange designs, left turn restrictions, roundabouts, directional openings, and jug handle designs advanced traffic management systems, and advanced vehicle-warning systems. (VDOT)
Strategy 2. Improve user awareness of and compliance with intersection and interchange traffic control devices.
2.1 Improve the awareness and visibility of traffic control devices so all users can navigate the intersection/inter-change; provide enhanced or additional signs, signals, markings, and markers, rumble strips/stripes, lighting, and ITS enhancements where cost effective. (VDOT)
2.2 Investigate the technology, feasibility, and associated pol-icy and procedures of automated methods to monitor and enforce intersection traffic control compliance. (VDOT)
2.3 Investigate and deploy enhanced technology for dilemma zone detection and notification, as well as speed management techniques approaching intersections, particularly those with high-posted speed limits. (VDOT)
2.4 Regularly assess and provide best practice for public rail-road crossing intersection-warning devices. (VDOT)
2.5 Designate local and state police to deploy enforcement resources at high-crash intersections and interchanges during high-risk time intervals. (VDOT)
Strategy 3. Educate roadway users so they under-stand the contributing factors associated with inter-section crashes, comply with traffic control devices, and provide proper right-of-way to all road users.
3.1 Develop appropriate content and messages to target education and outreach regarding intersection crashes and safety. (DOE)
3.2 Work collaboratively with safety partners and others to integrate new content into the driver education curricu-lum and the driver manual. (DMV)
3.3 Partner with DOE, the State Council on Higher Education for Virginia (SCHEV), media, safety partners, law enforcement, the judiciary, and public officials to raise awareness about the dangers of texting while driving. (DMV)
Strategy 4. Develop an effective, consistent, and coordinated incident response program in accor-dance with the National Incident Management Sys-tem (NIMS) at the state, regional, and local level to improve traffic operations and safety at intersections during incidents on limited access facilities.
4.1 Develop and provide best practices and strategies to develop incident management and communication plans for localities and responders. (VSP/VDOT/VDFP/VDH)
4.2 Develop web-based, interactive district/region specific primary and alternate traffic detour plans utilizing cur-rent and future technology (GIS) for responders. (VSP/VDOT/VDFP/VDH)
4.3 Investigate, develop, and integrate incident response plans at the corridor and local level. (VSP/VDOT/VDFP/VDH)
4.4 Develop, implement, and update traffic signal timing plans to support freeway incident management diver-sion plans. (VSP/VDOT/VDFP/VDH)
Intersection Emphasis Area Plan

2012-2016 strategic highway safety plan34
Overview
Data is the foundation for the SHSP. Data drives decisions to target resources at Virginia’s most serious traffic safety problems and will be used to determine whether the SHSP achieved that goal. As each of the SHSP emphasis areas seeks to improve highway safety, complete and accu-rate safety data will be required. The Data Emphasis Area Team has developed strategies and action steps designed to provide a more complete picture of Virginia’s traffic safety situation.
The SHSP Solution
Strategy 1. Maintain the Traffic Records Coordinating Committee (TRCC) with a multidisciplinary membership from DMV, DOT, MPOs, Health and EMS, Police, the Supreme Court, and other users, such as researchers.
1.1 Review and recommend changes to the current TRCC charter with a mission, activities, and designated personnel dedicated to open coordination, collaboration, and communication. (DMV)
Strategy 2. Continue Traffic Records Electronic Data System (TREDS) enhancements for data integration. Continue to improve data reporting and mapping.
2.1 Develop enhanced mapping that includes street names, addresses, and route numbers. Enhance ease and accuracy of the front-end mapping of crash locations by reporting officers. (DMV)
2.2 Improve the extent and accessibility of ad hoc queries, reports, and mapping to partner agencies, their contractors, other safety part-ners, and researchers. (DMV)
2.3 Complete the E-Summons pilot project and continue with full integration into TREDS. (DMV)
2.4 Complete the incident reporting and trauma registry TREDS integration projects. (DMV)
2.5 Integrate CODES data and reporting and query tools into TREDS. Investigate additional data elements to incorporate into TREDS. (DMV)
2.6 Integrate specific fields into automated fatal crash processing and reporting from the Fatality Analysis Reporting System (FARS) into TREDS. Pilot the integration of processing and reporting all crash data to the National Highway Traffic Safety Administration (NHTSA). (DMV)
2.7 Increase compliance of law enforcement submissions to TREDS. (DMV)
Data Emphasis Area Plan

352012-2016 strategic highway safety plan
Strategy 3. Monitor and maintain FMCSA objectives and measures for information regarding the commercial vehicle crash reporting system (SafetyNet) and continue to obtain good state data quality ratings.
3.1 Continue to record FMCSA reportable CMV crashes into TREDS. (DMV)
3.2 Work with local and state police to make needed changes to data on the police report. (DMV)
Strategy 4. Implement improved tools and methodologies for safety analysis and research incorporating high-way inventory, traffic, crash, and related data for all public roads.
4.1 Integrate Highway Safety Manual (HSM) methods into VDOT information systems, software, policies, and procedures. Complete pilot SafetyAnalyst data translation and test software functionality, results, and reporting. Develop methods, scope, and projects to improve RNS and annual data translation into SafetyAnalyst. Develop an implementation plan for including HSM and supporting software tools into VDOT policy and procedures, and complete the priority elements of the plan. (VDOT)
4.2 Build on existing data sources and develop a consistent inventory of traffic and safety assets on state maintained roads. Adopt a common data dictionary for core data elements. Provide analytical, reporting, and mapping capabilities to support asset main-tenance, upgrade, and replacement decisions. (VDOT)
4.3 Create a safety data mart integrating available roadway, roadside, and traffic control device asset and condition data with crash and traffic data to support ad hoc safety analysis, mapping, and reporting needs. (VDOT)
4.4 Complete the urban roadway system linear referencing system and mapping project. Consider an effort to populate the roadway and traffic engineering asset data required for SafetyAnalyst. (VDOT)
The SHSP Solution
Data Emphasis Area Plan
Source: Virginia Department of Transportation.

2012-2016 strategic highway safety plan36
Implementation and Evaluation
Leadership and CollaborationThe SHSP update provides Virginia with an enhanced under-standing of the improvements necessary for achieving meaningful reductions in severe crashes and a plan for man-aging roadway attributes, road users, and vehicles to achieve a high level of road safety. Effective implementation of the SHSP vision, mission, goals, and emphasis area strategies requires executive support as well as constant coordination and cooperation amongst all stakeholders. Figure 47 depicts the relationship of the many organizations and entities that will be involved in the successful implementation of the SHSP. The executive leaders and the Steering Committee will provide lead-ership to the emphasis area teams as well as the regional area teams. Executive leaders include Secretaries (e.g., Secretaries of Transportation, Public Safety, Health and Human Resources, and Education) and the heads of private sector organizations. The emphasis area teams, comprised of safety stakeholders from around the Commonwealth, managed the development of the objectives, strategies, and action plans and will monitor their implementation moving forward.
Virginia SHSP Organization Chart 47
The Steering Committee, comprised of key state agency executives and stakeholders, evaluated the safety data, examined effective strategies, and established the con-tent and ownership for the strategies and action steps. This group presented the draft of this report for adop-tion by the executive leaders. This committee will continue to meet regularly to:
» Review progress in each of the emphasis areas; » Provide assistance to the emphasis area teams, when appropriate, to overcome barriers or solve problems;
» Receive regular updates on SHSP-related cam-paigns, training, or other programs;
» Provide guidance on future programs, activities, etc.; » Make recommendation to the executive leaders; and » Determine the need and design of future SHSP updates.
Emphasis area teams also will meet regularly to address the following items:
» Discuss action step implementation progress and coordinate next steps;
» Identify problems or barriers and report to the Steering Committee;
» Determine whether changes are needed in action steps as the plan moves forward; and
» Continually track and report progress.

372012-2016 strategic highway safety plan
Implementation and Evaluation
The plan also calls for the formation of area teams that can implement the SHSP at the local level. In some cases, active programs and collaboration already exists at the regional level, which SHSP stakeholders will utilize for efficiency. It is important to give everyone an opportunity to review the local data and implement the appropriate elements of the SHSP in their own communities. The SHSP approach is to develop regionally customized action plans that meet the specific needs and concerns of the respective regional stakeholders. Figure 47 shows the organization chart for the SHSP.
Evaluation The SHSP includes a comprehensive evaluation plan to track progress and evaluate effectiveness. The plan has an overall goal to reduce deaths and serious injuries by three percent per year through 2016. In addition to the overall goal for the SHSP, each emphasis area team established sim-ilar measurable goals that will be tracked annually. Other performance measures may include results from direct observations (safety belt usage and vehicle speeds); survey data measuring awareness, driver attitudes and behaviors; and activity measures, such as number of citations issued during a high-visibility enforcement campaign or the installation of proven engineering countermeasures, such as median cable barriers or rumble strips.
To capture this information, emphasis area teams will meet periodically to determine what progress has been made on implementation. The teams will identify problems or bar-riers and request assistance from the agency responsible for the action step or the Steering Committee to address issues and overcome challenges. An annual report will pro-vide information about the extent to which each team is implementing the action steps and meeting the proposed measurable objectives. Throughout the implementation process over the next five years, the SHSP will be a dynamic document that stakeholders will review and improve. This type of evaluation will enable Virginia to keep up-to-date with the latest research and tools and make the appropriate adjustments when necessary.
Marketing and Communications One of the first marketing steps was to brand the SHSP. The Steering Committee reviewed several logo designs, color schemes, and slogans, and agreed to the logo shown to the right. Branding helps identify the SHSP and will be used on all SHSP products.
Information on the SHSP is available on the VDOT web site at http://www.virginiadot.org/info/hwysafetyplan.asp. In the future, a separate web site for the plan will be created where safety stakeholders and others can obtain information on upcoming activities, review the status of emphasis area action plans, and obtain other information, such as mate-rials developed for a particular emphasis area or meeting minutes. In addition, an E-newsletter will be developed and disseminated regularly to update safety stakehold-ers on SHSP activities. This E-newsletter also will include synopses of recent traffic safety research from around the country and in Virginia.
FundingFunding is a key element to initiating new or expanded strat-egies to improve highway safety. The major funding sources available for highway safety in Virginia are from NHTSA and Federal Highway Administration (FHWA) programs. To work within the existing funding limits requires agencies to pool resources and prioritize the most effective actions. Virginia will continue to work on improving highway safety with available resources.

2012-2016 strategic highway safety plan38
Virginia SHSP Steering Committee
Gary Brown Department of HealthFrank Cheatham Department of Health, EMSBud Cox Virginia State PoliceCraig Feister Federal Motor Carrier Safety Administration Don Hansen Virginia Department of Fire ProgramsAngelisa Jennings Department of Motor VehiclesMartha Kapitanov Federal Highway AdministrationRaymond Khoury Department of TransportationButch Letteer Department of Motor VehiclesMonty Mills Department of Motor VehiclesDavid Mitchell Department of Motor Vehicles Bill Naff National Highway Traffic Safety Administration, Region IIIKeith Nichols Hampton Roads Transportation Planning OrganizationRobert O’Connor Department of TransportationJennifer Piver-Renna Virginia Department of HealthCamelia Ravanbakht, Ph.D. Hampton Roads Transportation Planning OrganizationMaryann Rayment Department of Motor VehiclesStephen Read Department of TransportationDana Schrad Virginia Association of Chiefs of PolicePaul Sharpe Department of HealthJohn Saunders Department of Motor VehiclesConnie Sorrell Department of TransportationLt. Col. Gene Stockton Virginia State PoliceRobert Weakley Department of Motor VehiclesVanessa Wigand Department of Education
Appendix

