highway infrastructure projects – conception to …
TRANSCRIPT

HIGHWAY INFRASTRUCTURE PROJECTS –
CONCEPTION TO EXECUTION
Prof. A. VEERARAGAVANDepartment of Civil Engineering
Indian Institute of Technology MadrasChennai – 600036.
2
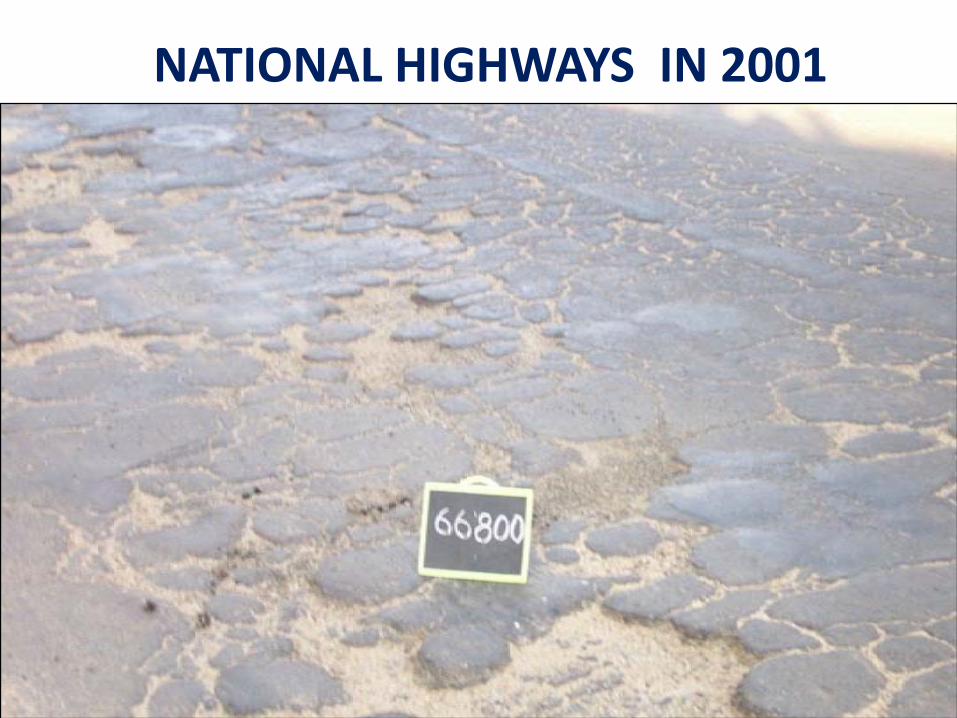
NATIONAL HIGHWAYS IN 2001
3
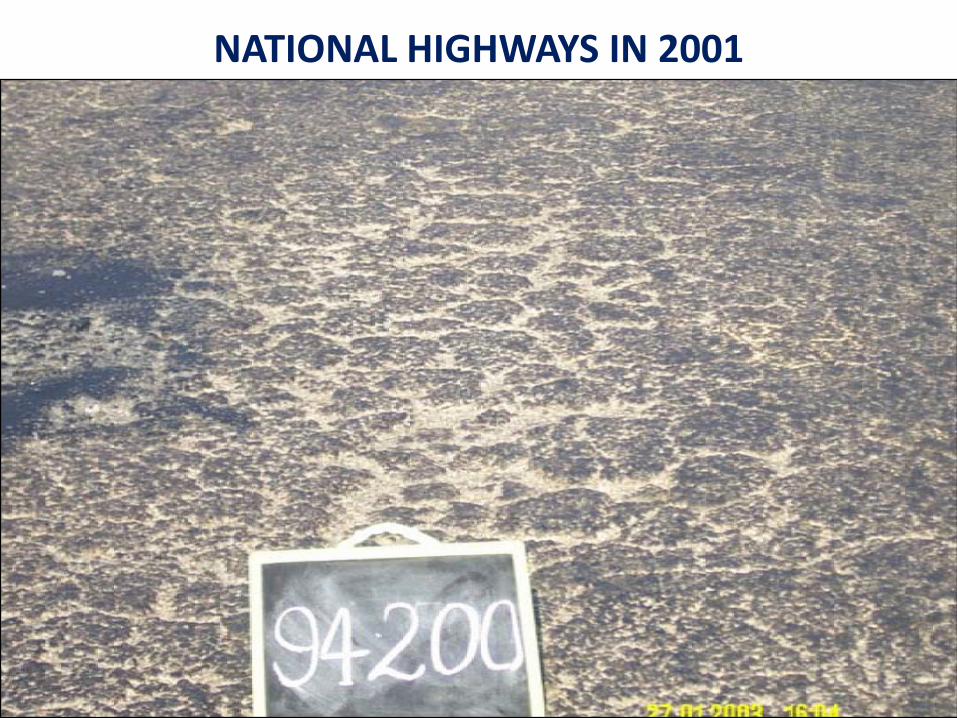
NATIONAL HIGHWAYS IN 2001

4

5

6
“…IT IS NOT WEALTH THAT BUILT THE
ROADS BUT, ROADS THAT BUILT OUR
WEALTH”
- John F. Kennedy

7
INDIAN ROAD NETWORK- CURRENT STATUS (km)
National Highway (NH) & Expressways 1,20,543
State Highways (SH) 1,55,222
Other Roads 52,07,044
Total Road Length 54,82,809
* 65% freight & 80 % passenger traffic on roads * Vehicle growth: 10.16% * NHs are less than 2% of network but carry 40% of total traffic
Source: Annual Report, MORTH, 2017

SEQUENCE OF OPERATIONS• Survey investigation and analysis• Report Preparation
• Pre-feasibility Study• Feasibility Study• Detailed Project Report
• Tendering and Award of Work• Construction – Translating design to reality• Operation and Maintenance
8

Detailed Project Report (DPR)• Steps:
• Topographic survey • Final location survey • Detailed soil survey • Detailed pavement design • Detailed drainage studies• Environmental studies
• Design report• Drawings • Estimation • Technical approval & Financial sanction • Tendering stage

ISSUES• Soil investigation and characterization• Material availability estimation• Pavement component layer material availability
and characterization• Mix design and characterization – soil/aggregates/
bituminous mixes• Traffic Prediction of each class of vehicle• Pavement Design – Choice of pavement type• Performance prediction• Life cycle cost analysis• Economics of alternate designs• Selection of pavement type for construction
10

DESIGN • Types: Flexible, Rigid, Composite• Flexible: 15 Years Design Life, Stage Construction, Standard
Wheel Load, Maintenance as and when needed, Mill andRecycle; Drainage Effect, High Maintenance Cost, High Life CycleCost, Poor Night Visibility, Not Sustainable
• Rigid: Long lasting, Lower LCC, Aggregate Consumption Is Less;Consideration of Spectrum of Axle Loads, Repair is Difficult, Skidrelated issues, Longer Curing Time, Utility Cuts
• Composite: Suitable for medium traffic level; Long lasting andsustainable, low LCC
• Design Factors: Soil Characteristics, Pavement ComponentMaterials characterization, Mix Design, Wheel Loads, SubgradeSoil, Climatic Factors, Drainage and Environmental Factors
• Pavement Type Selection and Thickness Design11

Traffic Growth • Normal Traffic• Generated Traffic
• Diverted Traffic• Induced Traffic
• Developmental Traffico Traffic Prediction
• AADT from ADT and Seasonal Variation• Prediction of Traffic Growth rates for each
class of vehicle• ARIMA model
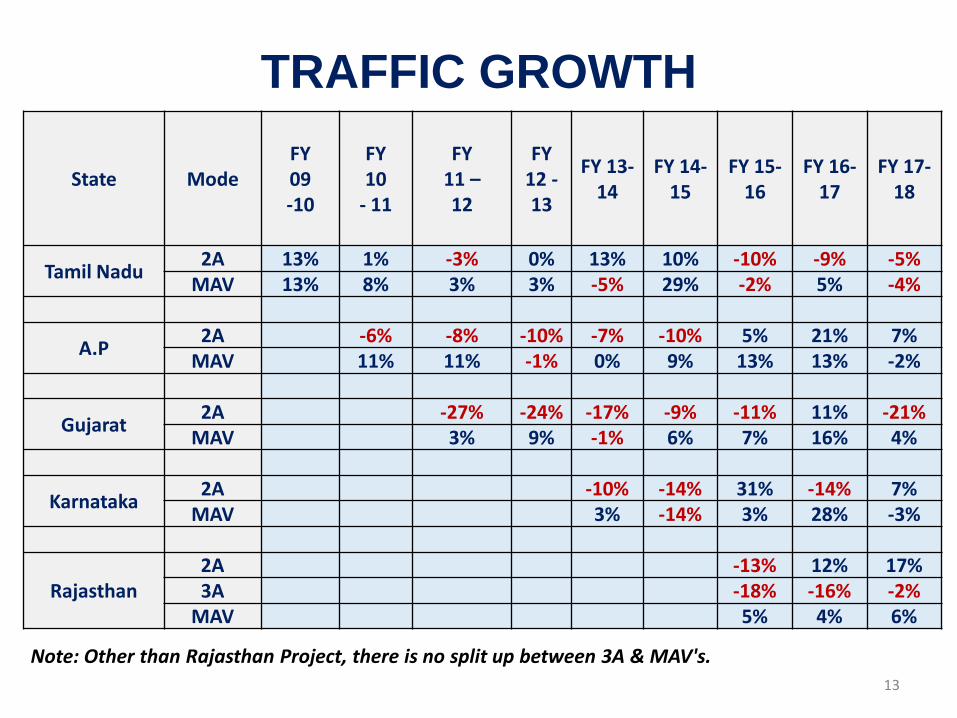
TRAFFIC GROWTH
State ModeFY 09-10
FY 10
- 11
FY 11 –12
FY 12 -13
FY 13-14
FY 14-15
FY 15-16
FY 16-17
FY 17-18
Tamil Nadu 2A 13% 1% -3% 0% 13% 10% -10% -9% -5%MAV 13% 8% 3% 3% -5% 29% -2% 5% -4%
A.P 2A -6% -8% -10% -7% -10% 5% 21% 7%MAV 11% 11% -1% 0% 9% 13% 13% -2%
Gujarat 2A -27% -24% -17% -9% -11% 11% -21%MAV 3% 9% -1% 6% 7% 16% 4%
Karnataka 2A -10% -14% 31% -14% 7%MAV 3% -14% 3% 28% -3%
Rajasthan2A -13% 12% 17%3A -18% -16% -2%
MAV 5% 4% 6%
Note: Other than Rajasthan Project, there is no split up between 3A & MAV's. 13

CONSEQUENCE OF INADEQUATE TIME FOR PROJECT PREPARATION, POOR DESIGN AND
POOR QUALITY OF CONSTRUCTION –PRE-MATURE DISTRESSES
14

15

16

17

18

19

WHAT WENT WRONG?• CBR of the subgrade soil of the constructed pavement
did not match with the design CBR• Compaction of subgrade - lower than the design
requirements• Gradation of Granular Sub-Base - did not meet the
drainage requirements• Compaction of granular layers - lower than the
requirements• Binder quality, mix design requirements, compaction
level of the layers and the choice of the pavementlayers - not as per best practicesCan we get desired the performance from a design based on lab tested / assumed material properties?
20

IMPORTANCE OF RELATING QUALITY OF CONSTRUCTION TO
PERFORMANCE
• How reliable are lab. material test results adopted inpavement design to predict desired performance ofpavements under actual traffic, climate andenvironmental conditions?
• How are the lab. material test results related to field testresults?
• Are they very different? If so, what is their influence ondesign thickness and the predicted performance?
• Can the variability in construction quality be quantifiedand controlled?
• What are their levels of influence on performance?

IMPORTANCE OF RELATING QUALITY TO PERFORMANCE
• How to account the construction quality variability in thedesign process?
• What is the relation between the variability inconstruction quality and the expected “uniform”pavement life/performance?
• What construction parameters are to be consideredduring inspection in order to reduce pavement lifevariance and increased reliability?
• How should the construction practices be improvedthrough process control to ensure desired/predictedlife/performance?

FUNDAMENTAL QUESTIONS• What do we want ? – Materials of needed strength, thickness of
layers as per design/code, stresses and strains within allowablelimit? or Performance - rut/crack/deflection/ roughness etc., withinallowable limits; Or both?
• How do you order? Materials with expected properties and designthickness through MEPDG analysis to ensure satisfactoryperformance
• How do you know, what you get (thickness from design) is whatyou wanted (to ensure satisfactory performance)?
• Sample Size and Tests: How many samples are to be tested?What are the significant QC/QA tests that will ensure “good” qualityconstruction? Which tests significantly ensure satisfactoryperformance?
23
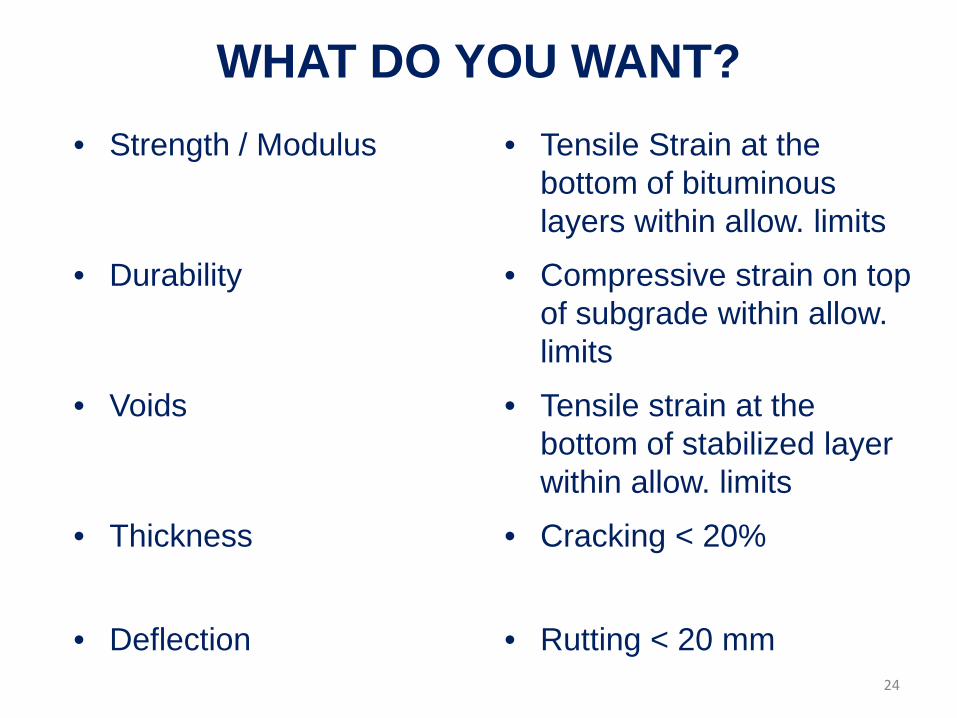
WHAT DO YOU WANT?• Strength / Modulus • Tensile Strain at the
bottom of bituminous layers within allow. limits
• Durability • Compressive strain on top of subgrade within allow. limits
• Voids • Tensile strain at the bottom of stabilized layer within allow. limits
• Thickness • Cracking < 20%
• Deflection • Rutting < 20 mm24

HOW DO WE ORDER?
• Materials that will ensure min. modulus values• Min. thicknesses that will ensure limits of
stresses and strains• Limits of temperature range / moisture range/
traffic levels?• Contract: Method or recipe / End result /
Quality assurance / warranty/ performancebased specifications/proprietary product
25

26


Asphalt
Base
Subgrade
ConstructionParameters
Material Models PavementPerformance
RELATION BETWEEN AS-BUILT QUALITY AND PAVEMENT PERFORMANCE
As-BuiltQuality
PavementPerformance?

“Process”
Fatigue Cracking& Rutting
Layer Moduli
ConstructionParameters
compaction,moisture content& dry density

Construction
PROCESS
Asphalt Content,Compaction,Dry Density,
Moisture Content
Agg. passing 4.75 mmAgg. passing 0.6 mmAgg. Passing 0.3 mmAgg. Passing 0.075 mm
• Fatigue Cracking
• Subgrade Rutting
• AC Rutting• AASHTO
Failure Criterion
Example: Witczak Model for Asphalt Layer
Modulus is a function of:
air voids,asphalt content, agg. passing
0.075 mm,asphaltviscosity,etc…
Construction
Modulus & Thickness of Each Layer
RegressionEquations
Cons
truc
tion
Proc
ess
Cont
rol

Design&Analysis
t2,
t1,
t3,
E1
E3
Pavement Parameters
E2
t2,
t1,
t3,
E1
E3
Pavement Parameters
E2
Analysis
Analysis+2σ
+σ-σ-2σ
µ, COV
PavementPerformance
“Rational” Estimationof Performance( mean, COV )
Main Idea
PavementPerformance
Single Value

Asphalt Content Temperatureetc...etc...
Impact of Construction Parameterson Performance
10%
12%5% 6%
48%
21%P200 Percent Air VoidsViscosity Percent asphalt contentDry density of base Specific gravity of subgrade
PavementPerformance
Time
Thickness of Asphalt Modulus of Asphaltetc...
ConstructionDesignMix
etc...
METHODOLOGY

33%
28%
2%1%
3%
10%1%
3%
8%
7%
4%
OMC MDD COM MCSat SH SW PClayPSilt P40 CBR
33%
28%
2%1%
3%
10%1%
3%
8%
7%
4%
OMC MDD COM MCSat SH SW PClayPSilt P40 CBR
OMCOMC MDD COM MCSat SH SW PClayPSilt P40 CBR
33%
28%
2%1%
3%
10%1%
3%
8%
7%
4%
OMC MDD COM MCSat SH SW PClayPSilt P40 CBR
33%
28%
2%1%
3%
10%1%
3%
8%
7%
4%
OMC MDD COM MCSat SH SW PClayPSilt P40 CBR
OMCOMC MDD COM MCSat SH SW PClayPSilt P40 CBR
Structural Impact Chart
Material Impact Chart
IMPACT CHART
1%
23%
28%14%
29% 5%Thickness of AC Thickness of Base Thickness of SubgradeModulus of AC Modulus of Base Modulus of Subgrade
• Construction translates design recommendationinto reality
• Construction quality - influences performance• How to define construction quality? What tests
define construction quality?• Can we develop pay factors based on quality of
construction? If yes, how?• Need to link construction quality to performance
and in performance prediction models tounderstand the rate of deterioration and plan theschedule for maintenance
34

• Issue: Assume material properties and consequent design forthe desired performance vis-a-vis actual material propertythrough NDT tests based on quality of construction & resultantperformance
• Lab test results are far away from reality
• Lab test results / APTFs do not simulate actual traffic, climateand environmental conditions and also the actual constructionquality
• Field performance is the key as it considers in-situconstruction quality, actual traffic load repetitions under actualclimatic conditions;
• Need of the hour is to collect periodic performance data,through sponsored research and relate theory to practice.
35
SUMMARY• Researchers should relook at their lab. tests on pavement
materials prepared under ideal conditions and expecting thepavement to be constructed under similar conditions in thefield
• Lab performance tests on individual materials prepared atconstant density and voids, tested under constant load,frequency of testing, rest period, temperature, moisture etc.,may not be relevant to predict the field performance of thepavement system under actual traffic, climate,environmental conditions with variation in constructionquality
• Researchers expect the performance of the pavementsystem as they understand, but the pavement system doesnot understand their complicated models and equations.
36

SUMMARY• Prediction of the performance of the pavement
system from limited lab tests on individualmaterials in isolation will be misleading
• Field samples to be tested in the lab to understandthe effect of variability in construction quality on thetest results and relate to field performance
• Field performance data and Non-Destructive Testsin the field to understand the effect of constructionquality on material characteristics, is the need ofthe hour.
37

ACNOWLEDGEMENTS
• Prof. Soheil Nazarian, UTEP, El Paso• Col. Deepak Baskandi, Indian Army
38
THANK YOU…