highway construction or stream destruction: a water
TRANSCRIPT

Western Kentucky UniversityTopSCHOLAR®Honors College Capstone Experience/ThesisProjects Honors College at WKU
Spring 2-5-2018
Highway Construction or Stream Destruction: AWater Quality Analysis in the Black Warrior Basin,Walker County, AlabamaCayla BaughnWestern Kentucky University, [email protected]
Follow this and additional works at: https://digitalcommons.wku.edu/stu_hon_theses
Part of the Chemistry Commons, Geology Commons, and the Geomorphology Commons
This Thesis is brought to you for free and open access by TopSCHOLAR®. It has been accepted for inclusion in Honors College Capstone Experience/Thesis Projects by an authorized administrator of TopSCHOLAR®. For more information, please contact [email protected].
Recommended CitationBaughn, Cayla, "Highway Construction or Stream Destruction: A Water Quality Analysis in the Black Warrior Basin, Walker County,Alabama" (2018). Honors College Capstone Experience/Thesis Projects. Paper 724.https://digitalcommons.wku.edu/stu_hon_theses/724

HIGHWAY CONSTRUCTION OR STREAM DESTRUCTION:
A WATER QUALITY ANALYSIS IN THE BLACK WARRIOR BASIN, WALKER
COUNTY, ALABAMA
A Capstone Project Presented in Partial Fulfillment
of the Requirements for the Degrees Bachelor of Science in Geography/Environmental
Studies and Bachelor of Arts in Religious Studies
with Honors College Graduate Distinction at
Western Kentucky Univeristy
By
Cayla M. Baughn
November 2017
*****
CE/T Committee:
Professor Chris Groves, Chair
Professor Patricia Kambesis
Professor Chris Keller

Copyright by
Cayla M. Baughn
2017

I dedicate this thesis to my friends and family whose love and care has supported me in
the discovery of myself. I also dedicate this thesis to my advisor, Dr. Chris Groves, who
has supported me and my work in even the darkest times with a purely good sense of
humor.

iv
ACKNOWLEDGEMENTS
First, I would like to thank and acknowledge my family members in Alabama and
Tennessee whose field assistance was absolutely indispensable and who transform field
work into a party! I would also like to acknowledge The Honors College at Western
Kentucky University for their assistance in completion of this project through Honors
Development Grants and Pauline Norris at Western Kentucky University’s Advanced
Materials Institute for her assistance with sample analysis and processing. Finally, I
would like to thank the US Environmental Protection Agency for their support of this
publication through Assistance Agreement No. MA-91774901-0 awarded by the U.S.
Environmental Protection Agency to the author. This manuscript has not been formally
reviewed by EPA and EPA does not endorse any products or commercial services
mentioned in this publication. The views expressed in this document are solely those of
the author and do not necessarily reflect those of the Agency.

v
ABSTRACT
In 2012, residents along Freeman Branch Creek in Eldridge, Alabama observed
unusual orange discoloration along the stream and on stream vegetation; an
unprecendented black veneer coating pebbles along the streambed; and life in the stream
seemed to have vanished. Freeman Branch Creek is located in Walker County, Alabama,
which is known for its production of coal and natural gas from the underlying
Pennsylvanian-aged Pottsville Formation, which is the uppermost geologic layer within
the the Black Warrior Basin.
Concerns for environmental safety related to intensive mining operations include
the concern that shallow aquifers will be contaminated by mining in deep reservoir
coalbeds and concern that intensive mining will produce acid mine drainage (AMD).
Most available evidence in the Black Warrior Basin indicates that contamination of
shallow aquifers by mining and mining fluids is unlikely, but no such evidence has been
provided to substantiate the lack of formation of AMD in surface waters of the Black
Warrior Basin.
AMD is an acidic, heavy-metal-containing sulphate solution derived from pyrite
oxidation that may render waterways devoid of life for considerable distances, acidify
waterways, and cause the precipitation of heavy metals. AMD is formed primarily
through the introduction of oxygen to certain minerals, which may occur through mining.
Pyrite is ubiquitous in most coal deposits and when oxidized yields ferrous iron (iron

vi
flocculant), sulphate, acid (in the form of free hydrogen ions), and associated heavy
metals—or AMD contaminants. Given the close proximity of Freeman Branch Creek to
mining operations and the unprecendented stream characteristics that mimicked those of
AMD, it seemed possible that Freeman Branch Creek was impacted by an upstream
source of AMD.
In an attempt to identify the source of impact on water quality at Freeman Branch
Creek, field sampling was conducted in September 2014 and July 2017. Samples were
collected from four locations along Freeman Branch Creek during the first sampling
event and from seven sampling locations during the second field sampling event. Water
samples derivative of the first sampling event were analyzed using alkalinity titrations,
inductively coupled plasma mass spectrometry (ICP-MS) for cations, and ion
chromatography (IC) for anions. During the second sampling event, water samples were
analyzed using alkalinity titrations and an EXO1 100 m depth sonde with temperature,
pH, specific conductivity, total dissolved solids, pressure, and depth-measurement
capabilities was installed in the creek at the first sampling location. Initial pH,
temperature, and specific conductivity were measured on site at each sampling location at
the time of sample collection. Results indicate that an upstream source of AMD is in fact
not the cause of reduced water quality in Freeman Branch Creek. Instead, it seems likely
that lessened water quality is associated with the construction of Highway 22 that
intersects Freeman Branch Creek.
Keywords: Pottsville Formation, Walker County, Black Warrior Basin, mining, acid mine
drainage, water quality analysis

vii
VITA
EDUCATION
Western Kentucky University , Bowling Green, KY August 2017
B.S. in Geography/Environmental Studies Maga Cum Laude
B.A. in Religious Studies
Mahurin Honors College Graduate
Honors Capstone: Highway Construction or Stream Destruction: A Water
Quality Analysis in the Black Warrior Basin, Walker County, Alabama
Westmoreland High School, Westmoreland, TN May 2012
PROFESSIONAL EXPERIENCE
Graduate Assistant at Crawford Hydrology Laboratory 2017-Present
EPA Atlantic Ecology Division EPA GRO Intern 2016
Project Grow Fellow at WKU Office of Sustainability 2014-2015
USAID Climate Change Adaptation Student Researcher 2014
WKU Delegate to Kentucky Student Environmental Coalition 2013-2014
Technician’s Assistant at USDA ARS Hydrology Laboratory 2012-2014
AWARDS & HONORS
2015-2017, EPA GRO Fellowship, Environmental Protection Agency.
2015-2017, Faculty-Undergraduate Student Engagement (FUSE) Grant, Western
Kentucky University.
2015, Udall Scholarship Nominee, Udall Foundation.
2015, Lifetime Experience Grant, Western Kentucky University.
2015, 2014, 2013, Honors Development Grant, Western Kentucky University.
2012, Regent Scholarship, Western Kentucky University.

viii
PROFESSIONAL MEMBERSHIPS
2012-Current, Kentucky Academy of Science.
2015-2017, Mammoth Cave Group of the Cumberland Chapter of the Sierra Club.
2016, New England Estuarine Research Society.
INTERNATIONAL EXPERIENCE
2017, International Research Center on Karst International Training Course on Karst
Hydrogeology, Environmental Geology, and Ecological Geology and Training
Course on Groundwater and Environmental Geology Investigation and Evaluation
for ASEAN Member States, Kunming, Yunnan Province, China.
2015, Iceland Summer Abroad: The Climate Change Challenge, Study Abroad Courses.
PRESENTATIONS
Baughn, C., Martin, R., McKinney, R., and Wigand, C. (2017). Effects of Sea Level Rise
on the Salt Marsh Critical Zone: A Case Study. Oral presenation at the
International Research Center on Karst International Training Course on Karst
Hydrogeology, Environmental Geology, and Ecological Geology and Training
Course on Groundwater and Environmental Geology Investigation and Evaluation
for ASEAN Member States. Kunming, Yunnan Province, China.
Baughn, C. (2017). Sustainability and Season Extension: A Kentucky Case Study of Low
Tunnels in Action. Oral presentation at the WKU Student Research Conference.
Bowling Green, KY.
Baughn, C., Harkins, C., Losekamp, K., and Stickney, C. (2017). Pathways for
Environmental H2SO4 Contamination from Disturbance of Geologic Materials.
Poster presentation at the Posters at the Capitol Research Conference. Frankfurt,
KY.
Baughn, C., Martin, R., McKinney, R., and Wigand, C. (2016). Marshes on the Move:
Testing effects of seawater intrusion on vegetation communities of the salt marsh-
upland ecotone. Poster presentation at the New England Estuarine Research
Society (NEERS) Conference. Block Island, Rhode Island.
Baughn, C. and Groves, C. (2015). H2SO4 Contamination of Freeman Branch Creek, AL
from Disturbance of Geologic Materials during Highway Construction. Poster
presentation at the Geography and Geology Department Honors Night
Symposium, WKU REACH Kickoff Reception, and WKU Student Research
Conference. Bowling Green, KY.

ix
CONTENTS
Acknowledgements ............................................................................................................ iv
Abstract ............................................................................................................................... v
Vita .................................................................................................................................... vii
List of Figures ..................................................................................................................... x
List of Tables……………………………………………………………………………..xi
Introduction ......................................................................................................................... 1
Literature Review................................................................................................................ 3
Study Area ........................................................................................................................ 16
Methods............................................................................................................................. 19
Results ............................................................................................................................... 21
Discussion ......................................................................................................................... 28
Conclusion……………………………………………………………………………….31
References ......................................................................................................................... 33

x
LIST OF FIGURES
Figure 1. Walker County Geologic Map…………………...............................................16
Figure 2. Study Area Map (September 2014)…………………………………………...17
Figure 3. Study Area Map (July 2017)...………………………………………………..18
Figure 5: Freeman Branch Creek: Temperature and pH………………………………...24
Figure 6: Freeman Branch Creek: Pressure and Depth………………………………….25
Figure 7: Freeman Branch Creek: Specific Conductivity and TDS………………….....26

xi
LIST OF TABLES
Table 1: Anion Concentration Table………………………............................................21
Table 2: Cation Concentration Table……………………………………………………22
Table 3: Alkalinity Concentration Table (September 2017).……………………………23
Table 4: Alkalinity Concentration Table (July 2017)…………………………………...23

1
INTRODUCTION
In 2012, residents along Freeman Branch Creek in Eldridge, Alabama observed
unusual orange discoloration along the stream and on stream vegetation. An
unprecendented black coating covered what were typically white, rounded quartz pebbles
in the stream and life in and around the stream appeared to be diminished. Freeman
Branch Creek is located in Walker County, Alabama, which is known for its production
of coal and natural gas from the underlying Pennsylvanian-aged geological Pottsville
Formation. Indeed, two coal mines are located within a few miles of the observed
contamination in Freeman Branch Creek (Mellen 1947, Pashin 2007).
The Pottsville Formation is a Pennsylvanian-aged formation and the uppermost
geologic layer within the Black Warrior Basin. Pennsylvanian-aged clastic and coal-
bearing rocks of the southeastern United States, including the Pottsville Formation, often
contain sulfide minerals, especially pyrite (FeS2). When these sulfide-containing rocks
are disturbed by mining or construction, pyrite can be exposed to weathering, resulting in
pyrite oxidation that produces sulfuric acid and ferric iron in solution. Since iron and
other metals that may also be present have strongly pH-dependent solubilities, acidic low
pH H2SO4 solutions, called “acid mine drainage” (AMD), can have relatively high metal
concentrations. If the pH of a given solution then increases via buffering (for instance, as
water flows along a stream) these metals can precipitate in various forms along
streambeds. Examples of metal precipitates include iron flocculent, which appears as a

2
red coating along stream beds, and manganese precipitate, which appears as a black
coating upon rocks within the streambed. Since the Pennsylvanian Pottsville Formation
underlying the area is a prominent zone of coal production, and since surface mining was
taking place near the site, it appeared likely that AMD was the source of the stream
contamination (Thomas 1988, Webb and Sasowsky 1994, Banks et al. 1997).
To determine if AMD was in fact the cause of the anomalous colorful coatings
along the stream and to understand related potential impacts on water quality, subsequent
field investigations were undertaken in September 2014 and July 2017. The purpose of
this research is to determine the source(s) of impacts on the stream chemistry of Freeman
Branch Creek.

3
LITERATURE REVIEW
Geomorphology and Paleogeomorphology of the Black Warrior Basin
The Paleozoic-age Black Warrior Basin in Alabama and Mississippi is a 35,000-
square-mile triangle-shaped foreland basin, or a basin created as a consequence of
mountain-building (orogenic) activity. Foreland basins usually result from tectonic
subsidence, or the action of one tectonic plate moving beneath another. Foreland basins
form between the craton and the contracting, usually fold-thrust orogenic belt, where a
fold-thrust orogenic belt is a belt of mountain foothills created by intense folding and
thrust faulting associated with subsidence of the continental crust. (Thomas 1988,
Decelles and Giles 1996, Waldron 2016).
The Black Warrior Basin is also a southwestward-dipping homocline, or a geologic
formation whose compositional strata dips consistently in one general direction, although
the degree of the dips may vary substantially. The Black Warrior Basin homocline dives
beneath the front of the Paleozoic Appalachian-Ouachita fold-thrust belt, although it is
interrupted by a collection of northwest-trending normal faults which extend across the
entirety of the Black Warrior Basin. The age of the northwest-trending normal faults is
not clearly defined. The Black Warrior Basin was deposited in a shallow inland sea
environment when the Black Warrior basin was a part of the continent’s stable interior.
Two-thirds of the Black Warrior Basin are buried beneath Gulf Coastal Plain and

4
Mississippi Embayment strata that was deposited during the Mesozoic era and Tertiary
period (Thomas 1988).
Early geographic delineation of the Black Warrior Basin suggested that the Basin was
bounded by the state of Tennessee to the north, the Alabaman Appalachian Mountains to
the southeast, and the buried Ouachita Mountains of northern Mississippi and Arkansas
to the southwest. More recent work has suggested that the Basin is bordered by the
Nashville Dome and an extension of the Ozark Dome to the north; a low arch that
emanates southeastward from the Nashville Dome that separates the Black Warrior Basin
from the Appalachian foreland basin; and a southwestward-diving Paleozoic arch, in
addition to a Mississippi Valley graben, that separates the Black Warrior Basin from the
Arkoma foreland basin to the west. A graben is a depressed block of the earth’s crust that
is lower in elevation relative to the crust on either side of it, and that is separated from the
adjacent earth crust by parallel normal faults (Mellen 1947, Pike 1968, Mellen 1977,
Horsey 1981, Thomas 1988). Other interpretations suggest that the Black Warrior Basin
is delineated by an “erosional escarpment along the Tennesee River Valley” (Horsey
1981, p. 799) to the north and agrees with the traditional interpretation that the Basin is
delineated by the Appalachians to the southeast and the buried Ouachita mountains to the
southwest (Mellen 1947, Pike 1968, Horsey 1981, Thomas 1988, Mellen 1977).
Geology of the Black Warrior Basin
The oldest sedimentary rocks in the Black Warrior Basin are of Cambrian age and the
youngest strata are Pennsylvanian in age. The Black Warrior Basin is characterized by

5
two predominant lithologies: Cambrian to lower Mississippian shallow-marine shelf
facies that harken to a passive continental margin and a later Mississippian to
Pennsylvanian lithology of shallow-marine to deltaic facies that were associated with the
evolution of a foreland basin. Facies are the physical character of strata, which is
determined by the specific ancient depositional environment. Shelf facies specifically are
facies that are characterized by fossilized shells and carbonate rocks that indicate
sedimentary deposition in a neritic environment. A continental margin is the border of a
continental plate, i.e. a coastline, that is not undergoing disruptive tectonic activity and
that usually accumulates large quantities of sediment along the peaceful continental shelf
(Thomas 1988, Strickler 1997).
The Pennsylvanian Pottsville Formation is a component of the clastic wedge that
overlays the Mississippian strata. The diverse composition of the Pennsylvanian
sandstone portion of the clastic wedge, including sedimentary, metamorphic, and igneous
sand grains, indicates that the clastic wedge resulted from the subduction of the southern
edge of the North American crust in the southerly direction. The Pennsylvanian portion
of the clastic wedge reaches a maximum thickness of over 2,700 m, although some
Pennsylvanian strata were removed by erosion during the Mesozoic Era. The Pottsville
Formation may be informally subdivided into two subunits: the lower and upper
Pottsville Formations (Thomas 1988).
The lower Pottsville Formation in the eastern Black Warrior Basin is
composed of six ancient successive barrier complexes. A back-barrier, in addition to a
lagoonal environment, likely existed to the southwest of the barrier complexes, as well as

6
in the western Black Warrior Basin, where the coal and shale members of the Formation
developed. The lower Pottsville Formation in the western portion of the Black Warrior
Basin suggests sporadic delta evolution, specifically including marine barrier, paleo-
beach or foreshore, tidal-channel, and tidal flat environments (Horsey 1981, Thomas
1988).
The sedimentation of the upper Pottsville Formation suggests a paleogeographic
environment of transition from a lower (below sea level) to an upper (above sea level and
coast line) delta plain. The majority of the coal groups within the upper Pottsville
Formation are indicative of a paleogeographic depositional environment defined by inter-
distributary bays or marshes, but coal derivative of backswamps and abandoned channels
has been identified. The mudstone-sandstone interbedding patterns of the upper Pottsville
Formation indicate a paleogeographic environment of distributary-channel sands. The
sandstones of the Upper Pottsville Formation suggest a paleogeographic environment of
tidal/marine distributary-channels, deltas, and barrier bars of a barrier system around a
delta front (Thomas 1988).
Lithology and Stratigraphy of the Black Warrior Basin
The oldest sedimentary rocks in the Black Warrior Basin are of Cambrian age and
overlay a Precambrian crystalline-rock basement layer that is composed of granite,
rhyolite, granodiorite, and basalt. The youngest strata of the Black Warrior Basin are
Pennsylvanian in age and are overlain by Cretaceous strata in the western part of the
basin and are exposed in the eastern part of the basin. The western part of the basin is

7
overlain by Mesozoic-Cenozoic strata of the Gulf Coastal Plain. The Black Warrior Basin
is characterized by two predominant lithologies: Cambrian to Early Mississippian
shallow-marine shelf facies (predominantly dolomite and dolomitic limestone) and a later
Mississippian to Pennsylvanian lithology of shallow-marine to deltaic strata (Pike 1968,
Thomas 1988, Strickler 1997). Since the oldest predominant lithological sequences in the
Black Warrior Basin, the Cambrian to Early Mississippian shallow-marine shelf facies,
have little to no interaction with the surface and so little relevance to acid mine drainage,
discussion of geology in the Black Warrior Basin will be limited to that of the youngest
lithological sequence in the Basin and the youngest geological formation within that
sequence: The Pennsylvanian Pottsville Formation.
The Pottsville Formation is composed of as much as 3,000 meters of sandstone
and shale, and lesser amounts of clay and coal. Due to tectonic activity, sediment atop the
northern Pottsville Formation was eroded so that the younger strata of the Pottsville
Formation are exposed in the northeastern reaches of the Black Warrior Basin. In the
early 1800s, the Pottsville Formation first came to be subdivided into two distinct
geologic subdivisions: the upper subdivision conducive to coal production and the lower
subdivision not conducive to coal production (Horsey 1981, Thomas 1988, Pashin 2007).
The lower Pottsville Formation is composed of three distinct, adjacent rock types:
massive orthoquartzite sandstone in the eastern Black Warrior Basin, mudstone
interbedded with rare and thin sandstone beds in the central Black Warrior Basin, and a
cyclical sequence of sandstones and mudstones in the western Black Warrior Basin.
Reports of shale and coal in the lower Pottsville Formation also exist, and although coal

8
beds are thin in the lower Pottsville Formation, coal is occasionally mined in regions
where the coalbeds thicken (Pike 1968, Horsey 1981, Thomas 1988).
The upper Pottsville Formation is the uppermost formation in the Mississippian-
Pennsylvanian clastic wedge and is composed of a sequence of vertically-stacked
parasequences, which are successions of conformable beds that display marine
progradation and are capped by stratigraphic layers of maximum marine flooding
surfaces. Conformable beds exhibit consistent deposition through time and do not contain
any unexplained lack of deposition (as opposed to uncomformable beds, which do exhibit
gaps in deposition over time). The Pottsville parasequences are composed of marine shale
at the base of their strata upon which are stacked coal beds, marginal-marine, and non-
marine sandstone and shale (Pike 1968, Horsey 1981, Thomas 1988, Lopez-Blanco 1993,
Pashin 2007, Frostick 2009, Holland 2016).
The upper Pottsville Formation is dominated by gray mudstone, thick shale
sequences, coal beds, and sandstone beds. Several sandstone units have been termed
“members,” including the Razburd Sandstone Member and the Camp Branch Sandstone
Member. Thick shale sequences overlie the sandstones, each of which contains up to six
coal beds. Coal in the upper Pottsville Formation is more geographically prevalent than in
the lower Pottsville Formation, and occurs in thicker beds. (Pike 1968, Horsey 1981,
Thomas 1988).
Resource Exploration and Exploitation in Walker County and the Black Warrior
Basin

9
The Black Warrior Basin is known for its gas, oil, and coal-production
capabilities (minor tar sands may also be found in northern Black Warrior Basin
Mississippian sandstones). The first resource exploitation in the Black Warrior Basin was
undertaken by the US Bureau of Mines whose primary concern was the alleviation of
hazards by natural gasses in underground coalmines. Although the first true gas
production took place in 1909, the Black Warrior Basin’s coalbed methane resources
(found exclusively in the upper Pottsville Formation in the eastern part of the Black
Warrior Basin) have been explored and exploited for longer than almost any coalbed
methane resource site in the world. Natural gas is predominantly produced from
Mississippian sandstones, although comparatively small amounts of gas are produced
from Pennsylvanian sandstones as well. Notably, natural gas is still derived from Walker
County, Alabama today. The Black Warrior Basin remains one of the most productive
coalbed methane production sites worldwide (Pike 1968, Thomas 1988, Pashin 2007).
In 1947, the Birmingham area of Alabama and the Black Warrior Basin was
known for its production of coal, iron ore, limestones, and dolomites, the last two of
which were used to create limes, cements, and fluxes (fluxes are used for various
purposes in metallurgy). In 1947, Walker County was known for its gas production, albeit
in limited quantities (Mellen 1947, Pashin 2007). Today coal is still mined through both
surface and underground mining from Pennsylvanian strata of the Pottsville Formation in
the eastern part of the Basin, including in Walker County, although minor amounts of oil
are produced from Mississippian sandstones as well (Pike 1968, Thomas 1988, Pashin
2007).

10
Oil and gas production from the Pottsville Formation, now the most productive
formation in the basin, was not established until at least after 1968 when Pike published
“Black Warrior basin, northeast Mississippi and northwest Alabama” (1968). By 1968,
many oil shows were identified in the Pottsville formation, but extensive exploration
failed to generate production from the Pottsville Formation. Commercial production of
coalbed methane has occurred in the Basin since 1980 (Pike 1968, Thomas 1988, Pashin
2007).
Environmental Issues Associated with Coal and Related Resource Extraction
Coalbed Methane Production
Three types of methane wells are drilled in the Black Warrior Basin: vertical, gob,
and horizontal wells. Vertical wells are similar to conventional oil and gas wells, are the
most common well type in the Basin, and can be drilled anywhere that coal has not yet
been mined. In contrast, gob and horizontal wells are drilled in connection to long-wall
coal mines. Gob wells are created by drilling to a short distance (within about 8 meters)
above the coal bed to be mined, thus causing the roof to collapse, which, in turn, causes
the floor to heave, which produces gas through the associated fracturing of adjacent
strata. Horizontal wells are drilled into longwall panels before active mining is pursued to
reduce the hazard posed by gases. The majority of vertical wells in the Basin are still
active (Pashin 2007).
Water produced through coalbed methane production is most often disposed of
through stream discharge after treating the produced water and circulating the water

11
through storage ponds that are lined with synthetic membranes to prevent leakage. These
storage ponds also sometimes harbor monitoring wells. The treatment system used to
process waters produced through coalbed methane production works by removing
sediment from the water through suspension settling and allowing the flocculation of
dissolved Mn and Fe compounds through aeration of the water. Mn and Fe compounds
that reach concentrations of more than 35 mg/L also can be removed. To ensure the
safety of ecosystems, TDS concentrations should be lower than 230 mg/L as determined
by the Geological Survey of Alabama.
Southwestern coalbed methane fields were developed largely between 1980 and
2000, at which point large quantities of saline waters were produced through the mining
process. The production of saline waters necessitated disposal through underground
injection, primarily into the sandstone portion at the base of the lower Pottsville
Formation, limestone and chert of the Devonian System, and dolostone near the top of the
Cambrian-Ordovician Knox Group at depths ranging from 1300 to 3050 m below the
surface (Pashin 2007).
Most coalbed methane produced in the Black Warrior Basin is produced from
coalbed seems at depths ranging from 150 to 1000 m below the surface—thus, concerns
regarding possible interrelationship between shallow aquifers and coalbed methane
production have arisen. Shallow aquifers in the Black Warrior Basin supply domestic-use
water, and domestic-use water is also derived from water in coalbeds as deep as 75 m
below the surface. The use of coalbed waters for domestic purposes gives rise to two
primary concerns: the potential drawdown of these domestic-use waters by the coalbed

12
methane industry and contamination of this water by hydraulic fracturing fluids (Pashin
2007).
Water flows through the sandstone and shale portions of the upper Pottsville
Formation almost exclusively through fractures in the strata because it exhibits extremely
low matrix permeability (<0.06 mD). Alternatively, coal in the upper Pottsville
Formation is the only substantial reservoir rock and/or aquifer in the formation due to
closely-spaced joints in the coal, and thus elevated permeability. However, coalbed
methane reservoirs in the basin are highly heterogenous because the bulk permeability of
coal in the Formation is strongly responsive to stress. In addition, permeability can differ
at any given depth by an order of magnitude (Pashin 2007).
Although some gaseous interchange between closely-spaced coal beds has been
documented, it has been shown that the thick beds of shale and sandstone in the Pottsville
Formation help to confine flow to coal zones only. Additional work has shown that coal
beds in alternate stratigraphic locations contain unique and independent flow systems and
are characterized by varying permeability anisotropy. It has also been shown that many
zones along faults of the Pottsville Formation are sealed due to the cementation of
fractures and closely-spaced joints with calcite. Therefore, the highly-compartmentalized
condition of inter-lithological flow renders contamination of shallow aquifers and
domestic-use water a very low threat (Pashin 2007).
Although concern for environmental safety and coalbed methane production is
usually focused on issues related to the hydrological relationship between shallow
aquifers and deep reservoir coalbeds, most available evidence in the Black Warrior Basin

13
indicates that flow within the coalbeds is effectively confined by thick marine shale strata
with little to no intermingling with shallow aquifers (cross-formational flow is limited)
(Pashin 2007).
Acid Mine Drainage
Another issue often associated with coal extraction is acid mine drainage. Acid
mine drainage (AMD) is an acidic, heavy-metal-containing sulphate solution derived
from pyrite oxidation. AMD is formed primarily through the introduction of oxygen to
minerals that reside deep in the earth through mining (these minerals are also brought to
the surface occasionally in the form of spoil tips). These minerals, which were previously
in a reduced state, are then oxidized. Many of these minerals are sulphides, which
produce, rather than consume protons through the oxidation process. Pyrite, an iron
disulphide, is a mineral that is ubiquitous in most metal sulphides, as well as in coal
deposits, and may exist in association with other chalcophile elements. When oxidized,
pyrite yields ferrous iron (iron flocculant), sulphate, acid, and associated heavy metals
(Banks et al. 1997).
Waterways effected by AMD (characterized by low pH values and high iron content)
may be devoid of life for considerable distances. AMD is generated by the oxidation of
sulphide minerals, primarily pyrite, and by the oxidation of marcasite and other metal
sulphides like chalcopyrite to a lesser extent. Sedimentary pyrite found in sandstones and
shales that occur simultaneously with coal deposits in the Eastern U.S. is tremendously
more reactive than hydrothermal pyrite, which occurs in conjunction with base metal

14
deposits (Webb and Sasowsky 1994). The oxidation of pyrite usually occurs through the
exposure of pyrite to oxygen and water through mining operations and oxidizes according
to the following reactions:
𝐹𝑒𝑆2(𝑠) +7
2𝑂2 + 𝐻2𝑂 = 𝐹𝑒2 + 2𝑆𝑂4
2− + 2𝐻+ (1)
𝐹𝑒2+ +1
4𝑂2 + 𝐻+ = 𝐹𝑒3+ +
1
2𝐻2𝑂 (2)
𝐹𝑒3+ + 3𝐻2𝑂 = 𝐹𝑒(𝑂𝐻)3(𝑠) + 3𝐻+ (3)
In the first equation, the sulphide present in the pyrite is oxidized to sulphate, which
releases ferrous iron and hydrogen ions (acidity) into the solution. In equation two, the
dissolved ferrous iron is oxidized to ferric iron. However, it should be noted that the
oxidation of ferrous iron to ferric iron can be catalyzed by microbial activity, especially
by the autotrophic iron bacteria Thobacillus ferrooxidans and other microaerophiles
which require only very little oxygen to survive. Oxidation of ferrous to ferric iron may
also occur through mechanical aeration, which increases the rate at which amorphous
ferric hydroxide particles with enlarged surface areas can form. The rate of oxidation is
proportional to the surface area of the ferric hydroxide particle in this type of oxidation
catalysis (Wicks and Groves 1992, Webb and Sasowsky 1994).
Finally, in equation three, the ferric iron hydrolyzes to create insoluble ferric
hydroxide (i.e. ferrihydrite, or “yellow boy”), and more hydrogen ions (acidity) are
released into the solution. It should be noted that ferric hydroxide may also contain
considerable quantities of elements other than iron, including silica, sulphate, aluminum,
or arsenic. In rare cases, hydrate iron, zinc, and manganese sulphates may also precipitate

15
along the banks of waterways effected by acid mine drainage. Ferric hydroxide is also of
interest in that a coating of ferric hydroxide on pyrite surfaces will significantly reduce
the rate of oxidation of the pyrite, and thus slow the rate at which acid mine drainage
develops. The oxidation of one mole of pyrite ultimately releases four moles of hydrogen
ions, which renders the decomposition of pyrite one of the most acidic of all weathering
reactions (Wicks and Groves 1992, Webb and Sasowsky 1994).
In addition to oxidation by reaction with oxygen and water, pyrite may also be
oxidized by dissolved ferric iron through the following reaction:
𝐹𝑒𝑆2(𝑠) + 14𝐹𝑒3+ + 8𝐻2𝑂 = 15𝐹𝑒2+ + 𝑆𝑂42− + 16𝐻+ (4)
Pyrite reacts with dissolved ferric iron and water to produce ferrous iron, sulphate, and
hydrogen ions (acidity). The vital implication of this reaction is that oxygen is only
necessary for the microbial catalysis of oxidation from ferrous to ferric iron. Pyrite will
be oxidized by ferric iron without the presence of oxygen otherwise. Thus, methods of
AMD abatement that include the limitation of the entrance of oxygen into the system will
not necessarily halt the production of acid mine drainage (Webb and Sasowsky 1994).

16
STUDY AREA
The study was conducted at Freeman Branch Creek in Eldridge, Walker County,
Alabama, in Alabama’s Black Warrior Basin. The portion of Freeman Branch Creek
under study flow acriss the Pottsville Formation and is located in a densely forested
(mixed deciduous and coniferous) and rural area, although coal mines are located in the
area. No grazing animals have access to, or even graze near the creek, although domestic
Figure 1: A map displaying the geology of Walker County, Alabama and
adjacent counties, as well as the path of Highway 22. Created by Chris Harkins.

17
animals often visit the creek in the study area. Very few residences are even within
walking distance of the sampling locations so the potential for householder contamination
is limited. The first set of field testing was conducted on September 25, 2014 at a stretch
of Freeman Branch Creek that spans from slightly north of where Freeman Branch Creek
intersects New River Road until just north of the intersection of Freeman Branch Creek
and Highway 22.
Figure 2: A map displaying the sampling locations during the September 25, 2014
field visit. Points 422 and 423 were test sites where no data was collected. Created
by Sarah Zibert.

18
The second set of field testing was conducted on July 13, 2017 and spanned a
stretch of Freeman Branch Creek from just north of where Freeman Branch Creek
intersects New River Road until about a mile north of where Freeman Branch Creek and
Highway 22 intersect. At this location, Freeman Branch Creek splits into east and west
forks. Sampling during the second set of field sampling was conducted at both forks just
upstream from their confluence.
Figure 3: A map displaying the sampling locations
during the July 13, 2017 field visit. Created by
Cayla Baughn.

19
METHODS
Field sampling was conducted on September 25, 2014 and July 13, 2017. The
2014 sampling event was conducted through the stretch of Freeman Branch Creek that
extends from just north of the intersection of Freeman Branch Creek and New River
Road to just north of where New River Road intersects Highway 22. In 2017, field
sampling was conducted along the stretch of Freeman Branch Creek that extends from
the same location (just north of where Freeman Branch Creek intersects New River
Road) to about one mile north of the intersection of Freeman Branch Creek and Highway
22, as well as beyond this point to the constituent east and west forks of Freeman Branch
Creek where one sample was taken from each tributary just upstream from their
confluence.
Water samples were collected from each sampling location in triplicate. Samples
were collected from four locations along Freeman Branch Creek during the first sampling
visit (three south of Highway 22 and one north of Highway 22) and from seven sampling
locations during the second field visit (four north of Highway 22 and three south of
Highway 22). On both occasions, samples were taken and stored at natural temperatures
for the duration of the field sampling event. The samples were then kept on ice until they
were transferred to a refrigerator.
During the second field visit, an EXO1 100 m depth sonde with temperature, pH,
specific conductivity, TDS, pressure, and depth-measurement capabilities was installed in

20
the creek at the first sampling location using a PVC pipe of appropriate size to protect the
exterior of the device and rope to secure the PVC pipe and sonde to trees on both sides of
the creek, which secured the sonde in the creek. The sonde recorded data for the
preceding parameters twice per second and averaged the parameter values every fifteen
minutes, at which point the 15-minute-average data values were recorded. The sonde was
deployed on July 13 2017 at 2:30 PM and collected data through August 6 at 1:00 PM.
During the second field visit, initial pH, temperature, and specific conductivity were
measured on site at each sampling location at the time of sample collection.
Water samples were analyzed using alkalinity titrations, inductively coupled
plasma mass spectrometry (ICP-MS) for cations, and ion chromatography (IC) for
anions. ICP-MS and IC analyses of samples derivative of the first field visit were
conducted on November 10, 2014 at Western Kentucky University’s Advanced Materials
Institute. Samples used for IC and ICP analysis were frozen upon reaching Bowling
Green, KY until the date of analysis. Water samples derivative of the first field visit were
analyzed for alkalinity using alkalinity titrations on September 26, 2014 at the Advanced
Materials Institute as well. Water samples derivative of the second field visit were only
analyzed for alkalinity at Western Kentucky University’s HydroAnalytical Laboratory on
September 26, 2017.

21
RESULTS
The field sampling event in 2014 was undertaken at four locations along Freeman Branch
Creek which are designated by the following labels: 424, 425, 426, and 427 (see Figure
2). However, to indicate the concentration of stream parameters in the downstream
direction, results will be reported in the following order: 425, 426, 427, and 424.
Likewise, nine water samples from seven additional sampling locations were taken from
Freeman Branch Creek on July 13, 2017 (see Figure 3) and the results of the analysis of
these samples will be reported in the following order to reflect dissemination of stream
parameters in the downstream direction: 2, 3, 4, 5, 6, 7, 8, 9, and 1.
Field samples collected in September 2014 were analyzed using IC and ICP-MS
technology to quantify the anions fluoride, chloride, bromide, nitrate, nitrite, phosphate,
and sulfate, as well as twenty-six cations. Alkalinity titrations were conducted to
Element 425 426 427 424
Fluoride 0.065 0.124 0.064 0.144
Chloride 1.73 2.66 1.722 1.891
Bromide N.D. N.D. N.D. N.D.
Nitrate 0.215 0.441 0.113 0.239
Nitrite N.D. N.D. N.D. N.D.
Phosphate N.D. N.D. N.D. N.D.
Sulfate 35.628 35.522 24.59 41.128
Table 1: Table of ion chromatography data indicating the concentration (in ppm) of
certain anions in September 2014 water samples.

22
determine the stream alkalinity. The anions bromide, nitrite, and phosphate were non-
detect in the water samples, and although the concentration of sulfate was more than ten
times that of almost every other anion, all anion concentrations were well within the
bounds of EPA primary and secondary drinking water standards, including sulfate ((a)
EPA 2017 (a), (b) EPA 2017)(See Figure 4).
Element 425 426 427 424
Aluminum 0.0733 0.0859 0.0549 0.085
Arsenic 0.008 0.0129 0.0157 0.0082
Barium 0.0125 0.0112 0.0167 0.0086
Beryllium N.D. N.D. 0.0001 N.D.
Calcium 12.16 11.74 11.96 12.72
Cadmium N.D. N.D. N.D. N.D.
Cobalt 0.0571 0.0942 0.0573 0.007
Chromium 0.0005 0.001 0.0003 0.0003
Copper 0.0005 0.0015 0.0008 0.001
Iron 0.0008 0.0242 0.0073 0.0037
Potassium 3.47 6.649 3.84 3.248
Magnesium 16.17 15.36 15.63 16.81
Manganese 0.0003 0.3249 0.0016 0.0108
Molybdenum N.D. 0.0006 0.0007 0.0009
Sodium 3.705 3.448 3.371 3.807
Nickel 0.0066 0.0069 0.006 0.0078
Phosphorous 0.0185 0.0695 0.0219 N.D.
Lead 0.0082 0.0088 0.0084 0.0112
Sulfur 13.36 13.29 9.568 15.28
Antimony 0.066 0.0019 0.0059 0.0101
Selenium 0.0166 0.021 0.013 0.0106
Silicon 3.989 3.244 3.1 4.46
Strontium 0.043 0.0373 0.0383 0.0425
Titanium N.D. 0.0015 0.0003 0.0024
Vanadium 0.0007 0.0005 0.0004 0.0007
Zinc 0.004 0.0129 0.0007 0.0018
Table 2: Table of ICP-MS data indicating the concentration (in ppm) of
certain cations in water samples from July 2017.
23
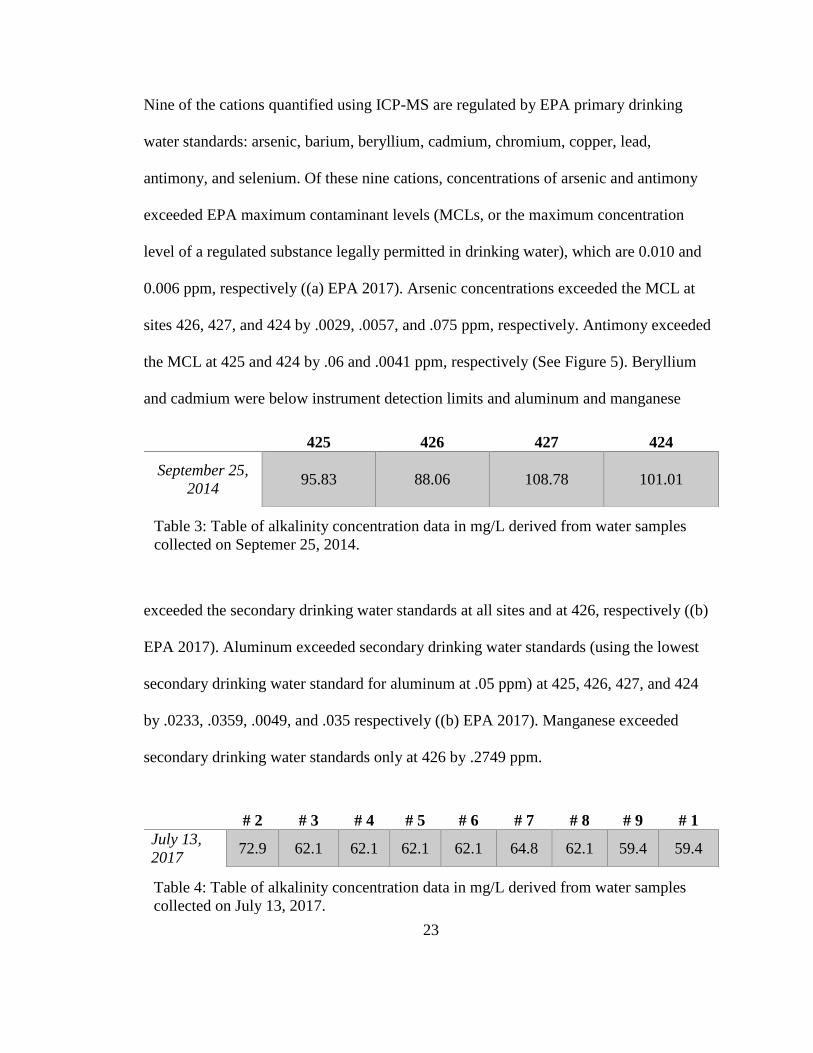
Nine of the cations quantified using ICP-MS are regulated by EPA primary drinking
water standards: arsenic, barium, beryllium, cadmium, chromium, copper, lead,
antimony, and selenium. Of these nine cations, concentrations of arsenic and antimony
exceeded EPA maximum contaminant levels (MCLs, or the maximum concentration
level of a regulated substance legally permitted in drinking water), which are 0.010 and
0.006 ppm, respectively ((a) EPA 2017). Arsenic concentrations exceeded the MCL at
sites 426, 427, and 424 by .0029, .0057, and .075 ppm, respectively. Antimony exceeded
the MCL at 425 and 424 by .06 and .0041 ppm, respectively (See Figure 5). Beryllium
and cadmium were below instrument detection limits and aluminum and manganese
exceeded the secondary drinking water standards at all sites and at 426, respectively ((b)
EPA 2017). Aluminum exceeded secondary drinking water standards (using the lowest
secondary drinking water standard for aluminum at .05 ppm) at 425, 426, 427, and 424
by .0233, .0359, .0049, and .035 respectively ((b) EPA 2017). Manganese exceeded
secondary drinking water standards only at 426 by .2749 ppm.
425 426 427 424
September 25,
2014
95.83
88.06 108.78 101.01
# 2 # 3 # 4 # 5 # 6 # 7 # 8 # 9 # 1
July 13,
2017 72.9 62.1 62.1 62.1 62.1 64.8 62.1 59.4 59.4
Table 3: Table of alkalinity concentration data in mg/L derived from water samples
collected on Septemer 25, 2014.
Table 4: Table of alkalinity concentration data in mg/L derived from water samples
collected on July 13, 2017.

24
Alkalinity, or the quantitative measurement of a solution’s ability to neutralize
acid, was assessed using four samples from all four September sampling sites and all nine
samples from all seven July sampling sites. Alkalinity concentrations fell from 425 to 426
and from 427 to 424, but dramatically rose between 426 and 427. It is noteworthy that the
426 sample was extracted from a pool in Freeman Branch Creek created by the minimal
volume of the culvert that passed beneath Highway 22 and that was partly bounded by a
large volume of limestone fill material.
The alkalinity concentrations of the nine samples collected on July 13, 2017
0
2
4
6
8
10
12
14
16
18
20
22
24
26
28
30
Freeman Branch Creek: Temperature and pH
Temperature (ºC) pH
Figure 5: Graph of pH and temperature (ºC) data recorded by EXO1 sonde every 15
minutes and averaged to compute daily averages from July 13 to August 6, 2017.

25
decreased fairly consistently in the downstream direction, with only a single increase of
alkalinity in the downstream direction at sample site #7 located just north of the
intersection of Highway 22 and Freeman Branch Creek (see Figure 3). The notable
variation in alkalinity between sample sites #2 and #3 is indicative of their varied source
waters, since sample sites #2 and #3 were located on the east and west forks of Freeman
Branch Creek, respectively.
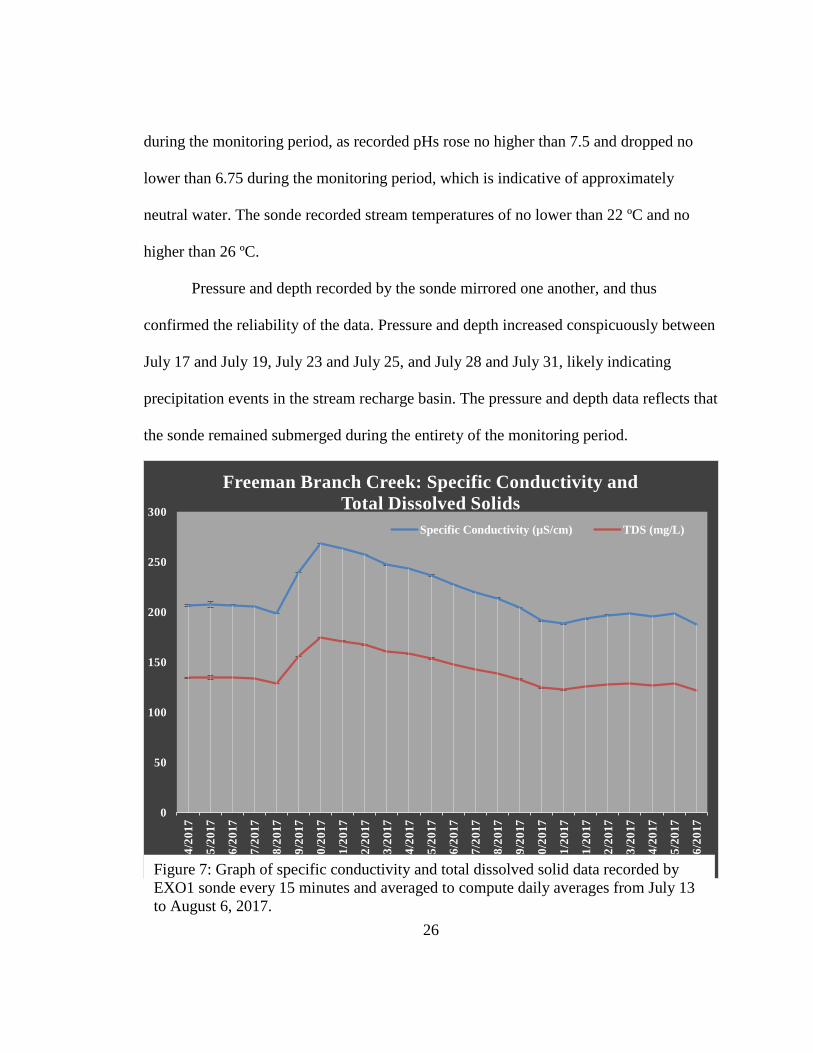
During the July 2017 sampling event, an EXO1 100 m depth sonde was installed
at site #1. The sonde measured temperature (ºC), pH, specific conductivity (µS/cm), TDS
(mg/L), depth (m), and pressure (psi) from July 13 until August 6, 2017. pH was stable
0
0.05
0.1
0.15
0.2
0.25
0.3
0.35
7/1
4/2
01
7
7/1
5/2
01
7
7/1
6/2
01
7
7/1
7/2
01
7
7/1
8/2
01
7
7/1
9/2
01
7
7/2
0/2
01
7
7/2
1/2
01
7
7/2
2/2
01
7
7/2
3/2
01
7
7/2
4/2
01
7
7/2
5/2
01
7
7/2
6/2
01
7
7/2
7/2
01
7
7/2
8/2
01
7
7/2
9/2
01
7
7/3
0/2
01
7
7/3
1/2
01
7
8/1
/20
17
8/2
/20
17
8/3
/20
17
8/4
/20
17
8/5
/20
17
8/6
/20
17
Freeman Branch Creek: Sonde Pressure and Depth
Pressure (psi) Depth (m)
Figure 6: Graph of pressure (psi) and depth (m) data recorded by EXO1 sonde every
15 minutes and averaged to compute daily averages from July 13 to August 6, 2017.
26
during the monitoring period, as recorded pHs rose no higher than 7.5 and dropped no
lower than 6.75 during the monitoring period, which is indicative of approximately
neutral water. The sonde recorded stream temperatures of no lower than 22 ºC and no
higher than 26 ºC.
Pressure and depth recorded by the sonde mirrored one another, and thus
confirmed the reliability of the data. Pressure and depth increased conspicuously between
July 17 and July 19, July 23 and July 25, and July 28 and July 31, likely indicating
precipitation events in the stream recharge basin. The pressure and depth data reflects that
the sonde remained submerged during the entirety of the monitoring period.
0
50
100
150
200
250
300
7/1
4/2
01
7
7/1
5/2
01
7
7/1
6/2
01
7
7/1
7/2
01
7
7/1
8/2
01
7
7/1
9/2
01
7
7/2
0/2
01
7
7/2
1/2
01
7
7/2
2/2
01
7
7/2
3/2
01
7
7/2
4/2
01
7
7/2
5/2
01
7
7/2
6/2
01
7
7/2
7/2
01
7
7/2
8/2
01
7
7/2
9/2
01
7
7/3
0/2
01
7
7/3
1/2
01
7
8/1
/20
17
8/2
/20
17
8/3
/20
17
8/4
/20
17
8/5
/20
17
8/6
/20
17
Freeman Branch Creek: Specific Conductivity and
Total Dissolved Solids
Specific Conductivity (µS/cm) TDS (mg/L)
Figure 7: Graph of specific conductivity and total dissolved solid data recorded by
EXO1 sonde every 15 minutes and averaged to compute daily averages from July 13
to August 6, 2017.

27
Specific conductivity and TDS also mirrored one another, thus again confirming the
reliability of the data. The notable increase in both TDS and specific conductivity
between July 18 and July 20 correlates closely with the increase in pressure and depth
between July 17 and July 19, indicative of increase discharge caused by precipitation
events in the recharge basin. The slight increase in specific conductivity and TDS
between July 31 and August 2 also correlates with the increase in pressure and depth
recorded from July 29 and 31, indicative of an increase in contribution to the streamflow.

28
DISCUSSION
Although initial qualitative observations, in addition to the close proximity of coal
mines, suggested the influence of AMD on the water quality of Freeman Branch Creek in
Eldridge, Alabama, subsequent water quality analysis and geologic characterization
instead indicated that the impacted water quality of Freeman Branch Creek was a
temporary condition caused by the construction of Highway 22 which intersects Freeman
Branch Creek. Water quality analysis evaluated the concentration of ions, alkalinity, pH,
TDS, specific conductivity, depth, and pressure during two sampling events in September
2014 and July 2017.
IC analysis revealed that, of the anions regulated by the EPA, all were well within
the primary and secondary drinking water standards set forth by the EPA, including
sulfate, which would be expected to be increased in an AMD-affected waterway. Nine of
the cations measured using ICP-MS are regulated under the EPA primary drinking water
standards and concentrations of all cations were within EPA MCLs, apart from arsenic
and antimony. Both aluminum and manganese exceed the secondary drinking water
standards set forth by the EPA, which renders Freeman Branch Creek at least a
potentially unpleasant drinking water source, if not dangerous ((b) EPA 2017). Both
aluminum and manganese may discolor water, and manganese may cause black staining
in addition to a taste of metallic bitterness to the water. It is also worthy of note that
although aluminum concentrations are continually in excess of EPA secondary drinking

29
water standards, the concentration of manganese only exceeds EPA secondary drinking
water standards, and by more than six times, at GPS 426 just downstream of the
intersection of Freeman Branch Creek and Highway 22 at the pooled portion of Freeman
Branch Creek.
Arsenic concentrations exceeded the MCL at 426, 427, and 424 by .0029, .0057,
and .075 ppm respectively and may cause increased risk of cancer, skin damage, and
disruption of circulatory systems in humans. Antimony exceeded the MCL at 425 and
424 by .06 and .0041 ppm respectively and may cause increased blood cholesterol and
decreased blood sugar in humans. The elevated concentrations of arsenic and antimony
detected in Freeman Branch Creek render the Creek an unsuitable drinking water source
for humans, and further research efforts should 1) repeat ion analysis of Freeman Branch
Creek to affirm the existence of preexistent conditions, 2) verify the Creek is not a source
of drinking water for locals provided preexistent conditions are confirmed, and 3)
investigate the influence of elevated arsenic and antimony concentrations on local biota.
Alkalinity was measured in samples collected during both the first and second
sampling events, from each sampling location. Alkalinity concentrations measured in
samples derivative from the first sampling event indicated a consistent decrease
downstream apart from a sharp increase in alkalinity from 426 to 427. Sample site 426
was located in the pooled portion of Freeman Branch Creek which is southwardly-
adjacent to Highway 22. The pool was at least partially bordered by a large deposit of
limestone fill material, which suggests that the spike in alkalinity between 426 and 427
was caused by buffering of the stream by the limestone fill material—this also accounts

30
for the heavy iron flocculant deposits just downstream of 426. However, alkalinity
concentrations of nine samples derivative from the second field visit decrease almost
continually in the downstream direction, aside from a slight increase in alkalinity in the
downstream direction between sample sites #6 and #7. This increase may also be
explained by a deposit of limestone fill material adjacent to both Highway 22 and site #7.
During the July 2017 sampling event, an EXO1 100 m depth sonde was installed
at site #1 where the sonde recorded pH, specific conductivity, TDS, depth, and pressure
from July 13 to August 6. The recorded pH during the sampling event rose no higher than
7.5 and dropped no lower than 6.75, which is indicative of neutral water and certainly not
characteristic of water affected by AMD. According to EPA secondary drinking water
standards, ideal drinking water ranges in pH from 6.5 to 8.5 ((b) EPA 2017). Depth and
pressure measurements confirmed that the sonde remained submerged during the entirety
of its deployment and the close correlation between TDS and specific conductivity
measurements verified the reliability of the sonde’s data. Additionally, TDS
concentrations never increased above 200 mg/L, ensuring that TDS concentration levels
remained well within EPA secondary standards for drinking water ((b) EPA 2017).

31
CONCLUSIONS
The unusual orange discoloration atop Freeman Branch Creek and coating
streambank vegetation; unprecendented black coating covering what were typically
white, rounded quartz pebbles in the stream; apparent dimunition of life in and around
Freeman Branch Creek; and close proximity of coal mines seemed to indicate the
contamination of Freeman Branch Creek by acid mine drainage. However, subsequent
anion and cation analysis; pH measurement; and geologic characterization revealed that
the impacted water quality of Freeman Branch Creek was a temporary condition caused
by the construction of Highway 22 which intersects Freeman Branch Creek.
As informed by the results of the water quality analysis conducted in the study, it
is recommended that further analysis be conducted at Freeman Branch Creek to assess
the use of the creek as a drinking water supply for humans and biota, and the potential
health hazards associated with the stream water. Further analysis should be conducted to
verify or reject the excessive concentration of arsenic and antimony, which may lead to
increased risk of cancer, skin damage, disruption of the circulatory system, increased
blood cholesterol, and decreased blood sugar in humans.
It is also suggested that the stream be evaluated for aluminum and manganese
concentrations, since both these elements were in excess of EPA secondary drinking
water standards and may cause stream discoloration; black staining; and a metallic, bitter
taste. It must also be noted that the concentrations of heavy metals, sulfate, and pH are

32
inconsistent with the known characteristics of streams affected by acid mine drainage.
Instead, given the increase in manganese adjacent to Highway 22 and the increase of
alkalinity adjacent to Highway 22 in samples derivative of both field visits, it is much
more likely that anomalies in the data reflect stream interaction with highway effluent
and construction, rather than an upstream source of acid mine drainage.

33
REFERENCES
Banks, D., Younger, P., Arnesen, R., Iversen, E., and Banks, S. (1997). Mine-water
chemistry: the good, the bad and the ugly. Environmental Geology, 32(3), 157-
174.
DeCelles, P. and Giles, K. (1996). Foreland basin systems. Basin Research, 8(2), 105-
123.
(a) EPA (2017). National Primary Drinking Water Regulations. Retrieved from
https://www.epa.gov/ground-water-and-drinking-water/national-primary-
drinking-water-regulations.
(b) EPA (2017). Secondary Drinking Water Standards: Guidance for Nuisance
Chemicals. Retrieved from
https://www.epa.gov/dwstandardsregulations/secondary-drinking-water-
standards-guidance-nuisance-chemicals.
Holland, S. (2016). Conformity. In University of Geogia Stratigraphic Lab Glossary.
Retrieved from https://strata.uga.edu/sequence/glossary.html.
Horsey, C. (1981). Depositional environments of the Pennsylvanian Pottsville Formation
in the Black Warrior basin of Alabama. Journal of Sedimentary Petrology, 51(3),
799-806.
Lopez-Blanco, M. (1993). Stratigraphy and sediment development of the Sant Llorenc
del Munt fan-delta complex (Eocene, southern Pyrenean foreland basins,
northeast Spain. In L. Frostick and R. Steel (Eds.), Tectonic Controls and
Signatures in Sedimentary Successions (67-88). Cambridge, MA: Blackwell
Scientific Publications.
Mellen, F. (1947). Black Warrior Basin, Alabama and Mississippi. Bulletin of the
American Association of Petroleum Geologists, 31(10), 1801-1816.
Mellen, F. (1977). Cambrian System in Black Warrior Basin. The American Association
of Petroleum Geologists Bulletin, 61(10), 1897-1900.
34
Pashin, J. (2007). Hydrodynamics of coalbed methane reservoirs in the Black Warrior
Basin: Key to understanding reservoir performance and environmental issues.
Applied Geochemistry, 22(10), 2257-2272.
Pike, S. (1968). Black Warrior basin, northeast Mississippi and northwest Alabama. In
Beebe, B. W. (Ed.), Natural Gases of North America: A Symposium, Volume 2
(1693-1701). University of Michigan: American Association of Petroleum
Geologists.
Strickler, M. (1997). What’s the difference between an active and passive continental
margin? In GeoMania hosted by the University of Oregon. Retrieved from
http://jersey.uoregon.edu/~mstrick/.
Thomas, W. (1988). The Black Warrior basin. In Sloss, L. L. (Ed.), The Geology of North
America, Vol. D-2: Sedimentary Cover—North American Craton: US (471-492).
Boulder, Colorado: Geological Society of America.
Waldron, J. (2016). Part VII Foreland thrust and fold belts. Webpage. Retrieved from
University of Alberta Earth and Atmospheric Courses Webpage:
https://courses.eas.ualberta.ca/eas421/lecturepages/thrust.html.
Webb, J. and Sasowsky, I. (1994). The interaction of acid mine drainage with a carbonate
terrane: evidence from the Obey River, north-central Tennessee. Journal of
Hydrology 161, 327-346.
Wicks, C. and Groves, C. (1992). Acidic mine drainage in carbonate terrains:
geochemical processes and rates of calcite dissolution. Journal of Hydrology, 146,
13-27.