highly enhanced fluorescence of fluorophores inside a … · 1 highly enhanced fluorescence of...
TRANSCRIPT
1
Highly enhanced fluorescence of fluorophores inside a
metallic nanocavity
Wenbing Li 1, Jinnan Zhang 2, Yan Zhou 2, Peng Zhang 2*
1 Department of Chemistry, New Mexico Tech, Socorro, NM 87801
2 Department of Chemistry, University of Cincinnati, Cincinnati, OH 45221
* Corresponding author: Peng Zhang, Tel: 513-556-9222. Fax: 513-556-9239. Email:
Supplementary Material (ESI) for Chemical CommunicationsThis journal is (c) The Royal Society of Chemistry 2011

2
Supporting Information
Materials
All chemicals were obtained commercially and used without further purification. Titanium
chloride (TiCl4) was obtained from Fisher. Meso-tetra(4-carboxyphenyl) porphine (TCPP) was
purchased from Frontier Scientific. Sodium citrate, sodium borohydride (NaBH4) and hydrogen
tetrachloroaurate (HAuCl4, 99.99%) were obtained from Sigma-Aldrich. All chemicals, unless
specified, were of reagent grade. Deionized water, with a resistivity greater than 18.0 MΩ·cm
(Millipore Milli-Q system), was used in preparing the aqueous solutions. All glassware used in
the experiments was washed with freshly prepared aqua regia (3:1 of HCl : HNO3) and rinsed
thoroughly in tap water first and then DI water prior to use.
TCPP
Figure S1. Molecular structure of TCPP.
Experimental
Preparation of colloidal TiO2 nanoparticles
Stock solutions of TiO2 colloidal were prepared by the hydrolysis of TiCl4 as previously
described.S1,S2 In brief, 2.00 mL of 99.8% TiCl4 at 0 °C was introduced under a stream of argon
Supplementary Material (ESI) for Chemical CommunicationsThis journal is (c) The Royal Society of Chemistry 2011
3
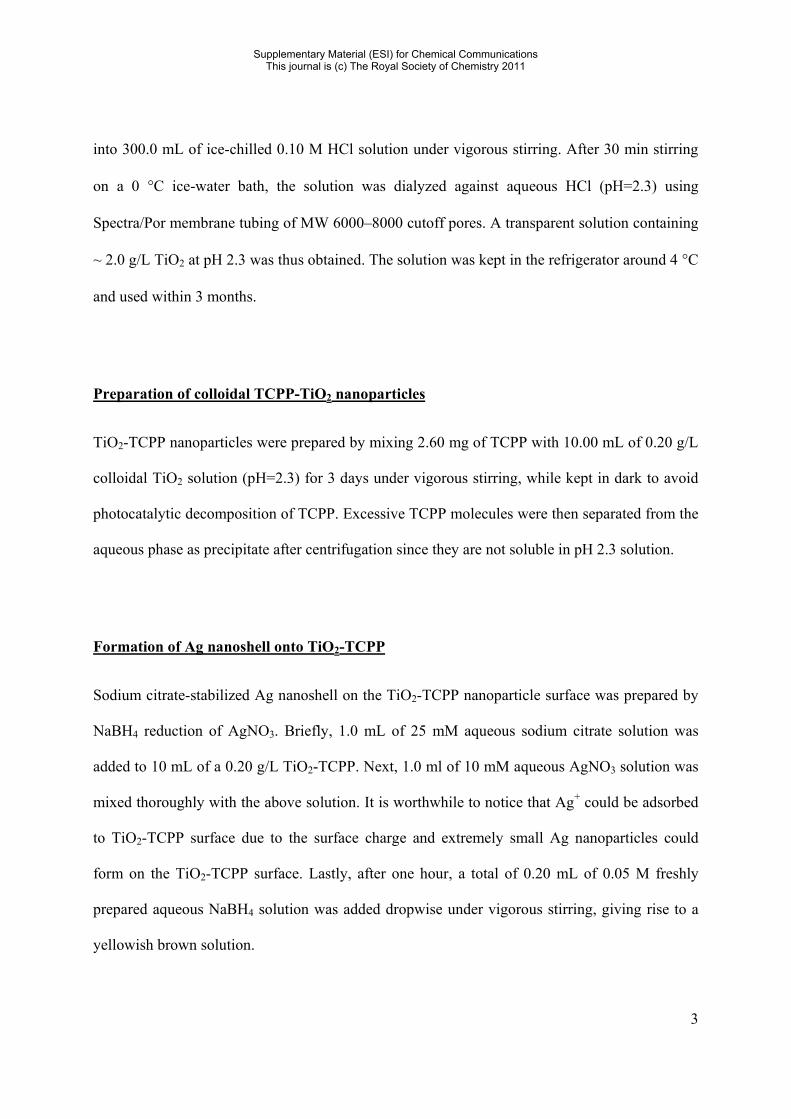
into 300.0 mL of ice-chilled 0.10 M HCl solution under vigorous stirring. After 30 min stirring
on a 0 °C ice-water bath, the solution was dialyzed against aqueous HCl (pH=2.3) using
Spectra/Por membrane tubing of MW 6000–8000 cutoff pores. A transparent solution containing
~ 2.0 g/L TiO2 at pH 2.3 was thus obtained. The solution was kept in the refrigerator around 4 °C
and used within 3 months.
Preparation of colloidal TCPP-TiO2 nanoparticles
TiO2-TCPP nanoparticles were prepared by mixing 2.60 mg of TCPP with 10.00 mL of 0.20 g/L
colloidal TiO2 solution (pH=2.3) for 3 days under vigorous stirring, while kept in dark to avoid
photocatalytic decomposition of TCPP. Excessive TCPP molecules were then separated from the
aqueous phase as precipitate after centrifugation since they are not soluble in pH 2.3 solution.
Formation of Ag nanoshell onto TiO2-TCPP
Sodium citrate-stabilized Ag nanoshell on the TiO2-TCPP nanoparticle surface was prepared by
NaBH4 reduction of AgNO3. Briefly, 1.0 mL of 25 mM aqueous sodium citrate solution was
added to 10 mL of a 0.20 g/L TiO2-TCPP. Next, 1.0 ml of 10 mM aqueous AgNO3 solution was
mixed thoroughly with the above solution. It is worthwhile to notice that Ag+ could be adsorbed
to TiO2-TCPP surface due to the surface charge and extremely small Ag nanoparticles could
form on the TiO2-TCPP surface. Lastly, after one hour, a total of 0.20 mL of 0.05 M freshly
prepared aqueous NaBH4 solution was added dropwise under vigorous stirring, giving rise to a
yellowish brown solution.
Supplementary Material (ESI) for Chemical CommunicationsThis journal is (c) The Royal Society of Chemistry 2011
4
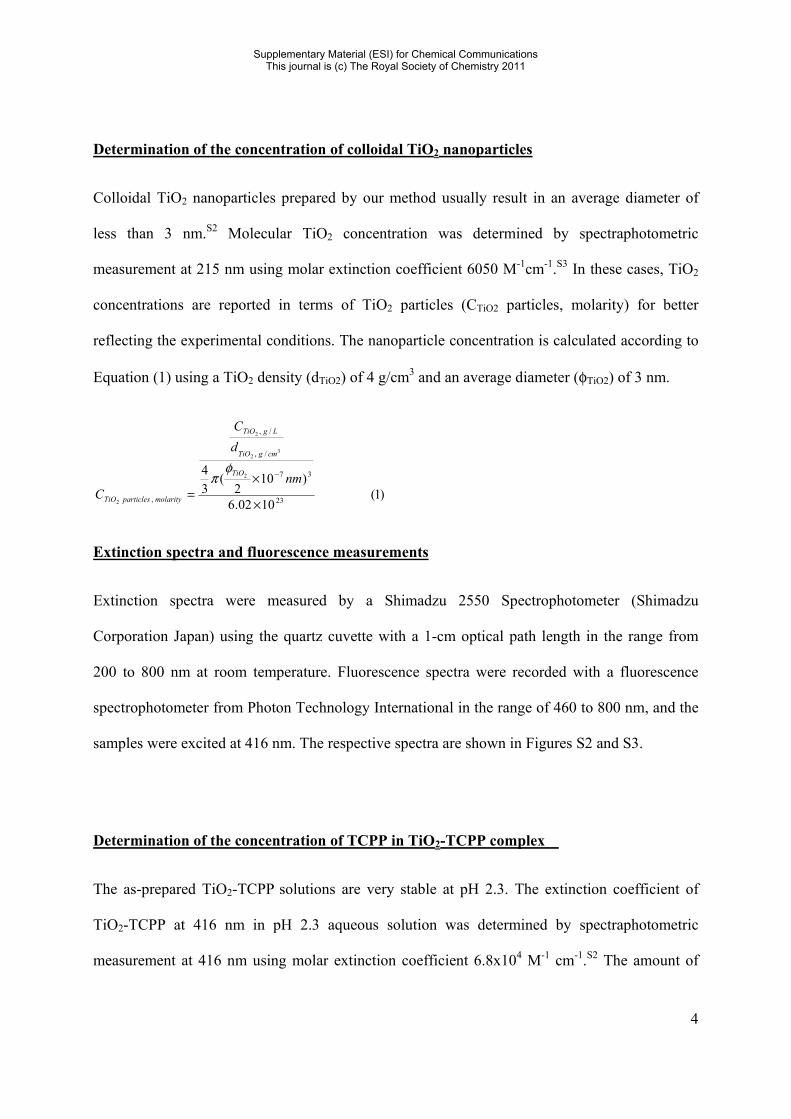
Determination of the concentration of colloidal TiO2 nanoparticles
Colloidal TiO2 nanoparticles prepared by our method usually result in an average diameter of
less than 3 nm.S2 Molecular TiO2 concentration was determined by spectraphotometric
measurement at 215 nm using molar extinction coefficient 6050 M-1cm-1.S3 In these cases, TiO2
concentrations are reported in terms of TiO2 particles (CTiO2 particles, molarity) for better
reflecting the experimental conditions. The nanoparticle concentration is calculated according to
Equation (1) using a TiO2 density (dTiO2) of 4 g/cm3 and an average diameter (φTiO2) of 3 nm.
)1(1002.6
)102
(34
23
37
/,
/,
,
2
32
2
2 ×
×=
− nm
dC
C
TiO
cmgTiO
LgTiO
molarityparticlesTiO
φπ
Extinction spectra and fluorescence measurements
Extinction spectra were measured by a Shimadzu 2550 Spectrophotometer (Shimadzu
Corporation Japan) using the quartz cuvette with a 1-cm optical path length in the range from
200 to 800 nm at room temperature. Fluorescence spectra were recorded with a fluorescence
spectrophotometer from Photon Technology International in the range of 460 to 800 nm, and the
samples were excited at 416 nm. The respective spectra are shown in Figures S2 and S3.
Determination of the concentration of TCPP in TiO2-TCPP complex
The as-prepared TiO2-TCPP solutions are very stable at pH 2.3. The extinction coefficient of
TiO2-TCPP at 416 nm in pH 2.3 aqueous solution was determined by spectraphotometric
measurement at 416 nm using molar extinction coefficient 6.8x10⁴ M-1 cm-1.S2 The amount of
Supplementary Material (ESI) for Chemical CommunicationsThis journal is (c) The Royal Society of Chemistry 2011

5
TCPP chemisorbed on TiO2 surface is therefore determined at 416 nm according to Beer’s law
using ε416 nm = 6.8x10⁴ M-1 cm-1. By adjusting the ratio of TiO2 to TCPP in the formation of
TiO2-TCPP complex, we can control the average number of TCPP molecules per TiO2 particle.
TEM, EDX and PSA characterizations of TiO2-TCPP/Ag-shell nanoparticles
TEM and EDX results are the other evidences to support the formation of TiO2-TCPP /Ag-shell
nanostructures. A drop of well-sonicated solution containing the nanoparticles was deposited on
a Formvar-covered carbon-coated copper grid (Electron Microscopy Sciences, PA). The samples
were allowed to dry at room temperature overnight. A JEOL 2010 high-resolution transmission
electron microscope (HRTEM) was used to obtain the TEM images and EDX spectra at 200 kV.
Particle size analysis measurements were carried out with a Nanotrac particle size analyzer
(PSA) from Microtrac Inc based on dynamic light scattering. The average values of the particle
size and polydispersity, defined as a relative width of the size distribution, were determined from
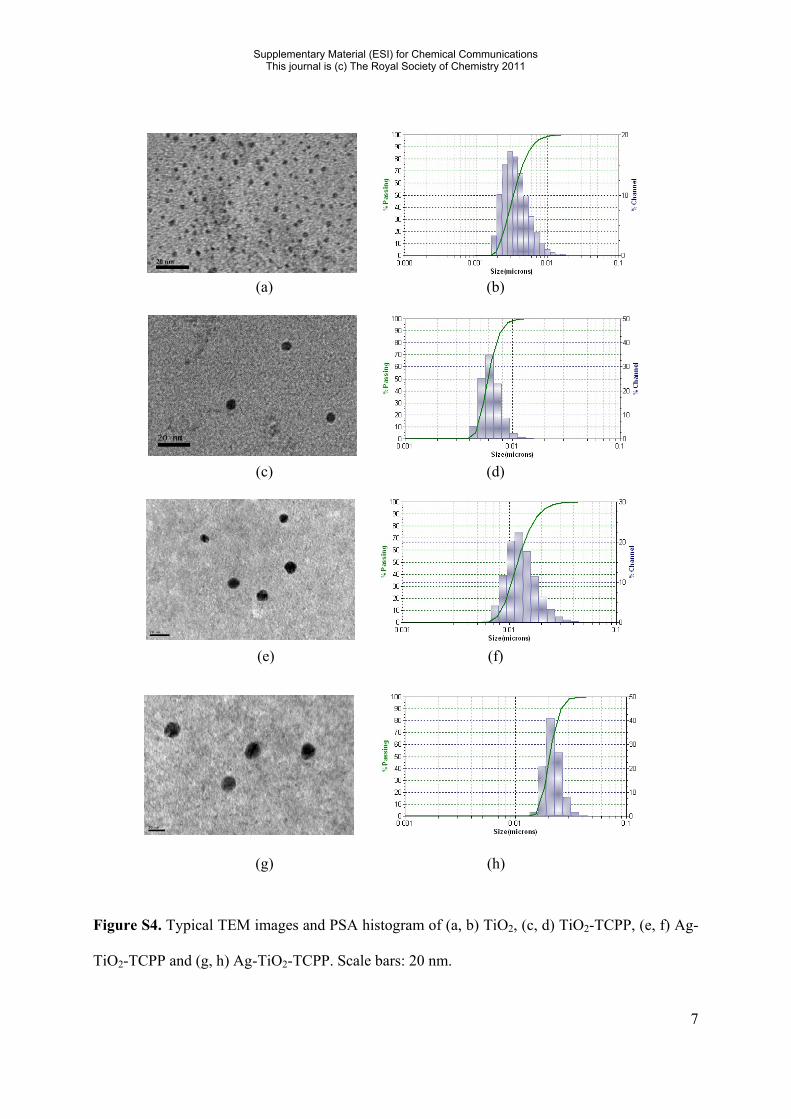
the PSA measurements. Figure S4 shows the typical TEM images and PSA histograms of the (a,
b) TiO2, (c, d) TiO2-TCPP, (e, f) Ag-TiO2-TCPP and (g, h) Ag-TiO2-TCPP. It can be seen that
the colloidal TiO2 nanoparticles are rather uniform, with particle size about 3.2 nm. After the
adsorption of TCPP and coating with extra TiO2 layer, the particle sizes increase to 7.0 nm. Next,
with the coating of Ag nanoshells, the particle sizes increase to ~12 nm and 20.1 nm. PSA results
show the particle sizes and their distributions of TiO2, TiO2-TCPP, and Ag-TiO2-TCPP, all
consistent with the TEM results.
Supplementary Material (ESI) for Chemical CommunicationsThis journal is (c) The Royal Society of Chemistry 2011
6
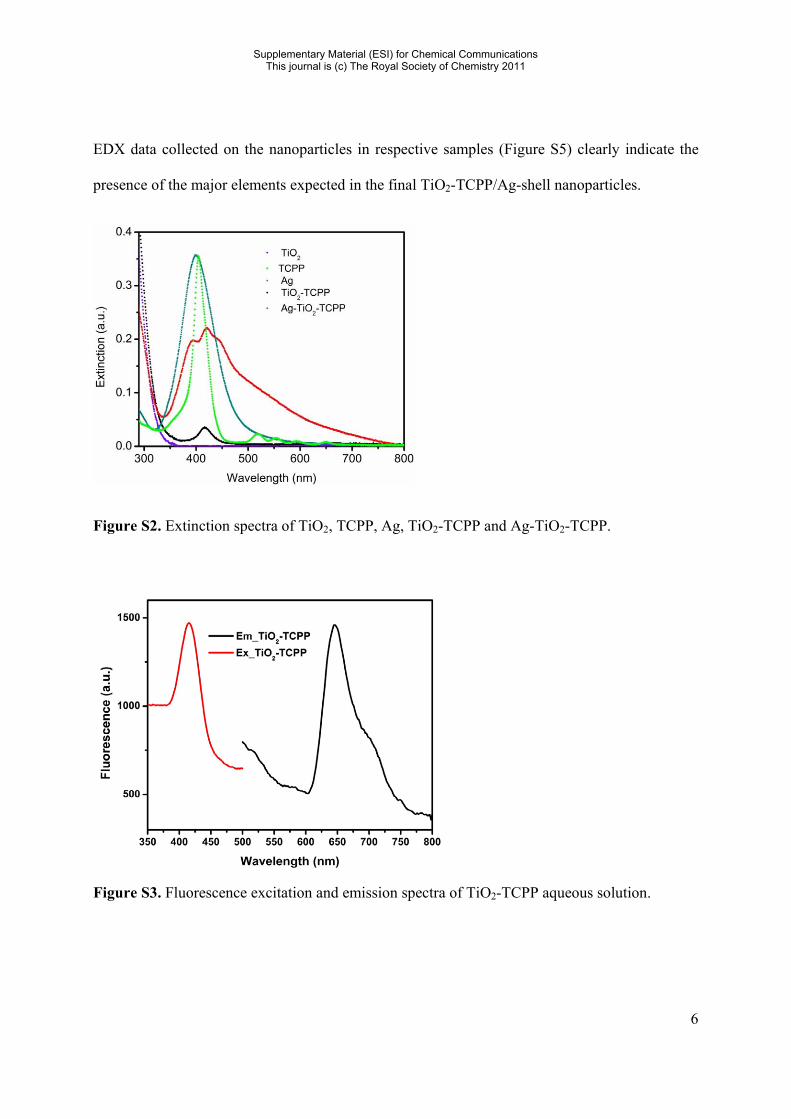
EDX data collected on the nanoparticles in respective samples (Figure S5) clearly indicate the
presence of the major elements expected in the final TiO2-TCPP/Ag-shell nanoparticles.
Figure S2. Extinction spectra of TiO2, TCPP, Ag, TiO2-TCPP and Ag-TiO2-TCPP.
Figure S3. Fluorescence excitation and emission spectra of TiO2-TCPP aqueous solution.
Supplementary Material (ESI) for Chemical CommunicationsThis journal is (c) The Royal Society of Chemistry 2011
7
(a) (b)
(c) (d)
(e) (f)
(g) (h)
Figure S4. Typical TEM images and PSA histogram of (a, b) TiO2, (c, d) TiO2-TCPP, (e, f) Ag-
TiO2-TCPP and (g, h) Ag-TiO2-TCPP. Scale bars: 20 nm.
Supplementary Material (ESI) for Chemical CommunicationsThis journal is (c) The Royal Society of Chemistry 2011

8
(a)
(b)
(c)
Figure S5. EDX spectra of (a) TiO2, (b) TiO2- TCPP, (c) Ag-TiO2-TCPP. Cu peaks are due to
the TEM grid.
Supplementary Material (ESI) for Chemical CommunicationsThis journal is (c) The Royal Society of Chemistry 2011

9
References:
[S1] Li, W.; Guo, Y.; Zhang, P. J. Phys. Chem. C 2010, 114, 7263.
[S2] Li, W.; Gandra, N.; Ellis, E,; Courtney, S.; Li, S,; Bulter, El; Gao, R. ACS Appl. Mater.
Interfaces. 2009, 1, 1778.
[S3] Gao, R.; Safrany, A.; Rabani, J. Radiat. Phy.s Chem. 2002, 65, 599.
Supplementary Material (ESI) for Chemical CommunicationsThis journal is (c) The Royal Society of Chemistry 2011