highlights of the budget for fy2001 - mof.go.jp · pdf fileprioritized allocationof public...
TRANSCRIPT

HIGHLIGHTS OF THE BUDGET FOR FY2001
September 2001 Ministry of Finance

Contents
Highlights of the FY2001 Budget 1
General Account Budget 2
General Account Budget by Major Expenditure Programs 3
Trends of Government Bond Issues 4
Trends of Accumulated Government Bonds Outstanding 5
Long Term Debt Outstanding 6
Trends of Interest Payment of Government Bonds 7
Trends of General Account Tax Revenue, Total Expenditures, and Government Bond Issues 8
General Government Gross Debt (National Account Basis) 9
General Government Financial balance (National Account Basis) 9
International Comparison 10,11 (Source:OECD/Economic Outlook 69 (June 2001))
Outline of Major Expenditure Programs • Social Security Related Budgets 12 • Public Works Related Budgets 14 • Local Government Related Budgets 16 • Special Allocation Category for the Rebirth of Japan
18
Medium-term Fiscal Projection FY2000- 2004 20

Highlights of the FY2001 Budget
Tentative Translation
1. Putting the economy back on a self-sustained recovery path, while building a new foundation for development.
•In order to solidify the economic trend towards a self-sustained recovery path, budgets for public works leveling to amounts equal to that of FY1999 and FY2000 initial budgets will be secured, along withcontingencies for public works totaling 300 billion yen. (Contingencies for public works in FY1999 andFY2000 were both 500 billion yen)
•In order to build a foundation for development in the 21st century, and to plan the rebirth of Japanese economy,the “Special Allocation Category for the Rebirth of Japan” (total: 700 billion yen (public works allocation:400 billion yen, non-public works allocation: 300 billion yen)will be applied to both public and non-publicfields of the FY2001 budget, with prioritized allocation to the following four priority areas: ‘Promotion of theIT revolution’, ‘Response to environmental issues’, Response to the aging society’, and ‘Upgrade of urbaninfrastructures’.
2. Promotion of fiscal efficiency, and qualitative improvement.
•The increase in general account expenditures is +1.2%, which is a large increase compared to the FY2000initial budget. The increase consists of consideration towards science and technology promotionexpenditures(+8.6%), and social security related expenditures(+4.7%), etc.
•272 projects for public works have been cancelled after thorough review of each project. Simultaneously,prioritized allocation of public work expenditures towards the four priority areas, including the “SpecialAllocation Category for the Rebirth of Japan”(400 billion yen) and the “Prioritized Allocation Category forPublic Works Related to Improving the Living Environment” (300 billion yen) will be made.
•In a state where both the national and local governments face a severe fiscal situation, fiscal measures forlocal governments will be taken to propel further transparency of national and local government finances, byimplementing the so-called Special Local Bonds.
•Taking the central government reform as an opportunity, fusion and cooperation between ministries/agenciesand their works will be promoted, centralized around the “Special Allocation Category for the Rebirth ofJapan”.
3. Reduction of Government Bond Issues.
•In the FY2001 initial budget, 1. unlike FY2000, preparations of aids towards bankruptcies in the financial sector by use of government bond
refunds, will not be necessary. (-4.5 trillion yen)2. although factors such as the increase of transfers to the ‘Special Account for the Allotment of Local
Allocation Taxes and Local Transfer Taxes’ exist due to the reform of local government finance (+1.4trillion yen), a total of 4.3 trillion yen in government bond issues will be reduced.
•FY2000 initial budget: 32.6 trillion yen → FY2001: 28.3 trillion yen (-4.3 trillion yen) (FY2000: 34.6 trillion yen after revision)
•Government bond dependency (ratio of government bond issuance to total expenditures): 34.3%(FY2000 after revision: 38.5%. Record high in FY1999: 42.1%)

(billion yen)FY2000 FY2001(Initial) (Initial)
(A) (B) (B)-(A) % change
(Revenue)
1. Tax Revenue 48,659.0 50,727.0 2,068.0 4.2%(49,895.0 after revision)
2. Non-tax Revenue 3,718.1 3,607.4 -110.7 -3.0%
3. Government Bond Issue 32,610.0 28,318.0 -4,292.0 -13.2%(34,598.0 after revision)
Construction Bonds 9,150.0 8,760.0 -390.0 -4.3%
Special Deficit-Financing Bonds 23,460.0 19,558.0 -3,902.0 -16.6%
[TOTAL] 84,987.1 82,652.4 -2,334.7 -2.7%
(Expenditure)
1. National Debt Service 21,965.3 17,170.5 -4,794.8 -21.8%
2. Local Allocation Tax Grants 14,930.4 16,823.0 1,892.6 12.7%
3. General Expenditure 48,091.4 48,658.9 567.5 1.2%
[TOTAL] 84,987.1 82,652.4 -2,334.7 -2.7%
(Note) Local allocation tax grants include increase in revenues from local government financial reforms such as the implementation of special local bonds.
General Account Budget (FY2001 Budget)
2000⇒2001
(billion yen)FY2000 FY2001(Initial) (Initial)
(A) (B) (B)-(A) % change
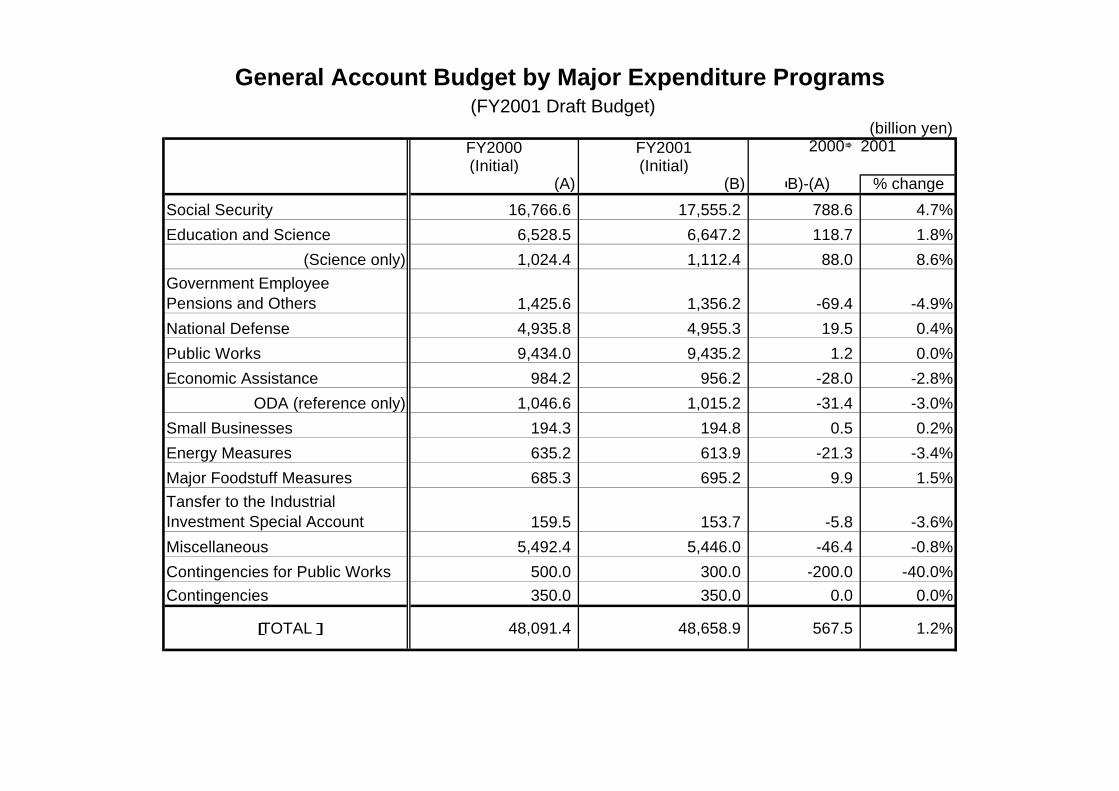
Social Security 16,766.6 17,555.2 788.6 4.7%
Education and Science 6,528.5 6,647.2 118.7 1.8%
(Science only) 1,024.4 1,112.4 88.0 8.6%Government EmployeePensions and Others 1,425.6 1,356.2 -69.4 -4.9%
National Defense 4,935.8 4,955.3 19.5 0.4%
Public Works 9,434.0 9,435.2 1.2 0.0%
Economic Assistance 984.2 956.2 -28.0 -2.8%
ODA (reference only) 1,046.6 1,015.2 -31.4 -3.0%
Small Businesses 194.3 194.8 0.5 0.2%
Energy Measures 635.2 613.9 -21.3 -3.4%
Major Foodstuff Measures 685.3 695.2 9.9 1.5%Tansfer to the IndustrialInvestment Special Account 159.5 153.7 -5.8 -3.6%
Miscellaneous 5,492.4 5,446.0 -46.4 -0.8%
Contingencies for Public Works 500.0 300.0 -200.0 -40.0%Contingencies 350.0 350.0 0.0 0.0%
[TOTAL] 48,091.4 48,658.9 567.5 1.2%
General Account Budget by Major Expenditure Programs (FY2001 Draft Budget)
2000⇒2001

Trends of Government Bond Issues (FY2001 Budget)
2.13.5
4.5 4.3
6.37.2
5.97.0 6.7 6.4 6.0
5.0
2.51.0 0.2
4.1 4.8
11.0
8.5
17.0
24.3
21.9
3.2
3.7
5.06.3
7.17.0
7.0
7.06.8
6.46.3
6.2
6.9
6.26.4 6.3 6.7
9.5
16.2
12.3
16.4
10.7
9.9
17.1
13.2
11.1
8.8
19.6
1.0
25.3
32.6
26.6
24.8
23.2
21.0
16.3
11.6
34.3
36.9
42.1
40.3
23.5
27.628.0
22.4
21.5
13.5
9.5
10.6
10.1
29.7
27.5
34.7
29.4
31.3
32.9
0
5
10
15
20
25
30
35
40
75 76 77 78 79 80 81 82 83 84 85 86 87 88 89 90 91 92 93 94 95 96 97 98 99 00 01
(Trillion Yen)
0
5
10
15
20
25
30
35
40
(%)
Ad-hoc Deficit financing bonds which shouldbe redeemed by earmarked revenuesConstruction Bonds
Special Deficit-financing bonds
Government Bond Issues
Government Bond IssuesTotal Expenditure
Note: FY1975-2000:settlement, FY2001:Budget
10.7
12.9
14.013.5
12.312.8
9.4
11.3
7.26.6
7.36.7
9.5
16.216.5
21.221.7
18.5
34.0
37.5
33.0
FY
14.213.5
9.6
7.2
5.3
28.3

0
50
100
150
200
250
300
350
Note 1. FY1965-2000:actual. FY2001 is an estimate.2. The special deficit-financing bond amount includes refunding bonds for long term debts Transferred from JNR Corp. settlement and National Forest Service.
Trends of Accumulated Government Bonds Outstanding (FY2001 Budget) approx389
(Trillion approxYen) 177
367.6
158.4
331.7
134.5
295.2
107.8
258.0
83.1244.7
76.9
225.2
67.5
206.6approx
64.2 211192.5 209.1
197.261.1
178.4 187.4
171.6 62.6166.3 64.1 174.9
160.9 64.5 167.8156.8 64.1
151.8 65.4 157.7145.1 65.3
134.4 63.7142.4
59.2121.7 131.5
109.7 53.1115.8
47.196.5 Special Deficit- 107.5
Financing Bonds 101.840.3 96.8
82.3 91.486.5
70.5 32.9 81.475.2
28.368.6
56.3 62.621.1 56.2
42.649.4
2.1 14.6 42.331.9 Construction Bonds10.3 35.2
22.1 28.015.0 5.5 21.6
9.7 16.64.0 5.8 7.6 12.9
0.2 0.9 1.6 2.1 2.5 2.8
65 66 67 68 69 70 71 72 73 74 75 76 77 78 79 80 81 82 83 84 85 86 87 88 89 90 91 92 93 94 95 96 97 98 99 00 01(FY)

(trillion yen)
FY1991<Settlement>
FY1996<Settlement>
FY1999<Settlement>
FY2000<Revised>
FY2001<Budget>
209 325 449 484 506
Straight Bonds 172 245 332 365 389
70 139 174 184 188
▲1 ▲14 ▲22 ▲26 ▲28
278 449 600 642 666
58.6% 87.2% 116.9% 125.0% 128.5%
Note 1. GDP for 2000:flash report figures. FY2001: estimates.Note 2. The outstanding debt of the fiscal loan fund special account at the end of FY2001 is estimated to be approximately 44 trillion yen.
Long Term Debt Outstanding
% of GDP
National Gov.
Local Gov.
Duplication
Total
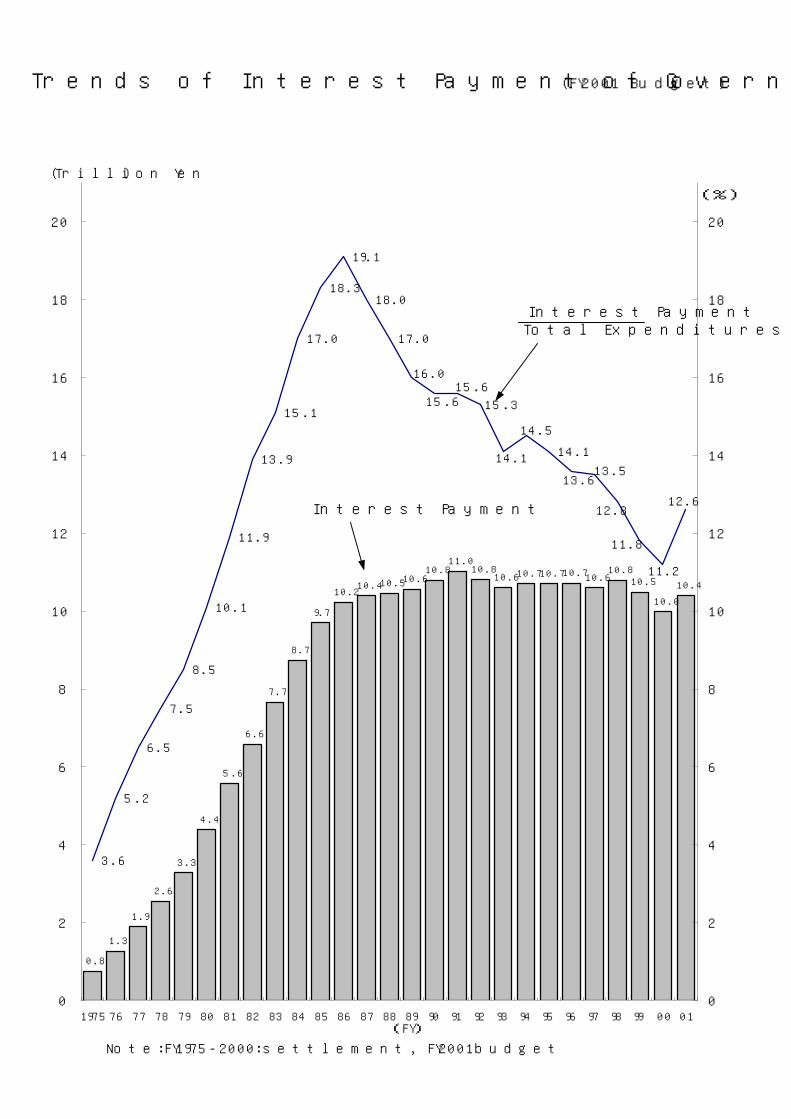
Trends of Interest Payment of Government Bonds (FY2001 Budget)
0.8
1.3
1.9
2.6
3.3
4.4
5.6
6.6
7.7
8.7
9.7
10.210.4 10.5 10.6
10.811.0
10.810.6 10.7 10.7 10.7 10.6
10.810.5
10.0
10.4
3.6
5.2
6.5
7.5
8.5
10.1
11.9
13.9
15.1
17.0
18.3
19.1
18.0
17.0
14.1
12.6
11.2
12.8
11.8
13.513.6
14.5
14.1
15.315.6
16.0
15.6
0
2
4
6
8
10
12
14
16
18
20
1975 76 77 78 79 80 81 82 83 84 85 86 87 88 89 90 91 92 93 94 95 96 97 98 99 00 01(FY)
(Trillion Yen)
0
2
4
6
8
10
12
14
16
18
20
(%)
Note:FY1975-2000:settlement, FY2001budget
Interest PaymentTotal Expenditures
Interest Payment

Trends of General Account Tax Revenue, Total Expenditures,and Government Bond Issues
12.8 12.3 11.39.4
6.6 6.79.5
16.2 16.5
33.0
28.3
7.2 7.3
18.5
34.0
21.2
13.5
21.7
37.5
50.6 51.553.0 53.6
57.7
61.5
65.9
69.370.5 70.5
75.173.6
75.978.8 78.5
84.4
89.0 89.3
82.7
32.434.9
38.2
41.9
46.8
50.8
54.9
60.1 59.8
54.4 54.1
50.7 50.751.0 51.9 52.153.9
49.447.2
0
10
20
30
40
50
60
70
80
90
100
1983 1984 1985 1986 1987 1988 1989 1990 1991 1992 1993 1994 1995 1996 1997 1998 1999 2000 2001
Govt Bond Issue
Total Expenditure
Tax Revenue
(Trillion Yen)
Tax revenue, relative to total expenditure(%)
Note : FY1983-2000, settlement.FY2001, budget.
67.8 72.1 78.1 81.1 82.7 83.4 86.8 84.8 77.2 72.1 69.3 68.4 66.0 68.7 58.663.9 53.1 55.1 61.4

General Government Gross Debt (National Account Basis)
(As a percentage of GDP)
1997 1998 19992000
(revised)2001
(initial)
97.6 107 117.1 approx.135.3 approx.140.8
CentralGovernmentGross Debt
76.6 83.9 92.8 approx.104.6 approx.109.6
Note 1. All figures are year end figures of the fiscal year.2. FY1997, 98, 99 are actual figures according to calculations by the Economic Planning Agency of Japan. Figures for FY2000 and 2001 are estimations based on a fixed set of assumptions.
General Government Financial Balance (National Accounts Basis)
(As a percentage of GDP)
1997 1998 19992000
(revised)2001
(initial)
▲ 5.4▲12.3▲7.2* ▲ 8.2 approx.▲9.4 approx.▲6.4
CentralGovernmentFinancial Balance
▲ 3.7▲10.4▲5.3* ▲ 6.8 approx.▲7.8 approx.▲5.5
Note 1. FY1997, 98, 99 are actual figures according to calculations by the Economic Planning Agency of Japan. Figures for FY2000 and 2001 are estimations based on a fixed set of assumptions.2. Figures noted with an '*' are calculated on a basis excluding the Japan National Railway Settlement Corporation and the National Forest Services.
FY
General GovernmentGross Debt
FY
General GovernmentFinancial Balance

(As a percentage of GDP)
( CY ) 1992 1993 1994 1995 1996 1997 1998 1999 2000 2001
General Government Excluding Social Security
Japan ▲ 2.0 ▲ 4.8 ▲ 5.1 ▲ 6.4 ▲ 6.9 ▲ 5.9 ▲ 7.1 ▲ 8.8 ▲ 7.8 ▲ 7.7
United States ▲ 6.7 ▲ 5.7 ▲ 4.5 ▲ 3.9 ▲ 3.1 ▲ 2.0 ▲ 0.9 ▲ 0.4 0.8 1.0
General Government
Japan 1.5 ▲ 1.6 ▲ 2.3 ▲ 3.6 ▲ 4.2 ▲ 3.3 ▲ 5.0 ▲ 7.0 ▲ 6.0 ▲ 6.0
United States ▲ 5.9 ▲ 5.0 ▲ 3.6 ▲ 3.1 ▲ 2.2 ▲ 0.9 0.3 1.0 2.3 2.6
United Kingdom ▲ 6.5 ▲ 8.0 ▲ 6.8 ▲ 5.8 ▲ 4.4 ▲ 2.0 0.4 1.3 2.7 2.2
Germany ▲ 2.5 ▲ 3.1 ▲ 2.4 ▲ 3.3 ▲ 3.4 ▲ 2.7 ▲ 2.1 ▲ 1.4 1.4 ▲ 1.7
France ▲ 4.2 ▲ 6.0 ▲ 5.5 ▲ 5.6 ▲ 4.1 ▲ 3.0 ▲ 2.7 ▲ 1.8 ▲ 1.4 ▲ 0.1
Italy ▲ 9.5 ▲ 9.4 ▲ 9.1 ▲ 7.6 ▲ 7.1 ▲ 2.7 ▲ 2.8 ▲ 1.9 0.1 ▲ 1.0
Canada ▲ 9.2 ▲ 8.7 ▲ 6.7 ▲ 5.4 ▲ 2.8 0.2 0.2 2.2 2.5 2.1Source:OECD Economic Outlook 68 (December 2000)
※ According to the estimate of the Japanese Government, the fiscal deficit of GDP (on a general governmentbasis excluding social security) will be approximately 9.4% in FY2000 (after revision) and 6.4% forFY2001.
※Japan and United States:General government financial balance excluding social security.
General Government Financial Balances (National Account Basis)(International Comparison)
-11
-10
-9
-8
-7
-6
-5
-4
-3
-2
-1
0
1
2
3
1992 1993 1994 1995 1996 1997 1998 1999 2000 2001 (CY)
(%)
CanadaU.K.
U.S.A
Germany
France
Italy
Japan
Canada
U.K.U.S.A
Germany
France
Italy
Japan

(As a percentage of GDP)
( CY ) 1992 1993 1994 1995 1996 1997 1998 1999 2000 2001
Japan 59.3 63.7 68.8 76.2 80.5 84.6 97.4 105.3 112.3 118.6
United States 74.1 75.8 75.0 74.5 73.9 71.4 68.4 65.3 59.5 54.6
United Kingdom 49.4 58.4 56.1 61.1 60.6 60.9 62.0 57.0 53.5 50.7
Germany 41.8 47.4 47.9 57.1 60.3 61.7 63.0 60.6 59.6 57.8
France 44.7 51.6 55.3 59.3 62.3 64.7 65.2 65.0 64.6 63.6
Italy 116.1 117.9 124.0 123.1 121.8 119.8 117.7 116.6 112.0 108.3
Canada 110.3 116.9 117.5 120.6 120.9 117.4 116.2 111.6 105.9 100.5Source:OECD Economic Outlook 68 (December 2000)
※ According to the estimate of the Japanese Government, the government gross debt of GDP (on a generalgovernmant basis excluding social security) will be approximately 135.3% in FY2000 (after revision) and approximately 140.8% in FY2001.
General Government Gross Debt (National Account Basis)(International Comparison)
30
50
70
90
110
130
1992 1993 1994 1995 1996 1997 1998 1999 2000 2001 (CY)
(%)
Canada
U.K.U.S.A.Germany
France
Italy
Japan
Canada
U.K.
U.S.A.
Germany
France
Italy
Japan

Highlights of Social Security Related Budgets
FY2000 FY2001 FY2000→2001
Social Security Related
Expenditures
16,766.6 billion yen 17,555.2 billion yen +788.6 billion yen (+4.7%)
[+747.0 billion yen (+4.5%)]
Note:Figure in brackets excludes the 41.6 billion yen, which is to be refunded to the special account
for government-managed health insurance.
Medical Care
1. Medical care costs shared by the national account
FY2000: 6,795.6 billion yen → FY2001: 7,166.7 billion yen*
(* Figure excludes the 41.6 billion yen, which is to be refunded to the special account for
government-managed health insurance) 2. Promotion of the Medical Frontier Plan : 30.3 billion yen
(Includes the 3.4 billion yen already accounted in the FY2000 supplementary budget) • Prioritized promotion of frontier medical science, and application of their achievements
in improving experimental results of medical prevention and treatment, for cancer,
myocardial infarction, cerebral apoplexy, dementia, and bone fractures. (Includes
expenditures for the promotion of science technologies)
Welfare
1. Sound enforcement of the Long-term Care Insurance System
• Promotion of Gold Plan 21 (FY2000 – 2004) such as the development of infrastructure
for long-term care service, as well as enrichment of measures to promote preventive
care and livelihood support. • Development of infrastructure for long-term care service
Special nursing homes for the elderly: support for 10,000 people
Health service facilities for the elderly: support for 7,000 people
Group homes for the senile elderly: support in 500 sites • Promotion of preventive care and livelihood support FY2000: 46.7 billion yen → FY2001: 500 billion yen
2. Promotion of comprehensive measures to address the decrease in the birthrate
• Enrichment of child rearing services, such as nursery care services, based on the New
Angel Plan (FY2000 – 2004). • Budget increase for the ‘New Angel Plan’: 295.8 billion yen → 315.3 billion yen
• Increase in the nursery capacity for infants (persons): 598,000 → 618,000 • Promotion of extended childcare (places): 8,000 → 9,000 • Promotion of Family Support Centers: 82 centers → 182 centers
In light of the coming aging society with a decreasing birthrate in the 21st century, a stable and
efficient social security system with long-term sustainability is being constructed through further
rationality and efficiency in spending, while satisfying the new needs of people’s lives.

3. Child-rearing benefits
• Major increase of income limits, to increase the support ratio to approximately 85% • Gross income limit change (Example of a family with husband, wife, and two
children) • Corporate employees: 6.70 million yen → 7.80 million yen • Non-corporate employees: 4.325 million yen → 5.963 million yen
• Number of children subject to benefits: approx. 5.65 million → 6.60 million 4. Promotion of measures for persons with disabilities
• Steady implementation of the Disability Plan (FY1996 – 2002) to promote support for
the independence and social participation of disabled people. • Budget increase for measures related to the Disability Plan:
276.7 billion yen → 287.9 billion yen • Conduct of a model project for the support of people with higher brain dysfunction
5. Public assistance
• Public assistance standards were to decrease with abiding by routine rules, but will be maintained as they are.
Pensions
Special countermeasures to decrease consumer prices
• With the current socioeconomic status, automatic decreases in pension payments due to consumer price index decreases (estimate: -1.0%, including FY2000 decrease of
–0.3%) will not be enforced. This is a special measure, which was taken in FY2000 as
well. • The fiscal effect of the above countermeasure in FY2000 and FY2001 will be
accounted into measures for the next fiscal recalculation, to make sure that no burden is imposed on future generations.
Employment
1. Measures to reduce mismatches of job offerings and job hunters
• Support for the smooth migration of labor, and simultaneously promotion of the development of new professional abilities, such as comprehensive training for IT-related
work
• Employment supports for young people without stable jobs, through utilization of various
work cases, etc.
• Promotion of employment-support measures for young people hunting for jobs. 2. Creation of fine employment opportunities
• Creation of employment opportunities in small and medium sized enterprises, and new or
growing sector industries
3. Preparation of an employment environment suited to the aging society
• Substantial increase in the number of Family Support Centers and Silver Human Resource Centers
4. Creation of a working environme nt where workers may work with a sense of security
• Provision for secondary physical examinations, etc.

Highlights of Public Works Related Budgets
FY2000 FY2001 FY2000→2001
Public Work Related
Expenditures
Before reorganization: 9,430.7 billion yen
After reorganization: 9,434.0 billion yen
9,435.2 billion
yen
+4.5 billion yen (+0.0%)
+1.2 billion yen (+0.0%)
◆ Promotion of Prioritized Budgeting • The budget for public works will be allocated with priority towards various programs, while
standards and schedules for the upgrade of infrastructures and the spending conditions of the
budget, etc. are comprehensively considered. Simultaneously, priority towards those measures
for the rebirth of our socioeconomy, such as the promotion of information technology,
environmental issues, response to the aging society, and upgrade of urban infrastructure, will be considered.
Project (examples) FY2000→FY2001 Project (examples) FY2000→FY2001
Shinkansen (bullet train) +113.2% Main urban railroads -18.7%
Reducing the digital divide +74.2% Industrial water -6.6%
Road works promoting traffic efficiency +12.3% Water supply -5.6%
Waste disposal +11.6% Airport/Aids to Navigation -4.0%
Renewal of urban environment +8.0% Coastline -3.5%
◆ Review of Scope and Expenditure Programs 1. An infrastructure improvement program to reduce gaps in telecommunications services
(antennas for mobile communications, local intranets, etc.) will be added as a new
expenditure program for public work related spending. 2. Expenditure programs for public works will be reformed, according to their functions and
purposes.
• taking into account the vital need for overall environmental improvement in urban areas where
people and various functions are integrated, a new program for the renewal of the urban
environment will be added. • a program for fishing ports and villages and coastline fishing areas will be integrated into the new
fishery infrastructure program, and related projects will be reformed.
• In order to solidify the economic trend towards a self-sustained recovery path, budgets for public works equal to amounts in the FY2000 initial budget will be secured.
• Prioritized distribution of budgets including those for public works budgets will be made, towards
the four areas designated as priority areas in the Japan Rebirth Plan. • Over 270 projects will be cancelled after thorough review of each project. Using central
government reform as an opportunity, further mergers between measures and projects, within and beyond the borders of public investment will be promoted

◆ Promotion of Efficiency, Transparency, and Decentralization 1. Drastic reform of individual projects
• Taking into account the ruling parties’ agreement for the drastic reform of public works, efforts to
reevaluate ongoing projects will continue.
→A record 272 projects will be canceled. (Total cost reduction in future expenditures is
estimated to be approximately 2.6 trillion yen.)
2. Promotion of mergers and cooperation between measures
• For a more efficient, thus effective restructuring of social infrastructure, further mergers of
measures and projects within and beyond the borders of public investment, in the areas of
traffic, sewerage treatment, housing and welfare, district development, disaster protection, etc.,
will be promoted. 3. Expansion of integrated subsidy programs
• Taking into account the roles of the national and local governments, new integrated subsidy
programs for nine project areas (first class rivers, coastlines, public housing, fishery foundations, etc.)
will be established from the viewpoint of greater effectiveness and efficiency.

Highlights of Local Government Related Budgets
FY2000 FY2001 FY2000→2001
Local Allocation Tax Grants
(General Account Basis)
(Special Account Payment Basis)
14,016.3 billion yen
21,410.7 billion yen
15,921.1 billion yen
20,349.8 billion yen
+1,904.8 billion yen (+13.6%)
-1,060.9 billion yen (-5.0%)
Special Local Grants 914.0 billion yen 901.8 billion yen -12.2 billion yen (-1.3%)
(Note) The general account expenditure for local governments, which is the combination of local allocation tax
grants and special local grants is 16,823.0 billion yen (+1,892.6 billion yen, 12.7%) for FY2001.
◆ Outlook for Local Government Expenditures Total:
Local General Expenditures:
Unsubsidized Capital Expenditures
88,930.0 billion yen (+0.5%)
73,985.4 billion yen (-0.9%)
18,500.0 billion yen (-4.1%)
⇒
⇒
⇒
89,310.0 billion yen (+0.4%)
73,550.0 billion yen (-0.6%)
17,500.0 billion yen (-5.4%)
(Note) The scale of the amount of unsubsidized capital expenditures was corrected to adjust for the difference
between the amount in the local finance program and the actual amounts in current years and it is not
supposed to be a decrease in the budgets in local governments.
◆ Outlook for Local Government Fiscal Balances and Local Finance Measures 1. Shortages in financial sources
Shortages in ordinary balances
Effects of permanent tax reductions
9,867.3 billion yen
3,502.6 billion yen
⇒
⇒
Approx.10,590.0 billion yen
3,604.6 billion yen
2. Measures for the shortages of financial sources in ordinary balance
To compensate for the lack of financial sources (approximately 10,590 billion yen), the system of
borrowing in the local allocation tax special account will be reviewed to further increase the
transparency of national and local fiscal conditions. Spending by the national government will be transferred from the general account, and spending by local governments will be compensated by the
implementation of special local bonds (temporary fiscal measure bonds) (FY2001-2003).
However, for FY2001, the current system of borrowing in the local allocation tax special account will be
simultaneously maintained, due to consideration towards the effect of decreases in local allocation
taxes to the local governments.
• The fiscal outlook of local general expenditures for FY2001 is estimated to decrease by
approximately 0.6% compared to FY2000. This is accurately in proportion with administrative
needs, for rational, thus efficient, spending. • On the revenue side, severe conditions are still expected to continue, and local government
revenues for FY2001 are expected to show a great shortage. • To cover the lack of financial sources in the ordinary balance, the system of borrowing in the local
allocation tax special account will be reviewed, and new local finance measures such as the
implementation of special local bonds, will be made to further increase the transparency of national
and local fiscal conditions.

-Increase in local bonds issuance
-Local construction bonds issued for
the shortfall of revenue sources
-Temporary fiscal measure bonds
-Increase in local allocation taxes
-General account based increase (legal addition)
-General account based increase (special addition)
-Borrowing in the local allocation tax special account
-Borne on the national responsibility
-Borne on the local responsibility
-Deferred refund of the special account borrowing
-Deferred adjustments from the preceding year
2,430.0 billion yen
2,430.0 billion yen
―
7,437.3 billion yen
600.0 billion yen
150.0 billion yen
3,244.6 billion yen
3,244.6 billion yen
―
198.1 billion yen
⇒
⇒
⇒
⇒
⇒
⇒
⇒
⇒
⇒
⇒
Approx.3,970.0 billion yen
Approx.2,530.0 billion yen
Approx.1,440.0 billion yen
6,613.5 billion yen
569.5 billion yen
1,436.8 billion yen
1,436.9 billion yen
1,436.9 billion yen
1,733.4 billion yen
―
3. Measures for the effects of permanent tax reductions
(1) Effects of local tax reductions
-Measures to compensate for the change in
national and local tobacco tax rates, to increase
local tobacco tax revenues.
-Increase in the local allocation tax rate transferred
from corporate tax revenues (+3.8%)
-Special local grants
-Tax reduction compensation bonds
(2) Effects of national tax reductions
-Borrowing in the local allocation tax special
account, etc. (Borne on the national responsibility)
-Borrowing in the local allocation tax special
account (Borne on the local responsibility)
-Deferred refund of the special account borrowing
1,903.7 billion yen
135.8 billion yen
378.0 billion yen
914.0 billion yen
475.9 billion yen
1,598.9 billion yen
799.4 billion yen
799.5 billion yen
―
⇒
⇒
⇒
⇒
⇒
⇒
⇒
⇒
⇒
1,979.3 billion yen
132.8 billion yen
449.9 billion yen
901.8 billion yen
494.8 billion yen
1,625.3 billion yen
751.7 billion yen
751.9 billion yen
121.6 billion yen

Special Allocation Category for the Rebirth of Japan (700 billion yen)
◆ Promotion of the IT Revolution (Non-public works: 187.8 billion yen, public works: 62.7 billion yen) 1. Creation of an information network at a globally high standard
(non-public works: 23.6 billion yen, public works: 24.4 billion yen) • Research and development of super-high-speed photonic network technologies • Breakthroughs in IT technologies • Development of space for fiber optic cables • Establishment of support projects for barrier-free information access for disabled people, etc.
2. Information-oriented education and human resource development
(non-public works: 32.1 billion yen) • Establishment of the Child Dream Fund (tentative name) • Development of a new-generation study areas for IT classes and 20-student classes • Development of IT technology to promote educational use of the Internet, etc.
3. Promotion of electronic government
(non-public works: 49.3 billion yen, public works: 37.7 billion yen) • Digitalization of tax administrations, such as electronic tax declarations and tax payments • Development of GIS infrastructure information (25,000 level) • Development of ITS • Development of IT-based disaster preventive infrastructure to provide quick and accurate disaster
information, etc. 4. Security measures
(non-public works: 12.7 billion yen) • Measures against cyber terrorists • Research and development of security technologies for networking, accessing, and information
contents, etc.
Promotion of the four major fields of the Japan Rebirth Plan • Promotion of the IT revolution (250.4 billion yen) → for the formation of E-Japan • Response to environmental issues (131.5 billion yen) → for a recycling society that is gentle on
the environment • Response to the aging society (98.9 billion yen) → for a cheerful and vital aging society • Upgrade of urban infrastructures (204.0 billion yen) → for the development of a comfortable and
energetic urban society.
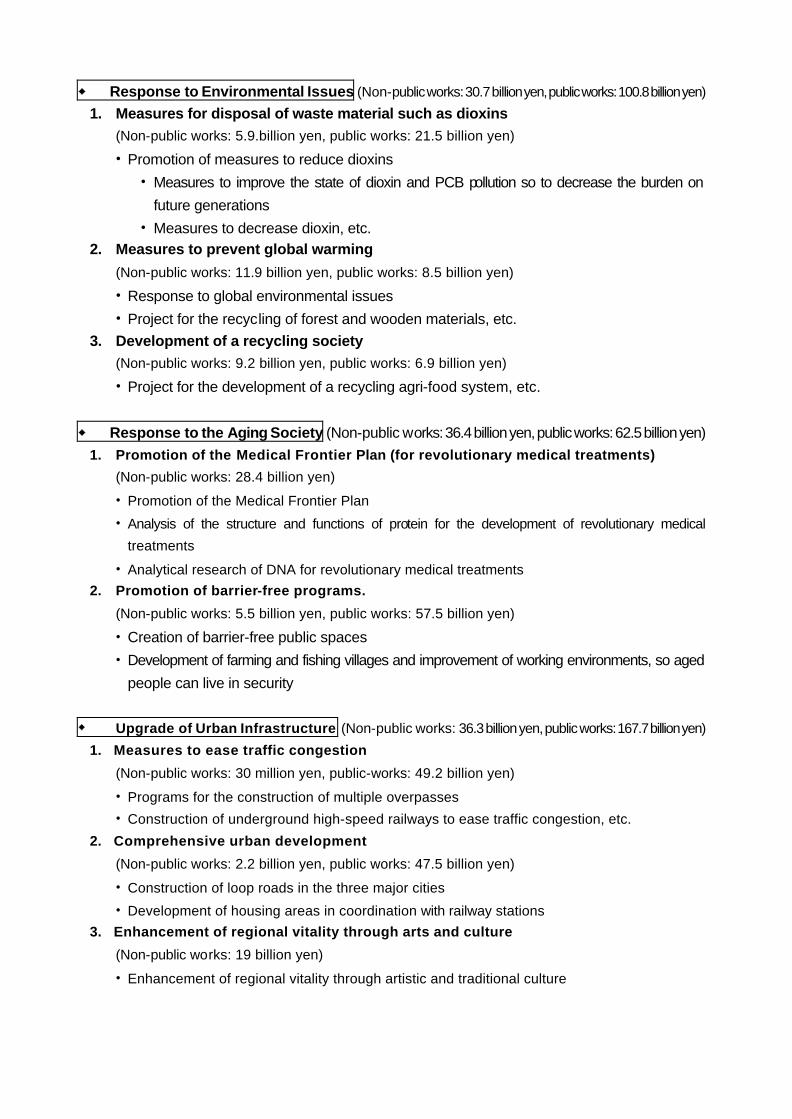
◆ Response to Environmental Issues (Non-public works: 30.7 billion yen, public works: 100.8 billion yen) 1. Measures for disposal of waste material such as dioxins
(Non-public works: 5.9.billion yen, public works: 21.5 billion yen)
• Promotion of measures to reduce dioxins • Measures to improve the state of dioxin and PCB pollution so to decrease the burden on
future generations • Measures to decrease dioxin, etc.
2. Measures to prevent global warming
(Non-public works: 11.9 billion yen, public works: 8.5 billion yen)
• Response to global environmental issues • Project for the recycling of forest and wooden materials, etc.
3. Development of a recycling society (Non-public works: 9.2 billion yen, public works: 6.9 billion yen)
• Project for the development of a recycling agri-food system, etc.
◆ Response to the Aging Society (Non-public works: 36.4 billion yen, public works: 62.5 billion yen) 1. Promotion of the Medical Frontier Plan (for revolutionary medical treatments)
(Non-public works: 28.4 billion yen)
• Promotion of the Medical Frontier Plan
• Analysis of the structure and functions of protein for the development of revolutionary medical
treatments
• Analytical research of DNA for revolutionary medical treatments 2. Promotion of barrier-free programs.
(Non-public works: 5.5 billion yen, public works: 57.5 billion yen)
• Creation of barrier-free public spaces
• Development of farming and fishing villages and improvement of working environments, so aged
people can live in security
◆ Upgrade of Urban Infrastructure (Non-public works: 36.3 billion yen, public works: 167.7 billion yen)
1. Measures to ease traffic congestion
(Non-public works: 30 million yen, public-works: 49.2 billion yen)
• Programs for the construction of multiple overpasses • Construction of underground high-speed railways to ease traffic congestion, etc.
2. Comprehensive urban development
(Non-public works: 2.2 billion yen, public works: 47.5 billion yen)
• Construction of loop roads in the three major cities
• Development of housing areas in coordination with railway stations 3. Enhancement of regional vitality through arts and culture
(Non-public works: 19 billion yen)
• Enhancement of regional vitality through artistic and traditional culture

February 2001
Ministry of Finance
Medium-term Fiscal Projection
(Trillion yen, %) FY2000 FY2001 FY2002 FY2003 FY2004
(- 21.8) ( 7.1) ( 6.2) ( 6.3) National Debt Service
22.0 17.2 18.4 19.5 20.8 ( 12.7) ( 15.6) ( 1.3) ( 6.9)
Local Allocation Tax Grants 14.9 16.8 19.5 19.7 21.1
( 1.2) ( 1.6) ( 1.6) ( 2.2) General Expenditures
48.1 48.7 49.5 50.2 51.3 ( 4.7) ( 5.1) ( 4.2) ( 4.2) Social Security Related
Expenditures 16.8 17.6 18.4 19.2 20.0 ( 0.0) ( 0.0) ( 0.1) ( 0.2) Public Work Related
Expenditures 9.4 9.4 9.4 9.4 9.5 ( - 1.0) ( - 0.4) ( 0.0) ( 1.2)
Others 21.9 21.7 21.6 21.6 21.8
( - 2.7) ( 5.6) ( 2.5) ( 4.1)
Outlays
Total 85.0 82.7 87.3 89.5 93.2
(Trillion yen, %) FY2000 FY2001 FY2002 FY2003 FY2004
( 4.2) ( - 0.7) ( 0.4) ( 1.4) Tax Revenues
48.7 50.7 50.4 50.6 51.3 ( - 3.0) ( 1.2) ( - 4.2) ( 1.4)
Non-Tax Revenues 3.7 3.6 3.6 3.5 3.5
(-13.2) ( 17.5) ( 6.4) ( 8.2) Government Bond Issues
32.6 28.3 33.3 35.4 38.3 ( - 2.7) ( 5.6) ( 2.5) ( 4.1)
Revenues
Total 85.0 82.7 87.3 89.5 93.2
This projection assumes the real GDP growth rate after FY 2002 to be 2%, which is the rate estimated within the Reference Material of “Ideal Socioeconomy and Policies for Economic Rebirth” (July 1999, Economic Council). The Consumer Price Index and the nominal GDP growth rates are assumed to be, 0% and 2%, respectively. The projection is calculated on current services basis assuming that the policies under FY2001 budget will remain unchanged in the coming years, and should in no way be interpreted to bind the Government's future budget formulation. The projection is subject to change in accordance with changes in the assumption for calculations.
Notes:1. Figures in the parenthesis indicate the percentage changes from the previous fiscal year.
2. Figures for FY 2000 are based on the initial budget.
Unofficial and Provisional Translation Readers are advised to refer to the original Japanese
text before quoting from this document.

[Assumptions for Calculation]
National Debt Service: Interest rates (3.2% for 10-year Government bonds) are assumed for the calculation. Local Allocation Tax Grants: includes
- Local Allocation Tax Grants* (grants by statutable rate and special grants) - Local Special Grants (grants intended to offset the revenue shortfall of local governments due to permanent tax reductions) * For grants by statutable rate in Local Allocation Tax Grants, elasticity against nominal GDP growth rate of 1.2 is assumed. For
special grants in Local Allocation Tax Grants, the projection takes into account the fact that the special legal addition in Local Allocation Tax Grants will increase from 1/4 of the shortfall in financial sources of local government fiscal balances (in FY 2001), to 1/2 (after FY 2002) by local financial measures in FY2001.
General Expenditures: calculated on current services basis assuming that the policies under the FY2001 budget will remain unchanged in the coming years. As for public investment, the amount is assumed to be basically equivalent to that of the previous fiscal year.
Tax Revenues : Elasticity against nominal GDP growth rate of 1.1 is assumed. The projection also takes into account the effect of the FY2001 tax reform and the fact that substantial amounts of teigaku postal savings are maturing during a limited period of time.
Non-tax revenues: Elasticity against nominal GDP growth rate of 1.0 is assumed. Government Bond Issues: The amount of Government Bonds Issues is assumed to be equivalent to Outlays minus the sum of Tax
Revenues and Non-Tax Revenues.
[Reference] (1)Reference Figures (Trillion Yen, %)
FY2000 FY2001 FY2002 FY2003 FY2004 Government Bond Dependency Ratio 38.5 34.3 38.1 39.5 41.1
Government Bonds Outstanding 365 389 418 448 483 Government Bonds Outstanding as a Percentage of GDP 71.0 74.9 78.9 83.1 87.7
Note: Figures for FY2000 are based on the supplementary budget. (2)Simulation in cases of changes in assumptions (after FY 2002)
(i) In case that only the assumed Consumer Price Index growth rate increases by 1% point (assumption of Nominal GDP becomes 3%)
(Trillion Yen, %) FY2000 FY2001 FY2002 FY2003 FY2004
(-21.8) ( 7 .1 ) ( 6 . 1 ) ( 6 . 1 ) National Debt Service 22.0 17.2 18.4 19.5 20.7
(12.7) (15.9) ( 1 . 5 ) ( 7 . 1 ) Local Allocation Tax Grants 14.9 16.8 19.5 19.8 21.2
( 1 .2 ) ( 2 . 0 ) ( 2 . 0 ) ( 2 . 6 )
Outlays
General Expenditures 48.1 48.7 49.6 50.6 51.9
( 4 . 2 ) ( 0 . 4 ) ( 1 . 5 ) ( 2 . 5 ) Tax Revenues 48.7 50.7 50.9 51.7 53.0
( - 3 .0 ) ( 1 . 7 ) ( - 3 .7 ) ( 2 . 0 ) Non-Tax Revenues 3.7 3.6 3.7 3.5 3.6
(-13.2) (16.3) ( 5 . 4 ) ( 7 . 4 )
Revenues
Government Bond Issues 32.6 28.3 32.9 34.7 37.3
( - 2 .7 ) ( 5 . 9 ) ( 2 . 7 ) ( 4 . 4 ) Total 85.0 82.7 87.5 89.9 93.8
(ii) In case that only the assumed Interest Rate increases by 1% point
(Trillion Yen, %) FY2000 FY2001 FY2002 FY2003 FY2004
(-21.8) (12.3) ( 9 . 9 ) (10.5) National Debt Service 22.0 17.2 19.3 21.2 23.4
(12.7) (17.5) ( 1 . 6 ) ( 7 . 1 ) Local Allocation Tax Grants 14.9 16.8 19.8 20.1 21.5
( 1 .2 ) ( 1 . 8 ) ( 1 . 7 ) ( 2 . 2 )
Outlays
General Expenditures 48.1 48.7 49.5 50.4 51.5
( 4 . 2 ) ( - 0 .7 ) ( 0 . 4 ) ( 1 . 4 ) Tax Revenues 48.7 50.7 50.4 50.6 51.3
( - 3 .0 ) ( 1 . 2 ) ( - 4 .2 ) ( 1 . 4 ) Non-Tax Revenues 3.7 3.6 3.6 3.5 3.5
(-13.2) (22.0) ( 8 . 7 ) (10.7)
Revenues
Government Bond Issues 32.6 28.3 34.5 37.6 41.6
( - 2 .7 ) ( 7 . 2 ) ( 3 . 5 ) ( 5 . 2 ) Total 85.0 82.7 88.6 91.7 96.4