highlights and executive · pdf filehighlights and executive summary report ... the...
TRANSCRIPT
EpidEmiologic TrEnds in drug AbusE
Proceedings of the Community Epidemiology Work Group
Highlights and Executive Summary
January 2014

NATIONAL INSTITUTE ON DRUG ABUSE
EpidEmiologic TrEnds in drug AbusE
Proceedings of the Community Epidemiology Work Group
Highlights and Executive Summary
January 2014
U.S. DEPARTMENT OF HEALTH AND HUMAN SERVICES NATIONAL INSTITUTES OF HEALTH
Division of Epidemiology, Services and Prevention Research National Institute on Drug Abuse
6001 Executive Boulevard Bethesda, Maryland 20892

ii Proceedings of the Community Epidemiology Work Group, January 2014
The National Institute on Drug Abuse (NIDA) acknowledges the contributions made by the representatives of the Community Epidemiology Work Group (CEWG), who prepare the reports presented at the semiannual meetings. Appreciation is extended also to other participating researchers and Federal officials who contributed information. This publication was prepared by Social Solutions International, Inc., under contract number N01DA-12-5570 from the National Institute on Drug Abuse.
The information presented in this Executive Summary is primarily based on CEWG area update briefs and meeting presentations prepared by CEWG representatives for the January 2014 CEWG meeting. Data/information from Federal sources supplemental to the meeting presentations and discussions have been included in this report to facilitate cross-area comparisons.
All material in this report is in the public domain and may be reproduced or copied without permission from the Institute or the authors. Citation of the source is appreciated. The U.S. Government does not endorse or favor any specific commercial product. Trade or proprietary names appearing in this publication are used only because they are considered essential in the context of the studies reported herein.
For more information about the Community Epidemiology Work Group and other research-based publications and information on drug abuse and addiction, visit NIDA’s Web site at http://www.drugabuse.gov.
Contents FOREwORD ........................................................................................................................................... iv
MEETING HIGHLIGHTS AND SUMMARy .............................................................................................. 1 January 2014 CEwG Meeting: Key Findings .................................................................................. 2 Summary of Drug Trends by Region ............................................................................................. 12 Across CEwG Areas: National Forensic Laboratory Information System (NFLIS) Data ..................................................................................................................................... 34
APPENDICES ........................................................................................................................................ 47
Appendix 1. Data Sources Used in CEWG Update Briefs for January 2014: Caveats and Limitations and Appendix Table 1. Data Indicators for January 2014 Update Briefs and Presentations........................................................................................................................50
Appendix Tables 2.1–2.25. NFLIS Top 10 Most Frequently Identified Drug Reports (Primary, Secondary, and Tertiary) Among Drug Items Seized and Analyzed in Forensic Laboratories for 24 CEWG Areas and the United States: 1H 2013 (January–June 2013) ................................51
Appendix Tables 3.1–3.3. NFLIS Numbers of Cannabimimetic, Substituted Cathinone, and Phenethylamine Drug Reports Identified in Forensic Laboratories in 24 CEWG Areas and the United States: 1H 2013 (January–June) ...............................................................................................58
PARTICIPANT LIST ............................................................................................................................... 63
National Institute on Drug Abuse June 2014
iii
Foreword
Proceedings of the Community Epidemiology Work Group, January 2014
Foreword
This Executive Summary provides a synthesis of findings from the 75th semiannual meeting of the National Institute on Drug Abuse (NIDA) Community Epidemiology Work Group (CEWG) held by webinar on January 22–23, 2014. The CEWG is a network of researchers from sentinel sites throughout the United States. It meets semiannually to provide ongoing community-level public health surveillance of drug abuse through presentation and discussion of quantitative and qualitative data. CEWG representatives access multiple sources of existing data from their local areas to report on drug abuse patterns and consequences in their areas and to provide an alert to potentially emerging new issues. Local area data are supplemented, as possible, with data available from federally supported projects, such as the Substance Abuse and Mental Health Services Administration (SAMHSA), Drug Abuse Warning Network (DAWN); Drug Enforcement Administration (DEA), National Forensic Laboratory Information System (NFLIS); the Arrestee Drug Abuse Monitoring (ADAM) II program; and the DEA, Heroin Domestic Monitor Program (HDMP). This descriptive and analytic information is used to inform the health and scientific communities and the general public about the current nature and patterns of drug abuse, emerging trends, and consequences of drug abuse.
The CEWG convenes twice yearly, in January and June. For the June meetings, CEWG representatives prepare full reports on drug abuse patterns and trends in their areas. After the meeting, a Highlights and Executive Summary Report is produced, and the full CEWG area reports are included in a second volume (in June 2014, the full area reports will be available individually on the NIDA Web site and will not be compiled in a second volume). For the January report, the representatives present an abbreviated report to provide an update on data newly available since the prior June report and to identify significant issues that have emerged since the prior meeting. These abbreviated reports, or update briefs, are available on the NIDA Web site.
The majority of the January 2014 meeting was devoted to the CEWG area reports and presentations. CEWG area representatives presented data on local drug abuse patterns and trends. Other highlights of the meeting included a welcome from Wilson Compton, M.D., M.P.E., Deputy Director of NIDA, and presentations by DEA representatives Jeffrey H. Comparin, with an update on the special testing and research laboratory; Wanda Iyoha, who gave a STRIDE (System to Retrieve Information From Drug Evidence) update on heroin, cocaine, and methamphetamine trends; and Sarah Bourne, who provided an overview of U.S. drug trends from the 2013 National Drug Threat Assessment.
This Highlights and Executive Summary Report for the January 2014 CEWG meeting includes highlights from the meeting, CEWG area reports, and discussions and cross-site data compilations.
Moira P. O’Brien Division of Epidemiology, Services and Prevention Research
National Institute on Drug Abuse National Institutes of Health
Department of Health and Human Services
1
CEWG Meeting Highlights and Summary
Proceedings of the Community Epidemiology Work Group, January 2014
CEwG Meeting Highlights and Summary
The 75th semiannual meeting of the Community Epidemiology Work Group (CEWG) was held on January 22–23, 2014, as a virtual meeting by webinar. During the meeting, researchers from 20 geographically dispersed areas in the United States reported on current trends and emerging drug issues in their areas.
The CEwG Network and Meetings: The CEWG is a unique epidemiology network that has functioned since 1976 to identify and assess current and emerging drug abuse patterns, trends, and issues, using multiple sources of existing information. The CEWG convenes semiannually; these meetings continue to be a major and distinguishing feature of the work group. CEWG representatives present information on drug abuse patterns and trends in their areas. In addition to CEWG area presentations, time at each meeting is devoted to presentations by invited speakers. These sessions typically focus on presentations by researchers in the CEWG host city or with expertise on a particular topic, updates by Federal personnel on key data sets used by CEWG representatives, and drug abuse patterns and trends in other countries. The meetings provide a foundation for continuity in the monitoring and surveillance of current and emerging drug problems and related health and social consequences.
Identification of changing drug abuse patterns is part of the discussions at each CEWG meeting. Through this process, CEWG representatives can alert one another to the emergence of a potentially new drug of abuse. The CEWG is uniquely positioned to bring crucial perspectives to bear on urgent drug abuse issues in a timely fashion and to illuminate their various facets within the local context through its semiannual meetings.
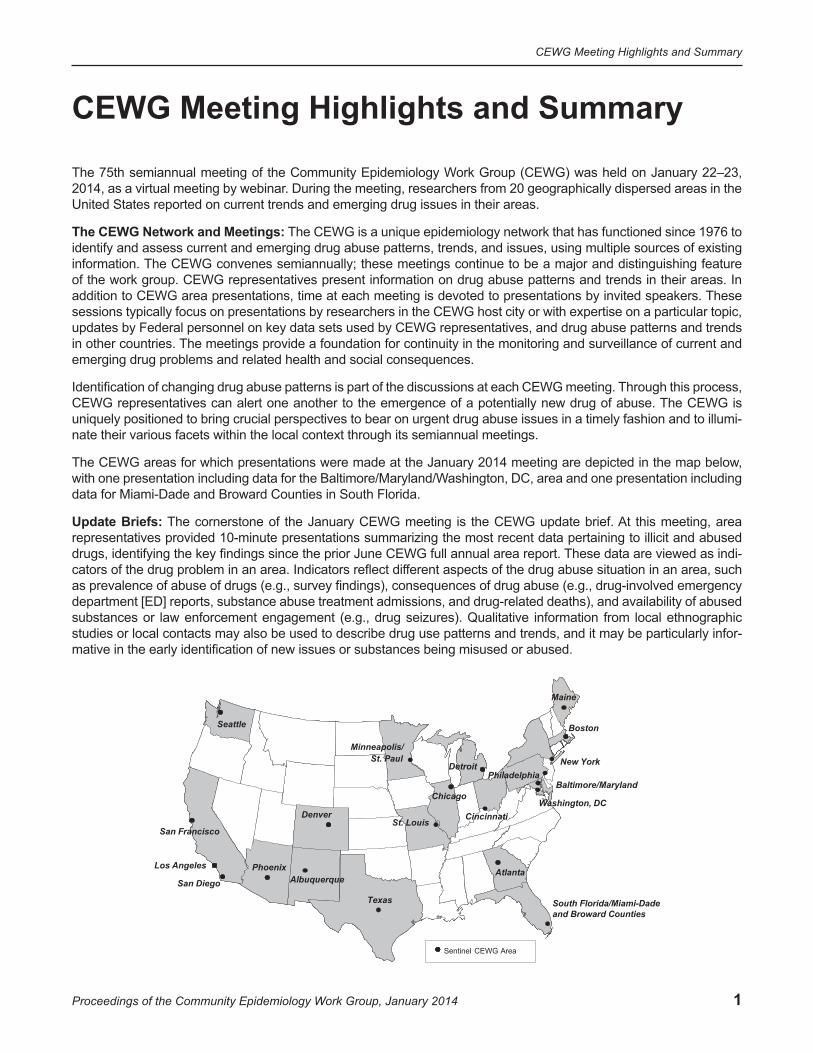
The CEWG areas for which presentations were made at the January 2014 meeting are depicted in the map below, with one presentation including data for the Baltimore/Maryland/Washington, DC, area and one presentation including data for Miami-Dade and Broward Counties in South Florida.
Update Briefs: The cornerstone of the January CEWG meeting is the CEWG update brief. At this meeting, area representatives provided 10-minute presentations summarizing the most recent data pertaining to illicit and abused drugs, identifying the key findings since the prior June CEWG full annual area report. These data are viewed as indicators of the drug problem in an area. Indicators reflect different aspects of the drug abuse situation in an area, such as prevalence of abuse of drugs (e.g., survey findings), consequences of drug abuse (e.g., drug-involved emergency department [ED] reports, substance abuse treatment admissions, and drug-related deaths), and availability of abused substances or law enforcement engagement (e.g., drug seizures). Qualitative information from local ethnographic studies or local contacts may also be used to describe drug use patterns and trends, and it may be particularly informative in the early identification of new issues or substances being misused or abused.
San Diego
South Florida/Miami-Dade and Broward Counties
Sentinel CEWG Area
Texas
Seattle
Los Angeles Phoenix
Denver
Minneapolis/ St. Paul
Chicago
St. Louis
Washington, DC
Atlanta
Cincinnati
Albuquerque
Baltimore/Maryland
San Francisco
New York
Boston
Maine
Philadelphia Detroit
2
CEWG Meeting Highlights and Summary
Proceedings of the Community Epidemiology Work Group, January 2014
Availability of data varies by area, so reporting varies by area. Examples of types of data reviewed by CEWG representatives to derive drug indicators include the following: admissions to drug abuse treatment programs by primary substance of abuse or primary reason for treatment admission reported by clients at admission; drug-involved ED reports of drugs mentioned in ED records in the Drug Abuse Warning Network or reports from local and State sources; seizure, average price, average purity, and related data obtained from the Drug Enforcement Administration (DEA) and from State and local law enforcement agencies; drug-caused deaths and drugs detected in decedents reported by medical examiner or local coroner offices or State public health agencies; arrestee urinalysis results and other toxicology data; surveys of drug use; and poison control center data1.
Sources of data used by several or most of the CEWG area representatives and presented in this Highlights and Executive Summary Report are summarized in appendix 1, along with caveats related to their use and interpretation. The terminology that a particular data source uses to characterize a drug, for example cannabis versus marijuana, is replicated in this report. Appendix table 1 shows the drug abuse indicators from data sources used in update briefs and presentations for the January 2014 CEWG meeting by area.
For the January 2014 CEWG meeting, CEWG representatives were invited to provide an update on drug abuse trends in their areas for the first half of 2013 (January–June). Key findings and issues identified at the CEWG meeting are highlighted in this section, with detail provided in the local area update briefs and abstracts which are available individually on the NIDA Web site. These update briefs document and summarize drug abuse trends and issues in specific CEWG areas, with an emphasis on information newly available since the June 2013 meeting reports. The availability of data varies by area. Readers are directed to the Data Sources section in appendix 1 and appendix table 1 to determine which drug indicators and data sources were reviewed for particular areas.
CEWG representatives are invited to use their professional judgment and knowledge of the local context to provide an overall characterization in their update briefs of the indicators for their areas, as possible, given available data; that is, to assess whether indicators appear to be stable, increasing, decreasing, or mixed (with some indicators increasing, some decreasing, and some stable). CEWG area representatives may also provide an overall characterization of the level of the indicators as high, moderate, or low, or identify when particular drugs are considered to be the dominant drugs of abuse in the area. Some indicators are sensitive to recent changes in local policy or law enforcement focus. Therefore, representatives use their knowledge of the local context in describing and interpreting data available for their areas.
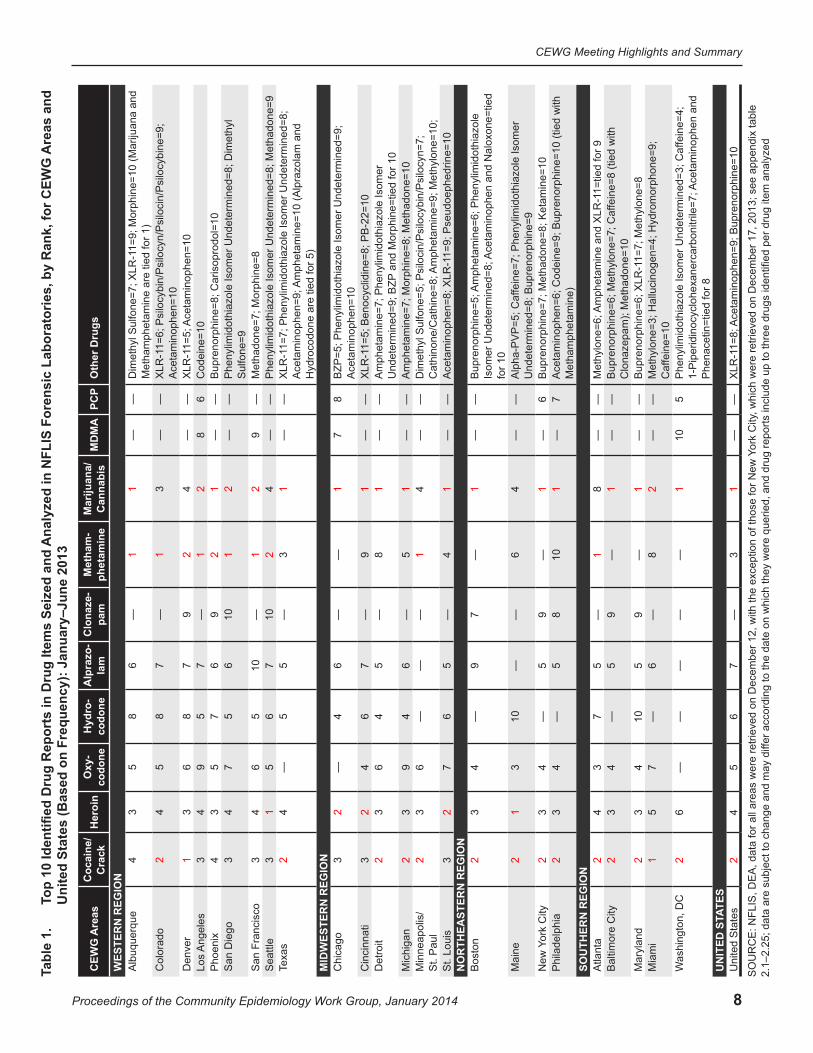
Data available across a majority of CEWG areas, such as drug reports information from the National Forensic Laboratory Information System (NFLIS) are reviewed. These NFLIS data are presented in tabular and graphical formats in tables 1–5 and in figures 1 and 3–9, as well as in appendix tables 2.1–2.25 and appendix tables 3.1–3.3.
Findings in this report are presented by type of substance, but it is important to note that polysubstance abuse continues to be a pervasive pattern across CEWG areas.
JANUARy 2014 CEwG MEETING: KEy FINDINGS
CEwG Area Reports CEWG representatives identified in their reports the most important one or two drug findings or issues for their areas in this reporting period, based on review of the most recent drug abuse data available in this 2014 reporting period (the first half of 2013 for most data sources).
1Poison control center data are reported here as they are reported by area representatives in their update briefs and slide presentations. The terminology used by area representatives in this report does not necessarily mean that particular substances, such as cannabimimetics (also known as synthetic cannabinoids) and substituted (or synthetic) cathinones, are chemically verified.
3
CEWG Meeting Highlights and Summary
Proceedings of the Community Epidemiology Work Group, January 2014
Heroin A total of 17 of 20 CEWG representatives from all 4 CEWG regions identified heroin as the most, or one of the most, important drug abuse concerns affecting their area either because indicators were increasing or because they were continuing at a high level.
Western CEWG Region: Four of the eight area representatives from the western region (from Denver/Colo-rado, San Diego, Seattle, and Texas) cited increases in heroin as key findings in their areas. One area repre-sentative, from Albuquerque/New Mexico, noted a continuing high level for heroin indicators.
• In Albuquerque/New Mexico, the area representative stated that “the continuing high level of heroin reports among drug items seized and analyzed by National Forensic Laboratory Information System (NFLIS) laboratories” was one of two key findings in that area.
• In Denver and Colorado, the continuing upward trend for heroin in the first half of 2013 was one of the most important drug trends in that area, according to the area representative.
• According to the San Diego area representative, one of two key findings was “the continuing gradual increases in all heroin indicators, accompanied by a growing local concern about overdose deaths involving heroin/morphine and transition by users from prescription opioids to heroin.”
• The key finding in the Seattle area in this reporting period was the increase in heroin indicators, particularly among young adults, based on numbers of primary treatment admissions, numbers and proportions of drug reports identified as heroin among drug items seized by law enforcement and analyzed in NFLIS laboratories, and numbers of drug-caused deaths involving heroin in the first half of 2013.
• In Texas, “an increase in young heroin users” was one of two key findings for this reporting period, as reported by the area representative.
Midwestern CEWG Region: Four CEWG area representatives from the Midwest (from Chicago, Cincinnati, Minneapolis/St. Paul, and St. Louis) included increases in heroin among the key findings for their areas. One area representative, from Detroit, noted a continuing problem with heroin as one of the key findings for that area.
• In Chicago, the area representative reported that the most important finding there was the increase in the numbers of heroin-related deaths from 2011 to 2012 in the suburban counties around Chicago.
• The area representative from Cincinnati reported that the continuing increases in indicators of heroin levels and consequences represented the most important drug trend in the Cincinnati area in the first half of 2013.
• The Detroit area representative reported that the “continuing problems with heroin” in Detroit, Wayne County, and Michigan was one of the two most important drug findings in the first half of 2013.
• In the Minneapolis/St. Paul area, one of the two most important findings reported by the area representative was the continuing increase in heroin indicators, based on primary treatment admissions, deaths, and NFLIS data.
• The consistently high levels for heroin indicators and increases in heroin drug indicators relative to other drugs was one of the key findings in St. Louis in the first half of 2013, as reported by the area representative.
Northeastern CEWG Region: Two of the area representatives from the Northeast (from Boston and Maine) identified increases in heroin indicators as key findings for this reporting period for their areas, and two area representatives (from New York City and Philadelphia) reported continuing high levels of heroin in their areas as key findings.
• The “continuing increases in heroin indicators” was one of the two key drug abuse findings in Boston.
• In Maine, “the increase in heroin and other illicit drugs in drug indicators” was the key finding for this reporting period.
• One of the key findings for New york City for this reporting period was the continuing dominance of heroin (along with cocaine and marijuana/cannabis) in indicators, based on proportions of treatment admissions and drug reports among drug items analyzed by NFLIS laboratories in the first half of 2013.

4
CEWG Meeting Highlights and Summary
Proceedings of the Community Epidemiology Work Group, January 2014
• The key finding in the first half of 2013 in Philadelphia was the continuing predominance of heroin among all indicators, including primary treatment admissions and alcohol and/or drug intoxication deaths.
Southern CEWG Region: All three representatives from the southern CEWG region included heroin increases in their key findings for this reporting period.
• An increase in heroin indicators was one of two key findings in Atlanta in this reporting period, as reported by the area representative.
• The representative from the Baltimore/Maryland/washington, DC, area reported “the upward trending of the numbers of primary treatment enrollments involving heroin in Maryland and Baltimore City” as one of two key findings.
• According to the area representative from Miami-Dade and Broward Counties/South Florida, the key finding identified in 2013 was that a “heroin epidemic” was in the outbreak stage in South Florida, particularly in Miami-Dade County.
Methamphetamine Eleven of 20 area representatives, from all CEWG regions except the Northeast, noted increases in metham-phetamine indicators as the most important, or one of the most important, drug issues in their areas in the first half of 2013.
Western CEWG Region: In the West, six out of eight area representatives noted increases in methamphet-amine indicators among their key findings for the first half of 2013. These areas were Albuquerque/New Mexico, Denver/Colorado, Los Angeles, San Diego, San Francisco, and Texas.
• In Albuquerque/New Mexico, one of the two key findings was the increasing numbers and proportions of both primary methamphetamine/amphetamine treatment admissions in 2012 and methamphetamine drug reports among items analyzed in NFLIS laboratories in the first half of 2013.
• In Denver/Colorado, the area representative reported the upward trends in indicators for methamphetamine (along with heroin and prescription opioids) as a key finding for this reporting period.
• The most important finding in the Los Angeles area was the increase in methamphetamine prevalence and consequence indicators, based on percentages of primary treatment admissions and NFLIS drug reports in the first half of 2013, percentages of reports from relevant poison control center calls for the full calendar 2013 year, and number of coroner toxicology cases projected for 2013.
• One of two key findings in San Diego, according to the area representative, was the increase in indicators for methamphetamine in this reporting period, after several years of mixed or declining indicators.
• In San Francisco, the area representative reported the “continuing dominance of methamphetamine in indicators,” with increases in the number of primary methamphetamine treatment admissions and in the proportion of methamphetamine reports among NFLIS drug items, as one of two key findings.
• The Texas area representative reported the “increasing presence of the more potent P2P (phenyl2-propanone) methamphetamine made in Mexico” as one of two key findings for the first half of 2013.
Midwestern CEWG Region: All four area representatives in the midwestern CEWG region—Cincinnati, Detroit, Minneapolis/St. Paul, and St. Louis—reported increases in methamphetamine indicators as a key finding for this reporting period.
• While methamphetamine indicators In Cincinnati were low relative to other drugs, numbers of clandestine laboratory seizures and methamphetamine poison control center cases increased from FY 2012 to FY 2013, and the proportion of methamphetamine drug reports among items analyzed by NFLIS laboratories increased from CY 2012 to the first half of 2013.
• The area representative from Detroit reported an increase in “stimulants other than cocaine” (amphetamines and methamphetamine) as one of two key findings for that area.
5
CEWG Meeting Highlights and Summary
Proceedings of the Community Epidemiology Work Group, January 2014
• One of the two key findings in the Minneapolis/St. Paul area was the increase in methamphetamine indicators, based on proportions of both primary treatment admissions and methamphetamine reports among seized and analyzed NFLIS drug items.
• An increase in methamphetamine indicators in the St. Louis region in the first half of 2013, in addition to the continuing methamphetamine presence in rural area of the State, was one of three key findings for St. Louis (along with increases in indicators for heroin and prescription opioids).
Southern CEWG Region: One area representative in the South included increases in methamphetamine as a key finding.
• An increase in methamphetamine indicators was reported by the Atlanta area representative as one of two key findings, based on proportions of primary treatment admissions, numbers of deaths, and proportions of NFLIS drug reports.
Prescription Opioids2
Among the key findings identified for the reporting period, 3 of 20 area representatives—1 from the western CEWG region (Denver/Colorado), 1 in the Midwest (St. Louis), and 1 in the Northeast (New York City)—noted increases in indicators for prescription opioids as one of the key findings for this reporting period.
• An increase in indicators for prescription opioids (along with increases for heroin and methamphetamine) was one of the most important drug use trends from the Denver/Colorado area in the first half of 2013, according to the area representative.
• The increase in indicators for prescription opioids relative to other drugs was one of three key findings in the St. Louis area in the first half of 2013 (in addition to increases in heroin and methamphetamine indicators).
• One of two key findings in New york City in this reporting period, according to the area representative, was an increase in indicators and consequences for prescription opioids.
Cocaine One area representative (San Francisco from the western region) included declines in cocaine indicators as a key finding for this reporting period, and one (New York City from the Northeast) noted the continuing pre-dominance of cocaine in that area.
• The continuing decline in cocaine indicators (including decreases in the number of primary treatment admissions and in the proportion of cocaine reports among drug items analyzed in NFLIS laboratories in the first half of 2013) was one of two key findings in San Francisco.
• One of the two important findings in New york City in this reporting period, according to the area representative, was the continuing predominance of cocaine (along with heroin and marijuana/cannabis) in indicators, based on proportions of primary treatment admissions and drug reports among drug items analyzed by NLFIS laboratories in the first half of 2013.
Marijuana/Cannabis Marijuana/cannabis trends were cited by two area representatives as key findings for their areas.
• In Phoenix, the key findings for this period were “that both numbers and proportions of drug reports identified as marijuana/cannabis in Maricopa County among items seized and analyzed by NFLIS laboratories decreased sharply
2Since heroin is an opiate (derived from the opium plant), the drug is excluded from this category, and reported elsewhere. This category primarily includes prescription opioids (narcotic analgesics), which are synthetically produced prescription opioid pain medications, and some nonheroin opiates, such as morphine. Despite the inclusion of some nonheroin opiates, the category is referred to throughout as “prescription opioids.”
6
CEWG Meeting Highlights and Summary
Proceedings of the Community Epidemiology Work Group, January 2014
between the first halves of 2012 and 2013, and marijuana/cannabis-related hospital admissions in Arizona declined among individuals in their twenties.”
• As noted above, one of the two most important findings in New york City in this reporting period was the continuing predominance of marijuana/cannabis (along with heroin and cocaine) in indicators, based on proportions of primary treatment admissions and drug reports among drug items analyzed by NLFIS laboratories in the first half of 2013.
Cannabimimetics and Substituted Cathinones Two CEWG area representatives in the southern region reported changes in trends for cannabimimetics and substituted cathinones as key findings for the first half of 2013 in their areas.
• One of the two key findings reported by the Baltimore/Maryland/washington, DC, area representative was “the increase across the region in indicators for cannabimimetics in 2012, which appeared to be slowing or reversing in 2013 in Washington, DC, but continuing to increase in Baltimore City and Maryland.”
• In addition to the concern for a “heroin epidemic” in the outbreak stage, the representative from the Miami-Dade and Broward Counties/South Florida area noted, “Other key findings in the first half of 2013 were a substantial (nearly 300-percent) increase from the first half of 2012 in drug reports for the synthetic cathinone, methylone, sold as ’Mollys,’ among seized drug items analyzed by NFLIS laboratories, along with the appearance of 37 different emerging psychoactive drugs.”
National Forensic Laboratory Information System (NFLIS)
The DEA’s NFLIS provides information on substances identified in items seized by law enforcement and analyzed by participating forensic (crime) laboratories. NFLIS data provide indications of availability of substances in the illicit market and law enforcement engagement, and they are particularly important for monitoring the emer-gence of new substances in local areas.
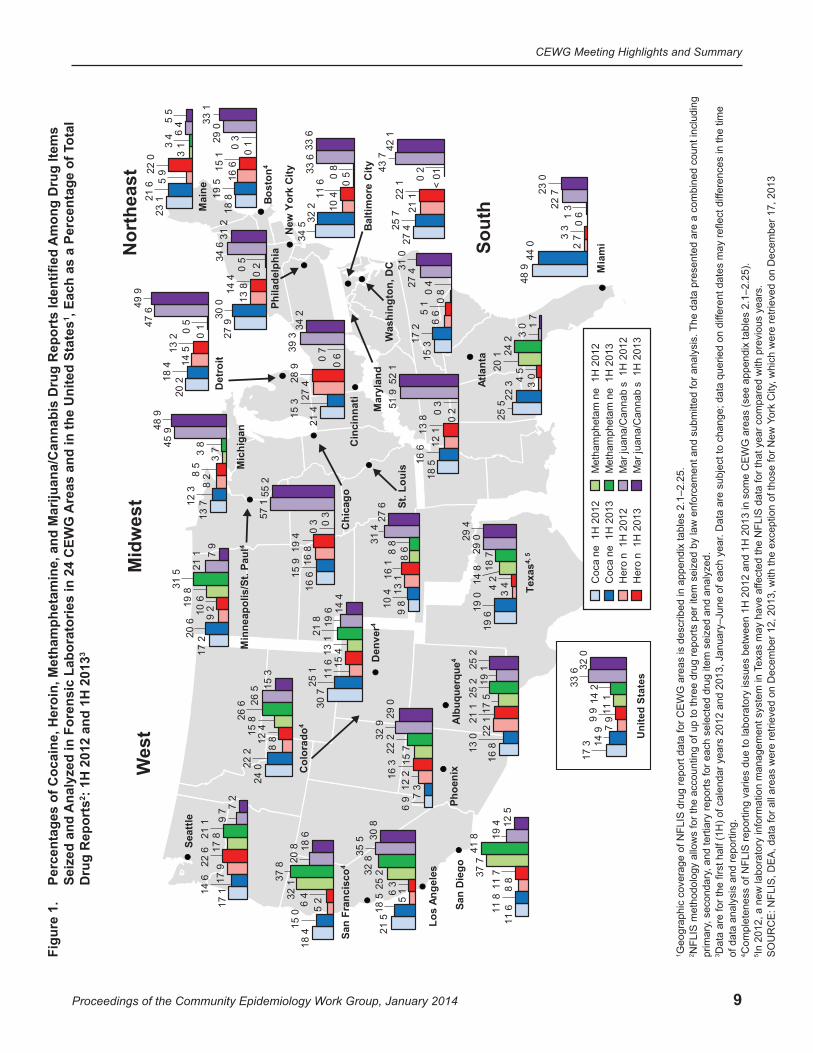
• Marijuana/cannabis was the most frequently identified drug in the first half of 2013 in 14 of 24 CEWG areas: Albuquerque, Baltimore City, Boston, Chicago, Cincinnati, Detroit, Maryland, Michigan, New York City, Philadelphia, Phoenix, St. Louis, Texas, and Washington, DC, as well as in the United States. Chicago had the highest percentage of marijuana/cannabis reports in the first half of 2013 (55.2 percent), and Atlanta had the lowest (1.7 percent)3. The value for the United States was 32.0 percent (table 1; figures 1 and 9; appendix table 2).
• Cocaine was the most frequently identified drug in the first half of 2013 in 2 of 24 CEWG areas, Denver and Miami. Cocaine as a proportion of total drug reports ranged from 7.3 percent in Phoenix to 44.0 percent in Miami, with the United States at 14.9 percent (table 1; figure 3, appendix table 2).
• Heroin was the most frequently identified drug in the first half of 2013 in 2 of 24 CEWG areas, Maine and Seattle. As a proportion of total drug reports, heroin reports were highest in Cincinnati (28.9 percent) and lowest in Miami (3.3 percent), compared with other CEWG areas. The value for the United States was 9.9 percent (table 1; figure 4; appendix table 2).
• Methamphetamine was the most frequently identified drug in the first half of 2013 in 7 of 24 CEWG areas: Albuquerque, Colorado, Los Angeles, San Diego, and San Francisco in the West; Minneapolis/St. Paul in the Midwest; and Atlanta in the South. San Diego had the highest percentage of methamphetamine drug reports (41.8 percent of total drug reports). In nine of the CEWG reporting areas, however, methamphetamine accounted for less than 1.0 percent of the total reports of drug items seized and analyzed; all were located east of the Mississippi River. These areas included Baltimore City, Boston, Chicago, Cincinnati, Detroit, Maryland, New York City, Philadelphia, and Washington, DC. The United States’ value was 14.2 percent (table 1; figures 1 and 8; appendix table 2).
3According to the Atlanta CEWG area representative, Georgia initiated a statewide administrative policy in 2004 that laboratory testing is not required when marijuana/cannabis is seized by law enforcement officers. This may explain the lower numbers for such drug items identified in this CEWG area relative to other CEWG areas.
7
CEWG Meeting Highlights and Summary
Proceedings of the Community Epidemiology Work Group, January 2014
• Other substances identified in lower numbers and proportion but appearing commonly (in at least 10 areas) among the top 10 substances included oxycodone, hydrocodone, and alprazolam (tables 1, 2, and 3; figures 5, 6, and 7): MDMA (3,4-methylenedioxymethamphetamine), PCP (phencyclidine), LSD (lysergic acid diethylamide), and other drugs; and emerging drugs, including cannabimimetics and substituted cathinones (table 1; appendix tables 2 and 3).
• Cannabimimetics (synthetic cannabinoids) were identified in NFLIS data in all CEWG areas.
| XLR-11 (a cannabimimetic or synthetic cannabinoid) appeared among the top 10 substances identified in NFLIS data in 8 of 24 CEWG areas in the first half of 2013. This drug ranked fifth in drug reports in Cincinnati and Denver; sixth in Colorado; seventh in Maryland and Texas; and ninth in Albuquerque, Atlanta, and St. Louis. It ranked eighth in the United States (table 1; appendix table 2). PB-22 ranked 10th among drug reports in Cincinnati in this reporting period (table 1).
| XLR-11 ranked first among drug reports identified as cannabimimetics in NFLIS reports in the United State in the first half of 2013, at 65.5 percent. UR-144 was the second most frequently identified cannabimimetic nationally in NFLIS data (at 6.6 percent of total drug reports for cannabimimetics), and AM-2201 was in third place, at 5.4 percent (appendix table 3.1).
• Substituted (synthetic) cathinones were identified in all CEWG areas.
| Methylone (3,4-methylenedioxymethcathinone or bk-MDMA ) was identified in NFLIS drug reports in all 24 CEWG areas in the reporting period, while 16 of 24 and 18 of 24 areas reported any alpha-PVP (alpha-pyrrolidinophentiophenone) or MDPV (3,4-methylenedioxypyrovalerone), respectively. Methylone ranked third in drug reports in Miami, 6th in Atlanta, 7th in Baltimore City, 8th in Maryland, and 10th in Minneapolis/St. Paul. Alpha-PVP ranked fifth in Maine among drug reports identified in drug items seized and analyzed in forensic laboratories in the first half of 2013.
| Methylone, alpha-PVP, MDPV, and 4-MEC (4-methyl-N-ethylcathinone) were the most frequently identified substituted cathinones in NFLIS data in the first half of 2013 in the United States, at 61.2, 16.8, 9.0, and 7.9 percent of total drug reports for substituted cathinones, respectively (table 1; appendix table 2; appendix table 3.2).
8
CEWG Meeting Highlights and Summary
Proceedings of the Community Epidemiology Work Group, January 2014
Ana
lyze
d in
NFL
IS F
oren
sic
Labo
rato
ries,
by
Ran
k, fo
r CEW
G A
reas
and
To
p 10
Iden
tified
Dru
g R
epor
ts in
Dru
g Ite
ms
Seiz
ed a
nd
Uni
ted
Stat
es (B
ased
on
Freq
uenc
y): J
anua
ry–J
une
2013
Ta
ble
1. Are
asC
EWG
C
ocai
ne/
Cra
ckH
eroi
nO
xy-
codo
neH
ydro
-co
done
Alp
razo
- la
mC
lona
ze-
pam
Met
ham
-ph
etam
ine
M
ariju
ana/
Can
nabi
sM
DM
APC
PO
ther
Dru
gs
WES
TER
N R
EGIO
NA
lbuq
uerq
ue4
35
86
—1
1—
—1=
9; M
orph
ine=
10 (M
ariju
ana
and
Dim
ethy
l Sul
fone
=7; X
LR-1
Met
ham
phet
amin
e ar
e tie
d fo
r 1)
Col
orad
o2
45
87
—1
3—
—X
LR-1
1=6;
Psi
locy
bin/
Psi
locy
n/P
silo
cin/
Psi
locy
bine
=9;
Ace
tam
inop
hen=
10D
enve
r1
36
87
92
4—
—X
LR-1
1=5;
Ace
tam
inop
hen=
10
Los
Ang
eles
34
95
7—
12
86
Cod
eine
=10
Pho
enix
43
57
69
21
——
Bup
reno
rphi
ne=8
; Car
isop
rodo
l=10
S
an D
iego
34
75
610
12
——
Phe
nylim
idot
hiaz
ole
Isom
er U
ndet
erm
ined
=8; D
imet
hyl
Sul
fone
=9
San
Fra
ncis
co3
46
510
—1
29
—M
etha
done
=7; M
orph
ine=
8 S
eattl
e3
15
67
102
4—
—P
heny
limid
othi
azol
e Is
omer
Und
eter
min
ed=8
; Met
hado
ne=9
Te
xas
24
—5
5—
31
——
Am
phet
amin
e=10
(Alp
razo
lam
and
X
LR-1
1=7;
Phe
nylim
idot
hiaz
ole
Isom
er U
ndet
erm
ined
=8;
Ace
tam
inop
hen=
9;
Hyd
roco
done
are
tied
for 5
) M
IDW
ESTE
RN
REG
ION
C
hica
go3
2—
46
——
17
8B
ZP=5
; Phe
nylim
idot
hiaz
ole
Isom
er U
ndet
erm
ined
=9;
Ace
tam
inop
hen=
10C
inci
nnat
i3
24
67
—9
1—
—X
LR-1
1=5;
Ben
ocyc
lidin
e=8;
PB
-22=
10
Det
roit
23
64
5—
81
——
Am
phet
amin
e=7;
Phe
nylim
idot
hiaz
ole
Isom
er
and
Mor
phin
e=tie
d fo
r 10
Und
eter
min
ed=9
; BZP
Mic
higa
n2
39
46
—5
1—
—A
mph
etam
ine=
7; M
orph
ine=
8; M
etha
done
=10
M
inne
apol
is/
St.
Pau
l2
36
——
—1
4—
—D
imet
hyl S
ulfo
ne=5
; Psi
loci
n/P
silo
cybi
n/P
silo
cyn=
7;
Met
hylo
ne=1
0;A
mph
etam
ine=
9;
Cat
hino
ne/C
athi
ne=8
; S
t. Lo
uis
32
76
5—
41
——
1=9;
Pse
udoe
phed
rine=
10
Ace
tam
inop
hen=
8; X
LR-1
NO
RTH
EAST
ERN
REG
ION
B
osto
n2
34
—9
7—
1—
—P
heny
limid
othi
azol
e A
mph
etam
ine=
6;
Ace
tam
inop
hen
and
Nal
oxon
e=tie
d B
upre
norp
hine
=5;
Isom
er U
ndet
erm
ined
=8;
for 1
0M
aine
21
310
——
64
——
fein
e=7;
Phe
nylim
idot
hiaz
ole
Isom
er
Alp
ha-P
VP
=5; C
afU
ndet
erm
ined
=8; B
upre
norp
hine
=9
City
ork
New
Y2
34
—5
9—
1—
6B
upre
norp
hine
=7; M
etha
done
=8; K
etam
ine=
10P
hila
delp
hia
23
4—
58
101
—7
Ace
tam
inop
hen=
6; C
odei
ne=9
; Bup
reno
rphi
ne=1
0 (ti
ed w
ith
Met
ham
phet
amin
e)
SOU
THER
N R
EGIO
N
Atla
nta
24
37
5—
18
——
1=tie
d fo
r 9A
mph
etam
ine
and
XLR
-1M
ethy
lone
=6;
Bal
timor
e C
ity2
34
—5
9—
1—
—fe
ine=
8 (ti
ed w
ith
Bup
reno
rphi
ne=6
; Met
hylo
ne=7
; Caf
Clo
naze
pam
); M
etha
done
=10
Mar
ylan
d2
34
105
9—
1—
—1=
7; M
ethy
lone
=8B
upre
norp
hine
=6; X
LR-1
Mia
mi
15
7—
6—
82
——
Met
hylo
ne=3
; Hal
luci
noge
n=4;
Hyd
rom
orph
one=
9;
fein
e=10
C
afW
ashi
ngto
n, D
C2
6—
——
——
110
5an
d P
heny
limid
othi
azol
e Is
omer
Und
eter
min
ed=3
; Caf
fein
e=4;
A
ceta
min
ophe
n 1-
Pip
erid
inoc
yclo
hexa
nerc
arbo
nitri
le=7
; P
hena
cetin
=tie
d fo
r 8
TES
UN
ITED
STA
Uni
ted
Sta
tes
24
56
7—
31
——
Bup
reno
rphi
ne=1
01=
8; A
ceta
min
ophe
n=9;
X
LR-1
ork
City
, whi
ch w
ere
retri
eved
on
Dec
embe
r 17,
201
3; s
ee a
ppen
dix
tabl
e S
OU
RC
E: N
FLIS
, DE
A, d
ata
for a
ll ar
eas
wer
e re
triev
ed o
n D
ecem
ber 1
2, w
ith th
e ex
cept
ion
of th
ose
for N
ew Y
fer a
ccor
ding
to th
e da
te o
n w
hich
they
wer
e qu
erie
d, a
nd d
rug
repo
rts in
clud
e up
to th
ree
drug
s id
entifi
ed p
er d
rug
item
ana
lyze
d2.
1–2.
25; d
ata
are
subj
ect t
o ch
ange
and
may
dif
9
CEWG Meeting Highlights and Summary
Proceedings of the Community Epidemiology Work Group, January 2014
Figure 1.
Percentages of Cocaine, Heroin, Methamphetamine, and Marijuana/Cannabis Drug Reports Identified Among Drug Items
Seiz
ed a
nd A
naly
zed
in F
oren
sic
Labo
rato
ries
in 2
4 C
EwG
Are
as a
nd in
the
Uni
ted
Stat
es1 ,
Each
as
a Pe
rcen
tage
of T
otal
D
rug
Rep
orts
2 : 1H
201
2 an
d 1H
201
33
Nor
thea
stM
idw
est
49 9
New
Yor
k C
ity
Bost
on4
Det
roit
Mia
mi
Cin
cinn
ati
Atla
nta
Was
hing
ton,
DC
Phila
delp
hia
Texa
s4, 5
Min
neap
olis
/St.
Paul
4
St. L
ouis
Chi
cago
Phoe
nix
Den
ver4
San
Die
go
Los
Ange
les
San
Fran
cisc
o4
Seat
tle
Wes
t
Sout
h
Balti
mor
e C
ity
Mai
ne
Mar
ylan
d
Alb
uque
rque
4
Col
orad
o4
Mic
higa
n
Coc
a ne
1H
201
2 C
oca
ne 1
H 2
013
Her
o n
1H
201
2 H
ero
n 1
H 2
013
Met
ham
phet
am n
e 1
H 2
012
Met
ham
phet
am n
e 1
H 2
013
Mar
juan
a/C
anna
b s
1H
201
2 M
ar ju
ana/
Can
nab
s 1
H 2
013
Uni
ted
Stat
es
17 3
7 9
11 1
33 6
14 9
9 9
14 2
32
0
15 3
6
6 0
8
27 4
17 2
5
1 0
4
31 0
19 6
3 4 14
8
29 0
19 0
4 2
18 7
29 4
17 1
17
9 17
8
9 7
14 6
22
6
21 1
7 2
18 4
5
2 32 1
20
815
0 6
4
37 8
18 6
11 6
8
8 37 7
19
411
8 1
1 7
41 8
12 5
9 8
13 1
8
6
31 4
10
4
16 1
8 8
27
6
6 9
12 2
15
7
32 9
7 3
16 3
22
2 29
0
27 9
13
8 0
2
34 6
30 0
14 4
0 5
31 2
34 5
10 4
0 5 33
632
2 11
6 0
8
33 6
17 2
9
2 19 8
21
1
20 6
10 6
31 5
7 9
13 7
8
2 3
7 45 9
12 3
8
5 3
8
48 9
48 9
2 7
0 6
22 7
44 0
3 3
1 3
23 0
18 5
12
1 0
2 51 9
16 6
13
80
3
52 1
23 1
5
9
3 1
6 4
21 6
22
0 3
45
5
21 5
5 1 25
2
35 5
18 5 6
3
32 8
30
8
20 2
14
5
0 1 47
6
18 4
13
20
5
30 7
11
6 1
3 1
19 6
25
1
15 4
21 8
14 4
24 0
8
8 15 8
26
5
22 2
12 4
26 6
15 3
21 4
27 4
0 6
39 3
15 3
28
9 0
7
34 2
16
6 1
6 8
0 3 57
1
15 9
19 4
0 3
55 2
18 8
16
6 0
1 29 0
19 5
15
1 0
3
33 1
27 4
21
1 <
01 43
7
25 7
22
1
0 2
42 1
16 8
22 1
17
5 19
1
13 0
21
1 2
5 2
25 2
25 5
3 0
20 1
3 0
22 3
4 5
24 2
1 7
1 Geo
grap
hic
cove
rage
of N
FLIS
dru
g re
port
data
for C
EW
G a
reas
is d
escr
ibed
in a
ppen
dix
tabl
es 2
.1–2
.25.
2 NFL
IS m
etho
dolo
gy a
llow
s fo
r the
acc
ount
ing
of u
p to
thre
e dr
ug re
ports
per
item
sei
zed
by la
w e
nfor
cem
ent a
nd s
ubm
itted
for a
naly
sis.
The
dat
a pr
esen
ted
are
a co
mbi
ned
coun
t inc
ludi
ng
prim
ary,
sec
onda
ry, a
nd te
rtiar
y re
ports
for e
ach
sele
cted
dru
g ite
m s
eize
d an
d an
alyz
ed.
3 Dat
a ar
e fo
r the
firs
t hal
f (1H
) of c
alen
dar y
ears
201
2 an
d 20
13, J
anua
ry–J
une
of e
ach
year
. Dat
a ar
e su
bjec
t to
chan
ge; d
ata
quer
ied
on d
iffer
ent d
ates
may
refle
ct d
iffer
ence
s in
the
time
of d
ata
anal
ysis
and
repo
rting
.
4 Com
plet
enes
s of
NFL
IS re
porti
ng v
arie
s du
e to
labo
rato
ry is
sues
bet
wee
n 1H
201
2 an
d 1H
201
3 in
som
e C
EW
G a
reas
(see
app
endi
x ta
bles
2.1
–2.2
5).
5 In 2
012,
a n
ew la
bora
tory
info
rmat
ion
man
agem
ent s
yste
m in
Tex
as m
ay h
ave
affe
cted
the
NFL
IS d
ata
for t
hat y
ear c
ompa
red
with
pre
viou
s ye
ars.
SO
UR
CE
: NFL
IS, D
EA
, dat
a fo
r all
area
s w
ere
retri
eved
on
Dec
embe
r 12,
201
3, w
ith th
e ex
cept
ion
of th
ose
for N
ew Y
ork
City
, whi
ch w
ere
retri
eved
on
Dec
embe
r 17,
201
3
10
CEWG Meeting Highlights and Summary
Proceedings of the Community Epidemiology Work Group, January 2014
System to Retrieve Information From Drug Evidence (STRIDE)
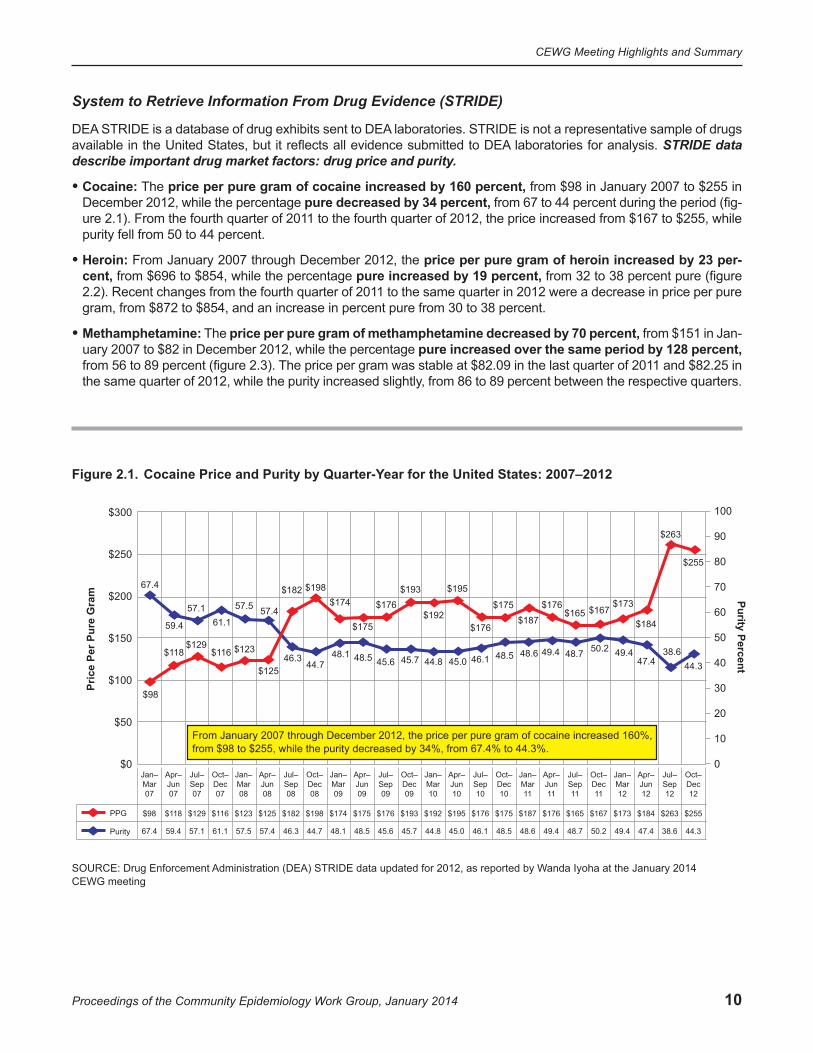
DEA STRIDE is a database of drug exhibits sent to DEA laboratories. STRIDE is not a representative sample of drugs available in the United States, but it reflects all evidence submitted to DEA laboratories for analysis. STRIDE data describe important drug market factors: drug price and purity.
• Cocaine: The price per pure gram of cocaine increased by 160 percent, from $98 in January 2007 to $255 in December 2012, while the percentage pure decreased by 34 percent, from 67 to 44 percent during the period (fig-ure 2.1). From the fourth quarter of 2011 to the fourth quarter of 2012, the price increased from $167 to $255, while purity fell from 50 to 44 percent.
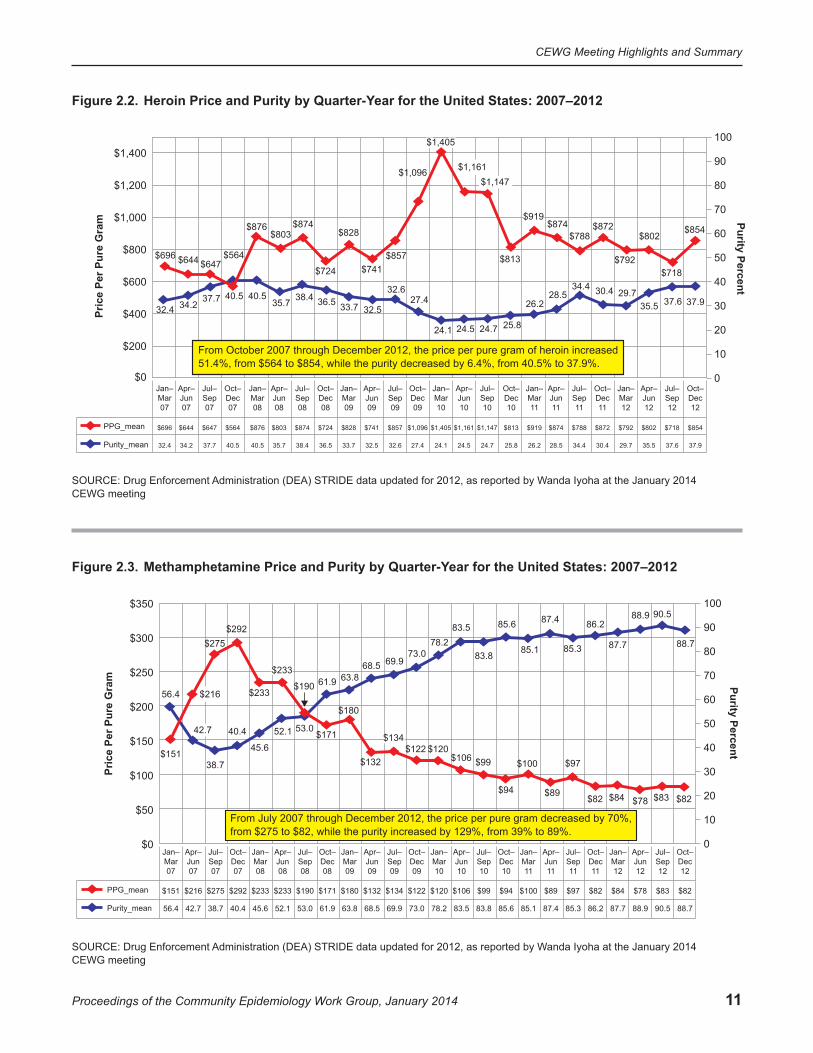
• Heroin: From January 2007 through December 2012, the price per pure gram of heroin increased by 23 per-cent, from $696 to $854, while the percentage pure increased by 19 percent, from 32 to 38 percent pure (figure 2.2). Recent changes from the fourth quarter of 2011 to the same quarter in 2012 were a decrease in price per pure gram, from $872 to $854, and an increase in percent pure from 30 to 38 percent.
• Methamphetamine: The price per pure gram of methamphetamine decreased by 70 percent, from $151 in Jan-uary 2007 to $82 in December 2012, while the percentage pure increased over the same period by 128 percent, from 56 to 89 percent (figure 2.3). The price per gram was stable at $82.09 in the last quarter of 2011 and $82.25 in the same quarter of 2012, while the purity increased slightly, from 86 to 89 percent between the respective quarters.
Figure 2.1. Cocaine Price and Purity by Quarter-Year for the United States: 2007–2012
$300
$250
$200
$150
$100
$50
$0
100
90
80
70
60
50
40
30
20
10
0
Pric
e Pe
r Pur
e G
ram Purity Percent
$98
$118$129
$116 $123
$125
$182 $198$174
$175
$176$193
$192
$195
$176
$175 $176
$187$165 $167
$173
$184
$263
$255
67.4
59.4
57.161.1
57.5 57.4
46.344.7
48.1 48.5 45.6 45.7 44.8 45.0 46.1 48.5 48.6 49.4 48.7 50.2 49.447.4
38.644.3
From January 2007 through December 2012, the price per pure gram of cocaine increased 160%,from $98 to $255, while the purity decreased by 34%, from 67.4% to 44.3%.
Jan–Mar07
$98
67.4
Apr–Jun07
$118
59.4
Jul–Sep07
$129
57.1
Oct–Dec07
$116
61.1
Jan–Mar08
$123
57.5
Apr–Jun08
$125
57.4
Jul–Sep08
$182
46.3
Oct–Dec08
$198
44.7
Jan–Mar09
$174
48.1
Apr–Jun09
$175
48.5
Jul–Sep09
$176
45.6
Oct–Dec09
$193
45.7
Jan–Mar10
$192
44.8
Apr–Jun10
$195
45.0
Jul–Sep10
$176
46.1
Oct–Dec10
$175
48.5
Jan–Mar11
$187
48.6
Apr–Jun11
$176
49.4
Jul–Sep11
$165
48.7
Oct–Dec11
$167
50.2
Jan–Mar12
$173
49.4
Apr–Jun12
$184
47.4
Jul–Sep12
$263
38.6
Oct–Dec12
$255
44.3
PPG
Purity
SOURCE: Drug Enforcement Administration (DEA) STRIDE data updated for 2012, as reported by Wanda Iyoha at the January 2014 CEWG meeting
11
CEWG Meeting Highlights and Summary
Proceedings of the Community Epidemiology Work Group, January 2014
Figure 2.2. Heroin Price and Purity by Quarter-Year for the United States: 2007–2012
$1,400
$1,200
$1,000
$800
$600
$200
$0
100
90
80
70
60
50
40
30
20
10
0
Pric
e Pe
r Pur
e G
ram Purity Percent
$400
$696 $644 $647$564
$876 $874$803 $828
$724 $741$857
$1,096
$874
$813
$872
$792
$788 $802$854
$718
32.4 34.237.7 40.5 40.5 36.535.7 38.4
33.7 32.5
32.6
24.1 24.7
27.4
24.5 25.8
26.228.5
34.4 30.4 29.737.935.5 37.6
From October 2007 through December 2012, the price per pure gram of heroin increased51.4%, from $564 to $854, while the purity decreased by 6.4%, from 40.5% to 37.9%.
$1,147
$919
$1,405
$1,161
Jan–Mar07
$696
32.4
Apr–Jun07
$644
34.2
Jul–Sep07
$647
37.7
Oct–Dec07
$564
40.5
Jan–Mar08
$876
40.5
Apr–Jun08
$803
35.7
Jul–Sep08
$874
38.4
Oct–Dec08
$724
36.5
Jan–Mar09
$828
33.7
Apr–Jun09
$741
32.5
Jul–Sep09
$857
32.6
Oct–Dec09
$1,096
27.4
Jan–Mar10
$1,405
24.1
Apr–Jun10
$1,161
24.5
Jul–Sep10
$1,147
24.7
Oct–Dec10
$813
25.8
Jan–Mar11
$919
26.2
Apr–Jun11
$874
28.5
Jul–Sep11
$788
34.4
Oct–Dec11
$872
30.4
Jan–Mar12
$792
29.7
Apr–Jun12
$802
35.5
Jul–Sep12
$718
37.6
Oct–Dec12
$854
37.9
PPG_mean
Purity_mean
SOURCE: Drug Enforcement Administration (DEA) STRIDE data updated for 2012, as reported by Wanda Iyoha at the January 2014 CEWG meeting
Figure 2.3. Methamphetamine Price and Purity by Quarter-Year for the United States: 2007–2012
$350
$300
$250
$200
$150
$50
$0
100
90
80
70
60
50
40
30
20
10
0
Pric
e Pe
r Pur
e G
ram Purity Percent
$100
$151
$233
$275
$190
$292
$180
$171
$94
$132$120
$97
$84
$106 $100$122
$89 $83
$99
$82 $78 $82
40.4
38.7
45.6
53.0
63.8
56.461.9
52.1
68.5
83.5
73.0 83.869.9
78.2
85.6
85.1
87.4
85.3
86.2
87.7
90.5
88.7
88.9
From July 2007 through December 2012, the price per pure gram decreased by 70%,from $275 to $82, while the purity increased by 129%, from 39% to 89%.
$233
$13442.7
$216
Jan–Mar07
$151
56.4
Apr–Jun07
$216
42.7
Jul–Sep07
$275
38.7
Oct–Dec07
$292
40.4
Jan–Mar08
$233
45.6
Apr–Jun08
$233
52.1
Jul–Sep08
$190
53.0
Oct–Dec08
$171
61.9
Jan–Mar09
$180
63.8
Apr–Jun09
$132
68.5
Jul–Sep09
$134
69.9
Oct–Dec09
$122
73.0
Jan–Mar10
$120
78.2
Apr–Jun10
$106
83.5
Jul–Sep10
$99
83.8
Oct–Dec10
$94
85.6
Jan–Mar11
$100
85.1
Apr–Jun11
$89
87.4
Jul–Sep11
$97
85.3
Oct–Dec11
$82
86.2
Jan–Mar12
$84
87.7
Apr–Jun12
$78
88.9
Jul–Sep12
$83
90.5
Oct–Dec12
$82
88.7
PPG_mean
Purity_mean
SOURCE: Drug Enforcement Administration (DEA) STRIDE data updated for 2012, as reported by Wanda Iyoha at the January 2014 CEWG meeting
12
CEWG Meeting Highlights and Summary
Proceedings of the Community Epidemiology Work Group, January 2014
SUMMARy FINDINGS: DRUG TRENDS By REGION The following section summarizes trends described by CEWG area representatives and highlights findings based on a review of the most recent drug indicator data available and presented at the January 2014 CEWG meeting. Availability of indicator data varies by area. Indicators reviewed for each area are noted in appendix table 1. Details supporting the statements contained in this summary can be found in the individual January update briefs found on the NIDA Web site at http://www.drugabuse.gov/about-nida/organization/workgroups-interest-groups-consortia/community-epidemiology-work-group-cewg/highlights-summaries-january-2014-reports.
Cocaine Overall CEwG Regions: Ten out of 20 CEwG area representatives reported declining indicators for cocaine in this reporting period. These included five of the eight CEWG area representatives in the western region (Albuquerque/New Mexico, Denver/Colorado, San Francisco, Seattle, and Texas); three of the five area repre-sentatives in the midwestern region (Chicago, Cincinnati, and Detroit); and two of the four area representa-tives in the southern CEwG region (Atlanta, and Miami-Dade and Broward Counties/South Florida). Mixed indicators for cocaine, with some increasing, some decreasing, and some stable, were reported for the first half of 2013 by eight area representatives, including two of western region area representatives, from Los Angeles and Phoenix; one representative from the Midwest, Minneapolis/St. Paul; all four area representa-tives in the Northeast (Boston, Maine, New york City, and Philadelphia); and one representative from the southern region, representing the Baltimore/Maryland/washington, DC, area (while cocaine indicators were mostly declining in Baltimore City and Maryland, they were mixed in this reporting period in washington, DC). Stable cocaine indicators were reported by representatives from San Diego in the western region and St. Louis in the Midwest.
Western CEWG Region: Five of the eight CEWG area representatives in the western region— Albuquerque/ New Mexico, Denver/Colorado, San Francisco, Seattle, and Texas—reported declining indicators for cocaine in this reporting period. Two area representatives, from Phoenix and San Diego, reported stability in cocaine indicators. One area representative from Los Angeles reported mixed cocaine indicators.
• Continuing declines in cocaine indicators were reported in the first half of 2013 in Albuquerque/New Mexico, Denver/Colorado, San Francisco, Seattle, and Texas.
| The proportion of primary cocaine treatment admissions continued to decline in this reporting period from previous reporting periods in Albuquerque/New Mexico, and proportions of drug reports identified as cocaine among seized and analyzed NFLIS items also declined in Albuquerque, from 16.8 percent of total drug reports in the first half of 2012 to 13.0 percent in the first half of 2013.
| Proportions of cocaine drug reports identified among items seized and analyzed in NFLIS laboratories declined in this reporting period in both Denver and Colorado. However, despite the decrease in cocaine drug reports in Denver, from 30.7 percent of total drug reports in the first half of 2012 to 25.1 percent of all reports in the first half of 2013, cocaine remained the top ranked drug in the Denver metropolitan area among all drugs identified by NFLIS laboratories.
| The continuing decline in cocaine indicators, including numbers of primary cocaine treatment admissions in the bay area and the proportion of drug reports identified as cocaine among items seized and identified in NFLIS laboratories in the San Francisco area, was a key finding for the area in this reporting period. Drug reports identified as cocaine among items seized by law enforcement and analyzed in NFLIS laboratories declined in San Francisco, from 18.4 percent of total drug reports in the first half of 2012 to 15.0 percent of the total in the first half of 2013.
| Cocaine drug reports among NFLIS data also declined in Seattle (from 17.1 percent of total drug reports among analyzed items in the first half of 2012 to 14.6 percent of total drug reports in the first half of 2013), as did cocaine overdose deaths. The Seattle area representative reported, however, that the number of drug-caused overdose deaths involving cocaine continued to be a concern in that area.
13
CEWG Meeting Highlights and Summary
Proceedings of the Community Epidemiology Work Group, January 2014
| The Texas area representative reported that all cocaine indicators (including primary cocaine treatment admissions, forensic laboratory findings, deaths, and poison control calls) declined in Texas in this reporting period, accompanied by fewer seizures at the border, more diversion of the drug to Europe, use of levamisole as a filler, and increased prices.
• Mixed cocaine indicators in the first half of 2013 were reported by the area representatives from Los Ange-les and Phoenix.
| In Los Angeles, some cocaine indicators were decreasing in this reporting period, and some showed increases. The proportion of cocaine drug reports among seized and analyzed NFLIS items decreased in the first half of 2013 from the first half of 2012. Proportions of primary cocaine treatment admissions also declined slightly in the first half of 2013 in Los Angeles, continuing a downward trend from 2009. Numbers of coroner toxicology cases with cocaine detected were projected to increase, however, based on annualizing the first 9 months of data, from 349 cases in 2012 to 375 in 2013.
| In Phoenix, some cocaine indicators decreased, and some were stable in this reporting period. The proportion of cocaine drug reports among items seized and analyzed in NFLIS laboratories decreased from the first half of 2012 (n=395) to the first half of 2013 (n=327) in Phoenix4, while the numbers of cocaine-related hospital admissions in Maricopa County were stable in the first half of 2013, compared with the first half of 2012.
• Mostly stable and continuing low cocaine indicators were reported by the area representative for San Diego. Proportions of primary treatment admissions for cocaine in San Diego remained at 4 percent of total admissions for the third half-year in a row, and reports among drug items analyzed in NFLIS laboratories identified as cocaine were stable at 12 percent in the first half of 2013 from the first half of 2012.
Midwestern Region: Of the five CEWG areas in the midwestern region, three area representatives—from Chicago, Cincinnati, and Detroit—reported declining cocaine indicators for the first half of 2013. One area representative, from Minneapolis/St. Paul, reported mixed indicators, and one representative, from St. Louis, reported stable indicators for cocaine in this reporting period.
• Continuing declines in cocaine indicators were reported by the area representatives from Chicago, Cincin-nati, and Detroit.
| While cocaine continued to be a major drug of abuse in the Chicago area, cocaine availability in the city was down in this reporting period, according to the area representative, and the proportion of drug reports identified as cocaine among drug items analyzed by NFLIS laboratories decreased from 16.6 percent of total drug reports in the first half of 2012 to 15.9 percent in the first half of 2013.
| In Cincinnati, proportions of primary cocaine treatment admissions declined from 8.0 percent of total admissions in 2012 to 6.5 percent of the total in the first half of 2013, and drug reports identified as cocaine among items seized and analyzed in the Cincinnati area declined from 21.4 percent of total drug reports in the first half of 2012 to 15.3 percent of the total in the first half of 2013.
| In Detroit, the area representative reported continuing declines in the proportion of primary cocaine treatment admissions and in the proportion of drug reports for cocaine among items seized by law enforcement and analyzed by NFLIS laboratories in Wayne County. Proportions of drug reports identified as cocaine among items analyzed by NFLIS laboratories in Detroit (Wayne County) remained high compared with other drugs, but they declined from 20.2 to 18.4 percent of total drug reports from the first half of 2012 to the first half of 2013.
• The area representative for the Minneapolis/St. Paul area reported mixed indicators for cocaine in this reporting period, with some indicators decreasing and some increasing. The proportion of primary cocaine treatment admissions fell in the first half of 2013 in the Minneapolis/St. Paul area, accounting for 4.1 percent of total admissions, compared with 5.2 percent of the total in both 2011 and 2012. The proportion of cocaine drug reports from law enforcement drug item seizures that were analyzed by NFLIS laboratories increased, however, to 20.6 percent of total drug reports in the first half of 2013, compared with 17.2 percent in the first half of 2012.
4The difference in the proportion of cocaine reports from 6.9 percent in the first half of 2012 to 7.3 percent in the first half of 2013 was attributed by the area representative to the diminishing share of total drug reports identified as cannabis/marijuana in the first half of 2013.
14
CEWG Meeting Highlights and Summary
Proceedings of the Community Epidemiology Work Group, January 2014
• Stable indicators for cocaine were reported by the area representative for St. Louis in the first half of 2013. Indicators for cocaine were stabilizing at a lower level than in previous reporting periods in the St. Louis area in the first half of 2013, according to the area representative. Numbers of primary cocaine treatment admissions in St. Louis were stable from 482 in the first half of 2012 to 481 in the first half of 2013, and the proportion of drug reports for cocaine among items analyzed by NFLIS laboratories were stable at approximately 10 percent of total drug reports in the first half of 2012 and the first half of 2013.
Northeastern Region: All four CEWG area representatives in the northeastern CEWG region—from Boston, Maine, New York City, and Philadelphia—reported mixed indicators for cocaine in this reporting period, with some indicators decreasing, some increasing, and some stable. Cocaine indicator levels remained high rela-tive to other drugs in Boston, New York City, and Philadelphia, as reported by the area representatives. The Maine area representative reported that cocaine levels in that State were low relative to other drugs in this reporting period.
• The Boston area representative reported that most indicators there were declining over time, but indicators were mixed in this reporting period. For example, the proportion of primary cocaine treatment admissions in the Boston area has steadily decreased, from 9 percent of total admissions in fiscal year (FY) 2008, but it was stable at 5 percent of the total in FYs 2012 and 2013. The proportion of drug reports identified as cocaine in Boston among items seized and analyzed by NFLIS laboratories increased slightly from 18.8 percent in the first half of 2012 to 19.5 percent of the total in the first half of 2012.
• In Maine, indicators for cocaine were mixed in this reporting period, with some indicators increasing, some decreasing, and some stable. Both the number of cocaine arrests and the proportions of primary treatment admissions increased in this reporting period, while the proportion of deaths with cocaine mentioned on the death certificate remained relatively stable (at 8 percent of all drug related deaths), and the proportion of drug reports among items seized by law enforcement and analyzed in NFLIS laboratories declined slightly (to 21.6 percent of total reports in the first half of 2013 from 23.1 percent of the total in the first half of 2012).
• Indicators for cocaine were also reported as mixed by the area representative from New york City, where some indicators remained stable and some decreased. Primary cocaine treatment admissions, as a proportion of the total, were relatively stable at 13 percent in the first half of 2013, compared with 14 percent in the first half of 2012, but they still represented the lowest first half-year number in more than two decades. Cocaine continued to rank second among drug reports identified among items seized and analyzed by NFLIS laboratories, and the proportion of reports declined from 34.5 percent in the first half of 2012 to 32.2 percent of the total in the first half of 2013. The continuing predominance of cocaine (along with heroin and marijuana/cannabis) was one of the key findings in the New York City area for this reporting period.
• In Philadelphia, proportions of cocaine drug reports among drug items analyzed by NFLIS laboratories increased (from 27.9 percent of all drug reports in the first half of 2012 to 30.0 percent in the first half of 2013), and percentages of primary cocaine treatment admissions increased slightly (from 11.1 percent of total admissions in the first half of 2012 to 12.4 percent on the total in the first half of 2013). The proportion of deaths in which cocaine was detected among Medical Examiner Office cases with a presence of drugs was stable in the first half of 2013 from 2012 at 39.7 percent.
Southern Region: Two area representatives in the southern CEWG region—from Atlanta and Miami-Dade and Broward Counties/South Florida—reported declining indicators for cocaine for this reporting period. While cocaine indicators were mostly declining in Baltimore City and Maryland, they were mixed in this reporting period in Washington, DC.
• Cocaine indicators were declining in this reporting period in Atlanta and the Miami-Dade and Broward Coun-ties/South Florida area.
| Cocaine levels in Atlanta were moderate and were continuing to decline in this reporting period, according to the area representative. Primary cocaine treatment admissions, as a proportion of the total, declined from 10.5 percent in 2012 to 9.2 percent in the first half of 2013; this was the first time that cocaine constituted less than 10 percent of Atlanta’s primary substance abuse treatment admissions. Both the State Medical Examiner’s Office and the Georgia Poison Control Center reported decreases from FY 2010 to FY 2013 in the number of deaths and poisonings. Proportions of cocaine drug reports among items seized and analyzed by NFLIS laboratories

15
CEWG Meeting Highlights and Summary
Proceedings of the Community Epidemiology Work Group, January 2014
in the first half of 2013 declined from 25.5 percent of total drug reports (and ranking first among all drug reports) in the first half of 2012 to 22.3 percent in the first half of 2013 (when cocaine fell to second place among all drug reports).
| Both primary cocaine treatment admissions and cocaine drug reports among drug items analyzed in NFLIS laboratories in South Florida’s Miami-Dade, Broward, and Palm Beach Counties (the three counties in the Miami Metropolitan Statistical Area [MSA]) decreased in the first half of 2013 from previous reporting periods. Primary cocaine treatment admissions for in Miami-Dade County declined from 23 percent in the first half of 2012 to 14 percent in the first half of 2013. Cocaine drug reports accounted for 44.0 percent of all primary, secondary, and tertiary drug reports among drug items analyzed in NFLIS laboratories in the Miami MSA during the first half of 2013; this represented a decrease from 48.9 percent in the first half of 2012.
• Cocaine indicators were mixed across the Baltimore/Maryland/Washington, DC, area in the first half of 2013. Cocaine continued to be one of the primary illicit drug problems across the Baltimore/ Maryland/Washington, DC, area, according to the area representative, and indicators were mixed, with some increasing and some decreasing in this reporting period. While a higher percentage of adult arrestees tested urinalysis positive for cocaine than for any other drug in washington, DC, the percentage continued to decline, from 16 percent in 2012 to 14 percent in 2013; this was the lowest proportion since testing began. However, drug reports identified as cocaine increased as a proportion of total reports from items seized and analyzed in NFLIS laboratories in Washington, DC, from the first half of 2012 to the first half of 2013 (from 15.3 to 17.2 percent). In the State of Maryland, the proportion of cocaine drug reports among items seized and analyzed by NFLIS laboratories decreased, from 18.5 percent in the first half of 2012 to 16.6 percent in the first half of 2013, and the proportion similarly declined in Baltimore City, from 27.4 percent of total reports in the first half of 2012 to 25.7 percent of the total in the first half of 2012.
Heroin Overall CEwG Areas: Twelve of 20 CEwG area representatives reported increasing indicators for heroin in this reporting period. These included four of the eight representatives in the west (Denver/Colorado, San Diego, Seattle, and Texas); four of the five area representatives in the midwestern CEWG region (Chicago, Cincinnati, Minneapolis/St. Paul, and St. Louis); two of the four area representatives from the Northeast (Bos-ton and Maine); and two of the three CEwG regions in the South (Atlanta and the Miami-Dade and Broward Counties/South Florida area). Mixed indicators for heroin (with some indicators increasing, some decreasing, and some stable) were reported for the first half of 2013 by 4 of the 20 area representatives, including 2 area representatives representing the western region, Los Angeles and San Francisco; Philadelphia in the North-east; and the Baltimore/Maryland/washington, DC, area (with indicators increasing in Baltimore City and Maryland but unclear in washington, DC). Stability in heroin indicators was reported by the Detroit and New york City area representatives. Heroin indicators were unclear in the Albuquerque/New Mexico and Phoenix areas due to limited heroin-specific data for this reporting period. Six of the area representatives, from all four regions of the country—Denver/Colorado, Seattle, and Texas in the west; St. Louis in the Midwest; Maine in the Northeast; and Atlanta in the South—reported a continuing increase in young heroin users in their areas during this reporting period.
Western CEWG Region: Among the eight CEWG areas in the western region, four area representatives—from Denver/Colorado, San Diego, Seattle, and Texas—reported increasing indicators for heroin in this reporting period, and two area representatives—from Los Angeles and San Francisco—reported mixed heroin indica-tors. Indicators for heroin were unclear in Albuquerque/New Mexico and Phoenix in this reporting period due to limited heroin-specific data.
• Increases in heroin indicators in the first half of 2013 were reported by the Denver/Colorado, San Diego, Seattle, and Texas area representatives.
| Heroin reports increased as a proportion of total drug reports among items seized and analyzed in NFLIS laboratories in Denver and Colorado in the first half of 2013. In Denver, the proportion of heroin reports increased to 15.4 percent of total drug reports among seized and analyzed drug items in the first half of 2013 from 11.6 percent of the total in the first half of 2012. The proportion of heroin reports among total drug reports from items analyzed by NFLIS in the State of Colorado also increased, from 8.8 percent of total drug reports in the first half

16
CEWG Meeting Highlights and Summary
Proceedings of the Community Epidemiology Work Group, January 2014
of 2012 to 12.4 percent of the total in the first half of 2013. The proportion of primary heroin treatment admissions increased in the first half of 2013 from the first half of 2012 both statewide in Colorado (from 7.6 to 9.1 percent of the total) and in the Denver metropolitan area (from 10.9 to 12.7 percent).
| In San Diego, the proportion of drug reports identified as heroin among items seized by law enforcement and analyzed in NFLIS laboratories increased from 8.8 percent in the first half of 2012 to 11.7 percent of the total in the first half of 2013. In addition, the proportion of primary heroin treatment admissions increased from 22 percent in the first halves of both 2011 and 2012 to 24 percent in the first half of 2013. Also, in contrast to CY 2011, when there were decreases in the prevalence of arrestee heroin/opioid use, as measured by positive urinalysis test results in a random sample of adult male, adult female, and juvenile arrestees, heroin prevalence increased slightly in all of these groups in CY 2012.
| Proportions of drug reports identified as heroin among items seized by law enforcement and analyzed in NFLIS laboratories remained high relative to other drugs in Seattle, at 23 percent of the total (ranking first among all drug reports in the first half of 2013 in that area). This represented an increase from 17.9 percent of total drug reports in the first half of 2012. The proportion of primary heroin treatment admissions also increased in the Seattle area, from 15.3 percent of total admissions in 2011, to 20.5 percent of admissions in 2012, and to 21.1 percent in the first half of 2013.
| The demand for heroin in Texas increased in the current reporting period, with supplies up and costs down, based on DEA field division reports and reported by the area representative. The proportion of seized drugs identified as heroin among drug items analyzed by laboratories reporting to NFLIS remained low relative to other drugs at 4.2 percent in the first half of 2013, but this was an increase from 3.4 percent of the total in the first half of 2012.
• Mixed indicators for heroin in the first half of 2013 were reported by area representatives from Los Angeles and San Francisco.
| In Los Angeles, most heroin indicators increased in this reporting period, but primary heroin treatment admissions declined slightly in the first half of 2013. The proportion of drug reports identified as heroin among items seized and analyzed in NFLIS laboratories in Los Angeles increased from 5.1 percent of total drug reports in the first half of 2012 to 6.3 percent of the total in the first half of 2013. However, proportions of primary heroin treatment admissions declined in Los Angeles in this reporting period compared with 2012 data. In January–June 2013, 19.8 percent of primary treatment admissions in Los Angeles County were for heroin, compared with 20.3 percent in 2012.
| In San Francisco, the proportion of primary heroin treatment admissions among total admissions was relatively stable in this reporting period, but heroin showed a slight increase in the proportion of drug reports among drug items seized and analyzed by NFLIS laboratories in the bay area from 5.2 percent of total drug reports in the first half of 2012 to 6.4 percent of the total in the first half of 2013.
• Indicators for heroin were unclear in the first half of 2013 in Albuquerque/New Mexico and Phoenix due to limited heroin-specific data.
| While the “the continuing high level of heroin reports among drug items seized and analyzed by NFLIS laboratories” was one of the key findings in the Albuquerque/New Mexico area for this reporting period, according to the area representative, heroin trends in the Albuquerque/New Mexico area were unclear in this reporting period due to scanty data mainly from NFLIS. Heroin reports accounted for 21.2 percent of total drug reports in the first half of 2013. This was a slight decrease from 22.1 percent of the total in the first half of 2012.
| Hospital admissions data in the Phoenix CEWG reporting combined heroin-related and prescription opioid-related admissions. In this reporting period, these combined admissions increased in one county and declined in another. While numbers of heroin/opioid-related hospital admissions in Maricopa County (Phoenix) rose slightly in the first half of 2013, compared with the first half of 2012, they declined in the first half of 2013 in Pima County (Tucson) in the same time period. The proportion of drug reports identified as heroin among items seized by law enforcement and analyzed in NFLIS laboratories increased in Phoenix in the first half of 2013 to 16.3 percent of total drug reports from 12.2 percent of total drug reports in the first half of 2012.
17
CEWG Meeting Highlights and Summary
Proceedings of the Community Epidemiology Work Group, January 2014
Midwestern Region: Four of the five area representatives in the midwestern CEWG region—from Chicago, Cincinnati, Minneapolis/St. Paul, and St. Louis—reported increasing heroin indicators, and one (Detroit) reported stable indicators for this reporting period. None of the representatives from the Midwest reported declining indicators for heroin.
• Increasing heroin indicators were reported by area representatives in Chicago, Cincinnati, Minneapolis/St. Paul, and St. Louis in the first half of 2013, and the representatives from Chicago, Cincinnati, and St. Louis reported continuing high levels for heroin relative to other drugs in this reporting period.
| The area representative from Chicago reported increases in heroin-related deaths in the suburban Chicago counties of DuPage, Lake, Will, McHenry, and Kane from 2011 to 2012. The proportion of heroin reports among all drug reports from items seized and analyzed by NFLIS laboratories in Chicago also increased in this reporting period, from 16.8 percent of the total in the first half of 2012 to 19.4 percent in the first half of 2013.
| Several heroin indicators were increasing in the Cincinnati area. Primary heroin treatment admissions were combined with admissions for prescription opioids, with the combination accounting for 32.9 percent of total admissions in the first half of 2013, compared with 25.8 percent in 2012. Heroin drug reports as a proportion of total drug reports among items seized and analyzed in NFLIS laboratories also increased in Cincinnati from the first half of 2012 to the first half of 2013, from 27.4 to 28.9 percent of the total.
| The representative from the Minneapolis/St. Paul area noted that heroin and other opiate addiction indicators “were issues of growing magnitude and consequence” in the Twin Cities in 2013. Primary heroin treatment admissions accounted for a record-high 13.6 percent of all admissions in the first half of 2013 in Minneapolis/ St. Paul, compared with 12.9 percent of total admissions in 2012 and 10.7 percent in 2011. Heroin was noted in 10.6 percent of drug reports from law enforcement seizures analyzed by NFLIS laboratories in the first half of 2013, compared with 9.2 percent of the total in the first half of 2012. In addition, from 2012 to 2013, numbers of heroin exposures reported to the Hennepin Regional Poison Center increased from 127 to 147.
| The heroin market in the St. Louis region has grown and become more complex over the past few reporting periods, and heroin indicators were increasing, according to the area representative. In the first half of 2013, heroin represented the highest proportion of primary treatment admissions after alcohol, with 34.6 percent of total admissions; this was a slight increase from 34.2 percent of total admissions in 2012 and 31.4 percent of the total in 2011. Heroin represented 16.1 percent of drug reports identified among items analyzed in NFLIS laboratories in the first half of 2013; this was an increase from 13.1 percent of total drug reports in the first half of 2012.
• Heroin indicators were high relative to other drugs and stable in Detroit. The “continuing problems with heroin” in Detroit, wayne County, and Michigan was one of the most important drug findings in the first half of 2013 in that area. The proportion of primary heroin treatment admissions continued to be high in Detroit, at 33.3 percent of all admissions in FY 2013; this was relatively stable from 34.5 percent of the total in FY 2012. Heroin continued to rank third (constituting 13.2 percent of the total), after marijuana/cannabis and cocaine, among drug reports from items seized and analyzed by NFLIS laboratories for Wayne County and the State of Michigan in the first half of 2013.
Northeastern Region: Two of the four area representatives from the Northeast—Boston and Maine—reported increasing indicators for this reporting period for heroin. In Philadelphia, heroin indicators were mixed; indi-cators were stable in New York City. Indicator levels were high relative to other drugs in Boston, Philadelphia, and New York City, and while levels were reported as moderate compared with other drugs in Maine, the area representative reported that heroin had re-emerged in drug indicators as a serious problem in the State.
• Heroin indicators increased in this reporting period in Boston and Maine.
| Heroin indicators were mostly increasing in this reporting period the Boston area, according to the area representative, and the continuing increases in heroin indicators was one of the key findings for the area. The proportion of primary heroin treatment admissions in Boston continued to be high relative to other drugs and increased from 52 to 56 percent between FY 2012 and FY 2013. The unintentional heroin overdose hospital patient rate per 100,000 population increased by 76 percent from FY 2010 (37.6 per 100,000) to FY 2012 (66.1 per 100,000) in Boston.

18
CEWG Meeting Highlights and Summary
Proceedings of the Community Epidemiology Work Group, January 2014
| In Maine, the proportion of heroin/morphine drug-induced deaths declined to 4 percent of all drug-induced deaths in the State in 2010, but by 2012, they had increased to 17 percent. Heroin reports as a percentage of drug items seized by law enforcement and analyzed by NFLIS laboratories increased substantially, from 5.9 percent of total reports (ranking fourth among drug reports) in the first half of 2012 to 22.0 percent (ranking first among all drug reports) in the first half of 2013. The proportion of primary heroin/morphine treatment admissions also increased, from approximately 11 percent of all admissions in 2012 to approximately 15 percent in the first half of 2013.
• Heroin remained a major problem in New York City, and heroin indicators were relatively stable, according to the area representative, based on available indicators. One of the key findings for this reporting period for New York City was the continuing predominance of heroin among the indicators (along with cocaine and marijuana/ cannabis). Primary heroin treatment admissions continued to represent more than one-quarter of all primary treatment admissions. In the first half of 2013, 11.6 percent of drug reports among items analyzed in New York City NFLIS laboratories were identified as heroin; this represented a slight increase from 10.4 percent of the total in the first half of 2012.
• The key finding in the first half of 2013 in Philadelphia was the continuing predominance of heroin among indicators. Heroin indicators were mixed, however, during this reporting period. The proportion of primary heroin treatment admissions increased to 22 percent of total admissions in the first half of 2013 (from 20 percent of the total in the first half of 2012). The proportion of deaths among Philadelphia Medical Examiner Office cases with morphine/heroin detected was 37.0 percent in the first half of 2013, stable from 2012.
Southern Region: Representatives from two of the three CEWG areas in the South, Atlanta and the Miami-Dade and Broward Counties/South Florida area, reported increasing heroin indicators in the first half of 2013. Heroin indicators were mixed in this reporting period in the Baltimore/Maryland/Washington, DC, area, according to that area representative (with indicators increasing in Baltimore City and Maryland but unclear in Washington, DC).
• Increases in heroin indicators were reported in this reporting period in two southern CEWG areas—Atlanta and the Miami-Dade and Broward Counties/South Florida area. These increases were reported as key findings for this reporting period by the representatives in these two areas.
| Although lower relative to other drugs than in other metropolitan areas, all heroin indicators showed increases in Atlanta in this reporting period. Heroin represented 5.8 percent of primary treatment admissions in Atlanta in the first half of 2013, compared with 4.3 percent in 2012. The numbers and proportions of drug reports identified as heroin among drug items seized and analyzed in Atlanta also increased, from 3.0 percent of the total (n=237) in the first half of 2012 to 4.5 percent of the total (n=356) in the first half of 2013.
| Heroin indicators, which historically have been at relatively low levels compared with other drugs of abuse in the Miami-Dade and Broward Counties/South Florida area, rose sharply in this reporting period, particularly in Miami-Dade County, and the area representative described the increases as a “heroin epidemic in the outbreak stage.” Proportions of primary heroin treatment admissions increased from approximately 4 percent of all substance abuse admissions in 2012 to approximately 8 percent in the first half of 2013 in Miami-Dade County. The number and proportion of heroin reports among drug items seized and analyzed by NFLIS laboratories in the Miami MSA in the first half of 2013 totaled 389, representing 3.3 percent of total drug reports. This was an increase from 2.7 percent (n=343 reports) in the first half of 2012.
• While an increase in primary heroin enrollments in the State of Maryland was cited as a key finding by the Baltimore/Maryland/Washington, DC, area, heroin indicators in that area were unclear in Washington, DC, in this reporting period (with data reported limited to NFLIS). In Maryland, the number of primary heroin treatment enrollments increased by 19 percent from the first half of 2012 to the first half of 2013 (from n=6,672 enrollments to n=7,943). In Baltimore City, the number of primary heroin treatment enrollments increased by 2 percent, from 3,708 enrollments to 3,796, during the same time period. While the proportion of heroin drug reports among items seized and analyzed in NFLIS laboratories increased very slightly in both Baltimore City and the State of Maryland from the first half of 2012 to the first half of 2013, they declined slightly in washington, DC, however, from 6.6 percent of total drug items in the first half of 2012 to 5.1 percent in the first half of 2013.
19
CEWG Meeting Highlights and Summary
Proceedings of the Community Epidemiology Work Group, January 2014
Younger Heroin Users:
Six out of 20 area representatives, from all 4 regions of the country—from Denver/Colorado, Seattle, and Texas in the West; St. Louis in the Midwest; Maine in the Northeast; and Atlanta in the South—reported a continuing increase in young heroin users in their areas during this reporting period, based on the increas-ing proportions of primary treatment admissions and hospital admissions among younger age groups and ethnographic and key informant information.
• Individuals seeking treatment for heroin as the primary substance problem in the first half of 2013 in Atlanta were younger and more likely to be White than in previous years. Proportions of primary heroin treatment admissions age 18–28 increased from 57.7 percent of total admissions in 2011, and 58.4 percent in 2012, to 63.6 percent of all admissions in the first half of 2013.
• In Denver, there was a continuing concern about an increase in new heroin users, including young adults who have switched from abusing prescription opioids to heroin due to availability and cost, according to the area representative.
• Primary heroin treatment clients in Maine whose heroin problem began within 24 months prior to admission were also more likely (45 percent) to be younger (between the ages of 18 and 25) than clients whose problem began more than 24 months prior to admission (28 percent).
• The Seattle area representative emphasized that young adults age 18–29 were the fastest growing, and represented the largest, age group, in both primary heroin treatment admissions and drug-caused deaths involving heroin in the current reporting period. Thirty percent of primary heroin treatment admissions in the first half of 2013 in the Seattle area were in the 18–29 age group; this represented an increase from 21 percent of primary heroin admissions in 2011 and from 27 percent of such admissions in 2012. Drug-caused deaths involving heroin increased in the Seattle area from 32 deaths in the first half of 2011, to 43 such deaths in the first half of 2012, and to 50 deaths in the first half of 2013. An analysis of mortality data from July 2005 through June 2013 showed a statistically significant (p<0.01) association between heroin-only drug-caused deaths and age—with the proportion of drug-caused deaths involving only heroin increasing as age among decedents decreased. For instance, among decedents age 16–20, the proportion of heroin-only drug-caused deaths was 55 percent, compared with 11 percent for decedents age 51–55.
• The CEWG representative from St. Louis continued to report that community forums and media events have been held around the region to address the young heroin user problem in the area.
• The age of persons dying from a heroin overdose in Texas has been decreasing from recent reporting periods, according to the area representative, with the average age declining from 41 years in 2005 to 36 years in 2012. There were more reports of suburban youth using heroin, according to key informants, and the number of young clients entering treatment with a primary problem of heroin has increased in the State. The proportion of primary heroin treatment admissions who were younger than 30 increased from 41 to 54 percent from 2005 to 2012, while the proportion of older clients entering treatment with heroin as the primary problem decreased correspondingly.
Prescription Opioids5
Overall CEwG Areas: Indicators for prescription opioids were reported by area representatives as increasing in the first half of 2013 in 3 of the 20 CEWG areas, including 1 of the 8 western CEWG areas, Denver/Colorado; 1 of the 5 CEwG areas in the Midwest, St. Louis; and 1 of the 4 northeastern region areas, New york City. Indicators for these drugs were mixed in 11 of the 20 CEwG areas, as reported by the area representatives, with some increasing, some decreasing, and some remaining stable. These areas included three areas in the western region (Albuquerque/New Mexico, San Diego, and Seattle); two areas in the Midwest, Chicago and Minneapolis/St. Paul; three CEwG areas in the Northeast (Boston, Maine, and Philadelphia); and two of the three southern region CEwG areas (Atlanta and the Miami-Dade and Broward Counties/South Florida area). Stable indicators were reported for Cincinnati and San Francisco for the first half of 2013. Mostly decreasing
5Since heroin is an opiate (derived from the opium plant), the drug is excluded from this category, and reported elsewhere. This category primarily includes prescription opioids (narcotic analgesics), which are synthetically produced prescription opioid pain medications, and some nonheroin opiates, such as morphine. Despite the inclusion of some nonheroin opiates, the category is referred to throughout as “prescription opioids.”

20
CEWG Meeting Highlights and Summary
Proceedings of the Community Epidemiology Work Group, January 2014
indicators for prescription opioids were reported by the Los Angeles area representative for this reporting period. Indicator trends for prescription opioids were unclear for this reporting period in Phoenix and Texas in the western region, Detroit in the Midwest, and in the Baltimore/Maryland/washington, DC, area in the South.
Western Region: Indicators for prescription opioids were increasing in the first half of 2013 in one of the eight western CEWG areas, Denver/Colorado. They were mixed in this reporting period in three areas in the western region—Albuquerque/New Mexico, San Diego, and Seattle—and they were stable in this reporting period in one western CEWG area, San Francisco, according to the area representatives. In Los Angeles, indicators for prescription opioids were mostly decreasing in this reporting period. Indicators for these drugs were unclear in this reporting period in Phoenix and Texas due to a lack of drug-specific data.
• Indicators for prescription opioids were increasing in the current reporting period in the Denver/Colorado area. Increases in several indicators for prescription opioids were cited by the area representative from Denver/ Colorado as a key finding for this reporting period. Statewide, the percentage of primary admissions for prescription opioids rose from 2.6 to 7.3 percent of total treatment admissions from 2004 through the first half of 2013. Similarly, in the Denver area, the percentage of primary admissions for prescription opioids increased from 3.3 to 6.4 percent of total admissions from 2004 through the first half of 2013. Prescription opioids were the most common type of drug in Denver alcohol and drug mortality reportable to the Denver Office of the Medical Examiner in 2012 (representing 48.3 percent of reportable deaths).
• Area representatives from Albuquerque/New Mexico, San Diego, and Seattle reported mixed indicators for prescription opioids in the first half of 2013.
| Indicators were mixed in this reporting period In Albuquerque/New Mexico for prescription opioids. The proportion of drug reports identified as oxycodone among items seized and analyzed in NFLIS laboratories decreased from 2.9 percent of total drug items in the first half of 2012 to 1.6 percent of the total in the first half of 2013. In 2012, “other opiates” represented 4.3 percent of all primary treatment admissions in 2012; this represented a decline from 5.1 percent of all treatment admissions in 2010. The area representative noted, however, that prescription opioids continued to be the leading cause of overdose deaths in Bernalillo County. (summary slide)
| Indicators for prescription opioids were also reported as mixed by the area representative from San Diego. The proportion of primary treatment admissions for prescription opioids (narcotic analgesics) remained low and relatively stable in the first half of 2013. Among adult arrestees in the San Diego Association of Governments’ Substance Abuse Monitoring program, the proportion reporting any illegal use of prescription drugs (including prescription opioids) decreased, from 42 percent in 2011 to 39 percent in 2012. Among juvenile arrestees, the proportion reporting any illegal use of prescription drugs increased from 37 percent in 2011 to 44 percent in 2012.
| In Seattle, the area representative stated that indicators for prescription opioids “leveled off, although these drugs continued to be the most common drug type identified in drug-caused deaths” in this reporting period. Proportions of primary treatment admissions for prescription-type opioids stabilized in the first half of 2013. Admissions for these drugs were most common among clients age 18–44 in the first half of 2013. Oxycodone continued to be the most common type of pharmaceutical opioid identified in drug reports among drug items analyzed by NFLIS laboratories. Oxycodone was identified in 5.7 percent of total drug reports (n=48) in the first half of 2013, compared with 3.5 percent of the total (n=45) in the first half of 2012.
• Indicators for prescription opioids were mostly stable in San Francisco in this reporting period, accord-ing to the area representative. Numbers of primary treatment admissions for oxycodone were stable between FY 2011–2012 (n=463) and FY 2012–2013 (n=466) in the five bay area counties. A higher percentage of young adults (age 18–25) reported prescription drugs as their primary drug problem at treatment admission than other age groups. Proportions of drug reports for prescription opioids were stable overall in NFLIS data in San Francisco, with variations among the individual drugs.
• Indicators for prescription opioids were mostly decreasing in Los Angeles in this reporting period, accord-ing to the area representative. Proportions of primary treatment admissions for prescription opioids were stable in this reporting period from 2012 levels. However, numbers of reports for prescription opioids among drug items analyzed by NFLIS laboratories, coroner toxicology cases, and poison control center calls all declined in the first half of 2013 in Los Angeles.

21
CEWG Meeting Highlights and Summary
Proceedings of the Community Epidemiology Work Group, January 2014
• Indicators for prescription opioids were unclear in the Phoenix and Texas areas in this reporting period.
| In Phoenix, numbers of drug reports identified as oxycodone declined from 267 in the first half of 2012 to 217 in the first half of 2013. Similarly, drug reports identified as hydrocodone declined in number, from 114 reports in the first half of 2012 to 87 in the first half of 2013. Hospital admissions data in Phoenix combine other opiates and prescription opioids with heroin; therefore, the hospital admissions trend for prescription opioids is not clear.
| According to the Texas area representative, insufficient data were available to report trends for the half-year reporting period. However, drinking codeine cough syrup continued to be driven by the rap music promoting “sippin’ syrup” and recent cases of singers getting in trouble because of their use of “Syrup.” Hydrocodone continued to be the most prevalent prescription opioid used for nonmedical purposes in Texas in this reporting period; it is one of the ingredients in the “Houston Cocktail” or “Holy Trinity,” along with alprazolam and carisoprodol.
Midwestern Region: One of the five CEWG area representatives in the Midwest, St. Louis, reported increasing indicators in this reporting period for prescription opioids. Available indicators for prescription opioids were mixed in two areas, Chicago and Minneapolis/St. Paul, during this reporting period. Indicators were stable according to the area representative in Cincinnati and they were unclear in Detroit.
• Increasing indicators for the first half of 2013 for prescription opioids were reported by the area representa-tive from St. Louis. The increase in indicators for prescription opioids relative to other drugs was reported by the area representative from St. Louis as one of the key findings for this reporting period. While the actual number of primary treatment admissions for prescription opioids was relatively low (n=254 in the first half of 2013, compared with n=212 in the first half of 2012), these drugs present reasons for multiple concerns, according to the area representative. Nearly one-quarter (24.4 percent) of these treatment admissions were younger than 24. Additionally, in the death data, 28.4 percent of primary drugs and 8.6 percent of secondary drugs present in the decedents in the first half of 2013 were for prescription opioids. (no comparison data)
• Indicators for prescription opioids were mixed in this reporting period in Chicago and Minneapolis/St. Paul.
| In Chicago, the area representative reported moderate levels and mostly increasing indicators for prescription opioids, but with a slight decline in NFLIS data. Hydrocodone continued to be the most available prescription opioid to users for nonmedical use. Hydrocodone continued to rank fourth among total drug reports from items seized by law enforcement and analyzed in NFLIS laboratories in the Chicago area. In the first half of 2013, 0.8 percent of total drug reports (n=300) were identified as hydrocodone; this represented a slight decline compared with 1.0 percent of the total (n=360) in the first half of 2012.
| Some of the indicators for “other opiates” were combined in the Minneapolis/St. Paul area with heroin (see the discussion on heroin section for these indicator trends). Available indicators for prescription opioids showed mixed trends. Admissions related to prescription opioids (mostly prescription painkillers) accounted for 10.1 percent of all admissions in the first half of 2013; this represented an increase compared with 9.0 percent of the total in 2012. The proportion of drug reports identified as oxycodone in Minneapolis/St. Paul from law enforcement seizures analyzed by NFLIS laboratories in the first half of 2013 decreased from 2.0 percent of total drug reports in the first half of 2012 to 1.5 percent in the first half of 2013.
• Indicators for prescription opioids were relatively stable in Cincinnati in the first half of 2013, according to the area representative.
| Oxycodone and hydrocodone remained the most prevalent opioid products abused in Cincinnati, based on numbers of human exposure cases called in to poison control centers and on numbers and proportions of drug reports among items analyzed by NFLIS laboratories in the first half of 2013. Both oxycodone and hydrocodone drug reports ranked among the top 10 drugs identified in drug reports from items seized by law enforcement that were analyzed by NFLIS laboratories in the Cincinnati area in the first half of 2012 and in the first half of 2013. Oxycodone reports ranked fourth among drug reports in the first half of 2012 and in the first half of 2013, and hydrocodone ranked sixth among the top 10 drugs in the first half of 2013.
• Indicators for prescription opioids were unclear in this reporting period in Detroit.
| The trend in indicators for prescription opioids was unclear in Detroit, with only NFLIS data available for this reporting period. Hydrocodone continued to be the prescription opioid most frequently identified in drug reports

22
CEWG Meeting Highlights and Summary
Proceedings of the Community Epidemiology Work Group, January 2014
among items analyzed by NFLIS laboratories for both Wayne County (Detroit) and the State of Michigan in the first half of 2013. In the first half of 2013, hydrocodone drug reports continued to rank fourth among the top 10 drug reports from items seized and analyzed in NFLIS laboratories, with. 3.7 percent of the total drug reports compared with 3.2 percent in the first half of 2012.
Northeastern Region: In the Northeast, indicators for prescription opioids were increasing in one of the four areas, New York City, according to the area representative. In three CEWG areas of the Northeast—Boston, Maine, and Philadelphia—indicators were reported by the area representatives as mixed in this reporting period.
• Although levels for prescription opioids were low relative to other drugs, an increase in indicators for these drugs was one of the key findings for this reporting period, according to the area representative in New York City. Numbers of reports for prescription opioids among drug items analyzed by NFLIS laboratories increased in New york City from the first half of 2012 to the first half of 2013. In addition, the area representative reported that while unintentional drug poisoning death rates in New York City decreased by 12 percent overall between 2005 and 2012, opioid analgesic poisoning death rates increased in this time period by 50 percent. Opioid analgesic poisoning death rates increased by 233 percent among Staten Islanders during this period. Proportions of primary treatment admissions for prescription opioids remained low, but they have increased in proportion to other drugs in recent years, according to the area representative.
• Mixed indicators for prescription opioids, in relation to other drugs, were reported by the area representa-tives from Boston, Maine, and Philadelphia for the first half of 2013.
| In Boston, where levels for prescription opioids were moderate relative to other drugs in this reporting period, indicators for these drugs were reported by the area representative as mixed. The unintentional overdose hospital patient rate for prescription opioids steadily increased by 66 percent over 5 years, from FY 2008 to FY 2012. However, the proportion of primary treatment admissions for prescription opioids decreased slightly, from 5 percent in FY 2011 to 3 percent in FY 2013. The proportion of NFLIS drug reports identified as oxycodone among analyzed drug items declined from 8.2 percent of total drug reports in the first half of 2012 to 6.3 percent in the first half of 2013.
| The area representative from Maine reported continuing high levels relative to other drugs for prescription opioids in the State, but indicators were mixed in this reporting period, with some indicators stable and some declining. For the first time in more than a decade of increasing proportions, primary treatment admissions for prescription opioids decreased, from 37 percent of total admissions in 2012 to 27 percent in the first half of 2013. Reports for oxycodone, buprenorphine, and hydrocodone were among the top 10 drugs identified in drug reports among drug items seized by law enforcement and analyzed by the forensic laboratories in the first half of 2013, continuing the trend of previous years.
| Available indicators for prescription opioids were also reported by the area representative as mixed in Philadel-phia in this reporting period. The proportion of oxycodone drug reports continued to rank fourth among all drug reports from items analyzed in NFLIS laboratories in the first half of 2013. Drug reports among analyzed NFLIS items identified as codeine ranked ninth among all drug reports in the first half of 2013 (the drug was not in the top 10 in the first half of 2012), with 0.6 percent of total drug reports. Buprenorphine also moved into the top 10 list of drug reports, tying for 10th place among all NFLIS drug reports in the first half of 2013. Opioid detection in positive urinalyses among first time individuals on parole or probation continued to increase, with the highest percentage of positive urinalyses for opioids detected since 2009 (at 9.1 percent, compared with 6.7 percent in 2009 and 8.2 percent in 2012).
Southern Region: In the South, indicators were mixed for prescription opioids in two of the three CEWG areas—Atlanta and the Miami-Dade and Broward Counties/South Florida area. Indicator trends were unclear in the Baltimore/Maryland/Washington, DC, area for prescription opioids in this reporting period.
• Indicators were mixed in Atlanta and in the Miami-Dade and Broward Counties/South Florida area in the first half of 2013.
| In Atlanta, in the first half of 2013, available drug indicators suggested that oxycodone was the most reported prescription drug in the Atlanta area. Treatment admissions data showed that the proportion of primary admissions for oxycodone decreased (from 3.0 percent of all treatment admissions in 2012 to 2.8 percent in the first

23
CEWG Meeting Highlights and Summary
Proceedings of the Community Epidemiology Work Group, January 2014
half of 2013) after increasing consistently from 2007 through 2011. Data from the State Medical Examiner’s Office also showed a slight decrease in oxycodone postmortem result entries from FY 2012 to FY 2013, but data indicated an increase in the number of deaths associated with hydrocodone. NFLIS data showed decreases in the proportion of drug reports identified as both oxycodone and hydrocodone among items analyzed from the first half of 2012 to the first half of 2013.
| In the Miami-Dade and Broward Counties/South Florida area, some indicators were increasing and some were decreasing in this reporting period. A total of 568 primary prescription opioid treatment admissions were observed in Broward County during the first half of 2013; there were 127 such admissions in Miami-Dade County in the same period. The Broward County admissions were 9 percent lower than in the first half of 2012, and the Miami-Dade County admissions were 10 percent higher. The 481 drug reports for prescription opioids among drug items seized and analyzed by NFLIS laboratories in the first half of 2013 in the South Florida counties of the Miami MSA represented a modest 2-percent decline from the proportion of prescription opioid reports identified among analyzed drug items in the first half of 2012.
• While indicator trends were unclear in the Baltimore/Maryland/Washington, DC, area for prescription opi-oids in this reporting period, NFLIS data showed that the proportion of drug reports containing oxycodone among items seized and identified by NFLIS laboratories in Baltimore City increased from 1.8 percent of total drug reports in the first half of 2012 to 2.9 percent of total reports in the first half of 2013.
Benzodiazepines Twelve of 20 CEWG area representatives reported on benzodiazepines at the January 2014 meeting—those from Denver/Colorado, Los Angeles, Seattle, and Texas in the West; Chicago and Cincinnati in the Midwest; Boston, Maine, New York City, and Philadelphia in the Northeast; and Atlanta, and the Miami-Dade and Bro-ward Counties/South Florida area in the South. Benzodiazepines, such as alprazolam, clonazepam, and diaz-epam, often appeared in indicators in combination with other drugs, and were appearing frequently among mortality and NFLIS data, as reported by several area representatives. Three CEwG area representatives— from Boston, Denver/Colorado, and Philadelphia—reported increased indicators for benzodiazepines.
• The Boston area representative reported that the unintentional benzodiazepine overdose hospital patient rate had steadily increased by 54 percent from FY 2009 (26.9 per 100,000) to FY 2012 (41.4 per 100,000). In FY 2013, the proportion of unique-person treatment admissions citing benzodiazepines as primary, secondary, or tertiary drugs of abuse reached 12 percent of the total in Boston, which represented an increase from 5 percent in FY 2005.
• In Denver, benzodiazepines increased sharply both in the number and proportion of alcohol and drug-related deaths reportable to the Denver Office of the Medical Examiner. Overall, the rate of benzodiazepine deaths in Denver rose from 2.7 per 100,000 in 2003 to 5.1 per 100,000 in 2012.
• The area representative from Philadelphia reported that benzodiazepines continued to appear frequently among drug indicators in that area. Benzodiazepines were frequently mentioned as secondary and tertiary drug problems by treatment admissions clients, and the volume of benzodiazepine detections by the Medical Examiner’s Office among decedents with the presence of drugs increased sharply from 2012 to the first half of 2013. Focus group participants indicated that alprazolam and clonazepam were often taken as a “booster” for other drugs, according to the area representative.
Methamphetamine Overall CEwG Areas: Indicators for methamphetamine were reported by area representatives as increasing in 12 of the 20 CEwG areas in this reporting period. Methamphetamine continued to be prominent in indicator data in all eight CEwG areas in the west. Seven of the eight areas in the western region—Albuquerque/New Mexico, Denver/Colorado, Los Angeles, San Diego, San Francisco, Seattle, and Texas—reported increases in methamphetamine indicators in the first half of 2013, as well as four of the five area representatives in the midwestern region—Cincinnati, Detroit, Minneapolis/St. Paul, and St. Louis—and one representative in the South, Atlanta. Mixed methamphetamine indicators for this reporting period were reported by the area repre-sentatives from Maine and the Miami-Dade and Broward Counties/South Florida area, and stable indicators were reported by the representative from Phoenix. Indicators for methamphetamine were low relative to other

24
CEWG Meeting Highlights and Summary
Proceedings of the Community Epidemiology Work Group, January 2014
drugs and stable in Chicago, in the Midwest, and in three of the four CEwG area representatives in the North-east—Boston, New york City, and Philadelphia. The Baltimore/Maryland/washington, DC, area representative reported very low and stable indicators for methamphetamine in this reporting period.
Western CEWG Region: Methamphetamine, as in past reporting periods, was prominent in indicator data and reported as a source of concern among all eight CEWG area representatives in the West. Indicators for meth-amphetamine were reported as increasing in seven of the eight areas—Albuquerque/New Mexico, Denver/ Colorado, Los Angeles, San Diego, San Francisco, Seattle, and Texas—in the first half of 2013, and they were stable in one CEWG area, Phoenix. None of the representatives in the western CEWG region reported declin-ing indicators for methamphetamine.
• Methamphetamine indicators were increasing in Albuquerque/New Mexico, Denver/Colorado, Los Angeles, San Diego, San Francisco, Seattle, and Texas in this reporting period. These increases were reported as key findings for this reporting period in Albuquerque/New Mexico, Denver/Colorado, Los Angeles, San Diego, San Francisco, and Texas.
| In Albuquerque, in the first half of 2013, 25.2 percent of all drug reports among items seized and analyzed in NFLIS laboratories were identified as methamphetamine, compared with 17.5 percent of drug reports in the first half of 2012. This proportion tied methamphetamine with marijuana/cannabis for first place among total drug reports in that area. In 2012, primary methamphetamine/amphetamine treatment admissions constituted 10.9 percent of all admissions in Albuquerque; this was an increase from 9.1 percent of all admissions in 2010.
| According to the area representative, the DEA Denver Field Division continued to rank methamphetamine as its top drug threat in the Denver area. In the first half of 2013, primary methamphetamine admissions represented 16.7 percent of all statewide treatment admissions in Colorado (an increase from 14.3 percent of total statewide admissions in the first half of 2012). In the greater Denver area, methamphetamine was the primary problem at admission for 12.0 percent of all treatment admissions in the first half of 2013; this was slightly higher than the proportion of the total in 2012 (11.3 percent). The proportion of methamphetamine drug reports among analyzed items increased in Denver from 13.1 percent of total drug reports in the first half of 2012 to 21.8 percent of the total in the Denver area in the first half of 2013.
| All available indicators were increasing for methamphetamine in Los Angeles in this reporting period, and methamphetamine remained prevalent and of major concern to law enforcement agencies in the Los Angeles County region, according to the area representative. The percentage of primary methamphetamine treatment admissions for the first half of 2013 (18.8 percent) represented an increase from 2012 levels (16.9 percent). NFLIS drug reports among analyzed drug items identified as methamphetamine ranked first among total drug reports in Los Angeles in the first half of 2013, with 32.8 percent of total drug reports. This represented an increase from 25.2 percent of total drug reports the first half of 2012. While illicit drugs constituted a relatively small portion (approximately 11 percent) of drug reports from relevant poison control system calls for Los Angeles County, methamphetamine was ranked first among illicit drugs in 2013 (accounting for 3.4 percent of drugs reports from relevant poison control calls). Projections for coroner toxicology cases with methamphetamine detected showed an increase in numbers in this reporting period, from 560 cases in 2012 to an estimated 687 cases in 2013.
| After several years of mixed or declining indicators, methamphetamine indicators were increasing in San Diego in this reporting period, as reported by the area representative. The proportion of primary methamphetamine treatment admissions had been in decline in San Diego since 2007 and reached a low of 25 percent of the total in the first half of 2012. In the first half of 2013, however, the proportion of primary methamphetamine treatment admissions returned to the 2010–2011 level of 29 percent of total admissions, representing 2,412 primary admissions. Among arrestees, the prevalence of urinalysis test results positive for methamphetamine increased among adult males (from 26 percent in 2011 to 31 percent in 2012) and adult females (from 39 to 47 percent). Methamphetamine drug reports continued to rank first among all drug reports from items analyzed in NFLIS laboratories. In the first half of 2013, drug reports identified as methamphetamine accounted for 41.8 percent of all drug reports, compared with 37.7 percent of the total for the first half of 2012.
| The San Francisco area representative reported the “continuing dominance of methamphetamine in indicators” as one of the key findings for in this reporting period. While the area representative did not provide an overall characterization of the trend based on half-year data, she reported that the numbers of treatment admissions
25
CEWG Meeting Highlights and Summary
Proceedings of the Community Epidemiology Work Group, January 2014
in which methamphetamine was the primary drug problem rose across the bay area, from FY 2011–2012 to FY 2012–2013, and they ranked second among all treatment admissions after alcohol. The proportion of reports identified as methamphetamine among drug items seized and analyzed by NFLIS laboratories increased from 32.1 percent of total reports in the first half of 2012 to 37.8 percent in the first half of 2013; methamphetamine reports accounted for the largest proportion of drug reports among analyzed drug items in both time periods.
| In Seattle, the area representative noted that “methamphetamine continued to be prevalent in indicators” in that area in the first half of 2013. He did not provide an overall characterization of the trend with half-year data, but he did note an increase in drug-caused deaths related to methamphetamine. These drug-caused deaths involving methamphetamine totaled 21 in the first half of 2013, representing a substantial increase compared with 7 such deaths in the first half of 2011. Drug reports identified as methamphetamine among items seized and analyzed in NFLIS laboratories also increased, from 17.8 percent of total drug reports in the first half of 2012 to 21.1 percent of the total in the first half of 2013.
| Methamphetamine indicators were at higher levels in this reporting period than ever reported in Texas, according to the area representative. The higher purity and potency of the current supply is due to the P2P version of the drug made in Mexico, based on data from the DEA’s Methamphetamine Profiling Program and reported by the area representative. The number of calls to Texas poison control centers involving human exposure to methamphetamine increased from 279 in 2012 to 503 in 2013. The proportion of methamphetamine items seized, analyzed, and reported to NFLIS in Texas increased from 14.8 percent of all drugs in the first half of 2012 to 18.7 percent in the first half of 2013.
• Indicators for methamphetamine were stable in one CEWG area, Phoenix, in this reporting period. Amphetamine-related hospital admissions (which consist primarily of admissions related to methamphetamine) in the Phoe-nix area, including Maricopa (Phoenix) and Pima (Tucson) Counties, were stable in the first half of 2013 from the second half of 2012. In addition, the numbers of drug reports identified as methamphetamine among items seized and analyzed by NFLIS laboratories were stable in the first half of 2013 from previous reporting periods, according to the area representative.
Midwestern Region: Four of the five area representatives in the midwestern region—Cincinnati, Detroit, Min-neapolis/St. Paul, and St. Louis—reported increases in methamphetamine for this reporting period. Indica-tors for methamphetamine were stable in one area, Chicago, in the Midwest. Methamphetamine indicators remained at low levels relative to other drugs in Cincinnati and Detroit and high relative to other drugs in the Minneapolis/St. Paul area.
• Methamphetamine indicators were reported as increasing in the first half of 2013 by area representatives from Cincinnati, Detroit, Minneapolis/St. Paul, and St. Louis.
| Methamphetamine indicators in Cincinnati were low relative to other drugs in this reporting period, according to the area representative, but indicators were gradually increasing. The number of reported methamphetamine clandestine laboratory seizures increased by 159 percent during FY 2013, compared with the previous year. Law enforcement attributed the increased number of methamphetamine laboratory and chemical findings to the increased use of the one-pot method for methamphetamine manufacture. Law enforcement also reported increased amounts of crystal methamphetamine seizures in 2013 from the previous year.
| Indicators for methamphetamine in Detroit remained low in this reporting period, but the proportion of methamphetamine drug reports among items seized by law enforcement and analyzed in NFLIS laboratories increased in the first half of 2013. For the first time, in the first half of 2013, methamphetamine was among the top 10 drug reports identified among drug items seized and analyzed in NFLIS laboratories for Wayne County; methamphetamine ranked eighth among drug reports with 0.5 percent of the total.
| Methamphetamine indicator levels continued to be high relative to other drugs in the Minneapolis/St. Paul area, and the increases in this reporting period were cited by the area representative as a key finding for the Twin Cities area. Proportions of primary methamphetamine treatment admissions have gradually increased in the Minneapolis/St. Paul area since 2011. They accounted for 9.4 percent of total treatment admissions in the first half of 2013, compared with 7.4 percent in 2012. Similarly, the proportion of drug reports identified as methamphetamine from items seized by law enforcement and analyzed by NFLIS laboratories increased in the first half of 2013 in the Minneapolis/St. Paul area from the first half of 2012. Methamphetamine drug reports

26
CEWG Meeting Highlights and Summary
Proceedings of the Community Epidemiology Work Group, January 2014
accounted for 31.5 percent of total drug reports in the first half of 2013 in the Twin Cities, compared with 19.8 percent of total drug reports in the first half of 2012.
| An increase in methamphetamine indicators in the St. Louis region in the first half of 2013, in addition to the continuing methamphetamine presence in rural areas of the State, was reported by the area representative as a key finding for this reporting period. The numbers of primary methamphetamine treatment admissions increased from the first half of 2012 (n=210) to the first half 2013 (n=257). Methamphetamine represented 8.8 percent of all drug reports among items seized and analyzed by NFLIS laboratories in the St. Louis MSA (a very slight increase from 8.6 percent of total reports in the first half of 2012). The area representative reported that methamphetamine use in rural areas continued to be a critical issue in the St. Louis area, with the drug reported as consistently available.
• The area representative from Chicago reported that indicators for methamphetamine continued to be low relative to other drugs and stable during this reporting period, with only NFLIS data available for this report-ing period. Proportions of methamphetamine among drug reports from items analyzed in NFLIS laboratories and primary methamphetamine treatment admissions continued to be very small relative to other drugs in the Chicago area in the first half of 2013.
Northeastern Region: Continuing low or very low methamphetamine indicator levels relative to other drugs and stable indicators were reported by three of the four CEWG area representatives in the Northeast—from Boston, New York City, and Philadelphia. Low and mixed indicators for this reporting period were reported by the area representative from Maine.
• Levels for methamphetamine relative to other drugs were low and stable in Boston, New York City, and Philadelphia.
| In Boston, methamphetamine represented less than 1.0 percent of total primary treatment admissions in FY 2013. Proportions of methamphetamine drug reports among drug reports from items seized and analyzed in NFLIS laboratories were very low relative to other drugs in Boston in the first half of 2013.
| Similar to other areas in the Northeast, numbers of primary methamphetamine treatment admissions and proportions of NFLIS methamphetamine drug reports among analyzed drug items were stable in the first half of 2013 from previous reporting periods and remained at very low levels in New york City.
| In Philadelphia, primary methamphetamine and other amphetamine treatment admissions totaled 0.1 percent of total admissions in the first half of 2013 and were stable from previous reporting periods. NFLIS data showed continuing low levels of the proportion of methamphetamine among drug reports from seized and analyzed items in Philadelphia in the first half of 2013.
• While methamphetamine levels in the State of Maine remained very low relative to other drugs, indicators for methamphetamine were mixed in this reporting period. Numbers and proportions of arrests for methamphetamine in the State of Maine increased to 51 (representing 8 percent of all drug arrests) in 2013 from 32 (6 percent of all drug arrests) in 2012. In the first half of 2013, methamphetamine accounted for 3.4 percent of total drug reports from seized items analyzed by NFLIS laboratories; this proportion represented a slight increase from 3.1 percent in the first half of 2012. Primary methamphetamine treatment admissions numbered 17 in the first half of 2013; this represented a slight decline from 46 admissions in 2012. Numbers of clandestine laboratory incidents increased from 12 incidents in 2012 to 20 in 2013.
Southern Region: The area representative from Atlanta reported increasing indicators for methamphetamine; the area representative from the Miami-Dade and Broward Counties/South Florida area reported mixed indica-tors for the first half of 2013; and the representative for the Baltimore/Maryland/Washington, DC, area reported very low and stable indicators for methamphetamine in this reporting period.
• An increase in methamphetamine indicators in Atlanta was a key finding in this reporting area, according to the area representative, based on increases in proportions of primary methamphetamine treatment admis-sions, numbers of deaths related to methamphetamine, and NFLIS drug report data. The proportion of primary methamphetamine-related public treatment admissions continued to increase yearly in the metropolitan Atlanta area (from 5.2 percent in 2010 to 6.8 percent in the first half of 2013). In the first 6 months of 2013, the proportion of individuals seeking public treatment for methamphetamine in Atlanta was at the highest level since 2006. The
27
CEWG Meeting Highlights and Summary
Proceedings of the Community Epidemiology Work Group, January 2014
Georgia State Medical Examiner’s Office reported an increasing number of deaths with methamphetamine present in FY 2013, compared with FY 2012. NFLIS data also indicated an increase in the proportion of methamphetamine drug reports among seized and analyzed drug items, from 20.1 percent of all drug reports in the first half of 2012 to 24.2 percent of total drug reports in the first half of 2013. For the first time, proportions of methamphetamine drug reports ranked highest among all drugs in the NFLIS data for Atlanta.
• Mixed indicators for methamphetamine were reported by the area representative for the Miami-Dade and Broward Counties/South Florida area in the first half of 2013. Numbers of primary methamphetamine treatment admissions in 2013 remained very low and stable in both South Florida counties. However, the proportion of methamphetamine reports among drug items analyzed in NFLIS laboratories in South Florida in the first half of 2013 increased to 1.3 percent of all drug reports from 0.6 percent of the total drug reports in the first half of 2012.
• Methamphetamine indicators were very low relative to other drugs and stable in the Baltimore/ Maryland/ Washington, DC, area in this reporting period, according to the area representative. The proportions of methamphetamine among drug reports from items seized and analyzed in NFLIS laboratories continued to be very small relative to other drugs in Baltimore City, Maryland, and washington, DC, in the first half of 2013. The proportion of adult arrestees in Washington, DC, testing urinalysis positive for amphetamines remained considerably lower than for other drugs in 2013 (at approximately 1.0 percent).
Marijuana/Cannabis Overall CEwG Areas: Increasing indicators for marijuana/cannabis were reported during this reporting period by one CEwG area representative, from Albuquerque/New Mexico in the western CEwG region. Twelve of the 20 CEWG area representatives reported mixed marijuana/cannabis indicators for the first half of 2013. These included seven of the eight area representatives in the western region (Denver/Colorado, Los Angeles, Phoenix, San Diego, San Francisco, Seattle, and Texas); one of the five midwestern CEWG areas, Minne-apolis/St. Paul; two of the four CEwG areas in the Northeast, Boston and Maine; and two of the three CEwG areas in the South, the Baltimore/Maryland/washington, DC, and Miami-Dade and Broward Counties/South Florida areas. Indicators for marijuana/cannabis were reported as stable in four of the five CEWG areas in the Midwest—Chicago, Cincinnati, Detroit, and St. Louis—and in two CEwG areas in the Northeast—New york City and Philadelphia. In one CEwG area in the South, Atlanta, indicators for marijuana/cannabis were mostly decreasing. Two area representatives, from Denver and Seattle, reported that their States (Colorado and washington) recently passed legislation allowing the recreational use of marijuana; they noted that this may influence indicators for marijuana in future reporting periods.
Western Region: One of the eight CEWG area representatives in the western region, Albuquerque/New Mexico, reported increasing indicators for marijuana/cannabis for this reporting period. Seven of the eight area representatives—from Denver/Colorado, Los Angeles, Phoenix, San Diego, San Francisco, Seattle, and Texas—reported mixed indicators for marijuana/cannabis for the first half of 2013. Two area representatives, from Denver and Seattle, reported that their States (Colorado and Washington) recently passed legislation allowing the recreational use of marijuana/cannabis; they noted that this may influence indicators for mari-juana/cannabis in future reporting periods.
• Indicators for marijuana/cannabis were increasing in this reporting period in Albuquerque/New Mexico. Marijuana/cannabis constituted 25.2 percent of all Albuquerque drug reports among items analyzed in NFLIS laboratories in the first half of 2013, tying for first place among all drug reports with methamphetamine (this represented an increase from 19.1 percent of drug reports in the first half of 2012). The proportion of marijuana primary treatment admissions in New Mexico also increased in 2012, to 8.7 percent of all admissions, from 7.7 percent in 2010. In 2012, there was a higher proportion of primary marijuana treatment admissions among clients age 21–25 than for any other age category, with 28.1 percent.
• Mixed indicators for marijuana/cannabis were reported for the first half of 2013 by area representatives in Denver/Colorado, Los Angeles, Phoenix, San Diego, San Francisco, Seattle, and Texas.
| Marijuana/cannabis continued to be the primary drug of abuse statewide in Colorado and in the greater Denver area, excluding alcohol, according to the area representative. Indicators in this reporting period were mixed, with some increasing and some decreasing. During the first half of 2013, the proportion of primary admissions for

28
CEWG Meeting Highlights and Summary
Proceedings of the Community Epidemiology Work Group, January 2014
marijuana represented 18.8 percent of total drug treatment admissions in Colorado and 18.1 percent of treatment admissions in the Denver area (including alcohol). However, both of these proportions represent small declines from the first half of 2012, when marijuana accounted for 19.2 and 19.8 percent of treatment admissions for Colorado and the Denver metropolitan area, respectively. Marijuana/cannabis was the fourth most common drug reported among drug items seized and analyzed in forensic laboratories in the first half of 2013 in the Denver metropolitan area, based on NFLIS data, representing 14.4 percent of total drug reports. This is a decline from the first half of 2012, when marijuana/cannabis was second among NFLIS drug reports in the Denver area, with 19.6 percent of the total identified as marijuana/cannabis. Colorado recently passed Amendment 64, which legalized the possession of less than 1 ounce of marijuana/cannabis for people older than 21. Medical marijuana centers in Colorado began selling recreational marijuana/cannabis on January 1, 2014.
| Marijuana/cannabis indicators were mixed in this reporting period in Los Angeles, with some increasing and some decreasing. Marijuana/cannabis was reported as the primary drug problem for 27.2 percent of Los Angeles County primary treatment admissions in the first half of 2013; this was a very slight increase from 26.9 percent of total admissions in 2012. More than one-half (59 percent) of primary marijuana admissions were for adolescents younger than 18. Marijuana/cannabis was identified in 30.8 percent of drug reports among drug items analyzed by NFLIS laboratories in the first half of 2013; this was a decrease from 35.5 percent in the first half of 2012.
| Overall indicators for marijuana/cannabis in the Phoenix area were mixed in this reporting period. This is despite the fact that a key finding involved the decrease in NFLIS drug reports identified as marijuana/cannabis in the first half of 2013, as well as a decline in marijuana/cannabis hospital admissions in Arizona for individuals in their twenties. Numbers of marijuana/cannabis-related hospital admissions in Maricopa County (Phoenix) were stable in the first half of 2013, at 2,105 admissions, compared with the second half of 2012 (n=2,106 admissions). In Pima County (Tucson), however, numbers of cannabis-related hospital admissions declined, from 900 admissions in the second half of 2012 to 844 admissions in the first half of 2013; this continued a declining trend that began in 2010. Based on an age analysis of hospital admissions for Arizona, a decrease in marijuana/cannabisrelated hospital admissions was observed among persons in their early twenties during the past few years. Both numbers and proportions of marijuana/cannabis drug reports among items seized and analyzed by NFLIS laboratories decreased in the Phoenix area in the first half of 2013 (n=1,305 drug reports, constituting 29.0 percent of total reports) from the first half of 2012 (n=1,875 drug reports, constituting 32.9 percent of the total).
| In San Diego, marijuana/cannabis indicators were mostly decreasing or stable in the first half of 2013, although an increase was observed among adult male arrestee positive urinalyses for marijuana/cannabis. Primary marijuana treatment admissions declined to 18.4 percent of all admissions in the first half of 2013 from 19.6 percent in the first half of 2012. Marijuana/cannabis use prevalence among adult arrestees in 2012 was up by 3 percentage points for males (42 percent in 2012, compared with 39 percent in 2011) and down by 1 percentage point for females (30 percent in 2012, compared with 31 percent in 2011). The prevalence of positive urinalysis tests for marijuana/cannabis among juvenile arrestees also decreased, from 51 percent in 2011 to 48 percent in 2012. The proportion of drug reports identified as marijuana/cannabis among drug items analyzed by NFLIS laboratories decreased in San Diego, from 19.4 percent of the total in the first half of 2012 to 12.5 percent in the first half of 2013.
| Marijuana/cannabis indicators continued to be mixed in the San Francisco area, as reported by the area representative. There was a slight decrease in the proportion of NFLIS drug reports identified as marijuana/ cannabis among drug items seized and analyzed by forensic laboratories (from 20.8 percent in the first half of 2012 to 18.6 percent in the first half of 2013). Marijuana was the most common drug reported at admission as the primary drug problem for clients younger than 18 in FY 2012–2013.
| The Seattle area representative reported that marijuana/cannabis continued to be prevalent in drug indicators in the first half of 2013, but indicators there were mixed. Treatment admissions with marijuana as the primary drug of abuse continued at high levels for youth. Numbers and proportions of marijuana/cannabis drug reports among seized drug items analyzed by NFLIS laboratories reached a new low in the first half of 2013, with 61 reports (7.2 percent of the total), compared with 123 (9.7 percent of all drug reports) in the first half of 2012. According to the area representative, Washington State is preparing the marketplace for legal marijuana/cannabis production and sales, due to the recent legalization of marijuana/cannabis for recreational use.
| In Texas, the area representative reported that demand indicators for marijuana/cannabis (poison control center calls, primary treatment admissions, and forensic laboratory items identified) were level or increasing in the
29
CEWG Meeting Highlights and Summary
Proceedings of the Community Epidemiology Work Group, January 2014
State in this reporting period. However, supply indicators were down. The quality of Mexican cannabis was reported as poor, and availability was down due to a drought in Mexico.
Midwestern Region: Area representatives in four of the five CEWG areas in the Midwest—Chicago, Cincin-nati, Detroit, and St. Louis—reported high levels for marijuana/cannabis relative to other drugs and relatively stable indicators. Indicators for marijuana/cannabis were mixed in one midwestern CEWG area, Minneapolis/ St. Paul, in this reporting period.
• Indicators for marijuana were high relative to other drugs and relatively stable in Chicago, Cincinnati, Detroit, and St. Louis and in this reporting period.
| Indicators for marijuana/cannabis in the Chicago area continued to be high relative to other drugs and stable in this reporting period, according to the area representative. In FY 2012, numbers of primary marijuana treatment admissions were relatively stable, with 6,625 primary treatment admissions compared with 6,744 such admissions in FY 2010. Drug reports identified as marijuana/cannabis continued to rank first among all reports from seized drug items analyzed by NFLIS laboratories in Chicago, and they continued to represent more than one-half of all drug reports in the current reporting period.
| In Cincinnati, marijuana/cannabis indicators were reported overall as stable at high levels in this reporting period by the area representative. Primary marijuana treatment admissions were the same in the first halves of 2012 and 2013, at 29.4 percent of total admissions. Marijuana/cannabis continued to be the drug most often identified in drug reports among items submitted to NFLIS laboratories and analyzed during the first half of 2013, accounting for 34.2 percent of all drug reports, compared with 39.3 percent of the total drug reports in the first half of 2012. Human exposure cases for marijuana/cannabis called in to poison control centers numbered 69 in 2012, compared with 76 cases in 2013.
| The Detroit CEWG area representative reported continuing stable indicators for marijuana/cannabis. Primary marijuana treatment admissions in Detroit accounted for 15.3 percent in FY 2013; this was similar to the 15.0 percent of primary marijuana admissions reported in FY 2011. Marijuana/cannabis continued to rank first among drug reports from items seized and analyzed by NFLIS laboratories for both Wayne County and the State of Michigan in the first half of 2013.
| In St. Louis, primary marijuana treatment admissions, as a percentage of total admissions, were stable from 16.7 percent in 2012 to 16.5 percent in the first half of 2013. In the first half of 2013, 56.6 percent of these marijuana clients were younger than 25. Marijuana/cannabis was the most frequently identified substance among drug reports from drug items seized and analyzed in NFLIS laboratories in the St. Louis MSA in the first halves of 2012 and 2013.
• Marijuana/cannabis indicators were mixed in Minneapolis/St. Paul, with some indicators stable and some declining in this reporting period. Marijuana as the primary substance problem accounted for 16.0 percent of total treatment admissions in the first half of 2013 in the Minneapolis/St. Paul area, a stable proportion compared with 16.3 percent of the total in 2012. Nearly one-third of these clients (30.0 percent) were younger than 18. Marijuana/ cannabis was identified in 7.9 percent of drug reports from law enforcement seizures analyzed by NFLIS laboratories in the first half of 2013; this proportion represented a substantial decrease from 21.1 percent of total drug reports in the first half of 2012.
Northeastern Region: Indicators for marijuana/cannabis were mixed in this reporting period in two of the four CEWG areas in the Northeast—Boston and Maine—according to the area representatives. Marijuana/canna-bis indicators were reported by area representatives as stable in the other two CEWG areas in the Northeast— New York City and Philadelphia.
• Indicators for marijuana/cannabis were mixed in this reporting period in Boston and Maine, as reported by the area representatives.
| In the Boston area, marijuana/cannabis indicators were mixed at varied levels, with some stable, some declining, and some increasing. From FY 2002 to FY 2013, the proportion of primary marijuana treatment admissions remained stable (between 4 and 5 percent). From 2011 to 2012, the proportion of Class D drug arrests (mainly marijuana) was stable at 18 percent. Marijuana/cannabis drug reports ranked highest among all drug reports from items analyzed by NFLIS laboratories in the first half of 2013. The proportion of marijuana/cannabis drug reports among analyzed items increased from 29.0 percent of total drug reports in the first half of 2012 to 33.1

30
CEWG Meeting Highlights and Summary
Proceedings of the Community Epidemiology Work Group, January 2014
percent in the first half of 2013. In 2013, 42 percent of public high school students in Boston reported using marijuana during their lifetime (an increase from 40 percent in 2011), and 26 percent reported using marijuana during the past 30 days (a decrease from 27 percent in 2011).
| Marijuana/cannabis indicators were mixed in this reporting period in Maine. According to the area representative, Maine’s medical marijuana law and a recent vote to legalize small amounts of the drug for personal use in Maine’s largest city, Portland, may impact indicators in the State. In 2013, 51 percent of Maine’s impaired drivers had a positive urinalysis toxicology screen for marijuana; this was an increase from 36 percent of the total in 2012. The proportion of marijuana drug arrests declined from 17 to 5 percent of all drug arrests from 2012 to 2013. The proportion of marijuana/cannabis drug reports among drug items seized and identified by NFLIS laboratories in Maine declined from 6.4 percent of total reports in the first half of 2012 to 5.5 percent in the first half of 2013. During the first half of 2013, the proportion of primary marijuana admissions dropped slightly to 8 percent of all admissions from 9 percent in 2012.
• Indicators for marijuana/cannabis continued to be high or very high relative to other drugs and stable in New York City and Philadelphia in this reporting period, according to the area representatives.
| Marijuana/cannabis indicators were reported by the area representative as very high and mixed in New york City, and the continuing predominance of marijuana/cannabis (along with heroin and cocaine) was a key finding in New York City for this reporting period. The proportion of primary marijuana treatment admissions was stable from previous reporting periods, representing 25 percent of all treatment admissions. More clients in treatment had a primary, secondary, or tertiary problem with marijuana than with any other drug. More than one-third of drug reports among items analyzed by NFLIS laboratories (33.6 percent) in the first half of 2013 were identified as marijuana/cannabis, the highest proportion for any drug. This proportion remained the same from the first half of 2012.
| Marijuana/cannabis continued to rank first in positive urinalysis tests among parolees who were being tested for the first time by the Adult Probation and Parole Department in Philadelphia. Marijuana continued to rank third among primary treatment admissions during the first half of 2013 (at 20.8 percent of all admissions). Marijuana/ cannabis drug reports continued to rank first among all drug reports identified in items seized and analyzed by NFLIS laboratories fin Philadelphia, with 31.2 percent of total drug reports in the first half of 2013.
Southern Region: Marijuana/cannabis indicators were mixed in two of the three CEWG areas in the South— the Baltimore/Maryland/Washington, DC, and Miami-Dade and Broward Counties/South Florida areas—in this reporting period. In one CEWG area in the South, Atlanta, indicators for marijuana/cannabis were mostly decreasing.
• Mixed indicators were reported for marijuana/cannabis for the first half of 2013 by the area representatives from Baltimore/Maryland/Washington, DC, and Miami-Dade and Broward Counties/South Florida.
| Indicators for marijuana/cannabis were mixed across the Baltimore/Maryland/washington, DC, area, although marijuana/cannabis continued to be a primary illicit drug problem in that area, according to the area representative. Drug reports identified as marijuana/cannabis among items seized and analyzed by NFLIS laboratories continued to rank first among all drug reports in Baltimore City, Maryland, and Washington, DC, in this reporting period. In Washington, DC, in 2013, juvenile arrestees were more likely to test urinalysis positive for marijuana (40 percent) than for any other drug. However, the percentage of juvenile arrestees testing positive for marijuana in 2013 was lower than for any year since 1993.
| In the Miami-Dade and Broward Counties/South Florida area, proportions of primary marijuana treatment admissions declined in both South Florida counties in this reporting period: from 39 percent of Miami-Dade County clients in 2012 to 28 percent in the first half of 2013, and from 30 percent of Broward County clients in 2012 to 19 percent in the first half of 2013. Numbers and proportions of drug reports for marijuana/cannabis among drug items analyzed by NFLIS laboratories in the Miami MSA were stable between the first halves of 2012 and 2013, and marijuana/cannabis continued to rank second in frequency among all drug reports for substances analyzed by NFLIS forensic laboratories in the first half of 2013.
• Marijuana/cannabis indicators were mostly decreasing in Atlanta in this reporting period. The proportion of clients seeking public treatment in Atlanta for marijuana as a primary drug of choice declined, from 17.3 percent

31
CEWG Meeting Highlights and Summary
Proceedings of the Community Epidemiology Work Group, January 2014
in 2011 to 16.1 percent in the first half of 2013. Results from Atlanta’s Arrestee Drug Abuse Monitoring (ADAM) II program also indicated a decrease in positive urine tests for marijuana among local arrestees in 2013, compared with the previous 3 years.
Synthetic Cannabinoids (Cannabimimetics) Twelve of 20 CEWG area representatives across all 4 regions reported on synthetic cannabimimetics for this reporting period. These included three area representatives in the western region (Los Angeles, Phoenix, and Seattle); all five CEWG area representatives in the Midwest (Chicago, Cincinnati, Detroit, Minneapolis/St. Paul, and St. Louis); two of the CEWG areas in the Northeast (Philadelphia and Maine); and two CEWG areas in the South (the Baltimore/Maryland/Washington, DC, and Miami-Dade and Broward Counties/South Florida areas).
Western Region: Three of the eight CEWG area representatives in the western region—from Los Angeles, Phoenix, and Seattle—reported on cannabimimetics for the first half of 2013. Available indicators for canna-bimimetics were mixed in Los Angeles and declining in Phoenix and Seattle, according to the area represen-tatives.
• Indicators for cannabimimetics were mixed in Los Angeles in this reporting period. The area representative from Los Angeles reported slight increases in the numbers of cannabimimetic drug reports among items seized and analyzed by NFLIS laboratories in this reporting period; there were 19 drug reports identified as cannabimimetics in the first half of 2012 and 25 such drug reports in the first half of 2013. However, the number of cannabimimetic drug reports from relevant poison control system calls for Los Angeles County declined in 2013 from the previous year. Numbers of drug reports identified as cannabimimetics among seized items analyzed in NFLIS laboratories declined in Phoe-nix and Seattle in this reporting period, and levels were low in both areas for cannabimimetics relative to other drugs.
Midwestern Region: All five CEWG area representatives in the Midwest—Chicago, Cincinnati, Detroit, Min-neapolis/St. Paul, and St. Louis—reported on indicators for cannabimimetics in this reporting period. In the first half of 2013, available indicators for cannabimimetics were increasing in Chicago; they were mixed in Cincinnati; indicators were relatively stable in Detroit; and they were declining in the Minneapolis/St. Paul and St. Louis areas.
• The Chicago area representative reported an increase in the number of drug reports identified as cannabimimetics among items seized and analyzed in NFLIS laboratories from 2011 to the first half of 2013. The numbers of drug reports identified as cannabimimetics among analyzed items increased from 154 in the first half of 2012 to 189 in the first half of 2013.
• In Cincinnati, indicators for cannabimimetics were mixed in this reporting period. The area representative reported that cannabimimetics remained at a low level in the indicators relative to other drugs, but they showed variability across different data sources. The proportion of human exposure cases called in to poison control centers in the Cincinnati area decreased by approximately 38 percent for cannabimimetics in 2013 from the previous year. However, the number of cannabimimetic drug reports among seized and analyzed NFLIS items increased to 134 drug reports in the first half of 2013 from 10 drug reports in in the first half of 2012.
• In Detroit, the number of drug reports identified as cannabimimetics from items seized and analyzed by NFLIS laboratories for Wayne County and the State of Michigan were relatively stable in this reporting period. In Detroit (Wayne County), these numbers totaled 6 in the first half of 2012 and 7 in the first half of 2013; in Michigan, they totaled 31 and 35 the first halves of 2012 and 2013, respectively.
• Available indicators for cannabimimetics were declining in the Minneapolis/St. Paul area for this reporting period. Numbers of both cannabimimetic exposures reported to poison control centers and cannabimimetic drug reports among items analyzed by NFLIS laboratories decreased in the Twin Cities area. The Hennepin Regional Poison Center reported 157 in 2012 and 110 in 2013. Drug reports identified as cannabimimetics from law enforcement seizures analyzed by NFLIS laboratories declined from 40 to 32 drug reports from the first half of 2012 to the first half of 2013. Declines for cannabimimetics in this reporting period were also reported by the area representative from St. Louis. Numbers of exposure calls for cannabimimetics to poison control centers and numbers of drug reports among items seized and analyzed by NFLIS laboratories both declined from the previous reporting period. Numbers
32
CEWG Meeting Highlights and Summary
Proceedings of the Community Epidemiology Work Group, January 2014
of drug reports among items seized and analyzed in NFLIS laboratories decreased from 391 drug reports in the first half of 2012 to 180 drug reports in the first half of 2013.
Northeastern Region: Available indicators for cannabimimetics were reported to be very low relative to other drugs in the four CEWG areas in the Northeast. Two of the four CEWG area representatives in the Northeast— from Philadelphia and Maine—reported decreasing indicators for cannabimimetics for the first half of 2013.
• In Maine, numbers of drug reports for cannabimimetics among items seized and analyzed in NFLIS laboratories were very small in this reporting period, and they declined from just 11 drug reports to 5 drug reports between the first halves of 2012 to 2013. According to the area representative, cannabimimetics appeared rarely and at low levels relative to other drugs in current indicator data in Philadelphia. Available indicators were declining in this reporting period. Cannabimimetics constituted 0.2 percent of total drug reports (n=21 drug reports) among items analyzed by NFLIS in the first half of 2013, compared with 173 in the first half of 2012 (representing 1.3 percent of total drug reports).
Southern Region: Two of the three CEWG areas in the South—the Baltimore/Maryland/Washington, DC, and Miami-Dade and Broward Counties/South Florida areas—reported on indicators for cannabimimetics in this reporting period. Available indicators for cannabimimetics were mixed across the Baltimore/Maryland/Wash-ington, DC, area in the first half of 2013; they were declining in the Miami-Dade and Broward Counties/South Florida area.
• One of the key findings reported by the area representative from the Baltimore/Maryland/washington, DC, area for this reporting period was “the increase across the region in indicators for cannabimimetics in 2012, which appeared to be slowing or reversing in 2013 in Washington, DC, but continuing to increase in Baltimore City and Maryland.” Trends were mixed across the area. Numbers of drug reports identified as cannabimimetics among items seized and analyzed by NFLIS laboratories increased in the first half of 2013 from the first half of 2012 in both Baltimore City (from n=1 to n=23) and the State of Maryland (from n=478 to n=504); numbers of cannabimimetic drug reports declined, however, in Washington, DC, from 18 to 4 in the same time period.
• In the Miami MSA, the number of drug reports identified as cannabimimetics among seized items analyzed in NFLIS laboratories declined from 113 in the first half of 2012 to 75 in the first half of 2013.
Synthetic (Substituted) Cathinones Nine of 20 CEWG area representatives across all 4 regions reported on synthetic (substituted) cathinones for this reporting period. These included two area representatives in the western region (Los Angeles and Seattle); four CEWG area representatives in the Midwest (Cincinnati, Detroit, Minneapolis/St. Paul, and St. Louis); one CEWG areas in the Northeast (Maine); and two CEWG areas in the South (the Baltimore/Maryland/ Washington, DC, and Miami-Dade and Broward Counties/South Florida areas).
Western Region: Two of the eight CEWG area representatives in the western region, from Los Angeles and Seattle, reported increases in substituted cathinones among available indicators in their areas for the first half of 2013.
• In Los Angeles, the area representative reported slight increases in numbers of drug reports for substituted cathinones among items seized and analyzed in NFLIS laboratories, to 36 drug reports in the first half of 2013 from 19 drug reports in the first half of 2012. (slide 12; UB) (slide 12; UB; NFLIS tables for additional data) In Seattle, the area represented reported that methylone, a substituted cathinone, was identified in eight NFLIS reports in the first half of 2013 (an increase from three drug reports in the first half of 2012), and the substance may be in products sold as “ecstasy” or “Molly,” often in powder form.
Midwestern Region: Four of five CEWG area representatives in the Midwest—from Cincinnati, Detroit, Min-neapolis/St. Paul, and St. Louis—reported on indicators for substituted cathinones in this reporting period. In the first half of 2013, available indicators for substituted cathinones were increasing in Detroit; they were mixed in Cincinnati and Minneapolis/St. Paul; and they were declining in St. Louis.
• In Detroit, the area representative reported an increase in numbers of substituted cathinones among drug reports from items seized and analyzed by NFLIS laboratories in this reporting period. The numbers of substituted cathinones

33
CEWG Meeting Highlights and Summary
Proceedings of the Community Epidemiology Work Group, January 2014
among drug reports from analyzed items increased in both the State of Michigan (from n=44 in 2012 in the first half of 2012 to n=162 in the first 6 months of 2013) and Wayne County (from n=4 to n=16 from the first halves of 2012 to 2013).
• Available indicators for substituted cathinones were mixed in this reporting period in Cincinnati. The proportion of human exposure cases called in to poison control centers decreased by approximately 38 percent for substituted cathinones in 2013 from the previous year, but the number of drug reports for substituted cathinones among items seized and analyzed by NFLIS laboratories increased from 11 to 14 from the first half of 2012 to the first half of 2013. Indicators for substituted cathinones were similarly mixed in the Minneapolis/St. Paul area in this reporting period, with numbers of exposure calls to poison control centers for substituted cathinones declining in 2013 and numbers of drug reports identified as substituted cathinones increasing in the first half of 2013. Numbers of exposure calls for “bath salts” (substituted cathinones) reported to the Hennepin Regional Poison Center decreased from 144 calls in 2011, to 87 in 2012, and then to 50 in 2013. Numbers of drug reports for substituted cathinones from drug items seized by local law enforcement and analyzed by NFLIS laboratories in the Twin Cities increased very slightly to 43 drug reports in the first half of 2013 in Minneapolis/St. Paul from 41 drug reports in the first half of 2012.
• In St Louis, indicators for substituted cathinones appeared to be declining in this reporting period. In addition to decreases in the number of exposure calls for substituted cathinones to poison control centers, the number of drug reports identified as substituted cathinones among items seized and analyzed in NLFIS laboratories decreased from 129 in the first half of 2012 to 85 in the first half of 2013.
Northeastern Region: Only one area representative in the Northeast, from Maine, reported indicators for sub-stituted cathinones in this reporting period; indicators for substituted cathinones were mixed in the State in the first half of 2013.
• In Maine, indicators for substituted cathinones were mixed in this reporting period, with some declining and some increasing. Numbers and proportions of drug reports for substituted cathinones among drug items seized by law enforcement and analyzed by the NFLIS forensic laboratories increased in the first half of 2013. Alpha-PVP was included for the first time in the top 10 list of drug reports in the first half of 2013 (ranking fifth, with 4.3 percent of total drug reports), but MDPV was no longer in the top 10 list of drugs (MDPV had ranked sixth, with 3.4 percent of total drug reports, in the first half of 2012). Among impaired drivers tested, approximately 6 percent of urinalyses tested positive for alpha-PVP and MDPV in 2012; this proportion declined to approximately 2 percent in 2013. Maine drug arrests for substituted cathinones increased to approximately 9 percent of total drug arrests in 2013 from approximately 6 percent of drug arrests in 2012. In the first half of 2013, there were 47 drug items identified as substituted cathinones among drug reports analyzed in Maine by NFLIS laboratories; this was an increase from 38 such drug reports in the first half of 2012.
Two of the three CEWG areas in the South—the Baltimore/Maryland/Washington, DC, and Miami-Dade and Broward Counties/South Florida areas—reported on indicators for substituted cathinones in this reporting period. Indicators for substituted cathinones were mixed across the Baltimore/Maryland/Washington, DC, area in the first half of 2013; they were increasing in the Miami-Dade and Broward Counties/South Florida area.
• Similar to the mixed trends in this reporting period for cannabimimetics, drug reports for substituted cathinones among items seized and analyzed by NFLIS laboratories increased in both Baltimore City and Maryland and decreased in washington, DC, from the first half of 2012 to the first half of 2013. The numbers of drug reports identified as substituted cathinones among items seized and analyzed by NFLIS laboratories increased in the first half of 2013 from the first half of 2012 in both Baltimore City (from n=40 to n=105) and the State of Maryland (from n=217 to n=237); numbers of substituted cathinone drug reports declined, however, in Washington, DC, from 65 in the first half of 2012 to 38 in the first half of 2013.
• In the Miami-Dade and Broward Counties/South Florida area, the CEWG representative reported a “substantial (nearly 300-percent) increase in the first half of 2013 from the first half of 2012 in drug reports for the synthetic cathinone, methylone, sold as ‘Mollys,’ among drug reports from seized items analyzed by NFLIS laboratories” as a key finding for this reporting period. Numbers of drug reports for all substituted cathinones combined increased in the Miami MSA from 217 drug reports among seized items analyzed by NFLIS in the first half of 2012 to 646 drug reports in the first half of 2013.
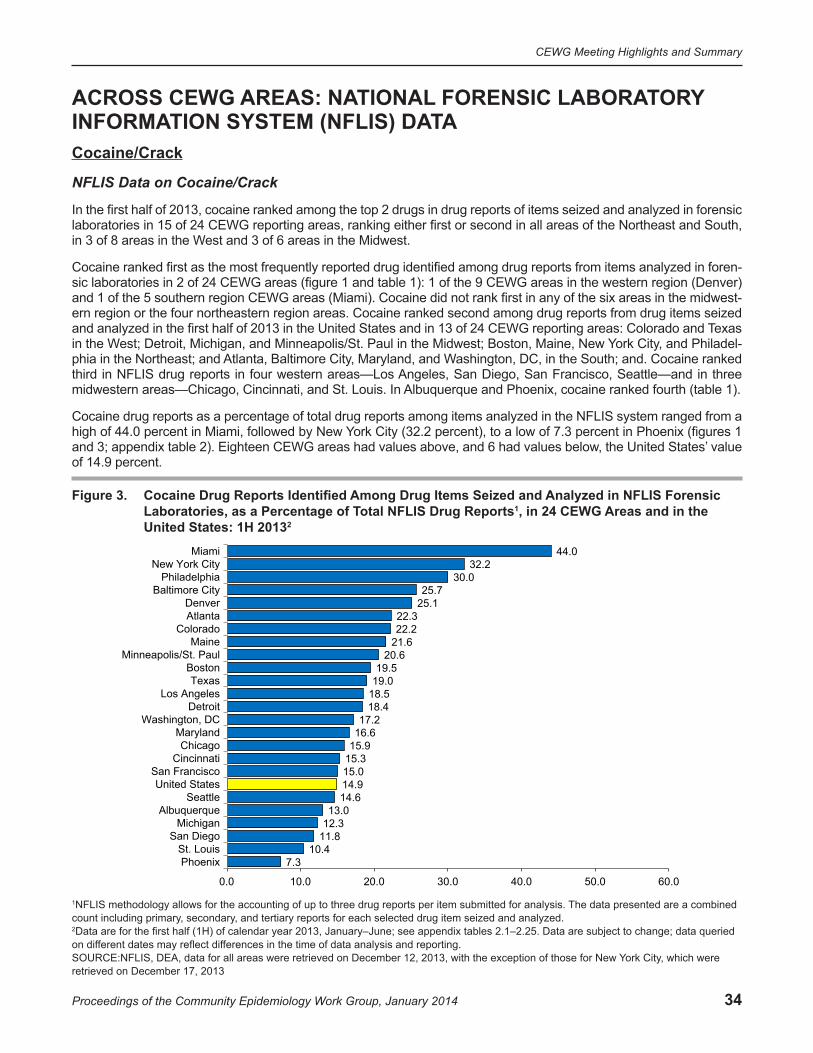
34
CEWG Meeting Highlights and Summary
Proceedings of the Community Epidemiology Work Group, January 2014
ACROSS CEWG AREAS: NATIONAL FORENSIC LABORATORY INFORMATION SYSTEM (NFLIS) DATA Cocaine/Crack
NFLIS Data on Cocaine/Crack
In the first half of 2013, cocaine ranked among the top 2 drugs in drug reports of items seized and analyzed in forensic laboratories in 15 of 24 CEWG reporting areas, ranking either first or second in all areas of the Northeast and South, in 3 of 8 areas in the West and 3 of 6 areas in the Midwest.
Cocaine ranked first as the most frequently reported drug identified among drug reports from items analyzed in foren-sic laboratories in 2 of 24 CEWG areas (figure 1 and table 1): 1 of the 9 CEWG areas in the western region (Denver) and 1 of the 5 southern region CEWG areas (Miami). Cocaine did not rank first in any of the six areas in the midwest-ern region or the four northeastern region areas. Cocaine ranked second among drug reports from drug items seized and analyzed in the first half of 2013 in the United States and in 13 of 24 CEWG reporting areas: Colorado and Texas in the West; Detroit, Michigan, and Minneapolis/St. Paul in the Midwest; Boston, Maine, New York City, and Philadel-phia in the Northeast; and Atlanta, Baltimore City, Maryland, and Washington, DC, in the South; and. Cocaine ranked third in NFLIS drug reports in four western areas—Los Angeles, San Diego, San Francisco, Seattle—and in three midwestern areas—Chicago, Cincinnati, and St. Louis. In Albuquerque and Phoenix, cocaine ranked fourth (table 1).
Cocaine drug reports as a percentage of total drug reports among items analyzed in the NFLIS system ranged from a high of 44.0 percent in Miami, followed by New York City (32.2 percent), to a low of 7.3 percent in Phoenix (figures 1 and 3; appendix table 2). Eighteen CEWG areas had values above, and 6 had values below, the United States’ value of 14.9 percent.
Figure 3. Cocaine Drug Reports Identified Among Drug Items Seized and Analyzed in NFLIS Forensic Laboratories, as a Percentage of Total NFLIS Drug Reports1, in 24 CEWG Areas and in the United States: 1H 20132
7.310.4
11.812.313.0
14.614.915.015.315.916.617.2
18.418.519.019.5
20.621.622.222.3
25.125.7
30.032.2
44.0
0.0 10.0 20.0 30.0 40.0 50.0 60.0
PhoenixSt. Louis
San DiegoMichigan
AlbuquerqueSeattle
United StatesSan Francisco
CincinnatiChicago
MarylandWashington, DC
DetroitLos Angeles
TexasBoston
Minneapolis/St. PaulMaine
ColoradoAtlantaDenver
Baltimore CityPhiladelphia
New York CityMiami
1NFLIS methodology allows for the accounting of up to three drug reports per item submitted for analysis. The data presented are a combined count including primary, secondary, and tertiary reports for each selected drug item seized and analyzed.2Data are for the first half (1H) of calendar year 2013, January–June; see appendix tables 2.1–2.25. Data are subject to change; data queried on different dates may reflect differences in the time of data analysis and reporting.SOURCE:NFLIS, DEA, data for all areas were retrieved on December 12, 2013, with the exception of those for New York City, which were retrieved on December 17, 2013

35
CEWG Meeting Highlights and Summary
Proceedings of the Community Epidemiology Work Group, January 2014
Heroin
NFLIS Data on Heroin
Heroin ranked as the most frequently identified drug among NFLIS drug reports in 2 of 24 CEWG areas reporting in the first half of 2013; these were Seattle in the West and Maine in the Northeast (table 1). Heroin placed second in the rankings of drug reports in three CEWG reporting areas in the Midwest—Chicago, Cincinnati, and St. Louis. It ranked third in 11 of 24 areas: 3 of the 9 reporting areas in the West (Albuquerque, Denver, and Phoenix); 3 of 6 areas in the Midwest (Detroit, Michigan, and Minneapolis/St. Paul); 3 of 4 northeastern areas (Boston, New York City, and Phila-delphia); and 2 of 5 southern CEWG areas (Baltimore City and Maryland). It ranked fourth in the United States and in another six CEWG areas—Colorado, Los Angeles, San Diego, San Francisco, and Texas in the western region and Atlanta in the southern region (table 1).
In 7 of the 24 CEWG areas shown on the map in figure 1, heroin items accounted for less than 10.0 percent of the drug reports from drug items seized and analyzed in forensic laboratories in the first half of 2013. As a proportion of total drug reports, heroin reports were highest in Cincinnati (at 28.9 percent), compared with other CEWG areas. Heroin drug reports were lowest in Miami (3.3 percent) (figure 4; appendix table 2). Seven areas had values below the United States average of 9.9 percent, and 17 areas had higher proportions of drug reports for heroin.
Figure 4. Heroin Drug Reports Identified Among Drug Items Seized and Analyzed in NFLIS Forensic Laboratories, as a Percentage of Total NFLIS Drug Reports1, in 24 CEWG Areas and in the United States: 1H 20132
3.34.24.55.1
6.36.4
8.59.910.6
11.611.712.413.213.814.415.115.416.116.3
19.421.222.022.122.6
28.9
0.0 10.0 20.0 30.0 40.0 50.0 60.0
MiamiTexas
AtlantaWashington, DC
Los AngelesSan Francisco
MichiganUnited States
Minneapolis/St. PaulNew York City
San DiegoColorado
DetroitMaryland
PhiladelphiaBostonDenver
St. LouisPhoenixChicago
AlbuquerqueMaine
Baltimore CitySeattle
Cincinnati
1NFLIS methodology allows for the accounting of up to three drug reports per item submitted for analysis. The data presented are a combined count including primary, secondary, and tertiary reports for each selected drug item seized and analyzed.2Data are for the first half (1H) of calendar year 2013, January–June; see appendix tables 2.1–2.25. Data are subject to change; data queried on different dates may reflect differences in the time of data analysis and reporting.SOURCE: NFLIS, DEA, data for all areas were retrieved on December 12, 2013, with the exception of those for New York City, which were retrieved on December 17, 2013

36
CEWG Meeting Highlights and Summary
Proceedings of the Community Epidemiology Work Group, January 2014
Prescription Opioids
NFLIS Data on Prescription Opioids
Of the drug reports for prescription opioids among drug items seized and analyzed by forensic laboratories across CEWG areas in the first half of 2013, oxycodone and hydrocodone were the two most frequently reported in most areas. However, neither drug accounted for more than 9.2 percent of total drug reports in any area (the proportion for oxycodone in Maine). In most areas (16 of 24 areas for oxycodone and 18 of 24 areas for hydrocodone), they accounted for less than 3.0 percent of total drug reports in the first half of 2013. Oxycodone and hydrocodone rep-resented less than 1.0 percent of drug reports in 5 and 11 areas, respectively, in this reporting period. For the United States, 3.2 percent of total drug reports were for oxycodone (with 16 areas below the U.S. average and 8 above), and 2.5 percent were for hydrocodone (with 17 areas below and 7 above the average for the United States) (figures 5 and 6; appendix table 2).
Oxycodone. Oxycodone ranked among the top 10 drug reports in drug items identified in NFLIS laboratories in 21 of 24 CEWG areas and in the United States in the first half of 2013. Oxycodone ranked third among NFLIS drug reports in two areas, Atlanta and Maine. Oxycodone ranked fourth among identified drug reports in six CEWG areas (Baltimore City, Boston, Cincinnati, Maryland, New York City, and Philadelphia), and it ranked fifth in Albuquerque, Colorado, Phoenix, Seattle, and in the United States (table 1; appendix table 2). Maine reported the highest percent-age of oxycodone reports among drug items seized and analyzed in forensic laboratories in the first half of 2013 (at 9.2 percent), followed distantly by Boston (6.3 percent) (table 2; figure 5).
Hydrocodone. Hydrocodone ranked among the top 10 NLFIS drug reports in 17 of 24 CEWG areas and the United States in the first half of 2013. It ranked fourth among NFLIS drug reports in three areas of the Midwest—Chicago, Detroit, and Michigan—and fifth among drug reports in Los Angeles, San Diego, San Francisco, and Texas in the West. Hydrocodone ranked sixth in Cincinnati, St. Louis, Seattle, and in the United States (table 1; appendix table 2). The highest percentage of hydrocodone drug reports was in Michigan, at 4.2 percent, followed by San Francisco, at 3.8 percent; the lowest percentages were in Washington, DC, and Baltimore City, at 0.2 percent each (table 2; figure 6).
Buprenorphine. Based on ranking of drug reports in the NFLIS system, buprenorphine was among the top 10 drugs identified in 7 of 24 areas and in the United States. It ranked 5th among identified drugs in Boston, 6th in Baltimore City and Maryland, 7th in New York City, 8th in Phoenix, 9th in Maine, and 10th in Philadelphia and in the United States (table 1; appendix table 2). Buprenorphine was identified among NFLIS drug reports in all 24 reporting CEWG areas in the first half of 2013. The drug was identified in at least 1.0 percent of drug items analyzed in six CEWG areas; these were Baltimore City (1.2 percent), Boston (2.1 percent), Maine (2.4 percent), Maryland (1.3 percent), New York City (1.7 percent), and Phoenix (1.4 percent) (table 2).
Methadone. Methadone ranked among the top 10 drug reports for the first half of 2013 in 5 of 24 CEWG areas, plac-ing 7th among identified drugs in drug reports in San Francisco, 8th in New York City, 9th in Seattle, and 10th each in Baltimore City and Michigan during this reporting period (table 1; appendix table 2). While methadone drug reports appeared in the NFLIS system in all but 1 of the 24 CEWG areas in the first half of 2013 (the exception was Washing-ton, DC), it was reported at a percentage of 1.0 or higher in only 4 areas—Maine, New York City, San Francisco, and Seattle—at 1.0, 1.4, 1.1, and 1.3 percent, respectively (table 2).
Codeine. Codeine appeared in the top 10 NFLIS drug reports in two CEWG areas, ranking 9th in Philadelphia and 10th in Los Angeles among total drug reports of drug items seized and identified in forensic laboratories in the first half of 2013. It did not appear in the top 10 rankings for the United States. Codeine was reported among drug reports in all areas with the exception of Maine, but the drug did not exceed 1.0 percent of the total drug reports in any area or in the Nation in this reporting period (table 2).
Fentanyl. Fentanyl did not rank in the top 10 among NFLIS drug items identified in any CEWG areas or in the United States in the first half of 2013 (table 1; appendix table 2). Fentanyl was identified in drug reports in 19 of 24 areas in the first half of 2013; however, no CEWG areas had fentanyl reports equal to or exceeding 1.0 percent (table 2).
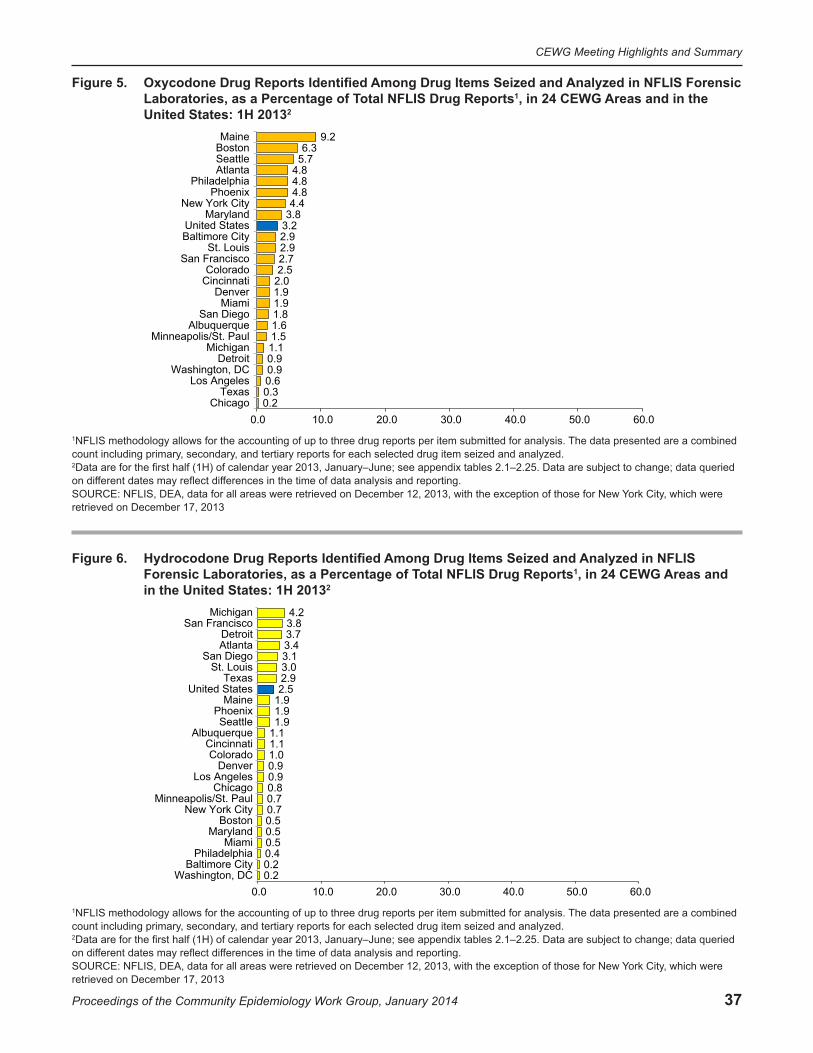
37
CEWG Meeting Highlights and Summary
Proceedings of the Community Epidemiology Work Group, January 2014
Figure 5. Oxycodone Drug Reports Identified Among Drug Items Seized and Analyzed in NFLIS Forensic Laboratories, as a Percentage of Total NFLIS Drug Reports1, in 24 CEWG Areas and in the United States: 1H 20132
0.20.30.60.90.91.11.51.61.81.91.92.02.52.72.92.93.23.84.44.84.84.85.76.3
9.2
0.0 10.0 20.0 30.0 40.0 50.0 60.0Chicago
TexasLos Angeles
Washington, DCDetroit
MichiganMinneapolis/St. Paul
AlbuquerqueSan Diego
MiamiDenver
CincinnatiColorado
San FranciscoSt. Louis
Baltimore CityUnited States
MarylandNew York City
PhoenixPhiladelphia
AtlantaSeattleBostonMaine
1NFLIS methodology allows for the accounting of up to three drug reports per item submitted for analysis. The data presented are a combined count including primary, secondary, and tertiary reports for each selected drug item seized and analyzed.2Data are for the first half (1H) of calendar year 2013, January–June; see appendix tables 2.1–2.25. Data are subject to change; data queried on different dates may reflect differences in the time of data analysis and reporting.SOURCE: NFLIS, DEA, data for all areas were retrieved on December 12, 2013, with the exception of those for New York City, which were retrieved on December 17, 2013
Figure 6. Hydrocodone Drug Reports Identified Among Drug Items Seized and Analyzed in NFLIS Forensic Laboratories, as a Percentage of Total NFLIS Drug Reports1, in 24 CEWG Areas and in the United States: 1H 20132
0.20.20.40.50.50.50.70.70.80.90.91.01.11.11.91.91.92.52.93.03.13.43.73.84.2
0.0 10.0 20.0 30.0 40.0 50.0 60.0Washington, DC
Baltimore CityPhiladelphia
MiamiMaryland
BostonNew York City
Minneapolis/St. PaulChicago
Los AngelesDenver
ColoradoCincinnati
AlbuquerqueSeattle
PhoenixMaine
United StatesTexas
St. LouisSan Diego
AtlantaDetroit
San FranciscoMichigan
1NFLIS methodology allows for the accounting of up to three drug reports per item submitted for analysis. The data presented are a combined count including primary, secondary, and tertiary reports for each selected drug item seized and analyzed.2Data are for the first half (1H) of calendar year 2013, January–June; see appendix tables 2.1–2.25. Data are subject to change; data queried on different dates may reflect differences in the time of data analysis and reporting.SOURCE: NFLIS, DEA, data for all areas were retrieved on December 12, 2013, with the exception of those for New York City, which were retrieved on December 17, 2013

38
CEWG Meeting Highlights and Summary
Proceedings of the Community Epidemiology Work Group, January 2014
2A
naly
zed
in N
FLIS
ot
al N
FLIS
Rep
orts
Iden
tified
: 1H
201
3A
mon
g D
rug
Item
s Se
ized
and
Id
entifi
ed
1A
nalg
esic
Rep
orts
Are
as a
nd in
the
Uni
ted
Stat
es, a
s a
Perc
enta
ge o
f TN
umbe
r and
Per
cent
age
of S
elec
ted
Nar
cotic
Fo
rens
ic L
abor
ator
ies
in 2
4 C
EWG
Tabl
e 2.
CEW
G A
rea
Oxy
codo
neH
ydro
codo
neB
upre
norp
hine
Mor
phin
eM
etha
done
Cod
eine
Fent
anyl
otal
T
Rep
orts
#%
#%
#%
#%
#%
#%
#%
Alb
uque
rque
161.
611
1.1
20.
25
0.5
30.
32
0.2
——
1,02
8A
tlant
a38
34.
827
03.
429
0.4
500.
641
0.5
180.
24
0.1
7,97
2B
altim
ore
City
438
2.9
360.
218
31.
222
0.1
530.
315
0.1
——
15,2
66B
osto
n19
46.
314
0.5
652.
15
0.2
90.
32
0.1
10.
03,
077
Chi
cago
590.
230
00.
834
0.1
390.
154
0.2
740.
21
0.0
35,7
97C
inci
nnat
i12
72.
068
1.1
370.
622
0.3
200.
310
0.2
50.
16,
293
Col
orad
o16
72.
569
1.0
180.
332
0.5
80.
13
0.0
40.
16,
639
Den
ver
911.
945
0.9
90.
224
0.5
50.
13
0.1
40.
14,
749
Det
roit
380.
914
93.
711
0.3
140.
39
0.2
120.
32
0.0
4,01
9A
ngel
esLo
s 11
10.
618
20.
912
0.1
300.
231
0.2
920.
51
0.0
19,4
51M
aine
649.
213
1.9
172.
43
0.4
71.
0—
——
—69
6M
aryl
and
1,41
53.
818
20.
550
21.
395
0.3
175
0.5
520.
111
0.0
37,5
11M
iam
i22
91.
962
0.5
180.
225
0.2
140.
16
0.1
——
11,9
29M
ichi
gan
195
1.1
733
4.2
911
0.7
212
1.2
137
0.8
720.
414
0.1
17,4
91M
inne
apol
is/S
t. P
aul
361.
516
0.7
90.
421
0.9
170.
77
0.3
40.
22,
343
York
City
New
1,
094
4.4
161
0.7
418
1.7
350.
135
81.
410
00.
43
0.0
24,7
27P
hila
delp
hia
618
4.8
530.
467
0.5
180.
128
0.2
770.
62
0.0
12,9
46P
hoen
ix21
74.
887
1.9
631.
432
0.7
150.
313
0.3
20.
04,
504
St.
Loui
s24
02.
924
63.
067
0.8
470.
635
0.4
250.
32
0.0
8,27
6S
an D
iego
107
1.8
187
3.1
380.
649
0.8
170.
326
0.4
30.
06,
103
San
Fra
ncis
co21
62.
730
33.
828
0.3
871.
189
1.1
550.
75
0.1
8,01
7S
eattl
e48
5.7
161.
94
0.5
10.
111
1.3
10.
13
0.4
845
Texa
s10
30.
396
92.
923
0.1
770.
287
0.3
211
0.3
10.
032
,886
Was
hing
ton,
DC
180.
93
0.2
110.
61
0.1
——
40.
2—
—1,
914
Uni
ted
Sta
tes
21,3
433.
216
,872
2.5
5,07
10.
83,
957
0.6
2,74
80.
41,
335
0.2
350
0.1
666,
425
, and
Th
e da
ta p
rese
nted
are
a c
ombi
ned
coun
t inc
ludi
ng p
rimar
y, s
econ
dary
fere
nces
in th
e tim
e of
dat
a an
alys
is a
nd
, whi
ch w
ere
retri
eved
on
ork
City
Y
fere
nt d
ates
may
refle
ct d
if
per
item
sub
mitt
ed fo
r ana
lysi
s.
e su
bjec
t to
chan
ge; d
ata
quer
ied
on d
if
NFL
IS m
etho
dolo
gy a
llow
s fo
r the
acc
ount
ing
of u
p to
thre
e dr
ug re
ports
terti
ary
repo
rts fo
r eac
h dr
ug it
em s
eize
d an
d an
alyz
ed.
Dat
a ar
e fo
r Jan
uary
–Jun
e 20
13; s
ee a
ppen
dix
tabl
es 2
.1–2
.25.
Dat
a ar
1 2 repo
rting
.S
OU
RC
E: N
FLIS
, DE
A, d
ata
for a
ll ar
eas
and
the
Uni
ted
Sta
tes
wer
e re
triev
ed o
n D
ecem
ber 1
2, 2
013,
with
the
exce
ptio
n of
thos
e fo
r New
D
ecem
ber 1
7, 2
013

39
CEWG Meeting Highlights and Summary
Proceedings of the Community Epidemiology Work Group, January 2014
Benzodiazepines
NFLIS Data on Benzodiazepines
Alprazolam, clonazepam, and diazepam were the most frequently reported benzodiazepines identified in drug reports among items seized and analyzed by forensic laboratories in 24 CEWG areas in the first half of 2013. Table 3 shows the numbers and percentages of drug reports containing alprazolam, clonazepam, and diazepam in each of the CEWG reporting areas.
Alprazolam. In the 24 CEWG areas for which NFLIS data were reported for the first half of 2013, the highest per-centages of alprazolam drug reports among items seized and analyzed were in Philadelphia (4.7 percent), followed by New York City (4.3 percent) and Atlanta (4.2 percent). Alprazolam drug reports represented 1.0–4.0 percent of total drug reports in 15 areas—Albuquerque, Baltimore City, Boston, Cincinnati, Colorado, Denver, Detroit, Maryland, Miami, Michigan, Phoenix, St. Louis, San Diego, Seattle, and Texas—and less than 1.0 percent in the remaining 6 reporting CEWG areas—Chicago, Los Angeles, Maine, Minneapolis/St. Paul, San Francisco, and Washington, DC (table 3; figure 7). The value for the United States was 2.3 percent. Alprazolam ranked among the top 10 drug reports in 21 of 24 CEWG reporting areas and in the United States. The drug ranked fifth in frequency among the top 10 drug reports among items analyzed by NFLIS laboratories in Atlanta, Baltimore City, Detroit, Maryland, New York City, Philadelphia, St. Louis, and Texas. Alprazolam ranked sixth in Albuquerque, Chicago, Miami, Michigan, Phoenix, and San Diego, and seventh in the United States in the reporting period (table 1; appendix table 2).
Clonazepam. Clonazepam was identified in drug reports in all 24 CEWG areas. As shown in table 1, in which the rankings of the most frequently reported drugs in NFLIS data for the first half of 2013 are listed, clonazepam ranked among the top 10 drug reports in 9 CEWG reporting areas, but not in the United States as a whole. It ranked seventh in
Figure 7. Alprazolam Drug Reports Identified Among Drug Items Seized and Analyzed in NFLIS Forensic Laboratories, as a Percentage of Total NFLIS Drug Reports1, in 24 CEWG Areas and in the United States: 1H 20132
0.20.70.80.80.80.91.01.01.01.11.41.51.81.81.82.12.32.52.82.93.23.74.24.34.7
0.0 10.0 20.0 30.0 40.0 50.0 60.0Washington DC
ChicagoSan Francisco
Minneapolis/St. PaulLos Angeles
MaineDenver
CincinnatiBoston
ColoradoAlbuquerque
Baltimore CitySeattle
San DiegoMarylandMichigan
United StatesDetroit
PhoenixTexasMiami
St. LouisAtlanta
New York CityPhiladelphia
1NFLIS methodology allows for the accounting of up to three drug reports per item submitted for analysis. The data presented are a combined count including primary, secondary, and tertiary reports for each selected drug item seized and analyzed.2Data are for the first half (1H) of calendar year 2013, January–June; see appendix tables 2.1–2.25. Data are subject to change; data queried on different dates may reflect differences in the time of data analysis and reporting.SOURCE: NFLIS, DEA, data for all areas were retrieved on December 12, 2013, with the exception of those for New York City, which were retrieved on December 17, 2013

40
CEWG Meeting Highlights and Summary
Proceedings of the Community Epidemiology Work Group, January 2014
frequency among drug reports in Boston and eighth in Philadelphia. Reports of clonazepam accounted for 1.6 percent of all drug reports among drug items analyzed by NFLIS laboratories in Boston. Its presence was minimal (less than 1.0 percent of the total) in most of the other CEWG areas and in the United States, with the exception of New York City (1.4 percent), Phoenix (1.0 percent), and Seattle (1.2 percent) (table 3).
Diazepam. While reported in all 24 CEWG areas, diazepam accounted for less than 1.0 percent of all drug reports in all CEWG areas and in the United States (table 3). Diazepam did not rank in the top 10 among drug reports in items identified in NFLIS forensic laboratories in any area in the United States in the first half of 2013 (table 1).
Table 3. Number of Selected Benzodiazepine Reports Identified by Forensic Laboratories in 24 CEWG Areas and in the United States, by Number and Percentage of Total Reports1 Identified: 1H 20132
CEWG AreaAlprazolam Clonazepam Diazepam Total
Reports# (%) # (%) # (%)Albuquerque 14 1.4 2 0.2 1 0.1 1,028Atlanta 338 4.2 49 0.6 19 0.2 7,972Baltimore City 236 1.5 63 0.4 8 0.1 15,266Boston 32 1.0 49 1.6 10 0.3 3,077Chicago 263 0.7 61 0.2 26 0.1 35,797Cincinnati 61 1.0 36 0.6 19 0.3 6,293Colorado 75 1.1 42 0.6 34 0.5 6,639Denver 46 1.0 32 0.7 20 0.4 4,749Detroit 102 2.5 6 0.1 7 0.2 4,019Los Angeles 161 0.8 27 0.1 23 0.1 19,451Maine 6 0.9 4 0.6 1 0.1 696Maryland 689 1.8 190 0.5 70 0.2 37,511Miami 378 3.2 18 0.2 19 0.2 11,929Michigan 369 2.1 76 0.4 60 0.3 17,491Minneapolis/St. Paul 19 0.8 12 0.5 5 0.2 2,343New York City 1,071 4.3 341 1.4 59 0.2 24,727Philadelphia 612 4.7 115 0.9 32 0.2 12,946Phoenix 127 2.8 46 1.0 27 0.6 4,504St. Louis 309 3.7 56 0.7 53 0.6 8,276San Diego 112 1.8 54 0.9 38 0.6 6,103San Francisco 62 0.8 59 0.7 60 0.7 8,017Seattle 15 1.8 10 1.2 2 0.2 845Texas 969 2.9 140 0.4 75 0.2 32,886Washington, DC 3 0.2 4 0.2 1 0.1 1,914United States3 15,336 2.3 4,698 0.7 2,568 0.4 666,425
1NFLIS methodology allows for the accounting of up to three drug reports per item submitted for analysis. The data presented are a combined count including primary, secondary, and tertiary reports for each drug item seized and analyzed.2Data are for January–June 2013; see appendix tables 2.1–2.25. Data are subject to change; data queried on different dates may reflect differences in the time of data analysis and reporting.3“Benzodiazepine” accounted for 36 reports in the United States.SOURCE: NFLIS, DEA, data for all areas and the United States were retrieved on December 12, 2013, with the exception of those for New York City, which were retrieved on December 17, 2013
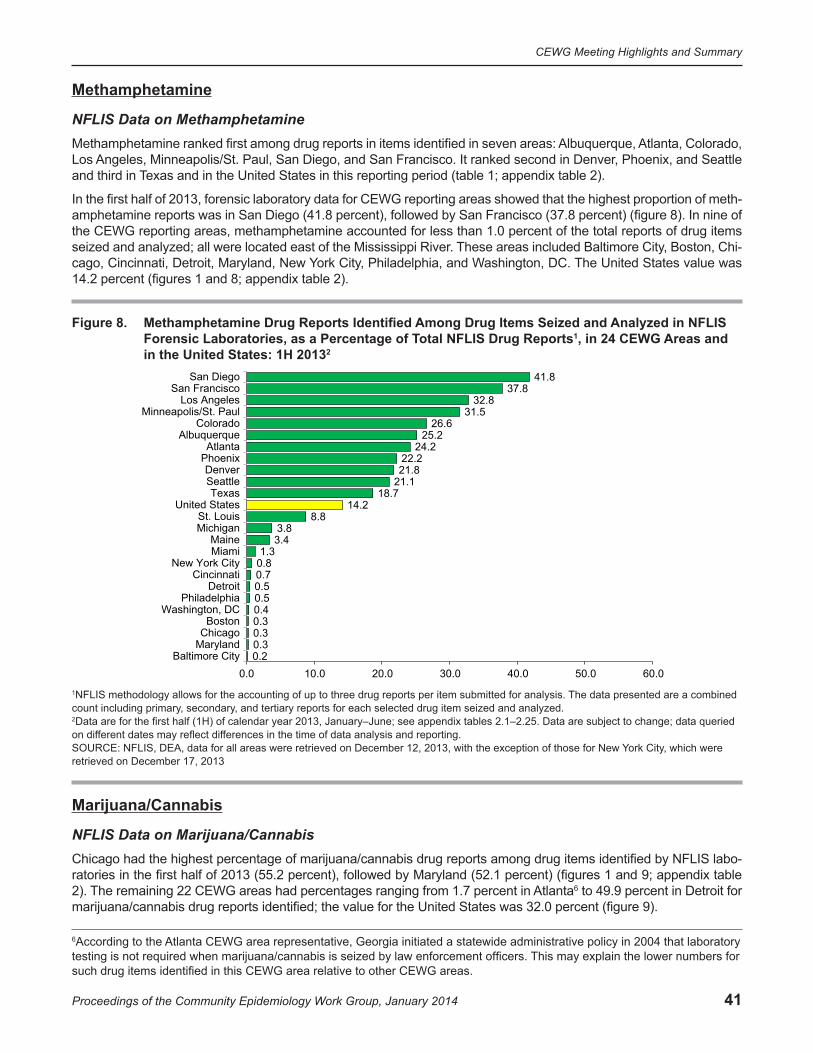
41
CEWG Meeting Highlights and Summary
Proceedings of the Community Epidemiology Work Group, January 2014
Methamphetamine
NFLIS Data on MethamphetamineMethamphetamine ranked first among drug reports in items identified in seven areas: Albuquerque, Atlanta, Colorado, Los Angeles, Minneapolis/St. Paul, San Diego, and San Francisco. It ranked second in Denver, Phoenix, and Seattle and third in Texas and in the United States in this reporting period (table 1; appendix table 2).
In the first half of 2013, forensic laboratory data for CEWG reporting areas showed that the highest proportion of meth-amphetamine reports was in San Diego (41.8 percent), followed by San Francisco (37.8 percent) (figure 8). In nine of the CEWG reporting areas, methamphetamine accounted for less than 1.0 percent of the total reports of drug items seized and analyzed; all were located east of the Mississippi River. These areas included Baltimore City, Boston, Chi-cago, Cincinnati, Detroit, Maryland, New York City, Philadelphia, and Washington, DC. The United States value was 14.2 percent (figures 1 and 8; appendix table 2).
Figure 8. Methamphetamine Drug Reports Identified Among Drug Items Seized and Analyzed in NFLIS Forensic Laboratories, as a Percentage of Total NFLIS Drug Reports1, in 24 CEWG Areas and in the United States: 1H 20132
0.20.30.30.30.40.50.50.70.81.3
3.43.8
8.814.2
18.721.121.822.2
24.225.2
26.631.5
32.837.8
41.8
0.0 10.0 20.0 30.0 40.0 50.0 60.0Baltimore City
MarylandChicagoBoston
Washington, DCPhiladelphia
DetroitCincinnati
New York CityMiamiMaine
MichiganSt. Louis
United StatesTexas
SeattleDenver
PhoenixAtlanta
AlbuquerqueColorado
Minneapolis/St. PaulLos Angeles
San FranciscoSan Diego
1NFLIS methodology allows for the accounting of up to three drug reports per item submitted for analysis. The data presented are a combined count including primary, secondary, and tertiary reports for each selected drug item seized and analyzed.2Data are for the first half (1H) of calendar year 2013, January–June; see appendix tables 2.1–2.25. Data are subject to change; data queried on different dates may reflect differences in the time of data analysis and reporting.SOURCE: NFLIS, DEA, data for all areas were retrieved on December 12, 2013, with the exception of those for New York City, which were retrieved on December 17, 2013
Marijuana/Cannabis
NFLIS Data on Marijuana/CannabisChicago had the highest percentage of marijuana/cannabis drug reports among drug items identified by NFLIS labo-ratories in the first half of 2013 (55.2 percent), followed by Maryland (52.1 percent) (figures 1 and 9; appendix table 2). The remaining 22 CEWG areas had percentages ranging from 1.7 percent in Atlanta6 to 49.9 percent in Detroit for marijuana/cannabis drug reports identified; the value for the United States was 32.0 percent (figure 9).
6According to the Atlanta CEWG area representative, Georgia initiated a statewide administrative policy in 2004 that laboratory testing is not required when marijuana/cannabis is seized by law enforcement officers. This may explain the lower numbers for such drug items identified in this CEWG area relative to other CEWG areas.
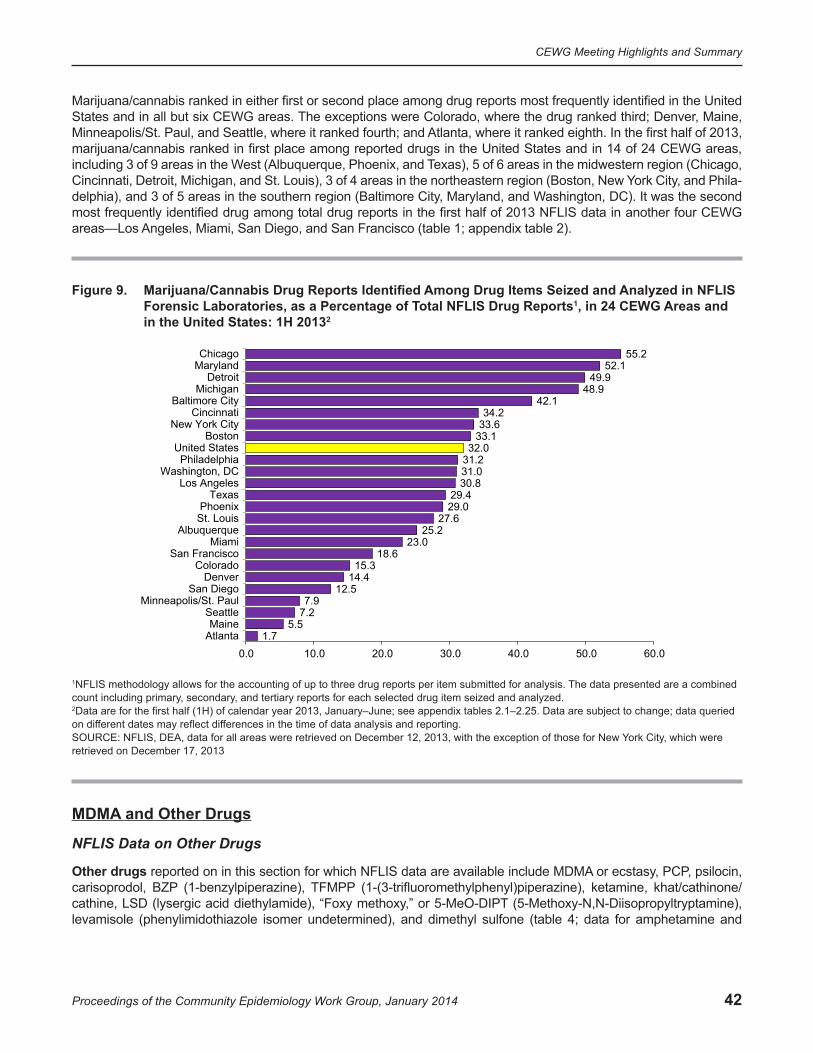
42
CEWG Meeting Highlights and Summary
Proceedings of the Community Epidemiology Work Group, January 2014
Marijuana/cannabis ranked in either first or second place among drug reports most frequently identified in the United States and in all but six CEWG areas. The exceptions were Colorado, where the drug ranked third; Denver, Maine, Minneapolis/St. Paul, and Seattle, where it ranked fourth; and Atlanta, where it ranked eighth. In the first half of 2013, marijuana/cannabis ranked in first place among reported drugs in the United States and in 14 of 24 CEWG areas, including 3 of 9 areas in the West (Albuquerque, Phoenix, and Texas), 5 of 6 areas in the midwestern region (Chicago, Cincinnati, Detroit, Michigan, and St. Louis), 3 of 4 areas in the northeastern region (Boston, New York City, and Phila-delphia), and 3 of 5 areas in the southern region (Baltimore City, Maryland, and Washington, DC). It was the second most frequently identified drug among total drug reports in the first half of 2013 NFLIS data in another four CEWG areas—Los Angeles, Miami, San Diego, and San Francisco (table 1; appendix table 2).
Figure 9. Marijuana/Cannabis Drug Reports Identified Among Drug Items Seized and Analyzed in NFLIS Forensic Laboratories, as a Percentage of Total NFLIS Drug Reports1, in 24 CEWG Areas and in the United States: 1H 20132
1.75.5
7.27.9
12.514.4
15.318.6
23.025.2
27.629.029.4
30.831.031.232.0
33.133.634.2
42.148.9
49.952.1
55.2
0.0 10.0 20.0 30.0 40.0 50.0 60.0AtlantaMaine
SeattleMinneapolis/St. Paul
San DiegoDenver
ColoradoSan Francisco
MiamiAlbuquerque
St. LouisPhoenix
TexasLos Angeles
Washington, DCPhiladelphia
United StatesBoston
New York CityCincinnati
Baltimore CityMichigan
DetroitMarylandChicago
1NFLIS methodology allows for the accounting of up to three drug reports per item submitted for analysis. The data presented are a combined count including primary, secondary, and tertiary reports for each selected drug item seized and analyzed.2Data are for the first half (1H) of calendar year 2013, January–June; see appendix tables 2.1–2.25. Data are subject to change; data queried on different dates may reflect differences in the time of data analysis and reporting.SOURCE: NFLIS, DEA, data for all areas were retrieved on December 12, 2013, with the exception of those for New York City, which were retrieved on December 17, 2013
MDMA and Other Drugs
NFLIS Data on Other Drugs
Other drugs reported on in this section for which NFLIS data are available include MDMA or ecstasy, PCP, psilocin, carisoprodol, BZP (1-benzylpiperazine), TFMPP (1-(3-trifluoromethylphenyl)piperazine), ketamine, khat/cathinone/cathine, LSD (lysergic acid diethylamide), “Foxy methoxy,” or 5-MeO-DIPT (5-Methoxy-N,N-Diisopropyltryptamine), levamisole (phenylimidothiazole isomer undetermined), and dimethyl sulfone (table 4; data for amphetamine and

43
CEWG Meeting Highlights and Summary
Proceedings of the Community Epidemiology Work Group, January 2014
hydromorphone, which appear in the top 10 NFLIS drug reports in several CEWG areas, while not shown in table 4, are described in the footnote below7).
MDMA, or ecstasy, ranked among the top 10 drug reports from items seized and identified in NFLIS laboratories in 4 of 24 CEWG areas. The drug ranked 7th in Chicago, 8th in Los Angeles, 9th in San Francisco, and 10th in Washington, DC (table 1; appendix table 2). The proportions of MDMA among analyzed NFLIS drug reports from items seized and identified in forensic laboratories were less than 1.0 percent in the United States and in all but 3 of 24 CEWG areas—San Francisco, Seattle, and Washington, DC), where percentages were 1.0, 1.1, and 1.2, respectively (table 4).
PCP. PCP ranked among the top 10 most frequent NFLIS drug reports from items seized and analyzed in NFLIS labo-ratories in 5 of 24 CEWG areas in this reporting period. PCP ranked fifth in Washington, DC, in the first half of 2013; it ranked sixth in Los Angeles and New York City, seventh in Philadelphia, and eighth in Chicago (table 1; appendix table 2). The Miami NFLIS laboratories reported a general category of hallucinogens, which accounted for 4.1 percent of drug reports among items seized and analyzed in the first half of 2013. Hallucinogens, mostly PCP, ranked fourth among the most frequently identified drug reports in Miami in this period (table 1; appendix table 2).
PCP was identified among total drug reports in the United States and in 18 of 24 CEWG areas reporting on items seized and analyzed in NFLIS laboratories in the first half of 2013. The six exceptions were Atlanta, Cincinnati, Den-ver, Detroit, Maine, and Michigan. PCP reports were highest in Washington, DC, at 7.0 percent of total drug reports, followed by Philadelphia (2.1 percent) and New York City (1.7 percent), with hallucinogens at 4.1 percent of total drug reports in Miami (table 4).
Psilocin/Psilocybin. Psilocin/psilocybin, a hallucinogen, ranked among the top 10 drugs in drug reports in the NFLIS system in the first half of 2013 in 2 CEWG areas, ranking seventh in Minneapolis/St. Paul and ninth in Colorado (table 1; appendix table 2). The drug was identified among drug reports from items analyzed in forensic laboratories in 23 of 24 CEWG areas in the first half of 2013; the exception was Washington, DC. Two areas showed percentages of 1.0 or more; these were Colorado (1.0 percent) and Minneapolis/St. Paul (1.3 percent) (table 4).
Carisoprodol. Carisoprodol8 is a muscle relaxant and central nervous system depressant that is available by prescrip-tion as Soma®. Since January 2012, carisoprodol has been a Schedule IV drug. In the first half of 2013, carisoprodol ranked among the top 10 NFLIS drug reports from items seized and identified in forensic laboratories in 1 CEWG area; it ranked 10th in Phoenix, where 1.0 percent of all drug reports identified in the reporting period were carisoprodol (table 1; appendix table 2). Carisoprodol was identified among NFLIS drug reports in 20 of 24 reporting areas in the first half of 2013. It was not identified in four areas (Albuquerque, Minneapolis/St. Paul, New York City, and Philadel-phia) (table 4).
BZP. In the first half of 2013, BZP ranked among the top 10 drug reports from items seized and identified in NFLIS forensic laboratories in 2 of 24 areas. The drug ranked 5th in Chicago and tied for 10th place in Detroit rankings (table 1; appendix table 2). BZP was identified among the drug reports from items analyzed in NFLIS forensic laboratories in 22 of 24 CEWG areas in the first half of 2013; exceptions were Albuquerque and Maine. BZP was identified in 1.0 percent of drug reports among drug items seized and analyzed in Minneapolis/St. Paul and Washington, DC. Propor-tions of drug reports for BZP were less than 1.0 percent in all other areas and the United States in this reporting period (table 4).
7Amphetamine. Amphetamine drug reports were identified among seized drug items analyzed in NFLIS laboratories in all 24 CEWG areas in the first half of 2013. Proportions of amphetamine among total drug reports represented less than 1.0 percent in all CEWG areas except five—Boston (1.9 percent); Michigan and Minneapolis/St. Paul (1.2 percent each); St. Louis (1.2 percent); and Atlanta (1.1 percent). The drug ranked among the top 10 most frequently identified NFLIS drug reports in 6 of 24 CEWG areas. Amphetamine ranked 6th among total drug reports in the first half of 2013 in Boston, 7th in both Detroit and Michigan, 9th (tied with XLR-11) in Atlanta, and 10th in Texas (table 1; appendix table 2; data not shown in table 4). Hydromorphone, a prescription opioid, was identified among drug reports from items seized and analyzed in NFLIS laboratories in all 24 CEWG areas except 2—Detroit and Washington, DC—in the first half of 2013. However, the drug did not reach proportions above 1.0 percent in any of these areas except Miami; hydromorphone ranked ninth among the top 10 drug reports in Miami, with 1.1 percent of total drug reports (table 1; appendix table 2; data not shown in table 4).8More information on carisoprodol may be found at: http://www.deadiversion.usdoj.gov/drugs_concern/carisoprodol/index.html and http://www.nlm.nih.gov/medlineplus/druginfo/meds/a682578.html.
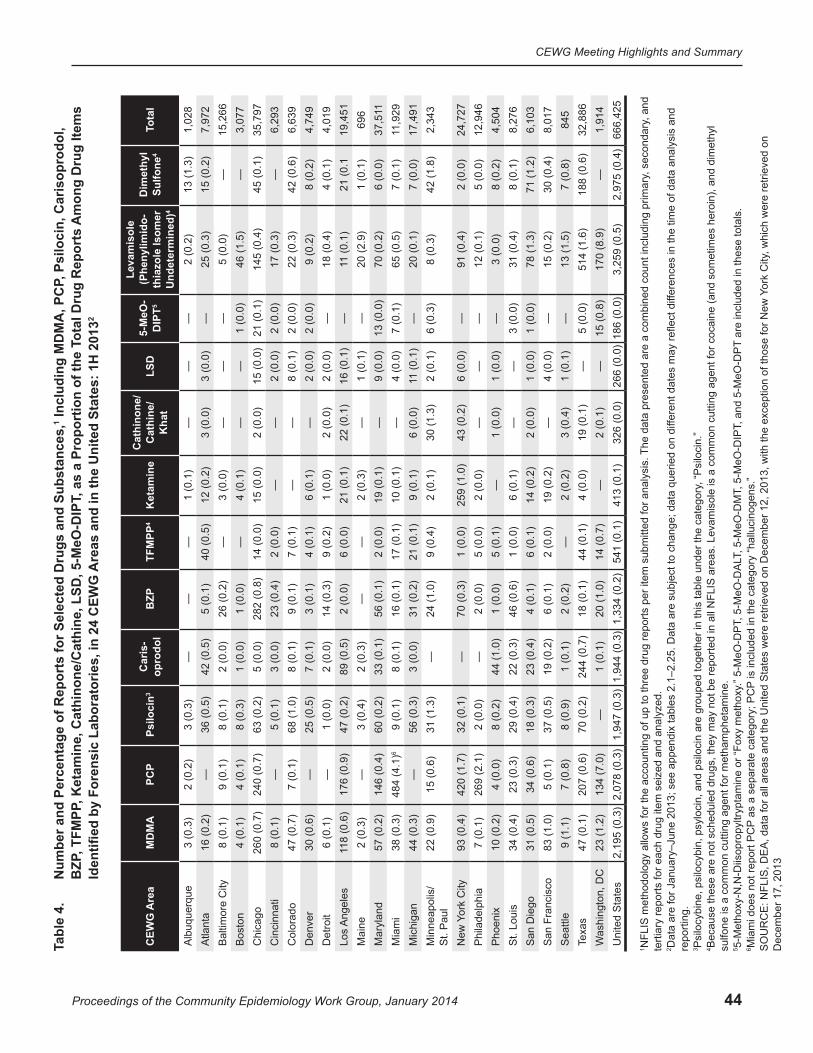
44
CEWG Meeting Highlights and Summary
Proceedings of the Community Epidemiology Work Group, January 2014
, Psi
loci
n, C
aris
opro
dol,
Am
ong
Dru
g Ite
ms
otal
Dru
g R
epor
ts
Incl
udin
g M
DM
A, P
CP
2
Num
ber a
nd P
erce
ntag
e of
Rep
orts
for S
elec
ted
Dru
gs a
nd S
ubst
ance
s,1
, as
a Pr
opor
tion
of th
e T
Are
as a
nd in
the
Uni
ted
Stat
es: 1
H 2
013
, TFM
PP, K
etam
ine,
Cat
hino
ne/C
athi
ne, L
SD, 5
-MeO
-DIP
TB
ZPId
entifi
ed b
y Fo
rens
ic L
abor
ator
ies,
in 2
4 C
EWG
Ta
ble
4.
CEW
G A
rea
MD
MA
PCP
Psilo
cin3
Car
is-
opro
dol
BZP
TFM
PP4
Ket
amin
eC
athi
none
/ C
athi
ne/
Kha
tLS
D5-
MeO
- 5D
IPT
4
Leva
mis
ole
(Phe
nylim
ido-
thia
zole
Isom
er
Und
eter
min
ed)
Dim
ethy
l Su
lfone
4ot
alT
Alb
uque
rque
3 (0
.3)
2 (0
.2)
3 (0
.3)
——
—1
(0.1
)—
——
2 (0
.2)
13 (1
.3)
1,02
8A
tlant
a16
(0.2
)—
36 (0
.5)
42 (0
.5)
5 (0
.1)
40 (0
.5)
12 (0
.2)
3 (0
.0)
3 (0
.0)
—25
(0.3
)15
(0.2
)7,
972
Bal
timor
e C
ity8
(0.1
)9
(0.1
)8
(0.1
)2
(0.0
)26
(0.2
)—
3 (0
.0)
——
—5
(0.0
)—
15,2
66B
osto
n4
(0.1
)4
(0.1
)8
(0.3
)1
(0.0
)1
(0.0
)—
4 (0
.1)
——
1 (0
.0)
46 (1
.5)
—3,
077
Chi
cago
260
(0.7
)24
0 (0
.7)
63 (0
.2)
5 (0
.0)
282
(0.8
)14
(0.0
)15
(0.0
)2
(0.0
)15
(0.0
)21
(0.1
)14
5 (0
.4)
45 (0
.1)
35,7
97C
inci
nnat
i8
(0.1
)—
5 (0
.1)
3 (0
.0)
23 (0
.4)
2 (0
.0)
——
2 (0
.0)
2 (0
.0)
17 (0
.3)
—6,
293
Col
orad
o47
(0.7
)7
(0.1
)68
(1.0
)8
(0.1
)9
(0.1
)7
(0.1
)—
—8
(0.1
)2
(0.0
)22
(0.3
)42
(0.6
)6,
639
Den
ver
30 (0
.6)
—25
(0.5
)7
(0.1
)3
(0.1
)4
(0.1
)6
(0.1
)—
2 (0
.0)
2 (0
.0)
9 (0
.2)
8 (0
.2)
4,74
9D
etro
it6
(0.1
)—
1 (0
.0)
2 (0
.0)
14 (0
.3)
9 (0
.2)
1 (0
.0)
2 (0
.0)
2 (0
.0)
—18
(0.4
)4
(0.1
)4,
019
Ang
eles
Los
118
(0.6
)17
6 (0
.9)
47 (0
.2)
89 (0
.5)
2 (0
.0)
6 (0
.0)
21 (0
.1)
22 (0
.1)
16 (0
.1)
—11
(0.1
)21
(0.1
19,4
51M
aine
2 (0
.3)
3 (0
.4)
2 (0
.3)
——
2 (0
.3)
—1
(0.1
)—
20 (2
.9)
1 (0
.1)
696
Mar
ylan
d57
(0.2
)60
(0.2
)
31 (1
.3)
32 (0
.1)
29 (0
.4)
18 (0
.3)
37 (0
.5)
146
(0.4
)48
4 (4
.1)6
— —15
(0.6
)
420
(1.7
)26
9 (2
.1)
4 (0
.0)
23 (0
.3)
34 (0
.6)
5 (0
.1)
33 (0
.1)
56 (0
.1)
2 (0
.0)
19 (0
.1)
—9
(0.0
)13
(0.0
)70
(0.2
)6
(0.0
)37
,511
Mia
mi
38 (0
.3)
9 (0
.1)
8 (0
.1)
16 (0
.1)
17 (0
.1)
10 (0
.1)
—4
(0.0
)7
(0.1
)65
(0.5
)7
(0.1
)11
,929
Mic
higa
n44
(0.3
)6
(0.3
)5
3 (0
.0)
31 (0
.2)
21 (0
.1)
9 (0
.1)
6 (0
.0)
11 (0
.1)
—20
(0.1
)7
(0.0
)17
,491
M
inne
apol
is/
St.
Pau
l22
(0.9
)—
24 (1
.0)
9 (0
.4)
2 (0
.1)
30 (1
.3)
2 (0
.1)
6 (0
.3)
8 (0
.3)
42 (1
.8)
2,34
3
York
City
New
93
(0.4
)—
70 (0
.3)
1 (0
.0)
259
(1.0
)43
(0.2
)6
(0.0
)—
91 (0
.4)
2 (0
.0)
24,7
27P
hila
delp
hia
7 (0
.1)
2 (0
.0)
—2
(0.0
)5
(0.0
)2
(0.0
)—
——
12 (0
.1)
5 (0
.0)
12,9
46P
hoen
ix10
(0.2
)8
(0.2
)44
(1.0
)1
(0.0
)5
(0.1
)—
1 (0
.0)
1 (0
.0)
—3
(0.0
)8
(0.2
)4,
504
St.
Loui
s34
(0.4
)22
(0.3
)46
(0.6
)1
(0.0
)6
(0.1
)—
—3
(0.0
)31
(0.4
)8
(0.1
)8,
276
San
Die
go31
(0.5
)23
(0.4
)4
(0.1
)6
(0.1
)14
(0.2
)2
(0.0
)1
(0.0
)1
(0.0
)78
(1.3
)71
(1.2
)6,
103
San
Fra
ncis
co83
(1.0
)19
(0.2
)6
(0.1
)2
(0.0
)19
(0.2
)—
4 (0
.0)
—15
(0.2
)30
(0.4
)8,
017
Sea
ttle
9 (1
.1)
7 (0
.8)
8 (0
.9)
1 (0
.1)
2 (0
.2)
—2
(0.2
)3
(0.4
)1
(0.1
)—
13 (1
.5)
7 (0
.8)
845
Texa
s47
(0.1
)20
7 (0
.6)
70 (0
.2)
244
(0.7
)18
(0.1
)44
(0.1
)4
(0.0
)19
(0.1
)—
5 (0
.0)
514
(1.6
)18
8 (0
.6)
32,8
86W
ashi
ngto
n, D
C23
(1.2
)13
4 (7
.0)
—1
(0.1
)20
(1.0
)14
(0.7
)—
2 (0
.1)
—15
(0.8
)17
0 (8
.9)
—1,
914
Uni
ted
Sta
tes
2,19
5 (0
.3)
2,07
8 (0
.3)
1,94
7 (0
.3)
1,94
4 (0
.3)
1,33
4 (0
.2)
541
(0.1
)41
3 (0
.1)
326
(0.0
)26
6 (0
.0)
186
(0.0
)3,
259
(0.5
)2,
975
(0.4
)66
6,42
5
, and
Th
e da
ta p
rese
nted
are
a c
ombi
ned
coun
t inc
ludi
ng p
rimar
y, s
econ
dary
fere
nces
in th
e tim
e of
dat
a an
alys
is a
nd
FLIS
are
as. L
evam
isol
e is
a c
omm
on c
uttin
g ag
ent f
or c
ocai
ne (a
nd s
omet
imes
her
oin)
, and
dim
ethy
l
, whi
ch w
ere
retri
eved
on
are
incl
uded
in th
ese
tota
ls.
ork
City
Y
fere
nt d
ates
may
refle
ct d
if
, and
5-M
eO-D
PT
per
item
sub
mitt
ed fo
r ana
lysi
s.
e su
bjec
t to
chan
ge; d
ata
quer
ied
on d
if
, “P
silo
cin.
”
, 5-M
eO-D
IPT
is ta
ble
unde
r the
cat
egor
y
, 5-M
eO-D
MT
The
cat
egor
y “h
allu
cino
gens
.”
NFL
IS m
etho
dolo
gy a
llow
s fo
r the
acc
ount
ing
of u
p to
thre
e dr
ug re
ports
N
Dat
a ar
e fo
r Jan
uary
–Jun
e 20
13; s
ee a
ppen
dix
tabl
es 2
.1–2
.25.
Dat
a ar
Psi
locy
bine
, psi
locy
bin,
psy
loci
n, a
nd p
silo
cin
are
grou
ped
toge
ther
in th
Bec
ause
thes
e ar
e no
t sch
edul
ed d
rugs
, the
y m
ay n
ot b
e re
porte
d in
all , 5
-MeO
-DA
L.”
5-M
eO-D
PT
is in
clud
ed in
t
terti
ary
repo
rts fo
r eac
h dr
ug it
em s
eize
d an
d an
alyz
ed.
sulfo
ne is
a c
omm
on c
uttin
g ag
ent f
or m
etha
mph
etam
ine.
5-M
etho
xy-N
,N-D
iisop
ropy
ltryp
tam
ine
or “F
oxy
met
hoxy
as
a se
para
te c
ateg
ory;
PC
P
repo
rting
.
Mia
mi d
oes
not r
epor
t PC
P
1 2 3 4 5 6 SO
UR
CE
: NFL
IS, D
EA
, dat
a fo
r all
area
s an
d th
e U
nite
d S
tate
s w
ere
retri
eved
on
Dec
embe
r 12,
201
3, w
ith th
e ex
cept
ion
of th
ose
for N
ew
Dec
embe
r 17,
201
3
45
CEWG Meeting Highlights and Summary
Proceedings of the Community Epidemiology Work Group, January 2014
TFMPP. TFMPP9 is a synthetic substance with no accepted medical use in the United States; it is used for its hallucinogenic effects. TFMPP was identified among drug reports from drug items analyzed in NFLIS laboratories in all except 5 of the 24 reporting areas in the first half of 2013—Albuquerque, Baltimore City, Boston, Maine, and Seattle. Percentages of drug reports did not equal or exceed 1.0 percent for TFMPP in any of the 24 reporting areas or in the United States) (table 4). TFMPP did not rank among the top 10 NFLIS drug reports in the first half of 2013 in any CEWG area. It should be noted that because TFMPP is not a controlled substance, it may not be reported to NFLIS by forensic laboratories in all areas.
Ketamine. Ketamine was identified among drug reports in the NFLIS system in the first half of 2013 in all CEWG areas except Cincinnati, Colorado, Phoenix, and Washington, DC. Ketamine represented less than 1.0 percent of total drug reports in all reporting areas and in the United States (table 4). Ketamine appeared among the top 10 reported drugs from analyzed drug items in 1 CEWG area in this reporting period; it ranked 10th in New York City, at 1.0 percent of total drug reports (table 1; appendix table 2).
Khat (Cathinone/Cathine). Cathinone or cathine were identified in NFLIS drug report data in 12 of 24 CEWG areas in the first half of 2013. Drug reports for cathinone/cathine did not reach 1.0 percent of total drug reports in any area except Minneapolis/St. Paul, where the drug ranked eighth among the top 10 drugs at 1.3 percent of total drug reports (table 4; table 1; appendix table 2).
LSD. LSD was not among the top 10 drugs reported in the NFLIS system for any CEWG reporting area, but it was reported in all but 7 of the 24 CEWG areas. These areas were Albuquerque, Baltimore City, Boston, Philadelphia, St. Louis, Texas, and Washington, DC. The proportion did not reach 1.0 percent of drug reports in any area or in the United States (table 4).
Foxy Methoxy. Foxy methoxy (5-MeO-DIPT) was identified among drug reports from items seized and analyzed in NFLIS forensic laboratories in 12 of 24 CEWG areas in the first half of 2013. The drug did not rank among the top 10 drug reports in the first half of 2013 in any CEWG reporting area and did not exceed 1.0 percent of total reports in any CEWG area (table 4).
Cannabimimetics, Substituted Cathinones, and the 2C Family of Phenethylamines
NFLIS Data on Cannabimimetics (Synthetic Cannabinoids)
Cannabimimetics. XLR-11 (1-(5-fluoropentyl-1h-3-yl)(2,2,3,3-tetramethylcyclopropyl)methanone) was identified among the top 10 NFLIS drug reports in the United States and in 8 of the 24 reporting CEWG areas in the first half of 2013. The cannabimimetic ranked fifth in Cincinnati and Denver; sixth in Colorado; seventh in Maryland and Texas; and ninth in Albuquerque, Atlanta, and St. Louis. XLR-11 was the eighth most frequently identified drug among drug reports from drug items seized and analyzed in NFLIS forensic laboratories in this reporting period in the United States. PB-22 (1-pentyl-1h-indole-3-carboxylic acid 8-quinolinyl ester) was the only other cannabimimetic appearing in the top 10 NFLIS rankings in any CEWG area; it ranked 10th in Cincinnati (table 1; appendix table 2).
Approximately two-thirds of all cannabimimetics identified in NFLIS drug reports in the United States (n=15,975) were XLR-11 (n=10,467). The total of 1,062 drug reports of UR-144 ((1-pentylindol-3-yl)-(2,2,3,3-tetramethylcyclopropyl)methanone) represented 6.6 percent of all NFLIS drug reports for cannabimimetics in the United States, while AM-2201 (1-(5-fluoropentyl)-3-(1-naphthoyl)indole) constituted 5.4 percent (n=863) (appendix table 3.1).
Cannabimimetic agents, or synthetic cannabinoids, were identified among drug reports in 22 of 24 areas in the first half of 2013; none were identified in San Francisco or Seattle. Ten CEWG areas showed total drug reports equal to or exceeding 1.0 percent identified as cannabimimetics, including Denver (5.1 percent), Colorado (4.0 percent), Texas (3.6 percent), Atlanta (2.4 percent), St. Louis (2.2 percent), Cincinnati (2.1 percent), Minneapolis/St. Paul (1.4 percent), Albuquerque and Maryland (1.3 percent each), and Boston (1.0 percent). The value for the United States was 2.4 percent (appendix table 3.1).
9More information on TFMPP can be found at: http://www.deadiversion.usdoj.gov/drugs concern/tfmpp.pdf.
46
CEWG Meeting Highlights and Summary
Proceedings of the Community Epidemiology Work Group, January 2014
NFLIS Data on Substituted Cathinones (Synthetic Cathinones)
Substituted Cathinones. For the United States as a whole, the top three substituted cathinones in NFLIS drug reports in the first half of 2013 were methylone) (n=4,427), alpha-PVP (n=1,214), and MDPV (n=652), at 61.2, 16.8, and 9.0 percent, respectively, of total drug reports for substituted cathinones (n=7,237) among items seized and analyzed in national forensic laboratories (appendix table 3.2).
Methylone ranked in the top 10 NFLIS drug reports in 5 of 24 reporting areas—Miami (3rd), Atlanta (6th), Baltimore City (7th), Maryland (8th), and Minneapolis/St. Paul (10th). The 1 other substituted cathinone represented among the top 10 drug reports in CEWG areas was alpha-PVP, which ranked fifth in Maine. None of the substituted cathinones ranked among the top 10 drug reports in the United States in this reporting period (table 1; appendix table 2).
One or more substituted cathinones were identified in drug reports in all 24 CEWG reporting areas in the first half of 2013. Methylone was reported in all 24 areas, while alpha-PVP was identified in 16 areas, and MDPV was reported in 18 of 24 areas (appendix table 3.2). The highest percentages of drug reports identified as substituted cathinones combined were in Maine, at 6.8 percent, followed by 5.4 percent in Miami, 4.4 percent in Atlanta, 2.0 percent in Washington, DC, 1.8 percent in Minneapolis/St. Paul, 1.4 percent in Boston, 1.2 percent in Seattle, and 1.0 percent in St. Louis. In the United States, 1.1 percent of all drug reports were substituted cathinones in the first half of 2013 (appendix table 3.2).
NFLIS Data on the 2C Family of Phenethylamines
Phenethylamines. Drug reports for the 2C family of phenethylamines (2C-I, 2C-B, 2C-C, 2C-E, 2C-H, 2C-P, 2C-T-2, and 2C-T-7) were identified among items seized and analyzed by NFLIS forensic laboratories in 18 of 24 areas in the first half of 2013. The total number of these items ranged from 57 in Texas, to 26 in Chicago and Michigan, followed by 17 in Minneapolis/St. Paul, 14 in Atlanta, and 11 in Miami, with the remaining area totals being fewer than 10 in number. In the first half of 2013, 18 of 24 areas identified these drugs in NFLIS reports; 63.5 percent were 2C-I and 22.2 percent were 2C-C. None of these drugs appeared among the top 10 drug reports for any CEWG area or in the United States, where a total of 864 such drug reports were identified In the first half of 2013 (appendix table 3.3).
47
Appendices
Proceedings of the Community Epidemiology Work Group, January 2014
Appendices
Appendix 1. Data Sources Used in CEwG Update Briefs for January 2014: Caveats and Limitations Data sources used by area representatives to update drug abuse indicators in 20 reporting CEWG areas are described below; caveats and data limitations are also discussed.
Treatment data were presented in several CEWG area reports. Area representatives included data for 17 CEWG metropolitan areas and 6 States: Colorado, Maine, Maryland, Michigan, New Mexico, and Texas. Data for some States are included in reporting with metropolitan data for comparison, including data for Colorado with Denver, Maryland with Baltimore City, Michigan with Detroit, and New Mexico with Albuquerque. South Florida/Broward County data are included with South Florida/Miami-Dade County data for comparison. The latter two counties, with Palm Beach County, are part of the Miami Metropolitan Statistical Area (MSA).
Forensic laboratory data on drug seizures for a total of 24 CEWG sites were available for the first half of 2013 (January–June). Data were provided by the National Forensic Laboratory Information System (NFLIS), maintained by the Drug Enforcement Administration (DEA). The data presented are a combined count including primary, secondary, and tertiary reports for each drug item submitted. NFLIS is a program in the DEA Office of Diversion Control that systematically and continuously collects results from drug analyses of items received from drug seizures by law enforcement authorities. Drug analyses are conducted by Federal (DEA) forensic laboratories and participating State and local forensic laboratories. As of March 2012 (the most recent data available), in addition to the DEA laboratories, the NFLIS system included 48 State systems and 91 local or municipal laboratories/laboratory systems, representing a total of 288 individual laboratories. In 2011, approximately 1.7 million drug analysis records were reported to NLFIS. Data are entered daily based on seizure date and the county in which the seizure occurred. NFLIS provides detailed information on the prevalence and types of controlled substances secured in law enforcement operations and assists in identifying emerging drug problems and changes in drug availability and in monitoring illicit drug use and trafficking, including the diversion of legally manufactured drugs into illegal markets. A list of participating and reporting State and local forensic laboratories is included in Appendix B of the U.S. Drug Enforcement Administration, Office of Diversion Control report, National Forensic Laboratory Information System: 2011 Annual Report (Washington, DC: U.S. Drug Enforcement Administration)10. In most cases, data are for MSAs, rather than single metropolitan counties, but the exact geographic areas covered in this report are defined in appendix table 2. A map displaying NFLIS data for 2011 for 24 CEWG areas is included as figure 1, while table 1 and a number of other figures and tables (figures 3–9 and tables 2–4), along with appendix tables 2.1–2.25 and appendix tables 3.1–3.3, are provided to display the data on forensic laboratory drug reports identified from drug items for the reporting period across areas. Update briefs also include NFLIS data for some CEWG areas. Numbers of drug reports for specific drugs for the United States shown in cross-area tables do not represent a total of the 24 CEWG areas. These totals represent the number of reports for a specific drug identified among items seized and analyzed in NFLIS laboratories across the entire Nation
Average price and purity data for heroin for 19 CEWG metropolitan areas in 2011 (the most recent period available) were provided by the DEA in the 2011 Heroin Domestic Monitor Program (HDMP) Drug Intelligence Report published in March 2013. This report is prepared by the Domestic Strategic Intelligence Unit of the Special Strategic Intelligence Section and reflects analysis of program data through December 31, 2011. Drug price and purity data from this report, from local DEA Field Divisions, or from other local sources are included in update briefs for seven CEWG areas: Chicago, Cincinnati, Denver/Colorado, Los Angeles, New York City, St. Louis, and San Diego. Drug price and purity data from the DEA STRIDE program are displayed in figures 2.1–2.3 were presented by Wanda Iyoha of the DEA.
Local drug-related mortality data from medical examiners/coroners (ME/Cs) or State public health agencies were reported in update briefs and/or presentations for 12 CEWG areas: Atlanta; Cincinnati; Denver/Colorado; Detroit; Los Angeles; Maine; Miami-Dade and Broward Counties/South Florida; Minneapolis/St. Paul; Philadelphia; St. Louis;
10This report and other information about NFLIS can be found at http://www.deadiversion.usdoj.gov/nflis/index.html.

48
Appendices
Proceedings of the Community Epidemiology Work Group, January 2014
San Diego; and Seattle. Data on drug-related deaths variously defined are provided by local area representatives as important consequence indicators. They reveal the extent to which deaths are drug-involved, drug-caused, or in which drugs were detected even if not the cause of the death. Mortality data may represent the presence of a drug detected in a decedent or overdose deaths. The mortality data are not comparable across areas because of the different data sources and variations in methods and procedures used by medical examiners or coroners. Drugs may cause a death, be detected in a death, or simply relate to a death in an unspecified way. Multiple drugs may be identified in a single case, with each reported in a separate drug category. Definitions associated with drug deaths vary. Common reporting terms include “drug-related,” “drug-detected,” “drug-caused,” “drug overdose,” and “drug positive.” These terms may have different meanings in different areas of the country, and their meaning may depend upon the local reporting standards and definitions.
Other data included in update briefs and presentations were local and national data accessed and analyzed by CEWG representatives. The sources included local law enforcement (e.g., data on drug arrests, impaired drivers, or law enforcement seizures); 2011 Youth Risk Behavior Survey (YRBS) data from the YRBS online query system; DEA Drug Abuse Warning Network (DAWN) emergency department (ED) data; Arrestee Drug Abuse Monitoring (ADAM) II program data from the Office of National Drug Control Policy; arrestee drug information from local and State corrections departments and facilities; DEA Automation of Reports and Consolidated Orders System (ARCOS) data on the flow of DEA-controlled substances from their point of manufacture through commercial distribution channels to point of sale or distribution at the dispensing or retail level; local DEA offices (DEA field reports); High Intensity Drug Trafficking Area (HIDTA) reports; poison control centers; prescription drug monitoring systems; hospital admissions and discharge data; local and State surveys; and interviews with key informants and ethnographers.
A Note to the Reader—Caveats: Terminology and Geographic Coverage—CEWG representatives use existing data, which are subject to the definitions and geographic coverage of the source data. Representatives generally use the terminology as it is used in the data source. For example, many treatment systems use the phrases “other opiates” for classifying “opiates11 other than heroin” to categorize a primary problem at admission. The term “other opiates” is therefore retained in this summary report, and the terms, “other opiates” and “opioids12” may be used in a single area report. Similarly, the term, “prescription-type opioid,” is used by some representatives to distinguish synthetic or semisynthetic opioids, such as oxycodone and hydrocodone, from heroin. The geographic coverage of data sources may vary within a CEWG area report. Readers are directed to the update briefs for a more complete description of data sources used in specific areas. In this summary report, in most cases, the general name of the CEWG area will be used for data sources. For NFLIS data, specific geographic coverage for each area is described in appendix 2 with notes on spatial composition.
Local comparisons are limited, or must be made with caution, for the following indicators:
Treatment Admissions—Many variables affect treatment admission numbers, including program emphasis, capacity, data collection methods, and reporting periods. Therefore, changes in admissions bear a complex relationship to drug abuse prevalence. Treatment data are not totally comparable across CEWG areas, and treatment numbers are subject to change. Most of the CEWG area representatives report treatment admissions data provided by States to the Treatment Episode Data Set (TEDS)13. Cross-area comparisons of treatment data are not included in this report.
NFLIS Drug Reports from Drug Items Seized and Analyzed by Forensic Laboratories—NFLIS includes drug chemistry results from completed analyses only; drug evidence secured by law enforcement but not analyzed in laboratories is not included in the NFLIS database. State and local policies related to the enforcement and prosecution of specific drugs may affect drug evidence submissions to laboratories for analysis. Laboratory policies and procedures
11Opiate is defined as “any preparation or derivative of opium” by Stedman’s Medical Dictionary – 28th Edition, Lippincott Williams and Wilkins, Baltimore, MD: c. 2006. 12Opioid is defined as “originally a term denoting synthetic narcotics resembling opiates but increasingly used to refer to both opiates and synthetic narcotics” by Stedman’s Medical Dictionary – 28th Edition, Lippincott Williams and Wilkins, Baltimore, MD: c. 2006. 13TEDS is an administrative data system providing descriptive information about the national flow of admissions to specialty providers of substance abuse treatment, conducted by the Center for Behavioral Health Statistics and Quality (CBHSQ), SAMHSA.
49
Appendices
Proceedings of the Community Epidemiology Work Group, January 2014
for handling drug evidence vary and range from analysis of all evidence submitted to the laboratory to analysis of selected items only. Many laboratories did not analyze the evidence when a case was dismissed or if no defendant could be identified (see NFLIS 2011 Annual Report cited earlier). Differences in local/State laboratory procedures and law enforcement practices across areas make area comparisons inexact. Also, the data cannot be used for prevalence estimates, because they are not adjusted for population size. They are reported as the percentage that each drug represents of the total number of drug reports, including up to three drugs identified in drug items seized and identified by forensic laboratories in a CEWG area, and cases are assigned to a geographic area by the location of the seizure event, not the laboratory. Because NFLIS data counting primary, secondary, and tertiary reports for each drug in analyzed drug items were provided for the first time in June 2012, NFLIS data included in the June 2012, January 2013, June 2013, and January 2014 reports cannot be compared with data presented in prior CEWG reports. The nature of the NFLIS reporting system is such that there may be a time lag between time of seizure, time of analysis of drug items and drug reports based on them, and time of reporting to the NFLIS system. Therefore, differences in the number of drug reports for a specified time period may occur when NFLIS is queried at different times, since data input is daily and cases may be held for different periods of time before analysis and reporting in various areas and agencies. Numbers of drug reports presented in these reports are subject to change and may differ when drawn on different dates. Not all forensic laboratories report on substances that are not controlled, rendering some comparisons of such drugs inaccurate.
Deaths—Mortality data may represent the presence of a drug detected in a decedent or overdose deaths. The mortality data are not comparable across areas because of variations in methods and procedures used by ME/Cs. Drugs may cause a death, be detected in a death, or simply relate to a death in an unspecified way. Multiple drugs may be identified in a single case, with each reported in a separate drug category. Definitions associated with drug deaths vary. Common reporting terms include “drug-related,” “drug-detected,” “drug-induced,” “drug-caused,” and “drug-involved.” These terms may have different meanings in different areas of the country, and their meaning may depend upon the local reporting standards and definitions. Cross-area tabulations of mortality drug abuse indicators are not included in this report.
Arrest and Seizure Data—The numbers of arrests and quantities of drugs seized may reflect enforcement policy and resources, rather than level of abuse.
Local Area Comparisons: The following methods and considerations pertain to local area comparisons:
• Local areas vary in their reporting periods. Some indicators reflect fiscal periods that may differ among local areas. In addition, the timelines of data vary, particularly for death and treatment indicators. Spatial units defining a CEWG area may also differ depending on the data source. Care has been taken to delineate the definition of the geographic unit under study for each data source, whether a city, a single metropolitan county, an MSA, or some subset of counties in an MSA. In some instances, data were compiled by region defined by the U.S. Census as northeastern, southern, midwestern, and western regions. Texas is included in the western region in this report, rather than in the census-defined southern region, based on member recommendations concerning area comparability of drug patterns and similarity of population characteristics to other western areas.
• Some indicator data are unavailable for certain cities. Therefore, the symbol, “NA,” in tables refers to data not reported by the CEWG area representative.
• The population racial/ethnic composition differs across CEWG areas. Readers are directed to the individual CEWG update briefs for information regarding treatment patterns and trends pertaining to race/ethnicity, age, and gender.
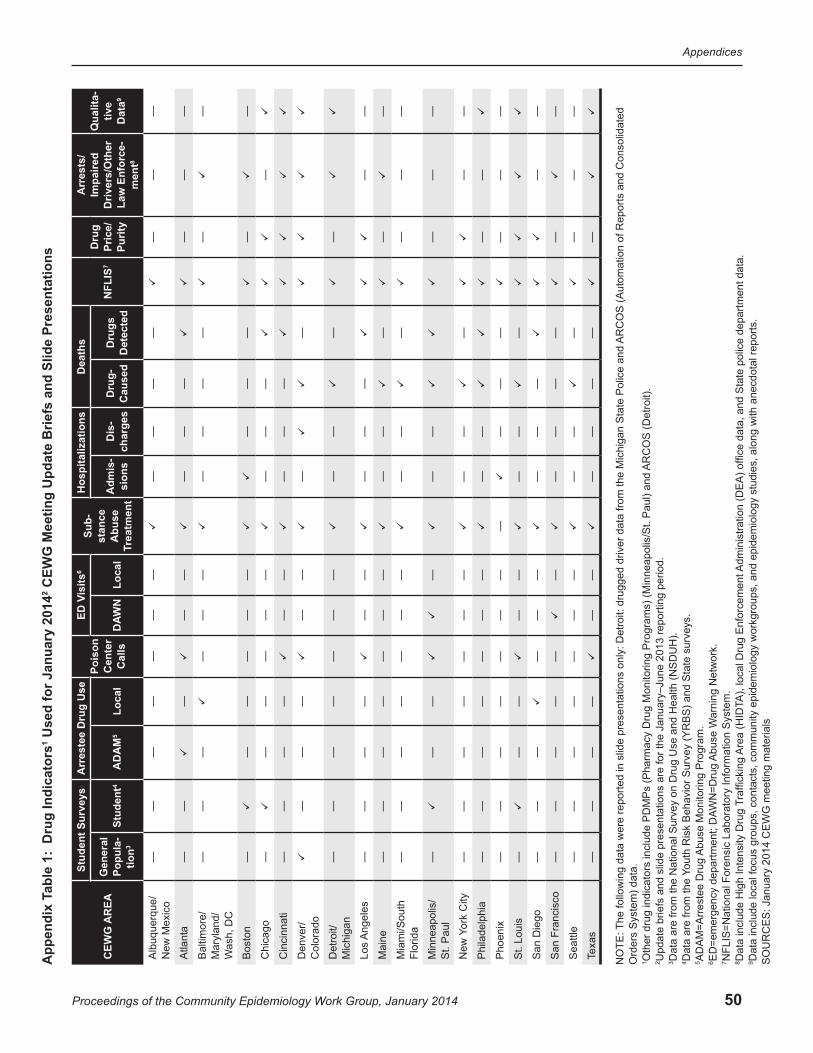
50
Appendices
Proceedings of the Community Epidemiology Work Group, January 2014
CEW
G M
eetin
g U
pdat
e B
riefs
and
Slid
e Pr
esen
tatio
ns2
Use
d fo
r Jan
uary
201
4ab
le 1
: D
rug
Indi
cato
rs1
App
endi
x T
CEW
G A
REA
Stud
ent S
urve
ysA
rres
tee
Dru
g U
sePo
ison
C
ente
r C
alls
6is
itsED
VSu
b-st
ance
A
buse
Tr
eatm
ent
Hos
pita
lizat
ions
Dea
ths
7N
FLIS
Dru
g Pr
ice/
Pu
rity
Arr
ests
/Im
paire
d D
river
s/O
ther
La
w E
nfor
ce-
8m
ent
Qua
lita-
tive
Dat
a9
Gen
eral
Po
pula
-tio
n3St
uden
t45
AD
AM
Loca
lW
ND
ALo
cal
Adm
is-
sion
sD
is-
char
ges
Dru
g-
Cau
sed
Dru
gs
Det
ecte
d
A
lbuq
uerq
ue/
New
Mex
ico
——
——
——
—
——
——
—
——
Atla
nta
——
—
—
—
——
—
—
——
Bal
timor
e/M
aryl
and/
ash,
DC
W
——
—
——
—
——
——
—
—
Bos
ton
—
——
——
—
—
——
—
—
Chi
cago
—
——
——
—
——
—
—
Cin
cinn
ati
——
——
—
—
——
—
Den
ver/
Col
orad
o
——
—
——
—
—
Det
roit/
M
ichi
gan
——
——
——
—
——
—
—
Los
Ang
eles
——
——
—
—
——
—
——
Mai
ne—
——
——
——
—
—
—
—
—
Mia
mi/S
outh
Fl
orid
a—
——
——
——
—
—
—
——
—
M
inne
apol
is/
St.
Pau
l—
—
—
—
—
—
——
—
City
ork
New
Y—
——
——
——
—
—
—
—
—
Phi
lade
lphi
a—
——
——
——
—
—
——
Pho
enix
——
——
——
——
—
——
—
——
St.
Loui
s—
—
—
——
—
—
—
San
Die
go—
——
—
——
—
——
—
—
San
Fra
ncis
co—
——
——
—
—
——
—
—
—
Sea
ttle
——
——
——
—
——
—
—
——
Texa
s—
——
—
——
—
——
—
—
AR
CO
S (A
utom
atio
n of
Rep
orts
and
Con
solid
ated
AR
CO
S (D
etro
it).
ams)
(Min
neap
olis
/St.
Pau
l) an
d
Adm
inis
tratio
n (D
EA
) offi
ce d
ata,
and
Sta
te p
olic
e de
partm
ent d
ata.
s. forc
emen
t
arni
ng N
etw
ork.
A),
loca
l Dru
g E
n
Abu
se M
onito
ring
Pro
gram
.A
buse
W
Are
a (H
IDT
WN
=Dru
g
raffi
ckin
g T
Yout
h R
isk
Beh
avio
r Sur
vey
(YR
BS
) and
Sta
te s
urve
y
NO
TE: T
he fo
llow
ing
data
wer
e re
porte
d in
slid
e pr
esen
tatio
ns o
nly:
Det
roit:
dru
gged
driv
er d
ata
from
the
Mic
higa
n S
tate
Pol
ice
and
Ord
ers
Sys
tem
) dat
a.O
ther
dru
g in
dica
tors
incl
ude
PD
MP
s (P
harm
acy
Dru
g M
onito
ring
Pro
grU
pdat
e br
iefs
and
slid
e pr
esen
tatio
ns a
re fo
r the
Jan
uary
–Jun
e 20
13 re
porti
ng p
erio
d.D
ata
are
from
the
Nat
iona
l Sur
vey
on D
rug
Use
and
Hea
lth (N
SD
UH
).D
ata
are
from
the
AD
AM
=Arr
este
e D
rug
ED
=em
erge
ncy
depa
rtmen
t; D
AN
FLIS
=Nat
iona
l For
ensi
c La
bora
tory
Info
rmat
ion
Sys
tem
.D
ata
incl
ude
Hig
h In
tens
ity D
rug
Dat
a in
clud
e lo
cal f
ocus
gro
ups,
con
tact
s, c
omm
unity
epi
dem
iolo
gy w
orkg
roup
s, a
nd e
pide
mio
logy
stu
dies
, alo
ng w
ith a
necd
otal
repo
rts.
1 2 3 4 5 6 7 8 9 SO
UR
CE
S: J
anua
ry 2
014
CE
WG
mee
ting
mat
eria
ls

51
Appendices
Proceedings of the Community Epidemiology Work Group, January 2014
Appendix Table 2.1. Top 10 Most Frequently Identified Drugs of Total Analyzed Drug Reports, Albuquerque: 1H 20131 Drug Number PercentageMarijuana/Cannabis 259 25.2
Methamphetamine 259 25.2
Heroin 218 21.2
Cocaine 134 13.0
Oxycodone 16 1.6
Alprazolam 14 1.4
Dimethyl Sulfone 13 1.3
Hydrocodone 11 1.1
XLR-11 7 0.7
Morphine 5 0.5
Other2 92 8.9
Total 1,028 100.01Data are for January–June 2013, and include primary, secondary, and tertiary reports.2All other analyzed reports.NOTES:1. Data are for all counties in the Albuquerque MSA: Bernalillo, Sandoval, Torrance, and Valencia Counties.2. Included under “Other” rather than in the top 10 list are 29 reports for “Negative Results-Tested for Specific Drugs.”3. Percentages may not sum to the total due to rounding.SOURCE: NFLIS, DEA, December 12, 2013
Appendix Table 2.2. Top 10 Most Frequently Identified Drugs of Total Analyzed Drug Reports, Atlanta: 1H 20131 Drug Number PercentageMethamphetamine 1,932 24.2Cocaine 1,777 22.3Oxycodone 383 4.8Heroin 356 4.5Alprazolam 338 4.2Methylone 323 4.1Hydrocodone 270 3.4Marijuana/Cannabis 135 1.7Amphetamine 90 1.1XLR-11 90 1.1Other2 2,278 28.6Total 7,972 100.0
1Data are for January–June 2013, and include primary, secondary, and tertiary reports.2All other analyzed reports.NOTES:1. Data are for the 28-county Atlanta/Sandy Springs/Marietta GA MSA: Barrow, Bartow, Butts, Carroll, Cherokee, Clayton, Cobb, Coweta, Dawson, DeKalb, Douglas, Fayette, Forsyth, Fulton, Gwinnett, Haralson, Heard, Henry, Jasper, Lamar, Meriwether, Newton, Paulding, Pickens, Pike, Rockdale, Spalding, and Walton Counties.2. Included under “Other” rather than in the top 10 list are 1,406 reports for “Unspecified Pharmaceutical Preparation.”3. Percentages may not sum to the total due to rounding.SOURCE: NFLIS, DEA, December 12, 2013
Appendix Table 2.3. Top 10 Most Frequently Identified Drugs of Total Analyzed Drug Reports, Baltimore City: 1H 20131 Drug Number PercentageMarijuana/Cannabis 6,423 42.1
Cocaine 3,925 25.7
Heroin 3,374 22.1
Oxycodone 438 2.9
Alprazolam 236 1.5
Buprenorphine 183 1.2
Methylone 100 0.7
Caffeine 63 0.4
Clonazepam 63 0.4
Methadone 53 0.3
Other2 408 2.7
Total 15,266 100.01Data are for January–June 2013, and include primary, secondary, and tertiary reports.2All other analyzed reports.NOTES:1. Data are for Baltimore City only.2. Percentages may not sum to the total due to rounding.SOURCE: NFLIS, DEA, December 12, 2013
Appendix Table 2.4. Top 10 Most Frequently Identified Drugs of Total Analyzed Drug Reports, Boston: 1H 20131 Drug Number PercentageMarijuana/Cannabis 1,020 33.1Cocaine 601 19.5Heroin 466 15.1Oxycodone 194 6.3Buprenorphine 65 2.1Amphetamine 60 1.9Clonazepam 49 1.6Phenylimidothiazole Isomer Undetermined
46 1.5
Alprazolam 32 1.0Acetaminophen2 31 1.0Naloxone 31 1.0Other3 482 15.7Total 3,077 100.0
1Data are for January–June 2013, and include primary, secondary, and tertiary reports.2Acetaminophen and Naloxone are tied for 10th place.3All other analyzed reports.NOTES:1. Data include seven counties in the Boston MSA: Essex, Middlesex, Norfolk, Plymouth, Rockingham, Strafford, and Suffolk Counties.2. Included under “Other” rather than in the top 10 list are 95 reports for "No Controlled Drug Identified.”3. Due to issues within the Massachusetts Department of Public Health (DPH) Western Laboratory, they last reported data in August 2012. Due to issues within the other DPH laboratories, they last reported data in December 2012. Therefore, the count compared with prior years may be lower.SOURCE: NFLIS, DEA, December 12, 2013

52
Appendices
Proceedings of the Community Epidemiology Work Group, January 2014
Appendix Table 2.5. Top 10 Most Frequently Identified Drugs of Total Analyzed Drug Reports, Chicago: 1H 20131 Drug Number PercentageMarijuana/Cannabis 19,776 55.2
Heroin 6,940 19.4
Cocaine 5,680 15.9
Hydrocodone 300 0.8
BZP 282 0.8
Alprazolam 263 0.7
MDMA 260 0.7
PCP 240 0.7
Phenylimidothiazole Isomer Undetermined
145 0.4
Acetaminophen 122 0.3
Other2 1,789 5.0
Total 35,797 100.01Data are for January–June 2013, and include primary, secondary, and tertiary reports.2All other analyzed reports.NOTES:1. Data are for 13 counties in the Chicago/Naperville/Joliet, IL/IN/WI MSA: Cook, DeKalb, DuPage, Grundy, Kane, Kendall, McHenry, and Will Counties in IL; Jasper, Lake, Newton, and Porter Counties in IN; and Kenosha County in WI.2. Percentages may not sum to the total due to rounding.SOURCE: NFLIS, DEA, December 12, 2013
Appendix Table 2.6. Top 10 Most Frequently Identified Drugs of Total Analyzed Drug Reports, Cincinnati: 1H 20131 Drug Number PercentageMarijuana/Cannabis 2,151 34.2
Heroin 1,820 28.9
Cocaine 961 15.3
Oxycodone 127 2.0
XLR-11 75 1.2
Hydrocodone 68 1.1
Alprazolam 61 1.0
Benocyclidine 49 0.8
Methamphetamine 47 0.7
PB-22 42 0.7
Other2 892 14.2
Total 6,293 100.01Data are for January–June 2013, and include primary, secondary, and tertiary reports.2All other analyzed reports.NOTES:1. Data are for Hamilton County.2. Included under “Other” rather than in the top 10 list are 490 reports for “Unknown.”3. Percentages may not sum to the total due to rounding.SOURCE: NFLIS, DEA, December 12, 2013
Appendix Table 2.7. Top 10 Most Frequently Identified Drugs of Total Analyzed Drug Reports, Colorado: 1H 20131 Drug Number PercentageMethamphetamine 1,763 26.6
Cocaine 1,476 22.2
Marijuana/Cannabis 1,015 15.3
Heroin 820 12.4
Oxycodone 167 2.5
XLR-11 136 2.0
Alprazolam 75 1.1
Hydrocodone 69 1.0
Psilocybin/Psilocyn/Psilocin/ Psilocybine
68 1.0
Acetaminophen 50 0.8
Other2 1,000 15.1
Total 6,639 100.01Data are for January–June 2013, and include primary, secondary, and tertiary reports.2All other analyzed reports.NOTES:1. Data are for the State of Colorado.2. Included under “Other” rather than in the top 10 list are 312 reports for "Noncontrolled Nonnarcotic Drug.”3. Due to laboratory circumstances, the Colorado Springs Police Department did not report data in 2012 but resumed reporting in February 2013. Due to staffing issues, the Jefferson County Laboratory reported only partial data for April and no data for May 2013.4. Percentages may not sum to the total due to rounding.SOURCE: NFLIS, DEA, December 12, 2013
Appendix Table 2.8. Top 10 Most Frequently Identified Drugs of Total Analyzed Drug Reports, Denver: 1H 20131 Drug Number PercentageCocaine 1,192 25.1
Methamphetamine 1,036 21.8
Heroin 730 15.4
Marijuana/Cannabis 686 14.4
XLR-11 135 2.8
Oycodone 91 1.9
Alprazolam 46 1.0
Hydrocodone 45 0.9
Clonazepam 32 0.7
Acetaminophen 31 0.7
Other2 725 15.3
Total 4,749 100.01Data are for January–June 2013, and include primary, secondary, and tertiary reports.2All other analyzed reports.NOTES:1. Data are for Denver, Arapahoe, and Jefferson Counties.2. Included under “Other” rather than in the top 10 list are 310 reports for “Noncontrolled Nonnarcotic Drug.”3. Due to staffing issues, the Jefferson County Laboratory reported only partial data for April and no data for May, 2013.4. Percentages may not sum to the total due to rounding.SOURCE: NFLIS, DEA, December 12, 2013

53
Appendices
Proceedings of the Community Epidemiology Work Group, January 2014
Appendix Table 2.9. Top 10 Most Frequently Identified Drugs of Total Analyzed Drug Reports, Detroit: 1H 20131 Drug Number PercentageMarijuana/Cannabis 2,007 49.9
Cocaine 741 18.4
Heroin 531 13.2
Hydrocodone 149 3.7
Alprazolam 102 2.5
Oxycodone 38 0.9
Amphetamine 31 0.8
Methamphetamine 21 0.5
Phenylimidothiazole Isomer Undetermined
18 0.4
BZP2 14 0.3
Morphine 14 0.3
Other3 353 8.8
Total 4,019 100.01Data are for January–June 2013, and include primary, secondary, and tertiary reports.2BZP and Morphine are tied for 10th place.3All other analyzed reports.NOTES:1. Data are for Wayne County.2. Included under “Other” rather than in the top 10 list are 192 reports for “No Controlled Drug Identified.”3. Percentages may not sum to the total due to rounding.SOURCE: NFLIS, DEA, December 12, 2013
Appendix Table 2.10. Top 10 Most Frequently Identified Drugs of Total Analyzed Drug Reports, Los Angeles: 1H 20131 Drug Number PercentageMethamphetamine 6,386 32.8
Marijuana/Cannabis 5,985 30.8
Cocaine 3,593 18.5
Heroin 1,222 6.3
Hydrocodone 182 0.9
PCP 176 0.9
Alprazolam 161 0.8
MDMA 118 0.6
Oxycodone 111 0.6
Codeine 92 0.5
Other2 1,425 7.3
Total 19,451 100.01Data are for January–June 2013, and include primary, secondary, and tertiary reports.2All other analyzed reports.NOTES:1. Data are for Los Angeles County.2. Included under “Other” rather than in the top 10 list are 234 reports for “Negative Results-Tested for Specific Drugs.”3. Percentages may not sum to the total due to rounding.SOURCE: NFLIS, DEA, December 12, 2013
Appendix Table 2.11. Top 10 Most Frequently Identified Drugs of Total Analyzed Drug Reports, Maine: 1H 20131 Drug Number PercentageHeroin 153 22.0
Cocaine 150 21.6
Oxycodone 64 9.2
Marijuana/Cannabis 38 5.5
Alpha-PVP 30 4.3
Methamphetamine 24 3.4
Caffeine 23 3.3
Phenylimidothiazole Isomer Undetermined
20 2.9
Buprenorphine 17 2.4
Hydrocodone 13 1.9
Other2 164 23.6
Total 696 100.01Data are for January–June 2013, and include primary, secondary, and tertiary reports.2All other analyzed reports.NOTES:1. Data are for the State of Maine.2. Percentages may not sum to the total due to rounding.SOURCE: NFLIS, DEA, December 12, 2013
Appendix Table 2.12. Top 10 Most Frequently Identified Drugs of Total Analyzed Drug Reports, Maryland: 1H 20131 Drug Number PercentageMarijuana/Cannabis 19,548 52.1
Cocaine 6,211 16.6
Heroin 5,174 13.8
Oxycodone 1,415 3.8
Alprazolam 689 1.8
Buprenorphine 502 1.3
XLR-11 475 1.3
Methylone 205 0.5
Clonazepam 190 0.5
Hydrocodone 182 0.5
Other2 2,920 7.8
Total 37,511 100.01Data are for January–June 2013, and include primary, secondary, and tertiary reports.2All other analyzed reports.NOTES:1. Data are for the State of Maryland.2. Included under “Other” rather than in the top 10 list are 598 reports for “No Controlled Drug Identified.”3. Percentages may not sum to the total due to rounding.SOURCE: NFLIS, DEA, December 12, 2013
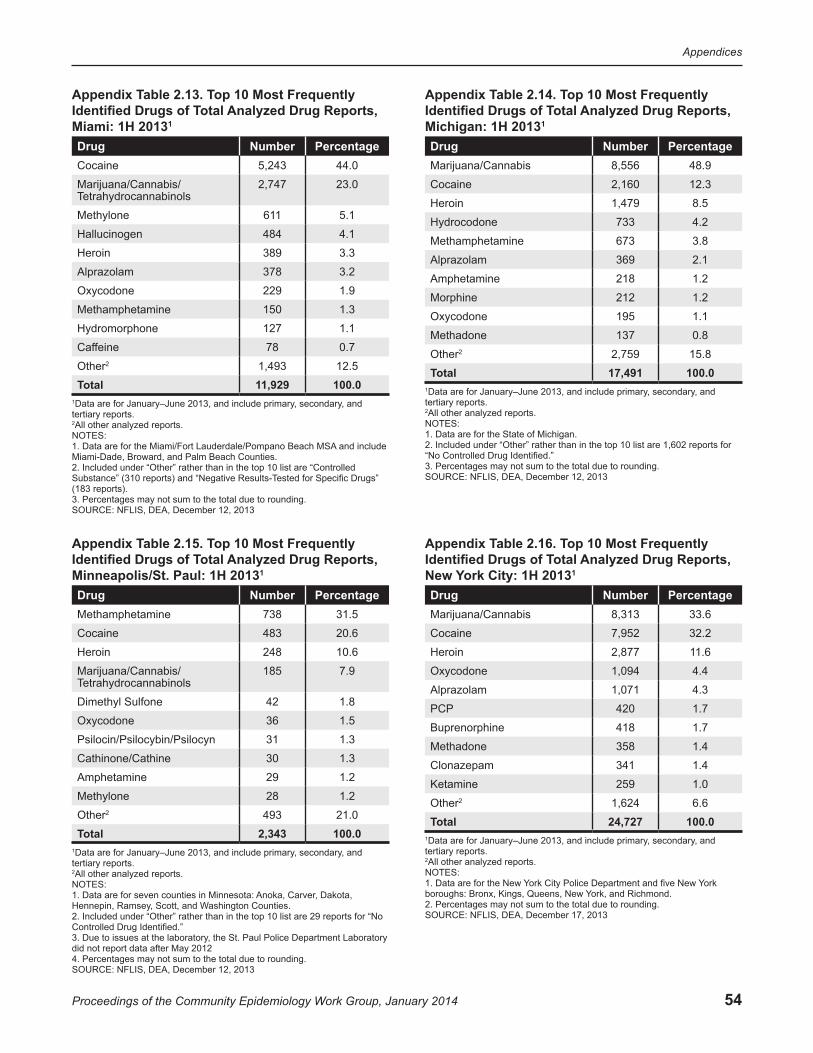
54
Appendices
Proceedings of the Community Epidemiology Work Group, January 2014
Appendix Table 2.13. Top 10 Most Frequently Identified Drugs of Total Analyzed Drug Reports, Miami: 1H 20131 Drug Number PercentageCocaine 5,243 44.0
Marijuana/Cannabis/ Tetrahydrocannabinols
2,747 23.0
Methylone 611 5.1
Hallucinogen 484 4.1
Heroin 389 3.3
Alprazolam 378 3.2
Oxycodone 229 1.9
Methamphetamine 150 1.3
Hydromorphone 127 1.1
Caffeine 78 0.7
Other2 1,493 12.5
Total 11,929 100.01Data are for January–June 2013, and include primary, secondary, and tertiary reports.2All other analyzed reports.NOTES:1. Data are for the Miami/Fort Lauderdale/Pompano Beach MSA and include Miami-Dade, Broward, and Palm Beach Counties.2. Included under “Other” rather than in the top 10 list are “Controlled Substance” (310 reports) and “Negative Results-Tested for Specific Drugs” (183 reports).3. Percentages may not sum to the total due to rounding.SOURCE: NFLIS, DEA, December 12, 2013
Appendix Table 2.14. Top 10 Most Frequently Identified Drugs of Total Analyzed Drug Reports, Michigan: 1H 20131 Drug Number PercentageMarijuana/Cannabis 8,556 48.9
Cocaine 2,160 12.3
Heroin 1,479 8.5
Hydrocodone 733 4.2
Methamphetamine 673 3.8
Alprazolam 369 2.1
Amphetamine 218 1.2
Morphine 212 1.2
Oxycodone 195 1.1
Methadone 137 0.8
Other2 2,759 15.8
Total 17,491 100.01Data are for January–June 2013, and include primary, secondary, and tertiary reports.2All other analyzed reports.NOTES:1. Data are for the State of Michigan.2. Included under “Other” rather than in the top 10 list are 1,602 reports for “No Controlled Drug Identified.”3. Percentages may not sum to the total due to rounding.SOURCE: NFLIS, DEA, December 12, 2013
Appendix Table 2.15. Top 10 Most Frequently Identified Drugs of Total Analyzed Drug Reports, Minneapolis/St. Paul: 1H 20131 Drug Number PercentageMethamphetamine 738 31.5
Cocaine 483 20.6
Heroin 248 10.6
Marijuana/Cannabis/ Tetrahydrocannabinols
185 7.9
Dimethyl Sulfone 42 1.8
Oxycodone 36 1.5
Psilocin/Psilocybin/Psilocyn 31 1.3
Cathinone/Cathine 30 1.3
Amphetamine 29 1.2
Methylone 28 1.2
Other2 493 21.0
Total 2,343 100.01Data are for January–June 2013, and include primary, secondary, and tertiary reports.2All other analyzed reports.NOTES:1. Data are for seven counties in Minnesota: Anoka, Carver, Dakota, Hennepin, Ramsey, Scott, and Washington Counties.2. Included under “Other” rather than in the top 10 list are 29 reports for “No Controlled Drug Identified.”3. Due to issues at the laboratory, the St. Paul Police Department Laboratory did not report data after May 20124. Percentages may not sum to the total due to rounding.SOURCE: NFLIS, DEA, December 12, 2013
Appendix Table 2.16. Top 10 Most Frequently Identified Drugs of Total Analyzed Drug Reports, New York City: 1H 20131 Drug Number PercentageMarijuana/Cannabis 8,313 33.6
Cocaine 7,952 32.2
Heroin 2,877 11.6
Oxycodone 1,094 4.4
Alprazolam 1,071 4.3
PCP 420 1.7
Buprenorphine 418 1.7
Methadone 358 1.4
Clonazepam 341 1.4
Ketamine 259 1.0
Other2 1,624 6.6
Total 24,727 100.01Data are for January–June 2013, and include primary, secondary, and tertiary reports.2All other analyzed reports.NOTES:1. Data are for the New York City Police Department and five New York boroughs: Bronx, Kings, Queens, New York, and Richmond.2. Percentages may not sum to the total due to rounding.SOURCE: NFLIS, DEA, December 17, 2013
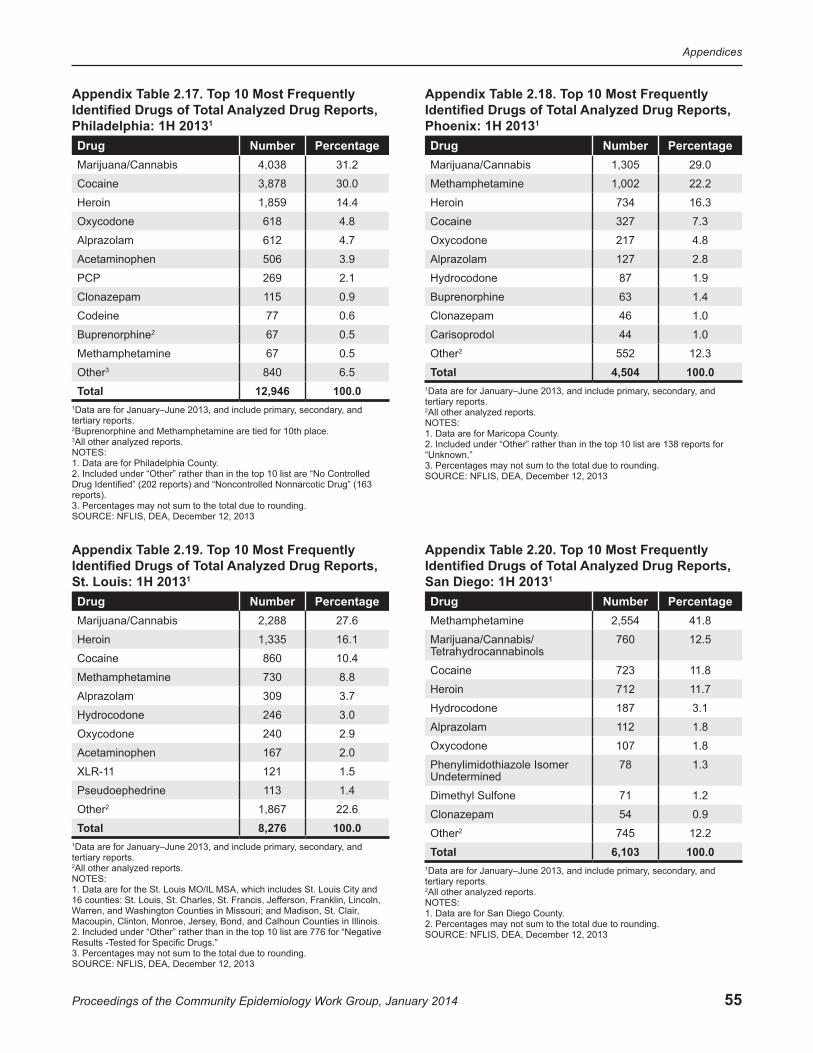
55
Appendices
Proceedings of the Community Epidemiology Work Group, January 2014
Appendix Table 2.17. Top 10 Most Frequently Identified Drugs of Total Analyzed Drug Reports, Philadelphia: 1H 20131 Drug Number PercentageMarijuana/Cannabis 4,038 31.2
Cocaine 3,878 30.0
Heroin 1,859 14.4
Oxycodone 618 4.8
Alprazolam 612 4.7
Acetaminophen 506 3.9
PCP 269 2.1
Clonazepam 115 0.9
Codeine 77 0.6
Buprenorphine2 67 0.5
Methamphetamine 67 0.5
Other3 840 6.5
Total 12,946 100.01Data are for January–June 2013, and include primary, secondary, and tertiary reports.2Buprenorphine and Methamphetamine are tied for 10th place.3All other analyzed reports.NOTES:1. Data are for Philadelphia County.2. Included under “Other” rather than in the top 10 list are “No Controlled Drug Identified” (202 reports) and “Noncontrolled Nonnarcotic Drug” (163 reports).3. Percentages may not sum to the total due to rounding.SOURCE: NFLIS, DEA, December 12, 2013
Appendix Table 2.18. Top 10 Most Frequently Identified Drugs of Total Analyzed Drug Reports, Phoenix: 1H 20131 Drug Number PercentageMarijuana/Cannabis 1,305 29.0
Methamphetamine 1,002 22.2
Heroin 734 16.3
Cocaine 327 7.3
Oxycodone 217 4.8
Alprazolam 127 2.8
Hydrocodone 87 1.9
Buprenorphine 63 1.4
Clonazepam 46 1.0
Carisoprodol 44 1.0
Other2 552 12.3
Total 4,504 100.01Data are for January–June 2013, and include primary, secondary, and tertiary reports.2All other analyzed reports.NOTES:1. Data are for Maricopa County.2. Included under “Other” rather than in the top 10 list are 138 reports for “Unknown.”3. Percentages may not sum to the total due to rounding.SOURCE: NFLIS, DEA, December 12, 2013
Appendix Table 2.19. Top 10 Most Frequently Identified Drugs of Total Analyzed Drug Reports, St. Louis: 1H 20131 Drug Number PercentageMarijuana/Cannabis 2,288 27.6
Heroin 1,335 16.1
Cocaine 860 10.4
Methamphetamine 730 8.8
Alprazolam 309 3.7
Hydrocodone 246 3.0
Oxycodone 240 2.9
Acetaminophen 167 2.0
XLR-11 121 1.5
Pseudoephedrine 113 1.4
Other2 1,867 22.6
Total 8,276 100.01Data are for January–June 2013, and include primary, secondary, and tertiary reports.2All other analyzed reports.NOTES:1. Data are for the St. Louis MO/IL MSA, which includes St. Louis City and 16 counties: St. Louis, St. Charles, St. Francis, Jefferson, Franklin, Lincoln, Warren, and Washington Counties in Missouri; and Madison, St. Clair, Macoupin, Clinton, Monroe, Jersey, Bond, and Calhoun Counties in Illinois.2. Included under “Other” rather than in the top 10 list are 776 for “Negative Results -Tested for Specific Drugs.”3. Percentages may not sum to the total due to rounding.SOURCE: NFLIS, DEA, December 12, 2013
Appendix Table 2.20. Top 10 Most Frequently Identified Drugs of Total Analyzed Drug Reports, San Diego: 1H 20131 Drug Number PercentageMethamphetamine 2,554 41.8
Marijuana/Cannabis/ Tetrahydrocannabinols
760 12.5
Cocaine 723 11.8
Heroin 712 11.7
Hydrocodone 187 3.1
Alprazolam 112 1.8
Oxycodone 107 1.8
Phenylimidothiazole Isomer Undetermined
78 1.3
Dimethyl Sulfone 71 1.2
Clonazepam 54 0.9
Other2 745 12.2
Total 6,103 100.01Data are for January–June 2013, and include primary, secondary, and tertiary reports.2All other analyzed reports.NOTES:1. Data are for San Diego County.2. Percentages may not sum to the total due to rounding.SOURCE: NFLIS, DEA, December 12, 2013
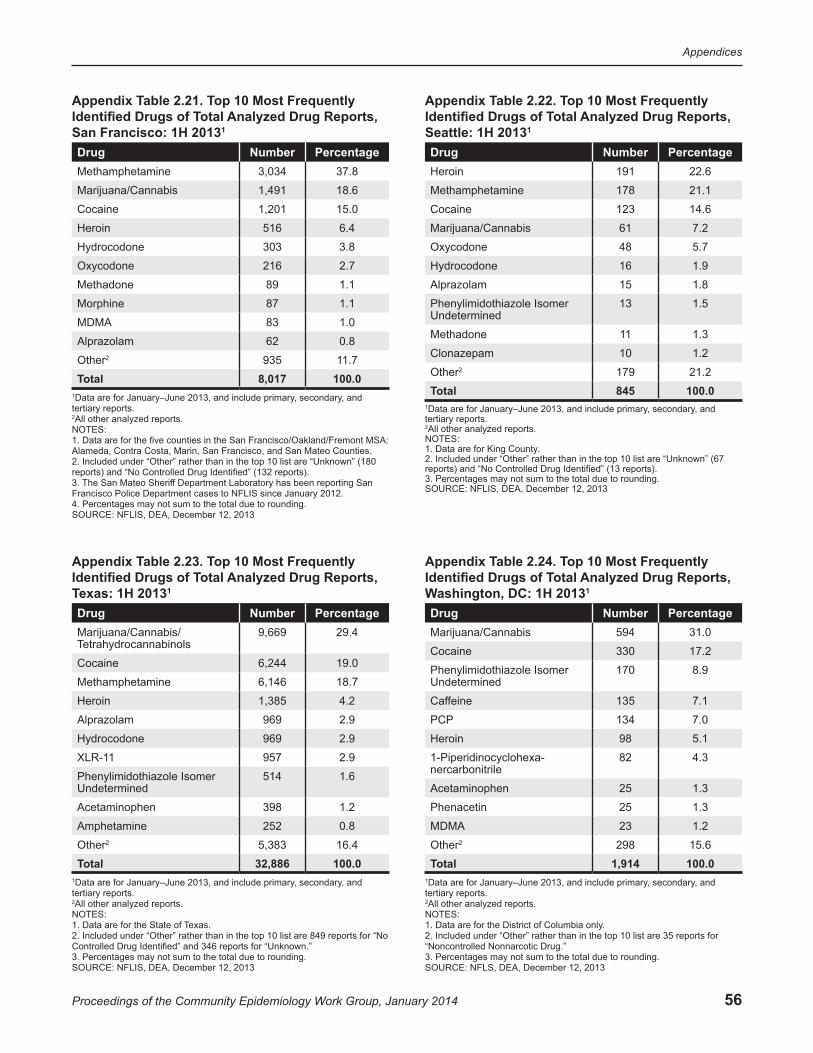
56
Appendices
Proceedings of the Community Epidemiology Work Group, January 2014
Appendix Table 2.21. Top 10 Most Frequently Identified Drugs of Total Analyzed Drug Reports, San Francisco: 1H 20131 Drug Number PercentageMethamphetamine 3,034 37.8
Marijuana/Cannabis 1,491 18.6
Cocaine 1,201 15.0
Heroin 516 6.4
Hydrocodone 303 3.8
Oxycodone 216 2.7
Methadone 89 1.1
Morphine 87 1.1
MDMA 83 1.0
Alprazolam 62 0.8
Other2 935 11.7
Total 8,017 100.01Data are for January–June 2013, and include primary, secondary, and tertiary reports.2All other analyzed reports.NOTES:1. Data are for the five counties in the San Francisco/Oakland/Fremont MSA: Alameda, Contra Costa, Marin, San Francisco, and San Mateo Counties.2. Included under “Other” rather than in the top 10 list are “Unknown” (180 reports) and “No Controlled Drug Identified” (132 reports).3. The San Mateo Sheriff Department Laboratory has been reporting San Francisco Police Department cases to NFLIS since January 2012.4. Percentages may not sum to the total due to rounding.SOURCE: NFLIS, DEA, December 12, 2013
Appendix Table 2.22. Top 10 Most Frequently Identified Drugs of Total Analyzed Drug Reports, Seattle: 1H 20131 Drug Number PercentageHeroin 191 22.6
Methamphetamine 178 21.1
Cocaine 123 14.6
Marijuana/Cannabis 61 7.2
Oxycodone 48 5.7
Hydrocodone 16 1.9
Alprazolam 15 1.8
Phenylimidothiazole Isomer Undetermined
13 1.5
Methadone 11 1.3
Clonazepam 10 1.2
Other2 179 21.2
Total 845 100.01Data are for January–June 2013, and include primary, secondary, and tertiary reports.2All other analyzed reports.NOTES:1. Data are for King County.2. Included under “Other” rather than in the top 10 list are “Unknown” (67 reports) and “No Controlled Drug Identified” (13 reports).3. Percentages may not sum to the total due to rounding.SOURCE: NFLIS, DEA, December 12, 2013
Appendix Table 2.23. Top 10 Most Frequently Identified Drugs of Total Analyzed Drug Reports, Texas: 1H 20131 Drug Number PercentageMarijuana/Cannabis/ Tetrahydrocannabinols
9,669 29.4
Cocaine 6,244 19.0
Methamphetamine 6,146 18.7
Heroin 1,385 4.2
Alprazolam 969 2.9
Hydrocodone 969 2.9
XLR-11 957 2.9
Phenylimidothiazole Isomer Undetermined
514 1.6
Acetaminophen 398 1.2
Amphetamine 252 0.8
Other2 5,383 16.4
Total 32,886 100.01Data are for January–June 2013, and include primary, secondary, and tertiary reports.2All other analyzed reports.NOTES:1. Data are for the State of Texas.2. Included under “Other” rather than in the top 10 list are 849 reports for “No Controlled Drug Identified” and 346 reports for “Unknown.”3. Percentages may not sum to the total due to rounding.SOURCE: NFLIS, DEA, December 12, 2013
Appendix Table 2.24. Top 10 Most Frequently Identified Drugs of Total Analyzed Drug Reports, Washington, DC: 1H 20131
Drug Number PercentageMarijuana/Cannabis 594 31.0
Cocaine 330 17.2
Phenylimidothiazole Isomer Undetermined
170 8.9
Caffeine 135 7.1
PCP 134 7.0
Heroin 98 5.1
1-Piperidinocyclohexa- nercarbonitrile
82 4.3
Acetaminophen 25 1.3
Phenacetin 25 1.3
MDMA 23 1.2
Other2 298 15.6
Total 1,914 100.01Data are for January–June 2013, and include primary, secondary, and tertiary reports.2All other analyzed reports.NOTES:1. Data are for the District of Columbia only.2. Included under “Other” rather than in the top 10 list are 35 reports for “Noncontrolled Nonnarcotic Drug.”3. Percentages may not sum to the total due to rounding.SOURCE: NFLS, DEA, December 12, 2013
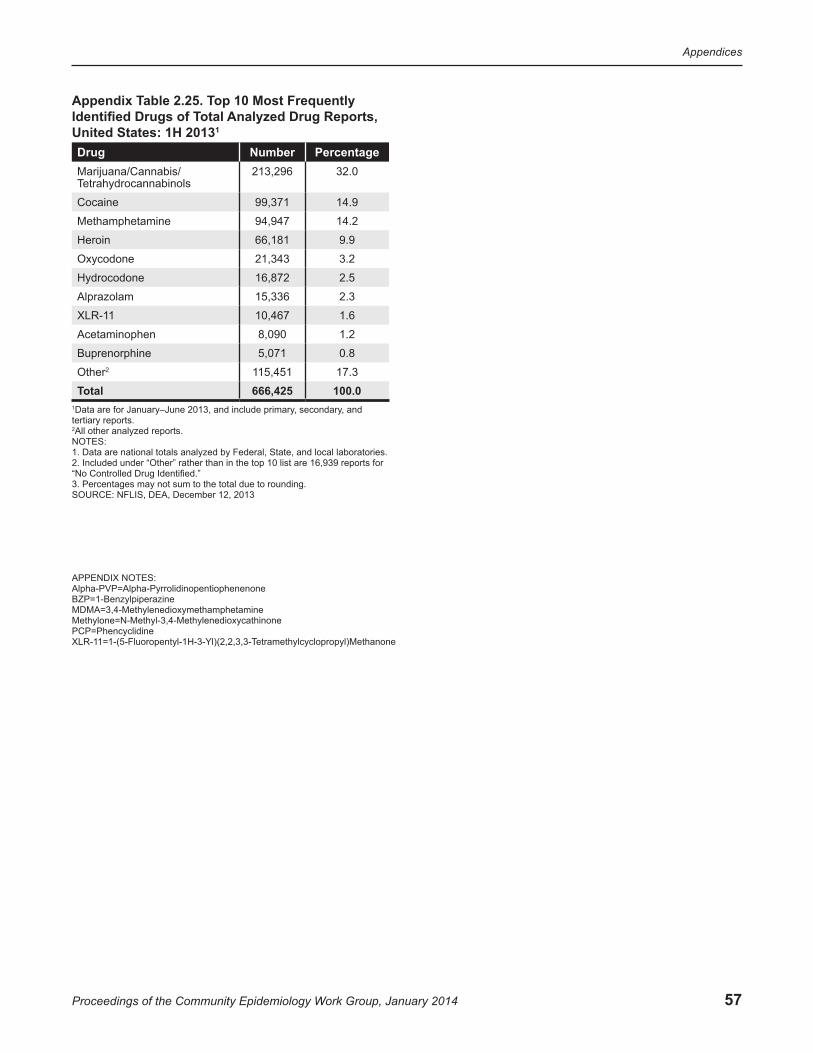
57
Appendices
Proceedings of the Community Epidemiology Work Group, January 2014
Appendix Table 2.25. Top 10 Most Frequently Identified Drugs of Total Analyzed Drug Reports, United States: 1H 20131 Drug Number PercentageMarijuana/Cannabis/ Tetrahydrocannabinols
213,296 32.0
Cocaine 99,371 14.9
Methamphetamine 94,947 14.2
Heroin 66,181 9.9
Oxycodone 21,343 3.2
Hydrocodone 16,872 2.5
Alprazolam 15,336 2.3
XLR-11 10,467 1.6
Acetaminophen 8,090 1.2
Buprenorphine 5,071 0.8
Other2 115,451 17.3
Total 666,425 100.01Data are for January–June 2013, and include primary, secondary, and tertiary reports.2All other analyzed reports.NOTES:1. Data are national totals analyzed by Federal, State, and local laboratories.2. Included under “Other” rather than in the top 10 list are 16,939 reports for “No Controlled Drug Identified.”3. Percentages may not sum to the total due to rounding.SOURCE: NFLIS, DEA, December 12, 2013
APPENDIX NOTES: Alpha-PVP=Alpha-PyrrolidinopentiophenenoneBZP=1-BenzylpiperazineMDMA=3,4-MethylenedioxymethamphetamineMethylone=N-Methyl-3,4-MethylenedioxycathinonePCP=PhencyclidineXLR-11=1-(5-Fluoropentyl-1H-3-Yl)(2,2,3,3-Tetramethylcyclopropyl)Methanone
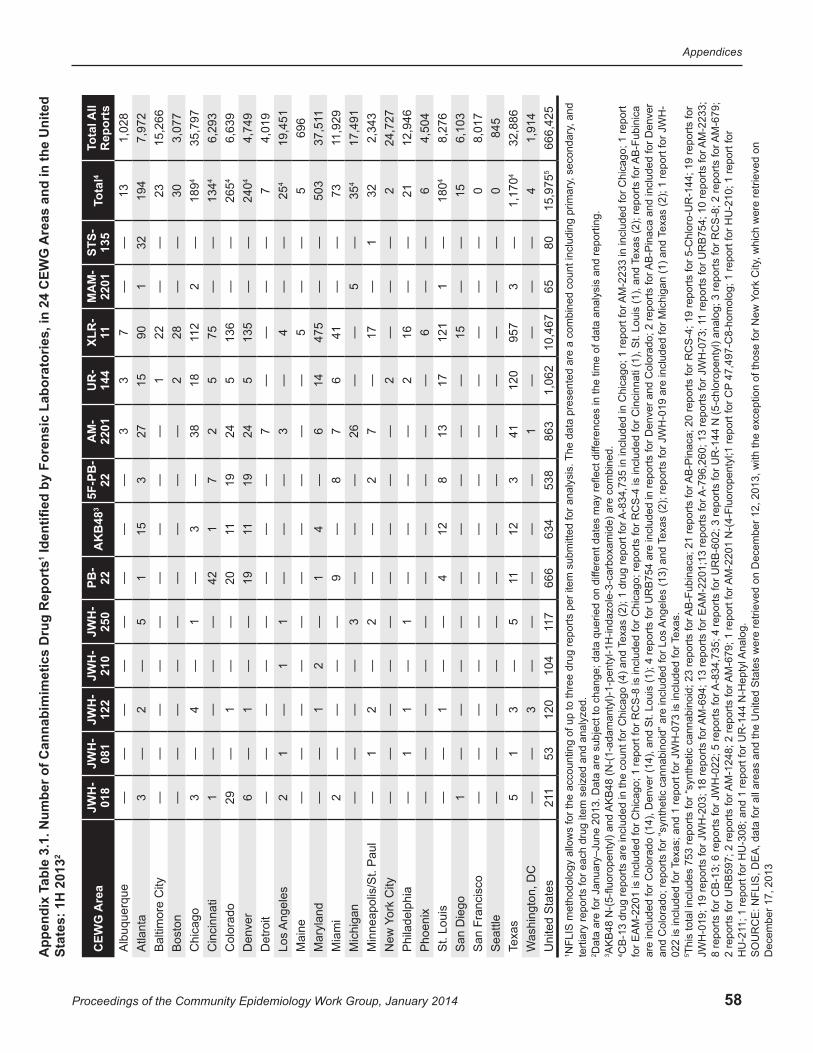
58
Appendices
Proceedings of the Community Epidemiology Work Group, January 2014
Are
as a
nd in
the
Uni
ted
Iden
tified
by
Fore
nsic
Lab
orat
orie
s, in
24
CEW
G
1A
ppen
dix
Tabl
e 3.
1. N
umbe
r of C
anna
bim
imet
ics
Dru
g R
epor
ts 2
Stat
es: 1
H 2
013
Are
aC
EWG
JW
H-
018
JWH
-08
1JW
H-
122
JWH
-21
0JW
H-
250
PB-
223
AK
B48
5F-P
B-
22A
M-
2201
U
R-
144
XL
R-
11M
AM
-22
01ST
S-13
5ot
al4
TTo
tal A
ll R
epor
tsA
lbuq
uerq
ue—
——
——
——
—3
37
——
131,
028
Atla
nta
3—
2—
51
153
2715
901
3219
47,
972
Bal
timor
e C
ity—
——
——
——
——
122
——
2315
,266
B
osto
n—
——
——
——
——
228
——
303,
077
Chi
cago
3—
4—
1—
3—
3818
211
2—
1894
35,7
97
Cin
cinn
ati
1—
——
—42
17
25
75—
—4
134
6,29
3C
olor
ado
29—
1—
—20
1119
245
136
——
426
56,
639
Den
ver
6—
1—
—19
1119
245
135
——
424
04,
749
Det
roit
——
——
——
——
7—
——
—7
4,01
9 Lo
s A
ngel
es2
1—
11
——
—3
—4
——
425
19,4
51M
aine
——
——
——
——
——
5—
—5
696
Mar
ylan
d—
—1
2—
14
—6
1447
5—
—50
31
37,5
1M
iam
i2
——
——
9—
87
641
——
7311
,929
M
ichi
gan
——
——
3—
——
26—
—5
—4
3517
,491
Min
neap
olis
/St.
Pau
l—
12
—2
——
27
—17
—1
322,
343
City
ork
New
Y—
——
——
——
——
2—
——
224
,727
Phi
lade
lphi
a—
11
—1
——
——
216
——
2112
,946
P
hoen
ix—
——
——
——
——
—6
——
64,
504
St.
Loui
s—
—1
——
412
813
1712
11
—18
048,
276
San
Die
go1
——
——
——
——
—15
——
156,
103
San
Fra
ncis
co—
——
——
——
——
——
——
08,
017
Sea
ttle
——
——
——
——
——
——
—0
845
Texa
s5
13
—5
1112
341
120
957
3—
41,
170
32,8
86
Was
hing
ton,
DC
——
3—
——
——
1—
——
—4
1,91
4U
nite
d S
tate
s112
5312
010
47
1166
663
453
886
31,
062
10,4
6765
8015
,975
566
6,42
5, a
nd
AB
-Fub
inic
a
AM
-223
3;
AM
-679
;
The
data
pre
sent
ed a
re a
com
bine
d co
unt i
nclu
ding
prim
ary,
sec
onda
ry
AM
-223
3 in
incl
uded
for C
hica
go; 1
repo
rt
fere
nces
in th
e tim
e of
dat
a an
alys
is a
nd re
porti
ng.
exas
(2);
repo
rts fo
r
exas
(2);
1 re
port
for J
WH
-T
T AB
-Pin
aca
and
incl
uded
for D
enve
r
1 re
ports
for U
RB
754;
10
repo
rts fo
r
47,
497-
C8-
hom
olog
; 1 re
port
for H
U-2
10; 1
repo
rt fo
r
, whi
ch w
ere
retri
eved
on
ork
City
Y
A-8
34,7
35 in
incl
uded
in C
hica
go; 1
repo
rt fo
r
A-7
96,2
60; 1
3 re
ports
for J
WH
-073
; 1
per
item
sub
mitt
ed fo
r ana
lysi
s.
fere
nt d
ates
may
refle
ct d
if
AB
-Pin
aca;
20
repo
rts fo
r RC
S-4
; 19
repo
rts fo
r 5-C
hlor
o-U
R-1
44; 1
9 re
ports
for
ed o
n di
f
AM
-220
1 N
-(4-
Fluo
rope
ntyl
;1 re
port
for C
P
exas
(2);
1 dr
ug re
port
for
Texa
s (2
); re
ports
for J
WH
-019
are
incl
uded
for M
ichi
gan
(1) a
nd
AK
B48
(N-(
1-ad
aman
tyl)-
1-pe
ntyl
-1H
-inda
zole
-3-c
arbo
xam
ide)
are
com
bine
d.
AB
-Fub
inac
a; 2
1 re
ports
for
AM
-694
; 13
repo
rts fo
r EA
M-2
201;
13 re
ports
for
A-8
34,7
35; 4
repo
rts fo
r UR
B-6
02; 3
repo
rts fo
r UR
-144
N (5
-chl
orop
enty
l) an
alog
; 3 re
ports
for R
CS
-8; 2
repo
rts fo
r
NFL
IS m
etho
dolo
gy a
llow
s fo
r the
acc
ount
ing
of u
p to
thre
e dr
ug re
ports
Dat
a ar
e fo
r Jan
uary
–Jun
e 20
13. D
ata
are
subj
ect t
o ch
ange
; dat
a qu
eri
Ang
eles
(13)
and
AM
-124
8; 2
repo
rts fo
r
Texa
s; a
nd 1
repo
rt fo
r JW
H-0
73 is
incl
uded
for T
exas
.
AK
B48
N-(
5-flu
orop
enty
l) an
d C
B-1
3 dr
ug re
ports
are
incl
uded
in th
e co
unt f
or C
hica
go (4
) and
Tfo
r EA
M-2
201
is in
clud
ed fo
r Chi
cago
; 1 re
port
for R
CS
-8 is
incl
uded
for C
hica
go; r
epor
ts fo
r RC
S-4
is in
clud
ed fo
r Cin
cinn
ati (
1), S
t. Lo
uis
(1),
and
are
incl
uded
for C
olor
ado
(14)
, Den
ver (
14),
and
St.
Loui
s (1
); 4
repo
rts fo
r UR
B75
4 ar
e in
clud
ed in
repo
rts fo
r Den
ver a
nd C
olor
ado;
2 re
ports
for
and
Col
orad
o; re
ports
for “
synt
hetic
can
nabi
noid
” are
incl
uded
for L
os
This
tota
l inc
lude
s 75
3 re
ports
for “
synt
hetic
can
nabi
noid
; 23
repo
rts fo
r
AM
-679
; 1 re
port
for
1; 1
repo
rt fo
r HU
-308
; and
1 re
port
for U
R-1
44 N
-Hep
tyl A
nalo
g.
1 terti
ary
repo
rts fo
r eac
h dr
ug it
em s
eize
d an
d an
alyz
ed.
2 3 4 022
is in
clud
ed fo
r 5 JW
H-0
19; 1
9 re
ports
for J
WH
-203
; 18
repo
rts fo
r 8
repo
rts fo
r CB
-13;
6 re
ports
for J
WH
-022
; 5 re
ports
for
2 re
ports
for U
RB
597;
2 re
ports
for
HU
-21
SO
UR
CE
: NFL
IS, D
EA
, dat
a fo
r all
area
s an
d th
e U
nite
d S
tate
s w
ere
retri
eved
on
Dec
embe
r 12,
201
3, w
ith th
e ex
cept
ion
of th
ose
for N
ew
Dec
embe
r 17,
201
3
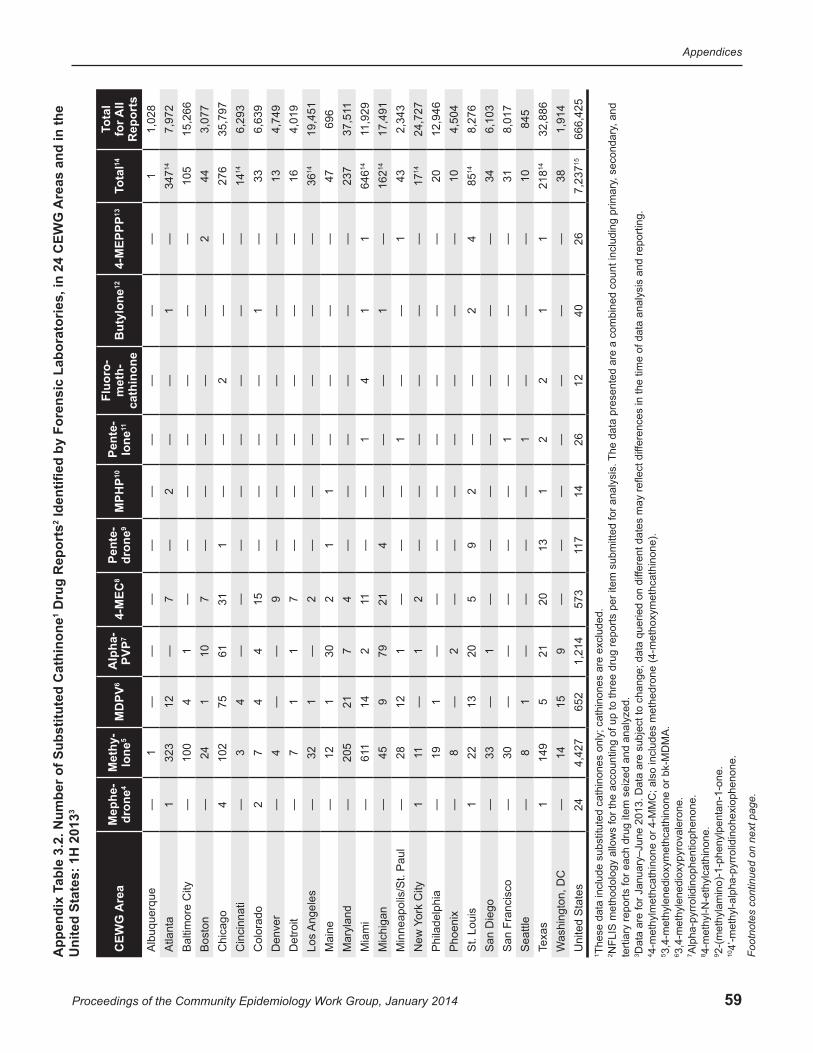
59
Appendices
Proceedings of the Community Epidemiology Work Group, January 2014
Are
as a
nd in
the
24
CEW
G
Iden
tified
by
Fore
nsic
Lab
orat
orie
s, in
Dru
g R
epor
ts2
able
3.2
. Num
ber o
f Sub
stitu
ted
Cat
hino
ne1
3A
ppen
dix
TU
nite
d St
ates
: 1H
201
3
CEW
G A
rea
Mep
he-
dron
e4M
ethy
-lo
ne5
6M
DPV
Alp
ha-
PVP7
84-
MEC
Pent
e-dr
one9
10M
PHP
Pent
e- 11lo
neFl
uoro
-m
eth-
cath
inon
eB
utyl
one12
134-
MEP
PP14
otal
Tot
al
T for A
ll R
epor
ts
Alb
uque
rque
—1
——
——
——
——
—1
1,02
8A
tlant
a1
323
12—
7—
2—
—1
—14
347
7,97
2 B
altim
ore
City
—10
04
1—
——
——
——
105
15,2
66B
osto
n—
241
107
——
——
—2
443,
077
Chi
cago
410
275
6131
1—
—2
——
276
35,7
97C
inci
nnat
i—
34
——
——
——
——
1414
6,29
3 C
olor
ado
27
44
15—
——
—1
—33
6,63
9D
enve
r—
4—
—9
——
——
——
134,
749
Det
roit
—7
11
7—
——
——
—16
4,01
9Lo
s A
ngel
es—
321
—2
——
——
——
1436
19,4
51
Mai
ne—
121
302
11
——
——
4769
6M
aryl
and
—20
521
74
——
——
——
237
1 37
,51
Mia
mi
—116
142
11—
—1
41
114
646
11,9
29M
ichi
gan
—45
979
214
——
—1
—14
162
17,4
91
Min
neap
olis
/St.
Pau
l—
2812
1—
——
1—
—1
432,
343
City
ork
New
Y1
11—
12
——
——
——
1417
24,7
27
Phi
lade
lphi
a—
191
——
——
——
——
2012
,946
Pho
enix
—8
—2
——
——
——
—10
4,50
4 S
t. Lo
uis
122
1320
59
2—
—2
414
858,
276
San
Die
go—
33—
1—
——
——
——
346,
103
San
Fra
ncis
co—
30—
——
——
1—
——
318,
017
Sea
ttle
—8
1—
——
—1
——
—10
845
Texa
s1
149
521
2013
12
21
114
218
32,8
86W
ashi
ngto
n, D
C—
1415
9—
——
——
——
381,
914
Uni
ted
Sta
tes
244,
427
652
1,21
457
37
1114
2612
4026
157,
237
666,
425
, and
Th
e da
ta p
rese
nted
are
a c
ombi
ned
coun
t inc
ludi
ng p
rimar
y, s
econ
dary
fere
nces
in th
e tim
e of
dat
a an
alys
is a
nd re
porti
ng.
per
item
sub
mitt
ed fo
r ana
lysi
s.
fere
nt d
ates
may
refle
ct d
if
Thes
e da
ta in
clud
e su
bstit
uted
cat
hino
nes
only
; cat
hino
nes
are
excl
uded
.N
FLIS
met
hodo
logy
allo
ws
for t
he a
ccou
ntin
g of
up
to th
ree
drug
repo
rts
ed o
n di
fD
ata
are
for J
anua
ry–J
une
2013
. Dat
a ar
e su
bjec
t to
chan
ge; d
ata
quer
i ymet
hcat
hino
ne).
terti
ary
repo
rts fo
r eac
h dr
ug it
em s
eize
d an
d an
alyz
ed.
4-m
ethy
lmet
hcat
hino
ne o
r 4-M
MC
; als
o in
clud
es m
ethe
dron
e (4
-met
hox
3,4-
met
hyle
nedi
oxym
ethc
athi
none
or b
k-M
DM
A.
3,4-
met
hyle
nedi
oxyp
yrov
aler
one.
Alp
ha-p
yrro
lidin
ophe
ntio
phen
one.
4-m
ethy
l-N-e
thyl
cath
inon
e.2-
(met
hyla
min
o)-1
-phe
nylp
enta
n-1-
one.
4’-m
ethy
l-alp
ha-p
yrro
lidin
ohex
ioph
enon
e.
1 2 3 4 5 6 7 8 9 10 Foot
note
s co
ntin
ued
on n
ext p
age.
60
Appendices
Proceedings of the Community Epidemiology Work Group, January 2014
Footnotes continued for Appendix Table 3.2.
11(ß-keto-methylbenzodioxolylpentanamine).12ß-keto-N-methylbenzo-dioxylpropylamine.134’-methyl-alpha-pyrrolindinopropiophenone.14Ethylone (3,4-methylenedioxyethylcathinone) drug reports are included in the count for Atlanta (one report), Los Angeles (one), and Texas (two); buphedrone (alpha-methylamino-butyophenone(MABP)) reports are included in the count for Cincinnati (four) and St. Louis (seven); three ethylcathinone reports are included for Cincinnati; dimethylone (3,4-methylenedioxydimethylcathinone; bk-MDDMA) reports are include for Miami (one) and New York City (two); and three reports for alpha-PBP (alpha-pyrrolidinobutiophenone) are included for Michicagan.15This total includes 33 reports for alpha-PBP, 30 reports for “substituted cathinones,” 14 for buphedrone, 14 for dimethylone, 7 for ethylone, 4 for ethylcathinone, 3 for 4-methylbuphedrone, 3 for mophedrone (3-methylmethcathinone (3-MMC)), 1 for dibutylone (beta-keto-N,N-dimethyl-1,3-benzodioxolylbutanamine; BK-KMBDB), 1 for 3,4-DMMC (3,4-dimethylmethcathinone), 1 for MDPBP (3',4'-methylenedioxy-alpha-pyrrolidinobutiophenone), and 1 for naphyrone (naphthylpyrovalerone).SOURCE: NFLIS, DEA, data for all areas and the United States were retrieved on December 12, 2013, with the exception of those for New York City, which were retrieved on December 17, 2013
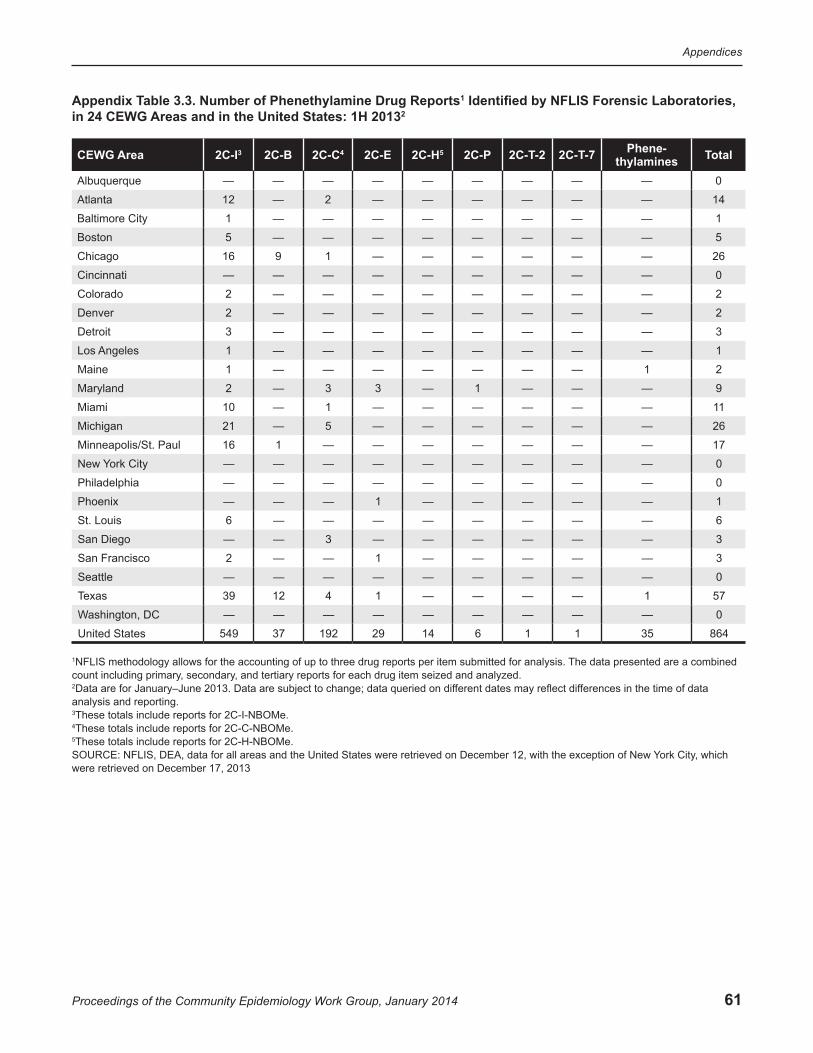
61
Appendices
Proceedings of the Community Epidemiology Work Group, January 2014
Appendix Table 3.3. Number of Phenethylamine Drug Reports1 Identified by NFLIS Forensic Laboratories, in 24 CEWG Areas and in the United States: 1H 20132
CEWG Area 2C-I3 2C-B 2C-C4 2C-E 2C-H5 2C-P 2C-T-2 2C-T-7 Phene-thylamines Total
Albuquerque — — — — — — — — — 0
Atlanta 12 — 2 — — — — — — 14
Baltimore City 1 — — — — — — — — 1
Boston 5 — — — — — — — — 5
Chicago 16 9 1 — — — — — — 26
Cincinnati — — — — — — — — — 0
Colorado 2 — — — — — — — — 2
Denver 2 — — — — — — — — 2
Detroit 3 — — — — — — — — 3
Los Angeles 1 — — — — — — — — 1
Maine 1 — — — — — — — 1 2
Maryland 2 — 3 3 — 1 — — — 9
Miami 10 — 1 — — — — — — 11
Michigan 21 — 5 — — — — — — 26
Minneapolis/St. Paul 16 1 — — — — — — — 17
New York City — — — — — — — — — 0
Philadelphia — — — — — — — — — 0
Phoenix — — — 1 — — — — — 1
St. Louis 6 — — — — — — — — 6
San Diego — — 3 — — — — — — 3
San Francisco 2 — — 1 — — — — — 3
Seattle — — — — — — — — — 0
Texas 39 12 4 1 — — — — 1 57
Washington, DC — — — — — — — — — 0
United States 549 37 192 29 14 6 1 1 35 864
1NFLIS methodology allows for the accounting of up to three drug reports per item submitted for analysis. The data presented are a combined count including primary, secondary, and tertiary reports for each drug item seized and analyzed.2Data are for January–June 2013. Data are subject to change; data queried on different dates may reflect differences in the time of data analysis and reporting.3These totals include reports for 2C-I-NBOMe.4These totals include reports for 2C-C-NBOMe.5These totals include reports for 2C-H-NBOMe.SOURCE: NFLIS, DEA, data for all areas and the United States were retrieved on December 12, with the exception of New York City, which were retrieved on December 17, 2013
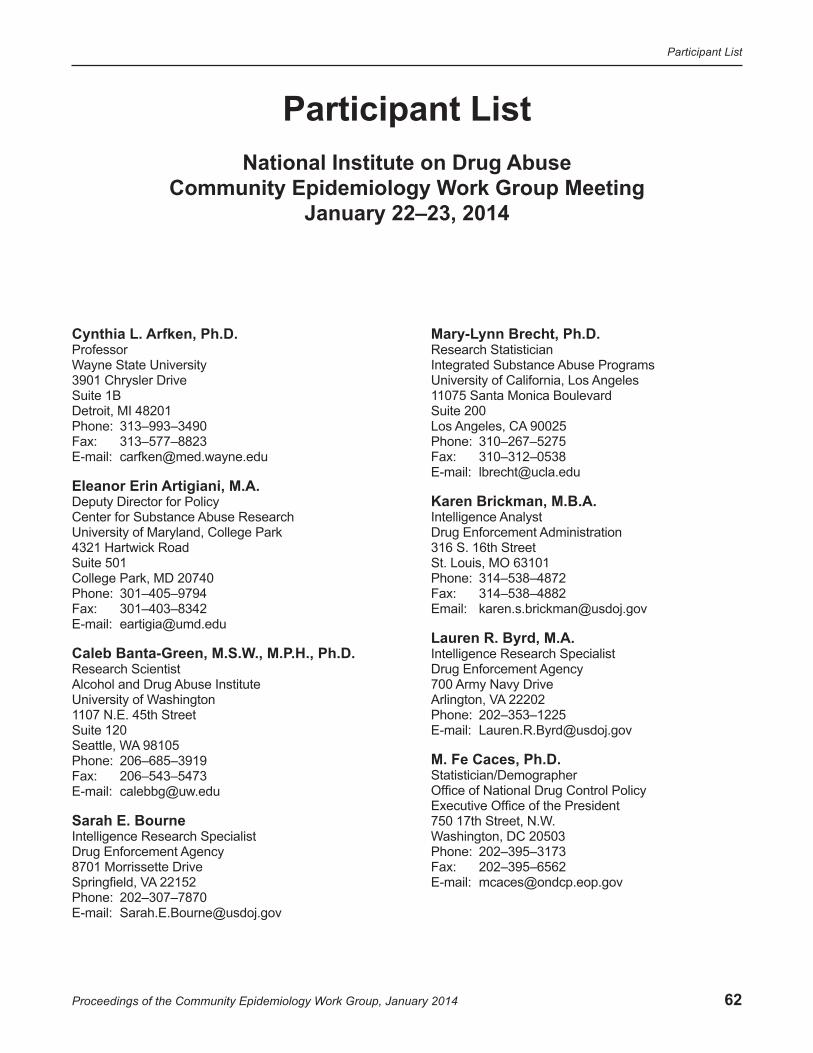
62
Participant List
Proceedings of the Community Epidemiology Work Group, January 2014
Participant List National Institute on Drug Abuse
Community Epidemiology work Group Meeting January 22–23, 2014
Cynthia L. Arfken, Ph.D.Professor Wayne State University 3901 Chrysler Drive Suite 1B Detroit, MI 48201 Phone: 313–993–3490 Fax: 313–577–8823 E-mail: [email protected]
Eleanor Erin Artigiani, M.A.Deputy Director for Policy Center for Substance Abuse Research University of Maryland, College Park 4321 Hartwick Road Suite 501 College Park, MD 20740 Phone: 301–405–9794 Fax: 301–403–8342 E-mail: [email protected]
Caleb Banta-Green, M.S.w., M.P.H., Ph.D. Research Scientist Alcohol and Drug Abuse Institute University of Washington 1107 N.E. 45th Street Suite 120 Seattle, WA 98105 Phone: 206–685–3919 Fax: 206–543–5473 E-mail: [email protected]
Sarah E. Bourne Intelligence Research Specialist Drug Enforcement Agency 8701 Morrissette Drive Springfield, VA 22152 Phone: 202–307–7870 E-mail: [email protected]
Mary-Lynn Brecht, Ph.D.Research Statistician Integrated Substance Abuse Programs University of California, Los Angeles 11075 Santa Monica Boulevard Suite 200 Los Angeles, CA 90025 Phone: 310–267–5275 Fax: 310–312–0538 E-mail: [email protected]
Karen Brickman, M.B.A. Intelligence Analyst Drug Enforcement Administration 316 S. 16th Street St. Louis, MO 63101 Phone: 314–538–4872 Fax: 314–538–4882 Email: [email protected]
Lauren R. Byrd, M.A.Intelligence Research Specialist Drug Enforcement Agency 700 Army Navy Drive Arlington, VA 22202 Phone: 202–353–1225 E-mail: [email protected]
M. Fe Caces, Ph.D. Statistician/Demographer Office of National Drug Control Policy Executive Office of the President 750 17th Street, N.W. Washington, DC 20503 Phone: 202–395–3173 Fax: 202–395–6562 E-mail: [email protected]
63
Participant List
Proceedings of the Community Epidemiology Work Group, January 2014
Redonna Chandler, Ph.D. Acting Director Division of Epidemiology, Services and Prevention
Research National Institute on Drug Abuse National Institutes of Health 6001 Executive Boulevard Bethesda, MD 20892 Phone: 301–443–8768 Fax: 301–443–2636 E-mail: [email protected]
Karyn Bjornstad Collins, M.P.A.Technical Editor, CEWG Social Solutions International, Inc. 441 Keith Avenue Missoula, MT 59801 Phone: 406–543–3481 Fax: 406–926–2802 E-mail: [email protected]
Jeffrey H. Comparin, B.S.Laboratory Director Special Testing and Research Laboratory Drug Enforcement Administration U.S. Department of Justice 2264 Dulles Summit Court Dulles, VA 20166 Phone: 703–668–3300 Fax: 703–668–3320 E-mail: [email protected]
wilson Compton, M.D., M.P.E.Deputy Director National Institute on Drug Abuse National Institutes of Health 6001 Executive Boulevard Bethesda, MD 20892-9581 Phone: 301–443–6504 E-mail: [email protected]
James K. Cunningham, Ph.D.Social Epidemiologist Department of Family and Community Medicine University of Arizona 1450 North Cherry Avenue Tucson, AZ 85719 Phone: 520–615–5080 Fax: 520–577–1864 E-mail: [email protected]
Matthew Dann, M.A. Research Analyst Health Canada Main Stats Bldg. A.L.0301A 150 Tunney's Pasture Driveway Ottawa, Ontario K1A 0K9 Canada Phone: 613–946–9191 E-mail: [email protected]
James w. Davis, M.A. Drug Epidemiologist Injury & Behavioral Epidemiology Bureau New Mexico Department of Health P.O. Box 26110 Santa Fe, NM 87502–6110 Phone: 505–827–5424 Fax: 505–827–2796 E-mail: [email protected]
Richard Denisco, M.D., M.P.H. Medical Officer Services Research Branch Division of Epidemiology, Services and Prevention
Research National Institute on Drug Abuse National Institutes of Health 6001 Executive Boulevard Bethesda, MD 20892-4371 Phone: 301–549–4371 Email: [email protected]
Brian J. Dew, Ph.D. Associate Professor and Chair Department of Counseling and
Psychological Services Georgia State University P.O. Box 3980 Atlanta, GA 30302–3890 Phone: 404–413–8168 Fax: 404–413–8013 E-mail: [email protected]
Daniel P. Dooley Director, Analysis and Surveillance Boston Public Health Commission 1010 Massachusetts Avenue Sixth Floor Boston, MA 02118 Phone: 617–534–2360 Fax: 857–288–2212 E-mail: [email protected]
Sarah Q. Duffy, Ph.D.Health Economist Services Research Branch Division of Epidemiology, Services and Prevention
Research National Institute on Drug Abuse National Institutes of Health 6001 Executive Boulevard Bethesda, MD 20892-9581 Phone: 301–451–4998 Email: [email protected]
64
Participant List
Proceedings of the Community Epidemiology Work Group, January 2014
Carol L. Falkowski Epidemiology Specialist Drug Abuse Dialogues 364 James Court St. Paul, MN 55115 Phone: 651–485–3187 E-mail: [email protected]
Alice A. Gleghorn, Ph.D.County Alcohol and Drug Administrator San Francisco Department of Public Health 1380 Howard Street Room 423 San Francisco, CA 94103 Phone: 415–377–7930 Fax: 415-255-3529 E-mail: [email protected]
James N. Hall Epidemiologist Center for Applied Research on Substance Use and
Health Disparities Nova Southeastern University 13584 S.W. 114 Terrace Miami, FL 33186 Phone: 786–547–7249 E-mail: [email protected]
Laura Hendrick Field Intelligence Manger Drug Enforcement Administration 600 Arch Street Suite 10224 Philadelphia, PA 19382 Phone: 215–861–3258 Fax: 215–861–3270 E-mail: [email protected]
James R. Hunter, R.Ph., M.P.H. Senior Program Manager Controlled Substance Abuse Center for Drug Evaluation and Research U.S. Food and Drug Administration 10903 New Hampshire Avenue Building 51, Room 5150 Silver Spring, MD 20993 E-mail: [email protected]
Heidi Israel, Ph.D., A.P.N., F.N.P., L.C.S.w. Associate Research Professor St. Louis University School of Medicine 3625 Vista 7N St. Louis, MO 63110 Phone: 314–577–8851 Fax: 314–268–5121 E-mail: [email protected]
wanda IyohaIntelligence Research Specialist Drug Enforcement Administration 8701 Morrissette Drive Springfield, VA 22152 Phone: 202–353–1303 E-mail: [email protected]
Suzanna Keller, M.L.S., M.Sc. Epidemiologist Health Canada Main Stats Bldg. A.L.0301A 150 Tunney's Pasture Driveway Ottawa, Ontario K1A 0K9 Canada Phone: 613–946–9177 E-mail: [email protected]
Suet T. Lim, Ph.D. Director of Research and Evaluation Community Behavioral Health Philadelphia Department of Behavioral Health and
Intellectual disAbility Services 801 Market Street Seventh Floor Philadelphia, PA 19107 Phone: 215–413–7165 Fax: 215–413–7121 E-mail: [email protected]
Marsha Lopez, Ph.D., M.H.S.Branch Chief Epidemiology Research Branch Division of Epidemiology, Services and Prevention
Research National Institute on Drug Abuse National Institutes of Health 6001 Executive Boulevard Bethesda, MD 20892-9581 Phone: 301–402–1846 Email: [email protected]
Jane C. Maxwell, Ph.D. Senior Research Scientist School of Social Work The University of Texas at Austin 1717 West 6th Street Suite 335 Austin, TX 78703 Phone: 512–232–0610 Fax: 512–232–0617 E-mail: [email protected]
65
Participant List
Proceedings of the Community Epidemiology Work Group, January 2014
Bruce Mendelson, M.P.A. Data Consultant Office of Drug Strategy Denver Department of Human Services 1200 Federal Boulevard Denver, CO 80204–3221 Phone: 720–844–2158 Fax: 720–944–1346 E-mail: [email protected]
Moira P. O'Brien, M.Phil. Health Scientist Administrator Epidemiology Research Branch Division of Epidemiology, Services and Prevention
Research National Institute on Drug Abuse National Institutes of Health Room 5153, MSC-9589 6001 Executive Boulevard Bethesda, MD 20892 Phone: 301–402–1881 Fax: 301–443–2636 E-mail: [email protected]
Lawrence J. Ouellet, Ph.D. Research Professor Division of Epidemiology and Biostatistics School of Public Health The University of Illinois at Chicago Mail Code 923 1603 West Taylor Street Chicago, IL 60612 Phone: 312–355–0145 Fax: 312–996–1450 E-mail: [email protected]
Denise Paone, Ed.D. Director of Research Bureau of Alcohol and Drug Use Prevention,
Care and Treatment New York City Department of Health and
Mental Hygiene 42-09 28th Street 19th Floor, CN-14 Long Island City, NY 11101 Phone: 347–396–7015 E-mail: [email protected]
Artisha R. Polk, M.P.H. Mathematical Statistician Drug Enforcement Administration DEA Headquarters/OD/ODE 8701 Morrissette Drive Springfield, VA 22152 Phone: 202–307–7180 Fax: 202–353–1263 E-mail: [email protected]
Laura Petts, M.A. Research Analyst Health Canada Main Stats Bldg. A.L. 0301A 150 Tunney’s Pasture Driveway Ottawa, Ontario K1A 0K9 Canada Phone: 613–946–9160 E-mail: [email protected]
Sandra Putnam, M.Sc., Ph.D. Project Director, CEWG Social Solutions International, Inc. 1541 Stewartstown Road Morgantown, WV 26505 Phone: 304–292–5148 Fax: 304–292–5149 E-mail: [email protected]
Gregory Rainone, Ph.D.Research Scientist IV Chief of Epidemiology Unit New York State Office of Alcoholism and Substance
Abuse Services 501 7th Avenue Eighth Floor New York, NY 10018 Phone: 646–728–4607 Fax: 646–728–4685 E-mail: [email protected]
Elizabeth B. Robertson, Ph.D. Senior Advisor for Prevention Research Division of Epidemiology, Services and Prevention
Research National Institute on Drug Abuse National Institutes of Health 6001 Executive Boulevard Bethesda, MD 20892-9581 Phone: 301–402–1720 Email: [email protected]
Jan Scaglione, Pharm.D., M.T., D.ABAT Clinical Toxicologist Cincinnati Children’s Hospital Medical Center Drug and Poison Information Center 3333 Burnet Avenue ML–9004 Cincinnati, OH 45229 Phone: 513–636–5060 Fax: 513–636–5072 E-mail: [email protected]

66
Participant List
Proceedings of the Community Epidemiology Work Group, January 2014
Jeffrey Schulden, M.D.Medical Officer Epidemiology Research Branch Division of Epidemiology, Services and Prevention
Research National Institute on Drug Abuse National Institutes of Health 6001 Executive Boulevard Bethesda, MD 20892 Phone: 301–402–1526 Email: [email protected]
Belinda E. Sims, Ph.D. Health Scientist Administrator Prevention Research Branch Division of Epidemiology, Services and Prevention
Research National Institute on Drug Abuse National Institutes of Health 6001 Executive Boulevard Bethesda, MD 20892-9581 Phone: 301–402–1533 Email: [email protected]
Judy Snider, M.Sc.Manager of Enhanced Monitoring and Reporting Office of Research and Surveillance, Controlled
Substances and Tobacco Directorate Healthy Environments and Consumer Safety Branch Health Canada Main Stats Bldg. A.L.0301A 150 Tunney's Pasture Driveway Ottawa, Ontario K1A 0K9 Canada Phone: 613–946–9209 Fax: 613–952–5188 E-mail: [email protected]
Marcella H. Sorg, Ph.D., R.N.Research Associate Professor and Director,
Rural Drug & Alcohol Research Program Margaret Chase Smith Policy Center University of Maine 5784 York Complex Building 4 Orono, ME 04469–5784 Phone: 207–581–2596 Fax: 207–581–1266 E-mail: [email protected]
Linda Truitt, Ph.D. Senior Social Science Analyst National Institute of Justice U.S. Department of Justice 820 Seventh Street, N.W. Washington, DC 20531 Phone: 202–353–9081 Fax: 202–616–0275 E-mail: [email protected]
Karla D. wagner, Ph.D.Assistant Professor University of California, San Diego 9500 Gilman Drive Mail Code 0849 La Jolla, CA 92093 Phone: 619–543–0857 Fax: 858–534–7566 E-mail: [email protected]
D. william wood, M.P.H., Ph.D. Professor Department of Sociology University of Hawaii at Manoa 2424 Maile Way Saunders Hall 247 Honolulu, HI 96822 Phone: 808–292–2939 Fax: 808–956–3707 E-mail: [email protected]
Matthew young, Ph.D.Senior Research and Policy Analyst Canadian Centre on Substance Abuse 75 Albert Street Ottawa, Ontario K1R 7L8 Canada Phone: 613–235–4048, extension 222 E-mail: [email protected]
Meeting Coordinator
Heather Evanson, CGMP Project Manager Social Solutions International, Inc. 8070 Georgia Avenue, Suite 201 Silver Spring, MD 20910 Phone: 301–825–4410 Fax: 866–369–6809 E-mail: [email protected]
Assistant Meeting Coordinator
Kristen Stier, M.A., CGMP Project Manager Social Solutions International, Inc. 8070 Georgia Avenue, Suite 201 Silver Spring, MD 20910 Phone: 202–870–2226 Fax: 866–369–6809 E-mail: [email protected]

June 2014