highlighting and quantifying seismic data quality concernshighlighting and quantifying seismic data...
TRANSCRIPT
FMGM 2015 – PM Dight (ed.) © 2015 Australian Centre for Geomechanics, Perth, ISBN 978-0-9924810-2-5
FMGM 2015, Sydney, Australia 539
Highlighting and quantifying seismic data quality concerns
IG Morkel Australian Centre for Geomechanics, The University of Western Australia, Australia
J Wesseloo Australian Centre for Geomechanics, The University of Western Australia, Australia
P Harris Australian Centre for Geomechanics, The University of Western Australia, Australia
Abstract
For seismically active mines, the analysis of the mining induced seismicity forms an important part of the geotechnical risk management and design process. However, it appears that the quality of seismic data is seldom scrutinised, resulting in lower quality databases and, therefore, unreliable results. These results are used to make decisions affecting both the safety and productivity of mine sites. For this reason assessing and quantifying the database quality is important.
Many mine sites rely on seismic service providers to help maintain the seismic system and to provide good quality seismic data, which they will use in seismic analysis techniques. The mine personnel generally assume good quality data and do not have the tools or expertise to evaluate the integrity of a database. In our experience, data quality problems are experienced by most mines, to some degree, with the quality at some mines having a serious impact on decision making.
This paper presents a method for the assessment of seismic data quality. This method highlights the areas in the database that is most contaminated with bad data and thus provides a first step towards rectifying the problem. Quality indices are also developed to objectively quantify the database quality. The methods presented in this paper are work in progress on which the authors will improve in the near future.
1 Introduction
Seismic data analyses are of a critical importance in geotechnical design and risk management and affect specific tasks like support design and re-entry analysis. Errors in the database will adversely affect the analysis results and decision making, which may lead to unsafe practices or loss in production.
McRae (1964) explains that the quality of the input data affects the quality of the output data, referred to as GIGO (garbage in, garbage out). Redman (1998) found that when enterprises use poor data quality, it leads to an increase in operational costs, inefficiency in decision making and a reduced ability to make and execute strategies. The importance of good data quality practices is widely accepted, but it is seldom given the time or the priority needed to ensure good analysis results. Tayi and Ballou (1998) argue that this is due to the complexity of factors influencing databases and the ambiguity of what a good quality database is.
Many mine sites rely on seismic service providers to help maintain the seismic system and to provide good quality seismic data which they will use in seismic analysis techniques such as those discussed in Wesseloo (2014), Wesseloo et al. (2014), Wesseloo (2013), Disley (2014), Van Aswegen et al. (2005) and Scheepers et al. (2012). An investigation of seismic data quality from several mine sites reveals that poor data quality is predominantly due to:
1. Noise contaminating the database. Noise sources are often a result of drilling, blasting, orepasses, crushers or more general cultural noise as a result of mining activities.
2. Inconsistent source parameter calculations.
As the problem of poor data quality becomes increasingly difficult to manage and rectify, the longer it is left unchecked, the need to address data quality issues as soon as possible becomes more pressing.
https://papers.acg.uwa.edu.au/p/1508_37_Morkel/

Highlighting and quantifying seismic data quality concerns IG Morkel et al.
540 FMGM 2015, Sydney, Australia
In addition to highlighting the concerns of data quality, this paper introduces two quality indices. These indexes are used to quantify the integrity of data as a single number, such that a user could easily distinguish between a good and bad dataset.
2 Current state of seismic data quality
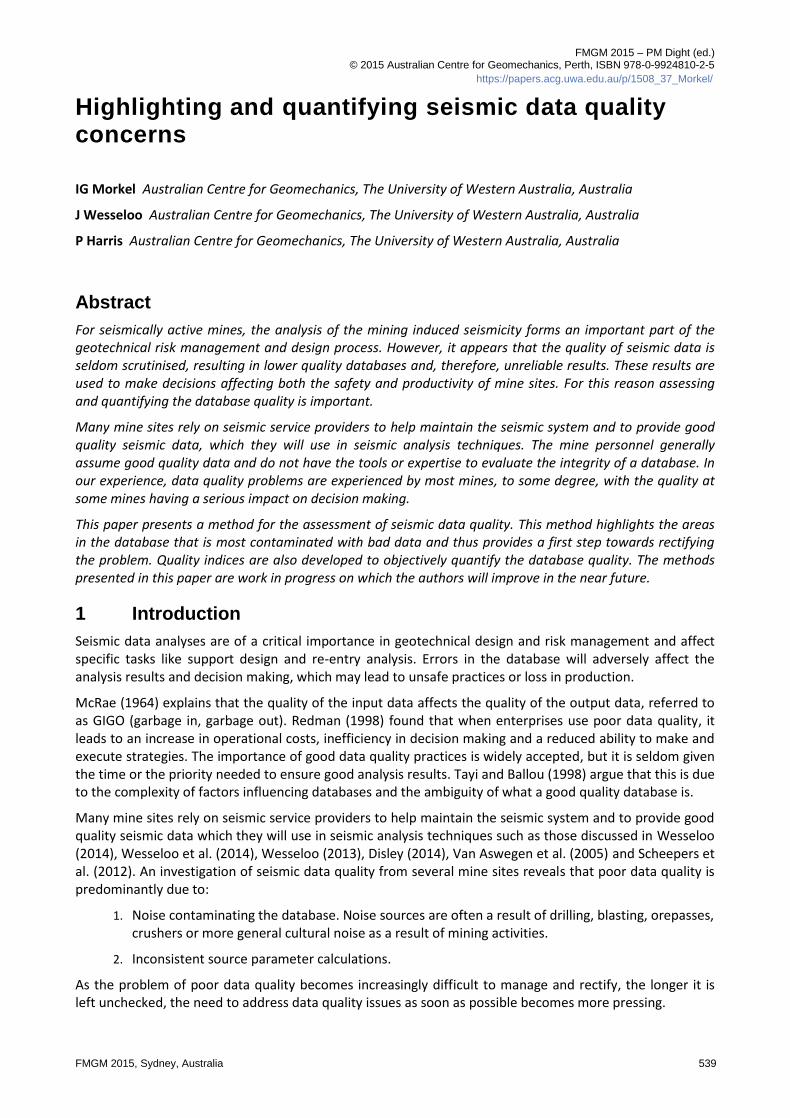
The data quality application (App) developed for the mXrap software is useful for highlighting the most prominent of these database artefacts (Harris & Wesseloo 2015). Some examples of poor database artefacts for several sites are shown in Figure 1.
(a) (b)
(c) (d)
Figure 1 Typical artefacts seen in seismic databases: (a) changes in s-wave corner-frequency ranges are related to changes in seismic parameter calculations; (b) linear artefacts seen due to static stress drop inconsistencies; (c) linear artefacts seen due to inconsistencies in source radius calculations; and (d) drilling noise
Underground mining
FMGM 2015, Sydney, Australia 541
Figure 1(a) illustrates how the ranges of the s-wave corner frequency abruptly changes numerous times over a span of several years. These changes seem to correlate in time to software upgrades or adjustments to the hardware configuration. Software updates sometimes result in such changes in source parameters as a result of updated algorithms for parameter calculations. Figures 1(b) and (c) shows linear artefacts caused by errors in static stress drop and corner frequency calculations. It is also possible to identify noise in a database if it is removed from the main population of events, (Figure 1(d)).
Eight mine site databases (from Australia, Canada, USA and Sweden) were investigated in this study. All of these databases show evidence of at least one or more of these artefacts. These artefacts are not related to any specific seismic system. The mXrap seismic data quality app highlights some of the more prominent and more obvious issues; it does not detect more subtle data quality problems and it does not quantify the database quality (Morkel & Wesseloo, 2015).
3 Method for highlighting anomalies in the data due to problems in data quality
The method consists of a statistical evaluation of the parameters in the database, which is used to generate a model of expected density distribution for different seismic source parameters. This is called the baseline model. The baseline model of parameter density is then compared to the measured parameter density to highlight anomalies. These anomalies are then investigated.
The method used to investigate the quality of a database is conditional to how well the model can predict the macro-behaviour in the database. The assumption is that the model is clean from noise (it does not contain local inconsistencies) and, therefore, will highlight areas within unexpected data points or lack thereof. If the model does not describe the database well enough, it can then be adjusted to include the additional database characteristic.
3.1 Set-up of the baseline model
The baseline model is determined by finding the density for each grid cell based on the distribution of the parameters investigated. The distributions are found from the dataset. For the log(energy)-log(moment) chart, the log(moment) distribution is determined from the slope of the frequency-log(moment) chart. It is assumed it follows a power-law behaviour. The second distribution, apparent stress, is assumed to be a log normal distribution. Apparent stress is used instead of energy, as it describes the spread of data in the log(energy)-log(moment) chart. The energy is then determined from Mendecki et al. (1999):
𝐸𝑛𝑒𝑟𝑔𝑦 =𝐴𝑆 ∙ 𝑀0
𝐺 (1)
where:
AS = apparent stress (Pa).
Mo = total seismic moment (Nm).
G = shear modulus of the rock mass (Pa).
In Equation 1, the shear modulus simply acts as a scaling constant and the true value is irrelevant for this work as long as the same value is used in building the model as is used in the database. An industry default of 30 GPa is generally used.
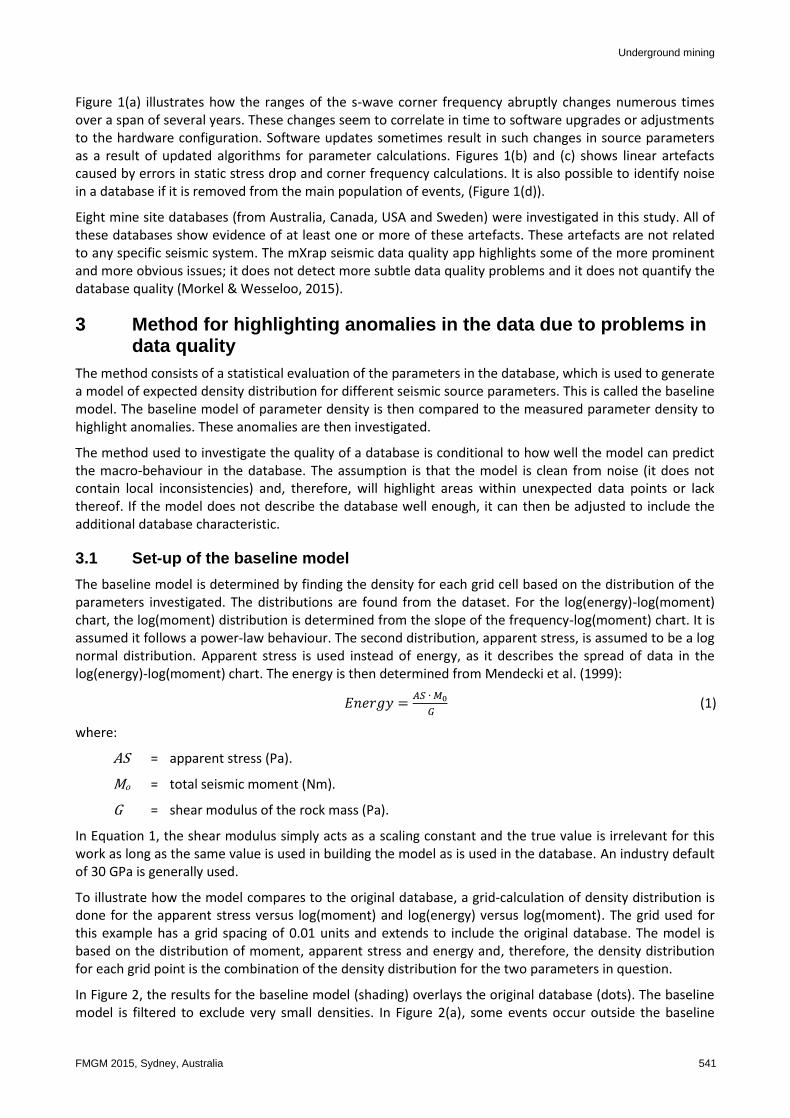
To illustrate how the model compares to the original database, a grid-calculation of density distribution is done for the apparent stress versus log(moment) and log(energy) versus log(moment). The grid used for this example has a grid spacing of 0.01 units and extends to include the original database. The model is based on the distribution of moment, apparent stress and energy and, therefore, the density distribution for each grid point is the combination of the density distribution for the two parameters in question.
In Figure 2, the results for the baseline model (shading) overlays the original database (dots). The baseline model is filtered to exclude very small densities. In Figure 2(a), some events occur outside the baseline
Highlighting and quantifying seismic data quality concerns IG Morkel et al.
542 FMGM 2015, Sydney, Australia
model boundaries. These are events at extreme values that would occur at a low density distribution. The same can be seen in Figure 2(b); however, in this case, many of those events are due to blasts, which would not be described by the baseline model.
(a)
(b)
Figure 2 Density distribution based on the model (contours) is overlayed onto the original event database (grey dots): (a) the apparent stress versus
Underground mining
FMGM 2015, Sydney, Australia 543
log(moment) plot for the model and the database; (b) the log(energy) versus log(moment) plot for the model and the database
3.2 Highlighting data anomalies
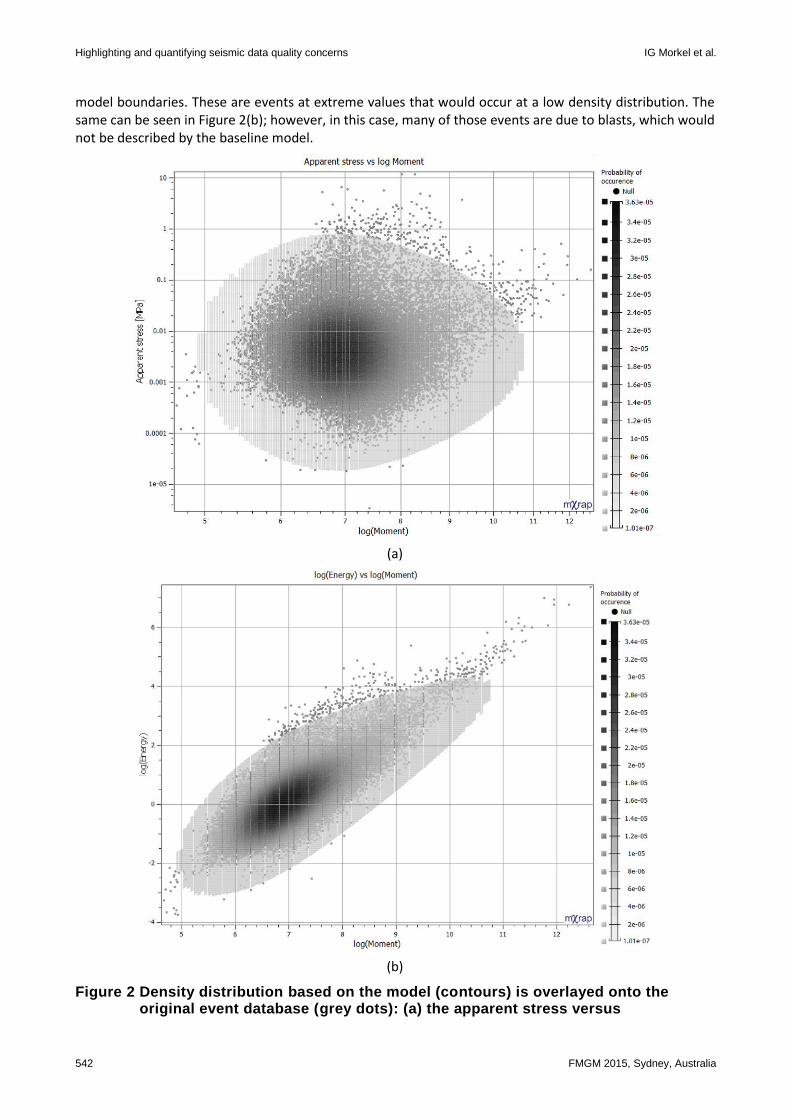
Anomalies in the database are highlighted by comparing the density distribution of the baseline model with the density distribution of the database. In Figure 3 the density distribution of a database for the log(energy) versus log(moment) chart is shown.
Figure 3 Density distribution for a database. Dark colours indicate higher probabilities and lighter colours lower probabilities
To describe the difference between the database and the baseline model, the density difference for each grid point is calculated. Density difference is defined as:
𝑫𝑫𝒊𝒇𝒇 = (𝑫𝒅𝒂𝒕𝒂𝒃𝒂𝒔𝒆−𝑫𝒃𝒂𝒔𝒆𝒍𝒊𝒏𝒆)/2
(𝑫𝒅𝒂𝒕𝒂𝒃𝒂𝒔𝒆+𝑫𝒃𝒂𝒔𝒆𝒍𝒊𝒏𝒆)/2, (2)
Ddatabase is the database density and Dbaseline is the expected density of the baseline model. The equation will yield values of 0 when the measure and expected densities are the same. The density difference will approach -1 when the database density is approaching zero or is much smaller than the baseline density, Dbaseline. The density difference will approach 1 when Ddatabase is much larger than Dbaseline. To ensure the fringe events are ignored and do not skew results, a cut-off limit is applied to exclude areas with very low data density.
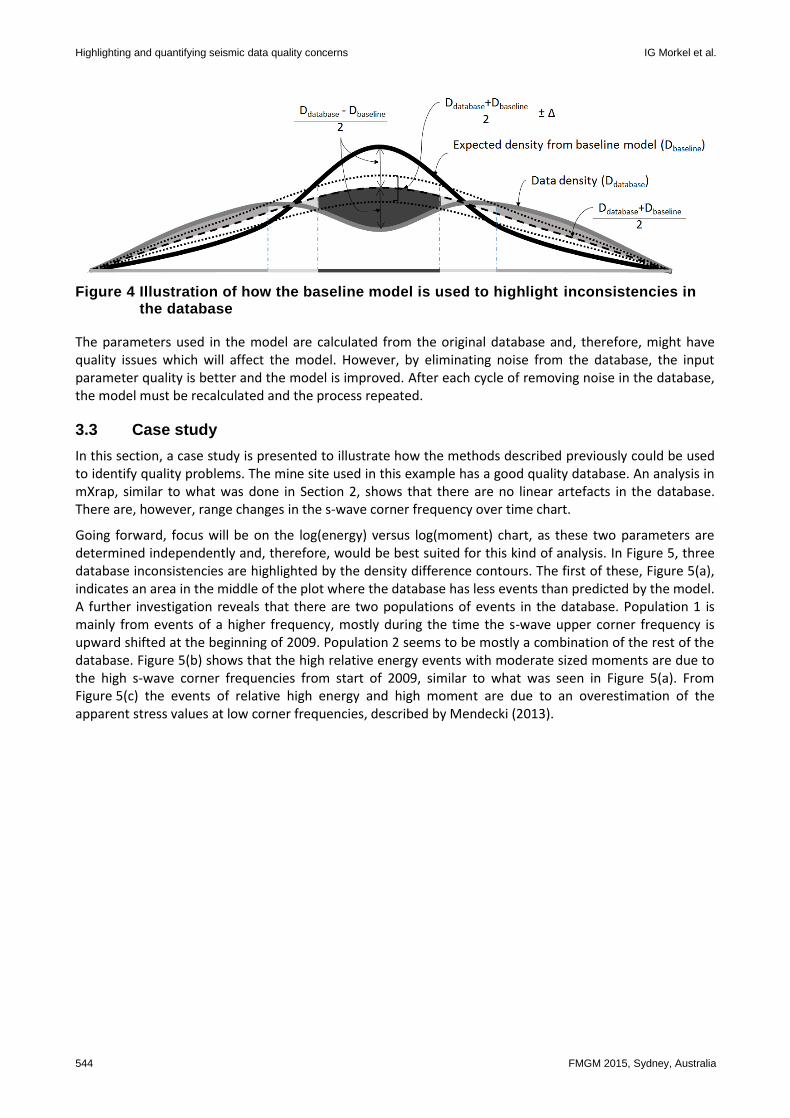
Figure 4 is an illustration of the density difference between the baseline model and the database. The light-grey grid points indicate areas with less than 30% difference between model and database; the dark-grey grid points indicate where there are more events in the database than predicted by the baseline model; and the grey grid points indicate where there is a lack of events in the database. The black dots show the events from the database. Anomalies in the database caused by noise, blasts and other database inconsistencies would coincide with the grey and dark-grey areas.
Highlighting and quantifying seismic data quality concerns IG Morkel et al.
544 FMGM 2015, Sydney, Australia
Figure 4 Illustration of how the baseline model is used to highlight inconsistencies in the database
The parameters used in the model are calculated from the original database and, therefore, might have quality issues which will affect the model. However, by eliminating noise from the database, the input parameter quality is better and the model is improved. After each cycle of removing noise in the database, the model must be recalculated and the process repeated.
3.3 Case study
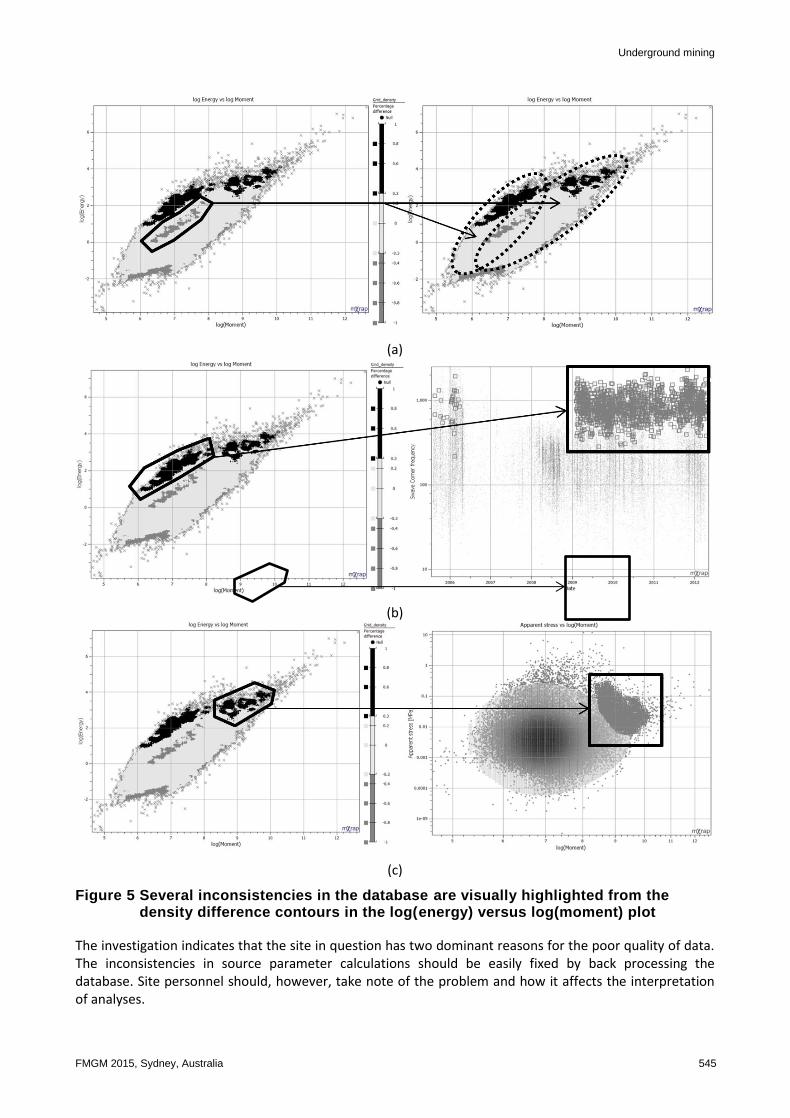
In this section, a case study is presented to illustrate how the methods described previously could be used to identify quality problems. The mine site used in this example has a good quality database. An analysis in mXrap, similar to what was done in Section 2, shows that there are no linear artefacts in the database. There are, however, range changes in the s-wave corner frequency over time chart.
Going forward, focus will be on the log(energy) versus log(moment) chart, as these two parameters are determined independently and, therefore, would be best suited for this kind of analysis. In Figure 5, three database inconsistencies are highlighted by the density difference contours. The first of these, Figure 5(a), indicates an area in the middle of the plot where the database has less events than predicted by the model. A further investigation reveals that there are two populations of events in the database. Population 1 is mainly from events of a higher frequency, mostly during the time the s-wave upper corner frequency is upward shifted at the beginning of 2009. Population 2 seems to be mostly a combination of the rest of the database. Figure 5(b) shows that the high relative energy events with moderate sized moments are due to the high s-wave corner frequencies from start of 2009, similar to what was seen in Figure 5(a). From Figure 5(c) the events of relative high energy and high moment are due to an overestimation of the apparent stress values at low corner frequencies, described by Mendecki (2013).
Underground mining
FMGM 2015, Sydney, Australia 545
(a)
(b)
(c)
Figure 5 Several inconsistencies in the database are visually highlighted from the density difference contours in the log(energy) versus log(moment) plot
The investigation indicates that the site in question has two dominant reasons for the poor quality of data. The inconsistencies in source parameter calculations should be easily fixed by back processing the database. Site personnel should, however, take note of the problem and how it affects the interpretation of analyses.
Highlighting and quantifying seismic data quality concerns IG Morkel et al.
546 FMGM 2015, Sydney, Australia
Note: at the time of writing of this paper, back processing has not been performed and, as a result, the improvement resulting from the back processing is still unknown.
4 Quality index
The previous section illustrated how density difference is used to find anomalies in the database which highlight inconsistencies and noise contamination in the database. It, however, does not quantify the extent of poor data quality. This section introduces two indices aimed at quantifying the overall quality of the database.
The first index aimed at quantifying the integrity of data is the baseline index (BLI). It describes the average correlation between the baseline model and the database density. It has a value between 0-10, where 0 indicates no correlation and 10 indicates complete correlation. The BLI is calculated from:
𝐵𝐿𝐼 =∫ |
𝐷𝑑𝑏−𝐷𝑏𝑙𝐷𝑑𝑏+𝐷𝑏𝑙
|𝐴
𝐴∙ 10, (3)
where:
Ddb = database density distribution.
Dbl = baseline density distribution.
A = area of integration.
The second of these indices, the percentage correlation index (PCI), quantifies the percentage of area which has an acceptable density difference. PCI is defined as:
𝑃𝐶𝐼 = ∫ [|𝐷𝑑𝑏−𝐷𝑏𝑙
𝐷𝑑𝑏+𝐷𝑏𝑙| ∙ 100% < ∆]
𝐴, (4)
where:
Ddb = database density distribution.
Dbl = baseline density distribution.
A = area of integration.
Δ = acceptable data quality tolerance range.
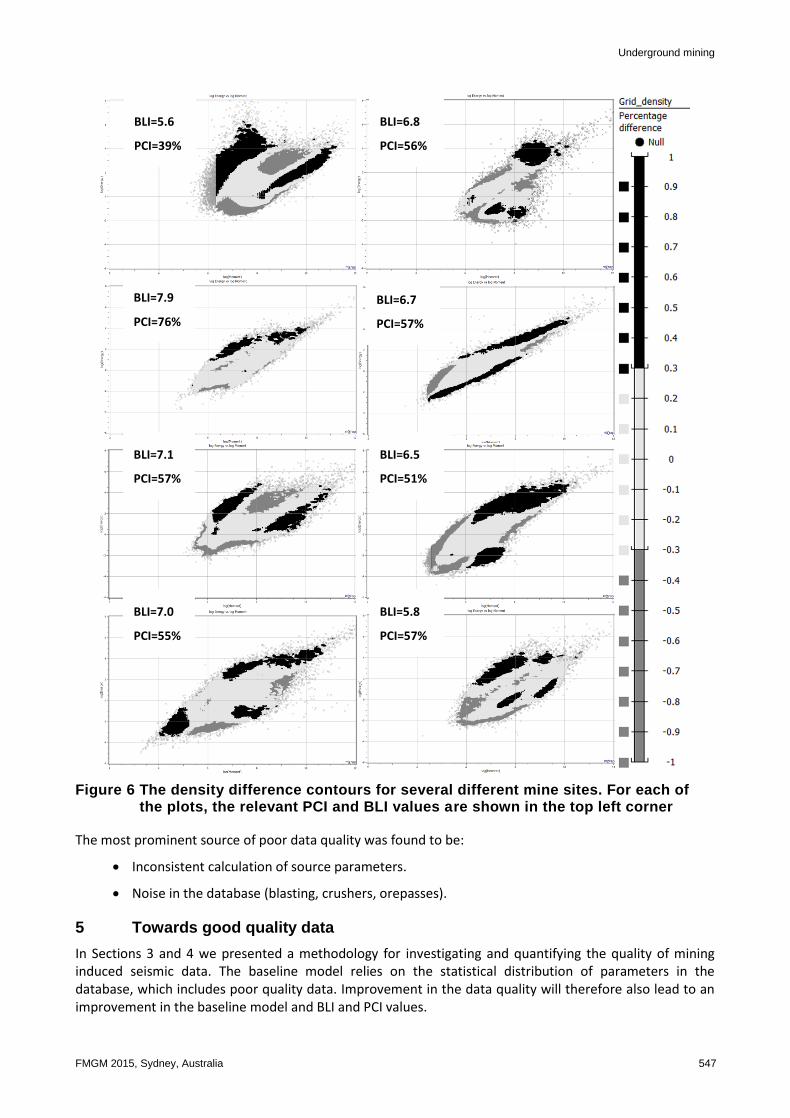
Several other mine sites have been investigated to determine typical PCI and BLI values, as well as giving guidance on the general sources of data quality problems. Figure 6 shows the density difference for each of the log(energy)-log(moment) plots, as well as the PCI and BLI values for each site. A data quality tolerance range (Δ) of 30% was used to determine the PCI values.
For the case study site, the calculated values for PCI is 76% and a BLI value of 7.9. None of the other sites have a better PCI or BLI value compared to what was found for the case study site. This is concerning as several data artefacts could be identified from that site. Of the eight mines investigated in this study, only one had a PCI greater than 60%, six had values between 50 and 60% and one had a value less than 40%. Three mines had BLI values of 7 or higher, three had values between 6 and 7, and two had values below 6.
This study confirms the statement in Section 2 that data quality is a widespread problem for seismically active mines. If the best site, the case study site, has several artefacts contaminating the data, the rest must be similar or worse. The PCI and BLI values are useful indicators of the extent of the problem. Based on the results, our early suggestion is BLI values of above 9.0 and PCI values of more than 90% are good. A further study is still required to more formally define these threshold values.
Underground mining
FMGM 2015, Sydney, Australia 547
Figure 6 The density difference contours for several different mine sites. For each of the plots, the relevant PCI and BLI values are shown in the top left corner
The most prominent source of poor data quality was found to be:
Inconsistent calculation of source parameters.
Noise in the database (blasting, crushers, orepasses).
5 Towards good quality data
In Sections 3 and 4 we presented a methodology for investigating and quantifying the quality of mining induced seismic data. The baseline model relies on the statistical distribution of parameters in the database, which includes poor quality data. Improvement in the data quality will therefore also lead to an improvement in the baseline model and BLI and PCI values.
BLI=5.6
PCI=39%
BLI=6.8
PCI=56%
BLI=7.9
PCI=76%
BLI=6.7
PCI=57%
BLI=7.1
PCI=57%
BLI=6.5
PCI=51%
BLI=7.0
PCI=55%
BLI=5.8
PCI=57%
Highlighting and quantifying seismic data quality concerns IG Morkel et al.
548 FMGM 2015, Sydney, Australia
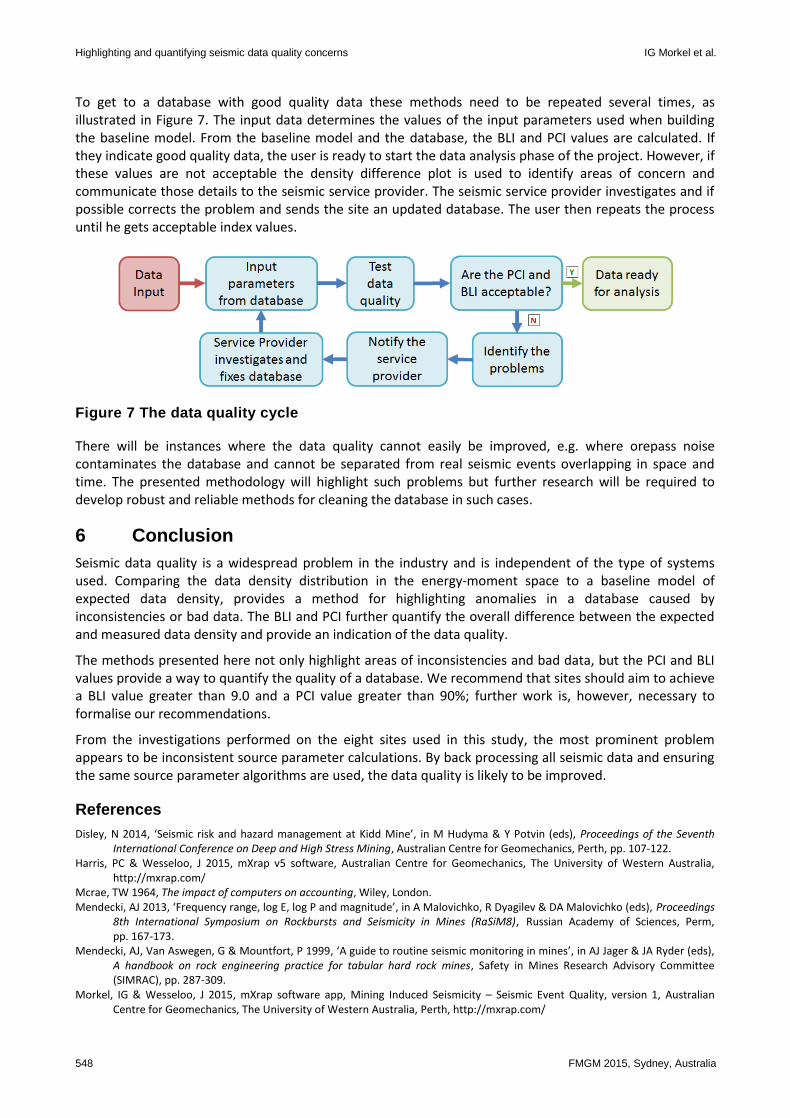
To get to a database with good quality data these methods need to be repeated several times, as illustrated in Figure 7. The input data determines the values of the input parameters used when building the baseline model. From the baseline model and the database, the BLI and PCI values are calculated. If they indicate good quality data, the user is ready to start the data analysis phase of the project. However, if these values are not acceptable the density difference plot is used to identify areas of concern and communicate those details to the seismic service provider. The seismic service provider investigates and if possible corrects the problem and sends the site an updated database. The user then repeats the process until he gets acceptable index values.
Figure 7 The data quality cycle
There will be instances where the data quality cannot easily be improved, e.g. where orepass noise contaminates the database and cannot be separated from real seismic events overlapping in space and time. The presented methodology will highlight such problems but further research will be required to develop robust and reliable methods for cleaning the database in such cases.
6 Conclusion
Seismic data quality is a widespread problem in the industry and is independent of the type of systems used. Comparing the data density distribution in the energy-moment space to a baseline model of expected data density, provides a method for highlighting anomalies in a database caused by inconsistencies or bad data. The BLI and PCI further quantify the overall difference between the expected and measured data density and provide an indication of the data quality.
The methods presented here not only highlight areas of inconsistencies and bad data, but the PCI and BLI values provide a way to quantify the quality of a database. We recommend that sites should aim to achieve a BLI value greater than 9.0 and a PCI value greater than 90%; further work is, however, necessary to formalise our recommendations.
From the investigations performed on the eight sites used in this study, the most prominent problem appears to be inconsistent source parameter calculations. By back processing all seismic data and ensuring the same source parameter algorithms are used, the data quality is likely to be improved.
References
Disley, N 2014, ‘Seismic risk and hazard management at Kidd Mine’, in M Hudyma & Y Potvin (eds), Proceedings of the Seventh International Conference on Deep and High Stress Mining, Australian Centre for Geomechanics, Perth, pp. 107-122.
Harris, PC & Wesseloo, J 2015, mXrap v5 software, Australian Centre for Geomechanics, The University of Western Australia, http://mxrap.com/
Mcrae, TW 1964, The impact of computers on accounting, Wiley, London. Mendecki, AJ 2013, ‘Frequency range, log E, log P and magnitude’, in A Malovichko, R Dyagilev & DA Malovichko (eds), Proceedings
8th International Symposium on Rockbursts and Seismicity in Mines (RaSiM8), Russian Academy of Sciences, Perm, pp. 167-173.
Mendecki, AJ, Van Aswegen, G & Mountfort, P 1999, ‘A guide to routine seismic monitoring in mines’, in AJ Jager & JA Ryder (eds), A handbook on rock engineering practice for tabular hard rock mines, Safety in Mines Research Advisory Committee (SIMRAC), pp. 287-309.
Morkel, IG & Wesseloo, J 2015, mXrap software app, Mining Induced Seismicity – Seismic Event Quality, version 1, Australian Centre for Geomechanics, The University of Western Australia, Perth, http://mxrap.com/
Underground mining
FMGM 2015, Sydney, Australia 549
Redman, TC 1998, ‘The impact of poor data quality on the typical enterprise’, Communications of the ACM, vol. 41, pp. 79-82. Scheepers, LJ, Hofmann, G & Morkel, IG 2012, ‘The study of seismic response to production for a grid mining layout’, Proceedings
of the Second Southern Hemisphere International Rock Mechanics (SHIRMS), pp. 387-406. Tayi, GK & Ballou, DP 1998, ‘Examining data quality’, Communications of the ACM, vol. 41, pp. 54-57. Van Aswegen, G, Potvin, Y & Hudyma, M 2005, ‘Routine seismic hazard assessment in some South African mines’, in Y Potvin & M
Hudyma (eds), Proceedings of the Sixth International Symposium on Rockburst and Seismicity in Mines (RaSiM6), Australian Centre for Geomechanics, Perth, pp. 435-444.
Wesseloo, J 2013, ‘Towards real-time probabilistic hazard assessment of the current hazard state for mines’, in A Malovichko, R Dyagilev & DA Malovichko (eds), Proceedings 8th International Symposium on Rockbursts and Seismicity in Mines (RaSiM8), Russian Academy of Sciences, Perm, pp. 307-312.
Wesseloo, J 2014, ‘Evaluation of the spatial variation of the b-value’, The Journal of The Southern African Institute of Mining and Metallurgy (SAIMM), vol. 114, October 2014, pp. 823-827.
Wesseloo, J, Woodward, K & Pereira, J 2014, ‘Grid-based analysis of seismic data’, The Journal of The Southern African Institute of Mining and Metallurgy (SAIMM), vol. 114, October 2014, pp. 815-823.

Highlighting and quantifying seismic data quality concerns IG Morkel et al.
550 FMGM 2015, Sydney, Australia