higher school certificate - sths.nsw.edu.ausths.nsw.edu.au/attachments/article/243/a parent guide to...
TRANSCRIPT

A parent and student guide to the
HIGHER SCHOOL CERTIFICATE
1) NSW Education Standards Authority (NESA) requirements
2) School assessment policy3) Schedule of tasks4) Reporting the HSC5) Moderation6) HSC and ATAR
NESA Requirements
NESA Requirements –Schools to certify that students have satisfactorily completed HSC courses by:• Following NESA courses• Working with sustained effort and diligence• Achieving course outcomes

School Assessment Policy

Policy Covers• Purpose• Procedures• Student responsibilities• Non completion of tasks • Approved Leave• Feedback• Appeal procedures• Assessment schedules for individual subjects
Schedule of Tasks

Four Assessment Blocks1. Term 4 Week 9
2. Term 1 Week 9
3. Term 2 Week 7
4. Term 3 Weeks 3-5
School Assessment for the HSC is
CRUCIAL

Reporting the HSC

School
AssessmentExamination
Mark
Student’s HSC
Mark
Student’s HSC
Band
Moderation

School assessment marksEach school submits marks for their students in all their courses (assessment marks)
• schools are very good at putting their students in order – according to ability and achievement - in each course
• but, schools differ in the tasks they set and the marks they allocate
So, the first step is to remove school differences by estimating what the assessment marks would have been if there was only one school.
This is called moderation
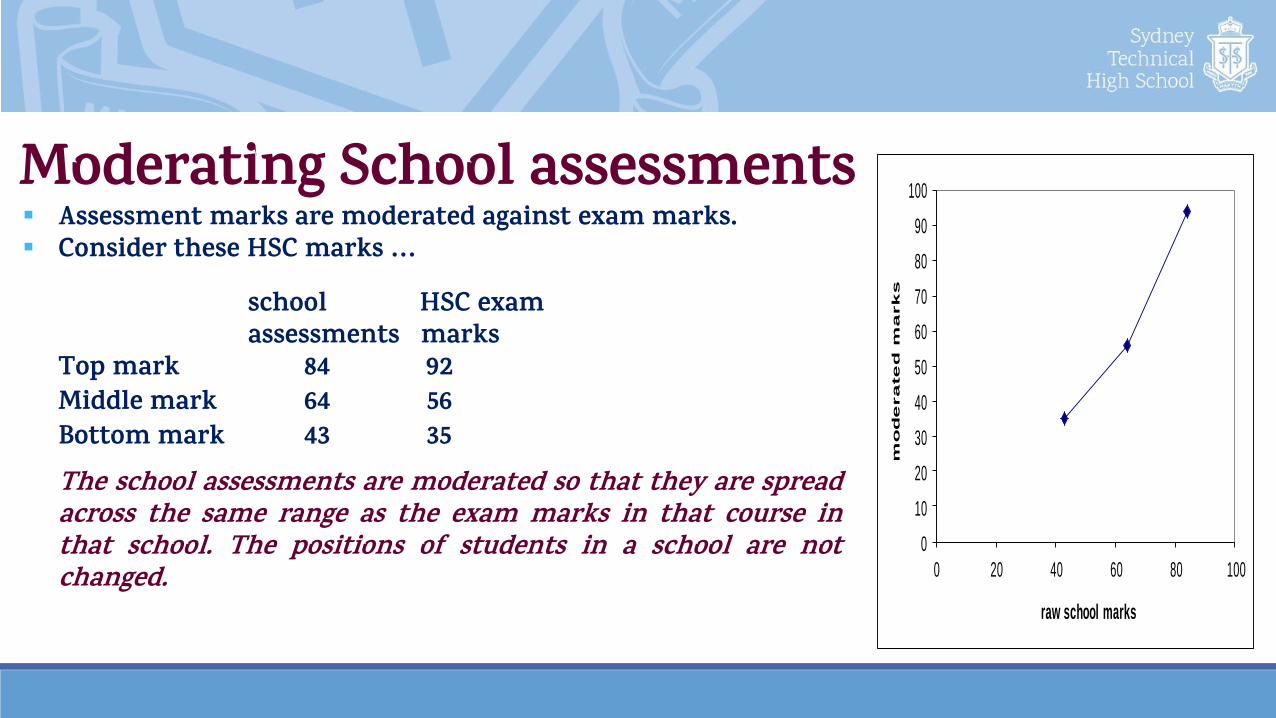
Moderating School assessments Assessment marks are moderated against exam marks. Consider these HSC marks …
school HSC examassessments marks
Top mark 84 92Middle mark 64 56Bottom mark 43 35The school assessments are moderated so that they are spreadacross the same range as the exam marks in that course inthat school. The positions of students in a school are notchanged.
0
10
20
30
40
50
60
70
80
90
100
0 20 40 60 80 100
mo
de
ra
te
d m
ark
s
raw school marks

Another example –2U Rocket Science

NESA Reporting achievement against standards For each course there are six standards called performance
bands These standards are described in words A group of experienced markers and examiners determine what
examination mark corresponds to each of the band boundaries The percentage of students at each standard depends only on
their performance This graph is used to calibrate the examination marks and
school assessments to the course standardsThis removes differences from year to year caused by one paper
being more difficult than another
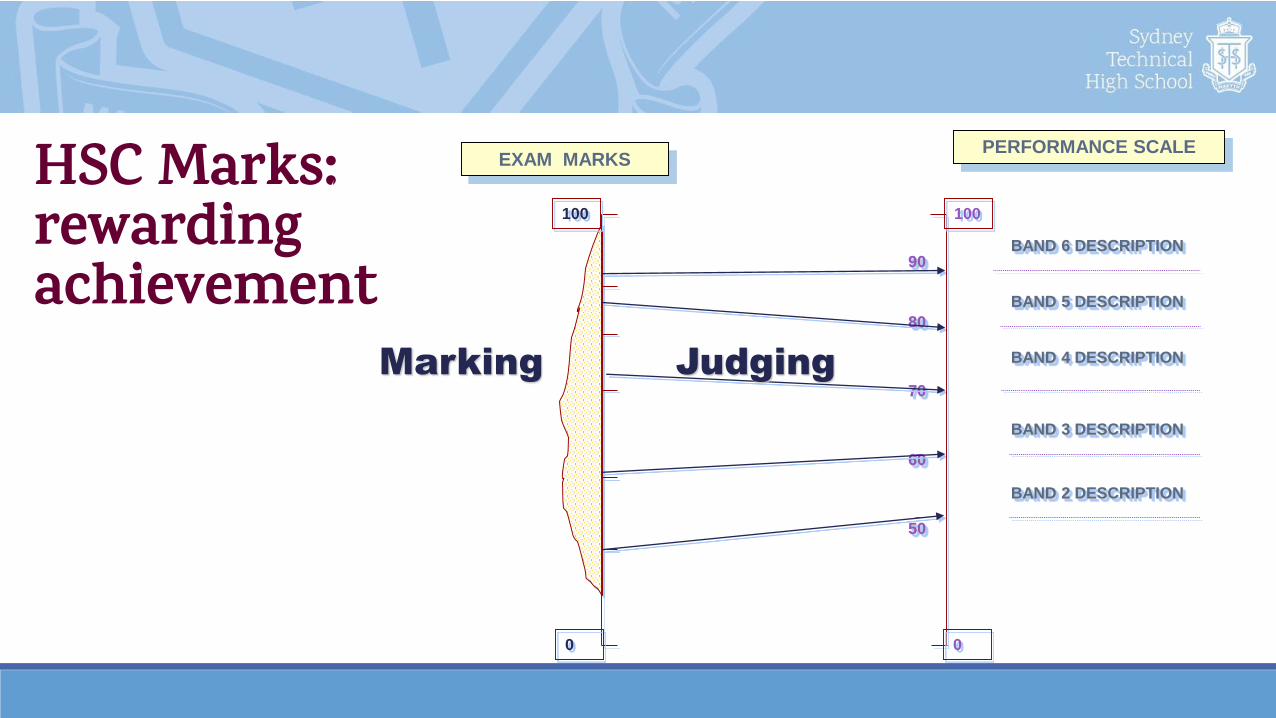
HSC Marks: rewarding achievement
PERFORMANCE SCALEEXAM MARKS
BAND 6 DESCRIPTION
BAND 5 DESCRIPTION
BAND 4 DESCRIPTION
BAND 3 DESCRIPTION
BAND 2 DESCRIPTION
100
0
90
80
70
60
50
JudgingMarking
100
0
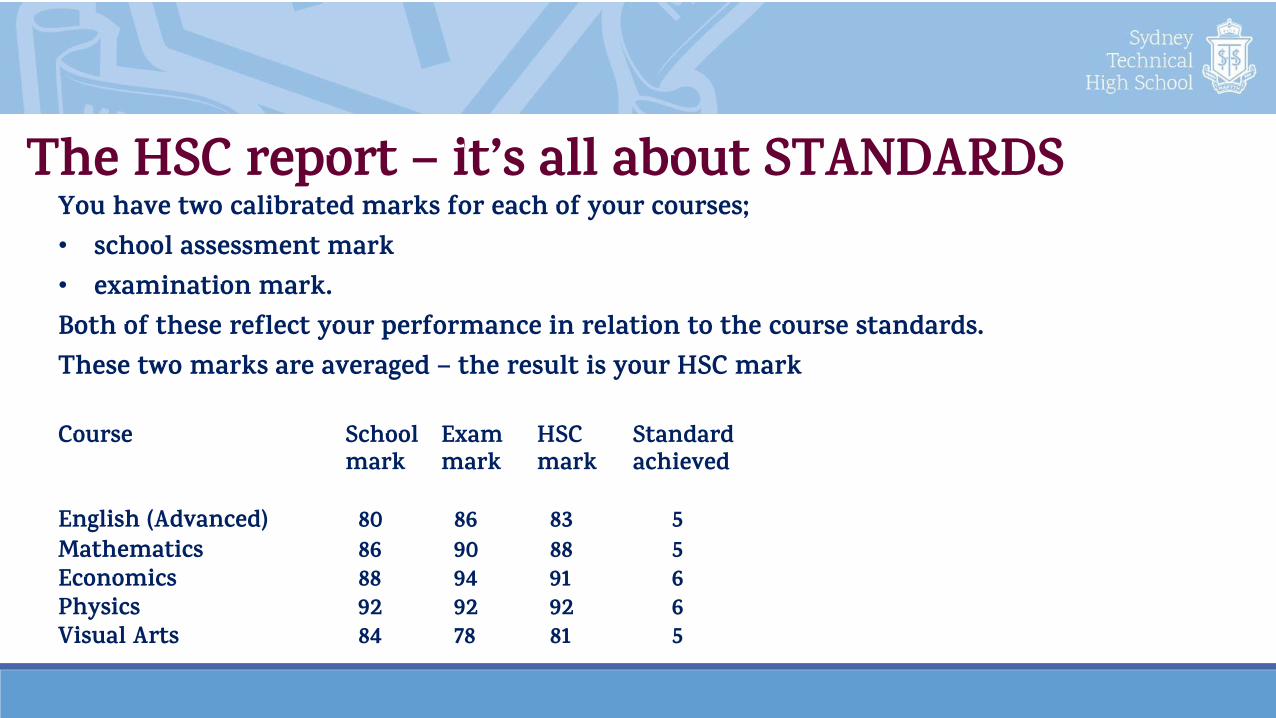
The HSC report – it’s all about STANDARDSYou have two calibrated marks for each of your courses; • school assessment mark• examination mark. Both of these reflect your performance in relation to the course standards.These two marks are averaged – the result is your HSC mark
Course School Exam HSC Standardmark mark mark achieved
English (Advanced) 80 86 83 5Mathematics 86 90 88 5Economics 88 94 91 6Physics 92 92 92 6Visual Arts 84 78 81 5
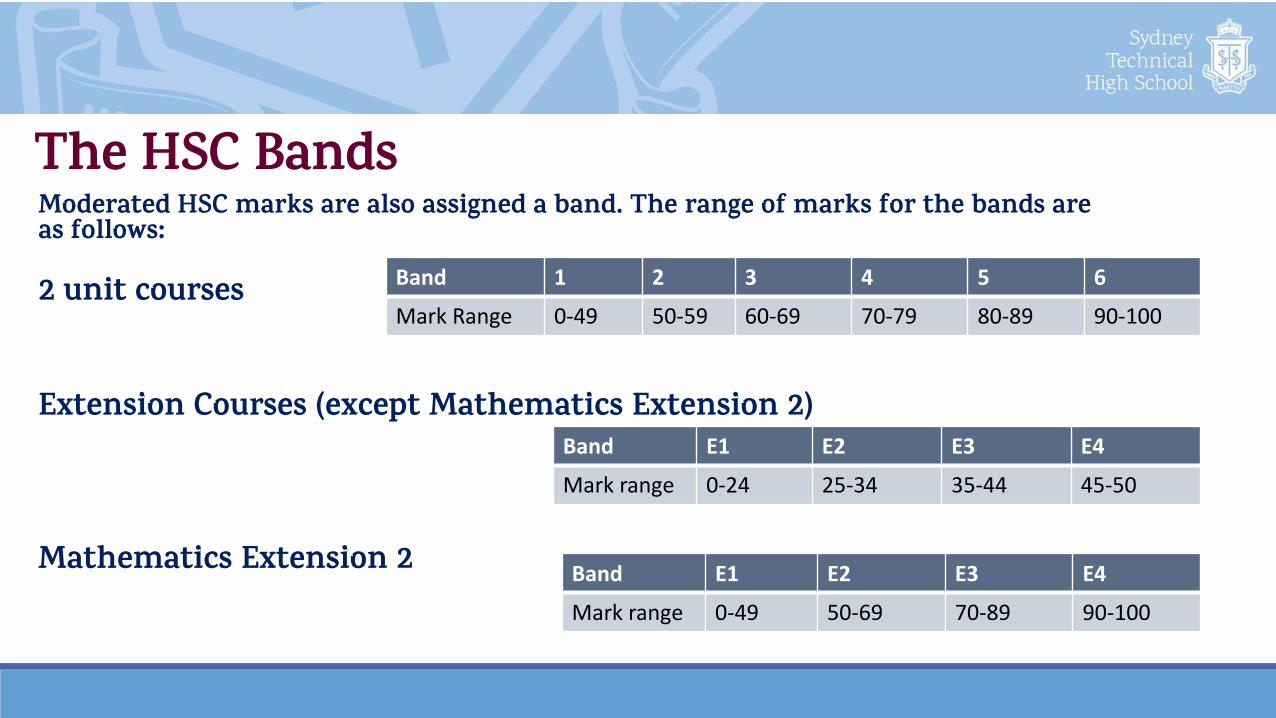
The HSC BandsModerated HSC marks are also assigned a band. The range of marks for the bands are as follows:
2 unit courses
Extension Courses (except Mathematics Extension 2)
Mathematics Extension 2
Band 1 2 3 4 5 6
Mark Range 0-49 50-59 60-69 70-79 80-89 90-100
Band E1 E2 E3 E4
Mark range 0-24 25-34 35-44 45-50
Band E1 E2 E3 E4
Mark range 0-49 50-69 70-89 90-100
HSC and the ATAR
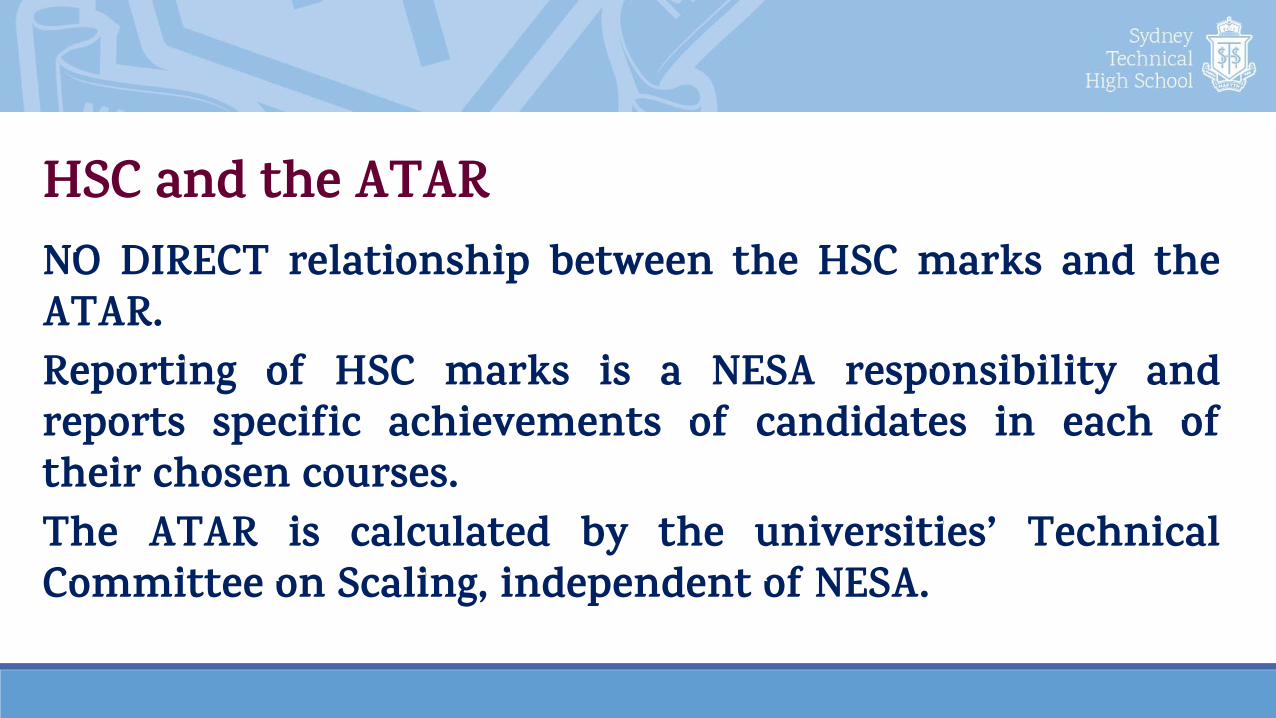
HSC and the ATARNO DIRECT relationship between the HSC marks and theATAR.Reporting of HSC marks is a NESA responsibility andreports specific achievements of candidates in each oftheir chosen courses.The ATAR is calculated by the universities’ TechnicalCommittee on Scaling, independent of NESA.
HSC and the ATAR• The ATAR IS NOT a mark OR an average of a student’s
HSC mark.
• The ATAR ranks university applicants based on statistical scaling of their raw exam marks and moderated assessment marks from NESA.

HSC and the ATAR• ATAR ranks are based on quite a complex algorithm
scaling process – based on the assumption of whatstudents’ marks would have been if all courses had beenstudied by all students.
• The ATAR is based on–A student’s position in their course (against NSW)–The scaled means of the course–The standard deviation of their courses

Performance will impact ATARCourse Fred Laura
HSC Mark Percentile HSC Mark Percentile
Biology 70 43 80 75
Business Studies 70 36 80 67
Mathematics 70 21 80 47
English Advanced
70 11 80 51
Modern History 70 21 80 59
Visual Arts 70 14 80 51
ATAR 57.50 79.65
Source: UAC.edu.au
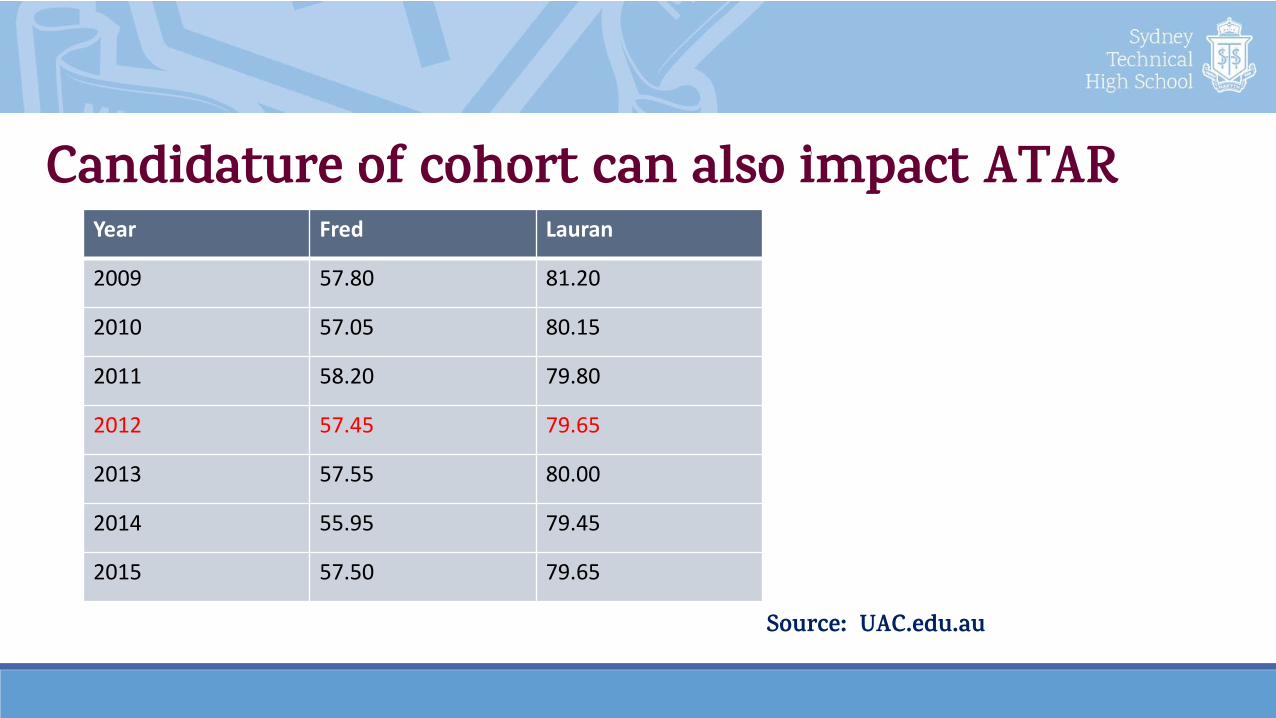
Candidature of cohort can also impact ATARYear Fred Lauran
2009 57.80 81.20
2010 57.05 80.15
2011 58.20 79.80
2012 57.45 79.65
2013 57.55 80.00
2014 55.95 79.45
2015 57.50 79.65
Source: UAC.edu.au

Calculating the ATAR
Source: UAC.edu.au
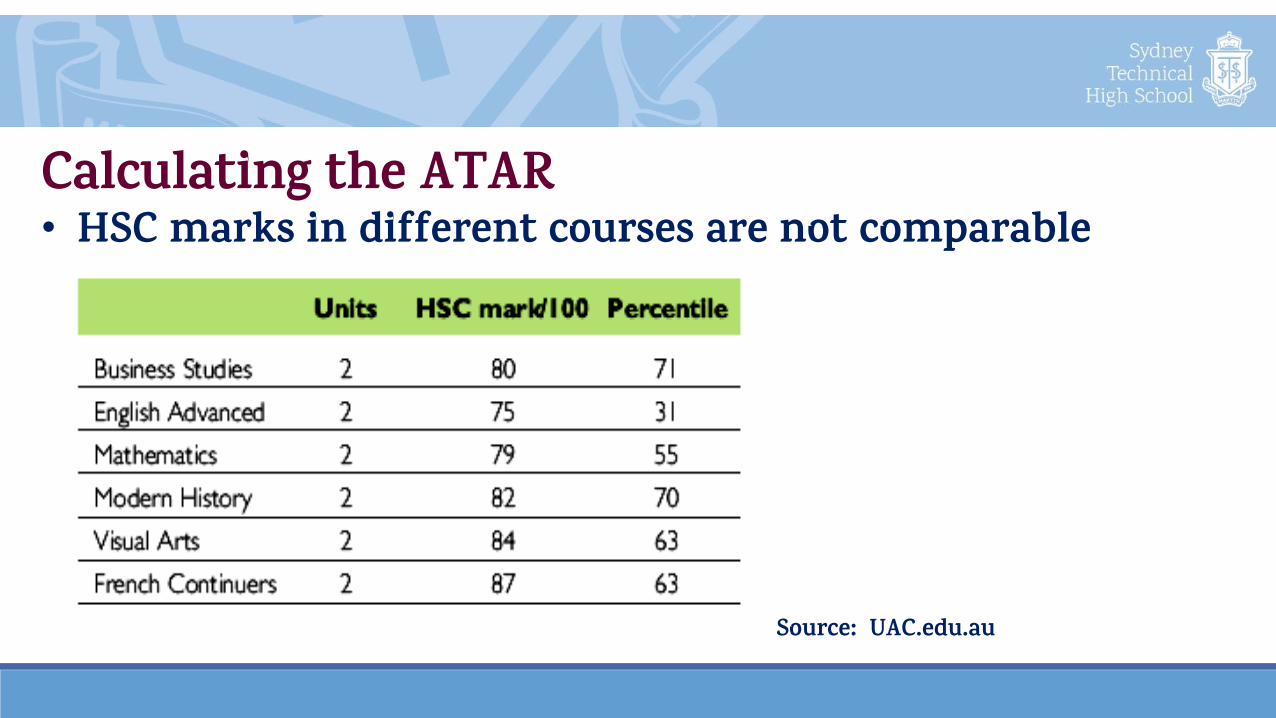
Calculating the ATAR• HSC marks in different courses are not comparable
Source: UAC.edu.au
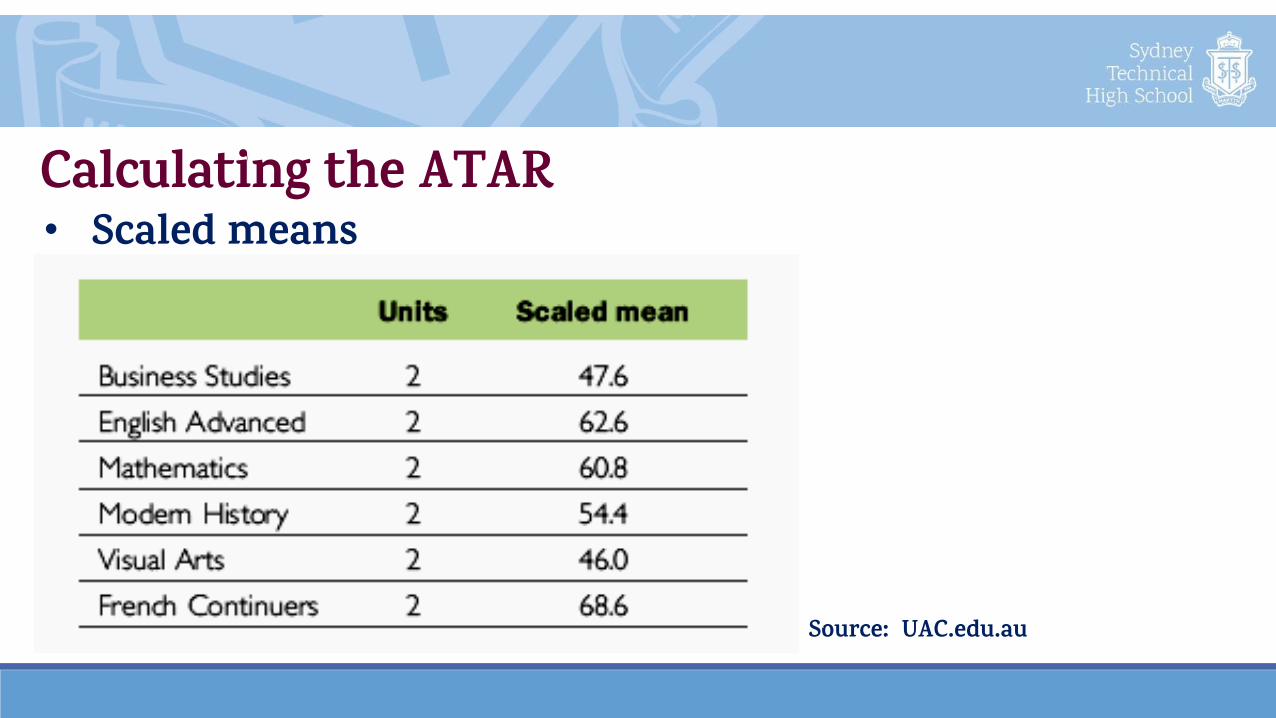
Calculating the ATAR• Scaled means
Source: UAC.edu.au
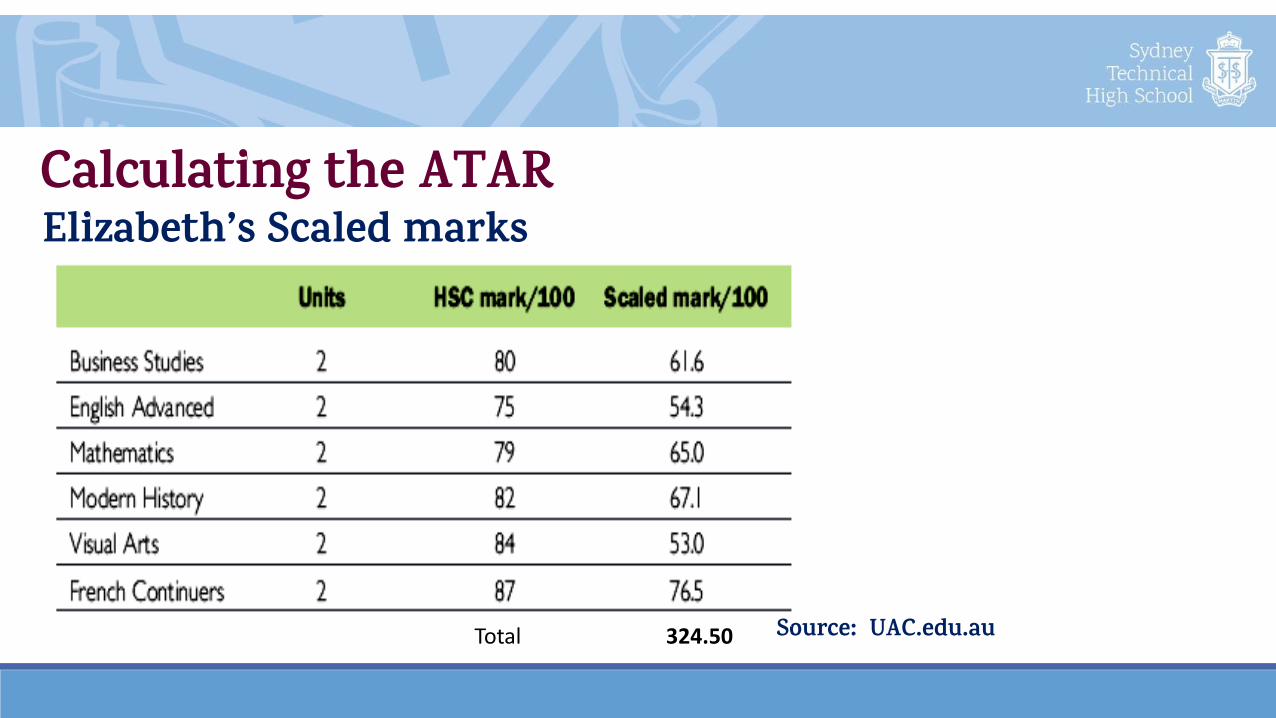
Calculating the ATARElizabeth’s Scaled marks
Total 324.50 Source: UAC.edu.au
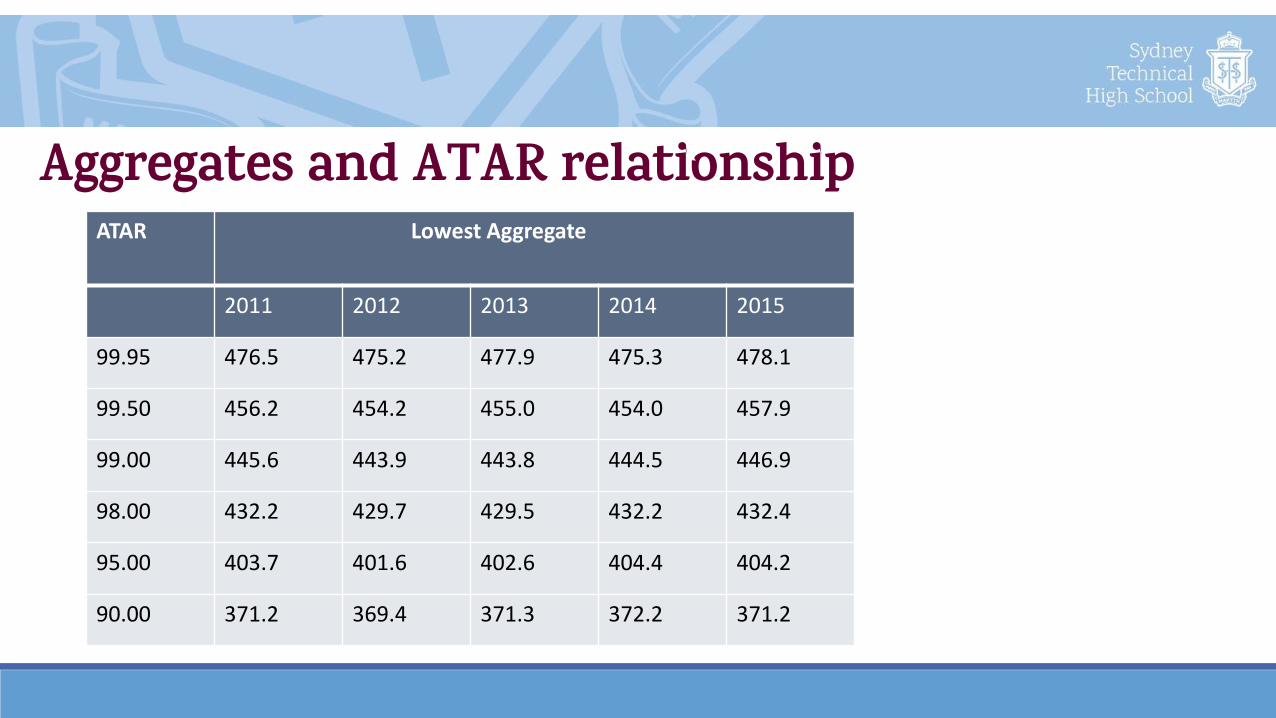
Aggregates and ATAR relationshipATAR Lowest Aggregate
2011 2012 2013 2014 2015
99.95 476.5 475.2 477.9 475.3 478.1
99.50 456.2 454.2 455.0 454.0 457.9
99.00 445.6 443.9 443.8 444.5 446.9
98.00 432.2 429.7 429.5 432.2 432.4
95.00 403.7 401.6 402.6 404.4 404.2
90.00 371.2 369.4 371.3 372.2 371.2

Calculating the ATARElizabeth’s aggregate is 324.5 out of 500
Elizabeth’s ATAR is 82.5
This means that Elizabeth did well enough overall to perform better than 82.5% of her Year 12 cohort.
So…how do you get a good ATAR?• Selecting subjects to which you have an
aptitude; and• Working hard at those subjects throughout
the year.