higher income individuals feel more entitled and report … · higher income individuals feel more...
TRANSCRIPT
INCOME, INEQUALITY, AND PROSOCIALITY 1
Higher Income Individuals Feel More Entitled and Report Giving
Proportionally Less to Charity Where Economic Inequality is High
Authors: Stéphane Côté1*, Robb Willer2, Julian House1, Chloe Kovacheff1
Affiliations:
1 Joseph L. Rotman School of Management, University of Toronto, Toronto, Ontario, M5S 3E6, Canada.
2 Department of Sociology, Stanford University, Stanford, CA 94305, USA.
*Corresponding author: [email protected] (S.C.)
Manuscript in preparation

INCOME, INEQUALITY, AND PROSOCIALITY 2
ABSTRACT
Studies disagree on how income relates to prosociality, variously finding that higher
income individuals are more prosocial, equally prosocial, or less prosocial than lower
income individuals. Recent research suggests that economic inequality may explain these
disparate results, with higher income individuals being less prosocial where inequality is
high. However, it is not yet known why inequality would condition the relationship in
this way. We examine whether inequality leads higher income individuals to a) feel
uniquely entitled to resources, or b) endorse economic meritocracy. Results of a survey
(n=978) show that higher income residents of relatively unequal areas reported donating
proportionally less of their income to charity than their lower income counterparts. This
relationship was mediated by entitlement, but not meritocratic beliefs. Inequality did not
predict raffle ticket donations to a pre-specified charity. These results suggest that higher
income residents of unequal areas may be less prosocial because they feel entitled.
Keywords: Economic Inequality, Income, Prosociality, Entitlement
INCOME, INEQUALITY, AND PROSOCIALITY 3
Higher Income Individuals Feel More Entitled and Report Giving
Proportionally Less to Charity Where Economic Inequality is High
In recent years the relationship between income and prosociality has received
considerable attention from researchers. While a growing body of work finds that higher
income individuals donate less resources to others (cf. Chen, Zhu, & Chen, 2013; Miller,
Kahle, & Hastings, 2015; Piff, Kraus, Côté, Cheng, & Keltner, 2010), other studies show
no association or even a positive link between income and prosociality (cf. Korndörfer,
Egloff, & Schmukle, 2015; Yamagishi, Li, Takagishi, Matsumoto, & Kiyonari, 2014).
One promising route to reconcile these mixed findings involves considering features of
the macrosocial structure. In particular, research in both field and laboratory contexts
finds that higher income individuals are less prosocial than lower income individuals
under unequal economic conditions, but equally or more prosocial where inequality is
lower (Côté, House, & Willer, 2015; Hargreaves Heap, Ramalingam, & Stoddard, 2016;
Nishi, Shirado, Rand, & Christakis, 2015).
While this past research suggests an overarching framework for understanding
when and where a negative relationship between income and prosociality will obtain, it is
not yet clear why economic inequality—the extent to which income is concentrated in the
hands of a small proportion of the population (Wilkinson & Pickett, 2009)—conditions
the relationship in this way. Here, we examine two candidate explanations—one based on
feelings of psychological entitlement, the other based on beliefs that society is
meritocratic—for why higher income individuals might be less prosocial under unequal
economic conditions. In doing so, we test the possibility that income relates to important
INCOME, INEQUALITY, AND PROSOCIALITY 4
beliefs about the self and the society, and further whether these beliefs vary depending on
levels of inequality.
Income, Inequality, and Psychological Entitlement
Psychological entitlement is the belief that one is more important and deserving of
resources and privileges than others (Campbell, Bonacci, Shelton, Exline, & Bushman,
2004). High levels of inequality might increase feelings of entitlement among individuals
at the top of the economic distribution because it facilitates favorable downward social
comparisons among these individuals. In settings with greater inequality, distinctions
between different economic positions are sharp (Stiglitz, 2012; Wilkinson & Pickett,
2009), and these distinctions might serve as a salient basis of self-perception. For
instance, higher income residents of highly unequal areas are more likely to self-identify
as a “have” or as “upper class” than higher income residents of less unequal areas
(Andersen & Curtis, 2012; Newman, Johnston, & Lown, 2015). Thus, inequality might
lead higher income individuals to find that they compare particularly favorably to others
because it highlights their superior economic standing. Further, when inequality is high,
economic positions are separated by a greater absolute distance, and higher income
individuals’ economic advantage over others is especially pronounced. Where the gap
between their economic standing and that of most others is especially large, inequality
might lead higher income individuals to make particularly favorable downward social
comparisons.
In turn, downward social comparisons may increase feelings of entitlement
among higher income residents of highly unequal areas. When successful individuals
explain their social standing, they often prioritize self-serving explanations that

INCOME, INEQUALITY, AND PROSOCIALITY 5
emphasize unique personal characteristics (Major, 1994). By emphasizing unique
characteristics that they possess and others do not, successful individuals engage in
favorable downward social comparisons that may lead to feelings of entitlement
(Campbell et al., 2004). We therefore predicted a positive relationship between income
and entitlement that is especially pronounced where inequality is relatively high and
attenuated where inequality is relatively low (Hypothesis 1).
Moreover, entitlement facilitates self-serving behaviors. People with a high sense
of entitlement believe that resources rightfully belong to them, and these beliefs lead
them to share fewer resources with others. Past research finds that more entitled
individuals make more selfish, competitive, and greedy decisions, are less
accommodating, empathic, and respectful in romantic relationships, and respond more
aggressively to negative feedback (Campbell et al., 2004; Zitek, Jordan, Monin, & Leach,
2010). Thus, we proposed that high feelings of entitlement among higher income
residents of highly unequal economic areas would lead them to exhibit lower levels of
prosociality (Hypothesis 2).
Income, Inequality, and Meritocratic Beliefs
Meritocratic beliefs refer to views that resources within a social system are
distributed appropriately based on worth (Pratto, Sidanius, Stallworth, & Malle, 1994).
High levels of inequality could increase meritocratic beliefs among individuals at the top
of the economic distribution, because higher income individuals are motivated to justify
their privileged position in a society where resources are unevenly distributed. Higher
income residents of unequal areas might feel insecurities that their resources are not truly
deserved, and also they may fear that those at the bottom of the economic distribution
INCOME, INEQUALITY, AND PROSOCIALITY 6
will challenge the concentration of resources at the top of the distribution (Newman et al.,
2015; Zimmerman & Reyna, 2013). To address these concerns, higher income
individuals may adopt meritocratic beliefs as a means for justifying their privileged
position within the existing distribution of resources. An important aspect of meritocratic
beliefs is the notion that success is the outcome of hard work (rather than luck or
privilege), a sentiment that supports the fairness of the current distribution of resources.
As such, meritocratic beliefs might equip higher income individuals against concerns
about the legitimacy of their privileged social standing. We thus hypothesized a positive
relationship between income and meritocratic beliefs that is especially pronounced where
inequality is high and attenuated where inequality is low (Hypothesis 3).
Meritocratic beliefs may, in turn, reduce the prosociality of higher income
residents of unequal areas. Central to meritocratic beliefs is the notion that people have
the resources that they deserve: those at the top of the economic hierarchy deserve a
disproportionate share of resources, while those at the bottom deserve less (Pratto et al.,
1994). Thus, meritocratic beliefs might reduce prosociality, because people who hold
these beliefs think they deserve the resources they possess (Wakslak, Jost, Tyler, & Chen,
2007). Where strongly held, these beliefs may also reduce the motivation to rectify
disparities by implying that others already possess the resources that they have earned.
Therefore, we expected that meritocratic beliefs endorsed by higher income individuals
where inequality is high would explain their lower levels of prosociality under these
conditions (Hypothesis 4).
Method
Participants and Procedure

INCOME, INEQUALITY, AND PROSOCIALITY 7
One thousand and three United States residents were recruited from a panel
maintained by Clearvoice, a research and marketing firm that holds a large database of
potential participants. This sample size provided over .95 power to detect a small effect
for the increase in variance explained by the interaction (Cohen, 1988; Hunsley & Meyer,
2003). To obtain a representative sample with respect to income—the focal individual-
level predictor—we set quotas for 15 income categories (separately for men and women)
using data from the Current Population Survey (U.S. Census Bureau, 2015b). Of the
1,003 individuals recruited to the study, 24 (or 2%) could not be included in the analyses
because they did not give responses to one or more questions used in analysis. One other
participant could not be included because this participant resided in a territory (the U.S.
Virgin Islands) for which no inequality estimate was available. The sample used for
analysis included 978 respondents (492 women and 486 men) between the ages of 17 and
89 (M = 50, SD = 15). Of these, 805 participants (82%) were European-American, 86
(9%) were African-American, 57 (6%) were Hispanic, 28 (3%) were Asian-American,
and 39 (4%) selected another category (some participants selected more than one
category). Residents of 47 of 50 U.S. states plus the District of Columbia (DC)
responded.
The survey included measures of state of residence, income, prosociality,
characteristics used as controls in the analyses (described below), and other constructs
that we did not analyze in this study. The survey, data, and R code to conduct the
analyses can be accessed at
https://www.dropbox.com/sh/qvgao7qunnh0qkp/AADSyBKDRkWfPMJH4Idf-
Ghsa?dl=0

INCOME, INEQUALITY, AND PROSOCIALITY 8
Measures
Economic inequality. We gathered Gini coefficients for each state (plus DC)
from the American Community Survey, a yearly representative survey of U.S. citizens
(U.S. Census Bureau, 2015a). The Gini is a widely used measure of inequality that
theoretically ranges from 0, indicating that all have the exact same income, to 1,
indicating that a single person holds all of the income (Wilkinson & Pickett, 2009). Ginis
ranged from .427 (Wyoming) to .522 (District of Columbia; M = .466, SD = .020).
Income. Participants reported their yearly income by choosing one category
ranging from 1 (0-$9,999) to 15 ($250,000 or more). We assigned midpoint income
amounts corresponding to the chosen category (Hout, 2004). We assigned $250,000 (the
lower bound) to participants who chose the highest category. The results were the same
when we adopted a strategy often used in sociology research using frequencies for the
second-highest and highest brackets to assign a value (in this sample, $560,742) for the
highest category (Hout, 2004; Parker & Fenwick, 1983). Mean income was $36,521 (SD
= $41,337). To aid interpretation of the results, we divided income values by 10,000.
Psychological entitlement. We administered the 9-item Psychological
Entitlement Scale (Campbell et al., 2004). Respondents indicated their agreement with
items including “I honestly feel I’m just more deserving than others” and “I do not
necessarily deserve special treatment” (reverse-scored) on a 1 (strongly disagree) to 7
(strongly agree) scale (M = 3.46, SD = 1.26; α = .90; 1 unreported).
Meritocratic beliefs. We administered an 8-item measure previously used by
Major, Kaiser, O’Brien, and McCoy (2007). Respondents indicated how much they
agreed with items such as “If people work hard they almost always get what they want”
INCOME, INEQUALITY, AND PROSOCIALITY 9
and “Advancement in American society is possible for all individuals” using a 1 (strongly
disagree) to 7 (strongly agree) scale (M = 3.84, SD = 1.12; α = .84).
Prosociality. We administered two measures of prosociality. The first measure is
the self-reported proportion of annual income donated to charity. Participants reported
whether they donated any money to a charitable organization in the year prior to the
survey (2014). Those who donated indicated how much. To facilitate accurate recall, we
listed some common types of charity (e.g., charity for animals, the environment, health,
or specific religions) and participants indicated how much they donated to each type. We
divided reported donation totals by income, and then multiplied these values by 100.
Reported charitable donation values were positively skewed, and thus, we logged these
values (Tabachnick & Fidell, 2007). The results were virtually the same when we
repeated the analyses with values that were not log-transformed. Reported charitable
donations data often include outliers that unduly influence results (Pedhazur &
Schmelkin, 1991). Therefore, following procedures described by Tabachnick and Fidell
(2007), we removed from the analyses participants with values for the reported
proportion of income donated to charity more than 3.29 standard deviations higher than
the mean (in this sample, participants who donated 26.3% or more of their annual
income). This procedure was conservative, affecting only 14 observations, or 1% of the
sample. On average, participants donated 1.12% of their income (SD = 2.92; range = 0 to
24.70). The mean logged value was .41 (SD = .65).
Second, we administered a modified “dictator game” (Bekkers, 2007) in which
participants decided how many of a set number of raffle tickets they wished to either
keep or donate to a well-known charitable organization. Respondents were offered a
INCOME, INEQUALITY, AND PROSOCIALITY 10
chance to win a raffle for $100, over and above their regular payment for completing the
study. Participants were told they had been assigned the role of “sender,” and that a
charitable organization, the United Way, would be in the role of the “receiver.” The
United Way was presented as one of the largest charitable organizations aimed at
reducing poverty. As “senders,” participants allocated 10 raffle tickets, each offering an
equal chance to win the cash prize, between themselves and the United Way. Participants
were told that, if the United Way won the raffle, the organization would receive the
winnings as an anonymous donation (a participant actually won the raffle). To increase
the believability of the raffle, we provided an email address to ask questions about the
raffle. On average, participants donated 4.14 tickets (SD = 3.44).
Controls (state level). We controlled for state characteristics that might correlate
with inequality and, thus, potentially confound analysis of the effects of inequality: mean
household income, population, proportion of the population living in urbanized areas and
urban clusters, and diversity in age, ethnicity, and gender. We retrieved state mean
household incomes (M = $73,129, SD = $12,415) and populations (M = 6.59 million, SD
= 7.21 million) in year 2014 from the American Community Survey (U.S. Census
Bureau, 2015a). To aid interpretation, we divided income values by 10,000 and
population values by 1,000,000. We obtained values for the proportion of the population
living in urbanized areas and urban clusters from the 2010 Decennial Census (U.S.
Census Bureau, 2015c; M = 75.3, SD = 14.23). We calculated diversity in age, ethnicity,
and gender using Blau’s index (Harrison & Klein, 2007). The formula for Blau’s index is
1 − Σpk2, where k denotes the category and p denotes the proportion of individuals in the
kth category. To calculate these indices, we obtained values for age (tracked in 18
INCOME, INEQUALITY, AND PROSOCIALITY 11
categories), ethnicity (tracked in 7 categories), and gender in each state from the
American Community Survey (U.S. Census Bureau, 2015a). We applied the formula for
Blau’s index to these values to obtain diversity scores for age, ethnicity, and gender. For
ease of interpretation, we then multiplied the values by 100 (age: M = 93.85, SD = .19;
ethnicity: M = 36.91, SD = 14.09; gender: M = 49.98, SD = .02).
Controls (individual level). We controlled for individual characteristics that
might correlate with income and, thus, potentially confound analysis of the effects of
income: age, gender (coded 1 = female or 0 = male), ethnicity (coded 1 = Caucasian or 0
= non-Caucasian), education, employment status, marital status, subjective social class,
religiosity, and political ideology. Education was coded 1 = less than high school, 2 =
high school diploma or GED, 3 = Associate or vocational degree, 4 = Bachelor's degree,
5 = Master's degree, or 6 = PhD or Professional degree (M = 3.18, SD =1.16; 1
unreported). Employment status was coded 1 = working as a paid employee or self-
employed (N = 479) or 0 = unemployed (n = 499). Marital status was coded 1 = married
(N = 477) or 0 = not married (N = 499; 2 unreported). Subjective social class was coded 1
= lower class, 2 = lower middle class, 3 = middle class, 4 = upper middle class, or 5 =
upper class (M = 2.5, SD = .87). Religiosity was rated on a scale of 1 (not at all religious)
to 7 (very religious; M = 3.98, SD = 2.09). Political ideology was rated on a scale of 1
(very liberal) to 7 (very conservative; M = 4.16, SD = 1.69).
Analysis
We ran hierarchical linear models (using the nlme package for R; Pinheiro, Bates,
DebRoy, Sarkar, & R Core Team, 2016) because respondents were nested within states,
and observations were thus non-independent (Aguinis, Gottfredson, & Culpepper, 2013;

INCOME, INEQUALITY, AND PROSOCIALITY 12
Preacher, Curran, & Bauer, 2006). We first conducted analyses without controls, and then
verified that any results were not spurious by repeating all analyses with controls. Income
was centered at its group mean (i.e., within states) and inequality was centered at its
grand mean (i.e., across states) to appropriately test cross-level interactions (Enders &
Tofighi, 2007; Hofmann & Gavin, 1998). We probed interactions by examining regions
of significance, which reveal the levels of inequality at which income was significantly
related to prosociality (Preacher et al., 2006). To generate regions of significance, we
used the web utility developed by Preacher, Curran, and Bauer (2006). Further, we
conducted mediated moderation analyses as outlined by Muller, Judd, and Yzerbyt
(2005), and supplemented these analyses with a bootstrap test (MacKinnon, 2008).
Results
Income, Inequality, and Psychological Entitlement
There was a significant interaction between income and inequality predicting
entitlement (Table 1, Model 1) that resisted individual- and state-level controls (Table 1,
Model 2). The interaction is displayed in Figure 1. Supporting Hypothesis 1, in the most
unequal states, having a higher income was associated with feeling more entitled.
According to the analysis of regions of significance, this relationship was positive in
areas with Ginis exceeding .470, a set that included 18 states plus DC in 2014. By
contrast, in the least unequal states (with Ginis lower than .470), there was no
relationship between income and entitlement. According to the analysis of regions of
significance, this relationship became significantly negative at Ginis lower than .163. No
state or country features such a low level of inequality (e.g., Sweden’s Gini is 27.3;
“GINI index (World Bank estimate),” 2016), suggesting that there is no realistic level of
INCOME, INEQUALITY, AND PROSOCIALITY 13
inequality where having a higher income is associated with feeling less entitled. Thus,
inequality moderated the relationship between income and entitlement in a way that could
explain why higher income individuals are less generous under unequal economic
conditions.

INCOME, INEQUALITY, AND PROSOCIALITY 14
Table 1 Hierarchical Linear Model Results Predicting Entitlement Model 1 Model 2 ⎯⎯⎯⎯⎯⎯ ⎯⎯⎯⎯⎯⎯ Variable γ SE t γ SE t ⎯⎯⎯⎯⎯⎯⎯⎯⎯⎯⎯⎯⎯⎯⎯⎯⎯⎯⎯⎯⎯⎯⎯⎯⎯⎯⎯⎯⎯⎯⎯⎯⎯⎯⎯⎯ Intercept 3.41 .04 79.67*** 3.87 .12 32.37*** Income .02 .01 1.45 .02 .01 1.57 Inequality 6.16 2.18 2.82** 4.08 3.74 1.09 Income x Inequality 1.03 .48 2.14* .99 .47 2.12* Age -.01 .00 -2.24* Gender .11 .08 1.34 Subjective social class .05 .05 .91 Ethnicity -.59 .11 -5.48*** Education -.03 .04 -.84 Employment status .17 .09 1.97* Marital status -.22 .08 -2.64** Religiosity .02 .02 .77 Conservative ideology -.03 .03 -1.25 State mean income .00 .05 .03 State population .00 .01 .57 State urban population .00 .01 .55 State gender diversity -3.13 3.73 -.84 State ethnic diversity -.00 .01 -.85 State age diversity -.05 .34 -.15 ⎯⎯⎯⎯⎯⎯⎯⎯⎯⎯⎯⎯⎯⎯⎯⎯⎯⎯⎯⎯⎯⎯⎯⎯⎯⎯⎯⎯⎯⎯⎯⎯⎯⎯⎯⎯ Note. For Model 1, n = 977. For Model 2, n = 974. Gender was coded 1 = female or 0 = male. Ethnicity was coded 1 = Caucasian or 0 = other. Employment status was coded 1 = working as a paid employee or self-employed or 0 = unemployed. Marital status was coded 1 = married or 0 = not married. *p < .05. ** p < .01. *** p < .001.

INCOME, INEQUALITY, AND PROSOCIALITY 15
Entitlement
Figure 1. Entitlement as a function of income (±1 SD) and inequality in respondents’ home states. Lines are projections based on regression estimate from the regression model. The solid line depicts the projected association between income and entitlement in the area with the lowest level of inequality (the state of Wyoming). The dotted line depicts this projected association in an area with an average level of inequality. The dashed line depicts this projected association in the area with the highest level of inequality (the District of Columbia).
1
2
3
4
5
Lowerincomeindividuals Higherincomeindividuals
Highestinequality
Averageinequality
Lowestinequality
INCOME, INEQUALITY, AND PROSOCIALITY 16
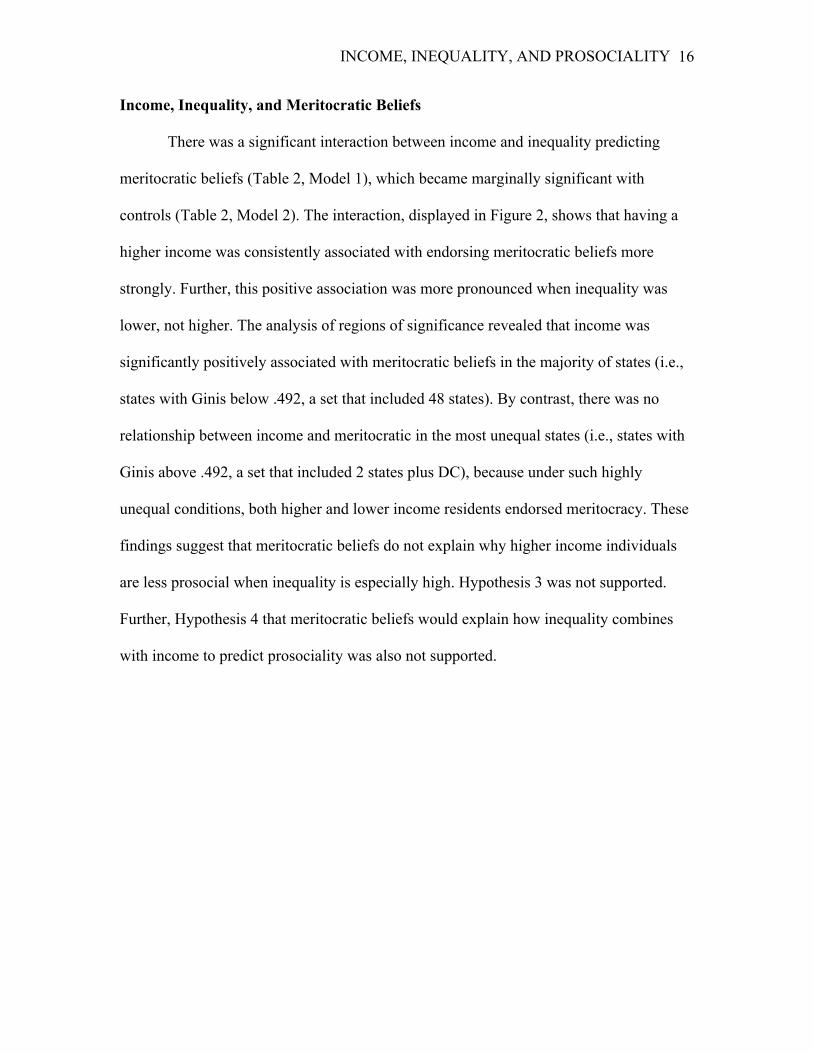
Income, Inequality, and Meritocratic Beliefs
There was a significant interaction between income and inequality predicting
meritocratic beliefs (Table 2, Model 1), which became marginally significant with
controls (Table 2, Model 2). The interaction, displayed in Figure 2, shows that having a
higher income was consistently associated with endorsing meritocratic beliefs more
strongly. Further, this positive association was more pronounced when inequality was
lower, not higher. The analysis of regions of significance revealed that income was
significantly positively associated with meritocratic beliefs in the majority of states (i.e.,
states with Ginis below .492, a set that included 48 states). By contrast, there was no
relationship between income and meritocratic in the most unequal states (i.e., states with
Ginis above .492, a set that included 2 states plus DC), because under such highly
unequal conditions, both higher and lower income residents endorsed meritocracy. These
findings suggest that meritocratic beliefs do not explain why higher income individuals
are less prosocial when inequality is especially high. Hypothesis 3 was not supported.
Further, Hypothesis 4 that meritocratic beliefs would explain how inequality combines
with income to predict prosociality was also not supported.
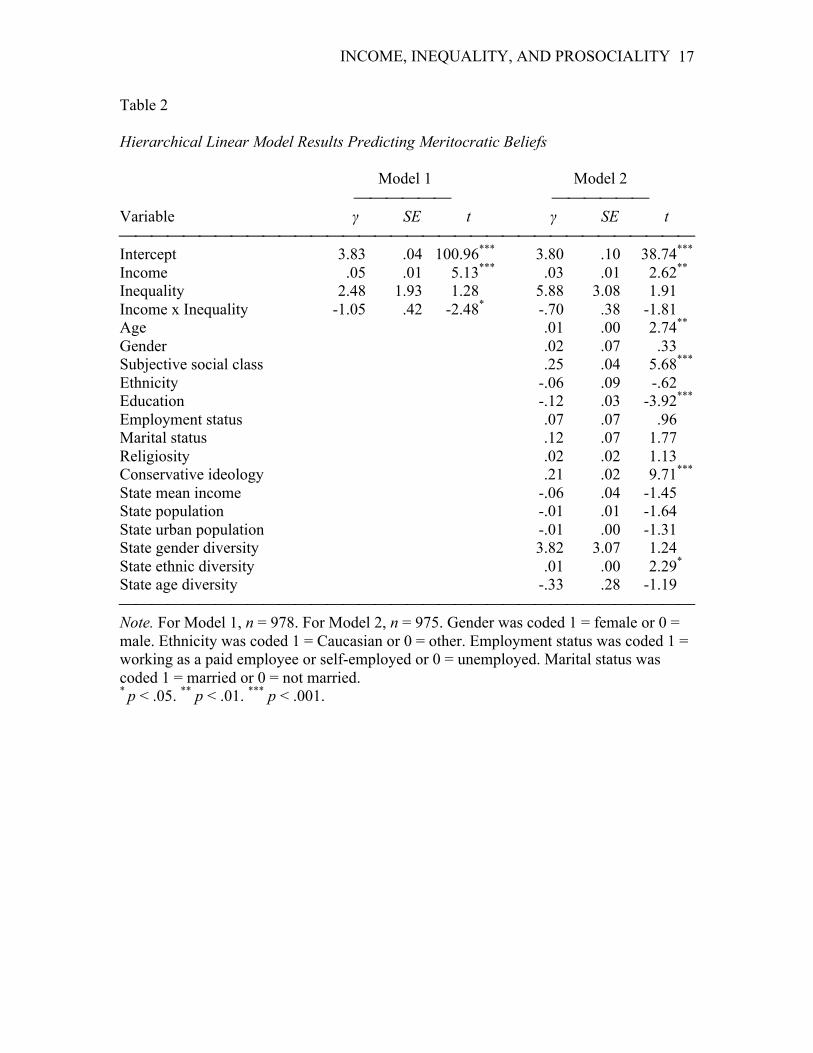
INCOME, INEQUALITY, AND PROSOCIALITY 17
Table 2 Hierarchical Linear Model Results Predicting Meritocratic Beliefs Model 1 Model 2 ⎯⎯⎯⎯⎯⎯ ⎯⎯⎯⎯⎯⎯ Variable γ SE t γ SE t ⎯⎯⎯⎯⎯⎯⎯⎯⎯⎯⎯⎯⎯⎯⎯⎯⎯⎯⎯⎯⎯⎯⎯⎯⎯⎯⎯⎯⎯⎯⎯⎯⎯⎯⎯⎯ Intercept 3.83 .04 100.96*** 3.80 .10 38.74*** Income .05 .01 5.13*** .03 .01 2.62** Inequality 2.48 1.93 1.28 5.88 3.08 1.91 Income x Inequality -1.05 .42 -2.48* -.70 .38 -1.81 Age .01 .00 2.74** Gender .02 .07 .33 Subjective social class .25 .04 5.68*** Ethnicity -.06 .09 -.62 Education -.12 .03 -3.92*** Employment status .07 .07 .96 Marital status .12 .07 1.77 Religiosity .02 .02 1.13 Conservative ideology .21 .02 9.71*** State mean income -.06 .04 -1.45 State population -.01 .01 -1.64 State urban population -.01 .00 -1.31 State gender diversity 3.82 3.07 1.24 State ethnic diversity .01 .00 2.29* State age diversity -.33 .28 -1.19 ⎯⎯⎯⎯⎯⎯⎯⎯⎯⎯⎯⎯⎯⎯⎯⎯⎯⎯⎯⎯⎯⎯⎯⎯⎯⎯⎯⎯⎯⎯⎯⎯⎯⎯⎯⎯ Note. For Model 1, n = 978. For Model 2, n = 975. Gender was coded 1 = female or 0 = male. Ethnicity was coded 1 = Caucasian or 0 = other. Employment status was coded 1 = working as a paid employee or self-employed or 0 = unemployed. Marital status was coded 1 = married or 0 = not married. * p < .05. ** p < .01. *** p < .001.
INCOME, INEQUALITY, AND PROSOCIALITY 18
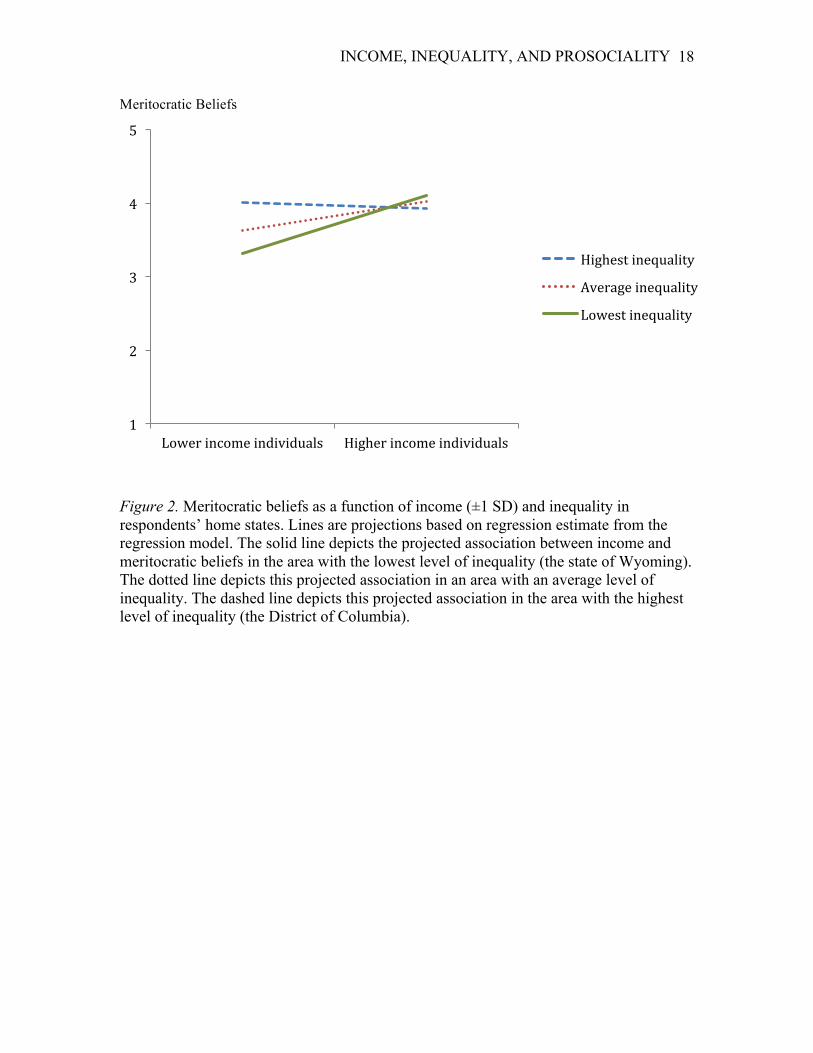
Meritocratic Beliefs
Figure 2. Meritocratic beliefs as a function of income (±1 SD) and inequality in respondents’ home states. Lines are projections based on regression estimate from the regression model. The solid line depicts the projected association between income and meritocratic beliefs in the area with the lowest level of inequality (the state of Wyoming). The dotted line depicts this projected association in an area with an average level of inequality. The dashed line depicts this projected association in the area with the highest level of inequality (the District of Columbia).
1
2
3
4
5
Lowerincomeindividuals Higherincomeindividuals
Highestinequality
Averageinequality
Lowestinequality
INCOME, INEQUALITY, AND PROSOCIALITY 19
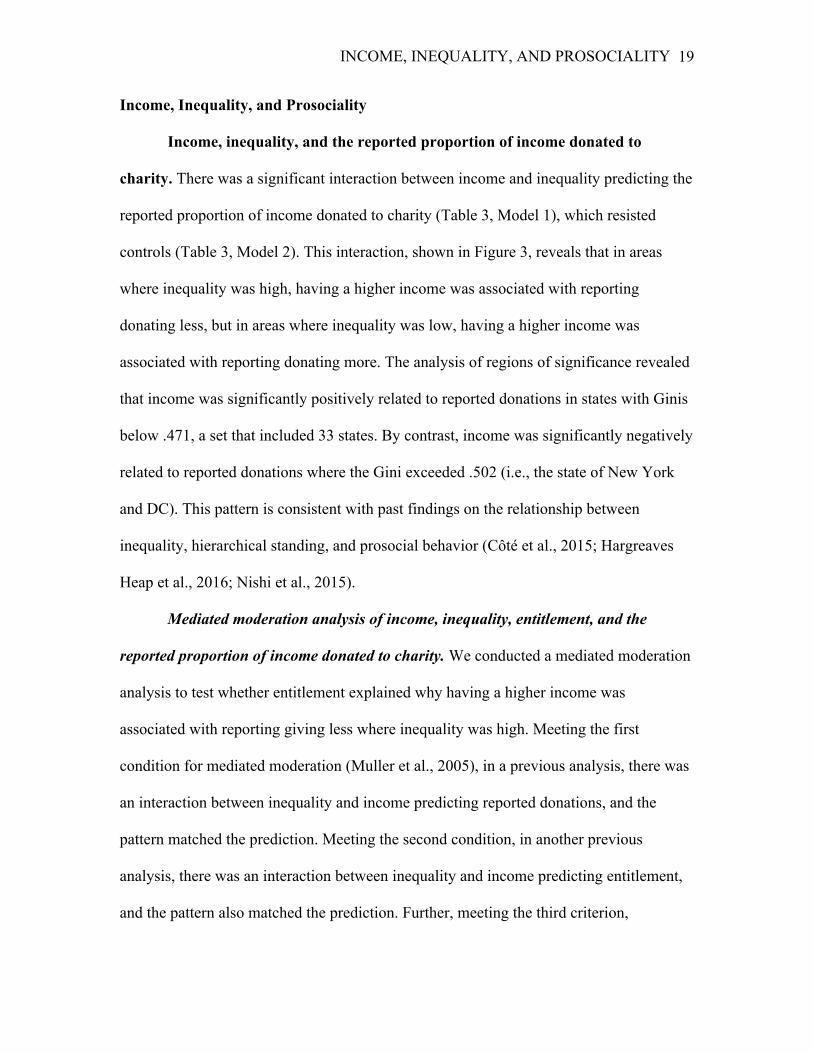
Income, Inequality, and Prosociality
Income, inequality, and the reported proportion of income donated to
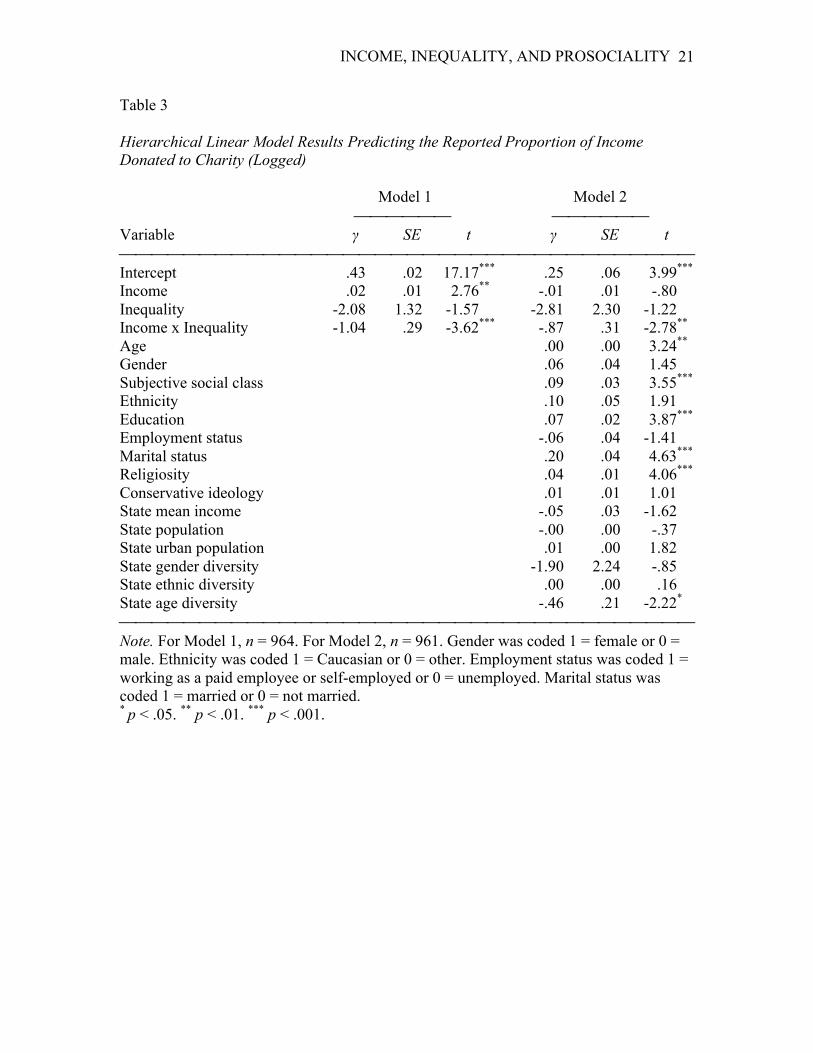
charity. There was a significant interaction between income and inequality predicting the
reported proportion of income donated to charity (Table 3, Model 1), which resisted
controls (Table 3, Model 2). This interaction, shown in Figure 3, reveals that in areas
where inequality was high, having a higher income was associated with reporting
donating less, but in areas where inequality was low, having a higher income was
associated with reporting donating more. The analysis of regions of significance revealed
that income was significantly positively related to reported donations in states with Ginis
below .471, a set that included 33 states. By contrast, income was significantly negatively
related to reported donations where the Gini exceeded .502 (i.e., the state of New York
and DC). This pattern is consistent with past findings on the relationship between
inequality, hierarchical standing, and prosocial behavior (Côté et al., 2015; Hargreaves
Heap et al., 2016; Nishi et al., 2015).
Mediated moderation analysis of income, inequality, entitlement, and the
reported proportion of income donated to charity. We conducted a mediated moderation
analysis to test whether entitlement explained why having a higher income was
associated with reporting giving less where inequality was high. Meeting the first
condition for mediated moderation (Muller et al., 2005), in a previous analysis, there was
an interaction between inequality and income predicting reported donations, and the
pattern matched the prediction. Meeting the second condition, in another previous
analysis, there was an interaction between inequality and income predicting entitlement,
and the pattern also matched the prediction. Further, meeting the third criterion,
INCOME, INEQUALITY, AND PROSOCIALITY 20
entitlement was negatively correlated with reported donations, r(961) = -.21, p < .001,
replicating past findings that individuals with high levels of entitlement are less prosocial
(Campbell et al., 2004). Further, the estimate for the interaction between inequality and
income predicting reported donations was reduced, though remained significant, γ = -.92,
SE = .27, t = -3.48, p < .001, when entitlement was added to the model.
We also tested mediated moderation by assessing the significance of the
conditional indirect effect using bootstrap confidence intervals (using 20,000 random
samples with replacement; MacKinnon, 2008). The 95% confidence ranged from -.22 to -
.01. Because the confidence interval excluded 0, mediated moderation was supported.
Thus, in highly unequal areas, higher income individuals reported giving a lower
proportion of their income to charity because they felt more entitled than lower income
individuals. These findings support Hypothesis 2.
INCOME, INEQUALITY, AND PROSOCIALITY 21
Table 3 Hierarchical Linear Model Results Predicting the Reported Proportion of Income Donated to Charity (Logged) Model 1 Model 2 ⎯⎯⎯⎯⎯⎯ ⎯⎯⎯⎯⎯⎯ Variable γ SE t γ SE t ⎯⎯⎯⎯⎯⎯⎯⎯⎯⎯⎯⎯⎯⎯⎯⎯⎯⎯⎯⎯⎯⎯⎯⎯⎯⎯⎯⎯⎯⎯⎯⎯⎯⎯⎯⎯ Intercept .43 .02 17.17*** .25 .06 3.99*** Income .02 .01 2.76** -.01 .01 -.80 Inequality -2.08 1.32 -1.57 -2.81 2.30 -1.22 Income x Inequality -1.04 .29 -3.62*** -.87 .31 -2.78** Age .00 .00 3.24** Gender .06 .04 1.45 Subjective social class .09 .03 3.55*** Ethnicity .10 .05 1.91 Education .07 .02 3.87*** Employment status -.06 .04 -1.41 Marital status .20 .04 4.63*** Religiosity .04 .01 4.06*** Conservative ideology .01 .01 1.01 State mean income -.05 .03 -1.62 State population -.00 .00 -.37 State urban population .01 .00 1.82 State gender diversity -1.90 2.24 -.85 State ethnic diversity .00 .00 .16 State age diversity -.46 .21 -2.22* ⎯⎯⎯⎯⎯⎯⎯⎯⎯⎯⎯⎯⎯⎯⎯⎯⎯⎯⎯⎯⎯⎯⎯⎯⎯⎯⎯⎯⎯⎯⎯⎯⎯⎯⎯⎯ Note. For Model 1, n = 964. For Model 2, n = 961. Gender was coded 1 = female or 0 = male. Ethnicity was coded 1 = Caucasian or 0 = other. Employment status was coded 1 = working as a paid employee or self-employed or 0 = unemployed. Marital status was coded 1 = married or 0 = not married. * p < .05. ** p < .01. *** p < .001.

INCOME, INEQUALITY, AND PROSOCIALITY 22
Reported Proportion of Income Donated to Charity (Logged)
Figure 3. Reported proportion of income donated to charity (logged) as a function of income (±1 SD) and inequality in respondents’ home states. Lines are projections based on regression estimate from the regression model. The solid line depicts the projected association between income and the reported proportion of income donated to charity in the area with the lowest level of inequality (the state of Wyoming). The dotted line depicts this projected association in an area with an average level of inequality. The dashed line depicts this projected association in the area with the highest level of inequality (the District of Columbia).
0
1
Lowerincomeindividuals Higherincomeindividuals
Highestinequality
Averageinequality
Lowestinequality
INCOME, INEQUALITY, AND PROSOCIALITY 23
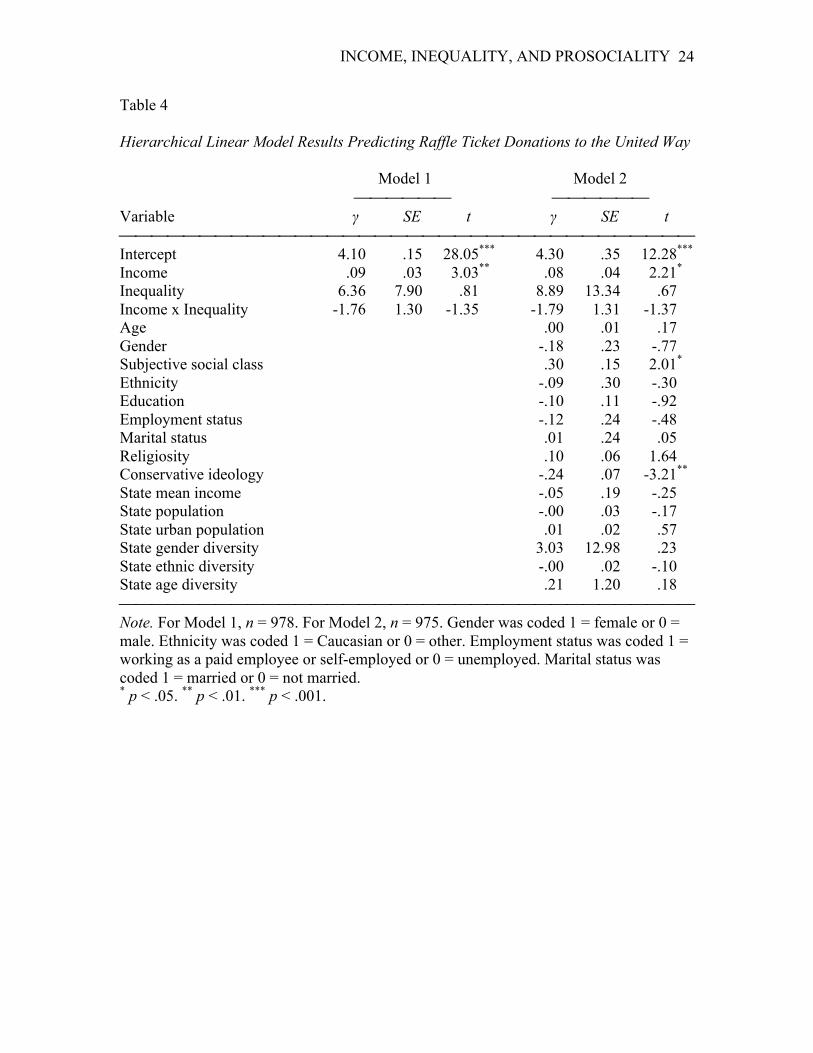
Income, inequality, and raffle ticket donations to the United Way. There was
a positive association between income and raffle ticket donations to the United Way, but
this association did not vary as a function of inequality. Thus, there was no significant
interaction between income and inequality predicting raffle ticket donations (Table 4,
Models 1 and 2). This result is inconsistent with the previous analysis concerning
charitable donations and results reported in past research (Côté et al., 2015; Hargreaves
Heap et al., 2016; Nishi et al., 2015), suggesting that some prosocial behaviors might not
be reduced by inequality. In the discussion, we consider potential explanation of this
result. This finding does not support Hypothesis 2. Thus, Hypothesis 2 was partially
supported. The findings on reported donations to charity supported Hypothesis 2, but the
findings on raffle ticket donations to the United Way did not support it.
INCOME, INEQUALITY, AND PROSOCIALITY 24
Table 4 Hierarchical Linear Model Results Predicting Raffle Ticket Donations to the United Way Model 1 Model 2 ⎯⎯⎯⎯⎯⎯ ⎯⎯⎯⎯⎯⎯ Variable γ SE t γ SE t ⎯⎯⎯⎯⎯⎯⎯⎯⎯⎯⎯⎯⎯⎯⎯⎯⎯⎯⎯⎯⎯⎯⎯⎯⎯⎯⎯⎯⎯⎯⎯⎯⎯⎯⎯⎯ Intercept 4.10 .15 28.05*** 4.30 .35 12.28*** Income .09 .03 3.03** .08 .04 2.21* Inequality 6.36 7.90 .81 8.89 13.34 .67 Income x Inequality -1.76 1.30 -1.35 -1.79 1.31 -1.37 Age .00 .01 .17 Gender -.18 .23 -.77 Subjective social class .30 .15 2.01* Ethnicity -.09 .30 -.30 Education -.10 .11 -.92 Employment status -.12 .24 -.48 Marital status .01 .24 .05 Religiosity .10 .06 1.64 Conservative ideology -.24 .07 -3.21** State mean income -.05 .19 -.25 State population -.00 .03 -.17 State urban population .01 .02 .57 State gender diversity 3.03 12.98 .23 State ethnic diversity -.00 .02 -.10 State age diversity .21 1.20 .18 ⎯⎯⎯⎯⎯⎯⎯⎯⎯⎯⎯⎯⎯⎯⎯⎯⎯⎯⎯⎯⎯⎯⎯⎯⎯⎯⎯⎯⎯⎯⎯⎯⎯⎯⎯⎯ Note. For Model 1, n = 978. For Model 2, n = 975. Gender was coded 1 = female or 0 = male. Ethnicity was coded 1 = Caucasian or 0 = other. Employment status was coded 1 = working as a paid employee or self-employed or 0 = unemployed. Marital status was coded 1 = married or 0 = not married. * p < .05. ** p < .01. *** p < .001.
INCOME, INEQUALITY, AND PROSOCIALITY 25
Discussion
This study makes several contributions to our understanding of how income
relates to prosociality. First, our findings about the reported proportion of income donated
to charity was consistent with past findings that having a higher income is associated with
being less prosocial under unequal economic conditions, and more prosocial under more
equal conditions (Côté et al., 2015; Hargreaves Heap et al., 2016; Nishi et al. 2015).
Second, we found evidence for a mechanism that explains this pattern: psychological
entitlement. Where inequality was high, higher income individuals felt more entitled than
their lower income counterparts. Further, entitlement mediated the moderated association
between income, inequality and reported charitable donations, suggesting that higher
income individuals are particularly self-serving under conditions of pronounced
economic inequality because these conditions make them feel important and deserving.
By contrast, our analyses suggest that meritocratic beliefs do not explain this pattern.
Higher income individuals endorsed meritocratic beliefs where inequality was relatively
high and also where it was relatively low.
Researchers have linked high levels of economic inequality with a host of social
problems, including crime, obesity, teenage births, drug and alcohol abuse, gender
inequality, and reduced social cohesion (Hsieh & Pugh, 1993; Kawachi, Kennedy,
Lochner, & Prothrow-Smith, 1999; Wilkinson & Pickett, 2009). Our findings illuminate
micro processes that might explain these macro patterns, a possibility that should be
examined in future research. For instance, inequality might reduce social cohesion in part
by increasing entitlement among those at the top of the economic distribution.
INCOME, INEQUALITY, AND PROSOCIALITY 26
Our findings extend past research by showing that inequality might reduce higher
income individuals’ donations of earned income, whereas past research had tested this
pattern with resources received unexpectedly from experimenters (Côté et al., 2015;
Hargreaves Heap et al., 2016; Nishi et al. 2015), a method that invites questions about
generalizability. In interpreting these findings, it is important to consider that self-reports
of charitable donations may be influenced by memory limitations and social desirability
response bias (Podsakoff & Organ, 1986), particularly because generous acts are among
the most socially desirable acts (Willer, 2009).
Our study also reveals boundary conditions for the pattern between income,
inequality, and prosociality found for reported donations to charity and in past research
(Côté et al., 2015; Hargreaves Heap et al., 2016; Nishi et al. 2015), as our analysis of
raffle ticket donations to the United Way did not yield this pattern. We conducted
exploratory analyses revealing that counter to past findings that entitlement is a robust
predictor of self-serving behavior (Campbell et al., 2004; Zitek et al., 2010), entitlement
did not correlate with raffle ticket donations, r(975) = -.03, p = .96. We also reviewed the
responses to an open-ended question asking for comments at the end of the survey. A few
participants reported having negative attitudes about the United Way because of prior
wrongdoing by executives, which sometimes led to prison sentences (Johnston, 2004;
Markon, 2004; Strom, 2006). Participants’ motivation to be prosocial toward the United
Way might thus depend in part on factors beyond the scope of our study—particularly
pre-existing, polarized attitudes towards this organization—and, as a result, less on other
predictors such as entitlement. As such, the findings suggest a boundary condition for the
INCOME, INEQUALITY, AND PROSOCIALITY 27
relationship between income, inequality, and prosociality—the perceived legitimacy of
the target of prosociality—that could be explored in future research.
In sum, the findings illuminate why the relationship between income and
prosociality has been found to vary depending on levels of inequality. Under highly
unequal economic conditions—but not when income is more evenly distributed—higher
income individuals feel highly entitled, and because of this they report giving less of their
income to charity. As such, the findings identify a previously unexamined correlate of
high economic inequality: high entitlement among those who earn the most. One
mechanism for the perpetuation of inequality might involve moneyed elites who are
highly entitled and donate little—a pattern of beliefs and behaviors that contribute to
maintaining that advantage.

INCOME, INEQUALITY, AND PROSOCIALITY 28
References
Aguinis, H., Gottfredson, R. K., & Culpepper, S. A. (2013). Best-practice
recommendations for estimating cross-level interaction effects using multilevel
modeling. Journal of Management, 39, 1490-1528.
Andersen, R., & Curtis, J. (2012). The polarizing effect of economic inequality on class
identification: Evidence from 44 countries. Research in Social Stratification and
Mobility, 30, 129-141.
Bekkers, R. (2007). Measuring altruistic behavior in surveys: The all-or-nothing dictator
game. Survey Research Methods, 1, 139-144.
Benz, M., & Meier, S. (2008). Do people behave in experiments as in the field? Evidence
from donations. Experimental Economics, 11, 268-281.
Campbell, W. K., Bonacci, A. M., Shelton, J., Exline, J. J., & Bushman, B. J. (2004).
Psychological entitlement: Interpersonal consequences and validation of a self-
report measure. Journal of Personality Assessment, 83, 29-45.
Chen, Y., Zhu, L., & Chen, Z. (2013). Family income affects children’s altruistic
behavior in the dictator game. PLOS One, 8, e80419.
Cohen, J. (1988). Statistical power analysis for the behavioral sciences (2nd ed.).
Hilldsale, NJ: Erlbaum.
Côté, S., House, J., & Willer, R. (2015). High economic inequality leads higher-income
individuals to be less prosocial. Proceedings of the National Academy of Sciences,
112, 15838-15843.
Enders, C. K., & Tofighi, D. (2007). Centering predictor variables in cross-sectional
multilevel models: a new look at an old issue. Psychological Methods, 12, 121-138.
INCOME, INEQUALITY, AND PROSOCIALITY 29
GINI index (World Bank estimate). (2016, July 19th). Retrieved from:
http://data.worldbank.org/indicator/SI.POV.GINI
Harrison, D. A., & Klein, K. J. (2007). What's the difference? Diversity constructs as
separation, variety, or disparity in organizations. Academy of Management Review,
32, 1199-1228.
Hofmann, D. A., & Gavin, M. B. (1998). Centering decisions in hierarchical linear
models: Implications for research in organizations. Journal of Management, 24,
623-641.
Hout, M. (2004). Getting the most out of the GSS income measures. GSS Methodological
Report 101. National Opinion Research Center, University of California, Berkeley,
CA.
Hsieh, C., & Pugh, M. D. (1993). Poverty, income inequality, and violent crime: A meta-
analysis of recent aggregate data studies. Criminal Justice Review, 18, 182-202.
Hunsley, J., & Meyer, G. J. (2003). The incremental validity of psychological testing and
assessment: Conceptual, methodological, and statistical issues. Psychological
Assessment, 15, 446-455.
Johnston, D.C. (2004, March 5th). Former head of United Way in the Washington area
pleads guilty to theft. The New York Times. Retrieved from
http://www.nytimes.com/2004/03/05/us/former-head-of-united-way-in-the-
washington-area-pleads-guilty-to-theft.html
Kawachi, I., Kennedy, B. P., Lochner, K., & Prothrow-Stith, D. (1997). Social capital,
income inequality, and mortality. American Journal of Public Health, 87, 1491-
1498.
INCOME, INEQUALITY, AND PROSOCIALITY 30
Korndörfer, M., Egloff, B., & Schmukle, S. C. (2015). A large scale test of the effect of
social class on prosocial behavior. PLOS One, 10, e0133193.
MacKinnon, D. P. (2008). Introduction to statistical mediation analysis. New York:
Erlbaum.
Major, B. (1994). From social inequality to personal entitlement: The role of social
comparisons, legitimacy appraisals, and group membership. Advances in
Experimental Social Psychology, 26, 293-355.
Major, B., Kaiser, C. R., O'Brien, L. T., & McCoy, S. K. (2007). Perceived
discrimination as worldview threat or worldview confirmation: Implications for
self-esteem. Journal of Personality and Social Psychology, 92, 1068-1086.
Markon, J. (2004, May 14th). Ex-chief of local United Way sentenced. The Washington
Post. Retrieved from http://www.washingtonpost.com/wp-dyn/articles/A27261-
2004May14.html
Miller, J. G., Kahle, S., & Hastings, P. D. (2015). Roots and benefits of costly giving:
Children who are more altruistic have greater autonomic flexibility and less family
wealth. Psychological Science, 26, 1038-1045.
Muller, D., Judd, C. M., & Yzerbyt, V. Y. (2005). When moderation is mediated and
mediation is moderated. Journal of Personality and Social Psychology, 89, 852-
863.
Newman, B. J., Johnston, C. D., & Lown, P. L. (2015). False consciousness or class
awareness? Local income inequality, personal economic position, and belief in
american meritocracy. American Journal of Political Science, 59, 326-340.

INCOME, INEQUALITY, AND PROSOCIALITY 31
Nishi, A., Shirado, H., Rand, D. G., & Christakis, N. A. (2015). Inequality and visibility
of wealth in experimental social networks. Nature, 526, 426-429.
Parker, R. N., & Fenwick, R. (1983). The Pareto curve and its utility for open-ended
income distributions in survey research. Social Forces, 61, 872-885.
Pedhazur, E. J., & Schmelkin, L. P. (1991). Measurement, design, and analysis: An
integrated approach. New York: Psychology Press.
Piff, P. K., Kraus, M. W., Côté, S., Cheng, B. H., & Keltner, D. (2010). Having less,
giving more: The influence of social class on prosocial behavior. Journal of
Personality and Social Psychology, 99, 771-784.
Pinheiro, J., Bates, D., DebRoy, S., Sarkar, D., and R Core Team (2016). nlme: Linear
and Nonlinear Mixed Effects Models. R package version 3.1-128, http://CRAN.R-
project.org/package=nlme.
Podsakoff, P. M., & Organ, D. W. (1986). Self-reports in organizational research:
Problems and prospects. Journal of Management, 12, 531-544.
Pratto, F., Sidanius, J., Stallworth, L. M., & Malle, B. F. (1994). Social dominance
orientation: A personality variable predicting social and political attitudes. Journal
of Personality and Social Psychology, 67, 741-763.
Preacher, K. J., Curran, P. J., & Bauer, D. J. (2006). Computational tools for probing
interactions in multiple linear regression, multilevel modeling, and latent curve
analysis. Journal of Educational and Behavioral Statistics, 31, 437-448.
Stiglitz, J. E. (2012). The price of inequality: How today's divided society endangers our
future. New York: W.W. Norton.
INCOME, INEQUALITY, AND PROSOCIALITY 32
Strom, S. (2006, April 14th). United Way says ex-leader took assets. The New York
Times. Retrieved from
http://www.nytimes.com/2006/04/14/nyregion/14united.html
Tabachnick, B. G., & Fidell, L. S. (2007). Using multivariate statistics (5th ed.). Boston:
Pearson.
U.S. Census Bureau (2015a). American Community Survey, 2014 American Community
Survey 1-Year Estimates, Tables B01003, B02001, B19083, S0101, S1902;
generated by Stéphane Côté; using American FactFinder. Available at
factfinder.census.gov/faces/nav/jsf/pages/index.xhtml. Accessed April 18, 2016.
U.S. Census Bureau (2015b). Current Population Survey, 2014 Annual Social and
Economic Supplement, Table PINC-11; generated by Stéphane Côté. Available at
www.census.gov. Accessed June 10, 2015.
U.S. Census Bureau (2015c). 2010 Decennial Census, Table P2; generated by Stéphane
Côté; using American FactFinder. Available at factfinder.census.
gov/faces/nav/jsf/pages/index.xhtml. Accessed April 7, 2014.
Wakslak, C. J., Jost, J. T., Tyler, T. R., & Chen, E. S. (2007). Moral outrage mediates the
dampening effect of system justification on support for redistributive social
policies. Psychological Science, 18, 267-274.
Wilkinson, R. G., & Pickett, K. E. (2009). Income inequality and social dysfunction.
Annual Review of Sociology, 35, 493-511.
Willer, R. (2009). Groups reward individual sacrifice: The status solution to the
collective action problem. American Sociological Review, 74, 23-43.
Yamagishi, T., Li, Y., Takagishi, H., Matsumoto, Y., & Kiyonari, T. (2014). In search of

INCOME, INEQUALITY, AND PROSOCIALITY 33
homo economicus. Psychological Science, 25, 1699-1711.
Zimmerman, J. L., & Reyna, C. (2013). The meaning and role of ideology in system
justification and resistance for high- and low-status people. Journal of Personality
and Social Psychology, 105, 1-23.
Zitek, E. M., Jordan, A. H., Monin, B., & Leach, F. R. (2010). Victim entitlement to
behave selfishly. Journal of Personality and Social Psychology, 98, 245-255.