higher education in agriculture - pids admin
TRANSCRIPT

Philippine Institute for Development StudiesSurian sa mga Pag-aaral Pangkaunlaran ng Pilipinas
Higher Educationin Agriculture
Trends, Prospects,and Policy Directions
Philippine Council for Agriculture, Aquatic and Natural Resources Research and Development
Edited by
Roehlano M. BrionesMelvin B. Carlos

Higher Education in Agriculture:
Trends, Prospects, and Policy Directions


iii
Philippine Institute for Development StudiesSurian sa mga Pag-aaral Pangkaunlaran ng Pilipinas
Philippine Council for Agriculture, Aquaticand Natural Resources Research and Development
Higher Education in Agriculture:
Trends, Prospects, and Policy Directions
Edited by
Roehlano M. Briones
Melvin B. Carlos

iv
Copyright 2013
Philippine Institute for Development Studies (PIDS)Philippine Council for Agriculture, Aquatic and Natural Resources Research and Development (PCAARRD)
Printed in the Philippines. All rights reserved.
The views expressed in this volume are those of the authors and do not necessarily reflect the views of any individual or organization. Please do not quote without permission from the authors or PIDS and PCAARRD.
Please address all inquiries to:
Philippine Institute for Development StudiesNEDA sa Makati Building, 106 Amorsolo StreetLegaspi Village, 1229 Makati City, PhilippinesTel: (63-2) 8939573 / 8942584 / 8935705Fax: (63-2) 8161091 / 8939586E-mail: [email protected]: http://www.pids.gov.ph
ISBN 978-971-564-062-6RP 11-13-600
Copyeditor: Florisa Luna L. CaradaProduction Coordinator: Ivory Myka R. Galang and Claudette S. MalanaCover design: Jose Ignacio O. TenorioLayout and printing: Bencel Z Press

v
Table of Contents
List of Tables, Figures, Box, and Annexes viForeword xiiiPreface xviiAcknowledgment xixList of Acronyms xx
Chapter 1The state and future supply of and demand for Agriculture, Forestry 1and Natural Resources (AFNR) graduates in the Philippines: IntroductionPatricio S. Faylon, Ruperto S. Sangalang, Albert P. Aquino, Melvin B. Carlos,Richard B. Daite, and Ernesto O. Brown
Enhancing the demand for AFNR graduates through science 1 and technology: Program historical background Enhancing the demand for AFNR Graduates through Science 7 and Technology (S&T): Work and components Enhancing the demand for AFNR Graduates through Science 9 and Technology: Component Project 1 in focus
Chapter 2AFNR education in the Philippines: History, context, and trends 13Anna Floresca F. Abrina, J. Prospero E. de Vera III, Rizalino B. Cruz,Ledivina V. Carino+, and Roehlano M. Briones
Introduction 13Higher education in the Philippines 14 History of AFNR education 20National, regional, and AFNR employment 25 Concluding comment 33References 33
Chapter 3Profiles and perceptions of AFNR human resources in the Philippines: 51Students, graduates and employersAnna Floresca F. Abrina, J. Prospero E. de Vera III, and Rizalino B. Cruz
Introduction 53AFNR human resource inventory 54AFNR human resource tracer study 57Conclusion 75

vi
Chapter 4Projecting the supply and demand for AFNR human resources 91Anna Floresca F. Abrina, Jaimie Kim B. Arias, Jose V. Camacho,and U-Primo E. Rodriguez
Overview 91The labor market 92Survey of business firms 96The projection model 101Policy scenarios 107Conclusions and recommendations 113References 114
Chapter 5The state and future supply of and demand for AFNR graduates 135in the Philippines: Synthesis and implications
Research questions 135Background 136Findings from the human resource inventory 138 and environmental scanning Results from the scenario analysis 141 Conclusion 145References 145
About the Authors 147

vii
List of Tables, Figures,Box, and Annexes
Chapter 1
Table1 Higher education programs in Agriculture, Forestry, Fisheries, 11 Natural Resources and allied fields (Baccalaureate and Ladderized)
Figure1 Program framework 82 Methodological framework of Component Project 1 10
Chapter 2
Annex A. Trends in higher educationTable A1 Higher education institutions (including satellite campuses), 37 by academic year and by institution type, AY 2002-2003 to AY 2004-2005 and AY 2010-20112 Higher education enrollment, by discipline and academic year, 38 AY 2005-2006 to AY 2009-20103 Number of graduates in higher education, by discipline 39 and academic year, AY 2004-2005 to AY 2008-20094 Higher education enrollment, by sector, institutional type 40 and academic year, AY 1996/97 to 2004-055 Enrollment and graduates of the TVET System, by region 41 and by year, 2002 to 2006
Annex B. Higher Education InstitutionsTable B1 Agricultural and total HEIs, by type of institution, 2003-2005 422 AFNR enrollment, by type of institution, AY 1999-2000 to AY 2004 42
Annex C. Employment and wagesTable C1 Employed persons by major industry group, in thousands, 43 as of October, 2003 to 20072 Employed persons by major occupation group, in thousands 43 as of October, 2003 to 20073 Average daily basic pay by major industry group, in Philippine 44 pesos, 2004-2009

viii
4 Average daily basic pay by major occupation group, in Philippine 44 pesos, 2004-20095 Regional contribution to total employment and total 45 unemployment, in percent, with averages, 2003 to 2007
Annex D. Population and poverty indicatorsTable D1 Proportion of rural barangays in the Philippines, by region, 2000 462 Provinces with more than 50 percent urban population, 2000 463 Poverty indicators in the Philippines, 1991-2006 46
Annex E. Production and employmentTable E1 Growth of gross domestic product, total and by industrial origin, 47 in percentage, 1993 to 20072 Proportion of gross domestic product, by industrial origin, 47 1993 to 20073 Employed persons by major occupation group, as proportion 48 of total, as of October, 2003 to 20074 Deployed land-based overseas Filipino workers, by major world 48 groupings, 1991-2007
Annex F. Quality of AFNR educationTable F1 Passing rates in licensure examinations, 2007 492 Passing rates in the licensure examination for agriculture, 49 national and top performing schools, 2003-2008
Chapter 3
Table1 Growth rates of AFNR enrollment, in percentage, regional 55 and total, SY 1998-1999 to 2007-20082 Growth rates of the number of AFNR graduates, in percentage, 56 regional and total, SY 1998- 1999 to SY 2007-20083 Percentage of respondents paying modal tuition fees, in percentage, 62
regional and total4 Percentage of respondents who paid modal miscellaneous fees, 63 in percentage, regional and total

ix
5 Reasons for choice of degree program, in percentages, all regions 656 Ranking of reasons for choice of HEI, based on percentage 66 response rate, student survey and graduate survey, all regions7 Distribution of graduate-respondents, based on length of first job 69 search, in percentage, regional and total8 Response rate of graduate-respondents to competencies learned 69 from HEI, in percentage, regional and total9 Response rate of student-respondents in modal category 70 of evaluation of satisfaction and effectiveness of program, in percentages, all regions10 Responses by graduate-respondents on self-evaluation 70 of competency and program effectiveness in relation to skills and knowledge acquired from college, modal responses, all regions11 Response rates on preferred recruitment and application methods 72 and considerations in hiring, in percentages, all regions12 Response rate among employer-respondents in the modal category 73 for importance of and satisfaction with employee characteristics, in percentages, all regions13 Response rate of employer-respondents on skills that need 74 emphasis, in percentages, regional and total
Figure1 Average proportion of each level of study in number of AFNR 57 degrees conferred, in percentage, total for all regions, SY 1998-1999 to SY 2007-2008 2 Average proportion of each rank in total faculty roster, 58 in percentage, total for all regions, SY 1998-1999 to 2007-20083 Distribution of self-employed graduate-respondents by source 61 of financing, in percentage, regional and total
Annex A. Higher Education Institutions coveredTable A1 List of higher education institutions included in inventory 76 and tracer study of AFNR human resources, by region

x
Annex B. Human Resource InventoryTable B1 Number of enrolled students in AFNR courses, by level of study, 78 regional and total, second semester SY 2008-20092 AFNR enrollment, number of enrollees by sex, regional and total, 79 SY 1998-1999 to SY 2007-20083 Number of AFNR degrees conferred, by level of study, regional 80 and total, SY 2007-20084 Number and growth rate of AFNR graduates, SY 2007-2008 80 and average for SY 1998-1999 to SY 2007-2008, regional and total
Annex C. Profile data from Human Resource Tracer StudyTable C1 Projected sample size and actual number of observations 81 of AFNR Human Resource Tracer Study, regional and total2 percentage of student-respondents with modal characteristics, 81 regional and total3 Top five AFNR degree programs by number 82 of student-respondents, regional and total4 Percentage of graduate-respondents with modal characteristics, 83 regional and total 5 Distribution of graduate-respondents by level of study, in percent, 83 regional and total6 Top five AFNR degree programs by number 84 of graduate-respondents, regional and total7 Distribution of employed graduate-respondents by status 84 of employment, in percentage, regional and total8 Distribution of graduate-respondents by current salary range, 85 in percentage, regional and total9 Top business sectors by number of self-employed 85 graduate-respondents, in percentage, regional and total10 Selected responses of graduate-respondents on reason 85 for unemployment, in percentage of all respondents, regional and total
Figure C1 Distribution of student-respondents by gender, in percentage, 86 regional and total2 Distribution of student-respondents by type of secondary school, 86 in percentage, regional and total3 Distribution of student-respondents by home region-school region 87 match, in percent, regional and total

xi
4 Distribution of graduate-respondents by gender, in percentage, 87 regional and total5 Distribution of graduate-respondents by home region-school 88 region match, in percent, regional and total6 Distribution of graduate-respondents by type of college, 88 in percentage, regional and total7 Distribution of graduate-respondents by employment status, 89 in percentage, regional and total
Chapter 4
Table1 Summary of survey of establishments 2006-2008 97 (% of total employment)2 Distribution of firms hiring AFNR graduates, 2009 983 Distribution of employees according to average starting 99 salaries (pesos)4 Salaries of graduates, in firms with AFNR graduates, 2006-2008 99 (pesos, 2008 prices)5 Firms’ rating of job prospects (%) 1006 Firms’ rating of factors that affect job prospects (%) 1007 Base year employment data 1048 Baseline growth rates of exogenous variables (%) 1069 Baseline average growth rates, 2010-2020 (%) 106
Figure1 Share of firms employing AFNR graduates offering additional 99 benefits (%)2 Method of recruitment of firms hiring AFNR graduates (%) 1003 The labor market for AFNR graduates 1024 Projected unemployment of AFNR graduates, baseline 107 scenario (%)5 Difference from baseline, 2010-2020 by experiment, 109 percentage points6 Difference from baseline unemployment rate of AFNR graduates 110 in 2020, by experiment, in percentage points7 Average annual growth of demand for AFNR graduates 110 2010-2002 (%), by experiment (baseline growth rate = 0.41%)8 Average growth of supply of AFNR graduates 2010-2002 (%), 111 by experiment (baseline growth rate = 1.00%)

xii
9 Average growth of unemployment, 2010-2002 (%), baseline 112 growth = 2.56%
Annex A. Distribution of firms by industry and by area, INSTAT SurveyTable A1 Distribution of firm respondents by industry 1172 Distribution of firm respondents by area 117
Annex B. Questionnaire for INSTAT Survey 118
Annex C. Mean rating and ranking of skills required for graduate, 126 INSTAT Survey
Annex D. Sources of secondary data and construction of data setTable D1 Sources of secondary aggregate data 1282 Percentage share of AFNR graduates occupying AFNR positions 129 and AFNR graduates not occupying AFNR positions to total employment per industry
Annex E. Equations of the model 130
Annex F. Parameterization 131
Annex G. Estimates of the demand for AFNR graduates 132
Annex H. Parameter values used for the supply of AFNR 133 graduates equation
Chapter 5
Box1 Economies of scale in higher education 137

xiii
Foreword
“An investment in knowledge pays the best interest.”—Benjamin Franklin
With a third of the poor concentrated in the rural sector and employed in low-skilled and low-productivity jobs in agriculture, higher education is a powerful tool that can lift them out of poverty. Agricultural modernization is an essential element in the Philippines’ strategy for inclusive growth. The mandate of many public sector higher education institutions (HEIs) is to create a pool of skilled workers to increase the competitiveness of our agriculture and fisheries sector. However, HEIs have experienced declining enrollment rates in agriculture, forestry, and natural resources (AFNR) courses. This puts into the question the cost effectiveness of these HEIs.
This book, Higher Education in Agriculture: Trends, Prospects, and Policy Directions, focuses on this dilemma and attempts to suggest long-term responses. It provides a comprehensive analysis beginning with a historical background, empirical data of AFNR human resources in the Philippines (covering students, graduates, and employers), and a quantitative analysis of future supply of and demand for AFNR human resources.
One of the main policy recommendations in this book is the rationalization of AFNR higher educational institutions, which is crucial to increasing the employability of AFNR graduates. The rationalization will make AFNR educational institutions more responsive to the needs of the labor market. Furthermore, this book also re-emphasizes the need to modernize the agriculture sector through diversification, infrastructure investments, and an agribusiness orientation. More opportunities for AFNR graduates will then open and the agriculture sector will experience a more robust growth.
It is hoped that this book will serve as a guide to policymakers, education specialists and students, and other education stakeholders, to help grapple with the emerging challenges in the human resource aspect of agricultural development.
Gilberto M. LlantoPresidentPIDS

xiv

xv
Foreword
The inclusion of the Philippine Council for Agriculture, Aquatic, and Natural Resources Research and Development (PCAARRD) as the managing institution for the project “Policy Research on the State and Future Supply of and Demand for Agriculture, Forestry, and Natural Resources (AFNR) Graduates in the Philippines”, under the program “Enhancing the Demand for AFNR Graduates Through Science and Technology”, was inevitable given its familiarity with the agriculture sector. As a council under the Department of Science and Technology, its main mandate is science planning for the AFNR sector. PCAARRD operates mainly through state universities and colleges (SUCs) by offering scholarship grants for graduate degrees and helping universities develop facilities for research in agriculture. The council also has the capacity to execute large-scale national programs through the mobilization of R&D consortia across the country.
SUCs in the Philippines are in a dilemma; past decades have seen fewer and fewer students enrolling in their flagship program offerings, which are the agriculture and related programs. This raises concern over the possible future gap in human resource requirements for agriculture. This book, Higher Education in Agriculture: Trends, Prospects, and Policy Directions, digs deeper into the phenomenon of declining enrollment in AFNR courses and seeks to explain the reasons for the decline as well as what should be done with this alarming trend.
The trend is mainly caused by the declining demand for AFNR graduates. Many graduates have difficulty finding employment or are employed in non-agriculture jobs. The drop in AFNR enrollment is directly affected by the decline in the share of agriculture in the economic output and employment in the Philippines. In a practical sense, students will more likely pursue degrees that are economically attractive.
Now is the most opportune time to implement the long overdue rationalization of SUCs to allow them to offer agri-oriented Technical Vocational Education and Training programs, focusing on agribusiness-oriented agriculture. Agriculture diversification, agribusiness promotion, and investment in rural and market-related infrastructure should also be pursued. This book calls for the diversification of the agriculture sector and AFNR-related programs to be able to answer the changing needs of the local and global economic environments, in particular employment and better incomes.

xvi
I thank the Philippine Institute for Development Studies for partnering with PCAARRD in this collaborative effort that aims to analyze the state and future development of the AFNR sector. My sincere gratitude to all the authors for sharing their time and expertise for the publication of this book.
Dr. Patricio S. FaylonExecutive DirectorPCAARRD

xvii
Preface
The role of the agriculture, forestry, and natural resources (AFNR) sector in the overall economic development strategy is sometimes overlooked in favor of manufacturing and services. More so is the importance of education and human resources development in the AFNR sector itself. This book looks into the reasons why agriculture and related courses, which are the flagship programs of the country’s state universities and colleges (SUCs), have become even less popular among the youth through the years.
This book documents the work of the project “Policy Research on the State and Future Supply of and Demand for AFNR Graduates in the Philippines” carried out by the Philippine Institute for Development Studies (PIDS) and the Philippine Council for Agriculture, Aquatic, and Natural Resources Research and Development (PCAARRD) as part of the program “Enhancing the Demand for AFNR Graduates Through Science and Technology”.
Declining enrollment in AFNR courses is indeed a cause for alarm given the unbridled expansion of SUCs in the past few decades. Congress has had a propensity to convert rural high schools into agricultural and forestry colleges, and later, into full-fledged SUCs, as part of political legacy-building. The changing dynamics of the higher education sector, however, puts into question the sustainability of their agriculture and related programs, if not the very existence of these institutions themselves. Moreover, the enrollment downtrend has dire consequences for the future human resource requirements of the agriculture sector.
A number of factors have been pinpointed as the causes of this moribund state. One is the supposed poor quality of AFNR courses offered by SUCs, as shown by low passing rates in licensure examinations administered by the Professional Regulation Commission. Another is the so-called economic barrier. Students supposedly are discouraged from enrolling into AFNR courses due to the high costs of tuition and other fees. Low demand for AFNR courses is also said to be due to the country’s economic transformation: with agriculture now accounting for less than a fifth of the domestic economy, there has been a dramatic decline in demand for graduates of AFNR courses. Aside from few job opportunities, the low remuneration for AFNR graduates has led students to pursue more lucrative careers.
This book examines each of these factors and points the way forward in transforming the educational sector to become more responsive to the new demands of the labor market. There is a need to rationalize AFNR higher educational and technical-vocational institutions while addressing skill shortages, degree requirements, and other crucial issues. In the larger context, the country’s strategy for economic development should promote agriculture modernization and an agribusiness orientation, supported by investments in

xviii
infrastructure. This book is yet another contribution of PIDS to the effort to craft evidence-based policy aimed at making growth and development more inclusive, especially for the third of the country’s workforce making a living in the agriculture sector.
Roehlano M. Briones, Ph.D.Senior Research FellowPIDS

xix
Acknowledgment
The Higher Education in Agriculture: Trends, Prospects, and Policy Directions is published by the Philippine Institute for Development Studies (PIDS) in partnership with the Philippine Council for Agriculture, Aquatic and Natural Resources Research and Development (PCAARRD). Chapter 1 was written by Patricio S. Faylon, Ruperto S. Sangalang, Albert P. Aquino, Melvin B. Carlos, Richard B. Daite, and Ernesto O. Brown. Chapter 2 was written by Anna Floresca F. Abrina, J. Prospero E. de Vera III, Rizalino B. Cruz, Ledivina V. Carino+, and Roehlano M. Briones. Chapter 3 was written by Anna Floresca F. Abrina, J. Prospero E. de Vera III, and Rizalino B. Cruz, and Chapter 4 by Anna Floresca F. Abrina, Jaimie Kim B. Arias, Jose V. Camacho, and U-Primo E. Rodriguez.
The authors acknowledge the valuable contributions of Rizalino Cruz and Julio Amador III in the data generation and analysis of this study for Chapter 2. For Chapter 3, the authors would like to acknowledge the invaluable help of Mr. Rey Val C. Firmalino in the consolidation and analysis of the data used in the study. The authors would like to also thank Mr. Harvey V. Baldovino of the Department of Economics at the University of the Philippines Los Baños for assisting in the collection, management, and analysis of data utilized in the study for Chapter 4.

xx
List of Acronyms
AY - Academic Year ACAP - Colleges of Agriculture in the Philippines AFF - Agriculture, Forestry and Fishery AFMA - Agriculture and Fisheries Modernization Act AFNR - Agriculture, Forestry and Natural Resources AFNR-HR - AFNR Human ResourcesAGRICOM - Congressional Commission on AgricultureASE - Annual Survey of EstablishmentsASPBI - Annual Survey of Philippine Business and IndustryATP - Architectural and Town-Planning CLAC - Central Luzon Agricultural College CPBI - Census Philippine Business and Industry CSC - Civil Service CommissionCEM - College of Economics and Management CHED - Commission on Higher Education COCAFM - Congressional Oversight Committee on Agriculture and Fisheries ModernizationDA - Department of AgricultureDAR - Department of Agrarian Reform DATBED - DOST-Academe Technology-Based Enterprise DevelopmentDBM - Department of Budget and ManagementDepEd - Department of EducationDECS - Department of Education, Culture and SportsDENR - Department of Environment and Natural Resources DOLE - Department of Labor and EmploymentDC - Directors’ CouncilDOST - Department of Science and TechnologyDSAC - Don Severino Agricultural CollegeEDCOM - Congressional Commission on Education EDSE-IGPs - Educational Income Generating ProjectsESTT - Education Science and Teacher Training FRDI - Forest Products Research and Development InstituteGMS - Generalized Algebraic Modeling SystemGC - Governing CouncilGDP - Gross Domestic ProductHEIs - Higher Education InstitutionsHE - Home EconomicsHR - Hotel and RestaurantHPF - Household Production Function

xxi
IPB - Institute of Plant BreedingINSTAT - Institute of StatisticsLTHEDP - Long-Term Higher Education Development PlanMCD - Mass Communication and DocumentationMF - Manufacturing and FoodMNF - Manufacturing Non-FoodMA - Medical and AlliedNAFES - National Agriculture and Fisheries Education SystemNCR - National Capital RegionNCAE - National Career Assessment ExaminationNCPAG - National College of Public Administration and GovernanceNCEs - National Centers of ExcellenceNCPC - National Crop Protection CenterNEP - National Expenditure ProgramNSCB - National Statistics Coordination BoardNSO - National Statistics OfficeNEDA - National Economic and Development AuthorityNMYC - National Manpower and Youth CouncilNS - Natural SciencesO - Other IndustriesOOPS - Output-Oriented Performance StandardsPAFERN - Philippine Agroforestry Education and Research NetworkPAFCI - Philippine Association of Forestry Colleges, Inc.PASUC - Philippine Association of State Universities and CollegesPCAARRD - Philippine Council for Agriculture, Aquatic, and Natural Resources Research and DevelopmentPOEA - Philippine Overseas Employment AdministrationPHTRC - Postharvest Horticulture Training and Research Center PCSPE - Presidential Commission to Survey Philippine EducationPRC - Professional Regulation CommissionRT - Religion and TheologyRPTs - Regional Project TeamsR&D - Research and DevelopmentST - Service TradesS&T - Science and TechnologySBS - Social and Behavioral SciencesSEAMEO - Southeast Asian Ministers of Education Organization

xxii
SEARCA - Southeast Asian Regional Center for Graduate Study and Research in AgricultureSUCS - State Universities and CollegesSY - School YearTESDA - Technical Education and Skills Development AuthorityTPAE - Technical Panel for Agricultural EducationTVET - Technical-Vocational Education and TrainingTBIs - Technology Business IncubatorsTLPs - Technopreneurial Learning ProjectsTCI - Trade, Craft and Industrial

The state and future supplyof and demand for Agriculture, Forestryand Natural Resources (AFNR) graduatesin the Philippines: Introduction
Patricio S. Faylon, Ruperto S. Sangalang, Albert P. Aquino,Melvin B. Carlos, Richard B. Daite, and Ernesto O. Brown
1Chapter
This chapter provides a brief description of the program, “Enhancing the demand for Agriculture, Forestry and Natural Resources (AFNR) graduates through Science and Technology”. First, the historical background in the development of the program is briefly narrated in order to achieve a better perspective of the rationale behind and the process involved in crafting the whole program and its various components. The general program framework is then discussed of which the project, “Policy Research on the State and Future Supply of and Demand for AFNR Graduates in the Philippines” is an integral part. The results of this project are highlighted in this book. As the reader would soon find out, the results of the policy research project take more profound implications when viewed within the whole program context.
Enhancing the demand for AFNR graduates through science and technology: Program historical backgroundThe events leading to the making of the program appeared somewhat surreal. In mid-December 2007, the Philippine Association of State Universities and Colleges (PASUC) had an audience with then President Gloria Macapagal-Arroyo in Malacañan Palace. In that meeting, the PASUC members—heads of state universities and colleges (SUCs) throughout the country—sounded off to the President their predicament on the dwindling number of enrollees in agriculture and related courses, their flagship program offerings. Fewer students were entering these degree programs. This miniscule number of graduates were either unable to find work or were lost to non-agriculture jobs. The competitiveness of agriculture as a profession and field of study is being compromised. One could imagine the Chief Executive patiently listening to the well-placed worries of the SUC top honchos. In what would later come as a pleasant shock, the President

2 Higher Education in Agriculture: Trends, Prospects, and Policy Directions
committed a huge sum to a yet-to-be designed program that she said should address this concern. Skeptics would thoughtlessly decode such a move as one done by a chief just to placate her whining wards. They may even concede that the presidential directive guarantees that the money would come, but—considering bureaucratic hurdles—probably at a date untimely for it to be useful and in an amount insignificant to make a dent. But this was not the case. Within a mere two months, the promised sum of PHP 200 million would be made available, fully documented, and ready for release.
The nature of the problem of declining enrollment and job mismatch in agriculture has not been fully understood in great depth. School administrators can well attest to declining enrollment figures, but the reasons for the slide, absent a detailed probe, are broadly left to conjecture. Many SUCs are situated in non-urban areas and are bannered by agriculture and related course offerings. The SUCs’ main clientele are students from poor farming communities, where agriculture is the key economic driver and the natural destination for jobs or livelihood. It can thus be theorized that the problem is shaped by one of the stylized facts in development economics: as a country advances to economic development, agriculture contributes proportionally less to national output relative to the other sectors in the economy. As the manufacturing, services, and industry sectors become more vibrant in creating more jobs and providing higher incomes, agriculture has less to offer. It is easy to connect this stylized fact with the decay in student interest in agriculture and the incongruence of skills with jobs availability in the sector. Nonetheless, the empirical evidence for the deeper underlying reasons is scant. Furthermore, targeted programs to boost course offerings in agriculture seem to be limited and insufficient on design. A careful study must indeed be done and new measures be put in place.
The aftermath of the December 2007 meeting saw things moving fast. PASUC was instrumental in lobbying for the program, but the details of carrying out the presidential instruction fell into the hands of the top-level troika of the Commission on Higher Education (CHED), the Department of Science and Technology (DOST), and the Department of Budget and Management (DBM). CHED, as overseer of higher education institutions (including SUCs), recognizes the issue very well, and in fact devotes a technical panel on agricultural education that must have almost certainly encountered this issue. CHED’s influence and authority would be vital in facilitating program implementation. DBM needed to source the funds for a speedy release while adhering to all necessary documentation and budgeting protocols. But a crucial decision at that early stage pointed to DOST as caretaker of the grant and chief administrator of the still undefined program. DOST has the capacity and track record on managing big programs and the mechanisms for fund management. But more than this, the decision proved farsighted. While the primal concern was on agriculture education and employment, science-based interventions would eventually dominate the fine points of the program.

3Patricio S. Faylon et.al
With DOST exercising oversight, the entry of Philippine Council for Agriculture, Aquatic, and Natural Resources Research and Development (PCAARRD) as the program’s managing institution was inevitable. PCAARRD was initially tasked to craft the mother program proposal and design the implementing mechanisms. (Eventually, it will expand its involvement to the whole gamut of program management—from technical and financial monitoring and evaluation, to networking, to information dissemination.) There were a few things going for PCAARRD that warranted its participation. First, it is familiar with agriculture since it is a council under DOST whose primary mandate is science planning in the said sector. This mandate involves placing fund support for agricultural science and technology activities: research and development (R&D), technology management, institutional development, and human resource enhancement. Second, it has an intimate relationship with SUCs nationwide. PCAARRD operates mainly through the SUCs by funding university-based research and maintaining an active network of researchers in agriculture. It offers scholarship grants for graduate degrees and helps universities develop facilities for agricultural research. Third, it can mobilize the regional R&D consortiums—regional networks of universities and government agencies spanning the entire country—to implement national programs on a massive scale. The regional consortiums serve as conduits of project intervention from the national level to the grassroots, based on the premise that implementation of projects is better left at the hands of local people. And lastly, PCAARRD’s institutional apparatus for proposal screening and project monitoring and evaluation is working well and had been in place for more than three decades. This last point is important since it was clearly understood that all money releases to implementers shall be backed by written technical proposals, and that all projects will pass through the multi-stage evaluation procedures of DOST.
Based on initial sketchy reports following the December 2007 meeting, PCAARRD started to work on the program design. The magnitude and complexity of the program became clear as the conceptualization underwent innumerable iterations. The issue of falling enrollment and bleak unemployment prospects in agriculture was deemed urgent, but baseline information from which interventions should be based were almost nonexistent. The program should cover as many SUCs as possible, but finding a common approach is difficult since these SUCs are subjected to a diversity of quaint needs. With the huge funding comes a tacit expectation of outright impact, but the key interventions may have to be in the form of social experiments whose results would not be immediately forthcoming. There was a clamor for an immediate implementation of a new program, but a hastily-designed plan could make it unwieldy and ineffective.
Despite these clashing concerns, core program components were readily identified that provided a thread of consistency. It was easily settled that in order to fully comprehend the problem, a full-blown environmental scanning and tracer

4 Higher Education in Agriculture: Trends, Prospects, and Policy Directions
study was essential to the program. Previous tracer studies done by some SUCs were too few and limited to provide a fresh national perspective. A countrywide tracer study should lead to an honest-to-goodness compilation and analysis of empirical evidence tracking the students’ decisions in entering agriculture degree programs and in eventually seeking employment. As a complement to this, and in order to examine the supposed declining significance of agriculture as employment outlet, a survey on the hiring decisions of agricultural business and career establishments should also be carried out. The ultimate point in closing the gap on the problem is to gauge whether this phenomenon, when proven to exist, is expected to persist well into the future. For this, the program saw the need for a forecasting model that should help anticipate the behavior of the market for agriculture professionals. There was also an initial perception that market failures somewhere may have been brought about by policy failures. Thus, all these groundwork strategies—tracer study, employer survey, and forecasting—were fused into a policy research that eventually became the first project component of the entire program.
The natural recourse would have been to rely on the results of the policy research in crafting subsequent projects. However, the pounding sense of urgency carried the desire to have projects immediately running on the ground. There was an acceptance that the relay between the policy research results and actual project interventions may not be as clean as it was desired to be. Thus, even while baselines were still nonexistent, the program must utilize existing information—incomplete and untested as they were—as bases for running new projects in the SUCs. Despite this, the move was not as detrimental to the program as first thought of. In fact, this compelled the program planners to find new and innovative concepts in project design. It is also in this compulsion that the focus on science-based agricultural entrepreneurship, which was eventually contained in the other two program components, came into being.
At first, the program’s attempt to promote agricultural entrepreneurship in the SUCs seemed uncharacteristic. The overarching objective was to help SUCs make agriculture attractive to students. Courses in agriculture are unavoidably technical in nature, as taught with a mix of theory and specialized applications. But the pedagogy on business enterprises (agriculture-based or otherwise) is best left to business schools or to small specialized units in some universities. The program planners propositioned that to enhance the demand for agriculture graduates, SUCs should also be able to adequately supply the needs of other major demanders, which include business and industry. It was realized that SUCs might need to reinvent themselves as producers of a new breed of students and graduates like agribusiness entrepreneurs engaged in lucrative enterprises. When wage employment prospects are dim, graduates can opt to employ themselves through their self-run agricultural businesses. This idea of SUCs doubling as training ground for entrepreneurs established

5Patricio S. Faylon et.al
the framework of the other two broad program components seeking to readily implement ‘on-the-ground’ projects. One component would deal with projects on enhancing capacity of SUCs to advance agri-entrepreneurship through new curriculum offerings and upgrading of facilities. The other component would provide venues for students to have practical training on entrepreneurship, and support technology business incubation projects.
Before the end of December 2007, or less than two weeks after the PASUC meeting with the President, the mother program proposal was complete. The proposal established the general framework and outlined in broad strokes the three major components: policy research, institutional capacity enhancement for entrepreneurship, and support to agri-enterprise building in SUCs. The proposal was submitted to the Secretary of DOST and the Chair of CHED for review. The DOST took the proposal up with DBM, and with this, the program evaluation procedures commenced, paving the way for the eventual release of the fund to DOST in less than two months’ time.
While the mother proposal was undergoing review, the early part of 2008 was devoted to fine-tuning the specifics of program implementation mechanics. A more detailed proposal needs to identify key strategies, timelines, budget and resource requirements, and implementing agencies. As understood early on, all proposals should pass through the multi-stage evaluation procedures of DOST, and the mother program proposal would be no exception. As part of the DOST protocol, all projects to be funded by DOST (through PCAARRD) shall pass through the three-stage approval process.
Stage 1. The proposal is being evaluated by the Directors’ Council (DC) at PCAARRD, composed of executive officers and directors of the council. The directors are research managers (covering the areas of crops, livestock, forestry, agricultural resources management, and socioeconomics) and heads of service and finance divisions. Once approved, the proposal is elevated to the the next level.
Stage 2. Proposal evaluation at this level is done by the PCAARRD Governing Council (GC), the highest policymaking body of PCAARRD. Chaired by the DOST Secretary, its members include the UPLB Chancellor, top-level representatives from the Department of Agriculture (DA), Department of Environment and Natural Resources (DENR), National Economic and Development Authority (NEDA), and representatives from the private sector.
Stage 3. Since the program proposal intends to access funds lodged at DOST, all GC-approved proposals must pass through the DOST Executive Committee (Execom) chaired by the DOST Secretary, with the undersecretaries, assistant secretaries, and bureau directors as members. Getting approval at this last stage is a huge task, since all technical and financial details of the proposal will be subjected to intense scrutiny.

6 Higher Education in Agriculture: Trends, Prospects, and Policy Directions
Designing the detailed proposal proved to be a greater challenge. The SUCs will be tapped as implementers, but they have varying capacities and needs that may not fit perfectly with the competencies required by the program. The idea was to include as many SUCs as possible, but spreading the funds too thinly may sacrifice the effectiveness of the intended outcome. The program components appeared reasonable, but making them operational requires further careful assessment. A program of this scale would also need a robust monitoring and evaluation procedure and ample resources for program management. The PCAARRD executives and staff devoted utmost effort in figuring out these specifics through undertaking a series of brainstorming and workshop sessions. Consultations with Dr. Ruperto S. Sangalang, president of the Cavite State University and PASUC’s Executive Vice President for Luzon proved highly beneficial. The program’s general concept was already being floated to the universities for feedback. Information drives seeking the active involvement of regional consortiums were also undertaken.
By the second week of January 2008, a more detailed proposal was presented to the PCAARRD Directors’ Council. Program implementation includes the following stakeholders: all 14 regions of the country, a minimum of 56 SUCs, Regional R&D Consortiums, and public and private institutions. The DC approved the program concept and framework on the condition that more detailed proposals will have to be solicited from the SUCs and other implementers. There was also a special interest in having Project 1 (the policy research) executed right away.
The same concerns were echoed when the proposal was elevated to the PCAARRD Governing Council during the first week of February 2008. The program’s concept was readily approved, but revisions on specific implementing mechanisms were proposed. The Governing Council ruled that with the approval of the program’s general framework and key components, succeeding steps require the immediate packaging of detailed proposals by project proponents, for the evaluation and approval by PCAARRD and DOST. The DOST Secretary made special mention of the need to show some results within the year.
After the GC approval, the search for project proponents began. There Program concepts, guidelines, and expectations were disseminated. PCAARRD undertook information drives and networking campaigns to orient and involve the SUCs, DOST institutes, and other public and private entities. In April 2008, more than 100 representatives from SUCs all over the country trooped to PCAARRD for a formal orientation and preliminary writeshop on project proposals. The writeshop aimed to conceptualize specific project proposals. The priority of which was for Component Project 1 on policy research with high hopes being implemented right away. For this component, PCAARRD was able to solicit the involvement of the Philippine Institute for Development Studies (PIDS) (as lead proponent), and researchers from the University of the Philippines (UP) Diliman (specifically, the National College of Public Administration and Governance, UP-NCPAG) and UP Los Baños (UPLB specifically, the Department of Economics

7Patricio S. Faylon et.al
and the Institute of Statistics). This project—covering the tracer study, employer survey, and forecasting—would set the stage for building the much-needed empirical evidence on the issue.
By May 2008, Component Project 1 was approved within the next months, other program component proposals followed. By the end of 2008, the following milestones were achieved: (i) around 46 lead proposals were packaged, reviewed, and presented; (ii) three-fourths of the total funds were processed and allocated for release to the proponents; (iii) at least 47 SUC-based entrepreneurial projects were approved; and (iv) at least 55 higher education institutions (HEIs) were directly involved. These numbers were expected to expand in the succeeding year as more project proponents came on board, and new program strategies evolved.
On hindsight, the generous commitment of the President should not be viewed as a huge stopgap measure but rather a careful and surgical move. This program came about at a time when pressing issues on spiraling food prices, food security, climate change, and environmental degradation brought agriculture to the limelight. These have prompted calls to rethink development efforts in agriculture. The support to this program recognizes that universities have a crucial role to play. Apart from being the knowledge and resource base in their localities, the SUCs should be able to churn out graduates as champions in fueling development and sustainability in the countryside.
Enhancing the demand for AFNR graduates through Science and Technology (S&T): Program framework and componentsFigure 1 illustrates the program framework. The program consists of three components, namely: (1) policy research; (2) institutional capacity building; and (3) support to high S&T income and employment generation. It was later realized though, that certain researches were needed to support particularly the third component. Hence, a fourth component was conceived consisting of highly focused studies designed to address the specific technological needs of agribusiness enterprises. The program was implemented in 14 regions and involved a total of 60 SUCs and numerous government line agency partners (e.g., DOST, DA, DENR, ERDS, TAPI, MGB).
The importance of each component is evident even on mere cursory examination. Policy research intends to take stock of the current state and future capacity of human resources in the AFNR sectors and provide recommendations on the direction of human resource development. The need for this study has long been recognized even prior to the meeting between the PASUC presidents and former president Gloria Arroyo. The problem on the proliferation of SUCs and the apparent decline in the quality of education in AFNR related courses appeared to trace its roots from the penchant of politicians. Politicians tend to use agricultural schools as legacy projects and win the support of their constituents. Indeed, much of the problems in AFNR higher education are the results, directly or indirectly,

8 Higher Education in Agriculture: Trends, Prospects, and Policy Directions
of policies formulated by the government. It was therefore of no surprise that the need for a comprehensive policy research took primacy when the whole program was being developed.
The overall policy environment seeks the attention of Congress for legislative reforms to improve higher education and the CHED on the policy context within their mandate. In addition, the SUCs need to improve curricular offering and other operational changes geared towards enhancing the demand for their graduates. The policy research project is discussed in the succeeding chapter.
Component Projects 2 and 3 were tightly woven to complement each other. These components aimed to provide employment opportunities for AFNR graduates not limited to formal employment, but should cover self-employment as well. A wide range of business opportunities existed which the graduates themselves could explore. However, as mentioned earlier, the SUCs themselves have generally limited capacity in honing students as entrepreneurs. Hence, Component project 2 focused on enhancing institutional capacity on entrepreneurship through improvements in teaching facilities, curricular programs, teaching materials, and retooling of the faculty members, among others.
While fortifying the theoretical foundation of students on entrepreneurship is crucial, this would be in vain unless the students themselves have adequate immersion in the management and operation of actual enterprises. Experiential learning is important in developing successful entrepreneurs. Component Project 3, therefore, aimed to support the various modalities at SCUs to serve as immersion grounds for students. This includes Educational Income Generating Projects (E-IGPs), Technopreneurial Learning Projects (TLPs), DOST-Academe
Figure 1. Program framework.

9Patricio S. Faylon et.al
Technology-Based Enterprise Development (DATBED), and Technology Business Incubators (TBIs). These modalities vary in form, but are similar in nature. The purpose is to provide the students with an enabling environment to apply and experience the business principles and technical knowledge they obtained from Component Project 2.
The application of S&T was made integral to the whole enterprise development process. The program envisioned the AFNR graduates as professional entrepreneurs capable of exploring and exploiting business opportunities in AFNR under the lens of S&T. It was realized though, that available technical knowledge and technologies especially in emerging fields with promising business opportunities (e.g., biotechnology) is still wanting. Component Project 4, therefore, aimed to address the information and technology gaps in selected fields to provide AFNR graduates with a richer pool from which to draw and develop innovative products and create greater value added in the AFNR sectors. Particular focus was given on biotechnology and organic agriculture owing to the huge market potential associated with these emerging fields. Traditional fields such as plant breeding for varietal improvement, waste management and researches in forestry and environment with clear relevance to the main goal of the program were also considered.
Enhancing the demand for AFNR graduates through science and technology: Component Project 1 in focusComponent Project 1: Policy research on the state and future supply of and demand for AFNR graduates in the Philippines concerns the systematic study on the AFNR human resource pool at the national level. Project 1 provides critical inputs to the other components of the program. To undertake the activities under this component, PCAARRD partnered with PIDS which is recognized as the national government think-tank on socioeconomic issues.
Generally, the project aims to: (1) establish a comprehensive picture of the current and potential human resource capacities in AFNR; (2) probe into factors affecting enrollment in and graduation from AFNR courses; and (3) recommend appropriate policy and program interventions to address the pressing problems. It has two subprojects: Key Strategy 1: Human Resource Inventory and Environmental Scanning which deals mainly on quantitative and qualitative aspects of the supply of AFNR human resources. Key Strategy 2: Forecasting Supply and Demand for AFNR Human Resources which focuses on the demand side of the equation necessary to support supply-and-demand modeling and projection of AFNR graduates 10, 15, and 20 years into the future.
Figure 2 illustrates the project’s general methodological framework. Factors affecting AFNR human resources supply were studied using the following analytical tools: (1) regional environmental scanning; (2) in-school student surveys and (3) graduate tracer studies in the 14 regions.

10 Higher Education in Agriculture: Trends, Prospects, and Policy Directions
On the other hand, factors affecting demand were studied using: (1) environmental scanning; (2) a national establishment survey of 500 employers; (3) employer tracer surveys in the 14 regions; and (4) other economic methods. Based on the regional databases, the national database for AFNR human resources was built and used for AFNR-HR supply-demand model building and forecasting.
Overall, the AFNR human resource inventory covered 95 HEIs, both public SUCs and private HEIs, offering AFNR degree programs across all 14 regions. Twenty-seven (27) SUCs or two (2) per region, led the conduct of in-school surveys, graduate tracer surveys, and employer tracer studies for the project. Over 20,000 AFNR students from all levels were surveyed and 10,000 AFNR graduates were traced for the supply side of the study. In addition, 2,000 employers of AFNR graduates across 14 regions and another 500 establishments were surveyed under the project from December 2008 to November 2009 to provide information on the demand side of the study.
The AFNR degree programs included in the study are listed in Table 1. totaling 35 baccalaureate and related ladderized programs.
Key Strategy 1 activities coordinated by UP-NCPAG and conducted in the regions by 27 SUCs aimed primarily at establishing the “total supply” of AFNR human resources in the country by accounting: (1) current supply based on the number of AFNR graduates; and (2) potential supply of AFNR human resources, as represented by the AFNR students still in school. In addition, this study had the following objectives: (1) conduct an environmental scanning of the issues, policies and trends impacting on human resources in the AFNR sectors; (2) analyze participation and graduation trends in AFNR degree programs in selected HEIs; (3) inventory potential and existing supply of AFNR human resources; and (4) understand factors affecting education, career and employment decisions of
Figure 2. Methodological framework of Component Project 1.

11Patricio S. Faylon et.al
Table 1. Higher education programs in Agriculture, Forestry, Fisheries, Natural Resources and allied fields (Baccalaureate and Ladderized).
• Agriculture• AgriculturalEngineering• Agribusiness,AgribusinessManagement• Agri-Biotechnology• AgriculturalTechnology• AgriculturalEducation,RuralSociology, CommunityDevelopment• AgriculturalEconomics• Agro-Forestry,Forestry,ForestRanger• AgriculturalExtension• Agricultural/DevelopmentCommunication• AgriculturalChemistry
• Poultry-AnimalHusbandry,Dairy-AnimalScience• Entomology,PestManagement,PlantPathology• EntrepreneurialTechnology• EnvironmentalScienceandNaturalResource Management,LandscapeArchitecture• Fisheries,FisheryTechnology• FoodTechnology• MarineBiology• PlantBreeding• RubberProduction• VeterinaryMedicine
AFNR students, graduates and their employers. Besides conducting surveys, Key Strategy 1 reviewed secondary data, government documents and related databases.
Key Strategy 2 activities conducted exclusively by UPLB through the College of Economics and Management (CEM) with assistance from the Institute of Statistics (INSTAT), focused on the following objectives: (1) build a projection model to profile the supply and demand for AFNR human resources in the Philippines; (2) generate baseline projections of the supply and demand for AFNR graduates; (3) evaluate the outlook for AFNR enrollment over the medium to long term and conduct sensitivity analysis, and (4) conduct experiments assessing the impact of alternative policy interventions in the AFNR labor market. The study required an extensive and intensive literature review of labor market models, past and present government policies as well as enrollment and employment statistics.
With the approval of this research project in the last quarter of 2008, PCAA RRD-PIDS, UP-NCPAG and UPLB-CEM-INSTAT mobilized the regional teams immediately. However, because of the unprecedented institutional arrangements, organizational and logistical requirements required and the geographical scale involved, it took more than the planned time to start the project and even longer than expected to collect the data. Being the first research of its kind, there were major constraints in data collection that were only realized during the course of study and in the field while locating and interviewing graduate and employer respondents. Still, the 14 SUC regional project teams for Key Strategy 1 persevered and completed their work in November 2009. However, it took almost a year for UP-NCPAG to consolidate the 14 regional results into a national integrated report. UPLB-CEM-INSTAT for Key Strategy 2 started as early as December 2008. They worked mostly on secondary data to build the AFNR-HR Supply-Demand Model, until the INSTAT survey results and Key Strategy 1 databases were received in late 2009. Thus, UPLB-CEM-INSTAT completed the Supply-Demand Projection studies in February 2010.


Anna Floresca F. Abrina1,J. Prospero E. de Vera III2, Rizalino B. Cruz2, Ledivina V. Carino+,2 and Roehlano M. Briones3
IntroductionThe downtrend in the enrollment in AFNR that has been widely observed in many SUCs has alarmed authorities due to the impacts this may possibly have on the stock of human resources in the AFNR fields. Others would argue that this should not be disconcerting since the AFNR sector has been on the decline as an economic contributor. Hence, AFNR as a field has become less attractive to the economically active and the potentially productive.
The pioneering research of Mincer (1973) suggests that expected earnings and the costs of obtaining a degree influence educational choices. Based on this human capital theory, an individual’s decision to choose a degree program must relate to the opportunities that would be available to him upon graduation as well as the costs he would incur in acquiring the skills necessary for employment.
An analysis of the factors affecting enrollment and graduation trends in AFNR courses is an examination of educational choice. The theoretical framework includes the following variables: (a) socioeconomic condition of the individual; (b) available options for financing one’s education; (c) offerings of individual programs and the HEIs; (d) effectiveness of the chosen HEIs’ programs and services; (e) relevance and importance of the knowledge and skills acquired; and (f) employment opportunities for the individual. Variables (a) to (d) relate to the costs of acquiring skills necessary for employment; variables (e) and (f) are more to the opportunities available to the individual upon graduation. These factors must be analyzed in the aggregate or at a macroeconomic level. Recognizing regional differences is also important to consider.
1 Department of Economics, College of Economics and Management, University of the Philippines Los Baños2 National College of Public Administration and Governance, University of the Philippines Diliman3 Philippine Institute for Development Studies, City of Makati
AFNR education in the Philippines:History, context, and trends
2Chapter

14 Higher Education in Agriculture: Trends, Prospects, and Policy Directions
Thus, the state and future supply of and demand for AFNR graduates can be best understood in relation to the following:
a. Evolution of AFNR education in the country: enrollment and graduation trends in higher education in general, and AFNR in particular; gender dimension; variation across regions and courses; distribution in terms of increase or decrease across levels of study; and potential for increases or decreases in the future.
b. Factors that affect enrollment trends in AFNR: government policies that promote incentives or disincentives in agriculture and higher education; labor market demand for AFNR human resources; and behavioral or cultural barriers that impact students choice of AFNR degree programs.
c. Quality and responsiveness of existing AFNR education programs based on indicators related to student competency and performance as well as to industry needs.
d. Perceptions of AFNR students and graduates regarding their school, degree of choice and kind of education.
Higher education in the PhilippinesGovernance of higher educationIn 1994, major reforms in the education sector in the Philippines were undertaken based on the recommendations from the Congressional Commission on Education (EDCOM) report. A trifocal system of education evolved from the former Department of Education, Culture and Sports (DECS) to the:
a. Department of Education (DepEd), covering elementary, secondary, and nonformal education;
b. CHED, governing tertiary or collegiate and graduate education (i.e., masteral and doctorate programs or disciplines) in both public and private by virtue of the Higher Education Act (RA 7722) of 1994; and
c. Technical Education and Skills Development Authority (TESDA), supervising non-degree technical-vocational (tech-voc) and middle-level education based on the Technical Education and Skills Development Act (RA 7796) of 1994; it also provides skills orientation, training and development to out-of-school youth and unemployed community adults. TESDA was created by the merging of the Bureau of Technical and Vocational Education (BTVE) of the DECS, the National Manpower and Youth Council (NMYC) of the Department of Labor and Employment (DOLE), and the Apprenticeship Program of the Bureau of Local Employment of the DOLE.

15AnnaFlorescaF.Abrinaet.al
Trends in higher educationWithin the formal education sector of the Philippines, the main component of post-secondary education provided by HEIs is comprised of various degree courses, with many new offerings based on the needs of industry. HEIs also offer post-graduate programs.
Official figures show that the number of registered HEIs in the country increased from 1,735 to 2,180 from Academic Year (AY) 2002-2003 to AY 2010-2011, an increase of 25.65 percent. Sixty percent of the increase occurred in AY 2004-2005, from 1,890 to 2,180. This could be considered a surprising trend taking into account that the number increased by less than 10 percent annually in earlier years (Table A.14).
On the average, the private HEIs outnumbered the public HEIs (3:1). This makes the increasing number of HEIs more disconcerting given that the main driver of this trend is the faster increase in the number of public HEIs compared to private HEIs. From AY 2002-2003 to AY 2010-2011, the number of public HEIs increased by 44.87 percent while that for private HEIs increased by less than half at 19.53 percent. Since the number of SUCs is only about one-fourth of the number of private HEIs, this increase may be attributed to the smaller base of the former. Other factors may imply a more pressing concern, which will be discussed shortly.
Enrollment in higher educationBased on the CHED figures, enrollment in higher education has been on the rise since AY 2005-2006, averaging an increase of 2.81 percent per year until AY 2009-2010. A slight dip was experienced in AY 2008-2009 (Table A.2). Over the five-year period from AY 2005-2006 to AY 2009-2010, business administration (BA) and related disciplines led in the number of enrollees (23.46%). It is followed by medical and allied (MA) sciences (20.35%). The least number of enrollees were in home economics (with less than 0.2%) and the trade, craft and industrial (TCI) disciplines (0.23%).
In the case of the Agriculture, Forestry and Fishery (AFF) discipline group, the number of enrollees has been on a downtrend, averaging a 1.5 percent decrease per year for the five-year period (except for an unexpected increase in AY 2008-2009). However, of the 21 discipline groups, this particular group has consistently held the 9th place in terms of total enrollment proportion. Interestingly, an increase in the AFF enrollment happened at the time when total enrollment decreased.
In addition, statistics show that the male-dominated disciplines (60% of total enrollees) are: maritime; religion and theology (RT); engineering; other disciplines (OD); architectural and town-planning (ATP); and, TCI disciplines. The female-dominated disciplines include: home economics (HE); service trades
4 The initial letter of the label of a particular table indicates the annex in which it can be found.

16 Higher Education in Agriculture: Trends, Prospects, and Policy Directions
(ST); education science and teacher training (ESTT); mass communication and documentation (MCD); MA sciences; social and behavioral sciences (SBS); natural sciences (NS); and, BA disciplines. On the average, for the AFF group, more males enroll in AFNR-related courses. However, the number for males (52.35% of total enrollees in the discipline) is only slightly higher. Most males enroll in engineering courses (20.06%), followed by the number of male enrollees in BA disciplines (19.84%), a discipline group where female enrollees dominate. On the other hand, most females enroll in BA disciplines (26.50%) and MA sciences (25.40%).
Additional statistics show that most students in the public HEIs were enrolled in ESTT courses (21.04%), followed by those enrolled in BA disciplines (20.93%). On the other hand, most students enrolled in private HEIs took up MA sciences (28.54%) or BA disciplines (24.91%). More importantly, enrolments in private HEIs (64%) outnumbered the enrollment in public HEIs (36%). This includes enrollment in the following disciplines: RT; MA sciences; maritime; law and jurisprudence; ST; OD; BA; IT; MCD; fine and applied arts; ATP; and other general disciplines. Public HEIs dominate in the disciplines of: AFF; HE; mathematics; NS; and, TCI.
Graduates of higher education The CHED reports that the number of graduates from HEIs has consistently increased from AY 2004-2005 to AY 2008-2009, averaging an annual increase of 3.5 percent over the five-year period (Table A.3). On average, the MA sciences (23.0%) has a slight lead in the number of graduates over BA disciplines (22.55%) since there is higher enrollment in MA sciences before AY 2007-2008. HE (0.23%) and RT (0.31%) have the least number of graduates. The TCI group having fewer students in the last two years of the period had fewer graduates too.
CHED data also show that the dominance of males and females in the different discipline groups reflected in enrollment figures is relative to its number of graduates. Some exceptions to this rule include graduation numbers in TCI (with graduation being male-dominant at 58%) and in AFF (with females slightly outnumbering the males at 51%).
In addition, graduation figures for public HEIs followed the enrollment trend such that most students graduate from ESTT courses (23.17%) and BA disciplines (19.82%). In a similar manner, graduation trends in private HEIs also followed the same pattern—MA accounting for 31.91 percent of all graduates and BA accounting for 24.09 percent. Still, graduates of private HEIs outnumber graduates from public HEIs (2:1), consistent with the enrollment patterns.
In the case of the AFF discipline group, the number of graduates follows the trend of enrollees, experiencing negative growth through the period except for AY 2006-2007, with an average annual decrease of 6.2 percent. However, this particular group has consistently held either the 7th or 8th place of 21 groups in terms of proportion of total graduates, compared to the 9th place it holds in terms of enrollment. This probably indicates that a greater percentage of students in
17AnnaFlorescaF.Abrinaet.al
this discipline group are able to finish their courses compared to some other discipline groups.
HEI proliferation, AFMA, and the TVET system Relating these trends to the number of HEIs in the country, the number of HEIs increased at a surprising rate in the last six years. The incongruity of the growth trends among the number of enrollees, graduates, and HEIs raises the question of whether HEIs are providing services to an acceptable number of students. For private HEIs, acceptability would relate to whether there are enough students to pay fees at reasonable rates for the costs of running the HEI. For public HEIs, acceptability would relate to justifying the government allocations for their operations from a budget that does not necessarily increase sufficiently from year to year.
Although enrollment in higher education decreased starting AY 2002-2003, this decreasing trend continued for only a couple of academic years (Table A.2). With enrollment increasing further after AY 2004-2005, it has increased as a whole over the past decade (Table A.4). The continuing increase in the demand for higher education is apparently being accommodated by the public sector, absorbing about 79 percent of the increase in total enrollment. With enrollment in public HEIs increasing by almost 39 percent compared to that of private HEIs at about 5 percent, from a share of 27 percent in AY 1996-1997, public HEIs admitted 34 percent of all enrollees in higher education in AY 2004-2005. Moreover, enrollment in SUCs accounted for 91 percent of all enrollees in public HEIs in AY 2004-2005, an increase of about 5 percent from AY 1996-1997.
Whether it was the increasing demand or the amplified presence of public HEIs, the number of public HEIs increased dramatically in the last decade. From AY 2002-2003 to AY 2010-2011, there was an almost 45 percent increase (Table A.1). Although the increasing demand for higher education as well as the expansion of the public higher education system can be considered a positive trend in a developing country such as the Philippines, by providing better access to more students, the question of whether the quality of education being provided kept up with the growth in numbers remains.
The problem of SUC expansion and proliferation has been raised by various commissions and studies in the past. More than two decades ago, the Task Force to Study State Higher Education concluded that:
There has been a rapid increase in the number of state college and universities, especially in the last 20 years… The creation of SCU’s was obviously made without planning for an integrated system of higher education. The SCU’s seem to have been established only for local or political interests. As a consequence, proliferation, inequality of resources, unevenness in areal distribution and enrolment and, in many ways, duplication of programs characterize(s) SCU’s. (MECS, 1987:2)

18 Higher Education in Agriculture: Trends, Prospects, and Policy Directions
What this aims to communicate is that inequality in the distribution of students and support has resulted from this proliferation. To further emphasize this point, the report also stated that:
Some SCU’s have gotten much bigger allocations than what their programs and development needs require…they are over dependent on government for financial support, low priority is given to research and development, and that the proliferation of programs have caused unevenness in student enrolment (MECS, 1987:4). As a result, the Task Force recommended that, pending the completion
of a comprehensive plan for state higher education institutions, there should be a moratorium on the opening of new institutions and programs (MECS, 1987), which apparently went unheeded.
The EDCOM noted several years later that the country had an “inordinately large college population” and that the country had the highest enrollment ratio in the whole region, which could possibly lead to the creation of an “educated unemployed” (1993). The Commission recommended the rationalization of the number and distribution of tertiary institutions, asserting that:
Quality education costs money. Thus, to improve quality, limited resources should not be dissipated to so many institutions. It is more in the interest of the country to have a few but excellent institutions rather than many sub-standard ones (EDCOM 1993).This recommendation evidently fell on deaf ears yet again, as legislators
continued to file bills converting trade and agriculture schools into SUCs during the 1990s. The count of 78 SUCs at the time of the 1987 Task Force increased rapidly to 111 SUCs, with 336 satellite campuses, as of SY 2004-05.
In the case of AFNR HEIs, the Congressional Commission on Agriculture (AGRICOM) Report noted that:
State colleges and universities of agriculture and fishery have not been able to meet the qualitative and quantitative requirements of the market for middle level and tertiary graduates. This can be traced to the increase in the number of substandard SUCs; poor curriculum; inadequate facilities and equipment; insufficient technical preparation of instructors in vocational and training programs for agriculture and fishery; and inability to tap fully the private sector as an adjunct of training programs (1997).Not necessarily in response to this criticism but which was expected to
have an impact on this assessment, the Agriculture and Fisheries Modernization Act (AFMA, RA 8435) was enacted in 1997. The human resource development component of the AFMA provided for the creation of a National Agriculture and Fisheries Education System (NAFES) that would: (1) maintain and support an integrated system of agriculture and fisheries education; (2) modernize and rationalize agricultural education at all levels; (3) unify, coordinate and improve the system of implementing academic programs; and, (4) upgrade

19AnnaFlorescaF.Abrinaet.al
the quality and ensure sustainability and global competitiveness of agriculture education at all levels. This integrated system was to be implemented by the: DepEd for the education program for elementary and secondary levels; TESDA, in charge of the development of post-secondary education program for agriculture and fisheries; and, CHED, responsible for establishing a network of National Centers of Excellence (NCEs) in agriculture and fisheries education composed of qualified public and private colleges and universities with a system of accreditation.
The AFMA also provided for a Rationalization Plan for the NCEs to be formulated by the CHED, PASUC, and Association of Colleges of Agriculture in the Philippines (ACAP). The other components of this initiative are: (1) a National Integrated Human Resources Development Plan; (2) Output-Oriented Performance Standards (OOPS); (3) Agriculture and Fisheries Board in the Professional Regulation Commission (PRC); and (4) National and Integrated Continuing Agriculture and Fisheries Education Program.
The promises made by the AFMA unfortunately remained unfulfilled a decade later. In 2007, the AFMA Experts Group Review noted that poor implementation was caused by the failure to provide the required resources, misallocation of the limited resources, and ineffective information, education and communication programs at the local level. The human resource component of the AFMA was not covered by the mandatory review. It is being studied by the Congressional Oversight Committee on Agriculture and Fisheries Modernization (COCAFM). Technical committees prepared specific plans. Then, the NAFES Project was shelved from 2003-2005. In 2006, the CHED revived the project and aims hard for full implementation.
Rationalization is important to employment, both opportunities and availments. The question of whether the skills required for gainful employment are being developed in these institutions is of primary concern. Given the results of the National Career Assessment Examination (NCAE), there is inclination towards more informal post-secondary education (Sapnu 2007).
Based on the discussions, it seems that not all students are destined for formal undergraduate programs, making the Technical-Vocational Education and Training (TVET) system an enabling environment for employability. In terms of enrollment figures and number of graduates of tech-voc training programs, these increased respectively by 11.68 percent and 10.61 percent annually from 2002 to 2006, although slight dips may be seen in 2003 and/or 2004 (Table A.5). Moreover, it is interesting to note that the enrollment and graduation from the TVET system have increased considerably especially in the years after the trifocalization of the education sector in 2004. This may indicate that tech-voc is taking its rightful place as an alternative to formal tertiary education.

20 Higher Education in Agriculture: Trends, Prospects, and Policy Directions
History of AFNR educationIn terms of degree offerings, although Public HEIs or SUCs are outnumbered by private HEIs, AFNR courses are primarily provided in SUCs, About 94 percent of all enrollees and graduates of AFF courses are in or from public HEIs. Thus, it is crucial to understand the derivation of this trend towards public HEIs, beginning with a history of agricultural education in the country.
Development of education in agricultureFilipinos were already practicing sedentary agriculture before the Spanish conquest. With the Regalian Doctrine, the Spanish changed the ownership of land, such that proceeds of the harvest went to friar lands and inquilinos rather than the now-tenant natives, who had to pay taxes on their meager share. Spain, particularly during the later period (1770s onward), tried to promote plantation agriculture in cotton, mulberry, and spices. However, without adequate training of the cultivators, these initiatives of Governor General Basco y Vargas became dismal failures.
Meanwhile, the coconut and tobacco industries developed by duress. Learning by doing prevailed in the areas where the Filipinos were forced to plant them. Belatedly in 1821 then in 1858 and again in 1889, schools of agriculture were established, two by Royal Decree. However, none of these schools lived beyond the first commencement exercises (Uichanco 1973; Bernardo 2007).
The Americans implemented a general education program in the Philippines as part of their overall pacification campaign and the advancement of their economic interests. Agriculture education, more or less, stood on the same ground. Americans strengthened agriculture education in the country and they later found it certainly right to do so as they profited most from the country’s vast agricultural resources. Constantino and Constantino (1979) reported that 19 out of 28 registered corporations engaged in agriculture in 1949 were American-owned. These foreign corporations practically dominated the entire industry.
When the Americans took over, the development of agriculture was urgent, following the loss of 400,000 Filipino lives in the second phase of the Philippine Revolution, including many farmers “who left their farms and families to fight against the Americans”, the death and destruction of an estimated 80 percent of the carabao stock due to the war and the rinderpest epidemic, and the locust plagues in Luzon and the Visayas (Bernardo 2007).
Although no one in the American colonial government had adequate training in agriculture, resources were provided to establish a school in a sugar plantation in La Carlota in 1901. The government only managed to appoint a director of the experiment station. It was not until 1907 that the decision to establish a School of Agriculture in Los Baños was made. It was opened in 1909 as the first college to be created by the Board of Regents of the UP, joining two others which predated the UP, the Escuela de Bellas Artes (which became the

21AnnaFlorescaF.Abrinaet.al
School of Fine Arts) and the Philippine Medical School (which became the College of Medicine and Surgery).
The UP College of Agriculture (UPCA) incorporated the land grant concept of American universities and started with 73 hectares at the foot of Mount Makiling. By 1918, it had a Central Agricultural Experiment Station of over 250 hectares for Agronomy and Animal Husbandry. The whole UP system eventually covered some 31,179 hectares all over the country (Javier 1999).
The discipline of Agriculture had to overcome the doubts of the first UP President about agriculture being a state university’s task. During its initial years and at various periods throughout its history, it was difficult for the college to get its fair share from the university and government as regards to buildings, laboratory equipment, faculty salaries, and even roads leading to the campus. It seems to have inherited the general Spanish attitude that agriculture could be learned without theory or explanation and that agricultural development can come about through exhortation and royal decrees, not through formal study and research.
The UPCA in 1909 had to prove itself through an innovative curriculum, incentives to attract students, and a thesis requirement that paved the way for a strong research program. As early as 1911, the Philippine Agriculturist and Forester started publication, at the initiative of its students. It is now called the Philippine Agricultural Scientist and is the first agricultural journal in Asia to bear the stamp of the Information Science Institute (ISI) as a world-class publication (Bernardo 2007).
The UPCA did not focus on the basic sciences or agricultural sciences alone. The socioeconomic dimensions of agriculture were the focus of the Department of Rural Economics, established in 1919. From it developed the seeds of what would later be institutes and colleges tackling not only economics and the other social sciences but also management, development, agrarian reform, and other policy areas in agriculture. In 1973, the College of Agriculture and the College of Forestry (discussed below) became the nucleus of the UPLB, while its departments—such as Agricultural Engineering, Agricultural Economics, Human Ecology, and Basic Sciences and Humanities—became separate colleges. Multidisciplinary research centers, such as the Postharvest Horticulture Training and Research Center (PHTRC), the Institute of Plant Breeding (IPB), and the National Crop Protection Center (NCPC), were also created to pull together scholars from the different colleges and departments for the specific requirements of these research issues.
These were followed by the National Institutes of Biotechnology and Applied Microbiology (Biotech UPLB), to keep pace with international developments in the burgeoning field. Biotech UPLB became the nucleus for the UP-wide system of Biotech Institutes when its first Director became UP President in the 1990s. UPLB has thus moved into becoming a comprehensive university although still with AFNR as its nucleus. Instruction, research, and

22 Higher Education in Agriculture: Trends, Prospects, and Policy Directions
extension on agricultural issues were not limited to the UPCA but permeated the entire campus.
The UPCA has maintained close ties with the Department of Agriculture and Natural Resources and its successor agencies (DA, DENR, and Department of Agrarian Reform [DAR]) as well as with the DOST throughout much of its history. These agencies have provided research grants and support for extension activities at the institutional and individual levels. International agencies have also provided funding support which has contributed to the creation of institutions such as the PHTRC from the Association of Southeast Asian Nations and Biotech UPLB from the Japan International Cooperation Agency as well as to the provision of study and research grants such as the UP-Cornell grants from the Rockefeller Foundation.
Focus on UPCA is merited by the fact that it developed as a model not just for Philippine schools but for other Asian countries as well. The UPCA gladly exported its products and the ACAP institutionalized this collaboration as primus inter pares to some extent. ACAP was formed in 1962 following a meeting in Los Baños of 12 heads of agricultural colleges.
In the beginning, the ACAP was sustained by the UP-Cornell Graduate Education Program financed by the Rockefeller Foundation. Through this program, UPCA faculty members got advanced degrees from Cornell. Meanwhile, faculty members of ACAP schools received scholarship grants to study in Los Baños and others participated in seminar-workshops in instruction, research and extension (Bernardo 2007). Ables (1980) describes membership in the ACAP as being like a fraternity where “a rigorous ‘initiation’ or inspection of prospective members can result in a regular membership, an associate membership, or a deferred admission to membership”.
In the years that it operated, the ACAP was said to be instrumental in guiding agricultural education and its members were looked to as the elite in the system (Ables 1980). On one occasion, the ACAP passed a resolution advising the then Ministry of Education against the opening of more agricultural educational institutions. Ables (1980) refers to this as a quasi-accrediting role of ACAP. He explains that non-membership in the ACAP literally meant “that a school has not yet arrived”.
In 1966, the Southeast Asian Regional Center for Graduate Study and Research in Agriculture (SEARCA) was created by the Southeast Asian Ministers of Education Organization (SEAMEO). In its early years, SEARCA assisted the UPCA in further spreading its wings to develop colleges of agriculture throughout the region, just as it had been assisted by the UP-Cornell program.
Education in forestry and natural resourcesA Forest School was created in the UPCA in 1910, in what would be later called the Upper Campus of UPLB. The School was established in the same decade as

23AnnaFlorescaF.Abrinaet.al
the first Colleges of Forestry in the United States. Hence, it was not much behind in technical developments in the field. From the start, it had close links with the Bureau of Forestry, with its original teaching staff all being employees of the Bureau. The Forest School became independent of UPCA in 1917 and had its first Filipino Dean cum Bureau of Forestry Director in 1936.
The separation of the UP College of Forestry (UPCF) from the Bureau of Forestry did not occur until the 1957 Reorganization Plan of the Philippine Government. With it, the Makiling National Park was turned over to the UPCF, providing it control over a forest experiment station of about 4,000 hectares. Like the UPCA, the UPCF immediately sent its faculty for graduate studies in the United States and developed a research program in the field.
The Forest Products Laboratory was set up in 1954 and it has developed into the Forest Products Research and Development Institute (FPRDI). Policy research on forestry issues was the mandate of the Forestry Development Center created by PD 1559. Like its counterpart in Agriculture, the UPCF had a Centre for Education, Research and Development for the Asia and Pacific Region (funded by the Swedish International Development Authority) to assist in the development of these areas outside the Philippines (Bernardo 2007).
The Philippine Association of Forestry Colleges, Inc. (PAFCI) was created in 1989 in the face of unabated destruction of forestry resources. At that time, it had only nine member institutions, with only one non-governmental institution, the Gregorio Araneta University Foundation (Bernardo 2007).
The UPCF, the UPCA, and the Institute of Environmental Science and Management developed in 1991 a UPLB agro-forestry program “to promote ecological stability and alleviate poverty through sustainable agroforestry systems and empowerment of rural communities”. Becoming the Institute of Agroforestry in 1998, this program established the Philippine Agroforestry Education and Research Network (PAFERN) composed of about 25 colleges and universities in the country. Like ACAP, it was a means of collaboration so that the participating institutions could strengthen their capabilities and curricula. The Institute also hosted a regional association of 33 leading colleges, the Southeast Asian Network on Agroforestry Education (Bernardo 2007).
Gender and AFNR education In the beginning, it was expected that AFNR would be a man’s field. However, a woman enrolled in UPCA in 1923 and another woman became president of the student body in 1925. The first two students who graduated summa cum laude—Obdulia Fronda-Sison in 1946 and Clare R. Baltazar in 1947—were women, and three of the five other honor graduates of Sison’s class were of the same gender.At the Upper Campus, the so-called “invasion of women” did not occur until 1951 when two women enrolled for the Bachelor of Science in Forestry degree (Bernardo 2007).

24 Higher Education in Agriculture: Trends, Prospects, and Policy Directions
Nevertheless, a department of Home Technology was created in the UPCA in 1951 “to train women as partners of men in agricultural and rural development”. By the time it was elevated into the Institute of Human Ecology in the 1970s, it was tasked to “project the role of both men and women in addressing the problems of human environment—not only in the home but outside the home as well” (Bernardo 2007). This subtle shift in wording indicates that UPCA was no longer in the business of apportioning tasks to the genders, but recognizing partnership and the equal capacity of men and women to enter the field of Agriculture.
Women’s participation in AFNR has indeed come a long way when one compares the discussion above with recent enrollment and graduation trends. As mentioned in an earlier section, women outnumbered men in total enrollment and graduates in higher education from AY 2005-2006 to AY 2009-2010. More importantly, in AFNR related courses, the earlier discussions revealed that, despite men slightly outnumbering women in enrollment in the courses, fewer men graduated compared to women in AFNR degree programs.
Increase of AFNR schoolsUntil the Second World War, agriculture education was almost totally in government hands through colleges of agriculture or technical schools established by the Philippine Congress in various provinces. Thereafter, private landowners converted their properties to agriculture school campuses. This move not only made large parcels of idle land productive, but was also advantageous for the landlord for having their properties exempted from land reform legislation (Ables 1980).
In this connection, a brief discussion of the land grant system that brought about the establishment of UP, which started the trend, is important. As a concept adopted from the US, the land grant system originated by way of the Morrill Act of 1862. The land-grant institutions, established through the Act, gave emphasis to agriculture and mechanic arts. Each state was granted ‘land scrip’ certificates for public land, where parcels of land were reserved for public schools. Whether the land was used for school buildings or other productive activities, the primary purpose of the land grants was to open opportunities for farmers and working people who were unable to pursue higher education (US National Archives, n.d.).
In the Philippines, UPLB received three land grants. In 1964, the government of the Philippines also borrowed US$6 million from the World Bank to upgrade the UPCA. Three more World Bank loans were secured after that for agriculture education as a whole, not only for UPCA. As Ables explains, “the loans manifested strong confidence in the role of agricultural education institutions in contributing to the economic development of the nation” because “if such contributions were not forthcoming, the loans would never be repaid” (1980).
Until the establishment of the Mindanao State University in 1961, there was an unspoken policy that UP would be the country’s only state university.

25AnnaFlorescaF.Abrinaet.al
After 1961, Congress created state colleges in different parts of the country, among the most prominent of which were the Central Luzon Agricultural College (CLAC) in Nueva Ecija and the Don Severino Agricultural College (DSAC) in Cavite. As time progressed, many provincial state colleges individually got charters as state universities while others were transformed from agricultural high schools to agricultural colleges. With amalgamations of normal, technical and other schools, more colleges also joined their ranks. By 2006, there were 111 SUC main campuses in the Philippines, of which 57 were offering AFNR degree programs.
At present, there are more than 170 schools offering agriculture degree programs in the country. Counting only the main campuses, from 2003 to 2005, public HEIs offering agriculture degrees outnumbered private HEIs four-to-one. On the other hand, CHED reports that in AY 2002-2003, about 88 percent of the total 1,489 main campuses of HEIs in the country were privately owned. In the years that followed, the proportion of public to private HEIs remained almost the same although the number of main campuses increased (Table B.1).
Librero (2007) noted that agriculture tends to be offered by big universities, especially SUCs, perhaps because of the huge investment in land that is required. CHED 2001 data revealed that 73.1 percent of the entire tertiary education student population were enrolled in private HEIs. However, Table B.2 shows that more SUCs than private HEIs offer AFNR courses and students tend to be enrolled in public rather than in private schools.
National, regional, and AFNR employmentWith the increasing number of students enrolling in college, it would be interesting to know whether employment of graduates followed a similar trend, particularly for AFNR graduates. Any consistency would provide justification not only for the increase in the number of HEIs offering AFNR degree programs, especially in the case of SUCs, but also for the institution of a greater number of related degree programs or for the provision of more support to existing programs.
Based on National Statistics Coordination Board (NSCB) figures, employment in the country was increasing from 2003 to 2007, with an average growth of 1.65 percent annually (Table C.1). The fastest growth of a major industry group was experienced in the Mining and Quarrying sector (8.09%), followed by the Real Estate, Renting and Business Activities sector (5.43%). However, more than one-third of the employed persons in the country were in the Fishing and Agriculture (1.03%) and Hunting and Forestry sectors (1.64%). In addition, although public HEIs were growing at a robust annual average of more than 7 percent, the employment in the education sector was only growing at an average of 3.33 percent annually.
Moreover, in terms of major occupation groups, majority of the employed persons for the period were either in the groups of Laborers and Unskilled Workers

26 Higher Education in Agriculture: Trends, Prospects, and Policy Directions
or Farmers, Forestry Workers, and Fishermen (Table C.2). These two groups alone accounted for an average of almost 51 percent of the total employment during 2003-2007. Employment grew fastest for Clerks while it actually declined in several years for Traders and Related Workers.
As mentioned earlier, opportunities after graduation are crucial to educational choice, which include employment options as well as prospective wages or salaries. Based on official figures, the three industries with the highest average daily basic pay are Extraterritorial Organizations and Bodies, Education, and Financial Intermediation (Table C.3). The two industries that fall under the agricultural group of industries average the lowest salaries, save for the Private Household with Employed Persons industry. Although pays in the two main industry groups are growing at about the same rate of 4 percent on the average for the period, average daily basic pay in the non-agricultural industries is about 120 percent higher. The fastest average growth rates are in the industries of Extraterritorial Organizations and Bodies, Transport, Storage and Communication, and Real Estate, Renting and Business Activities.
Moreover, in terms of occupational groups, occupations primarily related to AFNR are among those with the lowest average daily basic pay (Table C.4). Although the group did experience the fastest average annual growth, the average daily basic pay of Farmers, Forestry Workers, and Fishermen over the period did not even reach two-thirds of the average daily basic pay for all occupations, second only to the Laborers and Unskilled Workers group for lowest average.
Based on the preceding discussions, it seems that many employment opportunities exist in AFNR-related industries, although the opportunities do not necessarily call for a tertiary degree, particularly an AFNR degree. As shown above, more positions have been provided for unskilled rather than highly skilled workers. In addition, although most major industry groups, including the AFF sector, grew in the period, faster growth was experienced by industries considered to be part of the Services sector.
In terms of regional employment, the National Capital Region (NCR) and Region IV-A led all regions in contributing to total employment. These regions comprised almost one-fourth of total employed persons for 2003-2007 (Table C.5). However, these two regions also accounted for the most number of unemployed persons. The NCR alone contributed about one-fourth of the total unemployed in the country. An important concern is whether these large labor markets are providing enough opportunities for AFNR-related jobs or contributing to the demonstrated increases in the output and employment of the Services sector. On the other hand, the CAR contributed the least proportion to total employment as well as unemployment. Despite these numbers, the unemployment rate in the country declined from 2003 to 2007, with allowance for the redefinition of unemployment by the National Statistics Office (NSO) in 2005.

27AnnaFlorescaF.Abrinaet.al
Factors affecting AFNR employmentThe declining enrollment in AFNR degree programs, and probably the declining employment for its graduates, can be traced to a number of demographic, economic, socio-cultural, and political factors.
Urbanization and poverty. Rapid population growth and urbanization have changed the rural-urban balance in many areas in the country. This phenomenon was raised as early as 1997 when the UN World Population Report said that “the growth of cities will be the single largest influence on development in the first half of the 21st century” (UNFPA 1997). A decade later, the UNFPA declared that the world would reach a milestone in 2008, that of having “more than half of its population…living in urban areas” (2007).
Like most developing countries, the Philippine population is rapidly becoming more urban than rural. Based on the 2000 census, only 51.95 percent of the people are still classified as rural, although most barangays remain rural or partially rural, with only the National Capital Region (NCR) being 100 percent urban. The regions of Central Luzon and Southern Tagalog have urban majorities while six other regions have more than a third of their population classified as urban (Table D.1).
At the provincial level, 11 provinces have more than 50 percent of their population living in urban areas (Table D.2). The list demonstrates that most of the predominantly urban provinces are in Luzon, particularly in the Southern Tagalog and Central Luzon regions, given their proximity to the NCR. On the other hand, the four most rural provinces (with less than 10 percent of the population living in urban areas) are Ifugao (9.6%), Mountain Province (9.1%), Siquijor (8.4%), and Marinduque (4.8%).
Hence, a big proportion of Filipinos are packing themselves in the urban areas. Under this situation, a career in agriculture becomes increasingly alien to many of them.
A large number of people in the country continue to live in poverty. The number of households in the Philippines living below the poverty line remains considerable despite the gradual decline in the number over the past three decades (World Bank 1995; ADB 2007).
Moreover, poverty hits hardest in the rural areas (Table D.3), which may explain the belief of many poor people that the escape would be to find urban occupations. However, a more strategic approach is to reduce poverty through stronger agricultural and rural development. This would involve not only greater productivity growth of the sector but also improved capability of those who work in it (Balisacan 2008).
Agricultural production and employment. In relation to this rural-urban shift, another possible contributing factor is that agriculture has declined as a source of production and employment. As discussed earlier, the growth in employment in the agricultural sector has lagged behind other sectors. In terms

28 Higher Education in Agriculture: Trends, Prospects, and Policy Directions
of production, gross domestic product or GDP has consistently increased over the period of 1993 to 2007. Although in 1998, real production experienced a slight dip due to declines in the AFF and Industry sectors. However, real production in the AFF sector has grown at the slowest rate on the average among the three main industrial categories for the period (Table E.1).
Moreover, as contributors to GDP, the AFF sector has seen its share in the GDP decrease from almost 23 percent in 1993 to just above 18 percent in 2007 (Table E.2). The share of Industry decreased only slightly in the same period while that for the Services sector increased by about six percentage points.
The decreasing share of agriculture was noted by the AGRICOM more than a decade ago when it expected the share of agriculture in GDP to shrink from about 40 percent to between 10-15 percent and the proportion of work-people dependent on agriculture to decline by about the same proportion (1997). The decrease of the share of agriculture is expected as the country transforms into an urban and industrializing economy. Agriculture’s share has gone down even lower in other countries like Malaysia (8%), Thailand (10%), and Korea (3%). The share of agriculture in GDP is not likely to increase as the country shifts from pure agriculture to promotion of agro-industry. This is expected to come about not only with improvements in agriculture per se but also with improved linkages with the other sectors as the enterprise of agriculture proves to be a more productive business (Javier et al., 2007).
Considering employment, in terms of occupational groups, with the second to the greatest proportion of all employed persons (averaging around 19%) in 2003-2007, the AFNR sector would seem important enough as an employer (Table E.3). However, this does not directly translate to greater opportunities for graduates of AFNR degree programs and of tertiary education in general, especially considering that laborers and unskilled workers make up the largest occupation group. In fact, only about 7.2 percent of total job opportunities in 2003 required higher education, when majority of the employed were elementary and high school graduates (Ramota 2005).
The International Labor Organization (ILO) 2004 data showed that 73.5 percent of the entire workforce in the Philippines had completed only secondary school at the most. The remaining 26.5 percent was comprised of college graduates and undergraduates.
While it is true that the unemployment rate has been decreasing in recent years, a large number of unemployed persons exist because the labor market is unable to absorb the growing workforce. However, the apparent mismatch between the products of tertiary education and the needs of the labor market is disconcerting. Fewer job opportunities with the ensuing unemployment of college graduates pose the question whether a tertiary education is a necessary investment in human capital.

29AnnaFlorescaF.Abrinaet.al
Costs and foreign job opportunities. The figures previously presented cover only domestic employment. Considering that the number of Overseas Filipino Workers (OFWs) has been increasing (Table E.4), the case of foreign employment must also be given special attention. Labor demand in the foreign market may influence course offerings and costs. In turn, this is contributory to the declining enrollment in AFNR programs.
As monitored by the Philippine Overseas Employment Administration (POEA) Labor Assistance Center, the number of actual departures of OFWs has been growing at an average of 3.44 percent per year from 1991 to 2007. These numbers do not include those OFWs who left to work abroad but who were not processed by the POEA.
It is estimated that 10 percent of the entire Filipino population is abroad. Most are working as migrants to support their families here in the country. Other factors that may compel people to look for work abroad include “the absence of sustained economic development, political instability, a growing population, double-digit unemployment levels, and wages” (Asis 2011). Based on POEA figures, on the average, about half (50.1%) of the OFWs work in the Middle East while 36.6 percent are in Asia.
Thus, labor markets in these regions, as well as in the US and some countries in Europe, may strongly influence Philippine employment patterns. These in turn may shape offerings in tertiary education and consequently enrollment and graduation trends. To illustrate, in the period 2004 to 2009, almost one-fourth of all higher education graduates finished courses in the medical and allied sciences (Table A.3). These are degree programs necessary for widely-advertised employment opportunities in the health care industries of industrialized countries in the Middle East and Europe as well as of the US.
On the other hand, although medical and allied sciences maintain the highest proportions of enrollment and graduates, these numbers are in a downtrend. Instead, degree programs such as service trades, information technology (IT), business administration, mass communication, and their related disciplines have seen increasing enrollment and graduation numbers from 2005 to 2010 (Annex B).
Looking at the growth rates for the entire higher education sector, enrollment had been on a downtrend since AY 2005-2006, even experiencing a negative number on the whole in AY 2008-2009. The spate of tuition fee increases of HEIs in the preceding period may have influenced this movement, as in the case of SUCs and the UP system. Moreover, this trend of increasing costs of tertiary education may also explain the inclination towards disciplines such as business administration and IT, degree programs with fairly shorter durations and less material requirements.
In the case of service trades, a combination of the factors already mentioned may have driven the observed uptrend in both enrollment and graduation numbers. With a host of countries requiring tradesmen and service industry

30 Higher Education in Agriculture: Trends, Prospects, and Policy Directions
personnel, opportunities in the international labor market may induce a push in the direction of this discipline. In the case of business related courses, the increasing costs of education make more attractive service trades programs that are relatively cheaper (in terms of materials) and shorter in duration.
However, enrollment and graduation from programs concerned with trade, craft and industrial engineering have been declining. Considering the continuing opportunities for trade-related employment overseas, this downtrend may be related to the intensified development of the technical-vocational education system.
As part of the trifocalized education sector, TESDA provides TVET qualifications to the labor force as credentials of productivity and employability. The TVET Program was introduced in 2002 to revitalize tech-voc education, which may have been perceived in the past to be inferior to a full college degree. The TVET targets clients or individuals in the 15-64 age group, providing an alternative for students who drop out of the formal school system or who have a desire to go into technical and vocational courses.
Data reveal that, in its first year, enrollment in and graduation from the TVET program both increased by more than 10 percent. By 2007, enrollment in the program reached more than 1.7 million (Table B.3). With numerous foreign companies posting ads for trade-related positions, TVET provides a cheaper and quicker alternative to the formal yet probably superfluous training provided in the tertiary education sector.
Missed opportunities for promotion of AFNR. Finally, inadequate implementation of policies for agricultural development may also work against enrollment in AFNR-related disciplines. What policies would make a career in agriculture attractive?
It is not expected that the 10 million employed in agriculture would take up courses in higher education institutions. Some occupations do not require this. However, improvements of conditions in instruction, research, and extension could induce the best of these personnel to enroll in AFNR courses.
As it is, universities have the primary role in improving instruction. However, this concern will not be taken up here. On the other hand, there are national policies on research and extension that could affect employment prospects of agriculture graduates.
For instance, the rate of return on investment in Philippine agricultural research is high, ranging from 11-163 percent (Coraraton 1999). This does not seem to be widely known. The perception is that agriculture may be a dead-end field for ambitious and bright young students. This notion probably persists due to severe underinvestment in public agricultural R&D in the country (0.28% to 0.30% of gross value added). The implication is that research funds, though highly productive, are scarce and education relating to the field provides uncertain returns. As the AGRICOM noted a decade ago:

31AnnaFlorescaF.Abrinaet.al
Agriculture R & D has also been neglected. Public investments in agricultural research is about 0.3 percen—the lowest in East Asia—less than a third of the level the World Bank recommends for poor countries. Yet studies consistently show that of all agricultural investments, R & D yields the highest returns. The meager research funds are also allocated badly—disproportionate to a commodity’s contribution to agricultural production. There is a great deal of fragmentation and duplication in R&D work. The various Cabinet departments interested in aspects of agriculture, the State colleges and universities, as well as both public & private research agencies – all run their own R&D programs, which typically are only weakly linked to field extension programs. (1997)Several years after this Report, the Philippines is still below the World Bank-
prescribed level of 1 percent for developing countries. This benchmark has been adopted in the Philippines through the AFMA Act of 1997. Had this been followed, it would have meant about PHP 20 billion annually since 2001.
For students not inclined to research, a baccalaureate degree in AFNR could mean a career in extension. The National Extension Service provided by the AFMA involves the national government, local governments, and the private sector. AFNR schools, especially SUCs, have been specifically included in this complementary and non-hierarchical system. However, the scheme has suffered from lack of research-extension linkage, low funding, general weakness of the organization and management of extension within the national agencies, differing resources and interest across local governments, and the inability of AFNR schools to see their place in it (Javier et al., 2007; Contado, 2002; Cardenas et al., 2003). A coherent and active extension service may provide meaningful employment for graduates of AFNR schools throughout the country.
On the whole, the innovations and funds promised by the AFMA have not been delivered (Javier et al., 2007). Had the funds been available, a career in agriculture could be more attractive.
Employability: quality of AFNR educationRegarding the employment as well as the employability of AFNR graduates, a prior consideration should be the quality of education they were able to afford. The Technical Panel for Agricultural Education (TPAE) under CHED and the PRC were tasked to administer licensure examinations for agriculture and allied disciplines.
The TPAE was created in 1977 under the DECS (now DepEd) by virtue of Department Order No. 3-a. Pursuant to the recommendations of the Presidential Commission to Survey Philippine Education (PCSPE) at that time, the panel was established and organized “to operate and serve as a staff or

32 Higher Education in Agriculture: Trends, Prospects, and Policy Directions
consultative and advisory body” to the then Bureau of Higher Education (now CHED). TPAE was tasked “to redirect education to the more relevant needs of national development”, particularly, upgrading agricultural education to “match the requirements of the economy and industry” (DO 3-a 1977).
Although its mandate was to observe and maintain both the input process and output qualification standards, the main thrust of the TPAE has been on the input side. The TPAE creates the curriculum incorporating the minimum requirements for courses in agriculture, including facilities, personnel management, and funding concerns. However, in the early 1980s, TPAE found out that fewer than 10 schools/colleges had complied with the minimum requirements for the agriculture curriculum it had imposed (Villareal, 2006). Moreover, a contemporaneous study concluded that the TPAE had largely limited itself to gathering data and making recommendations instead of policing the ranks of agricultural institutions (Ables 1980).
Licensure examinations serve to assess the output. Pursuant to Title 2 (Human Resource Development) of the AFMA, particularly Section 75, a Board of Agriculture was created in the PRC to create and maintain standards for the profession. Results of the licensure examinations would create part of the Output-Oriented Performance Standards, which would serve as the “primary instrument of institutional evaluation” under the NAFES (R.A. 8435, 1997).
For that matter, the licensure examination in Agriculture is the latest of those required among related disciplines. Other allied disciplines with boards in the PRC include Agricultural Engineering, Fisheries Technologist, Foresters, Nutrition and Dietetics, and Veterinary Medicine. Data show no large discrepancy in the passing rates, especially among the AFNR and non-AFNR fields, except maybe for Agriculture and Accountancy (Table F.1). In fact, graduates of AFNR courses seem to be doing relatively better in the licensure examinations than their counterparts in non-AFNR courses.
However, a comparison of the top performing schools to the national average may provide further insights (Table F.2). Judging from the difference between the national passing rate and the passing rates for the four top performing schools (based on the percentages of their populations to pass the licensure examination for agriculturists), it seems that hardly any graduates from outside these four universities pass the licensure examination. The hopeful yet highly unlikely alternative explanation is that the populations of these four universities make up only a small proportion of the total number of takers, such that a very small percentage of the graduates from outside these four universities do pass. These figures imply the dismal performance of a majority of the colleges and universities that purport to offer agricultural education, at least in terms of this measurement of outputs.
As most of the HEIs offering AFNR courses are SUCs, inadequate funding would predictably be used as a defense for their poor showing in the licensure

33AnnaFlorescaF.Abrinaet.al
examinations. Excuses would be founded on the supposedly adverse effects of a lack of funds on the recruitment of competent faculty, provision of appropriate facilities, supply of necessary equipment, and the like. Although there may be some truth to these claims, the experiences of other SUCs belie this causality. Even providing for that, additional funds are unfortunately not forthcoming. According to Polinar (2008), budget cuts have become “legitimate government policy” under the Long-Term Higher Education Development Plan (LTHEDP) 2001-2010 and have indeed occurred eight years into its implementation.
While poor funding does plague public institutions, a slightly different state of affairs beleaguer SUCs with land grants—public HEIs where a College of Agriculture was present. It has been suggested that these land grants “can serve as a rich and enduring source of income” if efficiently managed. The Philippine experience may challenge this proposition as only 3 percent of total school incomes come from these land grants (Ables 1980). However, better outcomes are still expected from land grant SUCs given their slightly elevated financial positions.
Concluding commentBased on these discussions, the observation that AFNR enrollment has been on a downtrend is apparently true and seems to be primarily due to the declining demand for AFNR graduates, among other factors. Whether this reduction in enrollment is furthered by waning interest in AFNR as a field of study due to the diminishing role of the AFNR sector in the economy, or whether perpetuated by the educational system’s inability to address the needs of its students or the industries for which it intends to cater, remains a question to be answered by a more in-depth analysis of the perceptions of former and current students as well as of employers of the products of the system.
ReferencesAbles, H.A. 1981. A contemporary view of agricultural education in the Philippines. In
Higher Education in Agriculture and Allied Sciences: Issues and Perspectives edited by Geronimo Collado. College, Laguna: University of the Philippines Los Baños.
Asis, M.M.B. 2006. The Philippines’ culture of migration in Migration Information Source: Country Profiles. Washington D.C.: Migration Policy Institute. [online] http://www.migrationinformation.org/USFocus/display.cfm?ID=364.[Accessed September 12, 2011].

34 Higher Education in Agriculture: Trends, Prospects, and Policy Directions
Bernardo, F.A. 2007. UPLB: a century of challenges and achievements. College, Laguna: UPLB Alumni Association.
Bureau of Labor and Employment Statistics (BLES). 2010. Yearbook of labor statistics. Manila: BLES, Department of Labor and Employment. [online] http://www.bles.dole.gov.ph/PUBLICATIONS/ 2010%20YLS/STATISTICAL%20TABLES/EX-CEL/CHAPTER%209/table%209.2.xls. [Accessed September 10, 2011].
Commission on Higher Education (CHED). 2011a. Higher Education Statistical Bulletin: General Information. [online] http://202.57.63.198/ chedwww/index.php/ eng/Information. [Accessed September 10, 2011].
———. 2011b. Higher education statistical bulletin. [online] http://202.57.63.198/ched-www/index.php/eng/content/download/1188/6733/file/higher_educ_enroll_grads_2005_06_to_2009_10.xls. [Accessed September 10, 2011].
———. 2005. Higher education statistical bulletin: academic year 2004-2005. [online] http://202.57.63.198/chedwww/index.php/eng/content/download/1039/5926/file/AY%202004-05.xls. [Accessed September 10, 2011].
———. 2004. Higher Education Statistical Bulletin: Academic Year 2003-2004. [online] http://202.57.63.198/chedwww/index.php/eng/content/download/1038/5922/file/AY%202003-04.xls. [Accessed September 10, 2011].
———. 2003. Higher education statistical bulletin: academic year 2002-2003. [online] http://202.57.63.198/chedwww/index.php/eng/content/download/1037/5918/file/AY%202002-03.xls. [Accessed September 10, 2011].
———. 2002. Higher education statistical bulletin: academic year 2001-2002. [online] http://www.ched.gov.ph/statistics/index.html [Accessed September 10, 2011].
———. 2001. Higher education statistical bulletin: academic year 2000-2001. [online] http://www.ched.gov.ph/statistics/index.html [Accessed September 10, 2011].
———. 2000. Higher education statistical bulletin: academic year 1999-2000. [online] http://www.ched.gov.ph/statistics/index.html [Accessed September 10, 2011].
Congressional Commission on Agriculture (AGRICOM). 1997. Modernizing agriculture: report and recommendations of the congressional commission on agricultural mod-ernization. Manila: Congressional Commission on Agricultural Modernization.
Congressional Commission on Education (EDCOM). 1993. Making education work: Book II. The educational ladder: tertiary education .Q.C.: Congressional Oversight Com-mittee on Education.
Constantino, R. and L. Constantino. 1979. The Philippines: the continuing past. Quezon City: Foundation for Nationalist Studies
Cororaton, C.B. 1999. Rates of return to R&D investment in the Philippines. PIDS Discus-sion Paper Series No. 99-24. Makati City: Philippine Institute for Development Studies. [online] http://www3.pids.gov.ph/ris/dps/pidsdps9924.pdf. [Accessed September 14, 2011].

35AnnaFlorescaF.Abrinaet.al
Department Order (DO) No.3-a. 1977. Creating the technical panel for agricultural edu-cation and defining its functions and responsibilities. Manila City: Department of Education and Culture.
Javier, E.Q. 1999. Infrastructure development, resource generation and modernization in The UP president’s end-of-term report 1993-1999, Vol. 7. Diliman: University of the Philippines.
Javier, E.Q., et al. 2007. Philippine agriculture 2020. Bicutan, Taguig City: National Academy of Science and Technology.
Mincer, J. 1973. Schooling, Experience, and Earnings. New York: National Bureau of Economic Research.
Ministry of Education, Culture and Sports - Task Force to Study State Higher Education (MECS). 1987. Report on State Universities and Colleges in the Philippines. Volume I to Volume III. Q.C.: MECS.
National Statistical Coordination Board (NSCB). 2008. Philippine statistical yearbook 2008. Makati City: NSCB.
Polinar, M. 2008. Budget constraints: problems and prospects of state, subsidized educa-tion. The Philippine Collegian. Volume 8.
Professional Regulation Commission (PRC). 2005-2008. PRC board exam results. [online] www.prcboardexamresults.com. [Accessed September 14, 2011].
Republic Act No. (RA) 8435. 1997. Agriculture and Fisheries Modernization Act. City of Manila, Metro Manila, Philippines.
Sapnu, R. 2007. Daughter of Bataan cockpit worker tops NCAE. [online] http://www.phil-star.com/Article.aspx?articleId=391110. [Accessed September 14, 2011].
Schelzig, K. 2005. Income poverty and inequality in the Philippines in Poverty in the Phil-ippines: income, assets, and access. Southeast Asia Department, Asian Develop-ment Bank. [online] http://www.adb.org/Documents/Books/Poverty-in-the-Phil-ippines/chap3.pdf. [Accessed September 14, 2011].
Technical Education and Skills Development Administration (TESDA). 2011. Comparat-ive data 2003-2006: TVET enrollment and graduates. Taguig City: TESDA. [on-line] http://www.tesda.gov.ph/program.aspx?page_id=103. [Accessed September 10, 2011].
Uichanco, L.B. 1973. A historical sketch of collegiate education in agriculture in the Phil-ippines. Philippine Agriculturist. 25(9):720-748.
United Nations Population Fund (UNFPA). 1997. State of the world population report. New York: United Nations.
———. 2007. State of the world population report. New York: United Nations.United States (US) National Archives. n.d. Act of July 2, 1862 (Morrill Act), Public Law
37-108, which established land grant colleges, 07/02/1862; Enrolled Acts and Resolutions of Congress, 1789-1996; Record Group 11; General Records of the United States Government; National Archives.

36 Higher Education in Agriculture: Trends, Prospects, and Policy Directions
Villareal, R. 2006. Educating the Youth in the Prospects of Agriculture. Powerpoint Presentation.[online] http://www.nast.dost.gov.ph/29th%20ASM/papers%20and%20presentations/ASD%20STS/Educating%20the%20youth%20in%20the%20prospects%20of%20agriculture%20july_11_07%20(2nd%20copy).ppt. [Accessed 20 July 2010].

37AnnaFlorescaF.Abrinaet.al
Region 2002/03 2003/04 2004/05 2010/11
Public Private Public Private Public Private Public Private
IIIIIIIVAIVBVVIVIIVIIIIXXXIXIINCRCARARMMCARAGA
262421423542582536131197
24181513
7346
136165289273934942616364
238282639
282421443542582536131197
25181513
7646
141176309574955245626864
245292839
28233344344260273813119
1028191513
7749
145188329577
1145648616766
265273739
3022597445457235424919171634191514
7847
16820241
10080
1265852647875
278335043
Total 419 1316 424 1365 447 1443 607 1573
Source:CHED,2011a;2005;2004;2003
Annexes
Annex A. Trends in higher education
Table A.1. Higher education institutions (including satellite campuses), by academic year and by institution type, AY 2002-2003 to AY 2004-2005 and AY 2010-2011.

38 Higher Education in Agriculture: Trends, Prospects, and Policy Directions
Table A.2. Higher education enrollment, by discipline and academic year, AY 2005-2006 to AY 2009-2010.
Discipline GroupEnrollment
2005/06 2006/07 2007/08 2008/09 2009/10
GeneralEducationScienceandTeacherTrainingFineandAppliedArtsHumanitiesReligionandTheologySocialandBehavioralSciencesBusinessAdministrationandRelatedLawandJurisprudenceNaturalScienceMathematicsIT-RelatedMedicalandAlliedTrade,CraftandIndustrialEngineeringArchitecturalandTown-PlanningAgricultural,Forestry,andFisheriesHomeEconomicsServiceTradesMassCommunicationandDocumentationOtherDisciplinesMaritime
22,518361,774
11,28225,8607,143
64,092531,01718,84022,90310,701
242,799549,658
-309,32019,66763,9135,562
13,57623,781
104,26774,601
20,698331,41612,21626,5588,568
67,452572,17416,97723,14914,553
251,661609,659
9,891315,41219,01559,3975,568
19,74030,020
135,45554,870
35,257370,44112,93129,2417,884
73,512612,48118,15925,04412,688
280,596547,595
5,799311,43719,28858,1684,952
23,95128,385
107,45269,033
13,750325,18613,73228,2877,804
72,196649,54919,29322,64114,636
300,882517,319
4,330319,77518,00463,3154,847
26,81429,132
108,45065,443
14,198352,04616,68228,0896,943
76,546724,21520,14424,12712,154
348,462440,335
3,833344,66220,44159,6925,149
36,35530,994
117,44888,450
Total 2,483,274 2,604,449 2,654,294 2,625,385 2,770,965
Source:CHED,2011b

39AnnaFlorescaF.Abrinaet.al
Table A.3. Number of graduates in higher education, by discipline and academic year, AY 2004-2005 to AY 2008-2009.
Source:CHED,2011b
Discipline GroupGraduates
2004/05 2005/06 2006/07 2007/08 2008/09
GeneralEducationScienceandTeacherTrainingFineAndAppliedArtsHumanitiesReligionAndTheologySocialAndBehavioralSciencesBusinessAdministrationAndRelatedLawAndJurisprudenceNaturalScienceMathematicsIt-RelatedMedicalAndAlliedTrade,CraftAndIndustrialEngineeringArchitecturalAndTown-PlanningAgricultural,Forestry,AndFisheriesHomeEconomicsServiceTradesMassCommunicationAndDocumentationOtherDisciplinesMaritime
3,81770,8371,7035,1921,320
13,588102,628
3,9894,2672,042
38,56761,916
-49,2702,762
12,8031,2061,8814,398
15,42212,020
2,74866,3621,7494,4361,473
12,17694,8192,7443,7952,204
38,43586,3732,898
48,9512,663
13,0401,0752,2334,506
19,9638,801
3,41170,7111,7964,6451,392
11,93795,6462,7923,7681,787
35,901110,312
1,52849,6172,401
12,528877
2,3554,439
15,46311,121
1,96463,682
2,1184,4291,403
11,49393,2733,2603,6092,115
38,665121,401
1,22148,4642,277
11,181942
2,4344,258
16,19710,429
1,56256,7772,1374,6781,131
12,506106,746
2,9314,1942,105
45,830128,057
94648,4482,2869,842
9523,4905,454
17,81411,768
Total 409,628 421,444 444,427 444,815 469,654

40 Higher Education in Agriculture: Trends, Prospects, and Policy Directions
Tabl
e A
.4.
Hig
her e
duca
tion
enro
llmen
t, by
sec
tor,
inst
itutio
nal t
ype
and
acad
emic
yea
r, A
Y 19
96/9
7 to
200
4-05
.
Type
of In
stitu
tion
Aca
dem
ic Y
ear
1996
-97
1997
-98
1998
-99
1999
-200
020
00-0
120
01-0
220
02-0
320
03-0
420
04-0
5
Philip
pine
s2,
061,
300
2,06
7,96
52,
279,
314
2,37
3,48
62,
430,
842
2,46
6,05
62,
426.
976
2,42
0,85
62,
402,
315
Publ
ic
SUCs
LU
Cs
CSIs
O
GSs
550,
470
471,
243
38,0
96
38
,646
4,5
16
542,
950
464,
322
42,3
26
34
,571
2
,385
655,
629
545,
133
51,7
94
57
,890
1,7
31
717,
445
617,
050
55,0
18
4
4,55
7
812
771,
162
700,
199
61,9
54
4
,043
8
20
808,
321
733,
827
67,7
49
360
4
,966
815,
595
734,
224
74,3
825
54
6
,385
829,
181
742,
108
80,0
37
561
6,4
35
819,
251
744,
751
68,7
31
107
6,4
75
Priva
te
Sect
aria
n
Non-
Sect
aria
n
1,5
10,8
30
4
51,8
89
1,0
58,9
41
1,5
25,0
1
466
,787
1
,058
,228
1,6
23,6
85
5
01,4
54
1,1
22,2
31
1,6
56,0
41
5
17,2
06
1,1
38,8
35
1,6
59,6
80
5
27,7
53
1,1
31,9
27
1,6
57,7
35
5
00,7
53
1,1
56,9
82
1,61
1,38
1
505
,068
1
,106
,313
1,59
1,67
5
492
,438
1
,099
,237
1,58
3,06
4
477
,438
1
,105
,626
Sour
ce:
CHED
,200
5Le
gend
:SU
Cs–
Sta
teU
nive
rsitie
san
dCo
llege
s;L
UCs
–Lo
calU
nive
rsitie
san
dCo
llege
s;C
SIs
–CH
EDS
uper
vised
Inst
itutio
ns;O
GSs
–O
ther
Gov
ernm
entS
choo
ls
(inclu
ding
Spe
cialS
choo
ls)

41AnnaFlorescaF.Abrinaet.al
Sour
ce:T
ESDA
,201
1
Tabl
e A
.5.
Enro
llmen
t and
gra
duat
es o
f the
TV
ET S
yste
m, b
y re
gion
and
by
year
, 200
2 to
200
6.
Reg
ion
2002
2003
2004
2005
2006
Enro
llmen
tG
radu
ates
Enro
llmen
tG
radu
ates
Enro
llmen
tG
radu
ates
Enro
llmen
tG
radu
ates
Enro
llmen
tG
radu
ates
I II III IV-A
IV-B
V VI VII
VIII
IX X XI XII
NCR
CAR
CARA
GA
ARM
M
63,8
6329
,381
124,
458
181,
367
85,3
9010
8,01
350
,997
45,0
9038
,248
60,9
8153
,261
42,1
0320
5,63
429
,385
48,0
55
103,
698
17,0
9294
,827
145,
726
117,
645
137,
188
58,4
6836
,272
35,3
0855
,987
38,9
4737
,215
71,2
7734
,592
36,6
02
64,8
7655
,161
113,
191
144,
914
48,2
0110
9,82
999
,962
106,
740
62,0
1646
,029
65,8
6361
,785
42,5
5622
7,66
032
,091
37,2
14
62,1
8348
,617
66,1
7594
,483
41,9
0710
7,50
787
,248
97,2
9354
,667
44,1
1354
,729
38,7
2330
,451
117,
480
31,5
8329
,402
52,0
2774
,492
120,
325
131,
500
39,7
8063
,782
93,9
7114
3,52
353
,178
40,7
1942
,162
55,4
7138
,359
210,
727
30,1
7530
,247
35,6
8264
,233
66,2
3331
,743
65,1
6750
,930
84,6
8690
,729
50,8
8137
,449
31,4
1430
,427
24,1
8312
7,53
324
,718
23,8
90
85,9
7462
,440
140,
650
161,
707
61,3
2610
5,34
519
5,03
594
,540
67,3
4963
,875
91,2
8310
4,70
849
,371
315,
819
38,3
3445
,626
71,4
9567
,481
98,4
5510
5,58
859
,775
91,3
2817
5,72
410
2,41
859
,800
48,6
0680
,149
73,3
2836
,381
212,
062
34,8
7836
,876
90,7
8884
,861
179,
242
161,
717
62,0
8111
2,39
214
4,53
911
4,06
368
,606
64,6
6691
,083
112,
079
53,2
7629
6,01
649
,512
45,8
546,
090
75,9
5377
,240
126,
738
107,
217
57,3
8995
,999
124,
341
115,
264
62,0
3353
,025
64,4
3276
,302
42,1
3717
2,60
443
,337
40,6
056,
004
Tota
l1,
166,
226
1,02
0,84
41,
318,
088
1,00
6,56
11,
220,
438
839,
898
1,68
3,38
21,
354,
344
1,73
6,86
51,
342,
626

42 Higher Education in Agriculture: Trends, Prospects, and Policy Directions
Annex B. Higher Education Institutions
Table B.1. Agricultural and total HEIs, by type of institution, 2003-2005.Agricultural HEIs
Type of School 2003 2004 2005
Public/GovernmentPrivateTotal
117(79%)32
149
121(80%)29
150
125(82%)28
153
Total HEIs
Public/GovernmentPrivateTotal
173(12%)1,3161,489
175(10%)1,5401,715
176(11%)1,4431,619
Source:CHED,2005;PRC,2003-2005
Table B.2. AFNR enrollment, by type of institution, AY 1999-2000 to AY 2004-2005.
Source:CHED,2000;2001;2002;2003;2004;2005
Academic Year Total Percentage
Private Public Private Public
1999-20002000-20012001-20022002-20032003-20042004-2005
7,2486,8816,7276,5926,2104,290
77,98280,61188,17378,01742,54266,534
8.57.87.17.8
12.76.1
91.592.292.992.287.393.9

43AnnaFlorescaF.Abrinaet.al
Annex C. Employment and wages
Table C.1. Employed persons by major industry group, in thousands, as of October, 2003 to 2007.
Industry Group 2003 2004 2005 2006 2007
Agriculture,HuntingandForestryFishingMiningandQuarryingManufacturingElectricity,GasandWaterConstructionWholesaleandRetail,RepairofMotorVehicles, Motorcycles&PersonalHouseholdGoodsHotelandRestaurantsTransport,StorageandCommunicationFinancialIntermediationRealEstate,RentingandBusinessActivitiesPublicAdministration&Defense,Compulsory SocialSecurityEducationHealth&SocialWorkOtherCommunity,Social&PersonalServiceActivitiesPrivateHouseholdwithEmployedPersonsExtraterritorialOrganizations&Bodies
10,3411,400
1013,046
1131,6885,661
7932,352
329716
1,382
915370851
1,4942
10,4201,365
963,020
1211,6435,788
7982,446
298702
1,450
958361809
1,4651
10,7631,408
1163,043
1081,6166,215
8712,471
337736
1,494
989362781
1,5613
10,7541,412
1363,012
1231,6276,227
9142,469
372813
1,541
1,009376773
1,6292
10,7681,393
1353,060
1411,7406,176
9072,600
384881
1,569
1,043396779
1,6993
Total 30,119 31,741 32,874 33,188 33,672
Source:NSCB,2008
Table C.2. Employed persons by major occupation group, in thousands as of October, 2003 to 2007.
Major Occupation Group 2003 2004 2005 2006 2007
OfficialsofGovernmentandSpecialInterest- Organizations,CorporateExecutives, Managers,ManagingProprietorsandSupervisorsProfessionalsTechniciansandAssociateProfessionalsClerksServiceWorkersandShopandMarketSalesWorkersFarmers,ForestryWorkersandFishermenTradersandRelatedWorkersPlantMachineOperatorsandAssemblersLaborersandUnskilledWorkersSpecialOccupations
3,646
1,350884
1,3182,8826,0882,8892,369
10,004122
3,551
1,378874
1,3602,8476,1402,8362,492
10,128135
3,767
1,391871
1,4653,0426,2682,7672,553
10,612139
3,874
1,437914
1,5653,1776,2652,6892,534
10,589144
3,817
1,503887
1,6913,1416,3142,8122,603
10,768134
All Occupations 31,553 31,741 32,875 33,188 33,672
Source:NSCB,2008

44 Higher Education in Agriculture: Trends, Prospects, and Policy Directions
Table C.3. Average daily basic pay by major industry group, in Philippine pesos, 2004-2009.
Source:BLES,2010
Industry Group 2004 2005 2006 2007 2008 2009
Agricultural Agriculture,HuntingandForestry Fishing
117.83116.35133.47
122.17120.46143.09
132.25130.22156.17
132.65130.56159.40
138.85136.73166.21
145.14142.87174.62
Non-Agricultural MiningandQuarrying Manufacturing Electricity,GasandWater Construction WholesaleandRetail,RepairofMotorVehicles, Motorcycles&PersonalHouseholdGoodsHotelandRestaurantsTransport,StorageandCommunicationFinancialIntermediationRealEstate,RentingandBusinessActivitiesPublicAdministration&Defense,CompulsorySocial SecurityEducationHealth&SocialWorkOtherCommunity,Social&PersonalServiceActivitiesPrivateHouseholdwithEmployedPersonsExtraterritorialOrganizations&Bodies
258.08185.64239.36367.92225.81213.48
221.16246.32426.01318.43366.66
445.82366.82239.56111.57510.95
267.86207.90246.59421.59235.90217.49
221.82284.36446.12320.35396.15
441.03373.16252.03108.45536.94
286.18200.55264.99440.12264.18227.34
237.00326.35491.73361.47414.87
459.00392.30268.19113.47440.15
292.36205.09277.19460.73256.10242.29
242.60344.19473.44378.04411.57
460.85400.23272.65121.06
1089.33
305.67242.29289.56457.36267.83249.92
251.25357.10495.85412.27415.54
487.49417.32287.93122.63726.11
317.84241.06299.93465.62276.64257.71
264.50371.29515.55426.24433.40
522.52434.36307.97125.8873.98
All Industries 234.09 245.38 261.90 266.65 278.93 290.73
Table C.4. Average daily basic pay by major occupation group, in Philippine pesos, 2004-2009.
Major Occupation Group 2004 2005 2006 2007 2008 2009
OfficialsofGovernmentandSpecialInterest- Organizations,CorporateExecutives,Managers, ManagingProprietorsandSupervisorsProfessionalsTechniciansandAssociateProfessionalsClerksServiceWorkersandShopandMarketSalesWorkersFarmers,ForestryWorkersandFishermenTradersandRelatedWorkersPlantMachineOperatorsandAssemblersLaborersandUnskilledWorkersSpecialOccupations
559.54
510.35344.07273.38210.44129.36218.10233.27130.95434.26
580.73
504.39360.10294.35212.28135.67228.88248.62136.40434.26
629.78
518.26415.88330.76220.54160.82248.53263.97146.31458.28
644.27
534.35391.63337.71229.19177.74252.11278.10148.90498.17
673.78
558.21411.39354.44238.41171.35263.41286.51154.84487.47
687.74
589.02434.19370.43250.56175.52272.70296.76160.75525.32
All Occupations 234.09 245.38 261.90 266.65 278.93 290.73
Source:BLES,2010

45AnnaFlorescaF.Abrinaet.alTa
ble
C.5
. R
egio
nal c
ontr
ibut
ion
to to
tal e
mpl
oym
ent a
nd to
tal u
nem
ploy
men
t, in
per
cent
, with
ave
rage
s, 2
003
to 2
007.
Reg
ion
Prop
ortio
n of
Em
ploy
men
tPr
opor
tion
of U
nem
ploy
men
t
2003
2004
2005
2006
2007
Ave
2003
2004
2005
2006
2007
Ave
NCR
CAR
Regi
onI
Regi
onII
Regi
onII
IRe
gion
IV-A
Regi
onIV
-BRe
gion
VRe
gion
VI
Regi
onV
IIRe
gion
VIII
Regi
onIX
Regi
onX
Regi
onX
IRe
gion
XII
Regi
onX
IIIAR
MM
12.9
21.
905.
224.
079.
9011
.68
2.98
6.06
8.59
7.05
5.11
3.80
5.34
5.03
4.47
2.95
2.94
12.5
41.
935.
274.
509.
9211
.67
3.04
6.05
8.43
7.01
5.08
3.85
5.43
5.13
4.52
2.94
2.74
12.6
71.
915.
144.
179.
7311
.82
3.13
6.05
8.42
7.37
4.88
3.88
5.42
5.04
4.59
3.01
2.71
12.5
61.
975.
034.
149.
6412
.02
3.07
5.84
8.21
7.42
4.84
4.00
5.53
5.09
4.66
3.15
2.74
12.2
61.
955.
334.
0210
.08
12.4
73.
175.
818.
247.
684.
713.
705.
265.
004.
382.
823.
09
12.5
91.
935.
204.
189.
8511
.93
3.08
5.96
8.38
7.31
4.92
3.85
5.40
5.06
4.52
2.97
2.84
23.5
81.
295.
271.
6810
.99
15.6
41.
683.
816.
538.
333.
812.
023.
254.
293.
782.
501.
49
23.0
21.
575.
092.
0611
.55
14.6
92.
164.
146.
617.
744.
241.
983.
063.
993.
942.
471.
75
25.2
41.
414.
701.
4112
.29
16.9
91.
533.
866.
387.
752.
901.
573.
863.
973.
281.
721.
18
27.4
01.
224.
771.
5612
.10
15.3
81.
343.
976.
727.
633.
051.
453.
783.
742.
901.
531.
45
21.8
60.
935.
881.
4214
.29
16.2
51.
833.
787.
887.
172.
321.
604.
273.
873.
291.
831.
47
24.2
21.
295.
141.
6312
.24
15.7
91.
713.
916.
827.
723.
271.
723.
643.
973.
442.
011.
47
Sour
ceo
fbas
icda
ta:N
SCB,
200
8

46 Higher Education in Agriculture: Trends, Prospects, and Policy Directions
Annex D. Population and poverty indicators
Table D.1. Proportion of rural barangays in the Philippines, by region, 2000.
RegionTotal Population
(millions)Rural Popula-tion (millions)
Rural Popula-tion (%)
Number of Rural Barangays
Rural Barangays (%)
PhilippinesNCRCARIlocosCagayanValleyCentralLuzonSouthernTagalogBicolWesternVisayasCentralVisayasEasternVisayasWesternMindanaoNorthernMindanaoSouthernMindanaoCentralMindanaoCARAGAARMM
76.59.91.44.22.88.0
11.84.76.25.73.63.12.75.22.62.12.4
39.79.90.92.52.13.14.93.34.33.062.92.31.63.21.71.51.8
51.950.00
63.7061.8477.8139.4941.5672.3369.6753.6380.6375.0259.5161.6867.3072.8278.75
319380
9502452202716623676291933762358386819021221132311501882
76.17100.0081.0675.1387.7553.6965.4884.1083.4278.5588.1190.9680.7186.9381.9788.0688.03
Source:NSO,2000
Table D.2. Provinces with more than 50 percent urban population, 2000.
Rank Province Proportion of urban population (percentage)
1234567891011
RizalCaviteLagunaBulacanPampangaCebuBenguetBataanZambalesMisamisOrientalPangasinan
95.886.883.577.867.463.462.759.756.953.452.4
Source:NSO,2000
Table D.3. Poverty indicators in the Philippines, 1991-2006.
YearAnnual Per Capita Poverty
Threshold (PhP ‘000)Magnitude of Poor Families
(millions)Incidence of Poor Families (%)
All Urban Rural
199119941997200020032006
7.38.9
11.311.512.315.1
4.7804.5313.9834.1474.0234.677
39.935.531.833.724.426.9
31.124.017.919.9n.an.a.
48.647.044.446.9n.a.n.a.
Source:NSCB,2008;Schelzig,2005n.a.–datanotavailable

47AnnaFlorescaF.Abrinaet.al
Annex E. Production and employment
Year GDP AFF Industry Services
19941995199619971998199920002001200220032004200520062007
4.394.685.855.19
(0.58)3.405.971.764.454.936.384.955.407.19
2.600.853.823.09
(6.38)6.504.333.713.953.765.182.003.704.92
5.776.726.446.14
(2.12)0.888.97
(2.48)3.874.005.213.784.817.09
4.235.026.375.423.474.024.424.255.096.127.737.006.478.13
Average 4.57 3.00 4.22 5.55
Sourceofbasicdata:NSCB,2008
Table E.1. Growth of gross domestic product, total and by industrial origin, in percentage, 1993 to 2007.
Table E.2. Proportion of gross domestic product, by industrial origin, 1993 to 2007.
Year AFF Industry Services
199319941995199619971998199920002001200220032004200520062007
22.7522.3621.5521.1320.7119.5020.0919.7820.1620.0619.8419.6219.0618.7618.36
34.2534.7135.3835.5835.9135.3534.4935.4633.9933.8033.5033.1332.7632.5832.55
42.9942.9343.0743.2943.3845.1545.4244.7645.8546.1446.6647.2548.1748.6649.09
Source:NSCB,2008

48 Higher Education in Agriculture: Trends, Prospects, and Policy Directions
Table E.3. Employed persons by major occupation group, as proportion of total, as of October, 2003 to 2007.
Major Occupation Group 2003 2004 2005 2006 2007
OfficialsofGovernmentandSpecialInterest-Organizations, CorporateExecutives,Managers,ManagingProprietors andSupervisorsProfessionalsTechniciansandAssociateProfessionalsClerksServiceWorkersandShopandMarketSalesWorkersFarmers,ForestryWorkersandFishermenTradersandRelatedWorkersPlantMachineOperatorsandAssemblersLaborersandUnskilledWorkersSpecialOccupations
11.56
4.282.804.189.13
19.299.167.51
31.710.39
11.19
4.342.754.288.97
19.348.937.85
31.910.43
11.46
4.232.654.469.25
19.078.427.77
32.280.42
11.67
4.332.754.729.57
18.888.107.64
31.910.43
11.34
4.462.635.029.33
18.758.357.73
31.980.40
All Occupations 100.00 100.00 100.00 100.00 99.99
Source:NSCB,2008
Table E.4. Deployed land-based overseas Filipino workers, by major world groupings, 1991-2007.
Year Total Africa Asia EuropeMiddle East
OceaniaThe
AmericasTrust
TerritoriesUn-specified
19911992199319941995199619971998199920002001200220032004200520062007
489,260549,655550,872564,031488,173484,653559,227638,343640,331643,304662,648682,315651,938704,586740,360788,070811,070
1,9642,5102,4253,2553,6152,4943,5175,5384,9364,2984,9436,9198,7508,4859,1039,450
13,126
132,592134,776168,205194,120166,774174,308235,129307,261299,521292,067285,051288,481255,287266,609259,209222,940218,983
13,15614,59013,42311,51310,27911,40912,62626,42230,70739,29643,01945,36337,98155,11652,14659,31345,613
302,825340,604302,975286,387234,310221,224221,047279,767287,076283,291297,533306,939285,564352,314394,419462,545487,878
1,3741,6691,5071,2951,3981,5771,9702,5242,4242,3862,0611,9171,6983,0232,8665,126
10,691
13,37312,31912,22812,60313,4698,3787,0589,1529,0457,624
10,67911,53211,04911,69214,88621,97628,019
11,40911,1648,8908,4897,0394,8695,2807,6776,6227,4216,8236,0755,0237,1777,5966,4816,674
------
42
-6,92111,53010,88246,279113523986
Source:POEAinNSCB,2008

49AnnaFlorescaF.Abrinaet.al
Annex F. Quality of AFNR education
AFNR Non-AFNR
AgricultureAgriculturalEngineeringForestryVeterinaryMedicine
25.2445.1037.9439.51
AccountancyCivilEngineeringDentistryProfessionalTeachers
17.7030.9029.7532.58
Table F.1. Passing rates in licensure examinations, 2007.
Source:PRCEducationalStatisticsTaskForce,2007
Table F.2. Passing rates in the licensure examination for agriculture, national and top performing schools, 2003-2008.
College/University 2003 2004 2005 2006 2007 2008
UniversityofthePhilippinesLosBañosCentralLuzonStateUniversityCentralMindanaoUniversityLeyteStateUniversity
98574264
97 98554146
975146n/a
98
n/an/a
985241n/a
National Passing Rate 25 30 30 34 30
Source:UPLBWebsite,2003-2008;PRC,2005-2008


Profiles and perceptions of AFNRhuman resources in the Philippines:Students, graduates and employers1
Anna Floresca F. Abrina, J. Prospero E. de Vera III, and Rizalino B. Cruz
1 The authors would like to acknowledge the assistance of Mr. Rey Val C. Firmalino in preparing the draft report from which this chapter is derived.
3Chapter
With reports from:
Region IMarivic M. AlimbuyuguenMariano Marcos State University, Batac, Ilocos Norte
Emerita D. GalisteDon Mariano Marcos Memorial State University, Bacnotan, La Union
Leizl R. RosalesMariano Marcos State University, Batac, Ilocos Norte
Region IIPedrita N. MedranoIsabela State University
Nelia Z. CauilanCagayan State University
Cecilia H. Delos TrinosNueva Vizcaya State University
Flordeliza R. BassiagQuirino State College
Region IIIJocelyn L. AvenoCentral Luzon State University,Nueva Ecija
Alfredo S. ReyesPampanga Agricultural College
Teodora T. BattadMariettaB. MangalindanGlenda B. Sapon
Region VArnulfo M. MascariñasBicol University, Albay
Liza B. AlvaradoCamarines Sur State Agricultural College

52 Higher Education in Agriculture: Trends, Prospects, and Policy Directions
Carlos V. Cortez, Jr.Angelo P. CandelariaZaira H. Gonzales
Region VIRoel A. AlliWest Visayas State University, La Paz, Iloilo City
Salvacion VillasisAklan State University, Banga, Aklan
Region VIIEster V. TanNegros Oriental State University
Rachel Luz V. RicaCebu State College of Scienceand Technology
Enrique G. Oracion
Region VIIIPedro T. ArmeniaVisayas State University, Baybay City, Leyte
Josephine C. MarasiganEastern Samar State University
Z. M. HomesVisayas State University, Baybay City, Leyte
Region IXTeresita A. NarvaezWestern Mindanao State University, San Ramon, Zamboanga City
Josephine A. SubongJose Rizal Memorial State College,
Tampilisan Campus,Zamboanga del Norte
Region XAdel S. LauretoCentral Mindanao University, Malaybalay, Bukidnon
Leonida S. De AsisMisamis Oriental State Collegefor Agriculture and Technology
Thea Arbie S. RiveraCentral Mindanao University, Malaybalay, Bukidnon
King Jehu Q. Radaza IICentral Mindanao University, Malaybalay, Bukidnon
Ma. Joverly S. MoldeCentral Mindanao University, Malaybalay, Bukidnon
Elizar M. ElmundoMisamis Oriental State College for Agriculture and Technology
Region XIEditha PanganUniversity of Southeastern Philippines
Gilbert A. ImportanteUniversity of Southeastern Philippines
Region XIILorna G. ValdezUniversity of Southern Mindanao Agricultural Research Center, Kabacan, Cotabato

53AnnaFlorescaF.Abrinaet.al
Ruby S. HechanovaSultan Kudarat Polytechnic State College, Tacurong City
Riniely M. AlejoUniversity of Southern Mindanao, Kabacan, Cotabato
Cordillera Administrative RegionDarlyn D. TagarinoBenguet State University, La Trinidad, Benguet
Jovita E. SaguiboKalinga-Apayao State College, Tabuk, Kalinga
Noveba D. DulaganBenguet State University, La Trinidad, Benguet
CARAGA RegionRodel G. PasionNorthern Mindanao State Institute of Science and Technology, Ampayon, Butuan City
Nancy Q. SaleraSurigao Sur Polytechnic State College, Tandag, Surigao del Sur
IntroductionA prior environmental scanning of widely available secondary data regarding AFNR education in the Philippines bears out two critical observations in recent years. First, enrollment in AFNR degree programs has been on a downtrend. Second, the number of public HEIs has been considerably increasing. Although the downward trend in enrollment seems primarily due to the declining demand in the job market, questions regarding the ability of the educational system to address the needs of its students or the requirements of the industries which employ its graduates have been raised. More importantly, both these trends seem to provide support for efforts to rationalize the provision of public tertiary education in the country.
Since this argument is rooted in the beliefs and perceptions of the products as well as the clients of the educational system, it becomes important to determine, at the most basic level, whether any of these concerns are warranted. For purposes of obtaining individualistic answers to these questions, a human resource inventory and a human resource tracer study were implemented by RPTs across the 14 administrative regions in the country (Table A.12 for the list of HEIs included).
The human resource inventory aimed to generate data on the potential (in-school) and existing (graduates) AFNR human resources in the Philippines for SY 1998-1999 to 2007-2008. Specifically, this looked into the enrollment and graduation records of public and private HEIs in the regions covered by the RPTs. On the other hand, the human resource tracer study involved primary surveys of
2 The initial letter of the label of a particular table/figure indicates the annex in which it can be found.

54 Higher Education in Agriculture: Trends, Prospects, and Policy Directions
in-school AFNR students, graduates of AFNR degree programs, and the employers of these graduate-respondents.
For purposes of this study, the degree programs that were considered as AFNR courses are: agriculture; agricultural engineering; agribusiness/agribusiness management; agricultural technology; agricultural education; agricultural economics; agricultural extension; agricultural chemistry; agroforestry; animal husbandry; development communication; agricultural entrepreneurial technology; environmental science/management; fisheries; forestry; forest ranger; food technology; marine biology; rubber plantation; and, veterinary medicine.
This chapter will provide the main results of these two strategies employed to answer the issues regarding AFNR education in the country. Section 2 discusses the results of the Human Resource Inventory. Section 3 presents the pertinent responses derived from the Human Resource Tracer Study. The final section concludes with some comments on the results. At the end of this exercise, it is expected that, at the least, a partial answer can be reached for whether the declining enrollment in AFNR programs is a problem best worked out on the supply side or on the demand side. In addition, it may be possible to uncover additional arguments either for or against reversing the apparent proliferation of public HEIs in the country.
AFNR human resource inventoryAlthough the AFNR human resource inventory was to ideally include data from all HEIs from the 14 administrative regions across the country, a total of 92 HEIs were surveyed for data on enrollment and graduation trends (Annex A). In addition, some of the RPTs failed to provide data for their respective areas. Thus, although results are discussed generalizing to a national scope, special attention must be given to the results that follow, considering that propositions are true only for the particular regions for which data are available (see table/figure footnotes for exclusions).
Enrollment trends Although the inventory was to cover SY 1998-1999 to SY 2007-2008 for as many of the universities and colleges located in their respective regions as they could access, more recent figures for enrollment were also made available. The numbers for SY 2008-2009 show that a very large percentage of enrollments are at the undergraduate or baccalaureate level although a good number of students are enrolled in graduate degree programs (Table B.1). However, the total number provided by the RPTs account for only a little more than 1 percent of the total higher education enrollment reported by CHED for the same school year. It would be interesting then to determine whether past performance in enrollment for AFNR degree programs keeps up with the 2.81 percent growth reported for higher

55AnnaFlorescaF.Abrinaet.al
education in general for the same period. Table 1 summarizes the growth rates of enrollment in AFNR for the regions from SY 1998-1999 to SY 2007-2008.
Except for one year with a sharp increase and one year with a sharp decrease in Region VI, the enrollment in AFNR degree programs has changed rather unremarkably in the past 10 years. Although changes in the numbers have been small percentage-wise, these changes are mostly on a downward trend. In fact, based on the numbers from the RPTs, AFNR enrollment has declined by an average of about 3.46 percent annually. For the regions, few have seen positive annual average growth rates in AFNR enrollment, particularly Regions XI and XII. The positive annual average enrollment growth for Region VI is mostly a result of the very large increase in enrollment in SY 2001-2002.
In addition, a gender dimension does not seem considered in AFNR enrollment. On average, there seems to be no significant difference in the numbers of male and female enrollees in all regions (Table B.2). Males comprise 50.82 percent while females account for 49.18 pecent of all enrollees. Outnumbering of male enrollees over females is more significant in Region II and CAR. These results however only include counts for Regions II, VII, IX, X, XII, CARAGA, and CAR.
Graduation trends For the AFNR degrees conferred in SY 2007-2008, the baccalaureate level outnumbers all other levels. It is noticeable that in Region XI, a large number of graduates came from the associate or two-year degree programs (Table B.3).
The number of graduates of AFNR degrees now makes up just under 2 percent of all graduates of higher education, being 444,815 for the indicated school
RegionSchool Year
99-00 00-01 01-02 02-03 03-04 04-05 05-06 06-07 07-08
RegionIRegionIIRegionIIIRegionVRegionVIRegionVIIRegionVIIIRegionIXRegionXRegionXIRegionXIIRegionXIIICAR
7.9814.5012.4512.24(2.23)15.3111.836.42
(2.71)52.1934.7049.2921.20
49.9521.230.38
(1.68)31.56(1.36)5.958.45
(2.78)(1.39)(3.76)(7.08)8.18
(9.01)3.16
(10.44)(7.00)
283.53(12.33)23.694.961.87
(2.03)9.502.010.41
(4.39)(8.56)(2.45)(4.86)91.940.57
(8.49)(39.08)
0.293.565.722.228.81
5.59(1.77)
(10.68)(7.40)(6.99)4.48
(4.40)(6.02)(2.45)35.72(7.45)(2.23)(5.71)
(16.40)(13.67)(11.92)(12.14)(10.98)(7.74)
(13.66)(1.06)2.505.30
(17.99)(10.33)
3.74
(13.49)(11.28)(15.06)(37.31)20.86
(15.91)(12.63)(17.83)
1.483.908.13
(21.07)(22.10)
(12.97)(4.84)(8.78)23.46
(18.79)(24.18)(18.96)(18.00)
2.89(21.65)
5.31(8.27)0.38
(20.37)(9.34)
(21.95)(13.56)(94.11)(16.38)(3.21)
(31.65)(20.44)(7.11)1.161.93
(7.24)
Philippines 14.44 4.41 0.62 (2.84) (3.82) (8.77) (12.05) (6.76) (16.41)
Note:FiguresdonotincluderesultsforRegionIV.
Table 1. Growth rates of AFNR enrollment, in percentage, regional and total, SY 1998-1999 to 2007-2008.

56 Higher Education in Agriculture: Trends, Prospects, and Policy Directions
year. This is higher than the proportion of AFNR enrollees of all higher education enrollees discussed earlier. This could be an indication that students of AFNR courses may be relatively more successful at finishing their degrees compared to other disciplines or that more students transfer into rather than out of AFNR programs midstream.
In terms of historical experience, Table 2 depicts the trend of AFNR graduates in the past 10 years. In general, positive growth rates (implying increasing numbers of graduates) can be observed in the first half of the period from SY 1998-1999 to 2007-2008 while negative growth rates dominate among the regions in the second half. The annual decline in number of graduates in the last five years should not be surprising though, given the longer downward trend in the number of AFNR enrollees discussed earlier. However, the annual average growth rate of the number of AFNR graduates remained positive for the period and the total number of graduates did reflect a positive average growth rate over all regions for the last year of the period (Table B.4).
In terms of levels of study, Figure 1 depicts the average proportion of each level of study in the number of degrees conferred for the period of SY 1998-1999 to 2007-2008. As expected, the largest proportion accrues to the baccalaureate level. One observation that should be made however is that the proportion of baccalaureate degrees awarded to all degrees conferred increased rather significantly (by about 6-percentage points) from 10 years ago while that for associate degrees has decreased also rather significantly.
Note:FiguresdonotincluderesultsforRegionIV.
Table 2. Growth rates of the number of AFNR graduates, in percentage, regional and total, SY 1998-1999 to SY 2007-2008.
RegionSchool Year
99-00 00-01 01-02 02-03 03-04 04-05 05-06 06-07 07-08
RegionIRegionIIRegionIIIRegionVRegionVIRegionVIIRegionVIIIRegionIXRegionXRegionXIRegionXIICARAGACAR
21.79(9.83)13.3810.1711.206.039.21
13.0214.99
(20.80)6.084.32
27.24
43.6847.37
(10.10)9.23
48.977.41
(5.03)(9.42)0.21
40.54(6.47)(6.83)(5.54)
(10.99)11.73(6.32)2.04
(0.77)23.7615.37(3.18)(4.90)
(11.54)31.3213.320.48
18.790.11
47.9915.4739.32(9.86)0.895.37
16.1459.32(3.31)16.3511.51
(11.78)17.45(11.36)
7.00(22.22)
9.644.33
(0.28)16.41(0.78)(1.56)(7.03)
(12.16)
(21.86)(26.02)
2.94(14.38)(7.71)
(22.97)(19.55)
5.11(27.69)(0.39)(0.47)
(32.76)6.92
(12.73)(9.32)
(11.54)(13.30)
8.82(6.13)
(15.56)(21.35)
6.4227.028.02
(18.74)(0.75)
(8.06)(15.34)(12.68)
0.76(10.95)
1.27(10.46)
2.066.256.37
(23.75)(1.44)
(14.26)
(6.26)(0.85)30.98
(17.60)(7.03)(8.60)(3.47)(8.75)6.49
(21.90)19.67
(12.57)(2.12)
Philippines 8.84 6.28 6.06 14.13 (1.79) (12.26) (5.21) (8.77) 0.62

57AnnaFlorescaF.Abrinaet.al
Faculty profileThe human resource story includes not only AFNR enrollees and/or graduates but also the teaching staff who handle classes and other activities for these students. Figure 2 illustrates the distribution of faculty members based on their academic rank. As shown, Instructors comprise the largest proportion of the roster followed by Assistant Professors. In regional terms, Region X has the highest proportion of Professors while CARAGA has the largest proportion of Graduate/Teaching Assistants. Based on these numbers, there should be room for faculty development plans and activities.
Now having a general picture of the human resources available in the AFNR fields from the secondary data that has been collected, it is time to take a closer look at the actual circumstances, perceptions and possible recommendations of these human resources using primary data.
AFNR human resource tracer study The surveys of in-school students, graduates and employers aimed to: (i) probe into the factors influencing enrollment and graduation in AFNR degree programs; (ii) determine how well the education system has prepared the graduates for the workplace and life after school; and (iii) provide employer perceptions of recruitment practices as well as their assessment of job performance, strengths and weaknesses of graduates and AFNR HEIs. The survey instrument was administered by the RPTs to a total of 19,098 In-School AFNR students and 9,249 AFNR graduates across the 14 administrative regions. However, the RPTs from the CAR and Region IV failed to turn over encoded results of all three surveys. In addition, the RPTs from Region XI were unable to provide the results of
Figure 1. Average proportion of each level of study in number of AFNR degrees conferred, in percentage, total for all regions, SY 1998-1999 to SY 2007-2008.
Note:FiguresdonotincluderesultsforRegionIV.
83.22
11.49
0.321.173.81
AssociateDegree(twoyearsdegree)
Baccalaureate(fourorfive-yeardegree)
GraduateDiplomaorCertificate
Masters
PhD

58 Higher Education in Agriculture: Trends, Prospects, and Policy Directions
Figure 2. Average proportion of each rank in total faculty roster, in percentage, total for all regions, SY 1998-1999 to 2007-2008.
Note:FiguresdonotincluderesultsforRegionsIV,VIII,andXI.
32.85
38.33
2.626.82
19.38
Graduate/Teaching
AssistantInstructor
AssistantProfessor
AssociateProfessor
Professor
the graduate survey and Region XII was unable to submit results for both the graduate and employer surveys. Moreover, the number of observations for the database is far less than expected due to nonresponses from the respondents and/or nonsubmission of encoded results by partner HEIs. Table C.1 shows the regional breakdown of the actual number of observations on which the succeeding discussions are based.
Results here, in the absence of data from Region IV especially, must be carefully considered. Located in Region IV, UPLB is the HEI with probably one of the largest populations of AFNR enrollment. In addition, UPLB might be the HEI with the widest array of AFNR degree programs as well as the most diverse collection of students of varying economic backgrounds and regional origins, which may have greatly affected any conclusions drawn.
Profile of in-school studentsBased on the summarized results of the student surveys, an in-school AFNR student could be expected to be between 17 and 21 years of age, single, from a rural background, and one of the more than 5 members in the household whose earnings are less than PHP50,000 per year. The father of the student would most likely work as a farmer, forestry worker or fisherman while the mother is not employed and most likely a housewife. Table C.2 shows the percentage of respondents with characteristics consistent with the modal category observed from the data.
The modal age category should not be surprising. Filipino students usually graduate from high school at age 16. If they go directly to college, they would be in college from the time they were 17 to 21. With the mean age being about 20 years, it could imply that the survey respondents are in the latter years of their programs. The fact that almost all respondents are single should not be

59AnnaFlorescaF.Abrinaet.al
surprising as well, as students ideally do not get married until after several years of graduating from college.
With more than five household members being the mode, this sample must have families with about four children. The fact that the fathers are usually farmers, forestry workers or fishermen may be related to the fact that the students originate from rural communities, which in turn may explain the low modal annual income bracket of less than PHP50,000.00
In terms of the gender distribution, there does not seem to be much of a gender dimension to AFNR degree programs based on the survey results (Figure C.1). Results show that females outnumber males by a very small margin (50.06% to 49.94%) for the whole sample although relatively larger differences between numbers for the sexes can be observed for Regions II, VII, VIII, and XII.
With regard to the exposure of these students, it would be interesting to note other characteristics of the sample in order to get an idea of the experiences these students may have had that could ultimately explain their academic choices. With respect to the secondary school from which they graduated, majority of the student respondents graduated from public secondary schools, with almost 81 percent of the sample size (Figure C.2). A very small percentage graduated from special science secondary schools (less than 2% of total sample), probably because not too many special science schools are located in these areas. In terms of whether they hail from the region in which they study, numbers show a very big majority of the respondents are locals to the region in which their HEI is situated, with almost 89 percent of the total sample studying in their home regions (Figure C.3). Only Regions III and VIII have visitors that make up a relatively large percentage of the students at about 21 percent and 33 percent, respectively.
Given these demographics, it is not surprising for these students to choose degree programs in AFNR fields. The top five AFNR programs among the respondents are: Agriculture; Agribusiness/Agribusiness Management; Food Technology; Agricultural Technology; and, Agricultural Engineering (Table C.3). The relatively more general program does seem to be the top choice although the next top choices involve courses that try to combine agriculture with other disciplines.
Profile of graduatesSociodemographic. The profile of the graduate of an AFNR program does not differ too much from that of a current student in terms of family backgrounds and other demographics, probably because the respondents in this survey have only recently graduated (Table C.4). The mean age is about 26 years and the modal age bracket of 21 to 25 years comprised the sample. One interesting difference is that, although majority of the respondents are still single, about 25 percent of this sample are already married compared to the less than 2 percent of the student-respondents.

60 Higher Education in Agriculture: Trends, Prospects, and Policy Directions
Similarly, no gender dimension or bias in the graduate sample (Figure C.4) is significant. Although females again outnumber males, the difference is too small to be significant (51.22% to 48.78%).
Relating to similarities to the student survey, the baccalaureate level again dominates the distribution of graduate-respondents, with about 88 percent of the total sample (Table C.5). Moreover, almost 95 percent of the graduate-respondents indicated that they were locals of the region in which they studied (Figure C.5). Meanwhile, given the sampling technique implemented, very few graduate-respondents (less than 2%) indicated that they studied at private universities. These respondents might be those who took up or are taking up further studies in the SUCs (Figure C.6).
On the other hand, distributing the graduate-respondents based on the degree programs they finished, a slight difference can be observed between the graduate and student surveys when comparing the top five degree programs in terms of number of respondents. For the graduates, the top AFNR programs are; Agriculture; Agricultural Technology; Agricultural Education; Fisheries; and, Agribusiness/Agribusiness Management (Table C.6). Although Agriculture remains the top choice and the other top choices are generally mixed-disciplines programs, the graduate-respondents preferred technical programs while student-respondents preferred business-related programs.
Employment. Based on the survey results, unemployment among the graduate-respondents by their own evaluation is at 39.05 percent (Figure C.7). This figure is much higher than the national unemployment rate of about 11 percent at the time of the survey. However, this number decreased when the technical definition of unemployment was imposed, which will be discussed later. In addition, it must be taken into account when considering the results here that the respondents have only been graduates of their last AFNR degree program for about three years on the average.
Only a little less than one-third of the newly graduated AFNR human resources are employed on a regular or permanent status (Table C.7). An almost equal proportion of the pool is employed as contractuals. This becomes a concern regarding the opportunities available to AFNR graduates as well as the quality of job creation in the country. However, a little more than one-tenth are self-employed (a closer examination of which is presented in a later discussion).
For those graduate-respondents who are employed, one-third are in the private sector. It is only in Region VII where more AFNR graduates are employed by the Local Government sector. The majority of respondents indicated salaries ranging from PHP5,000.00 to less than PHP10,000.00 per month (Table C.8). Considering that the graduate-respondents here have finished school for at most five years, and that the monthly average daily basic pay for all occupations for 2009 is just under PHP9,000.00, the results on salaries do not appear to be worrisome on the whole.

61AnnaFlorescaF.Abrinaet.al
In the case of the self-employed individuals among the respondents, majority indicated that they were engaged in the Retail sector (Table C.9). Upon closer examination, most self-employed graduate-respondents transact in food, dry goods, and other agricultural commodities. However, before thinking of encouraging AFNR students to consider this type of employment, it must be considered that more than 40 percent of the respondents obtained financing from their families while an almost equal proportion used their own savings to finance their ventures (Figure 3). These numbers may indicate that self-employment may not be an option for all AFNR graduates, especially among the lower-income classes, unless more or better financing opportunities become available.
Most of the unemployed graduate-respondents cited “No job opportunity” as the top reason for their being unemployed. It is followed by “Job offered was not suitable”, then “Family responsibility”. However, considering that many of the options provided to the respondents would actually classify them as not being part of the labor force, it was determined that the unemployment rate among these graduate-respondents should be lower than earlier computed. The responses indicative that the respondent is not a member of the labor force include: further studies; family; lack of self-confidence to face the working world; chose not to work; not interested to work; and, health problems (Table C.10). Based on this redefinition of unemployment, it was determined that the unemployment rate for this sample, measured initially at about 39 percent, could technically be reduced by about 20 percentage points to 19.25 percent.
Costs and financing of higher educationAnother concern important to explain the declining enrollment in AFNR degree programs is the affordability of higher education. Given the earlier discussion of
Family
Ownsavings
Partnership
Loanfrombank
Others
Figure 3. Distribution of self-employed graduate-respondents by source of financing, in percentage, regional and total.
0.00
10.00
20.00
30.00
40.00
50.00
60.00
RegionIIRegionI
RegionIII
RegionV
RegionVI
RegionVII
RegionVIII
RegionIXRegionX
CARAGA
PHILIPPINES

62 Higher Education in Agriculture: Trends, Prospects, and Policy Directions
family incomes, it might seem that college being unaffordable to these respondents is a foregone conclusion. However, the fact that these respondents attend college even with financial constraints calls for a look at the cost of college education and how these expenses are financed. Table 3 presents the modal ranges of tuition fees among respondents of both the student and graduate surveys.
As indicated in the table, most student-respondents pay between PHP3,000.00 to PHP3,500.00 for tuition fees per semester. However, the most number of student-respondents (about 18% for all students) are actually on scholarship or nonpaying. What is interesting in the table above is that, although having, at the earliest, graduated only five years earlier, tuition fees paid by the graduate-respondents seemed to be smaller, substantially so in a few regions and as a mode. In addition, a comparatively smaller proportion of the graduate-respondents were on scholarship or nonpaying in their college days, with only about 11.14 percent belonging to this category. These observations may indicate that tuition fees have indeed increased over recent years although still being relatively very low and that more scholarships have probably been provided in the last few years.
In addition to tuition fees, miscellaneous fees are also paid every semester. Table 4 shows the modal bracket for miscellaneous fees paid. The fees do seem affordable enough, with a majority of respondents indicating that they pay only up to PHP1,500.00 per semester. As the numbers illustrate, miscellaneous fees paid by students are only slightly higher than for the graduates that may imply that the increase in miscellaneous fees in recent years has been minimal. It should be considered however that a closer look at the data will indicate that many of those on scholarship or who are non-paying in terms of tuition fees do pay miscellaneous fees.
Table 3. Percentage of respondents paying modal tuition fees, in percentage, regional and total.
REGIONSTUDENTS GRADUATES
Modal Bracket Percentage Modal Bracket Percentage
RegionIRegionIIRegionIIIRegionVRegionVIRegionVIIRegionVIIIRegionIXRegionXRegionXIRegionXIICARAGA
2,501-3,0001,001-1,500a
4,501-5,0004,501-5,0003,501-4,000a
3,001-3,500a
MorethanP5,0001,501-2,000a
3,001-3,5003,001-3,500
MorethanP5,0002,001-2,500
21.1814.8319.1724.7511.1440.3730.1016.1224.8616.7822.2222.62
1,501-2,000LessthanP1,000LessthanP1,000LessthanP1,000
2,001-2,500a
2,001-2,500LessthanP1,000LessthanP1,000LessthanP1,000
n.s.n.s.
2,501-3,000
19.9228.3518.7926.2315.9714.5025.4026.4278.43
20.50
PHILIPPINES 3,001-3,500a 12.70 Less than P1,000 18.75
Note:aModeforthisregionis“on-scholarship/nonpaying”;categoryindicatedisnextinproportiontomode.n.s.–no submission.

63AnnaFlorescaF.Abrinaet.al
Table 4. Percentage of respondents who paid modal miscellaneous fees, in percentage, regional and total.
RegionStudents Graduates
Bracket Percentage Bracket Percentage
RegionIRegionIIRegionIIIRegionVRegionVIRegionVIIRegionVIIIRegionIXRegionXRegionXIRegionXIICARAGA
1,001-1,5001,001-1,500
LessthanP1,000LessthanP1,000
1,001-1,5001,501-2,0001,001-1,500
LessthanP1,000LessthanP1,000
1,501-2,0001,001-1,5001,001-1,500
37.2753.2629.5669.5528.1241.1150.2542.4546.2629.6133.3340.48
LessthanP1,000LessthanP1,000LessthanP1,000LessthanP1,000LessthanP1,000
1,001-1,500LessthanP1,000LessthanP1,000LessthanP1,000
n.s.n.s.
LessthanP1,000
47.2559.0253.0377.9549.5833.0063.1760.0981.19
56.24
Philippines Less than P1,000 30.99 Less than P1,000 56.63
Note:n.s.–nosubmission
For private universities, the tuition and miscellaneous fees for four-year baccalaureate courses can range from PHP23,000.00 to over PHP100,000.00. In UPLB in Region IV, tuition fees are set at PHP1,000.00 per unit, with regular loads of 18 units per semester, and miscellaneous fees are set at PHP2,000.00 per semester, not including laboratory fees. Considering these, it seems that fees for AFNR degree programs in the HEIs considered here are more than affordable.
Aside from these fees, there are other costs of tertiary education, one of which is the expense of living arrangements. However, in the tracer study, only the graduate-respondents were asked regarding their living arrangements in college. Based on the results, about 55 percent of all graduate-respondents lived in their family homes while studying. This should not be surprising given the fact that only a very small percentage of the respondents do not hail from the region in which they studied. This may imply that proximity may have been one of the reasons why these respondents chose to study where they did. Another observation is that a greater proportion of respondents chose to live in dorms rather than in apartments (20.55% to 7.38%), probably due to lower fees for the former.
Given these expenses, financing then becomes a question. For both the student-respondents and the graduate-respondents, as expected, majority of respondents disclosed that it was their parents who financed their tertiary studies although a small percentage of the respondents were self-supporting. In addition, as mentioned earlier, a greater proportion of students compared to graduates had scholarships to help finance their studies. Help is the operative word here because, as also discussed earlier, the data indicate that even those on scholarships had additional financing sources. Despite this observation, not many respondents

64 Higher Education in Agriculture: Trends, Prospects, and Policy Directions
identify multiple financing sources, probably implying affordability of higher education in these areas.
Enrollment choiceBarring any concerns regarding access to higher education, individual considerations must have led these students and graduates to enroll in a particular degree program, specifically an AFNR program. In addition, as implied earlier, certain factors may have also influenced the choice of the HEI in which these respondents enrolled.
Choice of degree program Among the 15 choices presented in the survey questionnaire, respondents ranked by relevance the top five reasons that describe why they chose their particular degree programs. Results discussed are based on the number of mentions by the respondents, regardless of rank. Nevertheless, the top five reasons based on the number of mentions hardly differ from the top five reasons based on rank. Table 5 presents the response rate for each of the reasons presented.
For the student-respondents, the top five reasons chosen by the most number of respondents are: (1) more job opportunities are available to AFNR graduates; (2) wants to get a prestigious job; (3) prospect for immediate employment; (4) influence of parents or relatives; and, (5) affordable for the family. On the other hand, for the graduate-respondents, the top five reasons for choosing a particular program are: (1) affordable for the family; (2) prospect for immediate employment; (3) more job opportunities are available to AFNR graduates; (4) influence of parents or relatives; and, (5) wants to get a prestigious job.
More graduate-respondents chose an AFNR degree program because of the prospect for immediate employment. On the other hand, student-respondents are not sure of getting jobs after graduation, probably because they lack exposure to the job market or the persistent unemployment reports in the country. In addition, more graduate-respondents indicated that affordability was a reason for their choice of degree program. This however may be a result of having had to pay lower fees and having scholarships available at the time they were in school, as discussed in the previous section.
Based on these results, it seems that having experience in the working world affects one’s perspective. The realities regarding the availability of employment opportunities and the prestige that can be provided by a job seem to sink in better with the graduate-respondents who have experiences in the job market. These considerations are remembered as having been less important priorities in the decisionmaking. In addition, high school experiences and performance apparently do not have much sway in the enrollment choice. Passion does not seem to have much influence either. For all purposes, it seems that practical considerations and the family are stronger inducements.

65AnnaFlorescaF.Abrinaet.al
Table 5. Reasons for choice of degree program, in percentages, all regions.
ReasonStudent
RespondentsGraduate
Respondents
Highgradesinthecourseorsubjectarea(s)relatedtothecourseGoodgradesinhighschoolPrestigeinourcommunityInfluenceofparentsorrelativesInfluenceoffriendsorpeersProspectforimmediateemploymentProvidedwithacollegescholarship(orothermeanstoattendcollege)MorejobopportunitiesareavailabletoAFNRgraduatesAvailabilityofcourseofferinginchoseninstitutionWantstogetaprestigiousjobAffordableforthefamilyOpportunityforthefamilyStrongpassionfortheprofessionNoparticularchoiceornobetterideaOthers
16.6519.7821.5947.4221.4747.6229.0258.3431.8452.8441.0034.7824.1410.250.82
14.0615.5626.0046.5727.6757.6222.4152.8239.8543.0560.7626.5229.0312.131.11
So what keeps students in their programs? Not only was this considered for the student survey but also for the graduate survey, at least in the case of graduate-respondents who took up further studies.
Student-respondents were asked to identify reasons why they might drop out of school. The responses, ranked by the number of times an option was chosen, are: (1) Inability to pay fees; (2) Dissatisfaction with school instruction and/or facilities; (3) Disinterest in course/degree program; (4) Poor marks or grades; (5) Need to work full-time to support family; and (6) Lack of time/busy schedule. Based on these results, it seems again that practical reasons take precedence. The fact that school performance comes second is also important to note since this is where education authorities can have some impact.
In the case of the graduate survey, respondents were asked whether they have taken up further studies. Overall, about 18 percent of the respondents have or are taking up further studies. Greater proportions of graduate-respondents with further studies were found in Regions II, VII, and IX. Those who went to graduate school full-time accounted for just over half (51.2%) of all graduate-respondents with further studies. In terms of whether these graduates took up further studies related to their previous degrees, about 60 percent indicated that they did take up further studies similar to their undergraduate programs. This trend may probably be explained by the fact that, assuming these respondents are in or planning to be in jobs related to their degrees, the top reasons the respondents cited for taking up further studies are: (1) strong interest in seeking knowledge; (2) enhance academic credentials/qualifications; and, (3) better job prospects.
Choice of institutionAmong the eight choices presented in the survey questionnaire, Table 6 presents the ranking of these reasons based on the percentage response by the respondents.

66 Higher Education in Agriculture: Trends, Prospects, and Policy Directions
The results here show some disparity in priorities between the two groups of respondents although it seems that the reputation of the HEI is rather important to both, especially in terms of academic performance. Again, practical considerations certainly affected this choice, in this case, through concerns over the employability of the institution’s graduates. These reasons, mostly based on perceptions, may have exerted the influence they did on this decision as a result of the respondents’ primary source of information regarding the choice, which was found to be parents/siblings/relatives for both survey groups.
Evaluation of schoolingHaving established the reasons for their enrollment choices, respondents were asked to evaluate their experiences in school or after school. This determines whether the HEIs included in the survey met expectations in terms of both the delivery of services and the relevance to employment requirements.
Current experiences of in-school studentsStudent-respondents were asked to evaluate several areas of the in-school experience. The respondents chose from a five-point rating scale (extremely, very, somewhat, not very, and not at all) to indicate their satisfaction with their HEI’s performance. For the first five general areas in the following discussion, the modal rating for student-respondents indicated that they were very satisfied in all aspects. The following discussion simply aims to point out the exceptions to this general trend, particularly, to emphasize some areas that may need improvement or are worthy of note.
Curriculum. The respondents were asked to rate satisfaction in terms of the following: (i) suitability of the study program; (ii) balance between theoretical and practical application components; (iii) compulsory subjects; (iv) cognates/elective subjects; (v) variety of cognates/electives offered; (vi) availability of offered cognates/electives; and (vii) prepares students for work. Only in Regions V, VII and XI was the modal satisfaction rating lower (i.e., somewhat satisfied) in
Table 6. Ranking of reasons for choice of HEI, based on percentage response rate, student survey and graduate survey, all regions.
ReasonRank
Student Graduate
HighemployabilityofgraduatesParents/siblings/relativesarealumniofthiscollege/universityPeers/friendswillenrollorareenrolledinthiscollege/universityReputationasarenownedresearchinstitutionReputationasanexcellentacademicinstitutionReputationforcheap/affordabletuitionfeesReputationinthefieldofyourstudyOthers
36851247
45132678

67AnnaFlorescaF.Abrinaet.al
terms of the cognates offered in the curriculum. This is rather confusing however since the modal responses were very satisfactory for the subcategories of variety of cognates/electives and availability of cognates/electives.
Teaching. The assessment covered the following areas: (i) qualifications of teaching staff; (ii) balance in both theoretical and practical knowledge; (iii) innovation/creativity in teaching/supervising, use of technology in teaching; (iv) ability to relate teaching and current practices in AFNR; (v) ability to expose/update students on current knowledge; (vi) delivery skills and quality of teaching; (v) communication skills in English, (vi) communication skills in Filipino; (vii) teaching staff are available for consultations; (viii) academic advisor (helpful, approachable, concerned with students), (ix) quality of academic advising; and (x) online interaction (using the internet). Although most were very satisfied in other aspects, respondents in the southern regions indicated some difficulty in online communications. Respondents in Regions V, VII, VIII, IX, and XI indicated that they were only somewhat satisfied with online interaction with teachers using the internet.
Grading System. Evaluation concerned the following: (i) Fair and easily understood grading system; (ii) marking schemes for assignment/test/practical etc.; (iii) marking schemes for examinations; and, (iv) timely submission of student grades by faculty/teaching staff. The concerns on Regularly administered faculty/teaching staff evaluation and Fair and easily understood faculty/teaching staff evaluation system were rated relating to the Faculty/Teaching Staff Evaluation.
The grading system seemed to be very satisfactory although respondents in Region 11 rated timely submission of student grades by the faculty/teaching staff somewhat lower. On the other hand, the faculty/teaching staff evaluation system received very satisfactory marks except in Regions I and XII where respondents perceived the system to be extremely satisfying.
Facilities. The following areas were evaluated: (i) training facilities and equipment specific to AFNR courses; (ii) library facilities and services as a whole; (iii) library facilities and services (i.e., comfort and conducive study area, resources, services provided by library staff, online library resources); (iv) lecture rooms/tutorial rooms; (v) laboratory (i.e., computer, science)/workshop/etc.; (vi) gymnasium/sports facilities; (vii) canteen/cafeteria as a whole; (viii) canteen/cafeteria (i.e., nutritious and tasty food in cafeteria/canteen, price of food/meals; (ix) health/clinic facilities on campus; (x) health/clinic personnel and services; (xi) campus bookstore; and (xii) ICT services and facilities in campus.
Respondents signified a high level of satisfaction, particularly for facilities relating directly to academics. However, some southern regions indicated less satisfaction with complementary on-campus facilities such as the canteen/cafeteria, health/clinic facilities, bookstore, and ICT services and facilities. Regions

68 Higher Education in Agriculture: Trends, Prospects, and Policy Directions
V, VIII, X, and XI reflected a mode of somewhat satisfied for certain categories in these areas.
Campus Security. Respondents were asked to rate their sense of security at different times of the day on a five-point scale (very safe, safe somehow safe, not very safe, and not at all safe). In general, respondents felt safe in campus during mornings and afternoons, However, many respondents said that they only felt somewhat safe on their campuses at night.
Guidance Counseling. The most number of respondents signified very satisfactory performance by the HEIs in the areas of: (i) information on job and career opportunities; (ii) assistance on job applications (resume writing, application letters, etc.); (iii) assistance in obtaining jobs (job fairs, liaising with employers); (iv) information on further studies; and (v) job opportunities in campus. Less than half of the respondents availed themselves of counseling service (i.e., for academic concerns). For those who did not avail of the service, they said that problems were not difficult enough to warrant counseling or they were not aware that such service existed.
Employment outcomes for graduates For the graduate-respondents, effectiveness of the program could be implied by the outcomes faced by these graduates once they enter the job market. The outcomes for the graduates considered here are the length of the search for their first job, relevance of their degree program to their first job, and perceptions of their learning of necessary competencies.
Answers showed that it took six months at the most to find their first job (Table 7). In fact, more than one-third of the respondents found jobs within the first month of graduation. However, it would have been interesting to uncover the difficulties confronted by about 20 percent of respondents who did not find a job within the first year after their graduation.
The longer job search of the latter group may be attributed to the desire to find jobs where they could use the knowledge and skills they learned in their degree programs. Based on self-evaluations by the graduate-respondents, more than half (62.36%) of the sample indicated that their degrees were very helpful, at the least, to their first job. In fact, almost a fourth of the respondents indicated that their degrees were extremely helpful in their first job while only about 10 percent signified that their degrees were not very or not at all helpful.
In terms of what competencies they learned from college, which could partially explain the results regarding the relevance of their degrees to their first jobs, the respondents identified communication skills and human relation skills as the top competencies (Table 8). The least learned competency in school, according to these AFNR graduates, was information technology skills. This might be influenced by the less than satisfactory rating some of these HEIs received for IT facilities and services mentioned earlier.

69AnnaFlorescaF.Abrinaet.al
Table 7. Distribution of graduate-respondents, based on length of first job search, in percentage, regional and total.
RegionLess than a
month1 to 6
months7 to 11 months
1 year to less than 2
years
2 years to less than 3
years
3 years to less than 4
yearsOthers
RegionI 37.34 42.09 4.75 10.76 3.16 1.58 0.32
RegionII 25.95 41.98 9.16 8.40 6.87 4.58 3.05
RegionIII 41.25 35.95 6.27 10.37 2.65 2.05 1.45
RegionV 36.85 37.79 8.45 11.27 2.58 2.11 0.94
RegionVI 33.17 34.86 12.02 13.22 3.85 2.88 0.00
RegionVII 27.22 31.65 8.86 17.09 5.70 6.96 2.53
RegionVIII 34.62 38.92 7.10 12.90 3.01 2.80 0.65
RegionIX 34.83 30.71 11.24 13.11 4.12 1.87 4.12
RegionX 41.46 26.83 9.76 19.51 0.00 0.00 2.44
CARAGA 31.48 36.72 7.87 15.41 4.59 2.95 0.98
Philippines 35.75 36.61 8.05 12.25 3.46 2.59 1.28
Table 8. Response rate of graduate-respondents to competencies learned from HEI, in percentage, regional and total.
Competency Response Rate Competency Response Rate
CommunicationskillsHumanrelationskillsEntrepreneurialskillsInformationtechnologyskills
72.7276.0533.7329.53
Problem-solvingskillsCriticalthinkingskillsTechnicalskillsinAFNROthers
32.8930.6134.770.83
Self-evaluations and optionsFor student-respondents, who generally have no professional experience, they gave satisfactory ratings regarding the skills and knowledge they acquired from school. In terms of effectiveness of the program, ratings for a different set of qualities (i.e., more on life lessons and skills) were evaluated. For the graduate-respondents, who generally have work experience, evaluation was concerned with their competency in the skills and knowledge as well as their perception on the effectiveness of the programs in influencing these competency levels.
Data showed a very satisfied response on the performance of the HEIs in influencing the respondents’ learning of certain skills and knowledge. In addition, they were also very satisfied with how effective college had been influencing their lives (Table 9). However, respondents from Regions IX and XI gave lower satisfaction ratings for skills and knowledge learning. On the other hand, Region XII respondents gave relatively higher satisfaction ratings for program effectiveness relating to current affairs and team work.
Table 10 shows that the graduate-students’ modal ratings between the effectiveness of the program and the competencies that they engender are
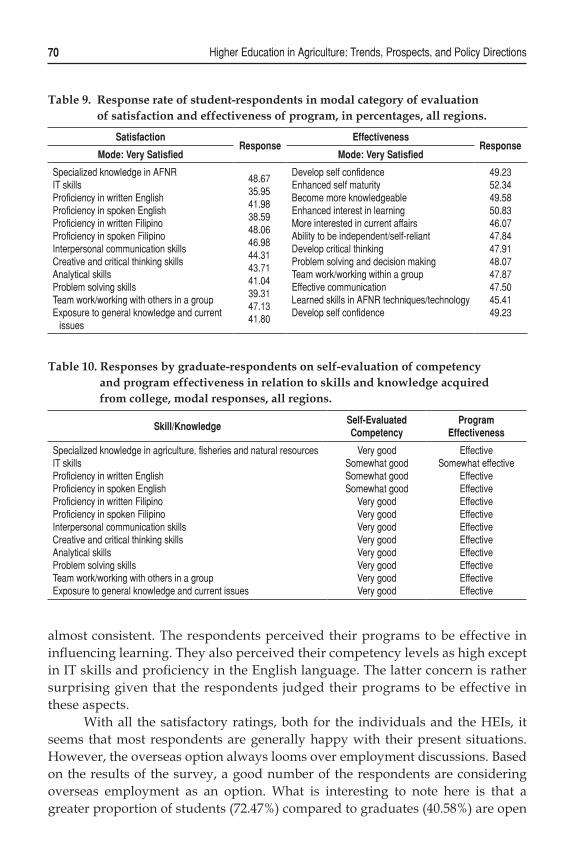
70 Higher Education in Agriculture: Trends, Prospects, and Policy Directions
Table 9. Response rate of student-respondents in modal category of evaluation of satisfaction and effectiveness of program, in percentages, all regions.
SatisfactionResponse
EffectivenessResponse
Mode: Very Satisfied Mode: Very Satisfied
SpecializedknowledgeinAFNRITskillsProficiencyinwrittenEnglishProficiencyinspokenEnglishProficiencyinwrittenFilipinoProficiencyinspokenFilipinoInterpersonalcommunicationskillsCreativeandcriticalthinkingskillsAnalyticalskillsProblemsolvingskillsTeamwork/workingwithothersinagroupExposuretogeneralknowledgeandcurrent issues
48.6735.9541.9838.5948.0646.9844.3143.7141.0439.3147.1341.80
DevelopselfconfidenceEnhancedselfmaturityBecomemoreknowledgeableEnhancedinterestinlearningMoreinterestedincurrentaffairsAbilitytobeindependent/self-reliantDevelopcriticalthinkingProblemsolvinganddecisionmakingTeamwork/workingwithinagroupEffectivecommunicationLearnedskillsinAFNRtechniques/technologyDevelopselfconfidence
49.2352.3449.5850.8346.0747.8447.9148.0747.8747.5045.4149.23
almost consistent. The respondents perceived their programs to be effective in influencing learning. They also perceived their competency levels as high except in IT skills and proficiency in the English language. The latter concern is rather surprising given that the respondents judged their programs to be effective in these aspects.
With all the satisfactory ratings, both for the individuals and the HEIs, it seems that most respondents are generally happy with their present situations. However, the overseas option always looms over employment discussions. Based on the results of the survey, a good number of the respondents are considering overseas employment as an option. What is interesting to note here is that a greater proportion of students (72.47%) compared to graduates (40.58%) are open
Table 10. Responses by graduate-respondents on self-evaluation of competency and program effectiveness in relation to skills and knowledge acquired from college, modal responses, all regions.
Skill/KnowledgeSelf-EvaluatedCompetency
ProgramEffectiveness
Specializedknowledgeinagriculture,fisheriesandnaturalresourcesITskillsProficiencyinwrittenEnglishProficiencyinspokenEnglishProficiencyinwrittenFilipinoProficiencyinspokenFilipinoInterpersonalcommunicationskillsCreativeandcriticalthinkingskillsAnalyticalskillsProblemsolvingskillsTeamwork/workingwithothersinagroupExposuretogeneralknowledgeandcurrentissues
VerygoodSomewhatgoodSomewhatgoodSomewhatgood
VerygoodVerygoodVerygoodVerygoodVerygoodVerygoodVerygoodVerygood
EffectiveSomewhateffective
EffectiveEffectiveEffectiveEffectiveEffectiveEffectiveEffectiveEffectiveEffectiveEffective

71AnnaFlorescaF.Abrinaet.al
to this option. This might not be surprising though, if it is taken into account that the graduate-respondents may be employed and satisfied in their current jobs or that they are more aware of the constraints to going overseas having had some experience in the job market already such that they are more realistic or practical in their plans or expectations.
Perspective of employersUp to this point, the discussion has been limited to products of a system evaluating the system that produced them. The employer survey aimed to provide the other side of this story, that is, an evaluation of the products of the educational system as well as a cursory appraisal from outside the system.
Based on the results of the graduate survey, employers of the graduate-respondents were traced. A total of 820 employers took part in the survey. Of this number about 91 percent of the employer-respondents indicated that they were local. This may not be surprising given that almost one-fourth of the respondents are from academic and research institutions. One-fifth were from governmental institutions. In addition, less than 10 percent of the employer-respondents employ graduate-respondents who do not hail from the region in which they are located.
Recruitment and hiring practicesTable 11 presents the responses of these employers to questions on their preferred methods of recruitment and application as well as their primary considerations in the hiring decision.
Based on the number of mentions by the respondents, the top recruitment options for employers are through posted notice of opening in front of the company and word of mouth/personal recommendation. Not so preferred were media and internet options as well as job centers or job fairs. Respondents mostly preferred face-to-face applications. Applications through writing or telephone were the next preferred. More importantly, previous work experience is the primary consideration of employers in hiring people. A close second is the strength of an applicant’s curriculum vitae followed closely by an applicant’s overall personality.
Importance of and satisfaction with characteristics of employeesEmployer-respondents were then asked to rate the importance of specific knowledge areas and qualities that are expected of employees. Some general and specialized skills were also identified and rated in terms of importance. At the same time, employer-respondents were also asked to evaluate their satisfaction with the competency of their employees in these areas. A five-point scale (extremely, very, somewhat, not very, and not at all) was used in every instance.
Results of the survey show that all areas identified are very important and that employers are very satisfied with the graduate-respondents who are their

72 Higher Education in Agriculture: Trends, Prospects, and Policy Directions
Table 11. Response rates on preferred recruitment and application methods and considerations in hiring, in percentages, all regions.
RecruitmentMethod
Response Application Method Response Hiring Consideration Response
JobCenter,JobFair
Newspapers,mediaads
RecruitmentagencyPostednoticeof
openinginfrontofthecompany
Internet-basedrecruit-ment
Company/organizationwebsite
Wordofmouth,personalrecommendation
Others
11.83
17.80
9.2760.85
6.71
10.24
56.34
5.49
Face-to-face
Telephone
InwritingEmail
Jobcenter,Jobfairadviser/recruiterInternet-basedrecruit-mentNotapplicable
Others
84.51
35.00
48.5413.54
6.46
3.54
1.95
0.85
PerformanceatinterviewPreviousworkexper-ienceOver-allpersonalityStrengthofcurriculumvitaeorresume
Performanceinassess-ment/testTrialperiod
Strengthofreferences
Others
0.73
52.07
49.0249.39
43.29
23.17
13.05
1.46
employees (Table 12). The discussions that follow take into account noteworthy exceptions to these modal responses.
Respondents from several regions noted that knowledge of peoples and cultures from other countries was only somewhat important. Such assessment was probably a consequence of the local nature of most employers. Employers in several regions were only somewhat satisfied with the performance of their employees in this area. Moreover, employers in Region IX were also only somewhat satisfied with employee performance in several knowledge areas. Despite this “somewhat” nature of assessment, the respondents were very satisfied with their employees in terms of knowledge of their field of study.
Likewise, employer-respondents are very satisfied with the general qualities their employees possessed. Moreover, for employers in Regions I, II, and VIII, a positive attitude towards work was extremely important.
All general skills identified in the survey were considered very important by most of the employer-respondents. However, for employers of Regions IX and X. they considered computer and equipment use skills as only somewhat important. region X employers considered skills in teamwork as extremely important. Employers from the same regions as well as from Region VIII indicated that they are only somewhat satisfied with the skill levels of their employees. This may be due to the deficiencies in the necessary equipment in these regions mentioned in earlier results.
Employers considered all identified skills as very important. In fact, most of the employers in Region III considered the last two of these specialized skills as extremely important. On the other hand, although generally very satisfied in other areas, employers from Regions IX, X, and XI were only somewhat satisfied

73AnnaFlorescaF.Abrinaet.al
Table 12. Response rate among employer-respondents in the modal category for importance of and satisfaction with employee characteristics, in percentages, all regions.
CharacteristicImportance
(Mode:Very Important)
Satisfaction(Mode:
Very Satisfied)
KnowledgeAreasKnowledgeinhis/herfieldofstudyUnderstandingofjob-relatedinformationSpecifictechnicalknowledgerequiredforthejob(otherthancomputer
applications)KnowledgeofspecificcomputerapplicationsrequiredforthejobUnderstandingofsystemsandorganizationsKnowledgeofpeoplesandculturesfromothercountriesKnowledgeofFieldofStudyKnowledgeOutsideFieldofStudy
57.0763.1054.17
42.3744.4331.39n.a.n.a.
63.9456.7754.55
41.5042.7532.9962.1959.62
GeneralQualitiesFlexibility(respondswelltochange)Creativity(identifiesnewapproachestoproblems)Empathy(understandsthesituation,feelings,ormotivesofothers)Reliability(canbedependedupontocompleteworkassignments)Integrity(understandsandappliesethicalprinciplestodecisions)PositiveattitudetowardsworkWillingnesstolearnUnderstandsandtakesdirectionsforworkassignmentsAcceptsresponsibilityforconsequencesofactionsOverall
59.2354.5756.6855.7553.2050.7561.9962.5262.00n.a.
61.9453.6856.5960.8257.1159.9561.9962.5262.0069.29
GeneralSkillsWrittencommunicationVerbalcommunicationListeningtoothersOrganizinginformationforpresentationCriticalthinking(e.g.evaluatinginformation,makingdecisions)Computation(math)ReadingcomprehensionBasiccomputer(e.g.wordprocessing)Advancecomputer(e.g.spreadsheets,databases)Useofequipmentortechnologyspecifictothejob(otherthancomputers)LeadershipTeamwork(interpersonalrelations)CustomerrelationsOverall
52.7757.7857.1249.2449.1249.5648.6045.7036.6849.0549.6856.6949.24n.a.
48.2454.8357.7246.0247.9248.9350.7645.5235.2345.3347.3657.2756.7364.80
SpecializedSkillsManagementoforganizationalresources(budgets,subordinates,etc.)FluencyinalanguageotherthanEnglishProjectmanagementNegotiation(contracts,alliances,sales)MentoringorcoachingcolleaguesAbilitytosetgoalsandallocatetimetoachievethemAbilitytotranslatetheoryintopracticeOverall
48.4839.7545.3747.0149.0552.6650.51n.a.
47.1036.9042.0641.0944.7550.3848.7358.00
GeneralCollegePreparationofEmployees n.a. 62.55

74 Higher Education in Agriculture: Trends, Prospects, and Policy Directions
with the skills of their employees in several categories. In addition, employers in several regions were only somewhat satisfied with the skills of their employees in various aspects relating to management.
Despite the exceptions mentioned above, employers were generally very satisfied with the competency and performance of their employees in the aspects identified in the survey. The next section discusses how these respondents perceived the institutions from which their employees graduated and presents other comments relating to improving the effectiveness of HEIs.
Perceptions and commentsMost (60%) employer-respondents affirmed that they were very satisfied on the college preparation of their employees (Table 12). But the employers also identified the skills that need to be given emphasis in college programs (Table 13).
Communication skills are the topmost concern of the employers, especially in relation to command of the English language. Apparently, employers regard more highly skills in English communication than knowledge of computer software and aptitude for team work.
Finally, when asked whether they would hire other graduates from the HEIs from which their current employees graduated, more than two-thirds of the respondents affirmed that it would be very likely. Almost 79 percent indicated that it would more than somewhat likely that they would hire graduates from the identified HEIs in the future. With the prior environmental scanning mentioned in the introductory section of this chapter indicating that there does not seem to be any large discrepancy in the passing rates among AFNR and non-AFNR licensure examinations, with graduates of AFNR courses seemingly doing relatively better than their counterparts in non-AFNR courses, these results only provide more support to disregard the common notion that the quality of AFNR education, particularly in SUCs, is low.
Table 13. Response rate of employer-respondents on skills that need emphasis, in percentages, regional and total.
Skill Philippines
EmphasisonspeakingandwritingCommunicationskillsingeneralExpandingknowledgeofcomputersingeneralTeamwork/workingwithothersinagroupExpandingspecificcomputerknowledge(MSOffice,spreadsheets,adobe,etc.)ProficiencyinwrittenEnglishProficiencyinspokenEnglishProficiencyinwrittenFilipinoProficiencyinspokenFilipinoOthers
35.6623.1014.098.638.254.824.190.630.633.55

75AnnaFlorescaF.Abrinaet.al
ConclusionIn recent years, the growth in the number of public HEIs has been a concern. This so-called proliferation has called to question whether government allocations for the operations of these HEIs are justified. The observed decline in the enrollment in AFNR degree programs of SUCs has furthered the clamor for rationalization. Moreover, doubts regarding the quality of AFNR education and consequently the employability of its graduates have also been raised. Results of a prior environmental scanning as well as the human resource inventory and tracer study debunked some of the more important misconceptions.
For one, access and affordability have been identified as factors explaining the declining enrollment in AFNR programs. The results showed that many students in AFNR programs came from humble backgrounds and face difficulties in tuition fees and other expenses. The downward trend in AFNR enrollment may be attributed to considerations of future employment opportunities.
Further, there were perceptions on the poor quality of AFNR education. Apparently, this is being associated with the low passing rates in licensure examinations. No significant discrepancy in passing rates among AFNR and non-AFNR fields was observed. Moreover, the satisfaction level on the college preparation is positive as indicated by graduates, employers as well as students.
Finally, although unemployment among AFNR graduates was rather high, this is the same circumstance experienced by other tertiary graduates. Employment outcomes among AFNR graduates are not different from the general population. Generally, the limited employability of graduates seems to be less a supply problem than a result of a shifting demand in the job market due to changes in demographic and economic structures.
Thus, the issue is rationalization. The enrollment and employment trends already provide compelling support to arguments for reversing the proliferation of public HEIs. Improvement in the educational system is the emphasis.
The logical recommendation then would be to consolidate resources in fewer institutions and concentrate efforts to enhance the educational experience. In particular, additional training in communication, computer and equipment use, and information technology are of primary importance. Augmenting mixed-discipline programs in line with changing job market demands may open up additional employment opportunities. Improvement of complementary facilities such as cafeterias and clinics would be highly valued while encouraging exposure to different people and cultures will foster respect for diversity and afford better interpersonal skills.
Employers can provide a better picture of the true situation in the job market. A more thorough look into the demand side of this story, vis-à-vis the inferences already reached here, would provide a better understanding of how to move forward.

76 Higher Education in Agriculture: Trends, Prospects, and Policy Directions
Annex A. Higher Education Institutions covered
Table A.1. List of higher education institutions included in inventory and tracer study of AFNR human resources, by region.
Region HEIs in Human Resource Inventory HEIs in Tracer Study
RegionI DonMarianoMarcosMemorialStateUniversity(DMMMSU)
IlocosSurPolytechnicStateCollege(ISPSC)PangasinanStateUniversity(PSU)MarianoMarcosStateUniversity(MMSU)
DonMarianoMarcosMemorialStateUniversity(DMMMSU)
MarianoMarcosStateUniversity(MMSU)
RegionII IsabelaStateUniversity(ISU)CagayanStateUniversity(CSU)NuevaVizcayaStateUniversity(NVSU)QuirinoStateCollege(QSC)
IsabelaStateUniversity(ISU)CagayanStateUniversity(CSU)NuevaVizcayaStateUniversity(NVSU)QuirinoStateCollege(QSC)
RegionIII AuroraStateCollegeofTechnology(ASCOT)BataanPeninsulaStateUniversity(BPSU)BulacanAgriculturalStateCollege(BASC)CentralLuzonStateUniversity(CLSU)FortunatoF.HaliliNationalAgriculturalSchool
(FFHNAS)Dr.Yanga’sCollege,Inc.(DYCI)MVGallegoFoundationCollege,Inc.(MVGFCI)NuevaEcijaUniversityofScienceandTechnology
(NEUST)PampangaAgriculturalCollege(PAC)RamonMagsaysayTechnologicalUniversity
(RMTU)TarlacCollegeofAgriculture(TCA)TarlacStateUniversity(TSU)WesleyanUniversity-Philippines(WU-P)
CentralLuzonStateUniversity(CLSU)PampangaAgriculturalCollege(PAC)
RegionIV BatangasStateUniversity(BATSU)CaviteStateUniversity(CavSU)PolytechnicUniversityofthePhilippines(PUP)SouthernLuzonStateUniversity(SLSU)UniversityofRizalSystem(URS)UniversityofthePhilippinesLosBaños(UPLB)WesternPhilippinesUniversity(WPU)
UniversityofthePhilippinesLosBaños(UPLB)WesternPhilippinesUniversity(WPU)
RegionV BicolUniversity(BU)CamarinesNorteStateCollege(CNSC)CamarinesSurStateAgriculturalCollege(CSSAC)CatanduanesStateColleges(CSC)PartidoStateUniversitySorsogonStateCollege(SSC)Dr.EmilioB.EspinosaSr.MemorialStateCollege
ofAgricultureandTechnology(DEBESMSCAT)
BicolUniversity(BU)CamarinesNorteStateCollege(CNSC)CamarinesSurStateAgriculturalCollege(CSSAC)CatanduanesStateColleges(CSC)SorsogonStateCollege(SSC)Dr.EmilioB.EspinosaSr.MemorialStateCollege
ofAgricultureandTechnology(DEBESMSCAT)

77AnnaFlorescaF.Abrinaet.al
Region HEIs in Human Resource Inventory HEIs in Tracer Study
RegionVI AklanStateUniversity(ASU)CapizStateUniversity(CAPSU)IloiloStateCollegeofFisheries(ISCOF)NegrosStateCollegeofAgriculture(NSCA)NorthernIloiloPolytechnicStateCollege(NIPSC)NorthernNegrosStateCollegeofScienceand
Technology(NONESCOST)WestVisayasStateUniversity(WVSU)WesternVisayasCollegeofScienceandTechno-
logy(WVCST)
AklanStateUniversity(ASU)CapizStateUniversity(CAPSU)IloiloStateCollegeofFisheries(ISCOF)NegrosStateCollegeofAgriculture(NSCA)NorthernIloiloPolytechnicStateCollege(NIPSC)NorthernNegrosStateCollegeofScienceand
Technology(NONESCOST)PolytechnicStateCollegeofAntique(PSCA)WestVisayasStateUniversity(WVSU)
RegionVII BoholInstituteofTechnology(BIT)CebuStateCollegeofScienceandTechnology
(CSCST)CentralVisayasStateCollegeofAgriculture,
ForestryandTechnology(CVSCAFT)FoundationUniversity(FU)NegrosOrientalStateUniversity(NORSU)SillimanUniversity(SU)SiquijorStateCollege(SSC)SouthwesternUniversity(SWU)UniversityofSanCarlos(USC)
BoholInstituteofTechnology(BIT)CebuStateCollegeofScienceandTechnology
(CSCST)CentralVisayasStateCollegeofAgriculture,
ForestryandTechnology(CVSCAFT)FoundationUniversity(FU)NegrosOrientalStateUniversity(NORSU)SillimanUniversity(SU)SiquijorStateCollege(SSC)SouthwesternUniversity(SWU)UniversityofSanCarlos(USC)
Region VIII
EasternSamarStateUniversity(ESSU)NavalInstituteofTechnology(NIT)SamarStateCollegeofAgricultureandForestry
(SSCAF)SamarStateUniversity(SSU)SouthernLeyteStateUniversity(SLSU)TiburcioTancincoMemorialInstituteofScienceand
Technology(TTMIST)UniversityofEasternPhilippines(UEP)VisayasStateUniversity(VSU)
EasternSamarStateUniversity(ESSU)NavalInstituteofTechnology(NIT)SamarStateCollegeofAgricultureandForestry
(SSCAF)SamarStateUniversity(SSU)SouthernLeyteStateUniversity(SLSU)TiburcioTancincoMemorialInstituteofScienceand
Technology(TTMIST)UniversityofEasternPhilippines(UEP)VisayasStateUniversity(VSU)*
RegionIX JoseRizalMemorialStateCollege(JRMSC)JosefinaH.CerillesStateCollege(JHCSC)WesternMindanaoStateUniversity(WMSU)ZamboangaStateCollegeofMarineScienceand
Technology(ZSCMST)
JoseRizalMemorialStateCollege(JRMSC)JosefinaH.CerillesStateCollege(JHCSC)WesternMindanaoStateUniversity(WMSU)ZamboangaStateCollegeofMarineScienceand
Technology(ZSCMST)
RegionX CamiguinPolytechnicStateCollege(CPSC)CentralMindanaoUniversity(CMU)MisamisOrientalStateCollegeofAgricultureand
Technology(MOSCAT)MisamisUniversity(MU)MountainViewCollege(MVC)NorthernMindanaoPolytechnicStateCollege
(NMSC)XavierUniversity(XU)
CentralMindanaoUniversity(CMU)
RegionXI DavaodelNorteStateCollege(DNSC)DavaoOrientalStateCollegeofScienceand
Technology(DOSCST)SouthernPhilippinesAgri-Business,Marineand
AquaticSchoolofTechnology(SPAMAST)UniversityofSoutheasternPhilippines(USeP)
UniversityofSoutheasternPhilippines(USeP)

78 Higher Education in Agriculture: Trends, Prospects, and Policy Directions
Region HEIs in Human Resource Inventory HEIs in Tracer Study
RegionXII CotabatoFoundationCollegeofScienceandTechnology(CFCST)
NotreDameMarbelUniversity(NDMU)MindanaoStateUniversity(MSU)SultanKudaratPolytechnicStateCollege(SKPSC)SurallahNationalAgriculturalSchool(SUNAS)UniversityofSouthernMindanao(USM)
CotabatoFoundationCollegeofScienceandTechnology(CFCST)
NotreDameMarbelUniversity(NDMU)MindanaoStateUniversity(MSU)**SultanKudaratPolytechnicStateCollege(SKPSC)SurallahNationalAgriculturalSchool(SUNAS)UniversityofSouthernMindanao(USM)*
CAR AbraStateInstituteofSciencesandTechnology(ASIST)
ApayaoStateCollege(ASC)BenguetStateUniversity(BSU)IfugaoStateCollegeofAgricultureandForestry
(ISCAF)Kalinga-ApayaoStateCollege(KASC)MountainProvinceStatePolytechnicCollege
(MPSPC)
AbraStateInstituteofSciencesandTechnology(ASIST)
ApayaoStateCollege(ASC)BenguetStateUniversity(BSU)*IfugaoStateCollegeofAgricultureandForestry
(ISCAF)Kalinga-ApayaoStateCollege(KASC)*MountainProvinceStatePolytechnicCollege
(MPSPC)
CARAGA AgusandelSurStateCollegeofAgricultureandTechnology(ASSCAT)
NorthernMindanaoStateInstituteofScienceandTechnology(NORMISIST)
SurigaodelNorteCollegeofAgricultureandTechnology(SNCAT)
SurigaodelSurPolytechnicStateCollege(SSPSC)SurigaoStateCollegeofTechnology(SSCT)
MalimonoCampus
AgusandelSurStateCollegeofAgricultureandTechnology(ASSCAT)*
NorthernMindanaoStateInstituteofScienceandTechnology(NORMISIST)*
SurigaodelNorteCollegeofAgricultureandTechnology(SNCAT)
SurigaodelSurPolytechnicStateCollege(SSPSC)SurigaoStateCollegeofTechnology(SSCT)
MalimonoCampus
Note:*OnlyHEIinvolvedinin-schoolstudentsurvey;**OnlytheGeneralSantoscampusinvolvedinin-schoolstudentsurvey.
Annex B. Human Resource Inventory
Table B.1. Number of enrolled students in AFNR courses, by level of study, regional and total, second semester SY 2008-2009.
Region BS/BA/AB MA/MS PhD Total
RegionIRegionIIRegionIIIRegionVRegionVIRegionVIIRegionVIIIRegionIXRegionXRegionXIICARAGACAR
3802,3953,4833,3031,7271,5851,469
9466,4603,0401,8713,394
710796
112171659
-44
-1823
810843517
20----
22
3952,6103,6223,4201,7451,6081,548
9466,5043,0401,8893,439
Philippines 30,053 499 214 30,766
Note:FiguresdonotincluderesultsforRegionsIVandXI.
Table A.1. (continued)

79AnnaFlorescaF.Abrinaet.al
Table B.2. AFNR enrollment, number of enrollees by sex, regional and total, SY 1998-1999 to SY 2007-2008.
RegionSchool Year
98-99 99-00 00-01 01-02 02-03 03-04 04-05 05-06 06-07 07-08
RegionIIMaleFemaleTotal
326143469
424121545
447217664
506226732
7043551,059
1,0475241,571
9205171,437
7763961,172
7824591,241
636402
1,038
RegionVIIMaleFemaleTotal
1,9331,2473,180
2,1441,4923,636
2,2581,5603,818
1,7971,3723,169
1,7291,4603,189
1,8481,4693,317
1,6751,4103,085
1,4771,1262,603
1,1468201,966
965679
1,644
RegionIXMaleFemaleTotal
1,1831,2852,468
1,3391,4102,749
1,4191,5102,929
1,3511,4672,818
1,6661,8153,481
1,4911,6303,121
1,2151,3332,548
1,2611,3512,612
9501,2232,173
782871
1,653
RegionXMaleFemaleTotal
8541,1401,994
9801,2762,256
3,0834,0837,166
2,9074,1797,086
3,1144,5927,706
3,1604,4237,583
3,1364,6167,752
3,3394,9238,262
3,7924,7258,517
4,0673,2547,321
RegionXIIMaleFemaleTotal
1,7251,8083,533
2,3072,4524,759
2,1872,3934,580
2,4042,6115,015
2,4722,8305,302
2,3272,5804,907
1,9682,0564,024
2,2042,1464,350
2,3442,2384,582
2,3842,2514,635
CARAGAMaleFemaleTotal
1,0221,3672,389
1,6211,7973,418
1,4121,7823,194
1,4811,7853,266
1,5161,7133,229
1,5381,7723,310
1,3871,4022,789
1,1571,0432,200
9561,0742,030
8891,0521,941
CARMaleFemaleTotal
23687
323
21379292
24380323
232104336
216110326
201109310
16391254
15094244
17391264
15392
245
PhilippinesMaleFemaleTotal
7,2797,077
14,356
9,0288,627
17,655
11,04911,62522,674
10,67811,74422,422
11,41712,87524,292
11,61212,50724,119
10,46411,42521,889
10,36411,07921,443
10,14310,63020,773
9,8768,601
18,477

80 Higher Education in Agriculture: Trends, Prospects, and Policy Directions
Table B.3. Number of AFNR degrees conferred, by level of study, regional and total, SY 2007-2008.
Region Associate BS/BA/AB MA/MS PhD Total
RegionIRegionIIRegionIIIRegionVRegionVIRegionVIIRegionVIIIRegionIXRegionXRegionXIRegionXIICARAGACAR
59
1,48958
346384
1,52972525
39146323
5071,704
6082225
618191516
13-
1033
-29
14
12---
2-
16--
4
353406
1,56074026
39753723
5183,232
6662438
Philippines 1,606 6,752 132 30 8,520
Note:FiguresdonotincluderesultsforRegionIV.
Table B.4. Number and growth rate of AFNR graduates, SY 2007-2008 and average for SY 1998-1999 to SY 2007-2008, regional and total.
RegionSY 2007-2008 Average
Count Growth (%) Count Growth (%)
RegionIRegionIIRegionIIIRegionVRegionVIRegionVIIRegionVIIIRegionIXRegionXRegionXIRegionXIIRegionXIIICAR
449580
1,560763582510835271525535
1,241299553
(6.26)(0.85)30.98
(17.60)(7.03)(8.60)(3.47)(8.75)6.49
(21.90)19.67
(12.57)(2.12)
626731
1,376976628618
1,148334483467
1,189493623
1.401.704.81
(0.07)6.620.06
(2.70)(1.94)3.818.653.28
(5.04)1.26
Philippines 8,703 0.62 9,691 0.88

81AnnaFlorescaF.Abrinaet.al
Annex C. Profile data from Human Resource Tracer Study
Table C.1. Projected sample size and actual number of observations of AFNR Human Resource Tracer Study, regional and total.
RegionNo. ofHEIs
Student Survey Graduate Survey EmployerSurvey
RespondentsSample Respondents Sample Respondents
ICARIIIIIIVVVIVIIVIIIIXXXIXIICARAGA
464
1311749398467
8871,506
9871,4141,9091,3961,4271,2651,0271,0822,038
8482,576
763
492n.s.968
1,414n.s.796
1,427540993
1,1181,408
304639763
597336485965626
1,074736814630462374
1,0271,123
**
472n.s.201965
n.s.570736200630467102
n.s.n.s.445
123n.s.2883
n.s.62
14062
128981532
n.s.49
Total 95 19,098 10,862 9,249 4,788 820
n.s.–nosubmission
Table C.2. Percentage of student-respondents with modal characteristics, regional and total.
RegionMeanAge
Percentage of respondents with modal characteristics
AgeMarital Status
Household Size
Regional Origin
Father’sOccupation
Mother’s Occupation
Income
17 to 21
SingleMore than 5
Rural
Farmer, Forestry Worker,
Fisherman
Notemployed
Less than
50,000
RegionIRegionIIRegionIIIRegionVRegionVIRegionVIIRegionVIIIRegionIXRegionXRegionXIRegionXIICARAGA
20.4619.9821.3720.2820.5521.2920.4220.2619.9820.8319.9020.54
73.1386.9478.8659.5184.7746.5279.5579.0781.4542.7587.2078.50
96.7598.1396.1898.6298.8197.0497.7898.6599.3698.3699.6997.90
45.9351.3243.0756.9362.5847.2253.3757.0958.2452.6346.5556.43
88.4187.6870.8055.2886.7664.6377.7462.3966.0558.5575.9066.71
60.9968.2546.0229.6353.6938.3732.1241.8639.3235.4461.9250.34
54.7027.3541.6653.1548.5736.1641.3932.2337.6050.1741.6445.68
89.6378.3636.6373.0878.4075.9338.4776.0344.1841.7854.3970.34
Philippines 20.48 74.88 98.15 53.48 72.56 46.32 41.55 61.47

82 Higher Education in Agriculture: Trends, Prospects, and Policy Directions
Table C.3. Top five AFNR degree programs by number of student-respondents, regional and total.
Region First Second Third Fourth Fifth
RegionI
RegionII
RegionIII
RegionV
RegionVI
RegionVII
RegionVIII
RegionIX
RegionX
RegionXI
RegionXII
CARAGA
Agriculture
Agriculture
Agriculture
Agribusiness/AgribusinessManagementAgriculture
Agriculture
AnimalHusbandry
FoodTechnology
Agriculture
AgriculturalTechnologyAgribusiness/AgribusinessManagementAgriculturalTechnology
EnvironmentalScience/ManagementAgribusiness/AgribusinessManagementVeterinaryMedicineFisheries
Fisheries
AgriculturalTechnology
Agribusiness/AgribusinessManagementAgriculture
VeterinaryMedicine
AgriculturalEngineeringDevelopmentCommunication
Agribusiness/AgribusinessManagement
AgriculturalTechnology
AgriculturalEngineering
FoodTechnology
Agriculture
AnimalHusbandryAgribusiness/AgribusinessManagementFoodTechnology
Agribusiness/AgribusinessManagementFoodTechnology
Forestry
VeterinaryMedicine
EnvironmentalScience/Management
AgriculturalEngineering
AnimalHusbandry
AgricultureExtensionAgriculturalEngineering
AgriculturalTechnologyForestry
Agriculture
AgriculturalEngineering
AgriculturalEducation
Agriculture
Agriculture
Agriculture
Fisheries
AgriculturalTechnology
DevelopmentCommunicationAgriculturalTechnology
Forestry
Fisheries
VeterinaryMedicine
Forestry
Agribusiness/AgribusinessManagementVeterinaryMedicineAnimalHusbandry
AgriculturalEngineering
Philippines Agriculture Agribusiness/ Agribusiness Management
Food Technology
Agricultural Technology
Agricultural Engineering

83AnnaFlorescaF.Abrinaet.al
Table C.4. Percentage of graduate-respondents with modal characteristics, regional and total.
RegionMean Age
Percentage of Respondents with Modal Characteristic
AgeMaritalStatus
Household Size
Regional Origin
Father’sOccupation
Mother’s Occupation
Income
21 to 25
SingleMore than 5
Rural
Farmer, Forestry Worker,
Fisherman
Not employedLess than
50,000
RegionIRegionIIRegionIIIRegionVRegionVIRegionVIIRegionVIIIRegionIXRegionXCARAGA
25.5325.6226.4925.3925.5927.9326.4925.7825.0826.31
63.1736.46a
76.0741.05a
62.5017.82a
65.2642.31a
27.56a
74.31
78.6069.1970.7879.0180.5768.0072.3872.7176.4766.67
54.2452.7946.8752.4950.0042.7146.9846.6251.9649.32
84.9690.9173.5861.6887.6448.50b
87.6266.5073.5368.99
52.1265.6645.4634.9757.1037.7042.7047.4738.3051.33
63.3636.8756.2648.0063.7639.1853.3343.2941.4160.09
71.6159.5242.5564.4864.9547.5056.3558.3530.6958.47
Philippines 26.04 52.19 73.99 49.15 76.02 47.34 54.12 56.96
Notes:aModefortheregionis26to30;bModefortheregionisurban.
Table C.5. Distribution of graduate-respondents by level of study, in percent, regional and total.
RegionAssociate degree (two-year degree)
Baccalaureate (four or five-year degree)
Graduate Diploma or Certificate
Masters PhD
RegionIRegionIIRegionIIIRegionVRegionVIRegionVIIRegionVIIIRegionIXRegionXCARAGA
0.006.220.735.625.980.507.309.890.002.02
98.0973.0690.0579.7991.9890.5091.4378.8887.2587.64
0.0015.034.46
12.302.047.500.63
10.799.809.66
1.485.702.382.280.001.500.630.452.940.67
0.420.002.380.000.000.000.000.000.000.00
Philippines 4.10 88.10 5.82 1.45 0.53

84 Higher Education in Agriculture: Trends, Prospects, and Policy Directions
Table C.6. Top five AFNR degree programs by number of graduate-respondents, regional and total.
Region First Second Third Fourth Fifth
RegionI
RegionII
RegionIII
RegionV
RegionVI
RegionVII
RegionVIII
RegionIX
RegionX
CARAGA
Agriculture
Agriculture
Agriculture
Fisheries
Agriculture
Agriculture
Agriculture
Agriculture
Agriculture
AgriculturalTechnology
AgriculturalEducationAgriculturalTechnology
FoodTechnology
Agriculture
AgriculturalTechnologyAgriculturalTechnology
Agribusiness/AgribusinessManagementAgriculturalEducation
AgriculturalEducation
EnvironmentalScience/Mgt
Fisheries
Agribusiness/AgribusinessManagementAgriculturalTechnologyAgriculturalTechnologyFisheries
RubberProduction
AgriculturalTechnology
FoodTechnology
EnvironmentalScience/Mgt
Agriculture
AgriculturalEngineeringAgriculturalEngineering
AnimalHusbandry
AgriculturalEducationForestry
Forestry
Fisheries
Agribusiness/AgribusinessManagementAgriculturalEngineering
Agro-Forestry
DevelopmentCommunicationDevelopmentCommunication
AgriculturalEducationAgriculturalEngineeringAgriculturalEducationAgribusiness/AgribusinessManagementAgriculturalEducation
AgriculturalTechnology
Agribusiness/AgribusinessManagement
Philippines AgricultureAgricultural Technology
Agricultural Education
FisheriesAgribusiness / Agribusiness Management
Table C.7. Distribution of employed graduate-respondents by status of employment, in percentage, regional and total.
Region Regular/ Permanent Temporary Casual Contractual Self-Employed
RegionIRegionIIRegionIIIRegionVRegionVIRegionVIIRegionVIIIRegionIXRegionXCARAGA
33.8534.3343.3227.9330.2018.9031.0724.8136.7624.82
14.1513.439.54
10.3715.488.54
16.7112.2125.006.03
10.463.739.108.51
18.0214.639.40
17.944.41
18.44
37.8533.5829.6636.7028.6828.6626.6332.8227.9437.23
3.6914.938.37
16.497.61
29.2716.1912.215.88
13.48
Philippines 32.10 12.15 11.93 31.93 11.89

85AnnaFlorescaF.Abrinaet.al
Table C.8. Distribution of graduate-respondents by current salary range, in percentage, regional and total.
RegionBelow
PHP5,000.00
PHP5,000.00 to less than
PHP10,000.00
PHP10,000.00 to less than
PHP15,000.00
PHP15,000.00 to less than
PHP20,000.00
PHP20,000.00 to less than
PHP25,000.00
PHP25,000.00and above
RegionIRegionIIRegionIIIRegionVRegionVIRegionVIIRegionVIIIRegionIXRegionXCARAGA
33.5524.1811.2729.9737.3338.0530.7241.9217.1928.40
43.7539.5644.6150.1647.4140.7140.8539.9051.5649.79
17.1127.4727.7814.6612.2613.2719.6115.6620.3115.64
2.966.597.843.582.720.886.212.027.813.70
1.642.205.560.650.003.541.310.001.561.23
0.990.002.940.980.273.541.310.511.561.23
Philippines 27.72 45.07 18.96 4.68 2.11 1.46
Table C.9. Top business sectors by number of self-employed graduate-respondents, in percentage, regional and total.
Region Exporter Importer Wholesale RetailManufacturer/
producerService
RegionIRegionIIRegionIIIRegionVRegionVIRegionVIIRegionVIIIRegionIXRegionXCARAGA
0.008.111.751.456.670.000.005.170.000.00
0.000.000.000.000.002.270.000.000.001.64
28.0016.2215.798.706.67
18.189.38
13.790.003.28
12.0027.0335.0950.7233.3331.8253.1334.4850.0057.38
28.0018.9221.0510.1430.0018.1815.6313.7933.3318.03
32.0029.7326.3228.9923.3329.5521.8832.7616.6719.67
Philippines 2.22 0.44 11.97 40.80 17.96 26.61
Table C.10. Selected responses of graduate-respondents on reason for unemployment, in percentage of all respondents, regional and total.
RegionFurther studies
FamilyRsponsibility
Lack ofself-confidence
Chose notto work
Not interestedto work
Health problem
All Reasons
RegionIRegionIIRegionIIIRegionVRegionVIRegionVIIRegionVIIIRegionIXRegionXCARAGA
0.647.955.285.811.490.503.498.370.001.58
8.9010.237.25
12.1511.284.009.52
14.256.867.47
1.912.271.042.644.763.002.064.072.942.49
1.481.141.551.232.041.002.863.173.920.90
0.420.000.410.701.091.000.632.260.981.13
0.852.271.041.060.681.001.751.360.001.13
14.1923.8616.5823.5921.3310.5020.3233.4814.7114.71
Philippines 3.78 9.57 2.62 1.86 0.85 1.12 19.80

86 Higher Education in Agriculture: Trends, Prospects, and Policy Directions
Figure C.1. Distribution of student-respondents by gender, in percentage, regional and total.
FEMALE
MALE
0.00
10.00
20.00
30.00
40.00
50.00
60.00
RegionIIRegionI
RegionIII
RegionV
RegionVI
RegionVII
RegionVIII
RegionIXRegionX
RegionXI
RegionXII
CARAGA
PHILIPPINES
70.00
46.3
4
36.5
8
49.0
8 53.2
7
45.4
8
37.5
9
62.2
4
54.8
9
50.7
8
48.3
6
61.6
6
52.1
6
50.0
6
53.6
6
63.4
2
50.9
2
46.7
3 54.5
2 62.4
1
37.7
6 45.1
1 49.2
2
51.6
4
38.3
4
47.8
4
49.9
4
Figure C.2. Distribution of student-respondents by type of secondary school, in percentage, regional and total.
PRIVATE
PUBLIC
SPECIALSCIENCE
0.00
10.00
20.00
30.00
40.00
50.00
60.00
RegionIIRegionI
RegionIII
RegionV
RegionVI
RegionVII
RegionVIII
RegionIXRegionX
RegionXI
RegionXII
CARAGA
PHILIPPINES
70.00
80.00
90.00
100.00
16.1
2
10.4
6
27.3
4
8.12 10
.16
10.9
1
33.7
6
16.7
8
18.5
2
9.35
17.9
2
20.1
6
24.6
3
0.41
0.63 3.
61
0.25
0.00
0.63 2.
84
0.33
0.00
0.79 1.543.83
0.74
83.4
7 88.9
1
69.0
5
91.6
2
89.8
4
88.4
6
63.4
0
82.8
9
81.4
8 89.8
6
80.5
4
76.0
1
74.6
3

87AnnaFlorescaF.Abrinaet.al
Figure C.4. Distribution of graduate-respondents by gender, in percentage, regional and total.
FEMALE
MALE
0.00
10.00
20.00
30.00
40.00
50.00
60.00
RegionIIRegionI
RegionIII
RegionV
RegionVI
RegionVII
RegionVIII
RegionIXRegionX
CARAGA
PHILIPPINES
70.00
55.7
2
56.4
8
50.5
3
50.4
8
53.4
5
47.0
6 50.5
6
51.2
2
48.1
0
39.0
0
41.7
9
44.2
8
43.5
2 49.4
7
49.5
2
46.5
5 52.9
4
49.4
4
48.7
8
51.9
0
61.0
0
58.2
1
LOCAL
VISITOR
0.00
20.00
40.00
60.00
80.00
100.00
RegionIIRegionI
RegionIII
RegionV
RegionVI
RegionVII
RegionVIII
RegionIXRegionX
RegionXI
RegionXII
CARAGA
PHILIPPINES
120.00
9.0.
43 97.6
2
79.2
8
97.8
6
95.9
4
92.7
8
67.0
7
94.0
8
93.4
2
86.5
4 93.4
5
88.5
5
84.5
9
9.57
2.38
20.7
2
2.14 4.06 7.
22
32.9
3
5.92 6.58 13
.46
6.55 11
.45
15.4
1
Figure C.3. Distribution of student-respondents by home region-school region match, in percent, regional and total.

88 Higher Education in Agriculture: Trends, Prospects, and Policy Directions
Figure C.5. Distribution of graduate-respondents by home region-school region match, in percent, regional and total.
LOCAL
VISITOR
0.00
20.00
40.00
60.00
80.00
100.00
RegionIIRegionI
RegionIII
RegionV
RegionVI
RegionVII
RegionVIII
RegionIXRegionX
CARAGA
PHILIPPINES
120.00
93.0
1
95.9
6
90.8
8 98.0
7
97.2
8
96.0
0
94.6
0
95.8
4
82.3
5
97.0
8
94.7
2
6.99
4.04 9.
12
1.93 2.72 4.00 5.40
4.16
17.6
5
2.92 5.28
Figure C.6. Distribution of graduate-respondents by type of college, in percentage, regional and total.
PrivateUniversity/College
StateUnivesity/College
0.00 0.50 1.66
0.53
0.00
26.0
0
0.00
0.00
0.00 1.53
0.98
100.
00
99.5
0
98.3
4
99.4
7
100.
00
74.0
0
100.
00
100.
00
99.0
2
100.
00
98.4
7
RegionIIRegionI
RegionIII
RegionV
RegionVI
RegionVII
RegionVIII
RegionIXRegionX
CARAGA
PHILIPPINES0.00
20.00
40.00
60.00
80.00
100.00
120.00

89AnnaFlorescaF.Abrinaet.al
Figure C.7. Distribution of graduate-respondents by employment status, in percentage, regional and total.
EMPLOYED
NOTEMPLOYED
0.00
10.00
20.00
30.00
40.00
50.00
60.00
70.00
RegionIIRegionI
RegionIII
RegionV
RegionVI
RegionVII
RegionVIII
RegionIXRegionX
CARAGA
PHILIPPINES
80.00
90.00
68.8
6
55.6
8
71.0
9
52.9
9
55.3
0
81.5
0
59.2
1
48.4
2
63.7
3
57.2
4
60.9
5
31.1
4
44.3
2
28.9
1
47.0
1
44.7
0
18.5
0
40.7
9
51.5
8
36.2
7 42.7
6
39.0
5


Projecting the supply and demandfor AFNR human resources
4Chapter
Anna Floresca F. Abrina, Jaimie Kim B. Arias, Jose V. Camacho,and U-Primo E. Rodriguez
OverviewEconomic theory suggests that formal education is a productive investment in human capital, an important determinant of economic growth (Schultz, 1971; Becker, 1975). Education is deemed to increase the productivity and efficiency of the work force, thereby facilitating higher output, and consequently stimulating economic growth. At the micro-level, investment in education increases the potential for employment and enhances earnings of individuals (Mincer 1958). However, Ayara (2002, as cited in Olaniyan and Okemakinde, 2008) argued that investments in education may not necessarily translate to positive impacts on the economy if: 1) educational capital goes into socially unproductive activities; 2) the education system fails to provide adequate skills; and, 3) there is slow growth in the demand for educated labor. Babalola (2003, as cited in Olaniyan and Okemakinde, 2008) further emphasized that, while the shortage of educated people might limit growth, excess supply can create unemployment, which also hinders growth and development.
Hence, it is important to take stock of the current state and future capacity of human capital in AFNR and to assess the demand of the private and government sectors for AFNR human resource. This information would make it possible to reasonably assess whether concerns over the decline in AFNR enrollment are warranted. More importantly, it will assist policymakers in making informed decisions with regard to educational management and human resource development planning in the AFNR sector.
Toward this end, a projection of the human resource requirements for AFNR personnel and the identification of gaps or future surpluses or shortages in the AFNR labor market were generated using a model of demand and supply for the AFNR workforce.

92 Higher Education in Agriculture: Trends, Prospects, and Policy Directions
This chapter is organized into five sections. Section 1 highlights literature on labor theory, labor market model estimations and the AFNR labor market, in particular. Section 2 discusses the relevant results of the survey of business firms. Section 3 focuses on the construction of the projection model for estimating the demand and supply of AFNR graduates as well as the model estimates and simulation results. Section 4 discusses the results of the simulations done to assess the impact of policy interventions in the AFNR labor market. Section 5 concludes and presents policy recommendations.
The labor marketTheory of demand and supply for laborAnalyzing the demand for human resources entails examining the factors that affect the hiring decisions of firms or industries. The demand for inputs, including labor, can be looked upon as a derived demand. The decision of a firm to hire labor is directly related to its desire to maximize profits (Nicholson 2002). The relevant variables that enter into the demand equation include input prices and output. Under diminishing marginal product for labor, the derived labor demand function is shown to be downward sloping, i.e., an increase in wages reduces quantity demanded for labor.
The negative relationship between quantity demanded for labor and wage rates comes from two sources: substitution and scale effects. The substitution effect of a wage increase implies that labor has become more expensive compared to other factors. The scale effect, on the other hand, involves a more elaborate chain of effects. An increase in the wage of labor implies higher average and marginal cost of production, causing an increase in output price. This reduces quantity demand for output, in turn reducing inputs, including labor (Ehrenberg and Smith, 2008).
The market supply curve for labor, on the other hand, is upward sloping which means that quantity supplied is positively related to the wage, for the following reasons: (1) an increase in the wage encourages workers to work more hours; and, (2) individuals not currently in the labor force may be enticed to participate in the labor market. In the context of multiple types of labor, changes in the wage in other labor markets may be treated as supply shifters (Ehrenberg and Smith 2008).
Related to the analysis of labor supply for a specific sector is the analysis of education and career decisions. From an economic perspective, this entails looking at the mechanics and workings of markets as they affect curriculum or degree choices. Basically, individuals are assumed to choose among occupations and make supply decisions by comparing net benefits for relevant alternatives (Huffman and Orazem, 1985).
Economic literature is rich in theories and models that try to explain this decision process. Thompson, et.al, (1994) categorized these theories into two broad classes. The first class posits that individuals invest in education in

93AnnaFlorescaF.Abrinaet.al
order to accumulate human capital, hence, improve their productivity. On the other hand, the second class argues that individuals acquire education merely to signal employers that they have innate productive abilities. However, such education does not actually contribute to improving the individual’s productivity.
The first class, which is dubbed as the human capital theory, has gained prominence in the field of labor economics. One of the pioneer researchers in this field is Mincer (1973). He suggested that education adds to an individual’s marginal product which increases net earnings over the working life cycle and that educational choice is influenced by two factors: expected earnings (or salaries) and the cost of obtaining education. Similarly, Kodde and Ritzen (1984, as cited in Thompson et al., 1994) explained educational decisions using a household production function (HPF) based upon Gary Becker’s model (Becker, 1964). The approach incorporates both consumption and production motives in explaining decisions of individuals to acquire education. The model also asserts that the demand for education is affected by the direct cost and opportunity cost (foregone income) of education. Numerous empirical studies have been done relating to this field (see Fiorito and Dauffenbach 1982; Berger, 1988; Dolton 1990; Ehrenberg 1992).
Labor market supply and demand modelsQuantitative methods for projecting the demand for and supply of human resources can be categorized into two general approaches: the requirement-type or fixed coefficient model and the market equilibrium model. Requirement type models employ fixed coefficient extrapolations to project demand and/or supply while the market equilibrium models use a more comprehensive framework wherein wages simultaneously equilibrate market demand and supply.
In requirement-type models, either trend ratios are extrapolated from time series data or parameters are treated as constants. More sophisticated demand analysis employs input-output modeling and regression techniques. The input-output model posits that output is a function of final demand. It is based on the assumption that the final demand for goods and services is the driving force in the economy. However, as Huffman and Connor (1986) pointed out, several limitations are inherent in the application of this method. First, the demand for and supply of labor services are assumed to be unresponsive to expected wage and the cost of acquiring education. Second, input-output ratios are inflexible to changes in relative prices. Lastly, policy insights are quite limited since projections derived from this approach ignore interactions and feedbacks among economic phenomena. Nonetheless, because of the advantage of the manpower requirements model in providing information on labor demand/supply in highly disaggregated occupations, the approach has been widely used in empirical work (e.g., Harmon 1971; Drummond and White 1974; Freeman 1976). Moreover, Freeman (1980)

94 Higher Education in Agriculture: Trends, Prospects, and Policy Directions
asserted that the fixed coefficient model may be adequate at explaining changes in demand if changes in wages have moderate effects on demand.
To partially address its shortcomings, modifications in the manpower requirements model have been undertaken. One example is the work of Freeman (1980) which incorporated wage changes in the labor market model (Augmented Manpower Requirements Model). Similarly, Borghans and Heijke (1996) incorporated the substitution process in the labor market.
There is one study conducted in the Philippines which used the manpower requirements model to project the demand and supply for health workers (Reyes and Picazo 1990). To project the future supply of health workers, the study conducted a simple extrapolation of historical growth rates of health personnel in the country. Health manpower needs (demand), on the other hand, were estimated using a standardized physician to population ratio, which was determined based on internationally accepted standards and from professional judgments.
For the market type model, labor market decisions reflect responsiveness to economic incentives. One of the pioneering works in applying such models was done by Freeman (1976), wherein he analyzed the determinants of supply and starting salaries of new engineers. The study applied a cobweb model which highlights the relatively fixed time delay between the decision to enroll in a course and entrance into the labor market. The model assumes that supply depends upon past conditions of salary rates while salaries are dependent on present conditions of labor supply and demand. The variables used in the study were: enrollment statistics, actual and expected salaries in the chosen field, actual and expected salaries in alternative fields, number of graduates, and sectoral/industry output. The study revealed that the own-salary elasticity of supply of engineers is about 2 percent in the short-run and 4 percent in the long-run. It also showed that the supply of engineers is highly responsive to other economic conditions such as the state of the market, or R&D, output of durable goods, and number of graduates.
Hansen et al. (1980) also used the market model to explain the role of wages in bringing about PhD labor market adjustments. In the study, PhD supply elasticities were estimated. Results showed that the own-salary supply elasticity of PhDs in the academe was about 0.5 percent while the cross-salary elasticity was near unity in absolute terms. In addition, federal non-defense expenditures and state and local expenditures were shown to have positive influences on government demand.
Labor market studies in the AFNR sectorThere is a dearth of literature on the modeling of the Philippine AFNR labor market. As such, this section is devoted to foreign researches conducted on the subject matter. There have been studies which were undertaken to determine demand for agriculture manpower. In the United States (US), Drummond and White (1974) estimated the manpower requirements for agriculture using an

95AnnaFlorescaF.Abrinaet.al
input-output framework. A study by Peterson (1992) assessed the demand for agriculture experiment station personnel using panel data regression analysis. It was found that the demand for experiment station personnel is positively affected by relative output and total population.
Huffman and Orazem (1985), on the other hand, analyzed both the demand and supply situation in the field of Agricultural Economics. Benefits, costs and control variables were included in the supply model, particularly the total number of graduate student positions with financial assistance, departmental wage rates for graduate students, university tuition rates, national average wage rates for accountants (as proxy for alternative wages), state net farm income (proxy for income foregone), national average wage rates for assistant professors, and the number of faculty members with the position of assistant professor or higher (proxy for quality of education). For the demand model, the explanatory variables include the departmental wage rate for graduate assistants, national average wage rate for assistant professors, total state agricultural extension expenditures, total state experiment station expenditures, total state personnel income, total state net farm income, and the departmental number of agricultural economics undergraduate students. Results of the study showed that graduate enrollment and number of PhDs are highly sensitive to changes in expected costs and returns, while the most important demand shifter for both graduate students and faculty is state nonfarm income.
Several studies have also been undertaken to look at the demand for AFNR-related education. Thompson et al., (1994) studied the drop in demand for agriculture and natural resource science education in the US. They used the following explanatory variables in the model: direct cost of education; annual starting salary of AFNR graduates; annual starting salaries of graduates in engineering, social sciences and biophysical sciences (as proxy for opportunity cost); net farm income; local price or shadow price of AFNR education; and, other control variables (number of US farms, farm sector GNP and farm sector employment). Using a household production function and the Mincerian human capital framework, the analysis showed that the demand for AFNR education is affected more by changes in opportunity costs rather than by direct costs and starting salaries.
Similarly, Blank (1998) examined the trends in US agricultural economics education programs. The main findings of his study are as follows. First, undergraduate enrollments in agricultural economics departments have declined over the study period while graduate enrollments have remained remarkably stable. Second, women represented an increasing percentage of majors in agricultural economics. Third, the declining farm population in the US led to an increased percentage of foreign students. Fourth, undergraduate programs in agricultural economics have moved toward agribusiness curricula. Fifth, graduate programs focused primarily on traditional agricultural economics and/or economics topics

96 Higher Education in Agriculture: Trends, Prospects, and Policy Directions
but there has been a significant shift toward resource/environmental economics. Finally, there was a notable decrease in the average number of faculty positions in the program.
Most of these studies formed the basis of the construction of the projection model and the necessary dataset for the simulations. However, before proceeding to that discussion, a short description of the conduct and key results of the survey of business firms, one source of the data, is presented.
Survey of business firmsAlthough this research largely utilized secondary data from various sources, it also employed primary data collected by the UPLB INSTAT from a national survey of business firms in order to provide firm-level information about the demand of the private sector for AFNR services. The survey generated panel data from 2006 to 2008 of 500 private firms, proportionally sampled following the industrial categorization used by and the geographical distribution reflected in the database of the NSO (see Annex A for a distribution of sample). The firms included in the sample represented the industries of: AFF; Manufacturing and Food (MF), Manufacturing Non-Food (MNF); Wholesale and Retail (WR); Hotel and Restaurant (HR); and, Other Industries (O).
The information collected include firm characteristics, personnel and salary profile, hiring strategies, industry job outlook, skills and competencies requirement for AFNR personnel, and AFNR human resource requirements (see Annex B for a copy of the questionnaire). Firm characteristics include basic information about the nature of business, main activities of the firm and year of establishment. Under personnel and salary profile, the number of personnel disaggregated according to field of tertiary study (AFNR vs. Non-AFNR) are included, as well as the starting and average salaries of AFNR and Non-AFNR personnel. For the skills and competencies requirements, variables established by Litzenberg and Schneider (1987) were used. Specifically, firms were asked to rank 51 characteristics under 4 skill categories according to level of importance (1-not important, 2-somewhat important, 3-moderately important, 4-important, 5-very important). The categories cover business and economics competencies (20 questions); computer, quantitative, and management information skills (8 questions); technical skills (14 questions); and communication skills (9 questions). Note that only 56 firms in the sample hired AFNR graduates.
Total and industry employmentTable 1 shows that, on the average, only about 22 percent of total employment in the business firms represents job positions that require college degrees. This proportion goes down to 2 percent when considering the proportion of total employment which represents job positions that require AFNR college degrees. As expected, the share of AFNR college positions to total employment is highest

97AnnaFlorescaF.Abrinaet.al
in the AFF sector, equivalent to about 9 percent. The Manufacturing sector has an AFNR college position requirement of 1 percent, while this proportion is close to nil for the rest of the economy.
The survey results also indicate that the percentage share of college graduate employees to total employment significantly exceeds the percentage share of job positions requiring college graduates. This trend also holds true for AFNR employment but to a lesser degree. This suggests that firms may be hiring workers who are “overqualified”.
Only about 40 percent of employees with AFNR college degrees actually occupy positions that require a background or training in AFNR-related skills. This implies that there could be a “job mismatch” wherein AFNR graduates are occupying positions not requiring AFNR training. A further implication of this could be that some AFNR positions are unfilled or that some AFNR employees have been promoted to managerial positions. The proportion of employees with AFNR degrees occupying AFNR positions (1.2%) is lower than the proportion of total positions that require AFNR degrees (1.7%).
The characteristics of firms that hire AFNR graduates were also obtained from the survey. Of the 500 total firms, only about 11 percent or 56 hired personnel with AFNR-related degrees. More than half of this number came from the AFF Sector, 27 percent from MF, about 11 percent from MNF, and only about 5 percent account for the remaining sectors. It is interesting though that less than half of the firms belonging to the AFF Sector are employing AFNR graduates. In the Manufacturing-Food sector, a lower proportion (about 29%) employ AFNR graduates, while, in MNF, this ratio further goes down to 11 percent. For the rest of the firms, only about 1 percent employ personnel with AFNR degrees (Table 2).
Majority of firms hiring AFNR personnel offer a starting salary, at 2008 prices, of less than PHP 20,000.00 for AFNR graduates (88%), about 44 percent pay less than PHP 10,000.00 while the other 44 percent pay between PHP 10,000.00 and PHP 19,999.00. The trend for college degree holders, in general, is less skewed
Table 1. Summary of survey of establishments 2006-2008 (% of total employment).
Source:INSTAT SurveyNote:AFF–Agriculture,FisheryandForestry;MF–Manufacturing,Food;MNF–Manufacturing,Non-Food; HR–HotelandRestaurant;WR–WholesaleandRetail;O–OtherIndustries*This represents about 39% of all AFNR graduates.**Thisrepresents61%ofallAFNRgraduates.
Indicator AFF M WR HR O ALL
PositionsthatrequireabachelordegreePositionsthatrequireanAFNRdegreeEmployeeswithbachelordegreesEmployeeswithbachelordegreesinAFNRcoursesAFNRgraduatesoccupyingAFNRpositionsAFNRgraduatesnotoccupyingAFNRpositions
10.99.3
25.110.76.24.5
6.31.2
24.93.712.7
11.70.1
22.80.20.10.1
21.40.0
28.10.40.00.4
58.20.0
59.80.00.00
22.31.7
34.03.11.21.9

98 Higher Education in Agriculture: Trends, Prospects, and Policy Directions
toward low starting pay. In fact, a higher proportion (25%) of firms pay higher than PHP20,000.00 as a starting pay. Table 3 summarizes these results.
In terms of actual amounts, Table 4 shows that the highest average starting salary for AFNR graduates is offered in sectors that are not major employers of AFNR graduates, particularly HR, WR, and O. This may imply that firms belonging to these industries are hiring graduates with specialized skills, hence, the wage premium. Another striking pattern is that, for firms that hire AFNR personnel, the average starting salary of AFNR graduates is significantly higher than that of college graduates in general and the salary difference is much greater in firms belonging to the AFF sector. This may also imply that technical skills offered by AFNR graduates in the AFF sector are specialized which warrants a wage premium.
With regard to additional benefits and compensation, Figure 1 shows that only about 75 percent of the firms hiring AFNR graduates provide 13th month pay, vacation, sick, and maternity leave benefits. About 68 percent provide health care insurance and separation pay. A small proportion offer additional non-mandatory benefits such as allowances for representation, transportation, cost of living, housing, food, and rice.
Job outlook and methods of recruitment of firms that hire AFNR graduatesPerceptions about the job prospects and the outlook for the firms in the next five years were also elicited from the respondents (Table 5). The majority (43%) signified that the job prospects in their industries will be good. Thirty-eight percent are more optimistic, 18 percent are more neutral while only 2 percent are pessimistic about the future.
When asked where the opportunity for increased employment would emanate from, majority of the firms signified that the economic growth of the country, in general, will be a very important driving force (Table 6).
In terms of recruitment methods, it was found that firms prefer hiring new employees via referrals from family or friends (Figure 2). This suggests that social networks play a big role in the employment and hiring decisions of firms. Half of the firms that hire AFNR graduates also revealed that they publish job vacancy announcements through print media, while a third indicated that they acquire the services of job placement agencies and they participate in school
Indicator AFF MF MNF WR HR O Total
No.offirmshiringAFNRgraduates%Sharetototalno.offirmshiringAFNR%Sharetototalnumberoffirmspersector
325747
152729
61111
122
121
121
56100
11
Table 2. Distribution of firms hiring AFNR graduates, 2009.
Source:INSTAT SurveyNote:AFF–Agriculture,FisheryandForestry;MF–Manufacturing,Food;MNF–Manufacturing,Non-Food; HR–HotelandRestaurant;WR–WholesaleandRetail;O–OtherIndustries

99AnnaFlorescaF.Abrinaet.al
Table 3. Distribution of employees according to average starting salaries (pesos).
Average Starting Salary of Employees
Employees with AFNR Degree Employees with College Degree
No. of Firms % of Firms No. of Firms % of Firms
<10,00010,000-19,99920,000-29,99930,000-39,99940,000-50,000
2424222
4444444
1724822
31441544
Source:INSTAT Survey
Item AFF MF MNF HR, WR & O All Industries
StartingSalariesAFNRgraduatesCollegegraduates
12,9208,329
14,41213,628
9,4057,434
15,92912,390
13,0289,935
CurrentSalariesAFNRgraduatesCollegegraduates
15,12311,008
15,92917,421
12,34811,682
20,95115,929
15,29413,124
Table 4. Salaries of graduates, in firms with AFNR graduates, 2006-2008 (pesos, 2008 prices).
Source: INSTAT SurveyNote: AFF – Agriculture, Fishery and Forestry; MF – Manufacturing, Food; MNF – Manufacturing, Non-Food; HR – Hotel and Restaurant; WR – Wholesale and Retail; O – Other Industries
Figure 1. Share of firms employing AFNR graduates offering additional benefits (%).
Source:INSTAT Survey

100 Higher Education in Agriculture: Trends, Prospects, and Policy Directions
job fairs. About 20 percent answered that they publish announcements in their company website and coordinate with government employment agencies, while less than 10 percent indicated utilizing the broadcast media, possibly due to the high cost that it entails.
Rating Share of Firms
PoorFairGoodVerygoodExcellent
21843362
Table 5. Firms’ rating of job prospects (%).
Source:INSTAT Survey
Degree of importance
Economic Growth
Potentialfor Business
Growth
Growth of AFNR Sector
Adoptionof New Tech
International Investments
Retirement Resignation
NotimportantSomewhatModerateImportantVeryimportant
4-
133246
24
235018
49
293914
-2
304321
41829387
14383452
14304352
Total 100 100 100 100 100 100 100
Table 6. Firms’ rating of factors that affect job prospects (%).
Source:INSTAT Survey
Figure 2. Method of recruitment of firms hiring AFNR graduates (%).
Source:INSTAT Survey

101AnnaFlorescaF.Abrinaet.al
AFNR skills and competency requirement and evaluationOf all the skills categories, technical skills received the highest mean rating, followed by communication skills, business and economics skills, and lastly computer, quantitative and management information skills (see Annex C for mean rating and overall ranking of skills required of AFNR graduates). The top five specific skills which received the highest mean rating include: (1) food science and processing technology skills, (2) listening skills and ability to carry out instructions; (3) ability to communicate instructions; (4) ability to identify objectives and goals; and (5) livestock production skills. Finance and accounting skills were rated lowest on average.
Under technical skills, firms indicated that food science and processing, livestock production systems, and natural resource management are the most important technical skills that AFNR graduates should be well-equipped with. For communication skills, firms accord the highest importance toward the ability of AFNR graduates to listen to and give clear and concise instructions. While under the business and economics skills, only the ability to identify objectives and goals for the company was given an important-rating by the firms. All specific skills under computer, quantitative and management information category were given a moderate rating.
The survey also revealed that most firms believe that technical skills and computer skills are best learnt in school, while most of the specific communication skills and business skills can be best learnt on the job.
The projection modelAll data gathering efforts (see Annex D) were conducted to provide inputs for the construction of a model that is capable of generating five to ten year projections in the market for AFNR graduates. It should be able to explain the sources of the supply and demand for graduates as well as potential employment trends.
Structure of the modelFigure 3 describes the structure of the projection model. It shows that the model captures the relationships among the variables to project demand and supply in the AFNR labor market. It is important to note that the market here is defined as services for which AFNR-related skills are required, and that such services are confined to workers that have a college degree. Moreover, equilibrium was not imposed in the model to allow for the estimation of potential shortages or surpluses in the AFNR labor market.
The figure shows the different sources of demand and supply for the market for AFNR graduates. Total demand is the sum of the quantities of AFNR graduates that all industries want to hire. The two major sources of the demand for AFNR graduates are industry and government/academe. Academe covers only SUCs, since they are the primary provider of AFNR education. Industry is a general

102 Higher Education in Agriculture: Trends, Prospects, and Policy Directions
term which refers to all activities outside of government and the academe, and is disaggregated into five sectors, namely: Agriculture, Manufacturing, HR, WR, and O (rest of the economy). Thus, the industries in the Philippine economy are grouped into six general categories of industries.
The model recognizes that AFNR graduates are also hired by industries for tasks that are not directly related to the training that the graduates received in school, This is captured by the disaggregation between AFNR graduates that are hired for AFNR positions and for non-AFNR positions in each industry, The presence of the latter provides a loose notion of job mismatch in which the skills acquired in school are not directly used by the graduate.
Supply is represented by the AFNR workforce, or the quantity of AFNR graduates who are working or actively seeking work. It excludes AFNR graduates who have either retired or are not seeking employment. The AFNR workforce (total supply of AFNR graduates) is either unemployed or employed in the various industries (total demand for AFNR graduates). Hence, the model can be described by a stock adjustment equation wherein for a certain time period t, the workforce is equal to the value of the workforce in the previous period plus new AFNR graduates who have decided to join the workforce less AFNR graduates who retired during the period.
The model is summarized by 10 equation blocks (Annex E). This may be classified as four blocks of behavioral equations and six blocks of identities. Four of the identities allow the model to generate estimates of the demand for AFNR graduates as a whole (Equation 1), by industry (Equation 2), and by positions (Equations 3 and 4). The remaining identities are used for estimating the AFNR workforce (Equation 5) and unemployment (Equation 10). The four behavioral
Figure 3. The labor market for AFNR graduates.
DEMANDFORAFNRGRADUATES SUPPLYOFAFNRGRADUATES
InAgriculture: • ForAFNRpositions • ForNon-AFNRpositions
InManufacturing: • ForAFNRpositions • ForNon-AFNRpositions
InHotelRestaurant: • ForAFNRpositions • ForNon-AFNRpositions
InWholesaleandRetail: • ForAFNRpositions • ForNon-AFNRpositions
InOtherIndustry: • ForAFNRpositions • ForNon-AFNRpositions
InGovernment/SUC: • ForAFNRpositions • ForNon-AFNRpositions
TOTALDEMANDFORAFNR
GRADUATES
UnemployedAFNRGradautes
MARKETFORAFNR
GRADUATES
NotParticipatingintheLaborForce
ParticipatingintheLaborForce
AFNRWORKFORCE
Retirement
AFNRGRADUATES

103AnnaFlorescaF.Abrinaet.al
equations explain the industry demand for AFNR graduates in AFNR positions (Equation 6), industry demand for AFNR graduates in non-AFNR positions (Equation 7), supply of fresh AFNR graduates (Equation 8), and retirements of AFNR graduates by industry (Equation 9).
The demand for AFNR graduates (Equations 6 and 7 in Annex 5) is assumed to be a function of relative wages and industry employment. The formulation is in the spirit of the manpower requirements (Harmon, 1971; Drummond and White, 1974; Mullendore and Ziegler, 1975; Freeman, 1980) and augmented manpower requirement models (Freeman, 1980; Borghans and Heijke, 1996) of labor demand. In the current setting, higher industry employment leads to higher demand for AFNR graduates. On the other hand, an increase in the wage rate of AFNR graduates relative to those of other courses is specified to have a negative impact on demand.
On the other hand, the supply of fresh AFNR graduates is assumed to be determined by freshmen enrollment in AFNR courses (with a four-year lag), current and lagged wages of AFNR and non-AFNR graduates, direct cost of education and the ratio of farm to nonfarm incomes. The introduction of lagged freshmen enrolment is based on the recursive cobweb model of Freeman (1976). The idea is that the potential size of graduates of a course in any given year is dependent on the number of freshmen who entered the program. The inclusion of current and lagged wages of AFNR graduates and non-AFNR graduates were based on the work of Thompson, Capps and Massey (1994) and Freeman (1976). The explanation is that higher current and lagged wages of AFNR graduates are likely to entice more students to enroll or to increase the likelihood that existing students will remain in AFNR courses. This in turn leads to more graduates of AFNR courses. Wages rates of non-AFNR courses are likely to have the opposite effect.
The ratio of farm to nonfarm incomes was based on the analysis of the influence of direct and opportunity costs as well as the potential effects of these relative incomes on the demand for undergraduate education in agricultural sciences recognized by Thompson et al. (1994). Farm income could be used to express the general level of disposable income available to AFNR students coming from rural families while nonfarm income could be used to reflect the fact that AFNR students increasingly come from urban areas. The ratio of these incomes is used to reflect the relative economic health of the two sectors. The inclusion of wage expectations was borrowed from the analysis of Hansen et al. (1980).
Retirements are formulated as a fixed proportion of industry employment. Ideally, this should account for the age-structure of the AFNR graduates. However, such information is not available. Hence, the formulation can be viewed as a compromise which also gets around the issue of early retirements.

104 Higher Education in Agriculture: Trends, Prospects, and Policy Directions
The model is solved using the Generalized Algebraic Modeling System (GAMS), which generates projections of demand and supply for AFNR graduates from 2006 to 2020. The difference in the estimated supply and demand represents the AFNR graduates’ unemployment.
Baseline dataTable 7 shows the estimated dataset for 2005, the base year of the model. It indicates the total demand and supply (workforce) of AFNR graduates. It also shows the estimated number of unemployed AFNR graduates and a breakdown of employment by industry.
The dataset reveals three important points regarding the market for AFNR graduates in 2005. First, the estimates indicate that nearly two-thirds (= 334.0/495.5) of the employed AFNR graduates are occupying AFNR positions. Ignoring ANFR graduates that might have been promoted to managerial positions, this is indicative of the extent of job-mismatch in the workplace.
Second, the AFF sector is the destination of more than four in five (= 417.7/495.5) AFNR graduates that are employed. This point highlights the importance of the sector as an employer of AFNR graduates.
Third, at least a fifth (= 146.1/641.7) of AFNR graduates in the workforce are unemployed. At first glance, this figure is a cause for concern since it is nearly three times as much as the unemployment rate for the entire country. However, this finding must be interpreted with caution because the NCPAG survey only covered graduates who finished tertiary education within five years of the survey. In other words, it is possible that these estimates are higher than
Table 7. Base year employment data.
Item ‘000 persons
DemandforAFNRgraduatesinNon-AFNRpositionsAFNRpositionsAllpositions
161.51334.02495.53
AFNRgraduatesWorkforceUnemployedFreshAFNRgraduatesRetirementsofAFNRgraduates
641.67146.1412.722.59
EmploymentbyindustryAgriculture/Fishery/ForestryManufacturingHotelsWholesale/RetailtradeGovernmentandSUCSOthers
417.6546.171.424.40
24.910.97
Source:INSTAT Survey.

105AnnaFlorescaF.Abrinaet.al
the actual unemployment rate for all AFNR graduates. In addition, as a study by Alburo and Abella (2002) cites, surveys conducted by the then DECS in 1994 and 1997 found that the unemployment rate of tertiary graduates of 1991 and 1995 in the Philippines reached 24.01 percent and 30.34 percent, respectively, such that the result of the NCPAG survey should not be surprising.
Moreover, the unemployment duration or time spent in job search has been shown to lengthen when there is weak aggregate demand for the type of skill or discipline. Psacharopoulos (1982) reported that for the Philippines, agriculture graduates have lower absorption rates (--%) whereas law, physical science, liberal arts and business graduates had the higher absorption rate in excess of 90 percent. There is a greater possibility that the incidence of high unemployment is due to technological progress. Given rapid technological progress, the relative cost of recruiting a worker whose training cost is higher (e.g., unskilled and/or old workers) increases. Thus, the supply of jobs available to these workers decreases, thereby increasing their length of time for job search or of being unemployed (Baumol and Wolff, 1998; as cited by Toshihiko and Sahin, 2004).
Base case scenarioThe base case scenario is a solution to the model from 2005 to 2020 using historical growth rates for the exogenous variables. This solution provides the projections of the model. It is also useful as a point of comparison for all model experiments.
However, before estimating results for this base case scenario, specific numerical values are needed for the parameters of the four behavioral equations. A discussion of the procedures used in the parameterization to obtain these values is presented in Annex F while the estimates obtained from this parameterization are presented in Annexes G and H.
Table 8 shows the growth rates of the exogenous variables that were used in generating the base case scenario. Most of the values were derived from data provided in the NSCB 2008 Philippine Statistical Yearbook (employment data) and the ASE of the NSO (wages and ratio of farm to nonfarm income). As direct information was not available, the growth of the total enrolment in AFNR courses in SUCs was used as a proxy for the growth of freshmen enrolment. The base case scenario also assumes that the direct cost of education is constant over the simulation period.
Simulation results of base case scenarioKey results using the baseline data are presented in Table 9. It summarizes the projected average annual growth rates of the endogenous variables in the base case scenario. It indicates that the demand for AFNR graduates is projected to grow sluggishly (0.4% p.a.) over the simulation period. Among the different sources of demand, the demand for AFNR graduates in non-AFNR positions is projected to grow faster than the demand for AFNR graduates in AFNR positions. The finding

106 Higher Education in Agriculture: Trends, Prospects, and Policy Directions
that the growth rate of the AFNR workforce (1.0% p.a.) is expected to grow faster than demand explains the relatively rapid growth of unemployed AFNR graduates (2.6% p.a.). The number of fresh AFNR graduates is also projected to contract at an average annual rate of 1.9 percent over the simulation period.
The simulation results raise four important points. First, the projected decline in the number of fresh AFNR graduates is inconsistent with recent trends which show a 1.6 percent annual growth in AFNR graduates from SY 1999/2000 to SY 2007/2008 (NCPAG survey). This is explained mostly by the assumption that the number of AFNR freshmen are projected to contract in the base case. Second, the workforce is projected to grow despite the negative growth of AFNR graduates. The reason is that AFNR graduates, even if these are declining, still represent additions to the workforce. It also suggests that the additions to the workforce (due to new graduates) still outweigh the number of retirements.
Third, despite the relatively fast growth of the demand for graduates in non-AFNR positions, trends in total demand are still heavily influenced by the growth
Item Growth (%)
SectoralemploymentAgriculture/Fishery/ForestryManufacturingHotelsWholesale/RetailtradeGovernment&SUCSOthers
FreshmenenrollmentWagerateinnon-agripositionsWagerateinagripositionsRatiooffarmtononfarmincomesCostofeducation
1.400.903.205.300.506.50
-3.500.600.30
-1.550.00
Table 8. Baseline growth rates of exogenous variables (%).
Table 9. Baseline average growth rates, 2010-2020 (%).
Variable Growth
Demand for AFNR graduatesNon-AFNRpositionsAFNRpositionsAllpositions
0.700.260.41
AFNR graduatesWorkforceUnemployedFreshAFNRgraduatesRetirements
1.002.56
-1.890.42
*Detailed(year-by-year)resultsareprovidedinAnnexE.

107AnnaFlorescaF.Abrinaet.al
of the demand for AFNR positions. The reason is the relatively high initial share of the latter in total employment. Fourth, the increase in the unemployment rate is a cause for concern. The projected negative growth rate of fresh AFNR graduates suggests the weakness of demand to absorb new entrants to the workforce. As a result, the unemployment rate among AFNR graduates is projected to rise from about a 22.8 percent in 2005 to 30.1 percent in 2020 (Figure 4).
Industry-specific results suggest that fastest growth rates in the demand for AFNR graduates are in the service sectors (Table 9). The demand from the AFF sector is expected to grow a relatively slow pace (0.42%). Since this sector is the most significant employer of AFNR graduates (84.4%), the AFF sector explains the low rate of growth in the demand for AFNR graduates.
Policy scenariosThe preceding section describes the key results from the baseline scenario. This section analyzes the impacts of changes in some of the critical exogenous variables.
Eight scenarios/experiments were implemented using the model. These were designed to illustrate the properties of the model in capturing the possible impacts of policy initiatives and other events on the market for AFNR graduates. It is important to note that the magnitudes or sizes of the shocks were arbitrarily chosen. Hence, the insights generated from the experiments matter more than the actual magnitudes of the impacts.
Figure 4. Projected unemployment of AFNR graduates, baseline scenario (%).

108 Higher Education in Agriculture: Trends, Prospects, and Policy Directions
The experiments implemented in the model were: Experiment 1: 10 percent increase in the cost of education. This experiment
can represent a policy implemented by authorities in the education sector. It could be in the form of: (a) a decline in the subsidies received by AFNR students; (b) an increase in tuition fees; or (c) a decline in the value of scholarships provided to students, etc.
Experiment 2: 10 percent decrease in the cost of education. This is the exact opposite of Experiment 1.
Experiment 3: The wage rate of non-AFNR graduates grows at a rate that is 1 percent faster than the base case. To illustrate, the growth rate of this variable in the base case was 0.6 percent p.a. (Table 8). Under the experiment, this variable is going to grow at 1.6 percent p.a. (= 0.6% + 1%). This experiment represents a change that is beyond the control of the education authorities. It may be due to events in the labor markets such as an increase in minimum wages, tax cuts specific to non-AFNR graduates, etc.
Experiment 4: The wage rate of AFNR graduates grows at a rate that is 1 percent faster than the base case. This experiment represents an event that is beyond the control of the education authorities.
Experiment 5: The number of freshmen entering AFNR courses grows at a rate that is 1 percent faster than the base case. This may be due to an active policy of education authorities to attract high school graduates to AFNR programs. It may also be due to an external event which makes such courses more attractive to high school graduates.
Experiment 6: Employment in the AFF sector grows at a rate that is 1 percent faster than the base case. This experiment represents an event that is beyond the control of the education authorities.
Experiment 7: Employment in all sectors (read: the entire economy) grows at a rate that is 1 percent faster than the base case. This experiment is an event that is beyond the control of the education authorities. Compared with Experiment 6, this is designed to show the importance of the AFF sector in affecting the market for AFNR graduates.
Experiment 8: Employment in the AFF sector and the wage rate of AFNR graduates grow at rates that are 1 percent and 0.5 percent faster than the base case, respectively. This is a combination of Experiments 3 and 6, implying a rightward

109AnnaFlorescaF.Abrinaet.al
shift in the demand for labor. It is designed to capture the possibility that the increase in labor demand from the AFFy sector is likely to cause an increase in the wage rate of AFNR graduates.
Note that Experiments 1 and 2 represent levels increases, that is, higher values of the exogenous variables with the growth rates of the variables remaining the same over time. The remaining experiments represent changes in the growth rates, that is, faster growth. The following discussion highlights some of the key findings.
Levels increase: experiments 1 and 2 Figure 5 summarizes some of the key impacts of Experiments 1 and 2. For Experiment 1, the model projects that the average number of fresh AFNR graduates will grow 21.2 percent slower than the base case. The reason is that higher costs of education make it more expensive for students to enroll in AFNR courses. Fewer AFNR graduates mean fewer entrants to the workforce (negative growth). Since the costs of education do not affect the demand for AFNR graduates in the model, the declining workforce translates to falling unemployment rates among AFNR graduates. For reasons that should be patently obvious, the impacts under Experiment 2 are the exact opposite of those found in Experiment 1.
The results from Experiments 1 and 2 have an important implication with respect to policies in the market for AFNR graduates. If current trends continue and projections in the base case hold, then attempts to reduce the direct cost of education in AFNR courses are likely to exacerbate the unemployment problem
Figure 5. Difference from baseline, 2010-2020 by experiment, percentage points.

110 Higher Education in Agriculture: Trends, Prospects, and Policy Directions
among AFNR graduates in the future. The model projects that a 10 percent decline in the cost of education is expected to raise unemployment among AFNR graduates by about 2 percentage points in the year 2020 (see Experiment 2 in Figure 6).
Faster growth: experiments 3 to 8 Figure 7 summarizes the growth rates of the demand for AFNR graduates under Experiments 3 to 8. It indicates that the demand for AFNR graduates is projected to grow (0.2% p.a.) at a pace that is slower than the base case (0.4% p.a.) if the wage rate of AFNR graduates is rising faster (Experiment 4). In contrast, demand is likely to grow faster than the base case when wage rates of non-AFNR graduates (Experiment 3) and/or sectoral and total employment (Experiments 6 and 7)
Figure 6. Difference from baseline unemployment rate of AFNR graduates in 2020, by experiment, in percentage points.
Figure 7. Average annual growth of demand for AFNR graduates 2010-2020 (%), by experiment (baseline growth rate = 0.41%)

111AnnaFlorescaF.Abrinaet.al
have higher growth rates. These findings are all consistent with formulations in Equations 6 and 7, where the demands for the AFNR graduates are negatively related to relative wages and positively related to sectoral employment.
There are two points worth noting about the results. First, the small difference in growth rates between Experiments 6 and 7 reflects the importance of employment growth in the AFF sector in the AFNR sector. It implies that growth in the other sectors of the economy only have marginal impacts on the employment of AFNR graduates. Second, the faster growth of demand in Experiment 8 means that the impact of faster growth in agricultural employment is stronger than the faster growth of wages among AFNR graduates. The direction of the impact could of course be different if the growth of wages is higher.
Figure 8 summarizes the growth rates of the supply (workforce) of AFNR graduates under Experiments 3 to 8. It indicates that faster growth of wage rates among non-AFNR graduates (Experiment 1) and AFNR graduates (Experiment 2) have contrasting impacts on the supply of graduates. The reason for this is that the former serves as an incentive for fresh high school graduates to enroll in and existing AFNR students to shift towards non-AFNR courses. The latter has the opposite effect. Since higher employment growth in the agricultural sector (Experiment 6) has no impact on the supply of graduates in the model, the projected faster growth of supply in Experiment 8 is driven solely by the higher growth rate of wages among AFNR graduates.
Figure 9 shows the net impacts of the changes in the growth of supply and demand on unemployment. It shows that the growth of unemployment is expected to be slower with faster growth in the wage rates of non-AFNR graduates
Figure 8. Average growth of supply of AFNR graduates 2010-2020 (%), by experiment (baseline growth rate = 1.00%)

112 Higher Education in Agriculture: Trends, Prospects, and Policy Directions
(Experiment 3) and employment growth in the sectors (Experiments 6 and 7). In the case of Experiment 3, this is due to the combined impacts of faster growth in the demand for and the slower growth in the supply of AFNR graduates. Since supply is unaffected in Experiments 6 and 7, the slower growth of unemployment under these scenarios is solely due to the enhanced demand for AFNR graduates. In contrast, faster unemployment growth is projected for Experiments 4 and 8. In Experiment 4, this is due to slower growth in demand and faster growth in supply. On the other hand, the impacts on Experiment 8 merely reflect the relative strengths of the impacts in Experiments 4 and 6.
Sensitivity analysisUncertainties associated with the availability of data make it necessary to conduct a sensitivity analysis on two crucial variables; namely, the growth rate of AFNR freshmen and initial unemployment rate.
The study did not find estimates for the growth rate of AFNR freshmen, a key variable that determines trends in AFNR graduates. In the base case, the decision adopted in the study was to use the annual growth rate of AFNR enrolment from SY 2000-2001 to SY 2007-2008 as a proxy. This growth rate was negative (-3.5% p.a.) and it eventually led to a growth rate of AFNR graduates that was also negative in the base case. This result was inconsistent with actual trends which show that AFNR graduates grew by an average of 1.6 percent p.a. between SY 1999-2000 and SY 2007-2008 (NCPAG Survey). To examine the potential shortcomings arising from the assumption adopted, two other growth rates for AFNR freshmen were explored in the study.
Figure 9. Average growth of unemployment, 2010-2020 (%), baseline growth = 2.56%.

113AnnaFlorescaF.Abrinaet.al
The first estimate extracts the number of new students from the enrollment data of the NCPAG dataset. Computed as the difference between enrollments over two periods, this variable had a rather optimistic average annual growth rate of 6.3 percent p.a. from SY 2001-2002 to SY 2007-2008. In the simulations, it generated an average growth rate for AFNR graduates of 0.88 percent, which is closer to the actual rate observed from SY 1999-2000 to SY 2007-2008. With the supply of graduates growing faster over the simulation period, the projected unemployment for 2020 under this scenario was 33.4 percent. This is higher than the 30.1 percent unemployment rate reported for the same year in the base case.
The second estimate is a more pessimistic scenario. It uses the growth rate of enrollment from SY 2005-2006 to SY 2007-2008 only, or a growth rate of -11.7 percent. As expected the growth of the workforce was lower under this scenario. Moreover, the unemployment rate in 2020 was projected to be 27.5 percent. This is lower than the estimate in the base case for the same year but still more than five percentage points higher than the unemployment rate for 2005.
The results of the analyses above suggest that the value used for the growth of freshmen has an impact on projected values of the unemployment rate. However, it does not appear to have had a significant effect on the projected trend that unemployment among AFNR graduates is going to rise over time.
Another concern in the model is the initial unemployment rate (22.8%). This was generated from the NCPAG Survey which only examined employment patterns among AFNR graduates who finished schooling within five years of the survey. Since it is possible that older graduates have more responsibilities in life and are more active in searching for jobs, it is not difficult to imagine that the true unemployment rate among AFNR graduates is lower than this estimate. To account for this possibility, an experiment was conducted using an unemployment rate that is only about two times larger (14.8%) than the national unemployment rate of 7.4 percent for 2005 (NSCB 2008).
Projected unemployment rates are shown in Figure 9. It indicates that the unemployment rate in 2020 is going to be significantly lower under the experiment above. While this result is not surprising, the point remains that the unemployment rate is still projected to rise between 2005 and 2020.
Conclusions and recommendationsThe major conclusion of this study is that there are bleak prospects for graduates of AFNR courses in paid employment. This is based on the substantial increase in projected unemployment in the next 10 years. Since freshmen employment was assumed to be declining over the simulation period, the primary source of this result is weak demand. Moreover, reversing this result requires an expansion in the agricultural sector that is very large, especially when taken in the context of its recent performance.

114 Higher Education in Agriculture: Trends, Prospects, and Policy Directions
The recommendations of this study are as follows. First, any further expansion in AFNR programs and enrollment should be reconsidered. Based on the results of the study, such initiatives are more likely to raise the number of unemployed graduates in the future. For similar reasons, the second recommendation is to carefully re-evaluate proposals to further subsidize, be it directly or indirectly, AFNR programs. This is especially the case if such initiatives encourage further entry of students to AFNR courses. Third, strengthening the quality of training and perhaps the more aggressive marketing of graduates in the workplace may raise the employability of AFNR students. However, pursuing this objective requires taking cognizance of the finding in this study that the source of the problem is weak demand. While outside the purview of the key decisionmakers in the education sector, policies and initiatives to promote a more robust growth of the agricultural sector are essential to reducing the projected burden of unemployment among AFNR graduates. However, bold changes might be needed given the magnitude of the expansion that is required.
This study is and should be viewed as a first attempt at modeling the market for AFNR graduates. Some of the potential extensions or revisions to the model are as follows. First, a finer disaggregation of the AFNR courses and job opportunities will strengthen the ability of the model to provide more specific recommendations. It will especially help in identifying potential growth areas which could guide the design of AFNR courses. Second, establishing a stronger linkage between unemployment and wages, perhaps in the spirit of the Phillips curve, will also help complete the key elements of the supply and demand model. Third, generating econometrically estimated parameters of the key coefficients and equations will also strengthen the ability of the model in making projections. It must be noted that the limitations raised above were initially considered in the construction of the model. However, the lack and, in many instances, absence of reliable time series data made it very difficult to integrate these elements with an acceptable degree of confidence. Hence, essential for any modeling exercise and any other research effort for that matter, in the future is the need for the key agencies to establish and institutionalize a reliable system for collecting and compiling relevant data for the AFNR sector. Supporting research on the different components of the market will also be important in establishing the key relationships among the different variables.
ReferencesAyara, N.N. 2002. The paradox of education and economic growth in Nigeria: an empirical
evidence. Selected papers for the 2002 Annual Conference.Nigerian Economic So-ciety (NES) Ibadan. Polygraphics Ventures Ltd.
Alburo, F.A. and D.I. Abella. 2002. Skilled labour migration from developing countries: study on the Philippines. International Migration Papers 51, International Migra-tion Programme, International Labour Office, Geneva.

115AnnaFlorescaF.Abrinaet.al
Babalola, J.B. 2003. Budget preparation and expenditure control in education in Basic text in educational planning edited by J.B. Babalola. Ibadan Awemark Industrial Printers.
Baumol, W.J. and E.N. Wolff. 1998. Speed of technical progress and length of the average interjob period. Jarome Levy Economics Institute Working Paper, 237.
Becker, G.S. 1964. Human capital. National Bureau of Economic Research General Series No. 80.
Becker, G.S. 1975. Human capital: a theoretical and empirical analysis, with special refer-ence to education. 2nd ed. New York: Columbia University Press for NBER.
Berger, M. 1988. Predicted future earnings and choice of college major. Industrial and Labor Relations Review, 41(3):418-429.
Blank, S. 1998. A decade of decline and evolution in agricultural economics enrollments and programs, 1985-96. Review of Agricultural Economics 20(1):155-167.
Borghans, L and H. Heijke. 1996. Forecasting the educational structure of occupations: a manpower requirement approach with substitution. Labor, 10(1):151-92.
Commission on Higher Education. Statistical Bulletin AY 2004-2005.Dolton, P. 1990. The economics of UK teacher supply: the graduate’s decision. The Economic
Journal, 100 (400):91-104.Drummond, H.E. and F. White. 1974. A predictive model for manpower requirements in
Georgia agriculture. Southern Journal of Agricultural Economics, 6(1):199-204. Ehrenberg, R. and R. Smith. 2008. Modern labor economics:
theory and public policy. Pearson Addison-Wessley.Ehrenberg, R. 1992. The flow of new doctorates. Journal of Economic Literature, 30(2):830-
875.Fiorito, J. and R. Dauffenbach. 1982. Market and nonmarket influences on curriculum
choice by college students. Industrial and Labor Relations Review, 36(1):88-101.Freeman, R. 1975. Supply and starting salary adjustments to the changing science man-
power market: physics 1948-73. American Economic Review, 65(1):27-38.Freeman, R. 1976. A cobweb model of the supply and starting salary of new engineers. In-
dustrial and Labor Relations Review, 29(2): 236-248.Freeman, R. 1980. An empirical analysis of the fixed coefficient ‘Manpower Requirements’
model, 1960-1970. NBER Working Papers 0315. National Bureau of Economic Re-search, Inc.
Hansen, W., H. Newburger, , F. Schroeder, D. Stapleton, and. D. Youngday. 1980. Fore-casting the market for new Ph.D. economists. The American Economic Review, 70(1):49-63.
Harmon, L. 1971. The supply of economists in the 1970’s. The American Economic Re-view, 61(2):311-315.
Huffman, W. and L. Connor. 1986. A perspective on the market for agricultural econom-ists: background, trends, and issues. North Central Journal of Agricultural Eco-nomics, 8 (2):189- 207.

116 Higher Education in Agriculture: Trends, Prospects, and Policy Directions
Huffman, W. and P. Orazem. 1985. An econometric model of the market for new Ph.D. in agricultural economics in the United States. American Journal of Agricultural Economics, 67(5):1207-1214.
Kodde, D.A., and J.M.M. Ritzen. 1984. Integrating consumption and investment motives in a neoclassical model of demand for education, Kyklos, 37(4):598-608.
Landis, F. and J. Svetska. 1983. The demand for engineers -- projections through 1987. Management Science, 29(4):455-464.
Litzenberg,K. and V. Schneider. 1987. Competencies and qualities of agricultural econom-ics graduates sought by agribusiness employers. American Journal of Agricul-tural Economics, 69(5):1031-1036.
Mincer, J. 1958. Investment in human capital and personal income distribution. Journal of Political Economy 66.
———. 1973. Schooling, experience, and earnings. New York: National Bureau of Eco-nomic Research.
Mukoyama, T. and A.Sahin. 2004. Why did the average duration of unemployment become so much longer? Working Papers 04002. Concordia University, Department of Economics.[online] http://economics.concordia.ca/documents/ working_paper-s/04002tm.pdf.
Mullendore, W. and L. Ziegler. 1975. Forecasting regional manpower requirements: in-put-output vs BLS regression techniques. Journal of Regional Analysis and Policy, 1(1):66-75.
Nicholson, W. 2002. Microeconomic theory-basic principles and extensions. Singapore: Thomson Learning Inc.
Olaniyan, D. and T. Okemakinde. 2008. Human capital theory: implications for educa-tional development. European Journal of Scientific Research, 24(2):157-162.
Peterson, W. 1992. Is the demand for experiment station personnel declining? Review of Agricultural Economics, 14(1):55-64.
Psacharopoulos, G. 1982. The economics of higher education in developing countries. Comp. Educ. Rev., 26:139-59.
Reyes, E. and O. Picazzo. 1990. Health manpower requirement and productivity in the Phil-ippines. PIDS Working Paper 90 (19). Makati, Philippines: Philippine Institute of Development Studies. [online] http://dirp4.pids.gov.ph/ris/wp/ pidswp9019.pdf.
Schultz, T. 1971. Investment in human capital: the role of education and of research. New York: Free Press.
Thompson, R., O. Capps, and J. Massey. 1994. Demand for an undergraduate educa-tion in the agricultural sciences. American Journal of Agricultural Economics, 76(2):303-312.

117AnnaFlorescaF.Abrinaet.al
Annexes
Annex A. Distribution of firms by industry and by area, INSTAT Survey.
The INSTAT survey of business firms was conducted to provide firm-level information about the demand of the private sector for AFNR services. As shown in Table A.1, a random sampling of 500 firms was undertaken representing the following industries: AFF, MF, MNF, WR, HR, and O.
In terms of geographical distribution, Table A.2 shows that 27 percent of the respondent firms came from NCR, 35 percent from North Luzon, 24 percent Calabarzon, 8 percent Central Visayas, 7 percent Davao.
Table A.1. Distribution of firm respondents by industry.
Industry No. of Respondents Share in Total (%)
Agriculture,FisheryandForestryManufacturing(Food)Manufacturing(Non-Food)Wholesale&RetailHotel&RestaurantOthers*Total
68515656
18980
500
141011113816
100
*MiningandQuarrying,Energy,GasandWater,Construction,Transportation,StorageandCommunications,andFinancialIntermediation,RealEstateandOtherBusinessServices.
Area Number of Firm Respondents Percentage Share (%)
NCRNorthLuzonCalabarzonCentralVisayasDavao
1341731194133
27352487
Table A.2. Distribution of firm respondents by area.

118 Higher Education in Agriculture: Trends, Prospects, and Policy Directions
A. Basic Information about Business Establishment
1. Registeredcompanyname:___________________________________________________
2. Businessaddress:_________________________________________________________________________
3. Yearstartedoperation:_____
4a.Mainactivity:___________________________
4b.Provideabriefdescriptionofyourmajorproduct/sand/orservice/s:_________________________________
__________________________________________________________________________________________
5. Organizationalclassification: LocalForeignMultinational
6. Marketofproduct/sand/orservice/s:DomesticConsumptionExportBoth
7. Economicorganization:SingleestablishmentBranchonlyEstablishmentandMainofficeMainoffice
7a.Forbranchoffice: Addressofmainoffice: ___________________________________________________________
___________________________________________________________
7b.Formainoffice: Numberofbranches:__________
Annex B. Questionnaire for INSTAT Survey.
Policy Research on the State and Future Supply of and Demand for Agriculture, Forestry and Natural Resources (AFNR) Graduates in the Philippines:
Projecting the Supply and Demand Situation of AFNR Human Resources
This survey of establishments is being conducted to generate data which will be used formodelling thedemand forAFNRgraduates in theprivatesector. Yourparticipation in thisresearchwillhelpusgenerateusefulinformationwhichcanserveasbasisforAFNRhumanresourceplanninginthecountry. Restassuredthatall informationprovidedwillbeheld instrictCONFIDENTIALITYandshallbeusedsolelyforthepurposeofthestudy.
B. Respondent-Specific Attributes
Age:______ Position:_________________________________
No.ofyearsworkinginthecompany:________ No.ofyearsincurrentposition:_________
MaritalStatus:___________ HighestEducationalAttainment:_____________________

119AnnaFlorescaF.Abrinaet.al
BenefitsNature of Work
Managerial Administrative Technical Extension Research Sales
1.OvertimePay
2.PaidMaternityLeave
3.PaidVacationLeave
4.PaidSickLeave
5.RiceAllowance
6.FoodAllowance
7.HousingAllowance
8.HealthInsurance
9.CostofLivingAllowanceAllowance
10.TransportationAllowance
11.RepresentationAllowance
12.13th-MonthBonus
13.SeparationPay
14.Retirement/TerminalPay
15.Others,Specify_____________
C. Personnel Profile, Recruitment and Personnel Benefits
1. Totalnumberofpositions,onfull-timebasis,whichrequireBachelor’sDegree:______
2. Projectedtotalnumberofnewpositions,onfull-timebasis,whichrequireBachelor’sdegreewithinnext a.fiveyears(2009to2013):_________ b.tenyears(2009to2018):_________
3.ProjectedtotalnumberofpersonnelwithBachelor’sdegreewhowillberetiringwithintheperiod a.2009-2013:________ b.2009-2018:________
4.Pleasecheckwhichofthefollowingbenefitsarereceivedbyemployeesinvariousnaturesofworkinyourcompany.
5.Methodofrecruitmentofpersonnel.(Checkallthatapply)School/universityjobfairsPrintMedia(suchasnewspaper,magazine,etc)BroadcastMedia(suchastelevision,radio,etc)Governmentrecruitment/jobplacementagencyPrivaterecruitment/jobplacementagencyCompanywebsiteBillboards FamilyandfriendsOthers,pleasespecify:___________________________________________________
6.DoesyourcompanyemployAFNRgraduates?YesNo,pleaseproceedtoSection E
7.Totalnumberofpositions,onfull-timebasis,thatrequireBachelor’sDegreeinAFNRcourses:__________
8.Projectedtotalnumberofnewpositions,onfull-timebasis,whichrequireBachelor’sdegreeinAFNRcourseswithinnext
a.fiveyears(2009to2013):_________ b.tenyears(2009to2018):_________
9.ProjectedtotalnumberofpersonnelwithBachelor’sdegreeinAFNRcourseswhowillberetiringwithintheperioda.2009-2013:________ b.2009-2018:________

120 Higher Education in Agriculture: Trends, Prospects, and Policy Directions
D. Skill Requirements and Expectations from AFNR Graduates Communication Skill Expectations from AFNR Graduates
1. CommunicationSkillExpectationsfromAFNRGraduates
Skill
1.1RateeachskillaccordingtoperceivedimportancetoanAFNRgraduate1-not important 2-somewhat important 3-moderately important4-important 5-very important
1.2 Identifywhethereachskillisbestlearned:1 - “on the job” or 2 - “in school”
1.Listentoandcarryoutinstructions2.Giveclearandconciseinstructions3.Expresscreativeideasverbally4.Professionaltelephoneskills5.Expresscreativeideasinwriting6.Expresstechnicalinformationverbally7.Writetechnicalreports8.Listentoandsummarizeoralpresentations9.Understandtechnicalinformation10.Others:Pleasespecify:_______________
2. BusinessandEconomicsSkillsExpectationsfromAFNRGraduates
Skill
2.1 RateeachskillaccordingtoperceivedimportancetoanAFNRgraduate1-not important2-somewhat important 3-moderately important4-important 5-very important
2.2Identifywhethereachskillisbestlearned:1 - “on the job” or 2 - “in school”
1.Identificationsofobjectives/goals2.Keyperformanceareas3.Coordinatehuman/physicalresources4.Developbusinesspoliciesandprograms5.Readandusefinancialstatements6.Marketingadministration7.Identifyandmanagerisk8.Professionalsellingskills9.Humanresourceplanning10.Micro(firm)economics11.Understandaccountingconcepts12.Corporatefinance13.Philippineagricultural/naturalresourcepolicy14.Inventorymanagementsystems15.Organizationalstructure16.Processandproductlayout17.Macro(Philippineeconomics18.National/internationalpoliticaleffects19.Internationaltrade20.Internationaleconomics21.Others,pleasespecify

121AnnaFlorescaF.Abrinaet.al
3. TechnicalSkillExpectationsfromAFNRGraduates
Skill
3.1RateeachskillaccordingtoperceivedimportancetoanAFNRgraduate1-not important2-somewhat important 3-moderately important4-important 5-very important
3.2Identifywhethereachskillisbestlearned:1 - “on the job” or 2 - “in school”
1.Cropproductionsystems2.Foodtransportation/distribution3.Specializedcropproductionsystems4.Livestockproductionsystems5.Foodscienceandprocessingtechnology6.Engineeringtechnology7.Soilchemistryandcharacterization8.Bioscience,biotechnologyandbiochemistry9.Naturalresourcemanagement10.Aquaculture,mariculture,fishculture andmanagement11.Ecologyandpollution12.Populationdynamicsandtaxonomy13.Pathologyandparasitology14.Computercontrolledprocess15.Others
4.Computer,QuantitativeandManagementInformationSkillExpectationsfromAFNRGraduates
Skill
4.1RateeachskillaccordingtoperceivedimportancetoanAFNRgraduate1-not important2-somewhat important 3-moderately important4-important 5-very important
4.2Identifywhethereachskillisbestlearned:1 - “on the job” or 2 - “in school”
1.Usecomputersinmanagementdecisionmaking2.UseandInterpretmathematicalandstatisticalmethods3.Generalbusinesssoftware4.Computeraccountingsystems5.Usequantitativetechniquesfordecisionmaking6.Designandimplementmanagementinformationsystems7.Usegeographicalinformationsystem(GIS)8.Communicatewithprogrammers9.Others________________________

122 Higher Education in Agriculture: Trends, Prospects, and Policy Directions
5. RateeachofthefollowingworkexperienceaccordingtoperceivedimportancetoAFNRgraduates Usethescale: 1-not important 2-somewhat important 3-moderately important 4-important 5-very important
Previous Work Experience Rating Previous Work Experience Rating
1.Developingbusinessplan 6.Financialinstitution
2.Domesticagribusiness 7.Studentteachingassistant/part-timework
3.International/multinationalagribusinessfirm 8.Non-agriculturalretailfirm
4.Industryinternships/cooperativeworkstudy 9.Government/publicaffairs
5.Farm/ranchwork 10.Researchinstitutions
6. IdentifythetopsixtraitsmostdesiredinAFNRgraduatesaccordingtosignificance(1asmostdesired)______Self-motivated ______Candelegateresponsibilityandauthority______Haspositiveworkattitude ______Cantakeanddefendaposition______Hashighmoral/ethicalstandards ______Caneffectivelyselectandsuperviseemployees______Canworkwithothers/teamplayers ______Canrecognizebusinessopportunity______Canworkwithoutsupervision ______Canapplytechnicalskills______Self-confident ______Creative______Hasloyaltytoorganization ______Canworkundervariedconditions______Hasleadershipskills ______Others______________
7. AcademicQualifications7a. Listalltheuniversities/collegeswhereyourcurrentpersonnelwhoaretertiarygraduatesreceivedtheir
degrees.________________________________________________________________________________________________________________________________________________________________________________________________________________________________________________________________________________________________________________________________________________________
7b.Wouldyouprefertohiregraduatescomingfromaspecificuniversity/college?Yes,goto7c No,proceedtono.8 7c.Listthepreferreduniversities/colleges.
University/CollegeHaveyouundertakendirectrecruitmentactivities/job
fairsintheuniversitiesyoulisted?Putcheck(ü)ifyes.
1. 2. 3. 4. 5. 6. 7. 8. 9. 10.
8. AFNRPreparednessforwork8a. ThinkingabouttheAFNRpersonnelyourecruitedstraightoutofahighereducationinstitutioninthe
Philippines,inrelationtotheirpreparednessforwork,youwouldsaythattheywere,ingeneral:_____ Choosefrom: 1-verypoorlyprepared;2-poorlyprepared;3-wellprepared;4-verywellprepared Ifyouanswered1or2,proceedto#8b.Ifyouanswered3or4,pleaseproceedto#9.

123AnnaFlorescaF.Abrinaet.al
8b ThinkingabouttheAFNRpersonnelwhoare/werepoorlypreparedforthework,youwouldsaythattheyperformedpoorlybecauseof:
skillslimitations lackofworkexperienceworkattitude,motivationand/orpersonality
9. IsthereasurplusorshortageofAFNRpersonnelinyourindustry?________ Chooseamongthefollowing: 1-considerableshortage;2-someshortage;3-balanced;4-somesurplus;5-considerablesurplus
10. ArethereanyAFNR-relatedjobvacancies? No,proceedto11 Yes10a.Inwhatoccupationsdoyouhavevacancies?Pleaselistdownfiveoccupationswiththemostvacancies. _________________________________________________________________________
10b.Howmanyvacanciesdoyouhaveintheseoccupations?_________________
10c.Thesevacanciesarehardtofillbecausetheapplicantslack: theskillsyoulookfor(proceedto#10d) thequalificationsyoulookfor(goto#11) theworkexperienceyourequire(goto#11) workattitude,motivationand/orpersonality(goto#11)
10d.Whichofthefollowingskillshaveyoufoundapplicantsfortheaboveoccupationstobelacking? Communicationskillexpectations Businessandeconomicskills; Technicalskills Computer,quantitativeandmanagementinformationskills Previousworkexperience Personaltraitandpersonalskills
11. WouldyouregardyourAFNRpersonnelasbeingfullyproficientattheircurrentjob? Yes(proceedto#11d) No(proceedto#11a)
11a.ThinkingaboutyourcurrentAFNRpersonnelwhoarenotfullyproficient,which,ifany,ofthefollowingskillsdoyoufeelneedsimproving?
Communicationskills Businessandeconomicskills Technicalskills Computer,quantitativeandmanagementinformationskills Previousworkexperience Personaltraitandpersonalskills
11b.Doesthefactthatsomepersonnelarenotfullyproficientimpacttheperformanceofyourestablishment?Yes,proceedto#11c No,proceedto#11d
11c. Inwhatwaydoesthislackofproficiencyimpactyourestablishment? Lossofbusinessororderstocompetitors Delaysdevelopingnewproductsorservices Theneedtowithdrawfromofferingcertainproductsorservicesaltogether Difficultiesmeetingcustomerserviceobjectives Difficultiesmeetingrequiredqualitystandards Increasedoperating/runningcosts Difficultiesintroducingtechnologicalchange Difficultiesintroducingnewworkingpractices Other,pleasespecify:_______________________________________________
11d.HaveyoutakenanymeasurestoimprovetheproficiencyorskillsoftheseAFNRpersonnel? Yes,proceedto#11e No,proceedtosectionE
11e.Whichofthefollowinghaveyouundertaken? Increasedrecruitment Providedfurthertraining Changedworkpractices Relocatedworkwithintheagency Expandedrecruitmentchannels Increased/expandedtraineeprograms Recruitedfromoverseas Other,pleasespecify:____________________ Don’tknow

124 Higher Education in Agriculture: Trends, Prospects, and Policy Directions
E. Perception on the factors that attract or will attract personnel to stay with the firm/company Pleasecheckthesignificanceofthefollowingfactorsinattractingpersonneltostaywiththefirm/company.
Factors1-Not
significant2-Slightly significant
3-Moderately Significant
4-Highly Significant
1. LevelOfSalary 2. Benefits(Food,HousingAllowance;HealthInsurance;
RetirementPlan) 3. CareerAndProfessionalGrowthOpportunities 4. EmploymentSecurity 5. Work/OfficeEnvironment 6. InterpersonalRelationshipWithManagementAnd
Co-Workers 7. BusinessOfficeLocation/DistanceFromHome 8. FamilyFriendlyOfficeLocation 9. TravelOpportunity 10.RelevanceOfAcademicDegreeWithNatureOfWork 11.ImageAndReputationOfTheFirm 12.Others,pleasespecify:_________________________
____________________________________________
F. Job Prospects and Outlook
1. Ratethejobprospectsfornewgraduatesinyourindustrythisyear(2009):___________ 1-poor;2-fair;3-good;4-verygood;5-excellent
2. Ratethejobprospectsfornewgraduatesinyourindustryinthenextfiveyears:____________ 1-poor;2-fair;3-good;4-verygood;5-excellent
3. Ratethefollowingfactorsastheyaffectjobopportunitiesinyoursectoraccordingtoimportance. Usethescale: 1-not important 2-somewhat important 3-moderately important 4-important 5-very important ______Growthoftheeconomy ______GrowthoftheAFNRsector ______Retirements ______Resignations ______Potentialfornewbusinessgrowth ______Adoptionofnewtechnology ______Internationalinvestments ______Others,pleasespecify
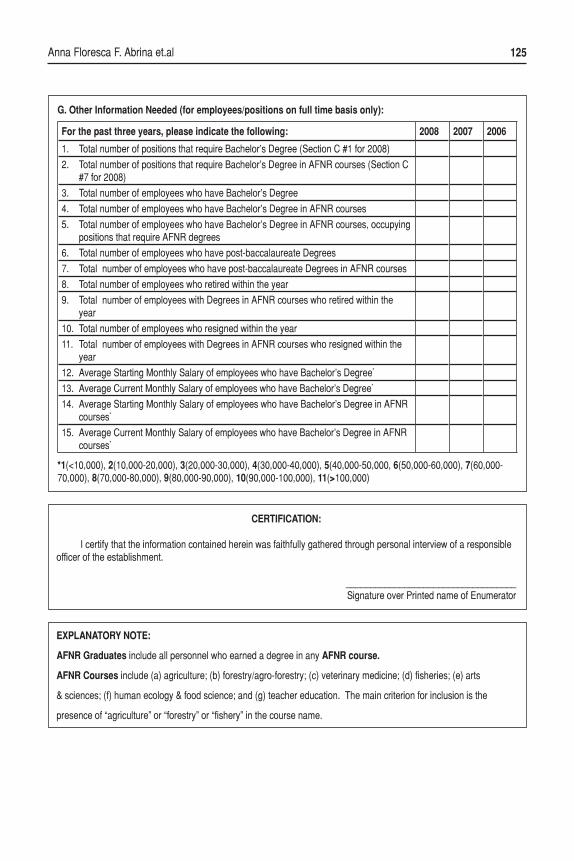
125AnnaFlorescaF.Abrinaet.al
G. Other Information Needed (for employees/positions on full time basis only):
*1(<10,000),2(10,000-20,000),3(20,000-30,000),4(30,000-40,000),5(40,000-50,000,6(50,000-60,000),7(60,000-70,000),8(70,000-80,000),9(80,000-90,000),10(90,000-100,000),11(>100,000)
For the past three years, please indicate the following: 2008 2007 2006
1. TotalnumberofpositionsthatrequireBachelor’sDegree(SectionC#1for2008) 2. TotalnumberofpositionsthatrequireBachelor’sDegreeinAFNRcourses(SectionC
#7for2008)
3. TotalnumberofemployeeswhohaveBachelor’sDegree 4. TotalnumberofemployeeswhohaveBachelor’sDegreeinAFNRcourses 5. TotalnumberofemployeeswhohaveBachelor’sDegreeinAFNRcourses,occupying
positionsthatrequireAFNRdegrees6. Totalnumberofemployeeswhohavepost-baccalaureateDegrees 7. Totalnumberofemployeeswhohavepost-baccalaureateDegreesinAFNRcourses 8. Totalnumberofemployeeswhoretiredwithintheyear 9. TotalnumberofemployeeswithDegreesinAFNRcourseswhoretiredwithinthe
year
10. Totalnumberofemployeeswhoresignedwithintheyear 11. TotalnumberofemployeeswithDegreesinAFNRcourseswhoresignedwithinthe
year
12. AverageStartingMonthlySalaryofemployeeswhohaveBachelor’sDegree* 13. AverageCurrentMonthlySalaryofemployeeswhohaveBachelor’sDegree* 14. AverageStartingMonthlySalaryofemployeeswhohaveBachelor’sDegreeinAFNR
courses*
15. AverageCurrentMonthlySalaryofemployeeswhohaveBachelor’sDegreeinAFNRcourses*
CERTIFICATION:
Icertifythattheinformationcontainedhereinwasfaithfullygatheredthroughpersonalinterviewofaresponsibleofficeroftheestablishment.
___________________________________SignatureoverPrintednameofEnumerator
EXPLANATORY NOTE:
AFNR GraduatesincludeallpersonnelwhoearnedadegreeinanyAFNR course.
AFNR Coursesinclude(a)agriculture;(b)forestry/agro-forestry;(c)veterinarymedicine;(d)fisheries;(e)arts
&sciences;(f)humanecology&foodscience;and(g)teachereducation.Themaincriterionforinclusionisthe
presenceof“agriculture”or“forestry”or“fishery”inthecoursename.

126 Higher Education in Agriculture: Trends, Prospects, and Policy Directions
Annex C. Mean rating and ranking of skills required for graduate,INSTAT Survey.
SkillsMean Rating
Standard Deviation
Overall Rank
Proportion which thinks that skill is best learned on the job (n=55)
Proportion which thinks that skill
is best learned in school (n=55)
Technical Skill Expectations from AFNR Graduates1. Foodscienceandprocessing
technology2. Livestockproductionsystems3. Naturalresourcemanagement4. Specializedcropproductionsystems5. Pathologyandparasitology6. Cropproductionsystems7. Bioscience,biotechnologyand
biochemistry8. Ecologyandpollution9. Foodtransportation/distribution10.Soilchemistryandcharacterization11.Engineeringtechnology12.Computercontrolledprocess13.Aquaculture,mariculture,fishculture
andmanagement14. PopulationdynamicsandtaxonomyAverage
4.95
4.174.003.983.963.953.93
3.913.843.843.733.603.52
3.513.92
0.80
0.900.880.990.791.110.96
0.930.940.980.890.831.00
0.92
1
56789
10
111414171922
23
26
3335389
3613
314715152728
1526
74
676562916487
695385857372
8574
Communication Skill Expectations from AFNR Graduates1. Listentoandcarryoutinstructions2. Giveclearandconciseinstructions3. Understandtechnicalinformation4. Expresstechnicalinformationverbally5. Writetechnicalreports6. Expresscreativeideasverbally7. Listentoandsummarizeoral
presentations8. Expresscreativeideasinwriting9. ProfessionaltelephoneskillsAverage
4.534.383.963.853.823.783.71
3.493.453.89
0.600.651.001.111.041.071.05
1.271.14
238
13151618
2425
84805164407860
588567
16204936602240
421533
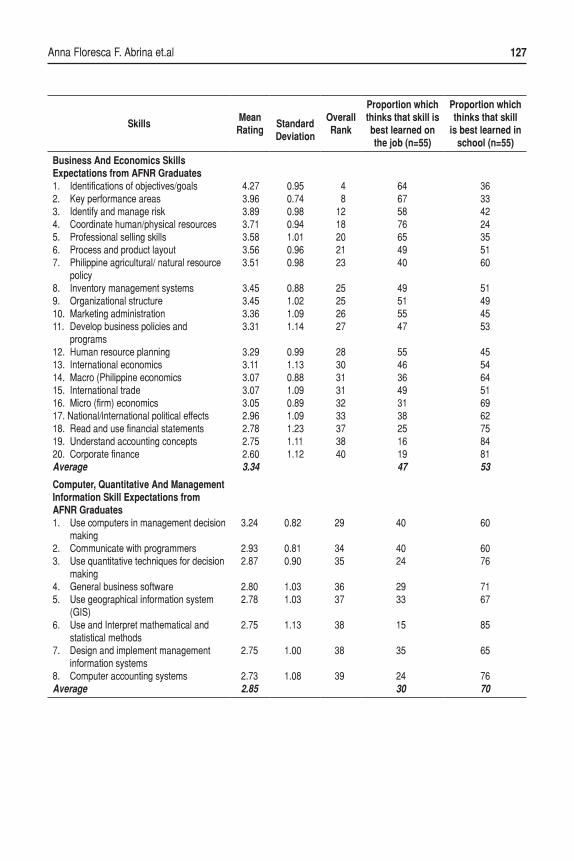
127AnnaFlorescaF.Abrinaet.al
SkillsMean Rating
Standard Deviation
Overall Rank
Proportion which thinks that skill is best learned on the job (n=55)
Proportion which thinks that skill
is best learned in school (n=55)
Business And Economics Skills Expectations from AFNR Graduates1. Identificationsofobjectives/goals2. Keyperformanceareas3. Identifyandmanagerisk4. Coordinatehuman/physicalresources5. Professionalsellingskills6. Processandproductlayout7. Philippineagricultural/naturalresource
policy8. Inventorymanagementsystems9. Organizationalstructure10.Marketingadministration11.Developbusinesspoliciesand
programs12.Humanresourceplanning13.Internationaleconomics14.Macro(Philippineeconomics15.Internationaltrade16.Micro(firm)economics17.National/internationalpoliticaleffects18.Readandusefinancialstatements19.Understandaccountingconcepts20.CorporatefinanceAverage
4.273.963.893.713.583.563.51
3.453.453.363.31
3.293.113.073.073.052.962.782.752.603.34
0.950.740.980.941.010.960.98
0.881.021.091.14
0.991.130.881.090.891.091.231.111.12
48
1218202123
25252627
283031313233373840
64675876654940
49515547
55463649313825161947
36334224355160
51494553
45546451696275848153
Computer, Quantitative And Management Information Skill Expectations from AFNR Graduates1. Usecomputersinmanagementdecision
making2. Communicatewithprogrammers3. Usequantitativetechniquesfordecision
making4. Generalbusinesssoftware5. Usegeographicalinformationsystem
(GIS)6. UseandInterpretmathematicaland
statisticalmethods7. Designandimplementmanagement
informationsystems8. ComputeraccountingsystemsAverage
3.24
2.932.87
2.802.78
2.75
2.75
2.732.85
0.82
0.810.90
1.031.03
1.13
1.00
1.08
29
3435
3637
38
38
39
40
4024
2933
15
35
2430
60
6076
7167
85
65
7670

128 Higher Education in Agriculture: Trends, Prospects, and Policy Directions
Annex D. Sources of secondary data and construction of data set
This research utilized secondary data collected from various sources. For the aggregate national level variables and indicators (Table D.1), data were gathered from the Civil Service Commission (CSC), CHED, DBM, DepEd, and the NSO. In addition, AFNR student information was collected from the NCPAG Tracer Study.
Owing much to the absence of time series information that is directly relevant to the modeling requirements, the strategy adopted in the construction of the dataset was to use a combination of secondary and survey data. Secondary data was useful as a source of aggregate values while survey data was critical for approximating the components of the aggregate values. Note that the baseline year used in this study is 2005 because some of the required data are unavailable in more recent years. The following briefly discusses the tedious undertaking of constructing the dataset.
The starting point for the construction of the dataset was the demand side of the model. This combined industry employment data from the Philippine Statistical Yearbook (NSCB, 2008) with information on the proportion of AFNR graduates occupying AFNR and non-AFNR positions in the industries. The latter of these two sets of data were obtained from two sources. For government and SUCs, the proportions were derived using information from the DBM on the number of filled technical positions in AFNR-related agencies and from the CHED on the number of SUC faculty in AFNR disciplines, respectively. On the other hand, the proportions for all the other industries in the model were calculated from the results of the INSTAT survey (Table D.2). The outcome of this exercise is a set of data representing national estimates of the number of AFNR graduates in AFNR and non-AFNR positions by industry. A summation of the values provides an estimate of the total number of AFNR graduates that are employed in the country. The INSTAT survey also had an estimate of the proportion of AFNR graduates
Table D.1. Sources of secondary aggregate data.
Data Sources
GovernmentandSUCEmploymentGovernmentandSUCAverageSalaryGovernmentandSUCAnnualBudgetPrivateFirmEmploymentandSalary
AggregateNationalEmploymentTertiaryEducationEnrollmentandGraduates
SecondaryEducationEnrollmentandGraduates
IncomeData(GDP,GVAA)UnemploymentData
DBMStaffingPattern,CivilServiceCommissionStatisticsDBMStaffingPattern,CivilServiceCommissionStatisticsDBMNationalExpenditureProgramNSOAnnualSurveyofEstablishment(ASE)/CensusPhilippineBusi-
nessandIndustry(CPBI)/AnnualSurveyofPhilippineBusinessandIndustry(ASPBI)
PhilippineStatisticalYearbook,LaborForceSurveyPhilippineStatisticalYearbook,PhilippinesinFiguresCommissionon
HigherEducationStatisticsPhilippineStatisticalYearbook,PhilippinesinFiguresDepartmentof
EducationStatisticsPhilippineStatisticalYearbook,PhilippinesinFiguresPhilippineStatisticalYearbook,PhilippinesinFigures

129AnnaFlorescaF.Abrinaet.al
that retired in the key industries of the model. This was used to generate national estimates of total retirements among AFNR graduates.
The estimated number of employed AFNR graduates in the economy was combined with unemployment rate among AFNR graduates in order to generate an estimate of the workforce or supply of AFNR graduates. The estimate of the unemployment rate was taken from a tracer survey conducted by the NCPAG. Subtracting total retirements from this value provided an estimate of the sum of the workforce in the previous year and the number of new AFNR graduates joining the workforce. The latter was estimated by exploiting information from the CHED on fresh AFNR graduates and from the NCPAG on labor force participation of AFNR graduates.
In relation to calculating the unemployment rate from the NCPAG data, the information from the NCPAG survey showed that about 41 percent of AFNR graduates did not have jobs. The reasons provided by the respondents for not having a job were used to determine those who are unemployed or outside of the workforce. The respondents considered as unemployed were the ones who said that they do not have a job because: (a) the job offered was not suitable; (b) lack of work experience; (c) no job opportunity; and half of the respondents who gave (d) other reasons. The remainder was considered to be outside of the labor force, hence, not unemployed. These were respondents who gave the following reasons: (a) further studies; (b) family responsibility; (c) lack of self confidence to face the working world; (d) chose not to work; (e) not interested in work; (f) health problems; and half of the respondents who gave (g) other reasons.
Information on extraneous variables like wage rates, farm income and non-farm incomes were derived mainly from the ASE of the NSO. Specifically, the average compensation of employees in AFNR positions and average compensation of employees in non-AFNR positions reported in NSO ASE, Census of Philippine Business and Industry (CPBI) and Annual Survey of Philippine Business and Industry (ASPBI) sources were used as proxy variables for AFNR and non-AFNR wages. The data for new AFNR graduates, AFNR freshmen enrollment, and total college freshmen enrollment were sourced from the Philippine Statistical Yearbook while data on government expenditures was based on the DBM National Expenditure Program (NEP). Proxies for estimating average farm and
Table D.2. Percentage share of AFNR graduates occupying AFNR positions and AFNR graduates not occupying AFNR positions to total employment per industry.
Item Agriculture ManufacturingWholesale/
RetailHotel &
RestaurantOthers All Industries
AFNRgraduatesoccupyingAFNRpositions
AFNRgraduatesnotoccupyingAFNRpositions
7.9
2.8
2.3
1.4
0.1
0.0
0.0
0.4
0.0
0.0
2.0
1.0

130 Higher Education in Agriculture: Trends, Prospects, and Policy Directions
nonfarm income were used; specifically, average farm income is computed from the average revenue of firms belonging in the AFNR sector while non-farm income is the average revenue of firms belonging to sectors other than AFNR. Information for this variable was sourced from the NSO ASE, CPBI, and ASPBI.
Annex E. Equations of the model
Total demand for AFNR graduatesTD TDN TDA t Tt t t= + ∈; (1)
Total demand for AFNR graduates, by industryTD DA DN i I t Tit it it= + ∈ ∈; , (2)
Total demand for AFNR graduates in AFNR positionsTDA DA i I t Tt it
i
= ∈ ∈∑ ; , (3)
Total demand for AFNR graduates in non-AFNR positionsTDN DN i I t Tt it
i
= ∈ ∈∑ ; , (4)
Workforce (Supply) of AFNR graduates( )t t 1 t it
t
TS TS 1 G R i I t T; ,s-= + - × - Î Îå (5)
Demand for AFNR graduates in AFNR positions, by industry(parameter values are shown in Annex 6)
( )it A A i it A A t N ti
DA N W W i I t T, , ,ln ln ln / ; ,a b g= + × + Î Îå (6)
Demand for AFNR graduates in non-AFNR positions, by industry(parameter values are shown in Annex 6)
( )it N N i i t N A t N ti
DN N W W i I t T, , , ,ln ln ln / ; ,a b g= + × + Î Îå (7)
Supply of fresh AFNR graduates (parameter values are shown in Annex 7)t 1 2 t 4 3 A t 4 A t 2 5 A t 3 6 t
7 N 2 8 N t 3 9 t
G E W W W CE
W W RF i I t T, , ,
, ,
ln ln ln ln ln
ln ln ; ,
d d d d d dd d d
- - -
-
= + × + × + × ++ × + ×
+ × + × + × Î Î
(8)
Retirements of AFNR graduates, by industry( )it i it itR DA DN i I t T; ,r= × + Î Î (9)
Unemploymentt t tU TS TD t T;= - Î (10)
Variable Definitions:Endogenous variables

131AnnaFlorescaF.Abrinaet.al
DAit = demand for AFNR graduates in AFNR positions for industry i at time tDNit = demand for AFNR graduates in non-AFNR positions for industry i at time tGt = number of fresh AFNR graduates at time tNit = employment of industry i at time t Rit = retirements of AFNR graduates for industry i at time tTDt = total demand for AFNR graduates at time tTDAt = demand for AFNR graduates in AFNR positions at time tTDNt = demand for AFNR graduates in non-AFNR positions at time tTSt = supply of AFNR graduates at time tUt = number of unemployed AFNR graduates at time t
Exogenous variablesCEt = direct cost of education at time tRFt = ratio of farm to non-farm income at time tWA,t = wage rate of AFNR graduates at time tWN,t = wage rate of non-AFNR graduates at time t
Annex F. Parameterization
Three approaches were used to specify specific numerical values needed for the parameters of the four behavioral equations: (i) econometric techniques; (ii) literature search; and (iii) calibration.
The demand for AFNR graduates in AFNR positions (Equation 6) requires estimates of the responses of the endogenous variable to changes in the exogenous variables (elasticities because of the double-log formulation of the equations) and the intercept term. The elasticities were estimated using panel data from the INSTAT survey. The parameters of the estimated equation have signs that are consistent with a priori expectations and statistically different from zero at the 10 percent level of significance.
Two points need to be noted regarding the estimated equation. First, many formulations of the equation were estimated before arriving at the specification used in the model. The choice of the random effects model over the fixed-effects model was based on a Hausman test. The initial equation also contained more variables than the one used in the model. However, many of the variables were dropped on the basis of Wald tests. Second, under ideal conditions, there should be one demand equation for each industry. Given the lack of observations however, the strategy adopted was to specify one general equation for all industries. Industry-specific intercept and slope dummies were introduced to capture inter-industry differences in the parameters. However, Wald tests showed that all the dummy variables were not statistically different from zero. The estimated equation for the demand for AFNR graduates in non-AFNR positions (Equation

132 Higher Education in Agriculture: Trends, Prospects, and Policy Directions
7) was obtained using the same procedure and had a qualitatively similar set of results. The estimation results for these equations are presented in Annex 6.
The supply of AFNR graduates (Equation 8) requires estimates for the responses of the number of graduates to changes in the exogenous variables (elasticities because of the double-log formulation of the equation) and the intercept term. Given the absence of a reasonably large dataset from which the parameters can be estimated, the approach adopted in the study was to adopt from the existing literature. The parameter values used in the model are shown in Annex 7.
The intercept terms in the demand and supply equations above and the coefficients of the retirement equations (Equation 9) were obtained by means of calibration. Commonly used in Computable General Equilibrium models, calibration is a technique which requires the careful choice of parameters so that the initial solution of the model (base case solution) replicates the base dataset. In other words, the initial solution of the model for 2005 should be identical to the values shown in Table 7 in the main text.
Annex G. Estimates of the demand for AFNR graduates
Demand for AFNR graduates in AFNR positions
Equation used in the model
( )it A it A t N tDA 0 18 N 0 07 W W, ,ln . ln . ln /a= + × - ×
Estimates of the equation
Demand for AFNR graduates in NON-AFNR positions
Equation used in the model( )it A it A t N tDA 0 18 N 0 07 W W, ,ln . ln . ln /a= + × - ×
lnN ln(Wa/Wn) Constant
CoefficientStandardErrorP-value
0.1834040.06991730.009
-0.06697380.0270030.013
0.64731260.35480630.068
R-squaredwithinbetweenoverall
0.06520.29240.2909
Waldchi2P-value
46.960

133AnnaFlorescaF.Abrinaet.al
Annex H. Parameter values used for the supply of AFNR graduates equation
Supply of AFNR graduates
t 1 2 t 4 3 A t 4 A t 2 5 A t 3 6 t
7 N 2 8 N t 3 9 t
G E W W W CE
W W RF, , ,
, ,
ln ln ln ln ln
ln ln
d d d d d dd d d
- - -
-
= + × + × + × ++ × + ×
+ × + × + ×
lnN ln(Wa/Wn) Constant
CoefficientStandardErrorP-value
0.42165970.13030150.001
-0.38497960.17059730.024
-0.63974990.67137480.341
R-squaredWithinbetweenoverall
0.17820.29860.2979
Waldchi2P-value
86.150
Estimates of the equation
Parameter Value Source
2d 0.30 CalibratedusingNCPAGdata
3d 2.13(5.02)t-value
Thompsonetal.(1994)
4d 1.21(0.43)stderr
Freeman(1976)
5d 1.21(0.43)stderr
Freeman(1976)
6d -1.34(7.39)t-value
Thompsonetal.(1994)
7d -1.85(0.51)stderr
Freeman(1976)
8d -1.85(0.51)stderr
Freeman(1976)
9d -0.064(1.88)t-value
Thompsonetal.(1994)


5Chapter
The state and future supply of and demandfor AFNR graduates in the Philippines: Synthesis and implications
Research questionsOver the past decade enrollment in AFNR tertiary courses has been declining, raising concerns about possible future gaps in human resource requirements for agriculture. By how much has AFNR enrollment been declining, and why? Furthermore, what should be done about this trend? This study was undertaken to document and characterize AFNR enrollment trends, and identify explanatory factors. The study would also lead to policy recommendations, assessed in terms of future scenarios for AFNR higher education, as well as relevance to the underlying causes of declining AFNR enrollment. A proper prescription of a cost-effective policy or program remedy is conditional on a proper diagnosis. Given the large participation of the public sector in AFNR higher education, measures to address expected human resource gaps in AFNR should as well be consistent with overall fiscal stance of the government.
To answer these questions the study has pursued a multi-pronged methodology utilizing various data sources. Explanatory factors are hypothesized within a framework of demand and supply in the labor market. The demand side comes from enterprises (including microenterprises for self-employment) or nonprofit institutions (including public sector entities). The supply side consists of AFNR graduates seeking employment—the outcome of an extended process in which households and youth make human capital investment choices, with some enrolling in and eventually graduating from AFNR tertiary programs. The supply side in the labor market leads to a derived demand for education services, which when combined with the supply of education services from HEIs, leads to the enrollment outcome to be explained.
Note that in a dynamic setting the demand and supply sides interact. Households and youth factor in employment and income prospects from AFNR

136 Higher Education in Agriculture: Trends, Prospects, and Policy Directions
education when making current human capital investment choices. Rising demand for AFNR graduates that is foreseen by households would, other things equal, lead to greater enrollment in AFNR courses. Conversely, the foreseen declining demand leads to lower enrollment.
On the supply side, the study conducted a human resource inventory consisting of an in-school survey of students as well as a tracer study of AFNR graduates. Indirectly, the tracer study also yielded information about labor demand (through actual employment outcomes of graduates). More directly, information about the demand side was conducted by way of environmental scanning, which covered employers of AFNR graduates in the regions, together with an enterprise survey which covered employers over a nationwide sample. Information from these sources, together with secondary data on economic structure and trends, is used to inform the scenario analysis, which is our tool for assessing future prospects for the AFNR sector as well as the impacts of alternative policy responses to the enrollment trends.
BackgroundThe higher education contextSince its beginnings as a core offering of the University of the Philippines, AFNR offerings have expanded together with the overall HE system. The broader context of declining AFNR enrollment should be seen within the wider context of the higher education development. It is possible that AFNR shares the overall problems, leading to a list of possible explanations for declining trend.
While the higher education system has been successful in providing tertiary schooling to a large proportion of the country’s youth, previous studies have been widely critical of the low quality of education provided by these institutions. According to these studies, one manifestation of low quality is the low passing rate in licensure exams (Chapter 2). Poor quality can be traced as well to under-investment both in facilities and human resources.
Juxtaposed with alleged underinvestment in the higher education system is the charge of “proliferation”. Implicit in the juxtaposition of under-investment with proliferation is the notion of a critical mass of facilities and faculty for each HEI, or effectively the presence of economies of scale (Box 1). Proliferation of HEIs under conditions of scale economies may lead to higher average cost (per given unit of service), or conversely, lower size or quality of service per peso of service provision cost.
This criticism heightened in the 1990s, which links the trend to the desire of “representative[s] in Congress to establish a state institution of higher learning, initially a college, subsequently a university, in his bailiwick, for obvious political reasons” (Gonzales 1997). Governance under these conditions becomes problematic, as “influential individuals, either politically well connected or legislators themselves and line officials such as provincial governors and mayors

137
sometimes exert political pressure to have friends and relatives appointed to academic positions.”
While the cost of higher education can be absorbed by the public sector in the case of SUCs, households would need to bear the cost of higher education in the case of private schools. Orbeta (2008) finds that only households from the 7th income decile (based on the 2006 FIES) can afford to pay the tuition of even just one student enrolled in a public school; and only those from the highest decile can afford to pay the tuition of one student enrolled in a private school. We also check whether a similar factor contributes to observed enrollment trends in the case of AFNR programs.
Declining AFNR enrollment: magnitude and explanations Among the HEIs included in the human resource inventory (with the exception of Region IV), the decline in AFNR enrollment is palpable: total enrollment was about 60,000 in 1998-1999, falling to just over 42,000 in 2007-2008, or an average drop of 3.5 percent per year. In fact, enrollment peaked at over 72,000 in 2001-2002, before suffering a steep drop in the subsequent years. Applying the observations for higher education in general to AFNR yields the following hypotheses to explain the trend in declining AFNR enrollment. While these hypotheses are not mutually exclusive, the study would attempt to determine the more significant factors behind enrollment trends.
Hypothesis 1: Quality: Students are shunning AFNR courses due to the poor quality of the education of HEI offerings.
Hypothesis 2: Economic barrier: Students find difficulty in enrolling in AFNR courses due to high tuition fees.
Hypothesis 3: Structural change: Due to changes in the underlying structure of the economy, demand for AFNR graduates, is declining, indirectly causing declining enrollment in AFNR courses.
Note further that the nature of the explanation would determine the nature of the corresponding solution. If poor quality is the explanation then the response should be to improve quality through the requisite investments and programmatic improvements. On the other hand, if the economic barrier is high then the appropriate response would be to reduce these barriers by
Box 1: Economies of scale in higher education
Longlong,Fengliang,andWeifan(2008)findthathighereducationinChinaischaracterizedbyeconomiesofscaleandscope;likewise,Lenton(2008)appliesproductionfunctionanalysistoahighereducationsectorinEnglandanddetectseconomiesofscale.Thisfindingconfirmsastringofstudies,especiallyintheUnitedStates,goingbacktothe1990sand1980sconfirmingeconomiesofscale,e.g.,biblecolleges,comprehensiveuniversities(KoshalandKoshal,1991),institutionsofhighereducationingeneral(LabandandLentz,2003;Cohn,Rhine,andSantos,1989),andthepublicschoolsystem(SenguptaandSfeir,1986).

138 Higher Education in Agriculture: Trends, Prospects, and Policy Directions
additional subsidies, or expansion of scholarship opportunities. On both counts, any expansion of public sector outlays should be assessed in terms of cost-effectiveness and social returns. However, if structural change is the main driver then the HEI system would need to adapt to the changing economic environment by reviewing the portfolio of course offerings, orientation of education centers, and even the size of its service provision.
Findings from the human resource inventory and environmental scanningThe quality explanationThat the quality of AFNR education is “low” can only be gauged by some performance measure and threshold of what is adequate as opposed to inadequate. Board examination results are often taken as such a measure. PRC data presented in Chapter 2 show that the passing rate for agriculture averaged 30 percent over the period 2004-2008. Again, proliferation is seen as the culprit: since the 1960s, many provincial colleges were converted to state universities, while agricultural high schools were transformed into agricultural colleges. By 2006, there were as many as 111 SUCs, over half of all HEIs that offer AFNR degrees. About 170 schools in total were offering such programs, accounting for a 10th of all HEIs. Note that, while nearly nine-tenths of college students are enrolled in private institutions, the bulk of AFNR students are enrolled in public institutions, mostly SUCs, for which the proliferation problem has been most acute.
Nevertheless, the appropriate measure and standard for quality is a controversial issue. Fortunately, our study however faces the more modest task of determining whether quality problems are contributing to declining enrollment trends. Based on the environmental scanning, the study finds no evidence that poor quality of AFNR schooling has affected enrollment trends.
Consider the Board passing rate: despite the low passing rate on average, the proportion actually rose from 25 percent in 2004 to peak at 34 percent in 2007—the years in which AFNR enrollment was suffering a dramatic decline. While the low passing rate is an underlying problem in the AFNR education sector, it appears to not be a significant causal factor behind diminishing enrollment.
The in-school survey and environmental scanning moreover suggests a markedly different quality assessment. In-school AFNR students mostly assigned very to extremely satisfied ratings to their HEIs along various dimensions of education quality. For instance, almost 71 percent registered this high rating for the AFNR degree programs in terms of preparing students for work. Likewise, graduates rate their courses quite favorably. A little less than two-thirds confirmed that their course was very to extremely helpful to their first job upon graduation. Interestingly, the most useful contribution of the AFNR course, according to these graduates, is human relations skills (76%), followed by communication skills at 73 percent; technical skills in AFNR is rated only third at 35 percent. This is mirrored by feedback from enterprises hiring AFNR graduates. Of the 820 firms surveyed, almost 70 percent

139
expressed very to extremely high degree of satisfaction overall with the knowledge of the AFNR graduates they had hired. The dimensions in which satisfaction rating was highest were: knowledge in his/her field of study, and understanding and taking directions for work assignments.
Note that the low passing rates for the Board exam in agriculture are not unique to the field. In 2004, the passing rate for civil engineering was 31 percent, for dentistry was 30 percent, and for accountancy was only 18 percent. Hence the standards being imposed by the PRC appear to be much more stringent than those adopted by the major education stakeholders.
The cost explanationIn contrast to high cost on average even in the public sector, in the case of AFNR degrees, the cost of higher education remains low and affordable. According to the in-school survey, nearly forty percent of students pay under PHP3,000.00 pesos per semester; those that paid over PHP5,000.00 pesos accounted for only 8.5 percent. About one-tenth pay under PHP1,500.00 pesos per semester. The reason for this low cost is two-fold: AFNR courses are largely offered by SUCs, who in turn are highly dependent on government subsidy. While 89 percent of all HEIs are private, agricultural HEIs (number 153 in 2005) are mostly public (82%). The reason is that only SUCs have sufficient land endowments requisite to agricultural instruction. For SUCs, though only 8 percent of income is collected from student fees (including tuition), basically 90 percent of the cost of education is borne by the public sector (Yonson 2007).
As a result, income is apparently not a major barrier to an AFNR degree even for the poor (although it may well be for the extremely poor). The in-school survey shows that as many as 60 percent of students come from households earning less than PHP50,000.00 per year; since the family size is four or greater, this is below even the 2006 poverty threshold of PHP13,334.00 per year. The father’s occupation is listed as farming, forestry, or fishing for 46 percent of students.This occupation, together with agricultural workers and unemployed, account for the 64 percent of fathers’ occupation.
What is remarkable that despite poverty and low earning opportunity from these occupations, 77 percent of students list their primary source of college financing as their parents. Together with other kin (including siblings), the extended family finances 92 percent of college education. Scholarships (full and partial) fund only a minority (29%).
The economic change explanationThis leaves the last hypothesis; unlike the previous ones, this pinpoints factors external to the education sector, i.e., labor market trends, that indirectly impact on enrollment. According to the tracer study, as many as 19 percent of AFNR graduates are unemployed (i.e., actively searching for but unable to get hired in a

140 Higher Education in Agriculture: Trends, Prospects, and Policy Directions
job). Of those employed, about 56 percent are in temporary, contractual, or casual positions, while only 32 percent were in regular positions. This is to be expected as most of the tracer respondents are recent graduates, and transition to regular employment in the Philippines is subject to lags. Only 12 percent are able to find work as self-employed workers, i.e., as entrepreneurs or practicing professionals.
High unemployment of AFNR graduates must surely influence human capital investment choices, therefore, enrollment decisions. The reason for high unemployment can be attributed to weak absorptive capacity of the economy to absorb AFNR graduates, in turn driven by underlying structural factors. Agriculture now accounts for just 18 percent of the economy according to official data (as of 2007), which uses fixed 1985 prices; the same year, Dumagan (2008) estimates a share of only 14 percent using the chained price index (which avoids the arbitrariness in generating real values due to selection of a base year). In practice, this is close to the share of agriculture in GDP based on current prices (also 14%). Note that over the past five decades, the current GDP share of agriculture peaked at 30 percent in 1973, in the wake of a worldwide commodity price boom.
Remuneration in agriculture-oriented occupations is also unimpressive: close to half reported starting salaries ranging from PHP5,000.00 to PHP10,000.00 a month, consistent with minimum wages in 2008. Only 15 percent earned over PHP15,000.00 a month. Salary prospects are likewise poor; five years after the first job, three-fourths of AFNR graduates continued to earn less than PHP10,000.00 per month. Low remuneration is consistent with the low labor productivity in agriculture: GDP per worker in agriculture is only 42 percent that of GDP per worker for the economy as a whole.
Aside from the “push” factor of agriculture’s decline, there has been a “pull” factor from the other sectors of the domestic economy, as well as non-AFNR occupations from abroad. Over the period 2000-2005, there was a dramatic shift in enrollment away from traditional discipline groups (accounting for 2/3 of the list of CHED discipline groups) to basically two discipline groups, namely medical and allied resources, as well as trade craft and industrial (vocational and technical education). Growth in the former averaged 25 percent over the period, while in the latter, growth reached 72 percent. Therefor, economic change is the main driver of AFNR enrollment trends, namely, the shift in employment and remuneration opportunities from agriculture to non-agricultural courses, both domestically and overseas.
Enrollment trends within AFNR may also be linked to economic change, likewise associated with the transformation of the AFNR sector. Closer inspection shows that enrollment drops are not common to all AFNR programs and to all regions of the country. Declines tend to be concentrated among traditional production-oriented courses, such as agriculture and forestry. On the other hand, courses such as agribusiness, agriculture entrepreneurship, environmental science, and fisheries posted increasing enrollment. Likewise rising AFNR enrollment

141
overall was observed in CAR, Region XI, and Region XII. This closely parallels modernization trends within Philippine agriculture. According to Dy (2010), the leading edge of agricultural modernization is agribusiness-based activities, particularly those competing in global markets. The agribusiness center of the Philippines is Mindanao, which benefits from favorable agroclimatic endowments. It is the major contributor to the country’s agricultural exports.
Results from the scenario analysisOverviewThe preceding analysis of ex post trends becomes the basis for the assessment of future scenarios. Scenarios are divided into business-as-usual and alternative scenarios. The former is the reference scenario corresponding to “no-action” or simply based on continuation of current trends. The latter corresponds roughly to different policy options to address problems that may arise under business-as-usual. The projection period spans a 15-year period from 2005 (a base year that reflects availability of data) up to 2020. It accounts for all the economic sectors and all forms of employment for AFNR graduates, including self-employment.
Scenario analysis is based on a quantitative model of supply and demand in the Philippine labor market for AFNR graduates. The alternative scenarios are as follows:
Reduced cost of AFNR education – this can take the form of additional subsidies to SUCs offering AFNR. The level of cost reduction is assumed to be 10 percent.
Rising employment in agriculture – this is premised on growth acceleration for the agricultural sector, due to improvements in productivity and expansion of value-added activities, driven in part by increased investments in R&D and agri-related infrastructure. The scenario is implemented by raising the exogenous growth rate of agricultural employment by 1 percentage point per year.
Rising employment and wages – alternative scenario (ii) implicitly assumes a “dual economy” framework in which the supply of agricultural workers is perfectly elastic until a turning point, called the Lewis turning point. Such a turning point may have been already exceeded in occupations demanding technical skills at the tertiary level. Hence, in scenario (iii) we add, on top of scenario (ii) assumption, a 0.5 percentage point growth per year in AFNR graduates’ wages.
Business-as-usual scenarioThe business-as-usual scenario is conditioned on an economic structure, revealed by the nationwide enterprise survey, in which 84 percent of AFNR graduates derive employment from agriculture (including fishery and forestry). About 9 percent are found in manufacturing, while just 5 percent are employed in government

142 Higher Education in Agriculture: Trends, Prospects, and Policy Directions
(including SUCs themselves). The scenario is also conditioned on historical trends, annual growth of agricultural employment is only 0.4 percent per year, which is still better than that of manufacturing (0.3%) and government (0.1%). AFNR enrollment continues to decline by 3.5 percent per year.
The model projects that new AFNR graduates would likewise decline, though by just 1.9 percent. Accordingly, the AFNR workforce would continue to grow an average of 1 percent per year; however, due to weak growth of the primary absorbing sectors, the ranks of the unemployed would swell by 2.6 percent per year. Unemployment among AFNR graduates would therefore increase dramatically, from the baseline of 23 percent, up to 30 percent by 2020. This seems to be an unacceptable outcome, strongly indicating the need for a policy and program response.
The current and projected glut of AFNR graduates in the labor market contrasts sharply with perceived mismatches regarding specific skills within the AFNR sector. Research agencies point to a shortage in hiring scientific personnel; declining enrollment has been perceived to dry up the pool of science-oriented professionals who might eventually go into research. The private sector has also noted positions that are “hard-to-fill” (DOLE JobsFit Report, 2010). These are:
Animal husbandry – poultry raiser, livestock raiser, animal production entrepreneur;
Agricultural economist; Aquaculturist – aquaculture farm caretaker, farm aide, facilities repair
and maintenance, fish nursery worker, prawn farm cultivator; Coconut farmer – horticulture farm aide, farm caretaker, coffee farmer,
fruit tree farmer, cacao farmer, vegetable farmer (inter-cropping system);
Fruit, vegetable, and root crops farmer; Entomologist; Fisherman (Ultimo); and Horticulturist – independent operator, leading hand.To explain this apparent contradiction, note first that the projections refer to
AFNR employment at the aggregate level—owing to data constraints, no information is provided at a more disaggregated level of specific skills and occupations. As noted earlier, within the AFNR sector there are growth centers associated with agribusiness expansion, which parallel the requirements expressed in the DOLE JobsFit Report.
Second, the type of AFNR education assessed in the scenario analysis is formal tertiary level schooling. It does not encompass the broader post-secondary education system, which includes TVET. In the DOLE Report, only entomologist and agricultural economist requires a tertiary degree; the rest require TVET certification at the National Competency at I, II, or III levels.

143
Alternative scenariosResults for the alternative scenarios are reported as differences from the business-as-usual projections. Among these we first consider Scenario (ii) – reduced education cost, whether directly to students in the form of scholarships, or directly to schools in the form of subsidies. Not surprisingly, reduced cost of education leads to greater unemployment rates for AFNR graduates – here 2 percentage points, after a 10 percent reduction in education cost. Reducing cost makes it marginally more attractive for students to enroll in AFNR courses. However, it fails to address the root cause of declining enrollment, which is the labor market’s weak capacity to absorb AFNR graduates.
Next we consider the effect of accelerating employment in agricultural activities. According to the scenario analysis, faster employment growth in agricultural activities reduces future unemployment rate of AFNR graduates; here the 1 percentage point faster growth reduces future unemployment rate by 1.9 percent, by reducing the annual growth of unemployed AFNR workers by 0.6 percent. Clearly, raising employment growth in agricultural activities does address the underlying labor market problem. However, the policy intervention for doing so falls largely outside the education sector. Rather, it entails strategies for accelerating investments in agriculture, such as through expansion of value adding activities, product diversification, and improvements in rural and market-related infrastructure, together with policy and institutional reforms that correct the bias for traditional crops (such as rice). As well, these strategies are spelled out in some detail in the current Philippine Development Plan (Chapter 4: Competitive and sustainable agriculture and fisheries sector).
Lastly, we consider Scenario (iii), in which growth in agricultural employment rises together with wages. It turns out that a 0.5 percentage point faster growth in wages causes the growth of unemployed graduates to rise slightly, by 0.17 percentage points, even with a 1 percent faster growth in agricultural employment. That is, the wage growth stimulates more AFNR enrollment, ultimately leading to a higher unemployment rate of AFNR graduates (0.11 percentage points higher by 2020).
Note however that rising employment growth can occur with possibly lower rates of wage growth given high rates of unemployment of AFNR graduates at the baseline. That is, the Lewis turning point may yet to be reached even in the case of technically-demanding agricultural occupations. It is crucial though that labor market distortions such as legislated wages as well as hiring/firing restrictions be kept at a minimum to afford maximum flexibility to the labor market.
Solutions from within the education sectorWhile the primary solution to declining AFNR enrollment relies on improving job prospects, within the education sector there is considerable scope for policy

144 Higher Education in Agriculture: Trends, Prospects, and Policy Directions
and program response. Clearly, rationalization of AFNR HEIs is warranted in response to diminishing labor market prospects for AFNR graduates. Rationalization has long been proposed for adoption in the public HEI sector.It is especially cogent for AFNR HEIs in view of the declining enrollment trends.
Rationalization is consistent with the underlying diagnosis by adjusting to the reality of a shrinking labor market demand by restructuring within the education sector. Consolidation of AFNR HEIs is warranted given proliferation in earlier years, which may have contributed to an AFNR enrollment “bubble” that peaked in the early 2000s, which was then followed by a steep correction.
Efforts at consolidating HEIs offering AFNR should be guided by the disaggregated analysis from the human resource inventory and environmental scanning. Obviously, disaggregated enrollment trends should not be applied automatically as the main criterion for determining the type and location of courses to concentrate public funds. Instead, rationalization should be based on strategic rethinking of the AFNR education system, one that is more responsive to the emerging requirements of agricultural modernization and agribusiness expansion. Such rethinking would review overall investments in traditional courses, and expand outlays for some of the nontraditional ones fitting future agribusiness requirements, together with geographic concentration in strategic service delivery points. Mindanao should be the focus of the new system, though the system should continue to affirm the role of high quality institutions of learning as well as basic and applied research.
Moreover, rationalization is an opportunity to pursue key reforms and program improvements within the post-secondary education system. First, within higher education, consolidation frees up resources that would help address perennial quality problems in key AFNR HEIs. HEIs should invest in upgrading their facilities, and in particular in faculty development, which has been noted as a key quality gap in training a globally competitive work force (Tullao 2003). The environmental scanning also notes a few weak spots that can be addressed by curricular improvements, such as training in general communication skills, with emphasis on speaking and writing, and training in general computer skills. In particular, the curriculum should place increasing emphasis on entrepreneurship, given the low levels of self-employment among AFNR graduates at present (below 10%). Finally, resources can also be allocated for expanding SUC programs on career counseling and employment promotion for their graduates, such as networking with potential employers, and assistance to potential agribusiness entrepreneurs.
Second, the labor market requirements for specific skills that can be addressed by appropriate expansion and quality improvement in agri-oriented TVET, which can benefit from the consolidation of HEIs offering AFNR degrees.

145
ConclusionThe main reason behind declining AFNR enrollment is structural change in the economy, which in turn is forcing changes in the labor market. Agriculture’s share in output has continually shrunk, even labor productivity in the sector has been declining. This is also causing remuneration as well as job opportunities in AFNR occupations to decline. Hence, households and youth are choosing alternatives to AFNR programs, particularly those geared overseas, such as medical and industrial occupations, including TVET.
The appropriate policy and program response is both external and internal to the post-secondary education system. Externally, the country’s development strategy should renew the thrust towards modernizing agriculture through diversification, agribusiness promotion, and investments in rural and market-related infrastructure. Internally, the educational system should aggressively pursue rationalization of AFNR HEIs together with agri-oriented TVET programs. Rationalization should consider carefully the labor market requirements of agribusiness-oriented agriculture, in terms of geographic focus (especially in Mindanao), specific skill shortages, degree requirements (tertiary completion as against TVET certification), and emerging growth centers of AFNR higher education (especially agribusiness courses, agricultural entrepreneurship, environmental sciences, and fisheries).
The transformation of the Philippine economy is forcing a reassessment of AFNR tertiary education. The long-deferred rationalization of public HEIs is now becoming an urgent necessity to reconcile AFNR education to the realities of the labor market. Admittedly, political and institutional constraints remain as always the key obstacle to reforms (Torralba et al., 2007). The past history of proliferation and governance inertia shall continue to pose great challenges towards sector reform. Hopefully, realization of the dire prognosis under business-as-usual should prod the public HEI system to urgently address these challenges.
ReferencesCohn, E., S. Rhine, and M. Santos. 1989. Institutions of higher education as multi-
product firms: economies of scale and scope. Review of Economics and Statistics 71(2):284-290.
Compra-Yonson, R. 2007. Financing public higher education in the Philippines: an examination of the applicability of income contingent student loan scheme. Paper presented at the 10th National Convention on Statistics, 1-2 October, EDSA Shangri-La Hotel, Mandaluyong City, Philippines.
Department of Labor and Employment (DOLE). 2010. Project JOBSFIT DOLE 2020 vision: summary of findings and recommendations. Bureau of Labor and Employment: Manila.

146 Higher Education in Agriculture: Trends, Prospects, and Policy Directions
Dy, R.T. 2009. Food for thought: how agribusiness is feeding the world (with special focus on the ASEAN). University of Asia and the Pacific and the Comprehensive Initiative for the Transformation of Organizations Foundation, Manila.
Gonzales, A. 1997. In Asian higher education: an international handbook and reference guide edited by G. Postiglione and G. Mak. Greenwood Press: Westport, CT.
Koshal, R. and M. Koshal. 1999. Economies of scale and scope in higher education: a case of comprehensive universities. Economics of Education Review 18(2):269-277.
Laband, D. and B. Lentz. 2003. New estimates of economies of scale and scope in higher education. Southern Economic Journal 70(1):172-183.
Longlong, H., L. Fengliang, and M. Weifang. 2009. Multi-product total cost functions for higher education: the case of Chinese research universities. Economics of Educa-tion Review 28(4):505-511.
Orbeta, A. 2003. Education, labor market and development: a review of the trends and issues in the Philippines. PIDS Perspective Paper Series No. 9. Makati City: Philip-pine Institute for Development Studies.
———. 2008. Background paper on higher education in the Philippines. Mimeo. Sengupta, J. and R. Sfeir. 1986. Production frontier estimates of scale in public schools in
California. Economics of Education Review 5(3):297-307. Torralba, A., P. Demsl, and M. Manzon. 2007. Schooling in the Philippines in Going to School
in East Asia edited by G. Postiglione and J. Tan.. Greenwood Press: Westport, CT. Tullao, T. 2003. Domestic regulation and the trade in service: the role of the Commission on
Higher Education (CHED) and the Professional Regulation Commission in Educa-tion and globalization edited by T. Tullao. Makati City: PASCN and PIDS.

About the AuthorsAnna Floresca F. Abrina is an Assistant Professor at the Department of Economics, University of the Philippines Los Baños (UPLB), from where she earned both her BS and MS in Economics degrees. She teaches courses in macroeconomics, consumption economics, and public economics. Her recent research interests have been in the fields of the economics of education, development economics, energy economics, and institutional economics.
Albert P. Aquino is Chief Science Research Specialist and Director of the Socioeconomics Research Division at Philippine Council for Agriculture, Aquatic and Natural Resources Research and Development (PCAARRD). He obtained his Ph.D. in Agricultural Economics from Chiba University, Japan and his M.Sc. in Agricultural Economics and B.Sc. in Agribusiness from the UPLB. His fields of expertise include monitoring and evaluation of development programs, impact assessment, science policy analysis, and advocacy and research management.
Jaimie Kim Bayani Arias is an Assistant Professor at the UPLB teaching undergraduate economics courses. She graduated from UPLB in 1999, earning a Bachelor of Science degree in Economics, and earned her MA Economics degree at the Ateneo de Manila University in 2005. Her research specializations are in the fields of development economics, natural resource, and environmental economics.
Dr. Roehlano Briones is a Senior Research Fellow at the Philippine Institute for Development Studies, where he specializes in agricultural policy. His research focuses on the economics of agriculture and natural resources, impact assessment, rural development, and food security. He obtained his Ph.D. from the UP School of Economics in 2000 and did postdoctoral research at the WorldFish Center in Penang, Malaysia. He has authored numerous published research papers and co-edited two books.
Ernesto O. Brown is Supervising Science Research Specialist and Assistant Director of the Socioeconomics Research Division at PCAARRD. He has a Ph.D. in Agricultural Economics from the UPLB. His fields of expertise include supply chain analysis and impact assessment.
Jose V. Camacho, Jr., an Associate Professor at the Department of Economics and Dean of the Graduate School at UPLB, obtained his Doctor of Economics degree at the Kyoto University in Japan. A former chairman of the department, he teaches courses in human resource economics and development economics. His research and publications have dealt on economics education, economics of education, and human resource economics.

Ledivina V. Carino+, is a distinguished sociologist and political scientist. She obtained her B.A. in Public Administration in UP, Masters in Political Science in University of Hawaii, and Ph.D. Sociology in Indiana University. She was also a board member of Philippine Institute for Development Studies.
Melvin B. Carlos is Chief Science Research Specialist and Director of the Technology Transfer and Promotion Division at PCAARRD. He completed his Ph.D. in Economic Geography at Simon Fraser University of British Columbia, Canada. His main areas of expertise include resource economics, spatial-institutional analysis, project management and technology transfer innovation systems.
Richard B. Daite is an Assistant Professor at the Department of Economics, College of Economics and Management UPLB. He is a Ph.D. in Economics Candidate at the UP School of Economics and specializes in public economics and international economics.
J. Prospero E. de Vera III is a Professor of Public Administration and Vice President for Public Affairs of the UP. He obtained his Doctor of Public Administration degree from the UP. His fields of research cover higher education, agriculture, local governments, climate change, and legislative studies.
Patricio S. Faylon is Executive Director at PCAARRD. He obtained his M.Sc. in Ruminant/Production Economics at the University of Illinois at Urbana-Champagne, in the United States and his Ph.D. from the UPLB. His areas of specialization include ruminant nutrition and physiology, meat processing, strategic planning, quality management, and research and development (R&D) management in the agriculture, aquatic, and natural resources sectors.
U-Primo E. Rodriguez is a Professor at the Department of Economics, UPLB. A Master of Economics of Development degree holder from the Australian National University, he has taught courses in macroeconomics, econometrics, and economywide modeling. His recent research work has involved the quantitative analyses of policies and issues in agriculture, energy, and international trade.
Ruperto S. Sangalang is Commissioner at the Commission on Higher Education (CHED) and former President of the Cavite State University. He obtained his Ph.D. in Rural Sociology from the Ohio State University, in the United States and specializes in agricultural education, international development, city and regional planning and higher education management.

Philippine Institute for Development StudiesNEDA sa Makati Building106 Amorsolo Street, Legaspi Village1229 Makati City, PhilippinesTel. Nos. (+632) 894-2584; 893-5705Fax Nos. (+632) 893-9589; 816-1091Email: [email protected]: http://www.pids.gov.ph
Higher Educationin Agriculture
trends, prospects,and policy directions
The declining enrollment in agriculture, forestry, and natural resources (AFNR) courses is an alarming phenomenon given the unbridled expansion of state universities and colleges (SUCs) in the past few decades. Congress has had a propensity to convert rural high schools into agricultural and forestry colleges, and later, into full-fledged SUCs, as part of political legacy-building. The changing dynamics of the higher education sector, however, puts into question the sustainability of their agriculture and related programs, if not the very existence of these institutions themselves. Moreover, the enrollment downtrend has dire consequences for the future human resource requirements of the AFNR sector. This book examines each of these factors and points the way forward in transforming the educational sector to become more responsive to the new demands of the labor market. There is a need to rationalize AFNR higher educational and technical-vocational institutions while addressing skill shortages, degree requirements, and other crucial issues. In the larger context, the country’s strategy for economic development should promote agricultural modernization and an agribusiness orientation, supported by investments in infrastructure. This book is yet another contribution to the effort to craft evidence-based policy aimed at making growth and development more inclusive, especially for the third of the country’s workforce making a living in the agriculture sector.