higher education budgeting in indiana 102 indiana commission for higher education october 12, 2006
TRANSCRIPT

Higher Education Budgeting in Indiana 102
Indiana Commission for
Higher Education
October 12, 2006

Higher Education Budgeting in Indiana 102
NATIONAL CONTEXT

5,825
5,282
0
2,000
4,000
6,000
8,000
10,000
12,000
14,000
Wyo
ming
Alaska
Hawaii
Conne
cticu
t
New Je
rsey
Nevad
a
Mas
sach
uset
ts
New M
exico
Georg
ia
New Y
ork
North
Car
olina
Illino
is
Idah
o
Delaw
are
Tenne
ssee
Rhode
Islan
d
Kansa
s
Wisc
onsin
Main
e
Kentu
cky
Arizon
a
Nebra
ska
Miss
ouri
Was
hingt
on
Califo
rnia
Unite
d Sta
tes
Mich
igan
Penns
ylvan
ia
Minn
esot
a
Texas
Utah
India
naIo
wa
Louis
iana
South
Car
olina
Virgini
a
Alabam
a
Oklaho
ma
Florida
Miss
issipp
iOhi
o
Arkan
sas
South
Dak
ota
Mar
yland
North
Dak
ota
Orego
n
Wes
t Virg
inia
Mon
tana
Color
ado
New H
amps
hire
Verm
ont
Higher Education Appropriations per FTE by State, 2005
U.S.Indiana
Source: SHEEO SHEF, State Higher Education Finance FY2005.

4%
112%
32%27%
0%
20%
40%
60%
80%
100%
120%
Wyo
ming
Rhode
Islan
d
Illino
is
Minn
esot
a
Kansa
s
Nebra
ska
Wisc
onsin
Mas
sach
uset
ts
Alabam
a
Mich
igan
North
Dak
ota
Conne
cticu
t
Miss
ouri
New Y
ork
New H
amps
hire
Penns
ylvan
ia
Verm
ontOhi
o
New Je
rsey
Iowa
Wes
t Virg
inia
Miss
issipp
i
Main
e
Alaska
Tenne
ssee
Virgini
a
Delaw
are
Orego
n
Hawaii
Mar
yland
Califo
rnia US
Color
ado
Mon
tana
Mar
yland
New M
exico
India
na
Oklaho
ma
Kentu
cky
Texas
Was
hingt
onId
aho
North
Car
olina
South
Car
olina
Arizon
a
South
Dak
ota
Florida
Louis
iana
Arkan
sasUta
h
Georg
ia
Nevad
a
Full-Time-Equivalent (FTE) Enrollment in Public Higher Education, Percent Change by State, 1990-2005
Source: SHEEO SHEF, State Higher Education Finance FY2005.
IndianaU.S.

29.1%
-19.7%-16.0%
-40.8%
-50.0%
-40.0%
-30.0%
-20.0%
-10.0%
0.0%
10.0%
20.0%
30.0%
40.0%
Orego
n
Verm
ont
Mon
tana
Colora
do
Mar
yland
Mar
yland
Main
e
Was
hingt
onUta
h
HawaiiIo
wa
Alaska
Oklaho
ma
Virgini
a
FloridaOhio
Minn
esot
a
Mich
igan
India
na
New Y
ork
Penns
ylvan
ia
South
Car
olina
Arkan
sas
US
Wisc
onsin
North
Dak
ota
North
Car
olina
Texas
Rhode
Islan
d
New H
amps
hire
Califo
rnia
South
Dak
otaId
aho
Alabam
a
Conne
cticu
t
Mas
sach
uset
ts
Arizon
a
Delawar
e
Miss
ouri
Tenne
ssee
Georg
ia
Kentu
cky
Illino
is
Kansa
s
Wes
t Virg
inia
Miss
issipp
i
New M
exico
Nebra
ska
Louis
iana
Nevad
a
New Je
rsey
Wyo
ming
Educational Appropriations per FTE,Percent Change by State, 1990-2005
U.S.Indiana
Source: SHEEO SHEF, State Higher Education Finance FY2005.
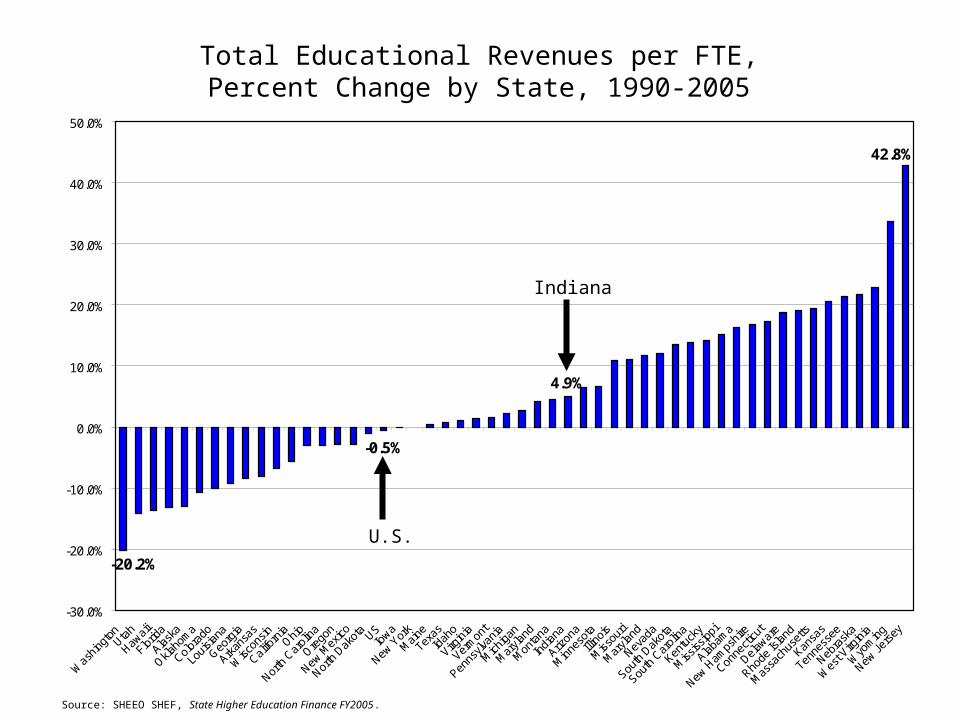
4.9%
-0.5%
42.8%
-20.2%
-30.0%
-20.0%
-10.0%
0.0%
10.0%
20.0%
30.0%
40.0%
50.0%
Was
hingt
onUta
h
Hawaii
Florida
Alaska
Oklaho
ma
Color
ado
Louis
iana
Georg
ia
Arkan
sas
Wisc
onsin
Califo
rniaOhi
o
North
Car
olina
Orego
n
New M
exico
North
Dak
ota US
Iowa
New Y
ork
Main
e
Texas
Idah
o
Virgini
a
Verm
ont
Penns
ylvan
ia
Mich
igan
Mar
yland
Mon
tana
India
na
Arizon
a
Minn
esot
a
Illino
is
Miss
ouri
Mar
yland
Nevad
a
South
Dak
ota
South
Car
olina
Kentu
cky
Miss
issipp
i
Alabam
a
New H
amps
hire
Conne
cticu
t
Delaw
are
Rhode
Islan
d
Mas
sach
uset
ts
Kansa
s
Tenne
ssee
Nebra
ska
Wes
t Virg
inia
Wyo
ming
New Je
rsey
Total Educational Revenues per FTE,Percent Change by State, 1990-2005
Source: SHEEO SHEF, State Higher Education Finance FY2005.
U.S.
Indiana

Net Tuition as a Percentage of Public Higher EducationTotal Educational Revenues by State, 2005
77%
50%
37%
13%
0%
10%
20%
30%
40%
50%
60%
70%
80%
90%
Verm
ont
New H
amps
hire
Color
ado
Delaw
are
Mar
yland
Orego
n
Penns
ylvan
ia
Mon
tana
Rhode
Islan
d
Mich
igan
South
Dak
ota
India
naOhi
oIo
wa
Alabam
a
South
Car
olina
Virgini
a
Wes
t Virg
inia
Main
e
Minn
esot
a
North
Dak
ota
New Je
rsey
Tenne
ssee
Mas
sach
uset
ts
Conne
cticu
t
Miss
ouri
Miss
issipp
i
Kansa
s
Arkan
sas
Kentu
cky
Wisc
onsin
Unite
d Sta
tes
Arizon
a
Nebra
skaUta
h
Oklaho
ma
New Y
ork
Texas
Illino
is
Louis
iana
Florida
North
Car
olina
Was
hingt
on
AlaskaId
aho
Nevad
a
Hawaii
Califo
rnia
Georg
ia
Wyo
ming
New M
exico
Source: SHEEO SHEF, State Higher Education Finance FY2005.
U.S.
Indiana

Change in State and Family Share of Education Expenditures
FY1995 to FY2005
Source: Indiana Commission for Higher Education.
57.2%
2.2%
40.6%
56.8%
2.5%
40.7%
56.4%
2.7%
40.9%
55.9%
2.7%
41.4%
55.3%
3.0%
41.6%
54.7%
2.9%
42.4%
53.7%
3.0%
43.3%
51.2%
3.4%
45.4%
48.1%
3.7%
48.1%
46.3%
4.1%
49.5%
45.9%
4.0%
50.1%
0%
10%
20%
30%
40%
50%
60%
70%
80%
90%
100%
1994-95 1995-96 1996-97 1997-98 1998-99 1999-00 2000-01 2001-02 2002-03 2003-04 2004-05
State Operating Appropriations
Tuition & Fees
SSACI Aid

Higher Education Budgeting in Indiana 102
STATE TO STATE COMPARISONS

Higher Education Budgeting in Indiana 102
Selected Peer States
Michigan Illinois
Ohio Wisconsin
Minnesota Virginia
Washington Massachusetts

Enrollment in Public Postsecondary
Institutions in Selected States (Fall 2004)
187,873
241,245
266,884
266,916
293,145
343,391
454,377
500,873
563,593
Massachusetts
Minnesota
Wisconsin
Indiana
Washington
Virginia
Ohio
Michigan
Illinois
Source: Chronicle of Higher Education Almanac
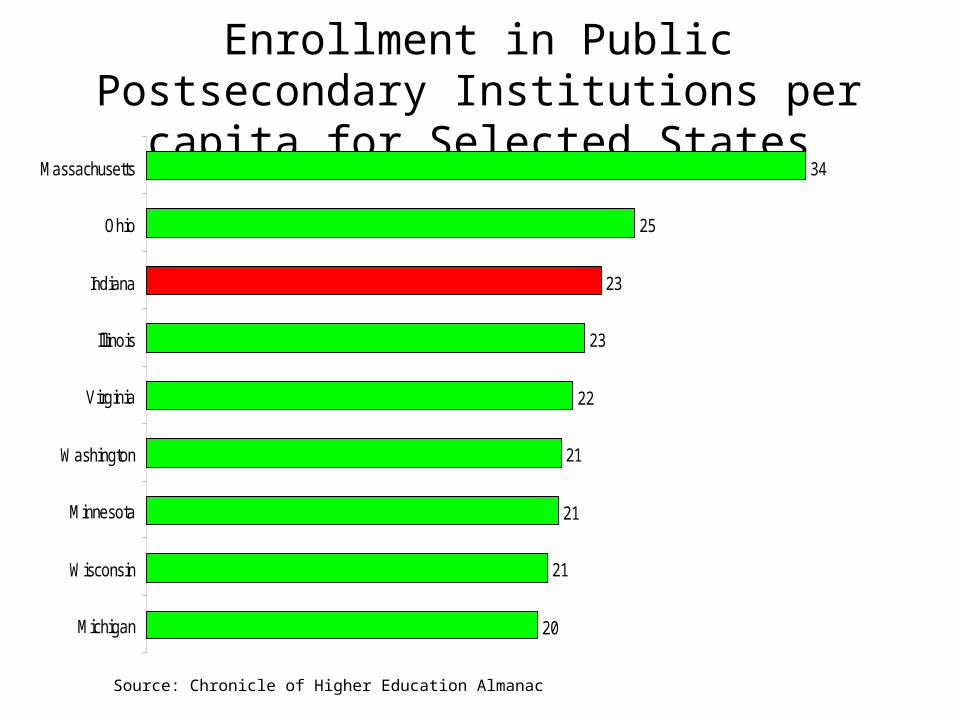
Enrollment in Public Postsecondary Institutions per capita for Selected States
20
21
21
21
22
23
23
25
34
Michigan
Wisconsin
Minnesota
Washington
Virginia
Illinois
Indiana
Ohio
Massachusetts
Source: Chronicle of Higher Education Almanac

Enrollment in Public and Independent Postsecondary Institutions in Selected
States (Fall 2004)
15
15
16
16
17
18
18
18
19
Massachusetts
Minnesota
Illinois
Michigan
Wisconsin
Indiana
Virginia
Washington
Ohio
Source: Chronicle of Higher Education Almanac

State Appropriationsfor Higher Education FY 2006 ($000)
$918,127
$1,131,515
$1,365,500
$1,430,424
$1,532,281
$1,594,605
$2,017,632
$2,111,733
$2,615,389
Massachusetts
Wisconsin
Minnesota
Indiana
Washington
Virginia
Michigan
Ohio
Illinois
Source: Chronicle of Higher Education Almanac

Higher Education Appropriations per capita FY 06
$143
$184
$199
$204
$205
$211
$228
$244
$266
Massachusetts
Ohio
Michigan
Wisconsin
Illinois
Virginia
Indiana
Washington
Minnesota
Source: Chronicle of Higher Education Almanac

Higher Education Appropriations per FTE FY 06
$4,028
$4,240
$4,641
$4,644
$4,648
$4,887
$5,227
$5,359
$5,660
Michigan
Wisconsin
Illinois
Virginia
Ohio
Massachusetts
Washington
Indiana
Minnesota
Source: Chronicle of Higher Education Almanac

Increases in State Appropriations for Higher Education FY95-FY 06
17%
19%
20%
27%
28%
31%
46%
54%
63%
Wisconsin
Massachusetts
Michigan
Ohio
Minnesota
Illinois
Indiana
Washington
Virginia
Source: Chronicle of Higher Education Almanac

Fall headcount enrollment in Indiana postsecondary institutions
0
50,000
100,000
150,000
200,000
250,000
300,000
350,000
400,000
1979-80
1980-81
1981-82
1982-83
1983-84
1984-85
1985-86
1986-87
1987-88
1988-89
1989-90
1990-91
1991-92
1992-93
1993-94
1994-95
1995-96
1996-97
1997-98
1998-99
1999-00
2000-01
2001-02
2002-03
2003-04
2004-05
2005-06
Total346,378
Public266,790
Private79,588
Source: Annual Editions of Report of Enrollment in Indiana Colleges and Universities, prepared for the Indiana Association of Collegiate Registrars and Admissions Officers. Independent Colleges of Indiana. Commission for Higher Education Student Information System.

State Higher Education Operating Appropriations per Hoosier FTE 1992 –
2004 (nominal)
$4,000
$4,500
$5,000
$5,500
$6,000
$6,500
$7,000
1992-93
1993-94
1994-95
1995-96
1996-97
1997-98
1998-99
1999-00
2000-01
2001-02
2002-03
2003-04
2004-05
Source: Indiana Commission for Higher Education

Inflation Adjusted State Higher Education Operating Appropriations per Hoosier FTE
1992 – 2004 (2004 $)
$5,000
$5,500
$6,000
$6,500
$7,000
$7,500
$8,000
1992-93
1993-94
1994-95
1995-96
1996-97
1997-98
1998-99
1999-00
2000-01
2001-02
2002-03
2003-04
2004-05
Source: Indiana Commission for Higher Education

Total State Student Aid Appropriations FY 05 ($000)
$89,899
$104,296
$173,103
$200,970
$240,000
$250,873
$279,179
$295,428
$377,455
Wisconsin
Massachusetts
Washington
Virginia
Ohio
Michigan
Minnesota
Indiana
Illinois
Source: Chronicle of Higher Education Almanac

Student Aid Appropriations per capita FY 05
$16
$16
$21
$25
$27
$28
$30
$47
$54
Wisconsin
Massachusetts
Ohio
Michigan
Virginia
Washington
Illinois
Indiana
Minnesota
Source: Chronicle of Higher Education Almanac
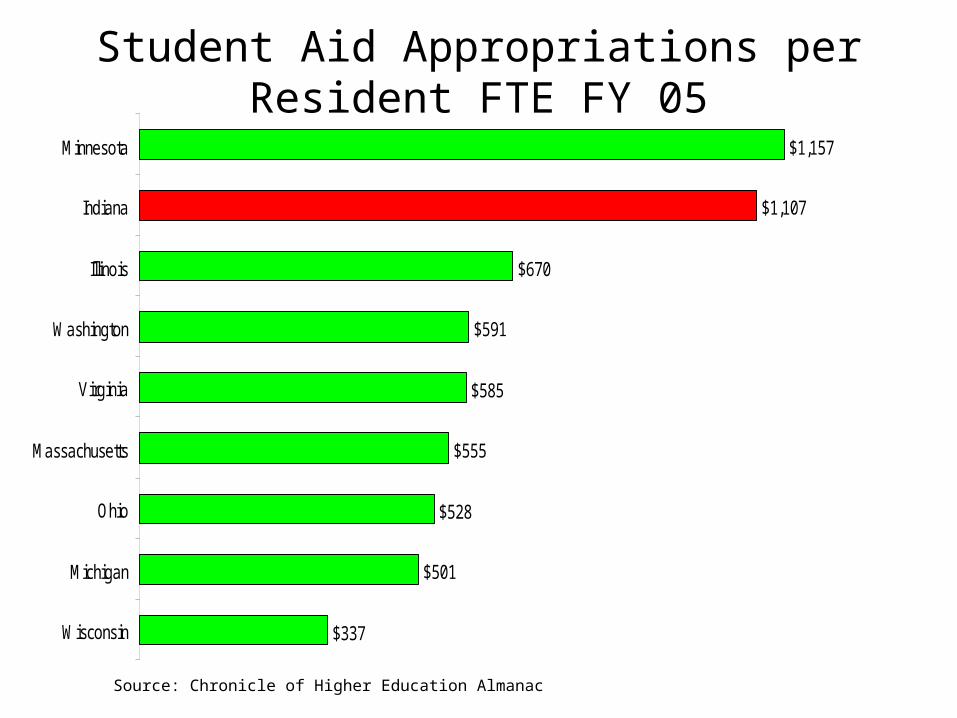
Student Aid Appropriations per Resident FTE FY 05
$337
$501
$528
$555
$585
$591
$670
$1,107
$1,157
Wisconsin
Michigan
Ohio
Massachusetts
Virginia
Washington
Illinois
Indiana
Minnesota
Source: Chronicle of Higher Education Almanac

Student Aid Appropriations per All FTE FY 05
$237
$271
$391
$404
$471
$473
$504
$800
$828
Massachusetts
Wisconsin
Ohio
Michigan
Illinois
Virginia
Washington
Minnesota
Indiana
Source: Chronicle of Higher Education Almanac

Total Higher Education and Student Aid Appropriations per capita FY 06
$160
$205
$221
$224
$234
$237
$271
$275
$320
Massachusetts
Ohio
Wisconsin
Michigan
Illinois
Virginia
Washington
Indiana
Minnesota
Source: Chronicle of Higher Education Almanac

Total Higher Education and Student Aid Appropriations per FTE (FY 05)
$4,529
$4,577
$5,176
$5,229
$5,310
$5,442
$5,818
$6,466
$6,817
Michigan
Wisconsin
Ohio
Virginia
Illinois
Massachusetts
Washington
Indiana
Minnesota
Source: Chronicle of Higher Education Almanac

Average Tuition 4yr. Public Institutions
Fall 04 (U.S. DOE)
$4,926
$5,290
$5,556
$5,666
$6,189
$6,478
$6,497
$7,010
$8,041
Washington
Wisconsin
Virginia
Indiana
Michigan
Minnesota
Illinois
Massachusetts
Ohio
Source: Chronicle of Higher Education Almanac

Average Tuition 2yr. Public Institutions
Fall 04 (U.S. DOE)
$1,929
$1,936
$1,952
$2,390
$2,599
$2,796
$2,844
$2,999
$3,839
Virginia
Michigan
Illinois
Washington
Indiana
Wisconsin
Massachusetts
Ohio
Minnesota
Source: Chronicle of Higher Education Almanac

Average Tuition 4yr. Independent
Institutions Fall 04 (U.S. DOE)
$13,253
$17,010
$18,380
$18,941
$18,996
$19,031
$19,510
$20,112
$25,935
Michigan
Virginia
Wisconsin
Ohio
Illinois
Washington
Minnesota
Indiana
Massachusetts
Source: Chronicle of Higher Education Almanac

Federally Funded Expenditures on Research & Development (NSF FY 04, $000)
Source: NCHEMS using NSF data, 2004.
195,032
306,237
313,517
365,336
526,823
562,845
705,963
820,716
847,844
1,066,129
1,580,959
Kentucky
Iowa
Minnesota
Indiana
Virginia
Wisconsin
Washington
Michigan
Ohio
Illinois
Massachusetts

Federally Funded Expenditures on Research & Development per Capita (NSF FY 04)
47.1
58.7
61.5
70.4
74
81.2
83.9
102.3
103.7
113.7
246.7
Kentucky
Indiana
Minnesota
Virginia
Ohio
Michigan
Illinois
Wisconsin
Iowa
Washington
Massachusetts
Source: NCHEMS using NSF data, 2004.

Total Expenditures on Research & Development (NSF FY 04, $000)
Source: NCHEMS using NSF data, 2004.
424,013
524,260
531,770
840,957
848,556
896,913
955,802
1,318,420
1,397,011
1,707,597
2,000,120
Kentucky
Minnesota
Iowa
Indiana
Virginia
Washington
Wisconsin
Ohio
Michigan
Illinois
Massachusetts

Total Expenditures on Research & Development per Capita (NSF FY 04)
102.4
102.9
113.4
115.1
134.3
135.1
138.3
144.5
173.7
180.1
312.2
Kentucky
Minnesota
Virginia
Ohio
Illinois
Indiana
Michigan
Washington
Wisconsin
Iowa
Massachusetts
Source: NCHEMS using NSF data, 2004.

Higher Education Budgeting in Indiana 102
CAMPUS PEER COMPARISONS

Revenues per FTE Student—Indiana Institutions as a Percentage of Peer Group Medians
Unrestricted: State, Local, Tuition, Fees, Private Gifts Per FTE
Restricted: Government Grants and Contracts
Per FTE
Total E&G Revenue Per FTE Student
102.196.8
114.399.3
125.6
86.981.9
109.0106.487.886.4
119.2126.5
113.483.791.574.380.991.670.895.777.577.475.5
118.095.695.3
119.4
44.568.2
113.984.061.9
38.563.934.455.841.275.251.3
195.8
43.280.0
174.880.484.7
102.055.6
101.5101.382.998.3
126.0203.097.3
139.8
81.083.3
110.9120.0112.1
79.771.087.197.079.085.597.3
136.6
99.477.490.674.276.491.362.790.979.873.276.0
117.1114.193.3
126.0
INDIANA UNIVERSITY-BLOOMINGTON PURDUE UNIVERSITY-MAIN CAMPUS
BALL STATE UNIVERSITY INDIANA UNIVERSITY-PURDUE UNIVERSITY-INDIANAPOLIS INDIANA STATE UNIVERSITY
INDIANA UNIVERSITY-PURDUE UNIVERSITY-FORT WAYNE UNIVERSITY OF SOUTHERN INDIANA INDIANA UNIVERSITY-SOUTH BEND INDIANA UNIVERSITY-NORTHWEST INDIANA UNIVERSITY-SOUTHEAST PURDUE UNIVERSITY-CALUMET CAMPUS INDIANA UNIVERSITY-KOKOMO INDIANA UNIVERSITY-EAST
PURDUE UNIVERSITY-NORTH CENTRAL CAMPUS IVY TECH STATE COLLEGE-NORTHCENTRAL IVY TECH STATE COLLEGE-CENTRAL INDIANA IVY TECH STATE COLLEGE-COLUMBUS IVY TECH STATE COLLEGE-EAST CENTRAL IVY TECH STATE COLLEGE-KOKOMO IVY TECH STATE COLLEGE-LAFAYETTE IVY TECH STATE COLLEGE-NORTHEAST IVY TECH STATE COLLEGE-SOUTH CENTRAL IVY TECH STATE COLLEGE-SOUTHWEST IVY TECH STATE COLLEGE-WABASH VALLEY IVY TECH STATE COLLEGE-WHITEWATER IVY TECH STATE COLLEGE-NORTHWEST IVY TECH STATE COLLEGE-SOUTHEAST VINCENNES UNIVERSITY IVY TECH STATE COLLEGE-BLOOMINGTON
Institution
Revenues
Below 90% of Peer Group Median 90 to 110% of Peer Group Median Above 110% of Peer Group Median
Source: NCHEMS,Indiana Taskforce on Affordability

Expenditures per FTE Student—Indiana Institutions as a Percentage of Peer Group Medians
Below 90% of Peer Group Median 90 to 110% of Peer Group Median Above 110% of Peer Group Median
Instruction Per FTEAcademic Support Per
FTEStudent Service Per
FTEInstitutional Support
Per FTEPlant Operation and
Maintenance Per FTE
INDIANA UNIVERSITY-BLOOMINGTON 103.7 68.2 89.5 148.6 79.3PURDUE UNIVERSITY-MAIN CAMPUS 93.9 66.5 69.3 91.1 107.4
BALL STATE UNIVERSITY 117.8 112.4 90.7 98.6 166.1INDIANA UNIVERSITY-PURDUE UNIVERSITY-INDIANAPOLIS 125.5 187.3 57.2 57.9 120.6INDIANA STATE UNIVERSITY 113.9 105.2 76.8 107.8 135.3
INDIANA UNIVERSITY-PURDUE UNIVERSITY-FORT WAYNE 96.8 40.6 53.0 77.4 94.3UNIVERSITY OF SOUTHERN INDIANA 70.0 63.9 59.0 93.3 72.9INDIANA UNIVERSITY-SOUTH BEND 112.3 99.9 38.4 91.6 88.0INDIANA UNIVERSITY-NORTHWEST 103.7 80.2 68.8 76.3 96.8INDIANA UNIVERSITY-SOUTHEAST 82.1 78.2 59.0 90.9 52.4PURDUE UNIVERSITY-CALUMET CAMPUS 111.1 40.2 68.8 78.1 116.4INDIANA UNIVERSITY-KOKOMO 87.4 124.0 64.2 101.5 96.5INDIANA UNIVERSITY-EAST 116.4 97.9 116.8 140.7 74.2
PURDUE UNIVERSITY-NORTH CENTRAL CAMPUS 117.7 19.4 63.0 126.7 121.6IVY TECH STATE COLLEGE-NORTHCENTRAL 71.2 96.6 48.9 58.7 83.8IVY TECH STATE COLLEGE-CENTRAL INDIANA 91.9 73.1 60.5 109.2 97.2IVY TECH STATE COLLEGE-COLUMBUS 68.6 57.2 57.8 91.6 73.0IVY TECH STATE COLLEGE-EAST CENTRAL 69.0 78.6 64.3 74.4 72.7IVY TECH STATE COLLEGE-KOKOMO 86.8 89.3 67.8 106.2 99.5IVY TECH STATE COLLEGE-LAFAYETTE 48.1 57.0 43.9 75.0 63.2IVY TECH STATE COLLEGE-NORTHEAST 77.2 112.9 58.1 72.9 72.4IVY TECH STATE COLLEGE-SOUTH CENTRAL 76.2 87.2 53.5 75.9 59.6IVY TECH STATE COLLEGE-SOUTHWEST 67.5 95.2 44.0 55.5 65.4IVY TECH STATE COLLEGE-WABASH VALLEY 81.7 37.6 49.3 57.0 59.5IVY TECH STATE COLLEGE-WHITEWATER 115.1 111.5 100.6 179.3 105.5IVY TECH STATE COLLEGE-NORTHWEST 93.3 53.5 72.7 105.2 78.3IVY TECH STATE COLLEGE-SOUTHEAST 70.3 51.5 65.1 172.3 149.4VINCENNES UNIVERSITY 126.9 86.2 69.8 71.1 95.0IVY TECH STATE COLLEGE-BLOOMINGTON
Institution
Expenditures
Source: NCHEMS,Indiana Taskforce on Affordability

Higher Education Budgeting in Indiana 102
INDIANA’S FISCAL POSITION

Change in Official Combined Reserve Balance including debt owed to Postsecondary Institutions,
Schools and Local Units of Government$2,264.9 $2,209.9
$1,841.3
$909.6
$160.5$13.6
-$190.0-$90.8
$41.9
$265.0
1998
1999
2000
2001
2002
2003
2004
2005
2006
2007
FY 07 estimated. Source: State Budget Agency

State General Fund and PTRC Revenue Growth FY00 – FY 07
2.9%
-3.0%-3.8%
13.4%
7.5% 7.5%
5.5% 5.4%
FY 00
FY 01
FY 02
FY 03
FY 04
FY 05
FY 06
FY 07
Note: FY 00-06 actual, FY 07 estimated. Source State Budget Agency

Compare State Revenue Growth with Higher Education Appropriations FY00 – FY 07
2.9%
-3.0%-3.8%
13.4%
7.5% 7.5%
5.5% 5.4%
8.8%
4.5%
-0.2%
0.0%0.7%
3.6%
2.0%2.8%
FY 00
FY 01
FY 02
FY 03
FY 04
FY 05
FY 06
FY 07
revenue growth higher education approps
State revenue forecast for FY 08 and FY 09 will be December 2006

Higher Education Budgeting in Indiana 102
DEBT SERVICE

Change in State Appropriations FY01 – FY 07
11.4%
-6.6%
23.1%
-17.7%
-67.0%
Operating Line Items Fee replacement Other Op cash capital (R&R)

Debt Service as a Percentage of Operating and Debt Service Appropriations 1975-2005
0.0%
2.0%
4.0%
6.0%
8.0%
10.0%
12.0%

New Appropriations FY 06$28.6 million
R&R
SSACI
Univ line items
fee replacement
operating only
other line items

New Appropriations FY 07$44.8 million
operating only
Univ line items
other line items
R&R
SSACI
fee replacement
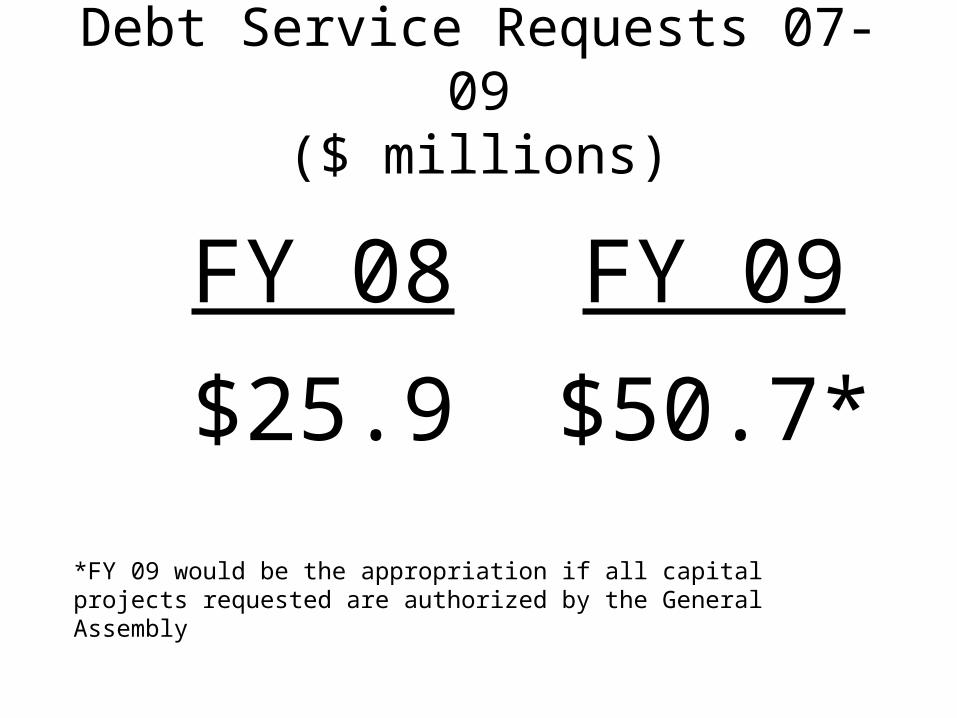
Debt Service Requests 07-09($ millions)
FY 08 FY 09
$25.9 $50.7*
*FY 09 would be the appropriation if all capital projects requested are authorized by the General Assembly

Plant Expansion
Continuation of method implemented in 2003-05– Nonresearch facilities receive the lesser of the
statewide average personal services and general S&E per GSF + campus utilities per GSF or the actual request
– Research facilities calculated in same manner, but using statewide research facility average for personal services and general S&E + campus research facility utility costs per GSF
– New leases requested in plant expansion

Plant Expansion Requests 07-09($ millions)
FY 08 FY 09
$10.0 $14.3

Higher Education Budgeting in Indiana 102
DEGREE COMPLETION INCENTIVE

Degree Production Incentive
• While it is very important to fund growth, the State should consider outputs as well as inputs in its funding decisions
• Increasing graduation rates and decreasing time to degree is good for students, parents, institutions, and the State
• The State should consider a base adjustment that rewards institutions for graduating more students faster

Six-Year Degree-Completion Rates in Indiana Postsecondary Education by Race
and Degree
33%
26%30%
47%
35%
56%
0%
10%
20%
30%
40%
50%
60%
All Students African American Hispanic
Associate Degree Baccalaureate Degree
Source: National Center for Education Statistics, 2003 IPEDS Graduation Rate Survey

Six-Year Graduation Rates Relative to Peer Groups
Indiana University-Bloomington
Purdue University-Main Campus
Ball State University
Indiana University-Purdue University-Indianapolis
Indiana State University
Indiana University-Purdue University-Fort Wayne
University of Southern Indiana
Indiana University-South Bend
Indiana University-Northwest
Indiana University-Southeast
Purdue University-Calumet Campus
Purdue University-North Central Campus
Indiana University-Kokomo
Indiana University-East
INDIANA UNIVERSITY-BLOOMINGTON
PURDUE UNIVERSITY-MAIN CAMPUS
BALL STATE UNIVERSITY
INDIANA UNIVERSITY-PURDUE UNIVERSITY-INDIANAPOLIS
INDIANA STATE UNIVERSITY
INDIANA UNIVERSITY-PURDUE UNIVERSITY-FORT WAYNE
UNIVERSITY OF SOUTHERN INDIANA
INDIANA UNIVERSITY-SOUTH BEND
INDIANA UNIVERSITY-NORTHWEST
INDIANA UNIVERSITY-SOUTHEAST
PURDUE UNIVERSITY-CALUMET CAMPUS
PURDUE UNIVERSITY-NORTH CENTRAL CAMPUS
INDIANA UNIVERSITY-KOKOMO
INDIANA UNIVERSITY-EAST
Range of Peer Groups
0% 10% 20% 30% 40% 50% 60% 70% 80% 90% 100%
Source: National Center for Higher Education Management Systems (IPEDS Graduation Rate Survey, 2003)

Degree Production Incentive as proposed 05-07
• Funding for 4-yr institutions based on improvement in baccalaureate degrees awarded per Hoosier FTE
• Funding for 2-year institutions based on improvement in associate’s degrees awarded per Hoosier FTE
• Incentive pays $3,500 per FTE, same as enrollment change subsidy rate
• Using baccalaureate degrees per Hoosier FTE provides for the inclusion of part-time and transfer students

Higher Education Budgeting in Indiana 102
SPECIAL APPROPRIATION REQUESTS

Economic Development Related Higher Education Special Appropriation Requests
FY 08 FY09
Life Sciences (IU) 30,000,000 50,000,000
Purdue Indiana's New Manufacturing Economy $5,000,000 $5,000,000
International Ctr for Motorsports Studies (ISU) $500,000 $1,050,000
Ctr for Research, Enterprise & Econ Develop (ISU) $400,000 $850,000
Econ Devel Outreach In SW Indiana (USI) $950,000 $1,800,000
Strategic Skills Initiative (VU) $3,500,000 $6,000,000