high voltage mg-doped na ni mg mn o = 0.05, 0.1) na- · ‡department of materials, university of...
TRANSCRIPT

High Voltage Mg-Doped Na0.67Ni0.3−xMgxMn0.7O2 (x = 0.05, 0.1) Na-Ion Cathodes with Enhanced Stability and Rate CapabilityGurpreet Singh,†,⊥ Nuria Tapia-Ruiz,‡,⊥ Juan Miguel Lopez del Amo,† Urmimala Maitra,‡
James W. Somerville,‡ A. Robert Armstrong,§ Jaione Martinez de Ilarduya,† Teofilo Rojo,*,†,∥
and Peter G. Bruce*,‡
†CICenergigune, Parque Tecnologico de Alava, Albert Einstein 48, ED.CIC, 01510 Minano, Spain‡Department of Materials, University of Oxford, Oxford OX1 3PH, United Kingdom§School of Chemistry, University of St. Andrews, St. Andrews, Fife KY16 9ST, United Kingdom∥Departamento de Química Inorganica, Universidad del País Vasco UPV/EHU, P.O. Box. 644, 48080 Bilbao, Spain
*S Supporting Information
ABSTRACT: Magnesium substituted P2-structure Na0.67Ni0.3Mn0.7O2 materials have been prepared by a facile solid-statemethod and investigated as cathodes in sodium-ion batteries. The Mg-doped materials described here were characterized by X-ray diffraction (XRD), 23Na solid-state nuclear magnetic resonance (SS-NMR), and scanning electron microscopy (SEM). Theelectrochemical performance of the samples was tested in half cells vs Na metal at room temperature. The Mg-doped materialsoperate at a high average voltage of ca. 3.3 V vs Na/Na+ delivering specific capacities of ∼120 mAh g−1, which remain stable up to50 cycles. Mg doping suppresses the well-known P2−O2 phase transition observed in the undoped composition by stabilizingthe reversible OP4 phase during charging (during Na removal). GITT measurements showed that the Na-ion mobility isimproved by 2 orders of magnitude with respect to the parent P2−Na0.67Ni0.3Mn0.7O2 material. The fast Na-ion mobility may bethe cause of the enhanced rate performance.
■ INTRODUCTION
Over the last two decades, most of the portable electronicmarket has been dominated by lithium-ion batteries (LIBs).These batteries are now finding new market opportunities inthe electric vehicle industry along with stationary energystorage.1 Even though the high energy density of lithium-ionbatteries makes them attractive for many applications, there is ademand for inexpensive technology for which the sources of theores are more uniformly distributed across the globe. Sodium-ion batteries (SIBs) are a promising alternative, addressing theaforementioned issues related to the cost and sources.Following their inception in the 1980s these batteries areunder reinvestigation as an alternative to LIBs for certainapplications.2−6 Various types of cathode and anode materialshave been proposed and studied for SIBs, often mimicking theirLIB counterparts. Among cathode materials, layered oxidecompounds of the type Na−TM−O2 (TM = 3d transition
metal) have shown promise in terms of energy density and ratecapability. The most studied layered compounds can beclassified as P2-type and O3-type structures as described byDelmas’ notation.7 P and O refer to the Na coordination, i.e.,trigonal prismatic or octahedral, respectively, while the numberrepresents the repeated transition metal oxide stacking withinthe unit cell (ABBA, ABCABC). Of these two layeredstructures, P2-type compounds provide great promise as theyundergo fewer structural transitions when (de)intercalating Na-ions.2
P2−Na2/3Ni1/3Mn2/3O2 was first reported in 2001 by Lu andDahn.8,9 This material has a relatively high theoretical capacity(173 mAh g−1), but more importantly, it shows an average
Received: May 13, 2016Revised: June 27, 2016Published: June 27, 2016
Article
pubs.acs.org/cm
© 2016 American Chemical Society 5087 DOI: 10.1021/acs.chemmater.6b01935Chem. Mater. 2016, 28, 5087−5094
This is an open access article published under a Creative Commons Attribution (CC-BY)License, which permits unrestricted use, distribution and reproduction in any medium,provided the author and source are cited.

operating voltage greater than 3.5 V (vs Na/Na+), attributed tothe Ni2+/Ni4+ redox couple.10,11 The main drawback, however,is its poor cycle life, which has been attributed to thedetrimental P2−O2 transformation that occurs at high voltages.This transition is caused by gliding of the transition metal layersupon sodium removal.8,9,12 In order to address the issue ofcapacity fade, doping of Na0.67Ni0.33Mn0.67O2 with ions such asZn2+ or Ti4+ (substituting for Ni and Mn, respectively) hasbeen adopted.13,14 Doping with these cations increases theamount of sodium left in the structure at the end of charge,alleviating the layer gliding at the expense of capacity. Similarly,Li+ doping accompanied by an increase in sodium content to0.85 (i.e., Na0.85Li0.17Ni0.21Mn0.64O2) stabilizes the structurewhile cycling with reversible capacities of ∼120 mAh g−1.15
Recent reports in the literature have shown that Mg doping onthe transition metal site improved the cycling stability of P2−Na2/3Mn1−xMgxO2 (0 ≤ x ≤ 0.2) while smoothing the charge/discharge voltage profiles.16 Moreover, further increase in theMg content led to an abnormally high capacity due to theparticipation of oxygen anions and/or partial loss of oxygen,although the capacity of the material falls at a faster ratecompared with the lightly doped samples.17 Recent reports,have shown that Mg could also be substituted in the Na−Mn−Ni−O system.18−20 Even though in these reports the authorshave highlighted the suppression of the O2 phase when dopingwith Mg2+, no identification and characterization of the OP4phase occurring at high voltages in the Mg-doped materials wasmade. Here we report a systematic study on effective Mg-doping in the P2−Na0.67Ni0.3Mn0.7O2 system and have shownthat in the Mg-doped compounds a reversible P2−OP4transition occurs at high voltages in contrast to the P2−O2transition observed in the undoped material. Reducing the Nicontent from the typical Na2/3Ni1/3Mn2/3O2 material8,9 isbeneficial from a cost perspective. Increased Mg contents favorNa+ vacancy disorder upon cycling, which could explain theincreased Na-ion mobility observed in these materials.
■ EXPERIMENTAL SECTIONNa0.67Ni0.3Mn0.7O2 was synthesized as described in ref 12. The Mg-doped samples were synthesized via a solid state synthesis route bymixing the precursors Na2CO3 (Sigma-Aldrich, anhydrous ≥99.5%),NiO (Ni 78.5%, Alfa Aesar), Mn2O3 (−325 mesh, 99%, Sigma-Aldrich) and MgO (99.99% Alfa Aesar) in appropriate ratios. Thepowdered mixture was pressed as pellets under a load of 4 tons cm−2
before calcining at 900 °C for 12 h in air followed by slow cooling inthe furnace. Samples were kept in an Ar filled glovebox maintained at<0.1 ppm of H2O and O2.Powder X-ray diffraction (PXRD) patterns were recorded on a 9
KW Rigaku Smartlab diffractometer using Cu Kα1 radiation (λ =1.54051 Å). PXRD data was refined by the Rietveld method using theGSAS software suite with the EXPGUI software interface.21 Acustomized airtight sample holder covered with Kapton film wasused to avoid severe air/moisture contact during measurement. In situX-ray diffraction was performed on electrochemical cells equippedwith an aluminum-coated beryllium window. The active material (70wt %) was mixed with carbon black (30 wt %) for 1 h and used in theelectrochemical cells for the charge/discharge measurements. X-raydiffraction data were collected using Cu Kα1 radiation (λ = 1.54051Å). Each X-ray pattern was collected for 1 h. Metallic sodium was usedas counter electrode with 1 M NaPF6 in EC/DEC (1:1 by vol %) aselectrolytic solution. The cell was cycled at 5 mA g−1 between 2.0 and4.5 V.Chemical analyses were performed by inductively coupled plasma
(ICP) emission spectroscopy using a PerkinElmer Elan 6100 DRCICP-MS.
The sample morphology was determined using scanning electronmicroscopy (SEM, Zeiss Merlin Analytical) at 1 kV and 84 μA.
Ni and Mn K-edge X-ray absorption spectra (XAS) were collectedin transmission mode at the B18 Core EXAFS beamline at DiamondLight Source. Reference spectra were simultaneously collected for eachmeasurement using Ni and Mn metal foil. Three scans were collectedfor each sample and the data were averaged. The Ifeffit softwareanalysis suite was used for the background corrections andnormalisation (Athena).22
23Na magic angle spinning nuclear magnetic resonance (MASNMR) experiments were performed at 52.9 MHz, on a Bruker-300spectrometer charged to a field of 4.7 T. A 1.3 mm standard probehead was used, and the rotor MAS spinning speed used was 50 kHz inall cases. A rotor synchronized spin−echo pulse sequence (90°−τ−180°−τ1−acquisition) was used with typical 90° and 180° pulses of1.2 and 2.4 μs, respectively, and the recycle delay was set to 0.8 s. Thespectra were referenced to a 0.1 M solution of 23NaCl. The fitting ofthe 23Na NMR signals were performed using the Dmfit software.23
Electrode preparation involved mixing the active material withconductive carbon black and PVDF (polyvinylidene fluoride) as binderin the ratio of 75:15:10, respectively. Slurries were prepared by addinga few drops of NMP (n-methyl-2-pyrrolidone) to the mixture underconstant stirring for 30 min. The slurry was cast onto Al foil that actsas current collector. Loading of active material for the galvanostaticcycling is 5.81 mg cm−2 and for GITT measurements is 2 mg cm−2.The coated foil was dried under vacuum at 120 °C for 2 h andelectrodes of desired diameter were punched out and pressed under aload of 4 tons cm−2. Galvanostatic cycling was performed in CR2032coin cells, where metallic sodium was used as counter electrode withglass fiber filter paper (Whatman) as separator and 1 M NaPF6(99.99% Sigma-Aldrich) in EC/DEC (1:1 by vol%) as the electrolyte.Electrochemical cells were charged/discharged at different currentrates between 2 and 4.5 V. AC impedance spectroscopy was carriedout in a VMP3 (Bio Logic) in the frequency range 200 kHz to 5 mHz.Measurements were conducted in a 2-electrode cell (coin-cell type)with an AC signal amplitude of 10 mV.
■ RESULTS AND DISCUSSION
Figure 1 shows the refined powder X-ray diffraction (PXRD)plots of Na0.67Ni0.3−xMgxMn0.7O2, where x = 0.05 (a) and x =0.1 (b). Table 1 shows the relevant crystallographic dataobtained from the Rietveld refinements. For comparison,refinement data on the undoped material are also shown inthe SI. Detailed inspection of PXRD data showed extrareflections at 20° 2θ (not shown here) from the honeycomb√3a × √3a in-plane ordering typically seen in Mg2+/Mn4+
systems.15 By contrast, the observation of Ni2+/Mn4+ orderingis difficult by PXRD as the X-ray scattering factors of Ni andMn are very similar. The similar refined lattice parametersobserved in these samples suggest that the long-range structureremains unaltered when increasing from x = 0.05 to 0.1 (Table1). Transition metal occupancy factors were fixed using thenominal stoichiometry, which matched, in turn, the valuesobtained from ICP (Table 2). Slightly larger SOF wereobserved for Nae sites (edge-shared) since these are energeti-cally more favorable from the electrostatic point of view thanthe Naf site (face-shared).The morphological features and particle size of the pristine
materials were determined by scanning electron microscopy(SEM). SEM micrographs showed irregular particles withhexagonal platelet shapes and sizes ranging between 1 and 5μm (Figure 2). The 23Na solid state NMR spectra ofNa0.67Ni0.3−xMgxMn0.7O2 (x = 0, 0.05, and 0.1) are shown inFigure 3. The spectra are characterized by a main signalcentered at around 1420 ppm corresponding to the centraltransition of one or more 23Na NMR signals broadened by
Chemistry of Materials Article
DOI: 10.1021/acs.chemmater.6b01935Chem. Mater. 2016, 28, 5087−5094
5088

second order quadrupolar interactions. The two minorsymmetric signals marked by asterisks in the spectra arerotational side bands, and the signal at around 0 ppmcorresponds to a minor diamagnetic Na2CO3 impurity of thesample.24−26 The quadrupolar features observed in the 23NaNMR spectrum of P2−Na0.67Ni0.3Mn0.7O2 (black) areindicative of a high degree of structural ordering in thematerial. As previously discussed by Cabana and co-workers,24
the 23Na NMR spectrum of this compound cannot besatisfactorily fitted considering a single line, consistent with
the presence of more than one Na+ site in the alkali layers ofthe structure. Although an unambiguous fitting of the spectrumwould require the measurement of the NMR signal at different
Figure 1. Fitted powder X-ray diffractograms at room temperature forNa0.67Ni0.3−xMgxMn0.7O2 where x = 0.05 (a); and x = 0.1 (b).Observed data are shown in red, calculated data are shown in green,and the difference between the two profiles is shown in pink. Black tickmarks indicate Bragg reflections from the calculated data.
Table 1. Selected Rietveld Refinement Data from X-Ray Data at Room Temperature for Na0.67Ni0.3−xMgxMn0.7O2 (x = 0.05 and0.1)
sample atom Wyckoff position X Y Z SOF Biso (Å2)
x = 0.05 Na(e) 2d 2/3 1/3 0.25 0.374(1) 2.8 (1)a = 2.88482(2) Å Na(f) 2b 0 0 0.25 0.296(1) 1.2 (1)c = 11.1583(2) Å Ni/Mn/Mg 2a 0 0 0 0.25/0.7/0.05 2.51(4)χ2 = 1.806Rp = 1.70% O 4f 2/3 1/3 0.0898(1) 1 2.82(1)Rpw = 2.29%x = 0.1 Na(e) 2d 2/3 1/3 0.25 0.403(2) 3.8(1)a = 2.88482(3) Å Na(f) 2b 0 0 0.25 0.267(2) 1.0(1)c = 11.1587(2) Å Ni/Mn/Mg 2a 0 0 0 0.2/0.7/0.1 2.94(2)χ2 = 2.301Rp = 1.78% O 4f 2/3 1/3 0.0912(1) 1 3.34(6)Rpw = 2.55%
Table 2. Nominal Compositions for Na0.67Ni0.3−xMgxMn0.7O2(x = 0.05 and 0.1) Obtained from ICP Measurements
molar fractiona
x = 0.05 x = 0.1
M Na0.66Ni0.26Mg0.04Mn0.7O2 Na0.67Ni0.20Mg0.09Mn0.71O2
Na 0.66 0.67Ni 0.26 0.20Mn 0.70 0.71Mg 0.04 0.09
aErrors are within 5% of the values given.
Figure 2. SEM images of (a) Na0.67Ni0 .3Mn0.7O2, (b)Na0.67Ni0.25Mg0.05Mn0.7O2, and (c) Na0.67Ni0.2Mg0.1Mn0.7O2, showinga platelet-like morphology with average particle size in the 1−5 μm.
Figure 3. 23Na NMR spectra of Na0.67Ni0.3−xMgxMn0.7O2 (x = 0, 0.05,and 0.1). The second order quadrupolar features observed in thespectrum of Na0.67Ni0.3Mn0.7O2 disappear gradually as the level of Mgis increased, in agreement with a reduction of the structural ordering ofthe Na+ ions in the structure.
Chemistry of Materials Article
DOI: 10.1021/acs.chemmater.6b01935Chem. Mater. 2016, 28, 5087−5094
5089
fields, an accurate fit is possible considering two 23Napopulations with the relative intensities obtained from theRietveld refinement on the PXRD data (Table 1). The result ofthis fitting is shown in Figure S2.It is clear from the inspection of the inset of Figure 3 that the
quadrupolar features observed in the spectrum of P2−Na0.67Ni0.3Mn0.7O2 vanish gradually when the level of Mg2+
doping is increased progressively to 0.05 and 0.1. Mg2+ ionsfavor the presence of new Na+ environments, which result inbroadening of the 23Na NMR signals observed in Figure 3, andthe subsequent disappearance of the quadrupolar features. The23Na NMR broadening can be additionally induced by theincreased Na+ mobility in the Mg doped phases (as will bedescribed below).The 23Na NMR shifts observed for the central transition in
Figure 3 are very large, as expected by the presence of Na−O−M (M = Ni, Mn) hyperfine interactions with paramagneticcenters, in agreement with the spectra previously recorded byCabana et al. for the NaxNix/2Mn1−x/2O2 family.24 Thehyperfine interactions generating such large shifts are verysensitive to variations in Na−O−M distances and angles, andthe signs of the interactions can be positive or negative withvariable magnitudes depending on the local geometries of theorbitals and the number of unpaired electrons involved in theinteraction. Although the replacement of a paramagnetic Ni2+
ion in the structure by an Mg2+ cation with no unpairedelectron density should, in principle, give rise to a signal with adifferent shift in the NMR spectrum, no significant changes inthe 23Na NMR shifts are observed for the different spectra ofFigure 3. Similar observations were made for the 23Na NMRshifts of the NaxNix/2Mn1−x/2O2 polytype and for the 6Li NMRsignals in LixNix/2Mn1−x/2O2. Very subtle variations of shiftswere observed in both cases despite the different Mn4+/Ni2+
ratios.24 These results were explained by the small variations ofinterlayer spacing in these compounds that result in differentstrengths of the Fermi contact interaction that compensate thedifferent paramagnetism in Mn4+/Ni2+.The electrochemical performance of the various samples has
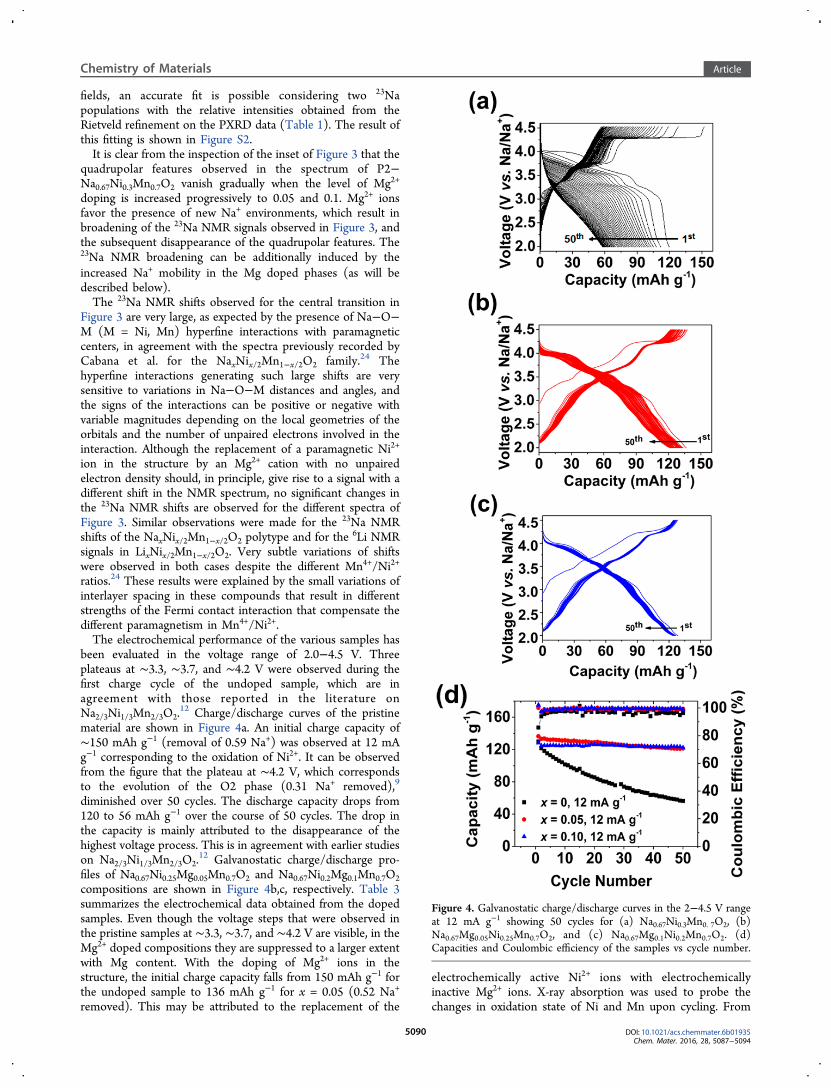
been evaluated in the voltage range of 2.0−4.5 V. Threeplateaus at ∼3.3, ∼3.7, and ∼4.2 V were observed during thefirst charge cycle of the undoped sample, which are inagreement with those reported in the literature onNa2/3Ni1/3Mn2/3O2.
12 Charge/discharge curves of the pristinematerial are shown in Figure 4a. An initial charge capacity of∼150 mAh g−1 (removal of 0.59 Na+) was observed at 12 mAg−1 corresponding to the oxidation of Ni2+. It can be observedfrom the figure that the plateau at ∼4.2 V, which correspondsto the evolution of the O2 phase (0.31 Na+ removed),9
diminished over 50 cycles. The discharge capacity drops from120 to 56 mAh g−1 over the course of 50 cycles. The drop inthe capacity is mainly attributed to the disappearance of thehighest voltage process. This is in agreement with earlier studieson Na2/3Ni1/3Mn2/3O2.
12 Galvanostatic charge/discharge pro-files of Na0.67Ni0.25Mg0.05Mn0.7O2 and Na0.67Ni0.2Mg0.1Mn0.7O2compositions are shown in Figure 4b,c, respectively. Table 3summarizes the electrochemical data obtained from the dopedsamples. Even though the voltage steps that were observed inthe pristine samples at ∼3.3, ∼3.7, and ∼4.2 V are visible, in theMg2+ doped compositions they are suppressed to a larger extentwith Mg content. With the doping of Mg2+ ions in thestructure, the initial charge capacity falls from 150 mAh g−1 forthe undoped sample to 136 mAh g−1 for x = 0.05 (0.52 Na+
removed). This may be attributed to the replacement of the
electrochemically active Ni2+ ions with electrochemicallyinactive Mg2+ ions. X-ray absorption was used to probe thechanges in oxidation state of Ni and Mn upon cycling. From
Figure 4. Galvanostatic charge/discharge curves in the 2−4.5 V rangeat 12 mA g−1 showing 50 cycles for (a) Na0.67Ni0.3Mn0. 7O2, (b)Na0.67Mg0.05Ni0.25Mn0.7O2, and (c) Na0.67Mg0.1Ni0.2Mn0.7O2. (d)Capacities and Coulombic efficiency of the samples vs cycle number.
Chemistry of Materials Article
DOI: 10.1021/acs.chemmater.6b01935Chem. Mater. 2016, 28, 5087−5094
5090

the results we can establish that the capacity mainly originatesfrom the redox active Ni2+/Ni4+ couple. Small changes in themanganese K edge associated with the Mn3+/Mn4+ redoxcouple were observed (Figures S3 and S4). A further drop inthe initial charge capacity to ∼128 mAh g−1 (0.48 Na+
removed) is observed when x = 0.1. For x = 0.05, thedischarge capacity drops from 136 to 121 mAh g−1 after 50cycles at a rate of 12 mA g−1, which corresponds to ∼90% ofcapacity retention. For x = 0.1, the discharge capacity falls from128 to 122 mAh g−1 after 50 cycles, which corresponds to 95%of the initial capacity. For all compositions an average operatingvoltage of ∼3.3 V was observed. Evolution of the capacity withthe cycle life is shown in Figure 4d. Ex situ X-ray diffraction wascarried out after 50 charge/discharge cycles. Cells were openedafter discharging the samples to 2.0 V. X-ray diffraction patternsof the Mg-doped samples after 50 cycles are shown in FigureS5. Lattice parameters of the Na0.67Ni0.2Mg0.1Mn0.7O2 material(Table S3) remained almost identical after 50 cycles, whereasfor the undoped sample a large increase in the c parameter wasobserved due to sodium loss upon cycling.In situ X-ray diffraction of P2−Na0.67Ni0.33Mn0.67O2 has been
reported in previous studies showing the structural evolution asNa ions are removed and reinserted in the material.9 Thestructure changes from P2 to O2 as the cell voltage reaches∼4.25 V, as shown by the evolution of the characteristic (002)peak present Figure 4. Galvanostatic charge/discharge curves inthe 2−4.5 V near 2θ ≈ 20°. An identical phase transition hasbeen observed in the undoped Na0.67Ni0.3Mn0.7O2 materialstudied here (Figure S6). In order to study the effects of Mg onthe structure upon cycling, we have performed in situ PXRDmeasurements on the x = 0.1 doped sample (i.e.,Na0.67Ni0.2Mg0.1Mn0.7O2, Figure 5). Changes in the a and clattice parameters upon cycling are shown in Figure S7 andTable S2. No characteristic peak corresponding to the O2phase is observed in the high voltage region (4.2−4.5 V).However, evolution of a clear broad peak as a shoulder on thehighest intensity peak corresponding to the P2 phase isobserved at ca. 0.35 Na content. This broad peak ischaracteristic of the OP4 phase, which has been describedpreviously as an intergrowth structure between the P2- and O2-type structures.16 From these results we believe that thesuppression of the P2−O2 phase transition in the Mg-dopedsample is responsible for the excellent cycling performance. Infact, several authors have related the P2−OP4 transition toenhanced electrochemical performance.16,27
To further analyze the galvanostatic charge/discharge curveswe have calculated the derivative of the capacity with respect tovoltage. The differential capacity plots are shown in Figure S8.Peaks corresponding to different voltage plateaus in thegalvanostatic charge/discharge curves were observed in the
Table 3. Summary of Electrochemical Data for Na0.67Ni0.3−xMgxMn0.7O2 (x = 0.05 and 0.1) Samples at Different Current Rates
current (mA g−1) x = 0.05 x = 0.1
12 initial discharge capacity (mAh g−1) 136.4 128.2discharge capacity after 50 cycles (mAh g−1) 121.4 122.4capacity retention (%) 89.0 95.4
200 initial discharge capacity (mAh g−1) 124.5 128.6discharge capacity after 50 cycles (mAh g−1) 113.9 123.7capacity retention (%) 91.5 96.2
400 initial discharge capacity (mAh g−1) 110.6 118.1discharge capacity after 50 cycles (mAh g−1) 95.0 111.7capacity retention (%) 85.9 94.6
Figure 5. (a) Galvanostatic charge/discharge curves (1st cycle) and(b) in situ powder X-ray diffraction of Na0.67Ni0.2Mg0.1Mn0.7O2showing the reversible evolution of P2−OP4 phase transition at theend of the charge and beginning of the discharge. (c) Zoomed regionshowing (002) reflection and OP4 phase. In (b) ■ shows the peakscorresponding to the Be window used and ● corresponds to thepresence of the Al current collector. Each X-ray diffraction pattern wascollected for 1 h.
Chemistry of Materials Article
DOI: 10.1021/acs.chemmater.6b01935Chem. Mater. 2016, 28, 5087−5094
5091

differential capacity plots. The oxidation peak at ∼4.25 V isattributed to the P2−O2 phase transition in the pristine sample(Figure S8a). The reduction peak corresponding to the O2−P2phase transition appears at ∼4.0 V. This peak disappears andshifts to lower potential with cycling, showing damage to thecrystal structure caused by this phase transition. By contrast, inthe doped samples, from the second cycle onward, nosignificant change in the peak position or intensity is observed.This could be due to the suppression of the P2−O2 phasetransition by Mg doping and consequent formation of the morereversible OP4 phase at high voltages (Figure S8b,c).This demonstrates the significant stabilizing effect of the
Mg2+ ions in the structure. The differential capacity plots of thedoped samples show additional peaks at low voltages, which areattributed to Mn3+/Mn4+ redox processes. The theoreticalcapacity based on Ni2+/Ni4+ is slightly lower than theexperimentally observed capacity, which is further evidence ofthe activation of the Mn3+/Mn4+ redox couple in thesematerials.The rate capability of the materials is shown in Figure 6,
where it is apparent that the Mg doping increases the rate
performance and capacity retention if compared to theundoped material. For x = 0.1, the initial discharge capacitydecreases from 128 to 118 mAh g−1 (92% retention) when therate is increased 2-fold from 200 to 400 mA g−1. Additionalelectrochemical data is shown in Table 3. Ex situ XRD dataNa0.67Ni0.3−xMgxMn0.7O2 (x = 0.05 and 0.1) after 50 cycles(charged at 10 mA g−1 and discharged at 200 and 400 mA g−1)are shown in Figures S9 and S10. XRD patterns of bothsamples could be indexed to the pristine materials describedabove, showing the robustness of these structures upon cycling.The broadening observed in the peaks was attributed to largeconcentration gradients across the particles caused by the highstress produced in the materials when cycling at fast rates(Table S4).The enhanced rate capability of the Mg-doped compounds
described here was further investigated using galvanostaticintermittent titration methods (GITT). GITT measurementswere also conducted on as-synthesized P2−Na0.67Ni0.3Mn0.7O2for further comparison (Figures S11−S13). For GITTmeasurements a pulse of 1.7 μA was applied for 1 h followedby a relaxation time of 2 h. Figure 7 shows the variation of the
Na diffusion coefficient (DNa+) in the studied samples
determined from the GITT profiles. The DNa+ is calculated
using equation S(i) (see SI). Na-ion mobility inNa0.67Ni0.2Mg0.1Mn0.7O2 is the highest of all the materialsdescribed here, with diffusion coefficients ranging from 10−7 to10−10 cm2 s−1 in the Na range 0.67 ≥ x ≥ 0.33. Comparablesodium diffusion coefficients were obtained by AC impedancein order to validate these results (Figure S14). Li et al. have alsoobserved improved high-rate performance in the Mg- and Ni-doped Na0.67MnO2 with formula Na0.67Ni0.1Mg0.1Mn0.8O2 andexplained this with the expansion of the interplanar spacing ofthe sodium layer caused by shortening of the TM−O bondlengths and the shrinkage of the TMO6 octahedra.19 Theseobservations may be caused by the greater Na disorder causedby the increased Mg content in the transition metal layers. P2−Na0.67Ni0.25Mg0.05Mn0.7O2 showed diffusion coefficients of 10−8
to 10−10 cm2 s−1 within the same range of sodium contents.These values are higher than those reported by Mendiboure etal. in P2−Na0.70MnO2 and P2−Na0.7CoO2 of 1.7 × 10⁻¹⁴ and 5× 10⁻¹² cm2 s−1, respectively.28 Interestingly, no jumps in theNa diffusion coefficient values, attributed to sodium ordering inthe undoped compound,29 were observed for x = 0.05 and x =0.1. Hence the results are in agreement with the smoothing ofthe load curves observed in these materials. The abruptdecrease in Na-ion mobility in the doped samples at highpotentials (low Na+ contents ∼0.35) could be explained by theformation of the OP4 structure caused by gliding of thetransition metal layers leading to octahedral Na+ vacancies.
■ CONCLUSIONSMagnesium doping in P2−Na0.67Ni0.3Mn0.7O2 enhances thecyclability and rate performance of the material in the 2−4.5 Vrange. Doping the structure with Mg2+ led to the formation ofthe OP4 phase at high voltages, and the P2−OP4 phasetransition is observed to be highly reversible as reflected by theX-ray diffraction data. The sodium-ion mobility is observed toimprove wi th Mg dop ing . Na - ion mob i l i t y inNa0.67Ni0.2Mg0.1Mn0.7O2 is the highest of all the materialsdiscussed in this study, with diffusion coefficients as high as10−7 cm2 s−1. Excellent capacity retention (∼95% of initial (128mAh g−1)) over 50 cycles with an average operating voltage
Figure 6. Cycling data of Na0.67Ni0.3−xMgxMn0.7O2 (x = 0, 0.05, and0.1) over 50 cycles. Samples were discharged at 200 and 400 mA g−1
and slowly charged at 10 mA g−1.
Figure 7. Na diffusion coefficients (DNa+) calculated from GITT
me a s u r em e n t s i n P 2−Na 0 . 6 7N i 0 . 3Mn 0 . 7O 2 ( b l a c k ) ,Na0.67Ni0.25Mg0.05Mn0.7O2 (red), and Na0.67Ni0.2Mg0.1Mn0.7O2 (blue)as a function of the Na concentration remaining in the structure.
Chemistry of Materials Article
DOI: 10.1021/acs.chemmater.6b01935Chem. Mater. 2016, 28, 5087−5094
5092

∼3.3 V vs Na/Na+ makes Na0.67Ni0.2Mg0.1Mn0.7O2 veryinteresting as a potential candidate for the sodium ion batteries.
■ ASSOCIATED CONTENT*S Supporting InformationThe Supporting Information is available free of charge on theACS Publications website at DOI: 10.1021/acs.chemma-ter.6b01935.
Rietveld plot; 23Na NMR data; X-ray absorption spectra;ex situ PXRD patterns; in situ X-ray data; variation oflattice parameters; differential capacity plots; ex situPXRD data; GITT profiles; impedance spectrum;selected Rietveld refinement data; refined latticeparameters and fraction of OP4 phase; calculated fwhm(PDF)
■ AUTHOR INFORMATIONCorresponding Authors*E-mail: [email protected].*E-mail: [email protected] Contributions⊥G.S. and N.T.R. contributed equally to this work. Themanuscript was written by G.S. and N.T.R. throughcontributions of all authors. The project was supervised byG.S., N.T.R., and P.G.B.NotesThe authors declare no competing financial interest.Research data has been deposited in ORA-data at DOI:10.5287/bodleian:aZjEYwA0b.
■ ACKNOWLEDGMENTSAt CIC Energigune this work was financially supported byLINABATT project from Ministerio de Economia Compet-itividad (ENE2013-44330-R). P.G.B. (University of Oxford) isindebted to the Engineering and Physical Sciences ResearchCouncil, including the SUPERGEN program, for financialsupport.
■ REFERENCES(1) Larcher, D.; Tarascon, J. M. Towards greener and moresustainable batteries for electrical energy storage. Nat. Chem. 2015, 1,19−29.(2) Palomares, V.; Serras, P.; Villaluenga, I.; Hueso, K. B.; Carretero-Gonzalez, J.; Rojo, T. Na-ion batteries, recent advances and presentchallenges to become low cost energy storage systems. Energy Environ.Sci. 2012, 5, 5884−5901.(3) Kundu, D.; Talaie, E.; Duffort, V.; Nazar, L. F. The emergingchemistry of sodium ion batteries for electrochemical energy storage.Angew. Chem., Int. Ed. 2015, 54, 2−20.(4) Ellis, B. L.; Nazar, L. F. Sodium and sodium-ion energy storagebatteries. Curr. Opin. Solid State Mater. Sci. 2012, 16, 168−177.(5) Kim, S.-W; Seo, D.-H.; Ma, X.; Ceder, G.; Kang, K. Electrodematerials for rechargeable sodium-ion batteries: potential alternativesto current lithium-ion batteries. Adv. Energy Mater. 2012, 2, 710−721.(6) Palomares, V.; Casas-Cabanas, M.; Castillo-Martínez, E.; Han, M.H.; Rojo, T. Update on Na-based battery materials. A growing researchpath. Energy Environ. Sci. 2013, 6, 2312−2337.(7) Delmas, C.; Fouassier, C.; Hagenmuller, P. Structuralclassification and properties of the layered oxides. Physica B+C1980, 99, 81−85.(8) Lu, Z.; Dahn, J. R. Can all the lithium be removed from T2-Li2/3[Ni1/3Mn2/3]O2? J. Electrochem. Soc. 2001, 148, A710−A715.(9) Lu, Z.; Dahn, J. R. In-situ X-ray diffraction study of P2-Na2/3[Ni1/3Mn2/3]O2. J. Electrochem. Soc. 2001, 148, A1225−A1229.
(10) Talaie, E.; Duffort, V.; Smith, H. L.; Fultz, B.; Nazar, L. F.Structure of the high-voltage phase of layered P2-Na2/3‑z[Mn1/2Fe1/2]-O2 and the positive effect of Ni substitution on its stability. EnergyEnviron. Sci. 2015, 8, 2512.(11) Hasa, I.; Buchholz, D.; Passerini, S.; Hassoun, J. A comparativestudy of layered transition metal oxide cathodes for application insodium-ion battery. ACS Appl. Mater. Interfaces 2015, 7, 5206−5212.(12) Lee, D. H.; Xu, J.; Meng, Y. S. An advanced cathode for Na-ionbatteries with high rate and excellent structural stability. Phys. Chem.Chem. Phys. 2013, 15, 3304−3312.(13) Yoshida, H.; Yabuuchi, N.; Kubota, K.; Ikeuchi, I.; Garsuch, A.;Schulz-Dobrickb, M.; Komaba, S. P2-type Na2/3Ni1/3Mn2/3‑xTixO2 as anew positive electrode for higher nergy Na-ion batteries. Chem.Commun. 2014, 50, 3677−3680.(14) Wu, X.; Guo, J.; Wang, D.; Zhong, G.; McDonald, M. J.; Yang,Y. P2-type Na0.66Ni0.33‑xZnxMn0.67O2 as new high-voltage cathodematerials for sodium-ion batteries. J. Power Sources 2015, 281, 18−26.(15) Kim, D.; Kang, S.-H.; Slater, M.; Rood, S.; Vaughey, J. T.; Karan,N.; Balasubramanian, M.; Johnson, C. S. Enabling sodium batteriesusing lithium-substituted sodium layered transition metal oxidecathodes. Adv. Energy Mater. 2011, 1, 333−336.(16) Billaud, J.; Singh, G.; Armstrong, A. R.; Gonzalo, E.; Roddatis,V.; Armand, M.; Rojo, T.; Bruce, P. G. Na0.67Mn1‑xMgxO2 (0 ≤ x ≤0.2): a high capacity cathode for sodium-ion batteries. Energy Environ.Sci. 2014, 7, 1387−1391.(17) Yabuuchi, N.; Hara, R.; Kubota, K.; Paulsen, J.; Kumakura, S.;Komaba, S. New electrode material for rechargeable sodium batteries:P2-type Na2/3[Mg0.28Mn0.72]O2 with anomalously high reversiblecapacity. J. Mater. Chem. A 2014, 2, 16851−16855.(18) (a) Zhao, W.; Kirie, H.; Tanaka, A.; Unnoa, M.; Yamamoto, S.;Noguchi, H. Synthesis of metal ion substituted P2-Na2/3Ni1/3Mn2/3O2
cathode material with enhanced performance for Na ion batteries.Mater. Lett. 2014, 135, 131−134. (b) Hemalatha, K.; Jayakumar, M.;Bera, P.; Prakash, A. S. Improved electrochemical performance ofNa0.67MnO2 through Ni and Mg substitution. J. Mater. Chem. A 2015,3, 20908−20912. (c) Ikeuchi, I.; Kubota, K.; Yabuuchi, N.; Komaba, S.Impacts of Mg and Al substitution on Na2/3Ni1/3Mn2/3O2 as positiveelectrode materials for Na-ion batteries. Abstract MA2014−04 235,IMLB 2014.(19) Li, Z.-Y.; Gao, R.; Zhang, J.; Zhang, X.; Hu, Z.; Liu, X. Newinsights into designing high-rate performance cathode materials forsodium ion batteries by enlarging the slab-spacing of the Na-iondiffusion layer. J. Mater. Chem. A 2016, 4, 3453−3461.(20) Wang, P.-F.; You, Y.; Yin, Y.-X.; Wang, Y.-S.; Wan, L.-J.; Gu, Li.;Guo, Y.-G. Suppressing the P2-O2 phase transtion of Na0.67Mn0.67-Ni0.33O2 by Magnesium Substitution for Improved Sodium-ionBatteries. Angew. Chem., Int. Ed. 2016, 55, 7445 in press..(21) (a) Larson, A. C.; Von Dreele, R. B. General Structural AnalysisSystem (GSAS). Los Alamos National Laboratory Report LAUR 1994,86−748. (b) Toby, B. H. EXPGUI, a graphical user interface forGSAS. J. Appl. Crystallogr. 2001, 34, 210−213.(22) Ravel, B.; Newville, M. Athena, Artemis, Hephaestus: dataanalysis for X-ray absorption spectroscopy using IFEFFIT. J.Synchrotron Radiat. 2005, 12, 537−541.(23) Massiot, D.; Fayon, F.; Capron, M.; King, I.; Le Calve, S.;Alonso, B.; Durand, J. O.; Bujoli, B.; Gan, Z.; Hoatson, G. Modellingone and two-dimensional solid-state NMR spectra. Magn. Reson. Chem.2002, 40, 70−76.(24) Cabana, J.; Chernova, N. A.; Xiao, J.; Roppolo, M.; Aldi, K. A.;Whittingham, M. S.; Grey, C. P. Study of the transition metal orderingin layered Na(x)Ni(x/2)Mn(1-x/2)O2 (2/3 ≤ x ≤ 1) andconsequences in Na/Li exchange. Inorg. Chem. 2013, 52, 8540−8550.(25) Singh, G.; Lopez del Amo, J. M.; Galceran, M.; Perez Villar, S.;Rojo, T. Structural evolution during sodium deintercalation/intercalation in Na2/3[Fe1/2Mn1/2]O2. J. Mater. Chem. A 2015, 3,6954−6961.(26) Gonzalo, E.; Han, M. H.; Lopez del Amo, J. M.; Acebedo, B.;Casas-Cabanas, M.; Rojo, T. Synthesis and characterization of pure P2-
Chemistry of Materials Article
DOI: 10.1021/acs.chemmater.6b01935Chem. Mater. 2016, 28, 5087−5094
5093

and O3- Na2/3Fe2/3Mn1/3O2 as cathode materials for Na ion batteries.J. Mater. Chem. A 2014, 2, 18523−18530.(27) Yabuuchi, N.; Kajiyama, M.; Iwatate, J.; Nishikawa, H.; Hitomi,S.; Okuyama, R.; Usui, R.; Yamada, Y.; Komaba, S. P2-typeNax[Fe1/2Mn1/2]O2 made from earth-abundant elements for recharge-able Na batteries. Nat. Mater. 2012, 11, 512−517.(28) Mendiboure, A.; Delmas, C.; Hagenmuller, P. Electrochemicalintercalation and deintercalation of NaxMnO2. J. Solid State Chem.1985, 57, 323−331.(29) Shu, G. J.; Chou, F. C. Sodium-ion diffusion and ordering insingle-crystal P2-NaxCoO2. Phys. Rev. B: Condens. Matter Mater. Phys.2008, 78, 052101.
Chemistry of Materials Article
DOI: 10.1021/acs.chemmater.6b01935Chem. Mater. 2016, 28, 5087−5094
5094