high value supply chains, food standards and poor farmers in
TRANSCRIPT

High Value Supply Chains, Food Standards and Poor
Farmers in Developing Countries:
The Case of Vegetable Exports From Senegal
Miet Maertens
LICOS, Centre for Transition Economics, Katholieke Universiteit Leuven, Belgium.
Selected Paper prepared for presentation at the American Agricultural Economics Association Annual Meeting, Long Beach, California, July 23-26, 2006
Copyright 2006 by Miet Maertens. All rights reserved. Readers may make verbatim copies of this document for non-commercial purposes by any means, provided that this copyright notice appears on all such copies.

Introduction
Global trade in high-value agricultural products, such as fresh and processed
fruits and vegetables (FFV), is increasing (Maertens and Swinnen, 2006). Especially
in developing country exports these high-value products are gaining importance: their
share in total agricultural exports from developing countries increased from 21% in
1980 to 41% in 2000 (Aksoy and Beghin, 2005). Despite the fact that participation in
international trade is generally recognized to favour economic development, a recent
debate in the literature casts doubt on the beneficial effect of high-value agricultural
trade for developing countries. It is argued that new product and process standards for
food quality and safety imposed by high-income countries introduce new barriers for
developing country exports and are diminishing the gains from trade (Augier et al,
2005; Brenton and Manchin, 2002; Unnevehr, 2000). Moreover, some studies
mention that high-value agricultural trade may do little for the fate of poor farmers as
they are likely to be excluded from high-value supply chains while the rents in the
chain are extracted by multinational companies and developing country elites (Dolan
and Humphrey, 2000; Farina and Reardon, 2000; Reardon et al, 1999).
Empirical studies on the impact of high-value agricultural trade and tightening
food standards have focussed on the question of poor farmers’ participation as
primary suppliers in high-value food chains and have presented a mixed picture.
Several studies indicate that because of tough quality and safety standards high-value
horticulture production and marketing increasingly originates from large industrial
estates and that small farmers are increasingly excluded as suppliers to high-value
markets (E.g. Reardon et al., 2003; Kirsten and Sartorius, 2002; Weatherspoon et al.,
2001; Reardon and Barrett, 2000; Delgado, 1999; Key and Runsten, 1999; Gibbon,
2003; Weatherspoon and Reardon, 2003; Dolan and Humphrey; 2000; Kherallah,
2

2000). Very different findings come from a study by Minten et al (2006) on
Madagascar and by Minot and Ngigi (2004) on Kenya, which find that a large share
of FFV exports from these African countries is grown by small farmers on a contract-
base. Apart from the contentious issue of poor farmers’ participation in high-value
supply chains, also the welfare effects of such participation remains an unresolved
matter – that has received less attention in the empirical literature. Some studies find
that small farmers included as contracted-suppliers in high-value food chains do gain
from this (e.g. Minten et al, 2006). However, the overall welfare effects of high-value
FFV trade in terms of rural income mobility, income equality and poverty reduction
have rarely been assessed and quantified. Humphrey, Mc Culloh and Ota (2004) argue
that a shift away from smallholder FFV production towards estate production is likely
to contribute to an enhanced poverty-reducing impact of high-value agricultural trade
because of new employment opportunities on estate farms. Yet, empirical evidence of
such welfare effects are lacking.
This paper studies the welfare effects of high-value FFV exports from Senegal
to the EU. We analyze how the structure of the export supply chain has changed in
response to tightening food standards and investigate the impact for the local
population. The study yields four important findings. First, we find that public and
private food standards in the EU have lead to increased consolidation and increased
vertical coordination in the FFV supply chain with a shift away from smallholder
contract-based production to integrated estate production. Second, these structural
changes have increased the participation of rural households, and especially poorer
households, in the supply chains through wage employment on FFV estates. Third, we
find that household participation in FFV export production, whether through contract-
farming or through estate wage employment, generates significant income gains.
3

Fourth, high-value FFV trade has a major impact on rural poverty-reduction and the
increasing prevalence of food standards is even enhancing this impact.
The structure of the papers is as follows. In a next section we describe the
supply chain for FFV exports from Senegal to the EU and the importance of food
standards in that chain. In section three we illustrate how the data for this study have
been collected. In section four we analyse how the structure of the FFV export supply
chain and household participation therein has changed. We analyse the welfare effects
of these changes on the basis of a comprehensive econometric model in section five
and with a simulation model in section six. Finally, we present the main conclusions
and implications from our study.
High-value FFV exports from Senegal and EU Food Standards
FFV play a central role in Senegal’s recent strategy of export diversification
towards high-value export commodities. Exports of FFV from Senegal increased
sharply over the past 15 years: from 2,700 ton in 1991 to 16,000 ton in 2005 (figure
1). The period of the sharpest growth was after 1997. During this period, the export
of French beans alone increased from 3,300 ton to almost 7,000 ton. It now still
represents almost half (42%) of the total volume FFV exports. Aside from beans,
other major export crops include cherry tomatoes (23%) and mangoes (16 %).
Apart from some small volumes exported to neighboring countries, FFV are
exported to the EU; in particular to France (40%), the Netherlands (35%) and
Belgium (16%). Senegal ranks fourth as an external supplier of French beans to the
EU, after Morocco, Egypt and Kenya. A quality premium is paid for French beans
from Senegal. The EU buys Senegalese beans at a price that is about 70% higher then
for beans imported from Egypt or Morroco (Eurostat, 2005). In addition, the price per
4

ton has increased – from 1,752 Euro in 2000 to 1,952 Euro in 2004 – while transport
costs have decreased substantially due to a shift from air cargo to maritime transport.
The validation of the label Origine Sénégal by the Senegalese government might have
played an important role in this quality-upgrading.
FFV exports to the EU have to satisfy a series of stringent public and private
food quality and safety standards. First, the EU legislation imposes high public
standards concerning food quality and food safety for FFV. These include (1) the
common marketing standards for FFV1; (2) phytosanitary measures such as maximum
residue levels; (3) general hygiene rules based on HACCP control mechanisms; and
(4) traceability requirements. These latter two requirements came into force since the
General Food Law of 2002. Traceability regulations imply agro-food businesses
within the EU to document from/to whom they are buying/selling produce such that
products can be traced back to their origin in case of food safety problems. Food
standards have become more stringent during the past years: e.g. new regulations
concerning the phytosanitary treatment of wooden packaging material and maximum
levels of contaminations by heavy metals apply since 2005 and 2002 respectively.
Second, in addition to these public standards, many large trading and retailing
companies have engaged in establishing private food standards that are even stricter.
For example the Euro-Retailer Produce Working Group (Eurep) has engaged in
adapting traceability (and other) standards into the EurepGAP certification protocols.
They increasingly require such certification from their overseas suppliers.
1 Commission Regulation (EC) No 912/2001, an amendment of EC No 2000/96, specifies a classification for French beans based on quality and size, and stipulates provisions concerning the presentation and marketing of the beans.
5

The study area and data collection
To measure the impact of these developments we collected information at
three different levels. First, we collected statistics on horticulture production and
exports from existing data sources and conducted a series of qualitative interviews
with experts, stakeholders and organizations.
Second, in April 2005, we conducted quantitative and structured interviews
with nine of the 20 horticulture exporting companies in the Dakar region. This sample
constitutes a mixture of firms recently entering the market and older companies, and a
mixture of smaller and larger exporters who jointly represent 44 % of the exported
volume French beans (table 1).
Third, we organized a large household survey in Les Niayes – the main
horticulture zone in Senegal from which the majority (over 90%) of exported French
beans originate. The majority of the population in this area are horticulture farmers
producing a large variety of vegetables for the local market and French beans for
export. In August – September 2005, we implemented a quantitative survey that
covered 300 households in 25 randomly selected villages in two administrative
regions – Dakar and Thiès – in the research area. The sample includes 159 households
who do not participate in the export supply chain for French beans and 141
households who do participate. The latter group includes 82 households who have one
or more household members employed as wage workers on agro-industrial FFV farms
and 59 households who cultivate French beans on contract with an exporting company
– and who might also have members employed as wage workers (24) or not (35). The
sample was stratified on whether or not households hold a contract for French bean
production, which resulted in and over sampling of these contract-farmers. To take
into account the sampling design and draw correct inferences we use, in all
6

subsequent analyses, sampling weights that are calculated with information gathered
at the village level.
In table 2 we present some key features of the household sample. There is a
high degree of poverty among the sampled households: the average per capita
household income is about 560,000 FCFA and 40% of the households live below the
national rural poverty line of 181,770 FCFA a year2 (table 2). However, the degree of
poverty in the research area is much lower than the national poverty rate which is
estimated at 48% for the country as a whole and at 57% for the rural population
(République du Sénégal and Banque Mondial, 2004). Agriculture is by far the most
important economic activity – constituting on average more than 70% of total
household income. The average farm size among the sampled households is 4.6 ha,
which is close to the national average of 4.3 ha in the survey year 1998/99 (Eastwood
et al., 2006). About three fourths of the cultivated land is irrigated, either manually or
with more advanced irrigation systems. Average household size is rather large with 16
members, which is typical for African rural households who live in extended families.
Another striking feature is the general low level of education: 80% of the sampled
household-heads have no formal education at all.
Impact of growth in high-value exports and standards
Structural changes in the export supply chain
The increasing and changing public and private food standards in the EU put
pressure on FFV exporters in Senegal to stay up to date with the changing legislation
and private standards and to make additional investments in order to comply with
2 The national rural poverty line for Senegal was calculated from the ESAM II survey (Enquête Sénégalaise auprès des Ménages) that was conducted in 2001-2002. This national rural poverty line of 181,770 FCFA per year corresponds to 0.9669 USD/day and is hence close to the international poverty line of 1 USD/day (République du Sénégal and Banque Mondiale, 2004).
7

those standards. These growing demands also increase the need for tighter
coordination in the high-value chains and have lead to important structural changes in
the export supply chain for FFV in Senegal, with major implications for the
Senegalese farmers. Key structural changes in the supply chain are increased
consolidation at the level of the agro-exporting industry as well as at the level of
primary producers; and increased vertical coordination with downstream buyers in the
EU as well as with upstream suppliers. This translates into a decreasing volume of
French beans that is procured from small farmers and an increase in vertically
integrated FFV estate production.
Consolidation in the export sector
In fact, since 2000, the export sector is increasingly concentrated with smaller
exporters dropping out. In 2002, French beans were exported through 27 companies.
This number decreased to 24 in 2004 and in 2005 only 20 firms remained. During the
last season in 2005, the three largest companies exported two thirds of the total
volume of French beans, while in 2002 their market share was slightly less than half.
This consolidation is at least partly the result from increasing EU food standards.
Because of financial constraints, only larger exporters are able to comply with
stringent food standards. Since 1994, most exporters were organized in SEPAS
(Syndicat des Exportateurs des Produits Agricoles). This organization coordinates the
transport of FFV by plane or ship, provides market information – including
information on food standards – and assists its members in the contact with overseas
buyers. However, following the increasing EU standards, the seven largest FFV
exporters founded the organization ONAPES (Organisation National des Producteurs
Exportateurs de Fruits et Légumes de Sénégal) in 1999. One of their specific aims
8

was to comply with traceability standards and become EurepGAP certified. Four
ONAPES companies are in our sample. Among these firms one – Sepam – is
EurepGAP and HACCP certified (since 2004). Two other ONAPES firms – Soleil
Vert and Baniang – and one SEPAS firm – Agriconcept – are in the process of
certification and made substantial investments for this in the past couple of years.
The remaining exporting companies, mainly smaller companies, are not certified, not
in the processing of becoming certified and not undertaking particular investments in
the scope of certification.
Increased vertical coordination
Vertical coordination increased, both downstream and upstream. First, the
FFV exporting companies – especially larger firms – increasingly engage in tighter
coordination with downstream importers and wholesalers in the EU market. Smaller
exporters deal with importers through indicative agreements on the supplied quantity,
which are not binding for either of the parties. Larger exporters have recently changed
from such indicative agreements to more binding contracts with overseas buyers,
which specify a fixed (minimum) price, the quantity to be delivered, the time of
delivery and sometimes also include pre-financing to the suppliers. Among the
reasons mentioned by exporting companies to engage in such tighter coordination are
the volatility of prices in the EU market and the incidence of produce refusal by
importers.
Second, to guarantee food quality and safety throughout the supply chain and
to assure accurate timing of production and harvesting exporting firms – especially
larger firms – increasingly rely on tighter vertical coordination with upstream
suppliers of primary produce. This increased vertical coordination occurs in two
9

ways. The first is through more elaborate production contracts and tighter
coordination within those contracts. Contracts signed with small family farms are
typically specified for one season and indicate the area to be planted (usually 0.5 or 1
ha), all technical requirements and the price. As part of the contract, the firms provide
technical assistance and inputs to the farmers; especially seeds and chemicals,
sometimes also cash credit. Some firms go as far in contract-coordination as the
complete management of fertilizer and pesticide application and daily or weekly
inspection of the farmers’ fields. Also field preparation, planting and/or harvesting
can be coordinated and financed completely by the exporting firm. Especially larger
exporters provide pre-financing and apply tighter contract-coordination while smaller
exporters leave management decisions to the farmers. The most extreme case of
contract-coordination is Sepam, who manages the whole production on farmers’ land
except for irrigation and harvesting.
A second, and even more radical, change towards vertical coordination is the
shift from contract-farming with smallholders to large-scale estate production on
agro-industrial farms. Larger exporters are increasingly engaging in fully integrated
estate production on land that they buy or rent. In fact, the ONAPES exporting
companies have agreed among themselves that each member should seek to be
present in the market every season with a volume of at least 200 ton FFV and that at
least 50% of the volume should originate from the companies own estate production –
a measure that is having a profound impact on the structure of the export supply
chain. Three firms in our sample have already substantially reduced procurement
through contract-farming with smallholders: from 100% in their first year of operation
to respectively 60% and 20% in the last season (table 2), in favor of integrated estate
production. The companies cited quality rather than quantity to be the reason for this
10

change. Even firms that still fully rely on contract-farming mentioned fully integrated
production to be an important strategy for compliance with food standards in the
future and hence for the survival and growth of the firm.
Increased household participation
The participation of rural Senegalese households in high-value export markets
increased dramatically. Our household survey data reveal that there has been a sharp
increase in the overall participation of local households in the French bean export
supply chain, from less than 10 % in 1992 to about 40 % in 2005 (figure 2). This
increase has had major positive welfare implications for the rural population – as we
will analyze in detail in the next sections. A simple comparison between participating
and non-participating households already reveals that there is a large difference in per
capita income: 391,000 FCFA for non-participants compared to 815,000 FCFA for
participants.
However, as a result of supply chain restructuring, the nature of increased
household participation in the export chain, and its effects on household well-being,
differed strongly in the 1990s from more recent years. During the second half of the
1990s households increasingly participated in export production through contract-
farming (figure 2). In 2000, an estimated 24% of local households in the research area
produced French beans on contract with an exporting firm. However, from 2000
onwards, while household participation grew further, this was mostly through wage
employment in the agro-industry while contract-farming decreased (figure 2).
Employment in the French bean agro-industry has increased sharply from less than
10% of local households in 2000 to 35% in 2005. Yet, at the same time, the share of
contract-farmers among the local population decreased from 24% to 8.5%. The survey
11

data indicate that in the period 2000-2005, 80 % of contract-farmers lost their
contract. The firms with whom these farmers signed contracts either started their own
estate production (e.g. Sepam and Soleil Vert) or exited the market. Among the
reasons these farmers mention for the dissolution of their contract, 76% indicate the
exporting firm to have ended the contract and do not always know the reasons why.
Hence, in summary, participation of rural farm households in high-standards
FFV production continues to increase but their role is shifting from contract-farmers
to estate workers. A comparison of total and per capita income across households
indicates that household income for estate wage workers is more than twice as high
and for contract-farmers more than four times higher compared to the income of non-
participating households (table 3). This suggests the shifted nature of household
participation has implications for the distribution of rural incomes. However, a more
thorough analysis is need to attribute income differences to the participation in high-
value export supply chains; which is done in the next sections.
Finally, an important issue is which households are participating in high-value
export production through contract-farming and through wage employment, and
which households are excluded. As a result of increased standards and supply chain
restructuring, the smallest contract-farmers – with less land and agricultural
equipment (table 4) – were excluded from contract-farming. Yet, more and more
poorer households were included as estate wage workers. The figures in table 3
indicate that estate wage workers have less livestock and less non-agricultural
equipment than non-participating households while there is no difference in
landholdings, in the share of irrigated land and in agricultural equipment between
those households. On the other hand, contract-farmers have higher landholdings, a
higher share of irrigated land, more productive assets to cultivate the land and more
12

livestock (table 3). Both contract-farmers and agro-industrial employees have more
labor endowments and a larger share of them is found in the Dakar region. So, both
relatively better-off households and poorer households are involved in high-value
FFV production but the former rather through contract-farming and the latter through
estate wage employment.
Econometric analysis
Selection and treatment bias
The figures mentioned above suggest that household income for contract-
farmers and for agro-industrial employees is substantially higher than the income for
non-participating households. However, based on a simple comparison of means in
table 3, it is impossible to satisfactorily attribute these differences in income to the
impact of contracts with exporters and of employment on FFV estates. Contract-
farmers might earn a higher income even if they had not participated in contract-
farming because they hold larger amounts of productive assets such as land and
livestock. Similarly, households participating in agro-industrial wage employment
might earn higher incomes because they have larger labor endowments. A regression
model is needed to disentangle these effects. Moreover, there might be unobservable
factors (managerial ability, household preferences, etc.) that simultaneously enhance
household income and increase the likelihood of a household to have a contract or to
be employed in the FFV industry. Due to this self-selection problem, OLS regression
models would lead to biased estimates and a more advanced econometric technique is
needed.
We control for self-selection bias by using a treatment effects model
(Wooldridge, 2001). We define a categorical variable that takes the outcomes m = 0,
13

1, 2, for three subgroups of households: non-participating households, estate wage
workers, and contract-farmers respectively. For each subgroup of households, or for
each treatment m:
mmmmm XY μβα ++= , m = 0, 1, 2 (1)
where Ym is the income of households receiving treatment m; and Xm a vector of
exogenous variables assumed to affect household income. Because we are mainly
interested in how income differs across m – measured by the coefficient α – and for
simplicity, we restrict the model by imposing that β is equal across the different
treatments. Using notation i to indicate individual households the model reduces to:
iiii XMY μβα ++= (2)
where the treatment variable Mi is a vector of dummy variables for each outcome m =
0, 1, 2. Due to self-selection of treatment, Mi cannot be assumed to be exogenous and
self-selection bias needs to be corrected for.
The specified model differs from a standard treatment effects model in that the
treatment variable has more than two possible outcomes. In a binary treatment effects
model, the self-selection of treatment is corrected for with a propensity score – which
is the conditional probability of treatment, usually estimated using probit or logit
regression models – a method pioneered by Rosenbaum and Rubin (1983). Resolving
the selectivity bias in our model with three possible outcomes of the treatment
variable is more complex and we use a solution that has been proposed by
Bourguignon, Fournier and Gurgand (2002)3. These authors show that the coefficients
3 Lee (1983) first described a method to the case where selectivity is modeled as a multinominal logit but as shown by Bourguignon et al. (2002) the results rely on fairly restrictive assumptions. Bourguignon et al. (2002) provide an alternative method for selectivity bias correction based on a multinominal logit model under the usual parametric assumptions. The selectivity correction function proposed by Bourguignon et al. (2002) involves all correlation coefficients between the disturbance
14

in equation (1) can be consistently estimated using a selectivity correction function as
in equation (3):
( ) ( ) ( ) mms
ss
ssmmmmmm Pq
PP
PqXY μγγβα +⎥⎦
⎤⎢⎣
⎡−
+++= ∑≠ 1
(3)
with Pm the conditional probability of treatment m and q(Pm) an integral function of
this probability. The probabilities Pm are conditioned by a set of exogenous variables
Zi and can be estimated by a multinominal logit (MNL) model (4):
( )∑+==
sis
imii Z
ZZmMP
φφ
exp1)exp(
)|( (4)
From estimating the MNL model (4) we derive the fitted probabilities Pm for
each treatment m; we use these to construct selectivity correction functions for each
treatment as in equation (3); include these functions in equation (2) and consistently
estimate the coefficients α and β by least squares. With this method we obtain
consistent estimators of the coefficients in the model but not of the standard errors as
the two-step nature of the procedure is not accounted for in the least squares
regression. Therefore, as proposed by Bourguignon, Fournier and Gurgand (2002), we
use a bootstrap method to get robust standards errors and hypothesis testing.
The estimation of the treatment effects model in a two-stage procedure does
not only address the issue of selection bias in correctly estimating the income effects
but also yields insights into the determinants of household participation in high-value
export production through contract-farming and estate wage employment. Both
issues, the determinants of household participation and the effect of participation on
household income, are important for analyzing the income and equity effects of trade
in high-value commodities.
term of the outcome equation of interest and the disturbance terms of all categorical latent expressions in the multinominal logit model whereas this is not the case in the method proposed by Lee (1983).
15

Expected effects and hypotheses
Our main interest is in the coefficients α1 and α2 of the two dummy variables
m1 and m2 representing agro-industrial wage laborers and contract-farmers
respectively. We hypothesize that both have a positive effect on Y or, in other words,
that high-standards export production has a positive effect on rural incomes, whether
it is realized through estate farming and associated rural employment or through
contract-farming with smallholders. Other variables in the second stage of the model
are a vector of exogenous variables X that are assumed to affect household income.
These include physical assets – the area cultivated (land), the share of land under
irrigation (irrigation), total livestock holdings (livestock), the value of farm and non-
farm equipment (eq_agr and eq_nonagr) – and households’ labor endowments
(labor). As these productive endowments increase the income generating capacity of a
household, we expect all these variables to have a positive effect on Y. We
additionally include unearned income (inc_unearned) as an explanatory variable in
the regression as this directly increases income irrespective of households’ productive
endowments.
In the first stage MNL model, the probability of household participation in
contract-farming and estate wage employment is conditioned by a vector of
exogenous variables Z. We include the following variables as elements of Z: land,
irrigation, livestock, eq_agr, eq_nonagr, labor, education – the education level of the
household, and region – a dummy variable for location in the Dakar region. In the
literature it is often mentioned that processing and exporting firms prefer to contract
with larger farms – as this reduces transaction costs – and with wealthier and better
educated farmers – as these require less financial and technical assistance from the
contractor-firm (Swinnen, 2005). Based on this argumentation, we expect the
16

variables land, irrigation, eq_agr, labor and education to increase the probability of
contract-farming relative to no participation. The variable region is expected to have a
positive effect in both equations of the multinominal logit model. Most FFV exporters
are located in the Dakar region and therefore transaction costs related to contract-
farming and transport costs related to estate employment are smaller for households
living in this region.
Results and discussion
The results of the two stage estimation procedure are given in table 5 - the first
stage MNL regression – and table 6 – the second stage OLS regression corrected for
selectivity bias.
Explaining household participation in high-standards production
The results of the first stage MNL regression confirm that contract-farming is
biased towards better-off (albeit still small) farmers with more productive assets while
wage employment on FFV estates is undertaken by rather poorer, larger and lower
educated households. This results directly from the estimated effects. First,
households with more labor, more land and a higher share of irrigated land have a
higher probability to be involved in FFV contract-farming with an exporting firm
(table 4). So, FFV contract-farmers are the relatively better-off households among the
rural smallholder population with more land and access to an irrigation system.
Second, households with more labor, a lower education and less productive
equipment have a higher probability of being involved in wage employment on FFV
estates (table 4). Hence, wage employment on FFV estates is not directed to better-off
households but rather to poorer and lower educated households.
17

These findings imply that household participation in the high-value export
supply chain for French beans did not only increase sharply – as discussed above
(figure 2) – but also turns out to be more equitable with the shift from smallholder
contract-farming to integrated estate farming and associated employment after 2000.
Despite the fact that the smallest farmers among the contract-farmers are excluded
from French bean contract-farming; participation in this high-value export supply
chain became more equitable as it includes more and poorer households as wage
workers on agro-industrial estates.
The results empirically validate, on the one hand, the often heard argument in
the literature that the smallest and poorest farmers are excluded from high-standards
contract-farming and the benefits thereof (e.g. Reardon et al., 2003; Weatherspoon
and Reardon, 2003; Kirsten and Sartorius, 2002; Reardon and Barrett, 2000; Gibbon,
2003; Weatherspoon et al., 2001; Farina and Reardon, 2000; Kerrallah, 2000;
Delgado, 1999; Key and Runsten, 1999; Reardon et al., 1999) and on the other hand
provide more general insights. The main reasons mentioned in the literature for the
exclusion of the smallest farmers from high-value contract-farming are the high
transaction costs in dealing with many small farmers and the difficulties in monitoring
quality and safety standards (Key and Runsten, 1999; Swinnen, 2005). Our analysis
shows that indeed smaller contract-farmers were excluded as a result of increased
food standards and supply chain restructuring but that this is only a partial outcome.
The overall outcome is an increased participation of rural households and of poorer
households in high-standards supply chains, not through contract-farming but through
agro-industrial employment.
Other effects in the MNL regression have the expected sign but are
statistically not significant, except for the positive effect of the dummy variable
18

region. This effect means that location in the Dakar region – closer to agro-exporting
firms – increases the probability of participating in high-value export production,
whether through contract-farming or through wage employment, and indicates that
transport and transaction costs are important in explaining participation in high-value
export production.
Impact of participation in high-standards production on household income
The results of the second stage regression model show that participation in
high-value FFV production, whether through estate wage employment or through
contract-farming, significantly increases household income. After correction for
selectivity bias we find that FFV estate workers and contract-farmers have incomes
that are respectively 1.4 million and 3 million FCFA higher than for non-participating
households (table 6) – or respectively about 60% and 120% higher than the average
household income in the region4.
These highly significant and large effects on household income demonstrate
that rural households involved in high-value supply chains, do share in the gains from
high-value export production. This is a key empirical finding as it has repeatedly been
argued in the literature that the gains from high-value agricultural trade are captures
by foreign investors and developing country elites (e.g. Dolan and Humphrey, 2000;
Farina and Reardon, 2000; Reardon et al, 1999). Especially contract-farming has often
been criticized to be a tool for agro-industrial firms and food multinationals to exploit
unequal relationships with farmers and extract rents from high-value supply chains
(Warning and Key, 2002). However, some recent empirical studies have demonstrated
4 The income effect of contract-farming is significantly larger than the income effect of estate wage employment. There are many possible explanations for this that could be explored in a more detailed analysis.
19

the beneficial effect of contract-farming (e.g. Swinnen, 2005; Dries and Swinnen,
2004) and high-value agricultural trade (e.g. Gulati et al., 2006; Minten et al., 2006)
for rural households in low-income countries. Our case-study from Senegal does not
only add to this recent empirical evidence but additionally demonstrate that high-
value agricultural trade benefits rural incomes even if it is realized through integrated
estate farming and associated rural employment rather then through contract-farming.
This result challenges the implicit assumption underlying some empirical studies that
high-standard food production needs to integrate farm households as primary
suppliers in the value chain if such production needs to benefit rural incomes. Our
results show that also households involved as wage workers reap significant, albeit
smaller, benefits from high-value agricultural production than contract-farmers do.
Finally, the coefficients of all other variables in the second stage regression
have the expected sign and are statistically significant, except for the variable
livestock. Households with more land, a higher share of irrigated land, more farm and
non-farm equipment, and more labor5 have higher incomes. A possible explanation
for the insignificant effect of livestock holdings on household income is that it is
important as a store of wealth rather than a productive asset in the research region.
Overall welfare effects
The findings from the econometric analysis demonstrate that high-value
agricultural trade significantly adds to rural incomes but that the effect is smaller if
household participation in the high-value supply chain is realized through estate wage
employment rather then through contract-farming. Moreover, we find that contract-
farming is biased towards relatively better-off farmers while wage employment on
5 Labor endowments have a positive but decreasing effect on household income. A plausible explanation for this is the existence of intra-household free-riding in larger households.
20

FFV estates is undertaken by rather poorer households. Hence, the overall welfare
effects for the local population in terms of an equitable distribution of income and
poverty reduction are still ambiguous.
To understand the overall welfare implications of high-value agricultural
trade, increased EU food standards and subsequent supply chain restructuring in
Senegal, we simulate household income based on the estimated coefficients α and β
(equation 2), for two hypothetical cases. In the first case both treatments m – contract-
farming and estate wage employment – are set to 0, which corresponds to the case if
there would be no French bean exports at all. For the second case treatments m are set
according to household participation in contract-farming and estate wage employment
in 2000. This second case simulates a situation in which there would have been no
further expansion of French bean exports after 2000, no supply chain restructuring
and in which the sector is dominated by smallholder contract-production. This case
resembles the absence of increasing EU food standards and subsequent changes6.
For these two hypothetical cases we estimate total household incomes based
on the estimated coefficients in the previous regression model, use these estimates to
calculate per capita incomes and derive poverty indicators and compare the results
with the actual situation. The results of this simulation, displayed in table 7, are
striking. First, high-value export horticulture reduces poverty by 17% in the research
area. Without the possibility for rural households to participate in high-value FFV
contract-farming and wage employment on FFV estates, the incidence of poverty in
the region would have been 57 % – which equals the average rural poverty rate for
Senegal – while actual poverty is only 40% (table 7). This is an extremely large and 6 This simulation might suffer from overestimation as well as underestimation of household income. On the one hand, in the absence of increasing food standards French bean exports from Senegal might have grown faster and hence benefited more households. On the other hand, without strict food standards there might have been no quality upgrading and price increases in French bean exports and hence income gains would have been lower.
21

important effect; much larger than the overall reduction in rural poverty in Senegal
from 66% in 1995 to 57% in 2002 (République du Sénégal and Banque Mondiale,
2004). The welfare impact of agricultural trade for poor households in developing
countries has been debated a lot but not many studies have been able to quantify that
effect as we have done here.
Second, we find that increased EU food standards and the subsequent shift
away from smallholder contract-farming in favor of integrated estate farming has
further contributed to an increased poverty-alleviating impact of high-value
agricultural trade. The simulated case without increased food standards and supply
chain restructuring results in a poverty rate of 44%, which is 4% higher than the
actual incidence of poverty (table 7). This is again an extremely important empirical
finding. Increasing food standards and a shift away from smallholder production are
generally seen as particularly detrimental for the poverty situation in developing
countries (e.g. Farina and Reardon, 2000; Kherralah, 2000; Reardon et al, 1999). Our
findings for Senegal challenge this view and empirically prove that increased food
standards can even enhance poverty reduction.
Third, high-standards exports do not only decrease the incidence of poverty, it
also sharply decreases the severity of poverty. If there would have been no French
bean exports, the poverty-gap-ratio in the region would be 1.43 while the actual
poverty-gap-ratio is 0.66 (table 7). Moreover, the poverty-gap-ratio would have been
much higher in the absence of increased food standards and subsequent supply chain
restructuring. This means that on top of households moving out of poverty, high-value
trade, food standards and the shift to estate farming also contribute to poor households
moving closer to the poverty line. This adds to the previous findings and indicates that
22

more people are likely to evade poverty if high-standards exports can be sustained or
expanded in the future.
Fourth, high-value trade increases average total and per capita income. Actual
average per capita income is about 570,000 FCFA while it would have been only
about 400,000 FCFA if households would not have the possibility to participate in
high-value export production (table 7). However, a situation where export production
is largely based on smallholder-contract production – as it was before food standards
induced structural changes in the supply chain – would slightly increase average
income to 600,000 (table 7). This difference is statistically not significant and is very
small as against the huge reduction in poverty.
Implications
The results from our study show that high-value agricultural trade significantly
benefits rural incomes and importantly contributes to reducing rural poverty. The
analysis further shows that, contrary to the conventional arguments in the literature,
increased food standards have resulted in a more equitable distribution of the income
gains from trade among the rural smallholder population and in an enhanced poverty
reduction. These findings imply that high-value agricultural trade – increasingly
subject to stringent food standards – is an engine of pro-poor economic growth in
developing countries. A key policy message is that developing countries should seek
to be included in these high-value, high-standards supply chains.
The recent literature pays much attention to food standards imposed by high-
income countries as technical (and scientifically justified) barriers for developing
countries and for small businesses and poor farmers in these countries to participate in
and gain from high-value trade. Our case-study however, demonstrates that increased
23

food standards do not necessarily lead to the exclusion of the weakest players in the
supply chain but can entail new opportunities for the rural poor and actually be a
catalyst for enhanced welfare. Increasing food standards undoubtedly put pressure on
food supply chains and therefore an emphasis on supply chain dynamics is essential
for exploiting new opportunities. Governments can play a proactive role in this: e.g.
by refraining from policies that impede agro-businesses strategic responses and
supply chain restructuring; by facilitating and promoting investment in high-value
agro-industrial sectors; by paying attention to the strategic location of agro-businesses
in poverty-prone areas, etc.
Conclusion
In recent years the FFV export sector in Senegal became increasingly
concentrated at the level of the agro-exporting industry as well as at the level of
primary producers, and increasingly vertically coordinated with downstream buyers in
the EU as well as with upstream suppliers. There has been a shift away from
smallholder contract-based production towards production on estate farms owned by
large exporting companies. These structural changes in the FFV supply chain are
(partially) driven by intensified public and private food standards in export markets.
Based on conventional arguments in the literature, one could expect these
recent developments to be particularly bad from a rural development and pro-poor
growth perspective. The comprehensive econometric analysis in this paper shows that
this is not all the case. We find that with the restructuring of the supply chain, more
households and more poor households participate in and share in the gains from high-
value export agriculture through wage employment on vertically integrated estate
24

farms. These new opportunities have enhanced the equitable distribution of rural
incomes and the poverty situation in the research area.
The overall conclusion of our study is that high-value agricultural production
and trade – increasingly subject to stringent food standards – entails important
opportunities for pro-poor economic growth in developing countries while and that an
emphasis on supply chains dynamics is essential for exploiting these opportunities.
25

References
Bourguignon, F., Fournier, M., and M. Gurgand (2002) Selection Bias Correction
Based on the Multinominal Logit Model. CREST Série des Documents de Travail n°
2002-04, Institut National de la Statistique et des Etudes Economiques.
Delgado, C. (1999) Sources of growth in smallholder agriculture in sub-Saharan
Africa: the role of vertical integration of smallholders with processors and marketers
of high-value-added items. Agrekon 38, 165-189
Dolan, C. and Humphrey, J. (2000) Governance and Trade in Fresh Vegetables: The
Impact of UK Supermarkets on the African Horticulture Industry. Journal of
Development Studies 37(2), pp. 147-176.
Dries, L. and J. Swinnen, 2004, “Foreign Direct Investment, Vertical Integration and
Local Suppliers: Evidence from the Polish Dairy Sector” World Development, 32(9), pp.
1525-1544
Eastwood, R.K., Lipton, M., and A.T. Newell (2006) Farm size. In: Evenson, R., and
P. Pingali (eds) Handbook of Agricultural Economics Vol III A. Amsterdam, Elsevier
Press.
Eurostat (2005) Statistical website, http://epp.eurostat.cec.eu.int/portal/ (accessed 15
December 2005).
Farina, E.M.M.Q. and Reardon, T. (2000) Agrifood Grades and Standards in the
Extended Mercosur: Their Role in the Changing Agrifood System, American Journal
of Agricultural Economics 82(5), pp. 1170-1176.
Gibbon, P., 2003. Value-Chain Governance, Public Regulation and Entry Barriers in
the Global Fresh Fruit and Vegetable Chain into the EU. Development Policy Review
21(5-6), pp.615-25.
Humphrey, J., McCulloch, N., and Ota, M. (2004) The impact of European market
changes on employment in the Kenyan horticulture sector. Journal of International
Development, 16(1), pp. 63-80.
26

Key, N. and Runsten, D. (1999) Contract farming, smallholders, and rural
development in Latin America: the organization of agroprocessing firms and the scale
of outgrower production. World Development 27(2), pp. 381-401.
Kherralah, M. (2000) Access of smallholder farmers to the fruits and vegetables
market in Kenya, IFPRI, mimeo.
Kirsten, J. and Sartorius, K. (2002) Linking agribusiness and small-scale farmers in
developing countries: is there a new role for contract farming? Development Southern
Africa 19(4), pp. 503-529.
Lee, L.F. (1983) Generalized Econometric Models with Selectivity. Econometrica 51,
pp. 507-512.
Maertens and Swinnen (2006) The fall and rise of vertical coordination in commodity
chains in developing and transition countries. Paper presented at the FAO workshop
on “Governance, Coordination, and Distribution Along Commodity Value Chains”,
Rome 4-5 March 2006
Maertens, M., Dries, L., Dedehouanou F.A, and J.F.M. Swinnen (2006) High-value
Global Supply Chains, EU Food Safety Policy and Smallholders in Developing
Countries. A Case-study form the Green Bean Sector in Senegal. In: Swinnen, J.F.M
(ed) Global Supply Chains, Standards and the Poor, CABI publishing.
Minot, N. and Ngigi, M. (2004) Are Horticultural Exports a Replicable Success
Story? Evidence from Kenya and Côte d’Ivoire. EPTD/MTID discussion paper,
IFPRI, Washington, DC.
Gulati, A., Minot, N. Delgado, C. and S. Bora (2006) Growth in high-value
agriculture in Asia and the emergence of vertical links with farmers. In: Swinnen,
J.F.M (ed) Global Supply Chains, Standards and the Poor, CABI publishing.
Minten, B., Randrianarison, L. and Swinnen, J. (2006) Global Retail Chains and Poor
Farmers: Evidence from Madagascar. LICOS Discussion Papers 164/2006, Leuven,
Belgium (http://www.econ.kuleuven.be/LICOS/DP/dp.htm)
27

Reardon, T. and Barrett, C.B. (2000) Agroindustrialisation, globalization and
international development: an overview of issues, patterns and determinants,
Agricultural Economics 23, pp.195-205.
Reardon, T., Timmer, C.P., Barrett, C. and Berdegué, J. (2003) The Rise of
Supermarkets in Africa, Asia, and Latin America. American Journal Agricultural
Economics 85(5), pp. 1140-1146.
Reardon, T., Codron, J. M., Busch, L., Bingen, J., and Harris, C. (1999) Global
change in agrifood grades and standards: agribusiness strategic responses in
developing countries. International Food and Agribusiness Management Review 2(3).
pp. 421-435.
Rosenbaum P.R., and D.B. Rubin (1983) The central role of the propensity score in
observational studies for causal effects’, Biometrika 70, pp. 41-55.
Swinnen, J.F.M., 2005, When the Market Comes to You - Or Not. The Dynamics of
Vertical Co-ordination in Agro-Food Chains in Europe and Central Asia. Report, The
World Bank, Washington.
Weatherspoon, D.D. and Reardon, T. (2003) The Rise of Supermarkets in Africa:
Implications for Agrifood Systems and the Rural poor. Development Policy Review
21(3), pp. 333-356.
Weatherspoon, D., Cacho, J. and Christy R. (2001) Linking Globalization, Economic
Growth and Poverty: Impacts of Agribusiness Strategies on Sub-Saharan Africa.
American Journal of Agricultural Economics 83(3), pp. 722-29 Warning and Key,
2002
28

Tables
Table 1: Characteristics of selected agro-exporting firms
French beans
other crops
Soleil Vert 800 1100 2000 ONAPES1
Sepam 883 1410 1992 ONAPES Master 68 0 1989 ONBaniang 80 150 1999 ONAPES Agriconcept 100 80 2002 SEPAS2
ANS Interexport 64 0 2001 SEPASPasen 30 0 2000 SEPASAgral Export 180 0 1992 SEPASPDG 173 239 1993 SEPAS
2 SEPAS – Syndicat des Exportateurs des produits Agricoles
1 ONAPES – Organisation National des Producteurs Exportateurs de Fruits et Légumes de Sénégal
Export volume in 2004 (ton)
Company name
Year entering Frecnh bean
export
organisation membership
APES
Source: Authors interviews
Table 2: Changes in procurement system of selected agro-exporting firms
1st year of operation
last seasonhousehold
farms (< 10 ha)
commercial farms
(> 50 ha)Soleil Vert 100 20 40 1Sepam 100 60 50 2Master 50 40 n.a. n.a.Baniang 85 85 n.a. n.a.Agriconcept 30 30 n.a. n.a.ANS Interexport 100 100 50 0Pasen 100 60 8 0Agral Export 100 100 30 0PDG 100 100 45 0
n.a.: data not available
% of supply from contract-farming
Number of contracted farms
Company name
Source: Authors interviews
29
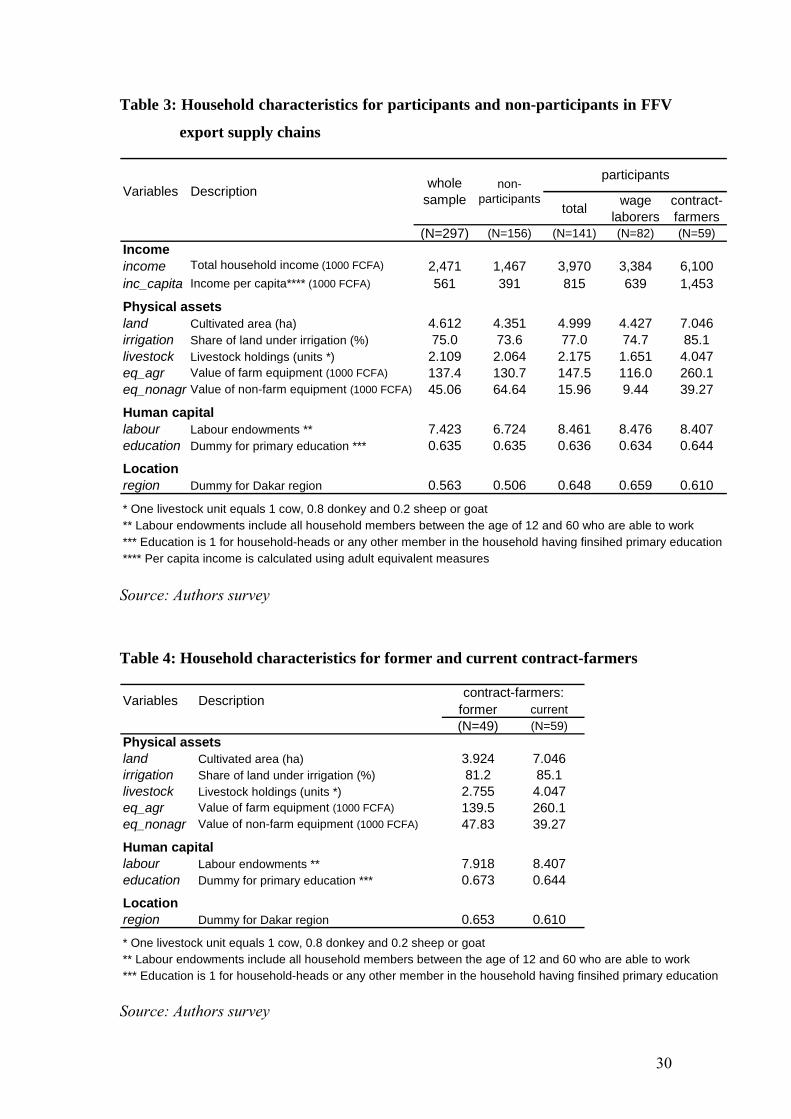
Table 3: Household characteristics for participants and non-participants in FFV
export supply chains
total wage laborers
contract-farmers
(N=297) (N=156) (N=141) (N=82) (N=59)Income income Total household income (1000 FCFA) 2,471 1,467 3,970 3,384 6,100inc_capita Income per capita**** (1000 FCFA) 561 391 815 639 1,453
Physical assets land Cultivated area (ha) 4.612 4.351 4.999 4.427 7.046irrigation Share of land under irrigation (%) 75.0 73.6 77.0 74.7 85.1livestock Livestock holdings (units *) 2.109 2.064 2.175 1.651 4.047eq_agr Value of farm equipment (1000 FCFA) 137.4 130.7 147.5 116.0 260.1eq_nonagr Value of non-farm equipment (1000 FCFA) 45.06 64.64 15.96 9.44 39.27
Human capital labour Labour endowments ** 7.423 6.724 8.461 8.476 8.407education Dummy for primary education *** 0.635 0.635 0.636 0.634 0.644
Locationregion Dummy for Dakar region 0.563 0.506 0.648 0.659 0.610
* One livestock unit equals 1 cow, 0.8 donkey and 0.2 sheep or goat ** Labour endowments include all household members between the age of 12 and 60 who are able to work*** Education is 1 for household-heads or any other member in the household having finsihed primary education**** Per capita income is calculated using adult equivalent measures
whole sample
participantsnon-
participantsVariables Description
Source: Authors survey
Table 4: Household characteristics for former and current contract-farmers
former current(N=49) (N=59)
Physical assets land Cultivated area (ha) 3.924 7.046irrigation Share of land under irrigation (%) 81.2 85.1livestock Livestock holdings (units *) 2.755 4.047eq_agr Value of farm equipment (1000 FCFA) 139.5 260.1eq_nonagr Value of non-farm equipment (1000 FCFA) 47.83 39.27
Human capital labour Labour endowments ** 7.918 8.407education Dummy for primary education *** 0.673 0.644
Locationregion Dummy for Dakar region 0.653 0.610
* One livestock unit equals 1 cow, 0.8 donkey and 0.2 sheep or goat
contract-farmers:
** Labour endowments include all household members between the age of 12 and 60 who are able to work*** Education is 1 for household-heads or any other member in the household having finsihed primary education
Variables Description
Source: Authors survey
30

Table 5: Explaining participation: 1st stage regression results from a
multinominal logit model
Number of obs 297F( 16, 280) 3.7200Prob > F 0.0000
Variables Coefficient odds ratio Std. Err. t statisticAGRO-INDUSTRIAL EMPLOYMENT (m =1)land 0.0059 1.0059 0.0351 0.17irrigation 0.0006 1.0006 0.0038 0.16livestock -0.0386 0.9622 0.0476 -0.81eq._agr -0.0004 0.9996 0.0007 -0.5eq._nonagr. -0.0018 0.9982 0.0009 -2.03** labour 0.2271 1.2549 0.0500 4.54*** education -0.4470 0.6396 0.3255 -1.37region 0.8368 2.3090 0.3250 2.57***constant -2.4741 0.5825 -4.25
CONTRACT_FARMING (m =2)land 0.0856 1.0894 0.0287 2.98***irrigation 0.0116 1.0117 0.0055 2.13**livestock 0.0236 1.0238 0.0257 0.92eq._agr 0.0006 1.0006 0.0006 0.96eq._nonagr. -0.0003 0.9997 0.0006 -0.57labour 0.1367 1.1465 0.0605 2.26**education -0.0308 0.9696 0.3813 -0.08region 0.9932 2.7000 0.3815 2.6***constant -5.0504 0.6989 -7.23
Significance level: *** 1%; ** 5%; *10%; and ° 15%
The outcome no participation (m =0) is used as the basecategory; the estimated coefficients of the other outcomes (m =1 and m =2) have to be interpreted relative to the basecaterory
Source: Author survey
31

Table 6: Impact of participation on income: 2nd stage regression results from
an OLS regression
29723.24
00.2626
Std. Err. t statistic Std. Err. t statisticunearned income 0.926 0.051 18.01*** 0.405 2.28**land 325.6 171.8 1.89* 45.94 7.09***irrigation 22.61 14.30 1.58° 3.572 6.33***eq._agr 3.925 3.825 1.03 1.300 3.02**eq._nonagr 3.722 4.512 0.82 2.088 1.78*livestock -35.85 178.7 -0.20 47.38 -0.76labour 887.0 557.3 1.59° 197.9 4.48***labour2 -57.26 36.65 -1.56° 12.04 -4.76***m 1 (wage employment) 1,419 827.5 1.72* 269.8 5.26***m 2 (contract-farming) 3,051 1,257 2.43** 221.9 13.75***corr_funct_m1 16,868 22,165 0.76 8,653 1.95*corr_funct_m2 -11,360 31,964 -0.36 14,350 -0.79corr_funct_m3 6,778 8,952 0.76 2,789 2.43**corr_funct_m12 43,205 94,805 0.46 40,512 1.07corr_funct_m13 -4,481 50,383 -0.09 17,080 -0.26corr_funct_m23 -5,952 62,903 -0.09 25,145 -0.24constant -738.2 125,602 -0.01 51,870 -0.01
Significance level: *** 1%; ** 5%; *10%; and ° 15%
Number of obsF( 16, 280)
Prob > FR-squared
1 To account for the two-step nature of the procedure, standard errors are estimated using the bootstrap method with 50 bootstrap replications and bootstrap samples seleceted within each stratum of the original survey design.
Note: the selectivity correction functions, corr_func_mx, to account for self-selection bias of treatment m =0, 1, 2 were calculated from a multinomnial logit model.
Variables Coefficient Bootstrap estimates1OLS estiamtes
Source: Author survey
Table 7: Poverty indicators for two alternative simulations, compared with the
actual situation
av. household income
av. per capita income
(1,000 FCFA) (1,000 FCFA)Scenerio A 1,831 401 57% 1.44Scenerio B 2,610 600 44% 1.22Actual situation 2,545 573 40% 0.66
Scenerio A: no French bean exports at all Scenerio B: French bean exports based on smallholder contract-farming as in 2000
poverty head-count ratio
poverty gap ratio
Source: Author survey
32

Figures
Figure 1: Exported volume (1,000 ton) of horticulture products from Senegal,
1987 - 2005
0
2
4
6
8
10
12
14
16
18
1991 1993 1995 1997 1999 2001 2003 2005
Year
Expo
rted
volu
me
(thou
sand
ton)
horticulture products green beans
Source: calculated from DH – Direction de l’Horticulture ( 2005)
33

Figure 2: Share of households participating in French bean production through
wage employment or contract-farming
0%5%
10%15%20%25%30%35%40%45%
1990 1992 1994 1996 1998 2000 2002 2004
Year
Shar
e of
hou
seho
lds
contract-farming wage employment total
The figure is based on recall data from a sample of 300 households in 2005. To account for demographic effects, households for which the household head did not reach the age of 25 in a particular year and households who migrated to the area only after a particular year were excluded from the figures for that year. To account for biases due to sampling design, sampling weights were used in the calculations.
Source: Calculated from survey data
34