high-sulfidation epithermal pyrite-hosted au (ag-cu) ore
TRANSCRIPT
©2014 Society of Economic Geologists, Inc.Economic Geology, v. 109, pp. 1705–1733
High-Sulfidation Epithermal Pyrite-Hosted Au (Ag-Cu) Ore Formation by Condensed Magmatic Vapors on Sangihe Island, Indonesia*
Julia King,1,† A.E. Williams-Jones,1 Vincent van Hinsberg,1 and Glyn Williams-Jones2
1Department of Earth and Planetary Sciences, McGill University, 3450 University Street, Montréal, Québec, Canada H3A 0E82Department of Earth Sciences, Simon Fraser University, 8888 University Drive, Burnaby, British Columbia, Canada V5A 1S6
AbstractAlthough gold in high-sulfidation epithermal deposits generally occurs as the native metal or electrum, in
some deposits, a significant proportion of the gold is hosted in pyrite. Here we use a combination of petrog-raphy, whole-rock geochemistry, pyrite chemistry, crystallography, and phase stability relationships to deter-mine how gold was transported and incorporated into pyrite in two relatively young high-sulfidation epithermal deposits, where the gold occurs almost exclusively in solid solution or as nanoparticles in pyrite.
The genetically related Bawone and Binebase Au (Cu-Ag) deposits, located 1 km apart on the volcanic island of Sangihe, northeastern Indonesia, are hosted by andesitic volcaniclastic rocks that were altered to a proximal advanced argillic association of quartz + pyrite (py I) + pyrophyllite + natroalunite + alunite + dickite + kaolin-ite and a more distal intermediate argillic association of quartz + pyrite (py I) + kaolinite + dickite + illite. The economic mineralization takes the form of multiple generations of auriferous pyrite, the first of which, pyrite I (py I), developed during advanced argillic alteration. Mass balance calculations show that all elements were mobile with the exception of Nb, Ti, some rare earth elements, and possibly Al.
The highest gold concentration is in pyrite II (py II), which occurs in veins that cut pyrite I. This drusy vari-ety of pyrite is characterized by complex growth and sector zoning, and contains as much as 6.0 wt % Cu. The elevated Cu concentrations correlate positively with Au and As concentrations, whereas the Ag concentration correlates strongly with Au but not Cu. Later barite-enargite mineralization exploited py II veins and vugs, and significant concentrations of Ag and Au are hosted by enargite, although the Au concentration in enargite is lower than in py II or py I.
A model is presented in which the fluid responsible for advanced argillic and intermediate argillic alteration and associated stage 1 gold mineralization was a condensed magmatic vapor derived from an oxidized magma. The gold and other metals were transported as hydrated species that ascended through the volcanic pile via fractures and zones of enhanced permeability to a depth between 900 and 1300 m, where the vapor condensed at a temperature between 250 and 340°C to form an acidic liquid with a pH of ~2.5; fO2 ranged up to four log units above the hematite-magnetite buffer. Interaction of this liquid with the host andesites caused advanced argillic and intermediate argillic alteration, including sulfidation of mafic minerals to form py I. During crystal-lization of py I, Au, Cu and Ag were adsorbed onto the surface of the pyrite and deposited as nanoparticles, or were incorporated in the pyrite structure. Adsorption of Au, Cu, and Ag from the condensed vapor reached a peak during the crystallization of vein-hosted py II, and the uptake of Ag and minor Au continued during later crystallization of enargite. From the distribution of metals among growth and sector zones in py II, incorpora-tion of gold and other metals appears to have been maximized when physicochemical conditions were relatively stable. This is in contrast to the requirement for native gold precipitation, namely that physicochemical gradi-ents be steep to ensure supersaturation of gold in the ore fluid.
IntroductionAlthough considerable progress has been made in under-standing the formation of high-sulfidation epithermal pre-cious metal deposits, opinion is still divided over the nature of the ore fluid. There is general agreement that the char-acteristic residual (vuggy) silica and advanced argillic altera-tion are the result of interaction of rocks with the condensate of highly acidic and oxidizing vapors (e.g., HCl, and H2S and H2SO4 produced by reaction of H2O with SO2) from a proxi-mal magma source (e.g., Hemley and Jones, 1964; Stoffregen 1987; Rye, 1993; Arribas 1995). However, until recently, most researchers, noting that the ore minerals commonly fill vugs and therefore postdate the alteration, have concluded that the fluid responsible for the alteration did not transport the ore
metals (Stoffregen, 1987; White and Hedenquist, 1990; Arri-bas, 1995; Hedenquist et al., 1998). Instead, these researchers have attributed the mineralization to collapse of the vapor-dominated system and transport of the metals by a magmatic-hydrothermal liquid with a large meteoric water component. The discovery that gold mineralization in the Pascua deposit, Chile, was contemporaneous with advanced argillic alteration (Chouinard et al., 2005a), indicates that for some high-sulfida-tion epithermal deposits (cf. Voudouris, 2010) the two-stage hydrothermal model does not apply. This, and a combina-tion of fluid inclusion (Heinrich et al., 1999; Landtwing et al., 2010) and experimental evidence (Archibald et al., 2001, 2002; Williams-Jones et al., 2002; Zezin et al., 2011b; Migdisov and Williams-Jones, 2013; Hurtig and Williams-Jones, 2014) showing that gold, silver, and copper may be considerably more soluble in aqueous vapors than previously suspected, supports a model for these deposits in which hydrothermal alteration and economic mineralization were both products of a magmatic hydrothermal vapor (cf. Williams-Jones and
0361-0128/14/4246/1705-29 1705Submitted: March 31, 2013
Accepted: December 9, 2013
† Corresponding author: e-mail, [email protected]*A digital supplement to this paper, containing four Appendices with raw
data, is available at http://economicgeology.org/ and at http://econgeol.geo-scienceworld.org/.
1706 KING ET AL.
Heinrich, 2005; Mavrogenes et al., 2010; Berger and Henley, 2011; Henley and Berger, 2011; Scher et al., 2013).
Most studies of high-sulfidation epithermal systems have focused on deposits in which the gold occurs as a discrete mineral or minerals (e.g., native gold, electrum, and/or a tellu-ride phase, such as calaverite; Kesler et al., 1981; Stoffregen, 1987; Moritz et al., 2004; Deditius et al., 2008). However, in some high-sulfidation deposits, notably the Pascua deposit in Chile, a high proportion of the gold is hosted in sulfide miner-als, particularly pyrite (e.g., Chouinard et al., 2005b; Deditius et al., 2009). Here, we report results of a study of two high-sulfidation epithermal deposits, Bawone (9.5 Mt of ore with an average grade of 1.32 g/t Au and 3.97 g/t Ag) and Bine-base (17.9 Mt of ore with an average grade of 0.76 g/t Au and 18.7 g/t Ag), located on Sangihe Island, Indonesia, in which virtually all the hypogene gold is hosted in pyrite. Most signifi-cantly, greater than 50% of this gold is in pyrite that forms part of the early advanced argillic alteration mineral association; the rest is contained mainly in pyrite veins that cut the altered rocks. Thus, gold mineralization was both contemporaneous with and postdated alteration. Based on this and other obser-vations, we develop a model designed to explain the genesis of the Bawone and Binebase deposits involving transport of the metals in a highly acidic vapor and sorption of the gold onto the surfaces of growing pyrite crystals. Given the early tim-ing of the Au-Ag mineralization and the observation that it is hosted almost exclusively by pyrite, we also propose that these deposits are representatives of a subclass of high-sulfidation epithermal precious metal deposits, in which the bulk of the metal is hosted in pyrite and the ore fluid was a condensed magmatic vapor.
Regional Geologic SettingThe Bawone and Binebase Au (Ag-Cu) deposits are located
in the southern part of Sangihe Island, the largest of the islands in the 500 km long Sangihe arc, which runs north-south from southern Mindanao, Philippines, to the north arm of Sulawesi, and separates the Celebes and Molucca Seas (Figs. 1, 2; Hall, 2000). The Sangihe arc formed as a result of the westerly subduction of the Molucca Sea plate under the Eurasian plate, whereas the facing Halmahera arc was pro-duced by the easterly subduction of the Molucca Sea plate under the Philippine Sea plate (Morrice et al., 1983; Morrice and Gill, 1986; Garwin, 1990; Hall, 1996, 2000). Twenty-five Quaternary stratovolcanoes are located along the length of the arc; eight of these are active, including Awu at the northern tip of Sangihe Island (Morrice and Gill, 1986; Fig. 1). Previ-ous studies of volcanism along the Sangihe Arc have shown that the arc is composed mainly of two-pyroxene and horn-blende andesites. Calc-alkaline suites dominate and vary from low to high K, depending on their distance from the volcanic front (Morrice and Gill, 1986).
Sangihe Island has a lobate form defined by volcanic cen-ters, the active stratovolcano, Awu, at the northern end and the dormant/extinct stratovolcanoes, Tahuna and Kakiraeng, and strongly weathered centers of Taware and Malisang to the south (Fig. 1). The oldest part of the island is in the southeast and the youngest in the northwest; new volcanoes are forming off the northwestern tip and western shores of Sangihe Island (Beaulieu, 2010). Given the heavy rainfall (greater than 3 m
per year), dense vegetation and inferred rapid uplift due to the compressive tectonic regime, even the oldest volcanoes, in the southern part of the island where the Bawone and Bine-base deposits are located, may be only tens of thousands of years in age.
The southern part of Sangihe Island is dominated by clino-pyroxene andesite flows, breccias, lahars, and tuffs of the Tamako Group, except in the southern and eastern parts where rocks of the Taware Group, Malisang Group, Bine-base Group, and Pinterang Formation are exposed (Fig. 2). The Binebase deposit is 1 km to the north of Bawone, and both deposits are hosted by rocks of the Binebase Group. At Bawone, the Binebase Group is overlain unconformably by the Pinterang Formation, which covers the deposit, whereas at Binebase, the deposit crops out and is strongly oxidized to a maximum depth of 70 m (Fig. 3). The Binebase Group has a northeasterly strike, moderate to steep southeasterly dip, and comprises andesitic ash and crystal tuffs, hornblende-pyrox-ene andesite flows, biotite-hornblende-magnetite diorite and minor dacite to rhyolite flows, which are interpreted to be volcanic and subvolcanic facies of the extinct and eroded Taware volcano (Garwin, 1990). To the east of the Binebase deposit, Binebase Group rocks are overlain by rocks of the Tamako Group (consisting of hornblende andesite flows, sills, and dikes), the proximal facies of the dormant and/or extinct Kakiraeng volcano, and to the south by the Pinterang For-mation. East of the Bawone deposit, the Pinterang Forma-tion overlies the Tamako Group rocks unconformably. This unit is thickest (<100 m) in topographic lows, and consists of reworked cross-bedded volcanic silts and sands, carbonates and organic-rich sediments, which record a marine incursion in the southeast part of Sangihe Island (Garwin, 1990). The Pinterang Formation also contains slightly rounded, unoxi-dized aggregates of pyrite fragments, similar to pyrite II (py II) from the Bawone and Binebase hypogene ores. The Pin-terang Formation and Tamako Group overlie the Malisang Group, which in turn unconformably overlies the Binebase Group in the southeast part of the island. Stegodon fossils found in conglomeritic channels in the Pinterang Forma-tion indicate that the unit is between 2 million years and 60,000 years in age (de Vos et al., 2007). The Malisang Group consists of hornblende andesite flows, sills, dikes, and diorite intrusions that form local highs and is related to the Malisang volcanic center (Garwin, 1990).
Local Geologic SettingRecent oxidation has enriched both Au and Ag, and con-
sequently, much of the potentially economic mineralization of the Binebase deposit and a part of the Bawone deposit are supergene in origin. However, both deposits have appreciable reserves of hypogene sulfide mineralization. The inferred resources, using a 0.25 g/t Au cutoff, are summarized in Table 1.
The Bawone and Binebase deposits are hosted by andesites and dacites of the Binebase Group. The Binebase deposit is exposed at the erosional surface and has been oxidized up to a depth of 70 m (Fig. 3B). The host andesite is a crystal-rich tuff containing 10 to 15 vol % of plagioclase laths and round quartz crystals (1–2 mm in length and diameter, respec-tively) and occasional lapilli, and lithic fragments (0.5–3 cm

HIGH-SULFIDATION EPITHERMAL PYRITE-HOSTED Au ORE FORMATION, SANGIHE ISLAND, INDONESIA 1707
in diameter). Rare breccia zones containing a wide variety of rock fragments are likely epiclastic deposits.
At Bawone, a thick andesite unit overlies flow-banded pla-gioclase-quartz-phyric dacite (Figs. 3A, 4A). In least-altered
samples, the andesite contains 5 to 30 vol % white plagio-clase laths (2 mm long) and rare, rounded quartz phenocrysts (2 mm in diameter) in an aphanitic matrix. Conformable lay-ers of welded crystal tuff are locally present in the andesite. These contain 10 vol % of megascopic crystals of <3-mm-long plagioclase laths and rare, rounded <3-mm-diameter quartz grains. This unit is intruded by hypabyssal andesitic por-phyry (Fig. 3A). The hypabyssal porphyry contains 20 vol %, 5 mm long, subhedral to euhedral hornblende, magnetite, biotite and plagioclase phenocrysts, and rare quartz eyes in an aphanitic matrix. An intrusive breccia with subangular to subrounded, 1- to 10-cm-diameter fragments of the host andesite and dacite generally defines the margins of the hyp-abyssal porphyry (Fig. 4B). At Bawone, the locally overlying
Awu (1327m)
Tahuna (697m)
Taware (306m)
Malisang (295m)
Kakiraeng (1006m)
Bawone (86m)Binebase (65m)
125°40'0"E125°30'0"E
3°40
'0"N
3°35
'0"N
3°30
'0"N
3°25
'0"N
3°20
'0"N 0 10
Km
Sangihe I.
Fig. 1. Inset: Location of Sangihe Island. Digitial elevation model of Sangihe Island showing the locations and elevations of the active volcano, Awu, dormant and/or extinct volcanic centers (Tahuna, Kakiraeng, Malisang) and the Bawone and Bine-base deposits. Bathymetry contours are at 50-m intervals.
Table 1. Inferred Resources for the Bawone and Binebase Deposits (Stone, 2010)
Deposit Tonnes Au (g/t) Ag (g/t) Au (oz) Ag (oz)
Bawone Oxide 3,475,000 1.66 9.16 185,464 205,933 Sulfide 5,999,000 1.12 0.97 216,020 187,089
Binebase Oxide 7,851,000 1.10 25.13 277,661 6,343,299 Sulfide 10,002,000 0.49 13.60 157, 573 4,373,443

1708 KING ET AL.
Intrusions
Quaternary Alluvium
Pinterang Formation
Tamako Group
Batunderang Group
Malisang Group
Binebase Group
Taware Group
0 4Km
Taware (306 m)
Malisang (295 m)
Bawone (86 m)
Binebase (65 m)
125°40'0"E
125°40'0"E
125°35'0"E
125°35'0"E
3°30
'0"N
3°30
'0"N
3°25
'0"N
3°25
'0"N
Extinct Volcano
Fig. 2. The geology of south Sangihe Island and the location of the Bawone and Binebase deposits, modified from Garwin (1990).
BOD3
BOD1 BOD42
25 m
25 m
Andesite porphyry
Dacite
Binebase Group
SoilPinterang FormationOxide zone/weatheredBinebase Group
Andesitic tuff
Porphyritic Intrusion
SoilPinterang FormationOxide zone
Andesitic crystal tuffBinebase Group
100 m
100 m
BID15 BID11 BID57BID16
BID63BID27
BID72BID69
BID56 BID60BID66
A B
Fig. 3. Representative lithological cross sections (A) through the Binebase deposit (NW-SE) and (B) through the Bawone deposit (SW-NE) based on drill holes. The black lines show the locations of the drill holes. Most primary features have been destroyed in the oxide zone but the original nature of the rock is assumed to have been the same as that of the underlying bedrock.

HIGH-SULFIDATION EPITHERMAL PYRITE-HOSTED Au ORE FORMATION, SANGIHE ISLAND, INDONESIA 1709
Pinterang Formation (poorly consolidated volcaniclastic sand-stones and siltstones, organic-rich siltstones, and calcareous mudstones) ranges up to 100 m thick and is separated from the Binebase Group rocks by a thin (several-cm) oxide layer, possibly a paleosol. The Pinterang Formation is overlain by an oxidized soil that is up to 4 m thick.
Hydrothermal AlterationIn hand sample, the altered rocks vary from dark gray to
white in color, depending on the pyrite content, and from very hard (quartz dominated; Fig. 4C) to powdery (clay dominated; Fig. 4D) in drill core; the latter variation commonly occurs over intervals of tens of centimeters to tens of meters. Altera-tion intensity is variable. In some samples, the primary min-erals have been completely replaced by secondary minerals, destroying all primary textures, whereas in other samples, vol-canic textures are preserved (Figs. 4D, 5A). The pervasively altered samples comprise very fine-grained, clay particles intergrown with fine-grained, generally anhedral, equigranu-lar quartz and pyrite (Fig. 5A, B, D). Less intensely altered
samples commonly retain porphyritic textures, although the phenocrysts have generally been replaced by kaolinite or dickite. The most intensely altered samples consist of a fine-grained mosaic of intergrown anhedral quartz, clay minerals (kaolinite, dickite, pyrophyllite), sulfate minerals (alunite, natroalunite) and pyrite. Hereafter, the fine-grained, anhe-dral pyrite intergrown with clay minerals and quartz will be referred to as pyrite I (py I).
Alteration created secondary porosity in the form of mm-scale vugs (formed by the dissolution of phenocrysts) and irregular, cm-scale cavities. The latter are commonly infilled by alunite, and/or pyrophyllite, and/or drusy pyrite, and/or chalcocite, and/or barite crystals (Figs. 4C, 5C, D).
Alteration is most intense (few primary textures preserved) along subvertical fluid conduits that fan out horizontally at lithologic contacts (Fig. 6A). Distal to the mineralized zones, alteration is generally less intense, primary volcanic textures and minerals are preserved, and the rock is more competent. The matrix of the rock is preferentially altered and has a grey to light-brown color.
D DCKao + Qtz + Al
Py I + Qtz
Py II
A B
Py I
Pl
Bt
Hbl
Mag
Fig. 4. Photographs of the host rocks of the Bawone and Binebase deposits (cut slabs and core). (A) Argillically altered flow-banded dacite, the basal unit of the Binebase Group at Bawone, showing phenocrysts and a matrix replaced by kaolinite and quartz. (B) Plagioclase (Pl)-biotite (Bt), hornblende (Hbl)-magnetite (Mag) andesite porphyry. (C) Vein of py II (brassy) with fragments of py I (black) in a matrix of vuggy py I with py II occasionally lining vugs. (D) Advanced argillic (alunite = Al, pyrite = Py, quartz = Qtz) alteration of fragments (light gray) in a matrix of fine-grained quartz and pyrite (dark gray). The scale bar is 1 cm.

1710 KING ET AL.
A B
Py I
Al
F
D
Cc
Brt
Py II
Py I + Qtz
Py II
Py II
Brt
Brt
Apy
Ccp
Sp El
C
E
En
QtzPy I
Fig. 5. Photomicrographs showing the textures of the altered and mineralized rocks in reflected light (10 μm scale bar). (A) Amphibole phenocrysts replaced by py I in a groundmass replaced by fine-grained quartz, py I, kaolinite ± dickite. (B) Fine-grained association of quartz, alunite and py I, typical of argillic alteration. (C) Massive py II and a vug containing rare chalcocite (Cc) and barite (Brt) crystals. (D) Growth zoned drusy crystals of py II infilling a vug in andesite altered to fine-grained py I and quartz (blue-grey is epoxy). (E) Fractured and zoned crystals of massive py II cut by a barite-enargite (En) vein. (F) Sphalerite (Sp), arsenopyrite (Apy), chalcopyrite (Ccp) and electrum (El) crystals in a coarse-grained barite matrix. The earliest stage of gold-silver mineralization is manifest by fine-grained py I associated with equally fine-grained quartz and clay minerals (A, B). This was followed by a second generation of Au-Ag mineralization in the form of coarse-grained py II (C, D, E). The third generation of Au-Ag mineralization is represented by barite-enargite (En) veins that com-monly contain brecciated py II crystals (E). Rare cm-scale veins of barite containing electrum, sphalerite, arsenopyrite and chalcopyrite that cut py I and py II mineralization constitute a fourth generation of Au-Ag mineralization observed only in the Binebase deposit.
HIGH-SULFIDATION EPITHERMAL PYRITE-HOSTED Au ORE FORMATION, SANGIHE ISLAND, INDONESIA 1711
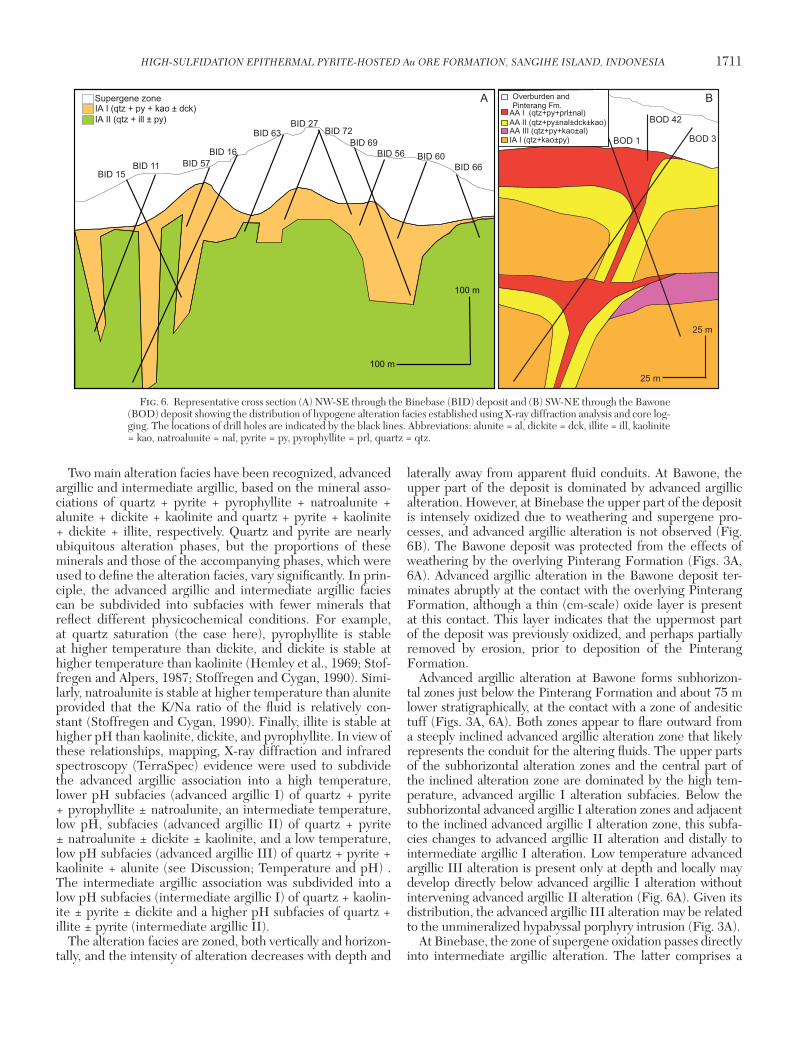
Two main alteration facies have been recognized, advanced argillic and intermediate argillic, based on the mineral asso-ciations of quartz + pyrite + pyrophyllite + natroalunite + alunite + dickite + kaolinite and quartz + pyrite + kaolinite + dickite + illite, respectively. Quartz and pyrite are nearly ubiquitous alteration phases, but the proportions of these minerals and those of the accompanying phases, which were used to define the alteration facies, vary significantly. In prin-ciple, the advanced argillic and intermediate argillic facies can be subdivided into subfacies with fewer minerals that reflect different physicochemical conditions. For example, at quartz saturation (the case here), pyrophyllite is stable at higher temperature than dickite, and dickite is stable at higher temperature than kaolinite (Hemley et al., 1969; Stof-fregen and Alpers, 1987; Stoffregen and Cygan, 1990). Simi-larly, natroalunite is stable at higher temperature than alunite provided that the K/Na ratio of the fluid is relatively con-stant (Stoffregen and Cygan, 1990). Finally, illite is stable at higher pH than kaolinite, dickite, and pyrophyllite. In view of these relationships, mapping, X-ray diffraction and infrared spectroscopy (TerraSpec) evidence were used to subdivide the advanced argillic association into a high temperature, lower pH subfacies (advanced argillic I) of quartz + pyrite + pyrophyllite ± natroalunite, an intermediate temperature, low pH, subfacies (advanced argillic II) of quartz + pyrite ± natroalunite ± dickite ± kaolinite, and a low temperature, low pH subfacies (advanced argillic III) of quartz + pyrite + kaolinite + alunite (see Discussion; Temperature and pH) . The intermediate argillic association was subdivided into a low pH subfacies (intermediate argillic I) of quartz + kaolin-ite ± pyrite ± dickite and a higher pH subfacies of quartz + illite ± pyrite (intermediate argillic II).
The alteration facies are zoned, both vertically and horizon-tally, and the intensity of alteration decreases with depth and
laterally away from apparent fluid conduits. At Bawone, the upper part of the deposit is dominated by advanced argillic alteration. However, at Binebase the upper part of the deposit is intensely oxidized due to weathering and supergene pro-cesses, and advanced argillic alteration is not observed (Fig. 6B). The Bawone deposit was protected from the effects of weathering by the overlying Pinterang Formation (Figs. 3A, 6A). Advanced argillic alteration in the Bawone deposit ter-minates abruptly at the contact with the overlying Pinterang Formation, although a thin (cm-scale) oxide layer is present at this contact. This layer indicates that the uppermost part of the deposit was previously oxidized, and perhaps partially removed by erosion, prior to deposition of the Pinterang Formation.
Advanced argillic alteration at Bawone forms subhorizon-tal zones just below the Pinterang Formation and about 75 m lower stratigraphically, at the contact with a zone of andesitic tuff (Figs. 3A, 6A). Both zones appear to flare outward from a steeply inclined advanced argillic alteration zone that likely represents the conduit for the altering fluids. The upper parts of the subhorizontal alteration zones and the central part of the inclined alteration zone are dominated by the high tem-perature, advanced argillic I alteration subfacies. Below the subhorizontal advanced argillic I alteration zones and adjacent to the inclined advanced argillic I alteration zone, this subfa-cies changes to advanced argillic II alteration and distally to intermediate argillic I alteration. Low temperature advanced argillic III alteration is present only at depth and locally may develop directly below advanced argillic I alteration without intervening advanced argillic II alteration (Fig. 6A). Given its distribution, the advanced argillic III alteration may be related to the unmineralized hypabyssal porphyry intrusion (Fig. 3A).
At Binebase, the zone of supergene oxidation passes directly into intermediate argillic alteration. The latter comprises a
Fig. 6. Representative cross section (A) NW-SE through the Binebase (BID) deposit and (B) SW-NE through the Bawone (BOD) deposit showing the distribution of hypogene alteration facies established using X-ray diffraction analysis and core log-ging. The locations of drill holes are indicated by the black lines. Abbreviations: alunite = al, dickite = dck, illite = ill, kaolinite = kao, natroalunite = nal, pyrite = py, pyrophyllite = prl, quartz = qtz.
BOD 1
BOD 42
BOD 3
25 m
25 m
Overburden and Pinterang Fm.
AA I (qtz+py+prl±nal)AA II (qtz+py±nal±dck±kao)
IA I (qtz+kao±py)AA III (qtz+py+kao±al)
100 m
100 m
BID 66BID 60BID 56
BID 69BID 72
BID 27BID 63
BID 16BID 57BID 11
BID 15
Supergene zoneIA I (qtz + py + kao ± dck)IA II (qtz + ill ± py)
A B
1712 KING ET AL.
blanket of intermediate argillic I alteration with several sub-vertical roots that pass downward and laterally into intermedi-ate argillic II alteration (Fig. 6B).
Hypogene MineralizationNeither free gold nor electrum is observed in the hypo-
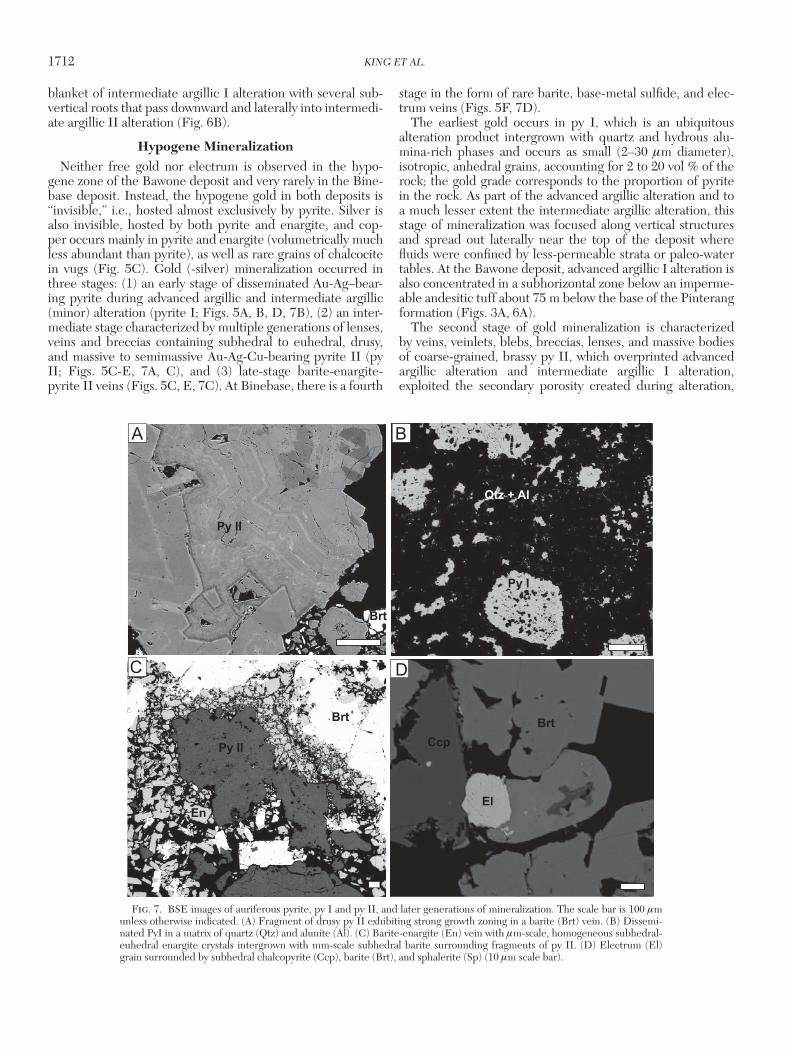
gene zone of the Bawone deposit and very rarely in the Bine-base deposit. Instead, the hypogene gold in both deposits is “invisible,” i.e., hosted almost exclusively by pyrite. Silver is also invisible, hosted by both pyrite and enargite, and cop-per occurs mainly in pyrite and enargite (volumetrically much less abundant than pyrite), as well as rare grains of chalcocite in vugs (Fig. 5C). Gold (-silver) mineralization occurred in three stages: (1) an early stage of disseminated Au-Ag–bear-ing pyrite during advanced argillic and intermediate argillic (minor) alteration (pyrite I; Figs. 5A, B, D, 7B), (2) an inter-mediate stage characterized by multiple generations of lenses, veins and breccias containing subhedral to euhedral, drusy, and massive to semimassive Au-Ag-Cu-bearing pyrite II (py II; Figs. 5C-E, 7A, C), and (3) late-stage barite-enargite-pyrite II veins (Figs. 5C, E, 7C). At Binebase, there is a fourth
stage in the form of rare barite, base-metal sulfide, and elec-trum veins (Figs. 5F, 7D).
The earliest gold occurs in py I, which is an ubiquitous alteration product intergrown with quartz and hydrous alu-mina-rich phases and occurs as small (2–30 μm diameter), isotropic, anhedral grains, accounting for 2 to 20 vol % of the rock; the gold grade corresponds to the proportion of pyrite in the rock. As part of the advanced argillic alteration and to a much lesser extent the intermediate argillic alteration, this stage of mineralization was focused along vertical structures and spread out laterally near the top of the deposit where fluids were confined by less-permeable strata or paleo-water tables. At the Bawone deposit, advanced argillic I alteration is also concentrated in a subhorizontal zone below an imperme-able andesitic tuff about 75 m below the base of the Pinterang formation (Figs. 3A, 6A).
The second stage of gold mineralization is characterized by veins, veinlets, blebs, breccias, lenses, and massive bodies of coarse-grained, brassy py II, which overprinted advanced argillic alteration and intermediate argillic I alteration, exploited the secondary porosity created during alteration,
D
A
Py II
Brt Brt
El
Ccp
Py II
Brt
Py I
Qtz + Al
B
C
En
Fig. 7. BSE images of auriferous pyrite, py I and py II, and later generations of mineralization. The scale bar is 100 μm unless otherwise indicated. (A) Fragment of drusy py II exhibiting strong growth zoning in a barite (Brt) vein. (B) Dissemi-nated PyI in a matrix of quartz (Qtz) and alunite (Al). (C) Barite-enargite (En) vein with μm-scale, homogeneous subhedral-euhedral enargite crystals intergrown with mm-scale subhedral barite surrounding fragments of py II. (D) Electrum (El) grain surrounded by subhedral chalcopyrite (Ccp), barite (Brt), and sphalerite (Sp) (10 μm scale bar).

HIGH-SULFIDATION EPITHERMAL PYRITE-HOSTED Au ORE FORMATION, SANGIHE ISLAND, INDONESIA 1713
and crosscut fine-grained py I. As is the case with py I, the gold grade is controlled by the abundance of py II, which forms 3 to 90 vol % of the rock, although py II is variably enriched in gold. In thin section, py II is coarse grained (0.1–2 mm long), massive or net-textured, and ranges in morphology from anhedral to euhedral (Figs. 5A, D, 7A, C). Botryoidal and drusy textures also are common, and many crystals are complexly zoned (Fig. 7A). In reflected light, some pyrite II crystals have an anhedral blue anisotropic core, which chemi-cally is indistinguishable from the rest of the crystal (Fig. 5E). Rare, isolated anhedral chalcocite crystals (3 mm in diameter) are observed locally in vugs rimmed by drusy py II (Fig. 5C). Growth zoning of py II crystals on the μm-scale is common, particularly in drusy crystals, which show a relatively stable growth history recorded by continuous growth surfaces. It is also observed in massive pyrite composed of crystals that grew separately and were later annealed, resorbed, brecciated and overgrown (Fig. 7A).
Pyrite I and II are commonly crosscut by barite-enargite veins (0.2–5 cm wide). These veins appear to have re-opened earlier py II veins, as they are commonly lined by fractured py II crystals, and py II commonly occurs as brecciated frag-ments in the veins, indicating that they were incorporated mechanically during barite-enargite vein formation (Figs. 5E, 7C). In the centers of these veins, intact, blue-purple, iso-tropic subhedral to euhedral (10–60 μm long) rectangular or bladed enargite crystals and fractured py II fragments are sus-pended in a matrix of coarse-grained, subhedral to drusy bar-ite crystals. Texturally, the enargite is homogeneous, unzoned, and appears to have coprecipitated with barite (Figs. 5E, 7C). Barite and enargite also commonly occur in vugs. The den-sity of barite-enargite veins (the proportion of veins relative to host-rock) is variable but generally correlates with that of py II veins, suggesting that both vein stages exploited the same structures.
Although electrum is volumetrically insignificant, the gold grade of these rare base-metal sulfide-electrum-barite veins is 20 times higher than that of the auriferous-pyrite dominated zones of the deposit. In the Binebase deposit, these veins range from 0.5 to 8 cm in width and are observed in the center of the hypogene mineralization. This rare vein association was only observed at Binebase, where it crosscuts all other min-eralization stages, except for the enargite-barite veins. The relative timing of these two late vein generations therefore cannot be established. Mineralogically, the base metal sulfide-electrum-barite veins comprise small subhedral to euhedral crystals of spalerite, arsenopyrite, chalcopyrite, galena, pyrite, electrum and Sb-sulfides that occur as aggregates in a coarse-grained matrix of euhedral barite crystals (Figs. 5F, 7D).
Distribution of gold-silver mineralization
Gold and silver grades in the Bawone deposit are highest just below the contact with the Pinterang Formation, decrease with depth and then increase again just below a thin tuffa-ceous andesite unit in a zone of advanced argillic I alteration (Figs. 3A, 6A, 8). Metal concentrations correlate with the pro-portion of py II, pyrite breccias and/or barite-enargite veins. A similar geometry is inferred for the hypogene mineralization at Binebase. However, because the upper part of the Bine-base deposit was subjected to supergene oxidation, we infer
that any high-grade hypogene mineralization in this deposit was at the level of the supergene zone. This interpretation is consistent with the observation that the remaining hypogene mineralization has a much lower concentration of gold and silver than the Bawone deposit (Table 1).
Assay data for 1m intervals of drill core for Bawone and Binebase, made available by East Asia Minerals Corp., show that there is a strong spatial correlation between Au and Ag concentrations, and also of As with Cu, and a weaker correla-tion of Cu and As with Sb (and Pb and Zn, not shown) concen-trations (Fig. 8). Molybdenum concentrations are below the 2 ppm detection limit. The distribution of Au, Ag, As, and Cu is vertically zoned, with the highest concentrations of these elements occurring at the top of the hypogene zone. The highest Au value coincides with high Cu, As, and Sb values reflecting the presence of barite-enargite veins. This relation-ship, however, does not hold for the second highest Au value (Fig. 8). Indeed, most of the higher Cu, As, and Sb values are accompanied by only minor to negligible enrichment in Au. We interpret these metal distributions to indicate that barite-enargite veins contributed only minor amounts of gold and locally re-opened veins of py II to produce the coincident Au, Cu, As, and Sb peaks.
Mass Changes During AlterationFifty-four drill core samples of the different lithological
units and alteration types were analyzed for major, trace, and rare earth elements (REE) by inductively coupled plasma-mass spectrometry (ICP-MS), and for gold by instrumental neutron activation analysis (INAA), by Actlabs in Vancouver (Table 2). The compositions of the altered rocks were com-pared to those of the least-altered rocks to evaluate the gains and losses of elements during alteration. In order to assess these mass changes, it was first necessary to identify poten-tially immobile elements that could be used to normalize
40
60
80
SbAsCuAgAu50 250
5000
1000
100020003000
200
10 20
Concentration (ppm)
Dep
th (m
)
Fig. 8. The concentrations of Au, Ag, Cu, As, and Sb (ppm) in a drill hole from the Bawone deposit (BOD1); Pb and Zn concentrations were below the detection limit and Mo and Ba were not analyzed.

1714 KING ET AL.
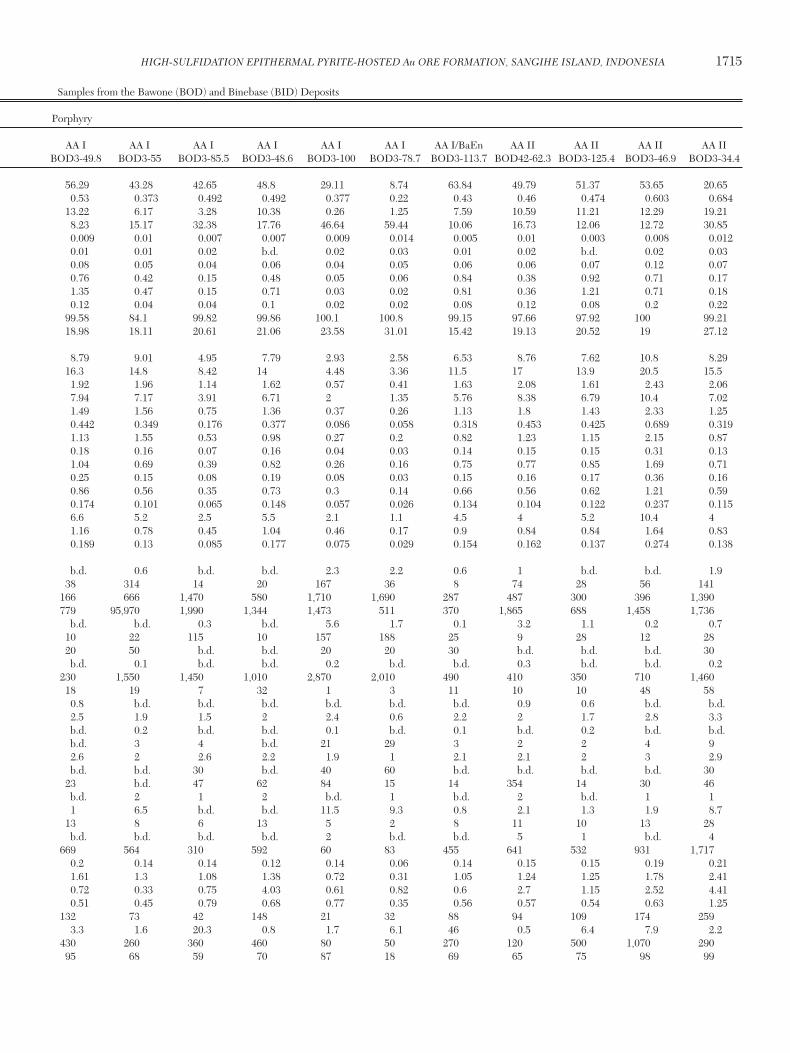
Table 2. Major Element Compositions from Drill Core and Hand Samples from the Bawone (BOD) and Binebase (BID) Deposits
Porphyry
IA I IA I IA I IA I IA I IA I IA I/BaEn IA I/BaEn AA I AA I AA I AA I AA I AA I AA I/BaEn AA II AA II AA II AA II d.l. BOD1-134.5 BOD3-158.8 BOD3-85.4 BOD3-74.1 BOD3-106.4 BOD3-83.3 BOD3-99.2 BOD3-96.8 BOD3-49.8 BOD3-55 BOD3-85.5 BOD3-48.6 BOD3-100 BOD3-78.7 BOD3-113.7 BOD42-62.3 BOD3-125.4 BOD3-46.9 BOD3-34.4
SiO2 (%) 0.01 55.4 64.68 8.2 58.66 51.41 48.19 19.69 85.78 56.29 43.28 42.65 48.8 29.11 8.74 63.84 49.79 51.37 53.65 20.65TiO2 (%) 0.001 0.546 0.547 0.036 0.528 0.484 0.541 0.185 0.501 0.53 0.373 0.492 0.492 0.377 0.22 0.43 0.46 0.474 0.603 0.684Al2O3 (%) 0.01 19.8 14.36 0.33 9.13 2.91 2.85 0.3 2.34 13.22 6.17 3.28 10.38 0.26 1.25 7.59 10.59 11.21 12.29 19.21Fe2O3 (%) 0.01 4.26 8.38 35.08 13.45 27.98 30.09 40.04 6.14 8.23 15.17 32.38 17.76 46.64 59.44 10.06 16.73 12.06 12.72 30.85MnO (%) 0.001 0.008 0.009 0.005 0.006 0.007 0.006 0.006 0.006 0.009 0.01 0.007 0.007 0.009 0.014 0.005 0.01 0.003 0.008 0.012MgO (%) 0.01 0.75 0.02 0.02 0.01 0.02 0.02 0.02 0.02 0.01 0.01 0.02 b.d. 0.02 0.03 0.01 0.02 b.d. 0.02 0.03CaO (%) 0.01 0.78 0.03 0.04 0.06 0.05 0.04 0.03 0.06 0.08 0.05 0.04 0.06 0.04 0.05 0.06 0.06 0.07 0.12 0.07Na2O (%) 0.01 0.35 0.05 0.06 0.56 0.06 0.07 0.04 0.04 0.76 0.42 0.15 0.48 0.05 0.06 0.84 0.38 0.92 0.71 0.17K2O (%) 0.01 2.17 0.08 0.02 0.69 0.02 0.04 0.05 0.04 1.35 0.47 0.15 0.71 0.03 0.02 0.81 0.36 1.21 0.71 0.18P2O5 (%) 0.01 0.1 0.08 b.d. 0.06 0.04 0.05 b.d. 0.08 0.12 0.04 0.04 0.1 0.02 0.02 0.08 0.12 0.08 0.2 0.22Total (%) 0.01 98.53 100.1 66.75 99.83 100.3 100.3 82.61 99.49 99.58 84.1 99.82 99.86 100.1 100.8 99.15 97.66 97.92 100 99.21LOI (%) 14.36 11.82 23.02 16.69 17.33 18.38 22.25 4.49 18.98 18.11 20.61 21.06 23.58 31.01 15.42 19.13 20.52 19 27.12
La (ppm) 0.05 15.8 8.91 11 5.52 5.38 6.03 8.38 13.9 8.79 9.01 4.95 7.79 2.93 2.58 6.53 8.76 7.62 10.8 8.29Ce (ppm) 0.05 32.1 16.5 7.29 8.67 8.77 10 8.03 26 16.3 14.8 8.42 14 4.48 3.36 11.5 17 13.9 20.5 15.5Pr (ppm) 0.01 3.83 1.94 0.49 0.96 1.17 1.33 0.79 2.97 1.92 1.96 1.14 1.62 0.57 0.41 1.63 2.08 1.61 2.43 2.06Nd (ppm) 0.05 14 8 1.21 3.95 4.15 4.67 2.55 12.1 7.94 7.17 3.91 6.71 2 1.35 5.76 8.38 6.79 10.4 7.02Sm (ppm) 0.01 2.66 1.64 0.34 0.81 0.78 0.84 0.61 2.31 1.49 1.56 0.75 1.36 0.37 0.26 1.13 1.8 1.43 2.33 1.25Eu (ppm) 0.005 0.791 0.596 b.d. 0.197 0.155 0.185 0.472 0.649 0.442 0.349 0.176 0.377 0.086 0.058 0.318 0.453 0.425 0.689 0.319Gd (ppm) 0.01 2.18 1.2 1.51 0.61 0.57 0.58 1.02 1.49 1.13 1.55 0.53 0.98 0.27 0.2 0.82 1.23 1.15 2.15 0.87Tb (ppm) 0.01 0.36 0.14 0.04 0.13 0.08 0.09 0.1 0.16 0.18 0.16 0.07 0.16 0.04 0.03 0.14 0.15 0.15 0.31 0.13Dy (ppm) 0.01 2.19 0.72 0.09 0.76 0.42 0.44 0.28 0.89 1.04 0.69 0.39 0.82 0.26 0.16 0.75 0.77 0.85 1.69 0.71Ho (ppm) 0.01 0.45 0.15 0.02 0.19 0.09 0.08 0.07 0.16 0.25 0.15 0.08 0.19 0.08 0.03 0.15 0.16 0.17 0.36 0.16Er (ppm) 0.01 1.41 0.52 0.09 0.75 0.43 0.39 0.23 0.73 0.86 0.56 0.35 0.73 0.3 0.14 0.66 0.56 0.62 1.21 0.59Tm (ppm) 0.005 0.237 0.103 0.014 0.157 0.08 0.067 0.042 0.146 0.174 0.101 0.065 0.148 0.057 0.026 0.134 0.104 0.122 0.237 0.115Y (ppm) 0.5 12.8 4 1.3 5.6 3 2.8 2.5 5.2 6.6 5.2 2.5 5.5 2.1 1.1 4.5 4 5.2 10.4 4Yb (ppm) 0.01 1.78 0.72 0.08 1.02 0.61 0.52 0.31 1.03 1.16 0.78 0.45 1.04 0.46 0.17 0.9 0.84 0.84 1.64 0.83Lu (ppm) 0.002 0.31 0.119 0.012 0.173 0.101 0.091 0.053 0.174 0.189 0.13 0.085 0.177 0.075 0.029 0.154 0.162 0.137 0.274 0.138
Ag (ppm) 0.5 b.d. 0.5 11.5 b.d. 0.8 0.7 3.9 b.d. b.d. 0.6 b.d. b.d. 2.3 2.2 0.6 1 b.d. b.d. 1.9As (ppm) 5 487 64 1,350 124 66 22 1,180 19 38 314 14 20 167 36 8 74 28 56 141Au (ppb) 2 b.d. 306 1,500 751 1,110 1,190 2,000 723 166 666 1,470 580 1,710 1,690 287 487 300 396 1,390Ba (ppm) 3 327 129 178,900 6,822 3,050 4,094 98,830 212 779 95,970 1,990 1,344 1,473 511 370 1,865 688 1,458 1,736Bi (ppm) 0.1 b.d. 8.4 26.7 0.6 1 1.4 3.6 5 b.d. b.d. 0.3 b.d. 5.6 1.7 0.1 3.2 1.1 0.2 0.7Co (ppm) 1 13 10 47 23 108 112 104 18 10 22 115 10 157 188 25 9 28 12 28Cr (ppm) 20 b.d. b.d. b.d. b.d. 30 30 60 b.d. 20 50 b.d. b.d. 20 20 30 b.d. b.d. b.d. 30Cs (ppm) 0.1 0.5 b.d. 0.2 b.d. 0.2 b.d. 0.3 b.d. b.d. 0.1 b.d. b.d. 0.2 b.d. b.d. 0.3 b.d. b.d. 0.2Cu (ppm) 10 40 170 4,550 1,780 490 2,590 4,540 270 230 1,550 1,450 1,010 2,870 2,010 490 410 350 710 1,460Ga (ppm) 1 18 28 4 7 10 7 3 8 18 19 7 32 1 3 11 10 10 48 58Ge (ppm) 0.5 1.8 2.8 0.6 b.d. b.d. b.d. 0.5 1.2 0.8 b.d. b.d. b.d. b.d. b.d. b.d. 0.9 0.6 b.d. b.d.Hf (ppm) 0.1 2.2 1.8 0.2 2.4 2 1.6 0.8 3.1 2.5 1.9 1.5 2 2.4 0.6 2.2 2 1.7 2.8 3.3In (ppm) 0.1 b.d. b.d. 0.4 b.d. b.d. b.d. 0.2 0.1 b.d. 0.2 b.d. b.d. 0.1 b.d. 0.1 b.d. 0.2 b.d. b.d.Mo (ppm) 2 b.d. 5 28 4 12 6 14 13 b.d. 3 4 b.d. 21 29 3 2 2 4 9Nb (ppm) 0.2 6.4 2.2 1.1 2.7 2.6 2.7 1.3 2.3 2.6 2 2.6 2.2 1.9 1 2.1 2.1 2 3 2.9Ni (ppm) 20 b.d. b.d. b.d. b.d. 30 30 40 b.d. b.d. b.d. 30 b.d. 40 60 b.d. b.d. b.d. b.d. 30Pb (ppm) 5 8 49 174 12 38 25 57 18 23 b.d. 47 62 84 15 14 354 14 30 46Rb (ppm) 1 36 b.d. b.d. 1 3 b.d. 2 b.d. b.d. 2 1 2 b.d. 1 b.d. 2 b.d. 1 1Sb (ppm) 0.2 b.d. 2.8 112 10 2.5 b.d. 70.5 4.8 1 6.5 b.d. b.d. 11.5 9.3 0.8 2.1 1.3 1.9 8.7Sc (ppm) 1 11 13 b.d. 9 7 5 3 10 13 8 6 13 5 2 8 11 10 13 28Sn (ppm) 1 b.d. b.d. 15 b.d. 1 b.d. 5 b.d. b.d. b.d. b.d. b.d. 2 b.d. b.d. 5 1 b.d. 4Sr (ppm) 2 248 702 1,484 477 298 310 772 515 669 564 310 592 60 83 455 641 532 931 1,717Ta (ppm) 0.01 0.35 0.18 0.06 0.18 0.2 0.15 0.08 0.21 0.2 0.14 0.14 0.12 0.14 0.06 0.14 0.15 0.15 0.19 0.21Th (ppm) 0.05 2.79 1.53 0.5 1.51 1.19 1.96 0.5 2.05 1.61 1.3 1.08 1.38 0.72 0.31 1.05 1.24 1.25 1.78 2.41Tl (ppm) 0.05 2.28 1.34 4.56 0.68 1.31 0.48 0.16 0.36 0.72 0.33 0.75 4.03 0.61 0.82 0.6 2.7 1.15 2.52 4.41U (ppm) 0.01 1.02 0.59 0.14 0.47 0.87 0.55 0.38 1.68 0.51 0.45 0.79 0.68 0.77 0.35 0.56 0.57 0.54 0.63 1.25V (ppm) 5 128 158 8 80 46 39 11 33 132 73 42 148 21 32 88 94 109 174 259W (ppm) 0.5 b.d. 4.1 19.2 4 4.4 9.9 2.6 6.4 3.3 1.6 20.3 0.8 1.7 6.1 46 0.5 6.4 7.9 2.2Zn (ppm) 30 1,060 140 b.d. 1,030 360 100 b.d. 320 430 260 360 460 80 50 270 120 500 1,070 290Zr (ppm) 1 81 78 6 86 75 58 30 144 95 68 59 70 87 18 69 65 75 98 99
HIGH-SULFIDATION EPITHERMAL PYRITE-HOSTED Au ORE FORMATION, SANGIHE ISLAND, INDONESIA 1715
Table 2. Major Element Compositions from Drill Core and Hand Samples from the Bawone (BOD) and Binebase (BID) Deposits
Porphyry
IA I IA I IA I IA I IA I IA I IA I/BaEn IA I/BaEn AA I AA I AA I AA I AA I AA I AA I/BaEn AA II AA II AA II AA II d.l. BOD1-134.5 BOD3-158.8 BOD3-85.4 BOD3-74.1 BOD3-106.4 BOD3-83.3 BOD3-99.2 BOD3-96.8 BOD3-49.8 BOD3-55 BOD3-85.5 BOD3-48.6 BOD3-100 BOD3-78.7 BOD3-113.7 BOD42-62.3 BOD3-125.4 BOD3-46.9 BOD3-34.4
SiO2 (%) 0.01 55.4 64.68 8.2 58.66 51.41 48.19 19.69 85.78 56.29 43.28 42.65 48.8 29.11 8.74 63.84 49.79 51.37 53.65 20.65TiO2 (%) 0.001 0.546 0.547 0.036 0.528 0.484 0.541 0.185 0.501 0.53 0.373 0.492 0.492 0.377 0.22 0.43 0.46 0.474 0.603 0.684Al2O3 (%) 0.01 19.8 14.36 0.33 9.13 2.91 2.85 0.3 2.34 13.22 6.17 3.28 10.38 0.26 1.25 7.59 10.59 11.21 12.29 19.21Fe2O3 (%) 0.01 4.26 8.38 35.08 13.45 27.98 30.09 40.04 6.14 8.23 15.17 32.38 17.76 46.64 59.44 10.06 16.73 12.06 12.72 30.85MnO (%) 0.001 0.008 0.009 0.005 0.006 0.007 0.006 0.006 0.006 0.009 0.01 0.007 0.007 0.009 0.014 0.005 0.01 0.003 0.008 0.012MgO (%) 0.01 0.75 0.02 0.02 0.01 0.02 0.02 0.02 0.02 0.01 0.01 0.02 b.d. 0.02 0.03 0.01 0.02 b.d. 0.02 0.03CaO (%) 0.01 0.78 0.03 0.04 0.06 0.05 0.04 0.03 0.06 0.08 0.05 0.04 0.06 0.04 0.05 0.06 0.06 0.07 0.12 0.07Na2O (%) 0.01 0.35 0.05 0.06 0.56 0.06 0.07 0.04 0.04 0.76 0.42 0.15 0.48 0.05 0.06 0.84 0.38 0.92 0.71 0.17K2O (%) 0.01 2.17 0.08 0.02 0.69 0.02 0.04 0.05 0.04 1.35 0.47 0.15 0.71 0.03 0.02 0.81 0.36 1.21 0.71 0.18P2O5 (%) 0.01 0.1 0.08 b.d. 0.06 0.04 0.05 b.d. 0.08 0.12 0.04 0.04 0.1 0.02 0.02 0.08 0.12 0.08 0.2 0.22Total (%) 0.01 98.53 100.1 66.75 99.83 100.3 100.3 82.61 99.49 99.58 84.1 99.82 99.86 100.1 100.8 99.15 97.66 97.92 100 99.21LOI (%) 14.36 11.82 23.02 16.69 17.33 18.38 22.25 4.49 18.98 18.11 20.61 21.06 23.58 31.01 15.42 19.13 20.52 19 27.12
La (ppm) 0.05 15.8 8.91 11 5.52 5.38 6.03 8.38 13.9 8.79 9.01 4.95 7.79 2.93 2.58 6.53 8.76 7.62 10.8 8.29Ce (ppm) 0.05 32.1 16.5 7.29 8.67 8.77 10 8.03 26 16.3 14.8 8.42 14 4.48 3.36 11.5 17 13.9 20.5 15.5Pr (ppm) 0.01 3.83 1.94 0.49 0.96 1.17 1.33 0.79 2.97 1.92 1.96 1.14 1.62 0.57 0.41 1.63 2.08 1.61 2.43 2.06Nd (ppm) 0.05 14 8 1.21 3.95 4.15 4.67 2.55 12.1 7.94 7.17 3.91 6.71 2 1.35 5.76 8.38 6.79 10.4 7.02Sm (ppm) 0.01 2.66 1.64 0.34 0.81 0.78 0.84 0.61 2.31 1.49 1.56 0.75 1.36 0.37 0.26 1.13 1.8 1.43 2.33 1.25Eu (ppm) 0.005 0.791 0.596 b.d. 0.197 0.155 0.185 0.472 0.649 0.442 0.349 0.176 0.377 0.086 0.058 0.318 0.453 0.425 0.689 0.319Gd (ppm) 0.01 2.18 1.2 1.51 0.61 0.57 0.58 1.02 1.49 1.13 1.55 0.53 0.98 0.27 0.2 0.82 1.23 1.15 2.15 0.87Tb (ppm) 0.01 0.36 0.14 0.04 0.13 0.08 0.09 0.1 0.16 0.18 0.16 0.07 0.16 0.04 0.03 0.14 0.15 0.15 0.31 0.13Dy (ppm) 0.01 2.19 0.72 0.09 0.76 0.42 0.44 0.28 0.89 1.04 0.69 0.39 0.82 0.26 0.16 0.75 0.77 0.85 1.69 0.71Ho (ppm) 0.01 0.45 0.15 0.02 0.19 0.09 0.08 0.07 0.16 0.25 0.15 0.08 0.19 0.08 0.03 0.15 0.16 0.17 0.36 0.16Er (ppm) 0.01 1.41 0.52 0.09 0.75 0.43 0.39 0.23 0.73 0.86 0.56 0.35 0.73 0.3 0.14 0.66 0.56 0.62 1.21 0.59Tm (ppm) 0.005 0.237 0.103 0.014 0.157 0.08 0.067 0.042 0.146 0.174 0.101 0.065 0.148 0.057 0.026 0.134 0.104 0.122 0.237 0.115Y (ppm) 0.5 12.8 4 1.3 5.6 3 2.8 2.5 5.2 6.6 5.2 2.5 5.5 2.1 1.1 4.5 4 5.2 10.4 4Yb (ppm) 0.01 1.78 0.72 0.08 1.02 0.61 0.52 0.31 1.03 1.16 0.78 0.45 1.04 0.46 0.17 0.9 0.84 0.84 1.64 0.83Lu (ppm) 0.002 0.31 0.119 0.012 0.173 0.101 0.091 0.053 0.174 0.189 0.13 0.085 0.177 0.075 0.029 0.154 0.162 0.137 0.274 0.138
Ag (ppm) 0.5 b.d. 0.5 11.5 b.d. 0.8 0.7 3.9 b.d. b.d. 0.6 b.d. b.d. 2.3 2.2 0.6 1 b.d. b.d. 1.9As (ppm) 5 487 64 1,350 124 66 22 1,180 19 38 314 14 20 167 36 8 74 28 56 141Au (ppb) 2 b.d. 306 1,500 751 1,110 1,190 2,000 723 166 666 1,470 580 1,710 1,690 287 487 300 396 1,390Ba (ppm) 3 327 129 178,900 6,822 3,050 4,094 98,830 212 779 95,970 1,990 1,344 1,473 511 370 1,865 688 1,458 1,736Bi (ppm) 0.1 b.d. 8.4 26.7 0.6 1 1.4 3.6 5 b.d. b.d. 0.3 b.d. 5.6 1.7 0.1 3.2 1.1 0.2 0.7Co (ppm) 1 13 10 47 23 108 112 104 18 10 22 115 10 157 188 25 9 28 12 28Cr (ppm) 20 b.d. b.d. b.d. b.d. 30 30 60 b.d. 20 50 b.d. b.d. 20 20 30 b.d. b.d. b.d. 30Cs (ppm) 0.1 0.5 b.d. 0.2 b.d. 0.2 b.d. 0.3 b.d. b.d. 0.1 b.d. b.d. 0.2 b.d. b.d. 0.3 b.d. b.d. 0.2Cu (ppm) 10 40 170 4,550 1,780 490 2,590 4,540 270 230 1,550 1,450 1,010 2,870 2,010 490 410 350 710 1,460Ga (ppm) 1 18 28 4 7 10 7 3 8 18 19 7 32 1 3 11 10 10 48 58Ge (ppm) 0.5 1.8 2.8 0.6 b.d. b.d. b.d. 0.5 1.2 0.8 b.d. b.d. b.d. b.d. b.d. b.d. 0.9 0.6 b.d. b.d.Hf (ppm) 0.1 2.2 1.8 0.2 2.4 2 1.6 0.8 3.1 2.5 1.9 1.5 2 2.4 0.6 2.2 2 1.7 2.8 3.3In (ppm) 0.1 b.d. b.d. 0.4 b.d. b.d. b.d. 0.2 0.1 b.d. 0.2 b.d. b.d. 0.1 b.d. 0.1 b.d. 0.2 b.d. b.d.Mo (ppm) 2 b.d. 5 28 4 12 6 14 13 b.d. 3 4 b.d. 21 29 3 2 2 4 9Nb (ppm) 0.2 6.4 2.2 1.1 2.7 2.6 2.7 1.3 2.3 2.6 2 2.6 2.2 1.9 1 2.1 2.1 2 3 2.9Ni (ppm) 20 b.d. b.d. b.d. b.d. 30 30 40 b.d. b.d. b.d. 30 b.d. 40 60 b.d. b.d. b.d. b.d. 30Pb (ppm) 5 8 49 174 12 38 25 57 18 23 b.d. 47 62 84 15 14 354 14 30 46Rb (ppm) 1 36 b.d. b.d. 1 3 b.d. 2 b.d. b.d. 2 1 2 b.d. 1 b.d. 2 b.d. 1 1Sb (ppm) 0.2 b.d. 2.8 112 10 2.5 b.d. 70.5 4.8 1 6.5 b.d. b.d. 11.5 9.3 0.8 2.1 1.3 1.9 8.7Sc (ppm) 1 11 13 b.d. 9 7 5 3 10 13 8 6 13 5 2 8 11 10 13 28Sn (ppm) 1 b.d. b.d. 15 b.d. 1 b.d. 5 b.d. b.d. b.d. b.d. b.d. 2 b.d. b.d. 5 1 b.d. 4Sr (ppm) 2 248 702 1,484 477 298 310 772 515 669 564 310 592 60 83 455 641 532 931 1,717Ta (ppm) 0.01 0.35 0.18 0.06 0.18 0.2 0.15 0.08 0.21 0.2 0.14 0.14 0.12 0.14 0.06 0.14 0.15 0.15 0.19 0.21Th (ppm) 0.05 2.79 1.53 0.5 1.51 1.19 1.96 0.5 2.05 1.61 1.3 1.08 1.38 0.72 0.31 1.05 1.24 1.25 1.78 2.41Tl (ppm) 0.05 2.28 1.34 4.56 0.68 1.31 0.48 0.16 0.36 0.72 0.33 0.75 4.03 0.61 0.82 0.6 2.7 1.15 2.52 4.41U (ppm) 0.01 1.02 0.59 0.14 0.47 0.87 0.55 0.38 1.68 0.51 0.45 0.79 0.68 0.77 0.35 0.56 0.57 0.54 0.63 1.25V (ppm) 5 128 158 8 80 46 39 11 33 132 73 42 148 21 32 88 94 109 174 259W (ppm) 0.5 b.d. 4.1 19.2 4 4.4 9.9 2.6 6.4 3.3 1.6 20.3 0.8 1.7 6.1 46 0.5 6.4 7.9 2.2Zn (ppm) 30 1,060 140 b.d. 1,030 360 100 b.d. 320 430 260 360 460 80 50 270 120 500 1,070 290Zr (ppm) 1 81 78 6 86 75 58 30 144 95 68 59 70 87 18 69 65 75 98 99

1716 KING ET AL.
Table 2. (Cont.)
Porphyry Crystal Tuff
AA II AA II AA II AA II AA II AA II/BaEn AA III AA III AA III Least altered IA I IA I IA I IA II IA II IA II IA II IA II IA II IA II BOD3-27.3 BOD3-79.5 BOD3-132.9 BOD3-41 BOD3-65.4 BOD3-65.8 BOD1-115 BOD1-124.9 BOD3-122.6 PANTAI BID70-61.7 BID24-101 BID39-41.2 BID43-39.5 BID26-102.5 BID15-84.2 BID18-144.5 BID18-183.2 BID23-68.6 BID26-58
SiO2 (%) 7.08 65.52 59.09 39.59 56.91 17.64 59.72 61.62 39.9 58.37 63.89 65.1 29.58 66.18 60.58 58.02 56.54 56.83 56.02 47.52TiO2 (%) 1.029 0.485 0.624 0.567 0.431 0.082 0.61 0.773 0.298 0.546 0.627 0.706 1.423 0.587 0.68 0.771 0.796 0.852 0.667 0.902Al2O3 (%) 24.05 6.24 16.11 3.97 5.67 0.81 16.49 16.96 3.6 15.2 11.62 12.71 26.73 12.6 14.96 16.24 17.84 18.21 15.5 19.49Fe2O3 (%) 19.86 14.38 7.88 32.64 18.17 31.27 7.98 5.73 32.09 5.59 9.89 8.13 18.12 5.45 6.7 7.15 6.92 6.79 6.86 6.34MnO (%) 0.005 0.006 0.016 0.017 0.005 0.003 0.014 0.022 0.006 0.132 0.005 0.005 0.004 0.017 0.023 0.018 0.015 0.027 0.019 0.025MgO (%) 0.03 b.d. 0.02 0.02 0.02 0.02 0.02 0.03 0.02 2.86 0.04 0.03 0.06 0.99 1.04 0.96 1.86 0.84 1.15 0.68CaO (%) 0.12 0.05 0.08 0.07 0.08 0.04 0.11 0.1 0.04 7.02 0.06 0.07 0.11 0.33 0.38 0.14 0.45 0.8 0.57 0.62Na2O (%) 1.22 0.05 0.23 0.16 0.43 0.06 0.07 0.14 0.31 2.79 0.04 0.04 0.07 0.04 0.03 0.07 0.06 0.06 0.06 0.09K2O (%) 3.49 0.01 0.17 0.21 0.42 b.d. 0.03 0.03 0.29 1.1 0.26 0.02 0.05 3.55 3.79 4.29 2.12 2.41 4.17 6.09P2O5 (%) 0.43 0.1 0.18 0.13 0.11 b.d. 0.21 0.11 0.04 0.2 0.15 0.16 0.43 0.16 0.17 0.15 0.23 0.2 0.14 0.23Total (%) 98.86 98.17 98.46 99.66 100 77.25 98.39 99.98 98.21 99.55 98.27 98.77 98.61 99.88 99.07 99.25 98.31 99.5 100.5 98.29LOI (%) 41.55 11.31 14.06 22.28 17.79 22.94 13.13 14.47 21.62 5.74 11.69 11.81 22.04 9.97 10.72 11.44 11.47 12.49 15.38 16.31
La (ppm) 16.8 8.97 11.4 10.4 8.48 6.84 12.1 9.83 3.87 12.5 7.53 9.05 10.5 6.12 6.04 8.04 10.3 10.5 11.9 12.7Ce (ppm) 31.1 15.8 22.1 19.4 15.4 5.76 24.7 17.9 5.81 24.6 14.6 18.6 16.1 11.7 13.5 18.3 21.5 21.7 23.3 25.6Pr (ppm) 3.44 2.12 2.59 2.68 2.08 0.53 2.84 2.1 0.71 3.13 1.52 2.13 1.35 1.46 1.69 2.52 2.83 2.93 3.04 3.33Nd (ppm) 13.5 7.48 11.2 9.94 7.45 1.48 12 8.17 2.53 12.8 6.08 8.82 3.57 6.05 7.94 11.1 12.2 12.4 12.6 14.1Sm (ppm) 2.4 1.34 2.45 2.19 1.4 0.35 2.44 1.56 0.53 2.96 1.05 1.88 0.39 1.98 2.51 2.98 3.37 3.36 2.91 3.51Eu (ppm) 0.496 0.368 0.854 0.68 0.415 0.18 0.616 0.784 0.181 1.03 0.352 0.595 0.2 0.581 0.84 0.858 0.947 1.09 0.891 1.1Gd (ppm) 1.53 0.88 1.96 1.77 1 0.76 1.59 1.19 0.49 2.89 0.73 1.36 0.32 2.46 3.12 3.11 3.49 3.58 2.97 3.74Tb (ppm) 0.19 0.12 0.24 0.22 0.15 0.05 0.2 0.2 0.06 0.48 0.12 0.17 0.05 0.46 0.57 0.55 0.58 0.63 0.52 0.65Dy (ppm) 0.95 0.65 1.23 1.14 0.77 0.17 1.04 1.25 0.28 2.87 0.81 0.86 0.32 2.94 3.59 3.39 3.58 3.9 3.28 4.01Ho (ppm) 0.2 0.13 0.26 0.22 0.18 0.03 0.23 0.28 0.06 0.6 0.21 0.19 0.09 0.61 0.73 0.69 0.77 0.81 0.68 0.82Er (ppm) 0.71 0.6 0.99 0.83 0.74 0.13 0.78 0.99 0.24 1.81 0.75 0.71 0.37 1.79 2.19 2.04 2.38 2.36 2.04 2.42Tm (ppm) 0.14 0.123 0.184 0.144 0.151 0.022 0.142 0.18 0.044 0.283 0.136 0.135 0.079 0.277 0.344 0.324 0.37 0.379 0.319 0.382Y (ppm) 5.3 4.2 6.9 6.6 5.1 1.7 6.2 7.1 1.8 16.6 6.1 5.5 2.4 17.7 21.7 19.2 21.6 22.2 19.2 22.4Yb (ppm) 1.06 0.9 1.35 1.02 1.07 0.16 1.17 1.42 0.31 1.97 1.09 1.1 0.75 1.92 2.4 2.39 2.62 2.67 2.25 2.64Lu (ppm) 0.183 0.15 0.218 0.164 0.174 0.028 0.23 0.28 0.055 0.331 0.205 0.209 0.173 0.322 0.411 0.435 0.445 0.466 0.374 0.452
Ag (ppm) 3.2 b.d. b.d. 1.6 2.8 3.7 b.d. 1.1 4.5 b.d. 0.6 b.d. 1.9 12.7 6.5 3.2 b.d. b.d. b.d. b.d.As (ppm) 55 106 104 442 311 2,500 60 125 242 b.d. 10 19 25 204 43 15 9 10 94 118Au (ppm) 1,240 717 345 1,310 1,080 1,280 273 130 1,760 b.d. 57 66 391 317 27 54 21 13 b.d. b.d.Ba (ppm) 1,546 2,354 1,517 2,519 4,145 106,900 802 1,609 13,280 181 664 107 1,837 8,105 2,045 1,381 130 139 749 744Bi (ppm) 1.2 b.d. 1.5 0.7 0.3 0.3 0.4 1 0.6 b.d. 0.4 0.5 4.2 b.d. b.d. b.d. b.d. b.d. b.d. b.d.Co (ppm) 17 53 11 25 26 54 8 10 111 14 8 21 80 16 14 14 21 21 16 18Cr (ppm) 40 30 20 30 30 30 30 20 30 20 b.d. b.d. 200 20 b.d. b.d. 20 b.d. b.d. b.d.Cs (ppm) 0.1 b.d. b.d. b.d. b.d. b.d. b.d. 0.3 0.3 1.5 b.d. b.d. 0.3 1.1 2 1.7 1.2 1.3 3 4.4Cu (ppm) 640 1,440 180 3,500 2,720 15,000 70 90 2,470 30 200 100 490 160 40 50 60 80 60 70Ga (ppm) 184 13 18 24 19 6 13 19 8 14 8 12 16 14 14 15 16 17 15 19Ge (ppm) b.d. 1.7 0.7 0.6 1.2 1.2 3.7 2.1 0.6 1.5 1.4 1.7 2 0.8 0.6 0.5 1.5 1.7 0.7 0.8Hf (ppm) 4 3.6 2.1 2.1 2.2 0.3 2.4 2.8 1.1 2.3 2.1 2.2 4.2 1.9 2.2 2.4 2.6 2.4 2 2.7In (ppm) 0.2 b.d. b.d. b.d. 0.1 0.2 b.d. b.d. 0.1 b.d. b.d. b.d. b.d. b.d. b.d. b.d. b.d. b.d. b.d. b.d.Mo (ppm) 12 18 15 11 5 21 58 49 38 b.d. b.d. 10 19 16 3 b.d. 3 b.d. b.d. b.d.Nb (ppm) 4.2 2.4 2.6 2.2 2.2 0.6 4.2 2.9 1.5 2.7 2.7 2.4 4.9 2.1 2.3 2.8 2.7 3.1 2.3 3.3Ni (ppm) 20 20 b.d. 30 b.d. 20 b.d. b.d. 50 b.d. b.d. b.d. 30 b.d. b.d. b.d. b.d. b.d. b.d. b.d.Pb (ppm) 149 b.d. 17 11 181 b.d. 74 120 28 b.d. 15 25 55 1,080 44 54 10 23 30 b.d.Rb (ppm) 2 b.d. b.d. 1 1 1 b.d. b.d. 2 21 4 b.d. 3 79 82 93 42 52 80 105Sb (ppm) 8.8 34.4 2.1 35.6 24.6 120 4.5 10.4 27.7 b.d. 1.7 b.d. 4.1 12.7 9.7 1.8 b.d. 6.7 11.5 9.7Sc (ppm) 35 10 14 10 9 2 14 23 5 18 14 14 18 21 26 29 25 32 25 32Sn (ppm) 5 3 b.d. 6 4 6 4 2 3 b.d. 3 3 11 2 b.d. b.d. b.d. b.d. b.d. b.d.Sr (ppm) 2,840 682 1,060 655 571 1,109 685 295 411 367 1,040 688 3,854 184 73 59 23 47 54 61Ta (ppm) 0.3 0.21 0.2 0.17 0.16 0.04 0.19 0.2 0.1 0.17 0.15 0.17 0.3 0.13 0.14 0.16 0.15 0.16 0.12 0.18Th (ppm) 3.8 1.66 1.85 1.52 1.33 0.32 1.83 1.93 0.52 1.83 1.22 1.03 1.73 1.29 1.23 1.63 1.59 5.43 1.31 1.85Tl (ppm) 3.81 0.93 1.53 0.49 4.59 0.07 1.21 3.13 0.4 0.1 0.38 0.75 0.39 4.04 0.9 1.07 0.35 0.28 3.85 2.83U (ppm) 5.45 1.91 1.45 0.84 0.51 0.25 0.67 12.6 0.4 0.77 0.38 0.91 0.59 5.01 0.74 0.61 0.52 1.84 0.6 0.65V (ppm) 410 69 157 91 59 17 120 199 36 171 120 123 222 178 201 248 245 285 221 283W (ppm) 5.3 2.1 0.8 3.4 12.9 1.6 b.d. b.d. 2.5 2.4 0.8 0.8 2.4 3.6 5.6 8.7 2 1.3 b.d. b.d.Zn (ppm) 310 40 120 70 300 190 360 960 b.d. 60 b.d. 80 b.d. 3,450 320 300 70 320 350 470Zr (ppm) 141 109 95 55 73 9 89 101 36 89 72 80 130 67 76 82 92 85 70 100
Note: The sample name indicates the drill hole number and the depth; samples are organized by lithology (porphyry or crystal tuff) and alteration-type (IA = intermediate argillic, BaEn = barite-enargite veins, AA = advanced argillic; see text for description), identified based on petrographic observations, bulk rock geochemistry and/or X-ray diffraction analyses

HIGH-SULFIDATION EPITHERMAL PYRITE-HOSTED Au ORE FORMATION, SANGIHE ISLAND, INDONESIA 1717
Table 2. (Cont.)
Porphyry Crystal Tuff
AA II AA II AA II AA II AA II AA II/BaEn AA III AA III AA III Least altered IA I IA I IA I IA II IA II IA II IA II IA II IA II IA II BOD3-27.3 BOD3-79.5 BOD3-132.9 BOD3-41 BOD3-65.4 BOD3-65.8 BOD1-115 BOD1-124.9 BOD3-122.6 PANTAI BID70-61.7 BID24-101 BID39-41.2 BID43-39.5 BID26-102.5 BID15-84.2 BID18-144.5 BID18-183.2 BID23-68.6 BID26-58
SiO2 (%) 7.08 65.52 59.09 39.59 56.91 17.64 59.72 61.62 39.9 58.37 63.89 65.1 29.58 66.18 60.58 58.02 56.54 56.83 56.02 47.52TiO2 (%) 1.029 0.485 0.624 0.567 0.431 0.082 0.61 0.773 0.298 0.546 0.627 0.706 1.423 0.587 0.68 0.771 0.796 0.852 0.667 0.902Al2O3 (%) 24.05 6.24 16.11 3.97 5.67 0.81 16.49 16.96 3.6 15.2 11.62 12.71 26.73 12.6 14.96 16.24 17.84 18.21 15.5 19.49Fe2O3 (%) 19.86 14.38 7.88 32.64 18.17 31.27 7.98 5.73 32.09 5.59 9.89 8.13 18.12 5.45 6.7 7.15 6.92 6.79 6.86 6.34MnO (%) 0.005 0.006 0.016 0.017 0.005 0.003 0.014 0.022 0.006 0.132 0.005 0.005 0.004 0.017 0.023 0.018 0.015 0.027 0.019 0.025MgO (%) 0.03 b.d. 0.02 0.02 0.02 0.02 0.02 0.03 0.02 2.86 0.04 0.03 0.06 0.99 1.04 0.96 1.86 0.84 1.15 0.68CaO (%) 0.12 0.05 0.08 0.07 0.08 0.04 0.11 0.1 0.04 7.02 0.06 0.07 0.11 0.33 0.38 0.14 0.45 0.8 0.57 0.62Na2O (%) 1.22 0.05 0.23 0.16 0.43 0.06 0.07 0.14 0.31 2.79 0.04 0.04 0.07 0.04 0.03 0.07 0.06 0.06 0.06 0.09K2O (%) 3.49 0.01 0.17 0.21 0.42 b.d. 0.03 0.03 0.29 1.1 0.26 0.02 0.05 3.55 3.79 4.29 2.12 2.41 4.17 6.09P2O5 (%) 0.43 0.1 0.18 0.13 0.11 b.d. 0.21 0.11 0.04 0.2 0.15 0.16 0.43 0.16 0.17 0.15 0.23 0.2 0.14 0.23Total (%) 98.86 98.17 98.46 99.66 100 77.25 98.39 99.98 98.21 99.55 98.27 98.77 98.61 99.88 99.07 99.25 98.31 99.5 100.5 98.29LOI (%) 41.55 11.31 14.06 22.28 17.79 22.94 13.13 14.47 21.62 5.74 11.69 11.81 22.04 9.97 10.72 11.44 11.47 12.49 15.38 16.31
La (ppm) 16.8 8.97 11.4 10.4 8.48 6.84 12.1 9.83 3.87 12.5 7.53 9.05 10.5 6.12 6.04 8.04 10.3 10.5 11.9 12.7Ce (ppm) 31.1 15.8 22.1 19.4 15.4 5.76 24.7 17.9 5.81 24.6 14.6 18.6 16.1 11.7 13.5 18.3 21.5 21.7 23.3 25.6Pr (ppm) 3.44 2.12 2.59 2.68 2.08 0.53 2.84 2.1 0.71 3.13 1.52 2.13 1.35 1.46 1.69 2.52 2.83 2.93 3.04 3.33Nd (ppm) 13.5 7.48 11.2 9.94 7.45 1.48 12 8.17 2.53 12.8 6.08 8.82 3.57 6.05 7.94 11.1 12.2 12.4 12.6 14.1Sm (ppm) 2.4 1.34 2.45 2.19 1.4 0.35 2.44 1.56 0.53 2.96 1.05 1.88 0.39 1.98 2.51 2.98 3.37 3.36 2.91 3.51Eu (ppm) 0.496 0.368 0.854 0.68 0.415 0.18 0.616 0.784 0.181 1.03 0.352 0.595 0.2 0.581 0.84 0.858 0.947 1.09 0.891 1.1Gd (ppm) 1.53 0.88 1.96 1.77 1 0.76 1.59 1.19 0.49 2.89 0.73 1.36 0.32 2.46 3.12 3.11 3.49 3.58 2.97 3.74Tb (ppm) 0.19 0.12 0.24 0.22 0.15 0.05 0.2 0.2 0.06 0.48 0.12 0.17 0.05 0.46 0.57 0.55 0.58 0.63 0.52 0.65Dy (ppm) 0.95 0.65 1.23 1.14 0.77 0.17 1.04 1.25 0.28 2.87 0.81 0.86 0.32 2.94 3.59 3.39 3.58 3.9 3.28 4.01Ho (ppm) 0.2 0.13 0.26 0.22 0.18 0.03 0.23 0.28 0.06 0.6 0.21 0.19 0.09 0.61 0.73 0.69 0.77 0.81 0.68 0.82Er (ppm) 0.71 0.6 0.99 0.83 0.74 0.13 0.78 0.99 0.24 1.81 0.75 0.71 0.37 1.79 2.19 2.04 2.38 2.36 2.04 2.42Tm (ppm) 0.14 0.123 0.184 0.144 0.151 0.022 0.142 0.18 0.044 0.283 0.136 0.135 0.079 0.277 0.344 0.324 0.37 0.379 0.319 0.382Y (ppm) 5.3 4.2 6.9 6.6 5.1 1.7 6.2 7.1 1.8 16.6 6.1 5.5 2.4 17.7 21.7 19.2 21.6 22.2 19.2 22.4Yb (ppm) 1.06 0.9 1.35 1.02 1.07 0.16 1.17 1.42 0.31 1.97 1.09 1.1 0.75 1.92 2.4 2.39 2.62 2.67 2.25 2.64Lu (ppm) 0.183 0.15 0.218 0.164 0.174 0.028 0.23 0.28 0.055 0.331 0.205 0.209 0.173 0.322 0.411 0.435 0.445 0.466 0.374 0.452
Ag (ppm) 3.2 b.d. b.d. 1.6 2.8 3.7 b.d. 1.1 4.5 b.d. 0.6 b.d. 1.9 12.7 6.5 3.2 b.d. b.d. b.d. b.d.As (ppm) 55 106 104 442 311 2,500 60 125 242 b.d. 10 19 25 204 43 15 9 10 94 118Au (ppm) 1,240 717 345 1,310 1,080 1,280 273 130 1,760 b.d. 57 66 391 317 27 54 21 13 b.d. b.d.Ba (ppm) 1,546 2,354 1,517 2,519 4,145 106,900 802 1,609 13,280 181 664 107 1,837 8,105 2,045 1,381 130 139 749 744Bi (ppm) 1.2 b.d. 1.5 0.7 0.3 0.3 0.4 1 0.6 b.d. 0.4 0.5 4.2 b.d. b.d. b.d. b.d. b.d. b.d. b.d.Co (ppm) 17 53 11 25 26 54 8 10 111 14 8 21 80 16 14 14 21 21 16 18Cr (ppm) 40 30 20 30 30 30 30 20 30 20 b.d. b.d. 200 20 b.d. b.d. 20 b.d. b.d. b.d.Cs (ppm) 0.1 b.d. b.d. b.d. b.d. b.d. b.d. 0.3 0.3 1.5 b.d. b.d. 0.3 1.1 2 1.7 1.2 1.3 3 4.4Cu (ppm) 640 1,440 180 3,500 2,720 15,000 70 90 2,470 30 200 100 490 160 40 50 60 80 60 70Ga (ppm) 184 13 18 24 19 6 13 19 8 14 8 12 16 14 14 15 16 17 15 19Ge (ppm) b.d. 1.7 0.7 0.6 1.2 1.2 3.7 2.1 0.6 1.5 1.4 1.7 2 0.8 0.6 0.5 1.5 1.7 0.7 0.8Hf (ppm) 4 3.6 2.1 2.1 2.2 0.3 2.4 2.8 1.1 2.3 2.1 2.2 4.2 1.9 2.2 2.4 2.6 2.4 2 2.7In (ppm) 0.2 b.d. b.d. b.d. 0.1 0.2 b.d. b.d. 0.1 b.d. b.d. b.d. b.d. b.d. b.d. b.d. b.d. b.d. b.d. b.d.Mo (ppm) 12 18 15 11 5 21 58 49 38 b.d. b.d. 10 19 16 3 b.d. 3 b.d. b.d. b.d.Nb (ppm) 4.2 2.4 2.6 2.2 2.2 0.6 4.2 2.9 1.5 2.7 2.7 2.4 4.9 2.1 2.3 2.8 2.7 3.1 2.3 3.3Ni (ppm) 20 20 b.d. 30 b.d. 20 b.d. b.d. 50 b.d. b.d. b.d. 30 b.d. b.d. b.d. b.d. b.d. b.d. b.d.Pb (ppm) 149 b.d. 17 11 181 b.d. 74 120 28 b.d. 15 25 55 1,080 44 54 10 23 30 b.d.Rb (ppm) 2 b.d. b.d. 1 1 1 b.d. b.d. 2 21 4 b.d. 3 79 82 93 42 52 80 105Sb (ppm) 8.8 34.4 2.1 35.6 24.6 120 4.5 10.4 27.7 b.d. 1.7 b.d. 4.1 12.7 9.7 1.8 b.d. 6.7 11.5 9.7Sc (ppm) 35 10 14 10 9 2 14 23 5 18 14 14 18 21 26 29 25 32 25 32Sn (ppm) 5 3 b.d. 6 4 6 4 2 3 b.d. 3 3 11 2 b.d. b.d. b.d. b.d. b.d. b.d.Sr (ppm) 2,840 682 1,060 655 571 1,109 685 295 411 367 1,040 688 3,854 184 73 59 23 47 54 61Ta (ppm) 0.3 0.21 0.2 0.17 0.16 0.04 0.19 0.2 0.1 0.17 0.15 0.17 0.3 0.13 0.14 0.16 0.15 0.16 0.12 0.18Th (ppm) 3.8 1.66 1.85 1.52 1.33 0.32 1.83 1.93 0.52 1.83 1.22 1.03 1.73 1.29 1.23 1.63 1.59 5.43 1.31 1.85Tl (ppm) 3.81 0.93 1.53 0.49 4.59 0.07 1.21 3.13 0.4 0.1 0.38 0.75 0.39 4.04 0.9 1.07 0.35 0.28 3.85 2.83U (ppm) 5.45 1.91 1.45 0.84 0.51 0.25 0.67 12.6 0.4 0.77 0.38 0.91 0.59 5.01 0.74 0.61 0.52 1.84 0.6 0.65V (ppm) 410 69 157 91 59 17 120 199 36 171 120 123 222 178 201 248 245 285 221 283W (ppm) 5.3 2.1 0.8 3.4 12.9 1.6 b.d. b.d. 2.5 2.4 0.8 0.8 2.4 3.6 5.6 8.7 2 1.3 b.d. b.d.Zn (ppm) 310 40 120 70 300 190 360 960 b.d. 60 b.d. 80 b.d. 3,450 320 300 70 320 350 470Zr (ppm) 141 109 95 55 73 9 89 101 36 89 72 80 130 67 76 82 92 85 70 100
Note: The sample name indicates the drill hole number and the depth; samples are organized by lithology (porphyry or crystal tuff) and alteration-type (IA = intermediate argillic, BaEn = barite-enargite veins, AA = advanced argillic; see text for description), identified based on petrographic observations, bulk rock geochemistry and/or X-ray diffraction analyses

1718 KING ET AL.
the compositions of the altered rocks to those of their least-altered equivalents. This was done by making binary plots of the data, and determining which element pairs were linearly distributed, as such a distribution would correspond to a rela-tively constant mass ratio for the elements and could indicate that they were immobile (e.g., MacLean and Kranidiotis, 1987; Warren et al., 2007; Agrawal et al., 2008). These plots show that concentrations of pairs of the following elements, Zr, Ti, Nb, Hf, and Ta, form linear arrays. However, because Ti, Nb, and Ta are not incorporated into the same minerals as Zr and Hf (Ti, Nb, and Ta occur in rutile and Zr and Hf in zir-con), the linear variation of Zr with Ti was taken as evidence of immobility (Fig. 9). Assuming that Zr and Ti were immobile, the concentration of these elements in each altered sample was normalized to their concentration in a least altered sam-ple for each rock type using the method of Grant (1986). To scale the changes for each element proportionally so that the mass change for an unaltered rock is zero, the concentration of each element was multiplied by the ratio of the immobile element concentrations (Zr and Ti) in the fresh rock to that in the altered rock. Values less than unity indicate losses of ele-ments relative to their concentrations in the unaltered rock, and values greater than unity indicate gains (Fig. 10).
Three distinct patterns of relative gains and losses are observed for advanced argillic alteration (the small size of the data set precluded separate treatment of advanced argillic I, II, and III alteration) and intermediate argillic I (Bawone and Binebase) and II (Binebase) alteration (Fig. 10). As expected from the mineralogy, the advanced argillic and intermediate argillic I samples were strongly depleted in the major elements, Mn, Mg, Ca, and Na, moderately depleted or unchanged in K, weakly depleted in Al and P, and relatively undepleted in Si. Somewhat unexpectedly, however, these samples appear to be enriched in Fe. As py II
commonly occurs in the form of blebs that filled pores cre-ated by advanced argillic and intermediate argillic I altera-tion (and thus postdated this alteration), we suspect that most if not all of the apparent enrichment in Fe is an artifact due to unavoidable inclusion of py II in the samples analyzed to represent this alteration. The intermediate argillic altera-tion II samples were also depleted in Mn, Mg, Ca, P, and particularly in Na, but appear to have conserved Al, Si, and Fe. In contrast to advanced argillic and intermediate argillic I alteration, these samples are strongly enriched in K. The overall distribution of trace metals and semimetals (Au, Cu, As, Ag, Cr, Co, Ni, Zn, Mo, Sn, Sb, Tl, W, and Pb) indicates that they were added during all stages of alteration, albeit in variable quantities (it should be noted that because of the py II problem referred to above, the additions of Cu and Au for advanced argillic and intermediate argillic I alteration may be overestimated). However, whereas Rb and Cs were depleted (or unchanged) and Sr added during advanced argillic and intermediate argillic I alteration, the opposite occurred dur-ing intermediate argillic II alteration, i.e., Sr was depleted and Rb and Cs enriched (Fig. 10).
Both the advanced argillic and intermediate argillic I altered rocks underwent substantial mass losses in all REEs, with the degree of depletion increasing progressively with atomic number from La to Dy and then decreasing progres-sively to Lu (Fig. 10). In contrast to advanced argillic and intermediate argillic I alteration, the depletion of REEs dur-ing intermediate argillic II alteration was greatest for La and decreased with atomic number to Gd with the exception of Eu. We consider that the very small additions of the heavy rare earth elements (HREEs: Tb, Dy, Ho, Er, Tm, Yb, Lu) reflect uncertainties in the mass transfer calculations and that these elements were immobile during alteration. The prefer-ential leaching of the light rare earth elements (LREEs: La, Ce, Pr, Nd) during intermediate argillic II alteration is con-sistent with results of experiments showing that the LREEs are more mobile in chloride-bearing hydrothermal fluids than the HREEs (Migdisov et al., 2009). The reason for the prefer-ential depletion of Eu, Gd, Tb, Dy, and Ho during advanced argillic and intermediate argillic I alteration is unclear. A pos-sible explanation for this anomalous behavior is that depletion of the LREEs was inhibited because of their incorporation by sulfates and clay minerals (e.g., Miller et al., 1982; Hopf, 1993; Fulignati et al., 1999; Karakaya, 2009), and that with-out this uptake they would have been more depleted, con-sistent with the experimental predictions (Migdisov et al., 2009). The differential behavior of the REEs reported above supports observations from active hydrothermal systems that REE chemistry offers a useful tool for distinguishing altera-tion types (e.g., Michard, 1989; Fulignati et al., 1998, 1999; Lottermoser, 1992; Lewis et al., 1997; Salaün et al., 2011).
Ore mineral composition
The compositions of pyrite and enargite were analyzed using a combination of electron microprobe (EMP) and laser ablation-inductively coupled plasma-mass spectrometry (LA-ICP-MS). Quantitative electron microprobe analyses for Fe, S, Cu, As, Sb, Co, Ni, Zn, Se, and Te were conducted on carbon-coated samples at McGill University using a JEOL 8900 instru-ment equipped with five wavelength dispersive spectrometers
Fig. 9. Plot showing the distribution of TiO2 and Zr in variably altered rocks of the Bawone (BOD) and Binebase (BID) deposits. See the text for an interpretation of the significance of these data. The Pearson correlation coef-ficient for both deposits (r) = 0.80.
40 80 120 160
Zr (ppm)
0
0.4
0.8
1.2
1.6
TiO
2 (w
t. %
)
BODBIDLeast Altered

HIGH-SULFIDATION EPITHERMAL PYRITE-HOSTED Au ORE FORMATION, SANGIHE ISLAND, INDONESIA 1719
(WDS). The operating conditions were an excitation potential of 20 kV, a beam current of 50 nA and a spot-size of 2 μm. Analyses were standardized using pyrite (Fe, S), chalcopyrite (Cu), AsNiCo (As, Ni, Co), CdTe (Cd, Te), sphalerite (Zn), stibnite (Sb), and AgSe (Se) supplied by CANMET. In addi-tion to quantitative spot analyses, the EMP was also used to produce element maps for Cu, Fe, Se, and As. The operating conditions were an excitation voltage of 20 kV, an operating current of 90 nA, and a beam diameter of 2 μm. The counting time was 30 ms and the pixel size between 0.20 and 1.28 μm.
The LA-ICP-MS analyses were conducted at the Geologi-cal Survey of Canada (pyrite) using a Photon Machines Nalyte 193 mm Excimer laser coupled to an Agilent Technologies 7700 Series ICP-MS, and at Université de Chicoutimi (enar-gite) using an Excimer Resolution M-50 (Resonetics) Laser coupled to an Agilent 7700x ICP-MS. The concentration of Fe57, S34, Cu65, Au197, Se77, Te125, Ag107, As75, and Sb121 was measured in both pyrite and enargite. Pyrite was also ana-lyzed for Co59, Ni60, Pb208, Zn66, and Bi209. The ablation pits ranged from 14 to 54 μm in diameter, and the counting time was 100 s (30 s of background, 70 s of ablation) for pyrite and 90 s (30 s for background, 60 s of ablation) for enargite.
The concentrations of Fe and S determined by EMP analysis were used as an internal standard for the LA-ICP-MS analy-ses of pyrite and enargite, respectively; GSE-IG, NIST 610 and Po689 were used as external standards for the analysis of pyrite and GSE-1G, PS1 and JB5 for enargite.
Pyrite: The following trace elements were detected in pyrite using the EMP: As, Co, Cu, Ni, Sb, Se, Te, and Zn (Table AI). LA-ICP-MS analyses yielded results for these elements simi-lar to those obtained with the EMP, and also detected Ag, Au, Bi, and Pb (Table A2). Copper is the principal trace element in both generations of pyrite followed by Co, As, and Pb in py I or by Co, Pb, and As in py II. Significantly, both generations of pyrite contain ppm levels of Au and Ag.
Pyrite I crystals are compositionally unzoned (Fig. 7B) and have a wide inter- and intra-crystal range of Cu concentrations (0.02–1.5 wt %); the median Cu concentration is 0.44 wt % and the interquartile range (IQR) is 0.24 to 0.72 wt %. Cobalt concentration is significantly lower, with a median of 62.5 ppm (IQR = 15.6–206 ppm). The median As concentration is 43.9 ppm (IQR = 15.6–83 ppm) and that of Pb is 59.6 ppm (IQR = 9.5–79.7 ppm). As mentioned above, py I is aurifer-ous and argentiferous. The median concentrations of Au and
Fig. 10. Relative gains and losses of elements for advanced argillically altered rocks from Bawone (red), intermediate argillically altered I porphyry and crystal tuffs from Bawone and Binebase (yellow) and intermediate argillically II altered (purple) crystal tuffs from Binebase, calculated using the method of Grant (1986). A value of 1 indicates immobility, less than 1 indicates a relative mass loss and greater than 1 indicates a relative mass gain.
Au
Ag
Cu
As
Sn
Sb
Co
Pb
Mo
Cs
Ni
Zn Bi
SrB
aR
b
Ag
Cs
Au
Cu
As
Sn
Sb
Co
Pb
Mo Ni
Zn Bi
Sr
Ba
Rb
SiO
2
Al 2O
3
MnO
MgO
CaO
Na 2O
K2O
P2O
5
Fe2O
3
SiO
2
Fe2O
3
Al 2O
3
MnO
MgO CaO
Na 2O
K2O
P2O
5 La Ce Pr Nd Sm Eu Gd Tb Dy Ho Er Tm Yb Lu
La Ce Pr Nd Sm Eu Gd Tb Dy Ho Er Tm Yb Lu
Inte
rmed
iate
Arg
illic
IIn
term
edia
te A
rgill
ic II
10
1
0.1
0.01
10
1
0.1
100
1000
10
1
0.1
100
1000
10
1
0.1
Ag
CsA
u
Cu
As
Sn
Sb
Co
Pb
Mo Ni
Zn Bi
Sr
Ba
Rb
La Ce Pr Nd Sm Eu Gd Tb Dy Ho Er Tm Yb LuSiO
2
Al 2O
3
Fe2O
3
CaOM
nO
MgO
Na 2O
K2O
P2O
5
10
1
0.1
10
1
0.1
0.01
10
1
0.1
100
1000
Adv
ance
d A
rgill
ic
10
1
0.1
10
1
0.1
0.01
1720 KING ET AL.
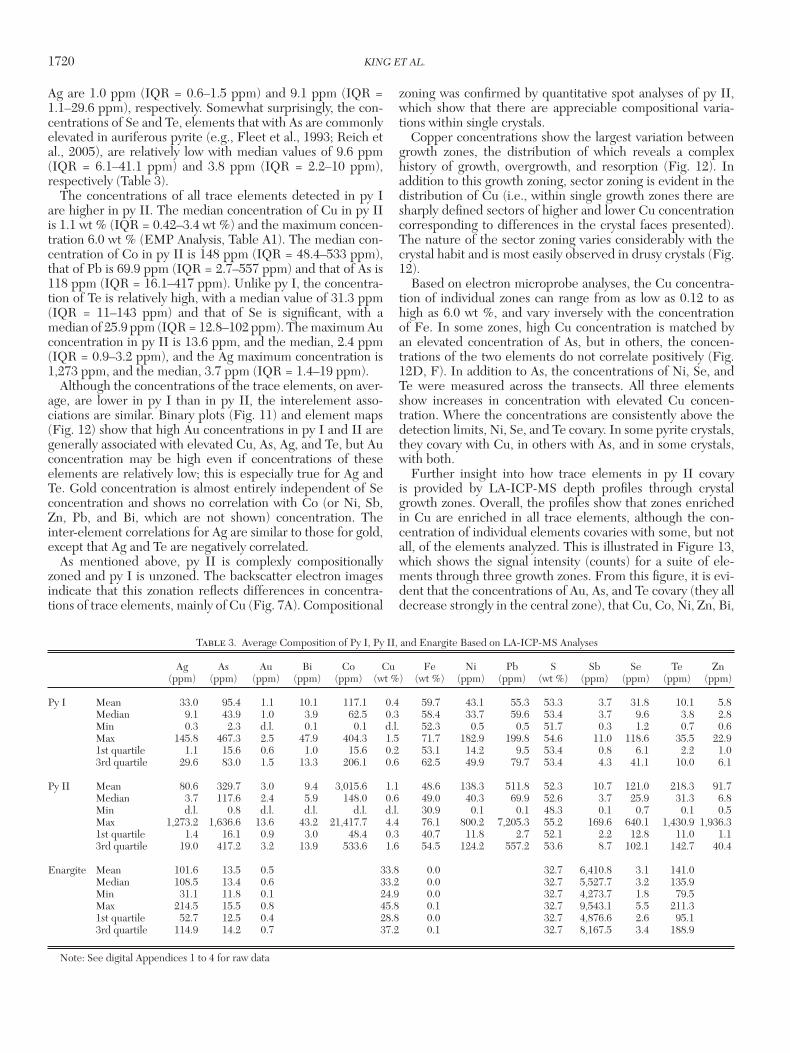
Ag are 1.0 ppm (IQR = 0.6–1.5 ppm) and 9.1 ppm (IQR = 1.1–29.6 ppm), respectively. Somewhat surprisingly, the con-centrations of Se and Te, elements that with As are commonly elevated in auriferous pyrite (e.g., Fleet et al., 1993; Reich et al., 2005), are relatively low with median values of 9.6 ppm (IQR = 6.1–41.1 ppm) and 3.8 ppm (IQR = 2.2–10 ppm), respectively (Table 3).
The concentrations of all trace elements detected in py I are higher in py II. The median concentration of Cu in py II is 1.1 wt % (IQR = 0.42–3.4 wt %) and the maximum concen-tration 6.0 wt % (EMP Analysis, Table A1). The median con-centration of Co in py II is 148 ppm (IQR = 48.4–533 ppm), that of Pb is 69.9 ppm (IQR = 2.7–557 ppm) and that of As is 118 ppm (IQR = 16.1–417 ppm). Unlike py I, the concentra-tion of Te is relatively high, with a median value of 31.3 ppm (IQR = 11–143 ppm) and that of Se is significant, with a median of 25.9 ppm (IQR = 12.8–102 ppm). The maximum Au concentration in py II is 13.6 ppm, and the median, 2.4 ppm (IQR = 0.9–3.2 ppm), and the Ag maximum concentration is 1,273 ppm, and the median, 3.7 ppm (IQR = 1.4–19 ppm).
Although the concentrations of the trace elements, on aver-age, are lower in py I than in py II, the interelement asso-ciations are similar. Binary plots (Fig. 11) and element maps (Fig. 12) show that high Au concentrations in py I and II are generally associated with elevated Cu, As, Ag, and Te, but Au concentration may be high even if concentrations of these elements are relatively low; this is especially true for Ag and Te. Gold concentration is almost entirely independent of Se concentration and shows no correlation with Co (or Ni, Sb, Zn, Pb, and Bi, which are not shown) concentration. The inter-element correlations for Ag are similar to those for gold, except that Ag and Te are negatively correlated.
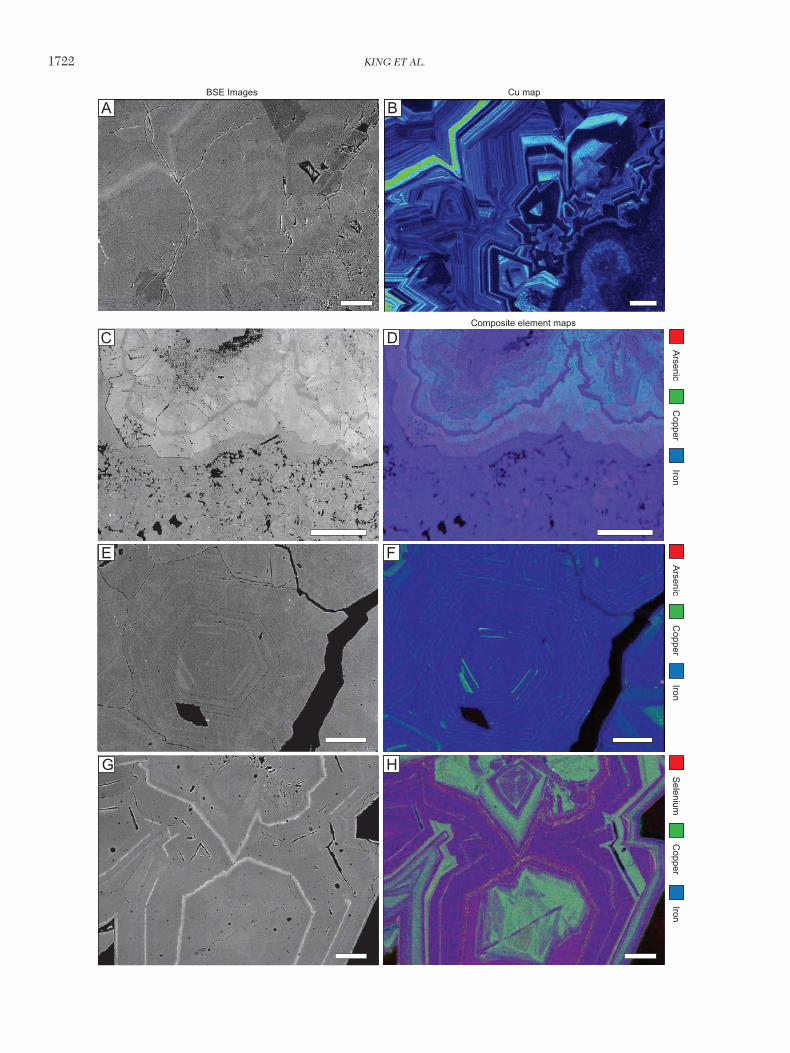
As mentioned above, py II is complexly compositionally zoned and py I is unzoned. The backscatter electron images indicate that this zonation reflects differences in concentra-tions of trace elements, mainly of Cu (Fig. 7A). Compositional
zoning was confirmed by quantitative spot analyses of py II, which show that there are appreciable compositional varia-tions within single crystals.
Copper concentrations show the largest variation between growth zones, the distribution of which reveals a complex history of growth, overgrowth, and resorption (Fig. 12). In addition to this growth zoning, sector zoning is evident in the distribution of Cu (i.e., within single growth zones there are sharply defined sectors of higher and lower Cu concentration corresponding to differences in the crystal faces presented). The nature of the sector zoning varies considerably with the crystal habit and is most easily observed in drusy crystals (Fig. 12).
Based on electron microprobe analyses, the Cu concentra-tion of individual zones can range from as low as 0.12 to as high as 6.0 wt %, and vary inversely with the concentration of Fe. In some zones, high Cu concentration is matched by an elevated concentration of As, but in others, the concen-trations of the two elements do not correlate positively (Fig. 12D, F). In addition to As, the concentrations of Ni, Se, and Te were measured across the transects. All three elements show increases in concentration with elevated Cu concen-tration. Where the concentrations are consistently above the detection limits, Ni, Se, and Te covary. In some pyrite crystals, they covary with Cu, in others with As, and in some crystals, with both.
Further insight into how trace elements in py II covary is provided by LA-ICP-MS depth profiles through crystal growth zones. Overall, the profiles show that zones enriched in Cu are enriched in all trace elements, although the con-centration of individual elements covaries with some, but not all, of the elements analyzed. This is illustrated in Figure 13, which shows the signal intensity (counts) for a suite of ele-ments through three growth zones. From this figure, it is evi-dent that the concentrations of Au, As, and Te covary (they all decrease strongly in the central zone), that Cu, Co, Ni, Zn, Bi,
Table 3. Average Composition of Py I, Py II, and Enargite Based on LA-ICP-MS Analyses
Ag As Au Bi Co Cu Fe Ni Pb S Sb Se Te Zn (ppm) (ppm) (ppm) (ppm) (ppm) (wt %) (wt %) (ppm) (ppm) (wt %) (ppm) (ppm) (ppm) (ppm)
Py I Mean 33.0 95.4 1.1 10.1 117.1 0.4 59.7 43.1 55.3 53.3 3.7 31.8 10.1 5.8 Median 9.1 43.9 1.0 3.9 62.5 0.3 58.4 33.7 59.6 53.4 3.7 9.6 3.8 2.8 Min 0.3 2.3 d.l. 0.1 0.1 d.l. 52.3 0.5 0.5 51.7 0.3 1.2 0.7 0.6 Max 145.8 467.3 2.5 47.9 404.3 1.5 71.7 182.9 199.8 54.6 11.0 118.6 35.5 22.9 1st quartile 1.1 15.6 0.6 1.0 15.6 0.2 53.1 14.2 9.5 53.4 0.8 6.1 2.2 1.0 3rd quartile 29.6 83.0 1.5 13.3 206.1 0.6 62.5 49.9 79.7 53.4 4.3 41.1 10.0 6.1
Py II Mean 80.6 329.7 3.0 9.4 3,015.6 1.1 48.6 138.3 511.8 52.3 10.7 121.0 218.3 91.7 Median 3.7 117.6 2.4 5.9 148.0 0.6 49.0 40.3 69.9 52.6 3.7 25.9 31.3 6.8 Min d.l. 0.8 d.l. d.l. d.l. d.l. 30.9 0.1 0.1 48.3 0.1 0.7 0.1 0.5 Max 1,273.2 1,636.6 13.6 43.2 21,417.7 4.4 76.1 800.2 7,205.3 55.2 169.6 640.1 1,430.9 1,936.3 1st quartile 1.4 16.1 0.9 3.0 48.4 0.3 40.7 11.8 2.7 52.1 2.2 12.8 11.0 1.1 3rd quartile 19.0 417.2 3.2 13.9 533.6 1.6 54.5 124.2 557.2 53.6 8.7 102.1 142.7 40.4
Enargite Mean 101.6 13.5 0.5 33.8 0.0 32.7 6,410.8 3.1 141.0 Median 108.5 13.4 0.6 33.2 0.0 32.7 5,527.7 3.2 135.9 Min 31.1 11.8 0.1 24.9 0.0 32.7 4,273.7 1.8 79.5 Max 214.5 15.5 0.8 45.8 0.1 32.7 9,543.1 5.5 211.3 1st quartile 52.7 12.5 0.4 28.8 0.0 32.7 4,876.6 2.6 95.1 3rd quartile 114.9 14.2 0.7 37.2 0.1 32.7 8,167.5 3.4 188.9
Note: See digital Appendices 1 to 4 for raw data

HIGH-SULFIDATION EPITHERMAL PYRITE-HOSTED Au ORE FORMATION, SANGIHE ISLAND, INDONESIA 1721
and Se covary and do so independently of Au, As, and Te, and that Ag and Pb covary independently of the other two groups of elements. It should be noted, however, that these group-ings are not observed in all crystals. For example, Te behaves independently of Au and As in some crystals and covaries with Se in others. Nonetheless, the “Cu group” of Cu, Ni, and Co generally covaries independently of the “Au group” of Au, As, and Te (Se). Silver concentration is usually decoupled from those of both Au and Cu, and commonly covaries with Pb, Bi and, rarely, Se concentration.
Enargite: On the basis of quantitative EMP analyses (Table A3), enargite has close to an end member composi-tion with a median As concentration of 18.5 wt % (IQR
= 18.1–18.8 wt %), a median S concentration of 32.8 wt % (IQR = 32.7–33.0 wt %) and a median Cu concentration of 48.6 wt % (IQR = 48.1–48.8 wt %). The trace element con-centrations were analyzed by a combination of EMP and LA-ICP-MS methods, and predictably, Sb was the trace element with the highest concentration with a median of 5527 ppm (IQR = 4876–8167 ppm; Tables 3, A4). This is well below its concentration in stibioenargite (Springer, 1969; Maske and Skinner, 1971; Posfai and Buseck, 1998). Iron is the next most important trace element with a median concentration of 316 ppm (IQR = 117–649 ppm), followed by Te and Se, with median concentrations of 135 ppm (IQR = 95.1–189 ppm) and 3.2 ppm (IQR = 2.6–3.4 ppm), respectively (Table 3). The
Aa (a
fu)
10-6
10-2
10-4 10-4
As
(afu
)
10-2
10-6
Cu
(afu
)
10-5
10-1
10-3
Cu
(afu
)
10-1
10-3
Te (a
fu)
10-3
10-5
10-7
Te (a
fu)
10-3
10-5
10-7
10-5
Se
(afu
)
10-3
10-5
10-7
Sb
(afu
)
10-5
10-5
10-7
Ag (afu)
Co
(afu
)
10-7
10-5
10-3
10-1
10-410-8 10-7 10-6 10-5
Au (afu)
Ag
(afu
)
10-6
10-5
10-4
10-7
10-710-810-9 10-6
Pyrite IPyrite II
Fig. 11. Binary plots of trace element concentration in pyrite analyzed by LA-ICP-MS and shown in atoms per formula unit (afu).
1722 KING ET AL.
C D
FE
G H
A BBSE Images Cu map
Composite element maps
Arsenic
Copper
Arsenic
Copper
Selenium
Copper
IronIron
Iron
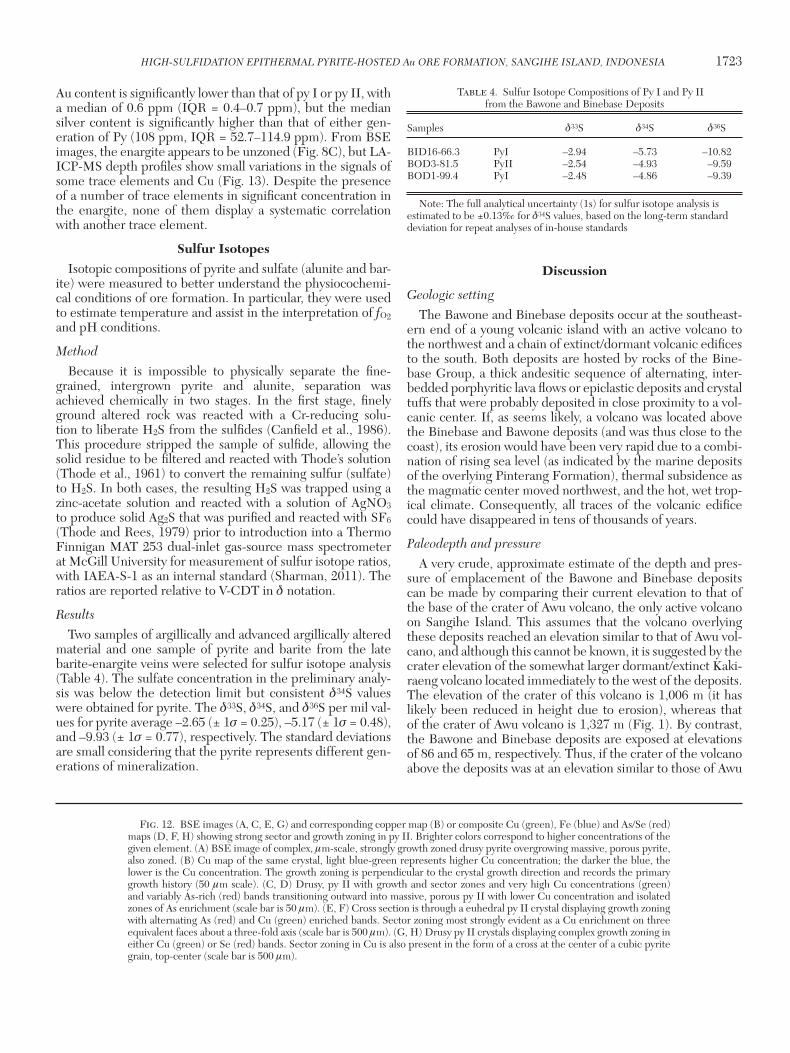
HIGH-SULFIDATION EPITHERMAL PYRITE-HOSTED Au ORE FORMATION, SANGIHE ISLAND, INDONESIA 1723
Au content is significantly lower than that of py I or py II, with a median of 0.6 ppm (IQR = 0.4–0.7 ppm), but the median silver content is significantly higher than that of either gen-eration of Py (108 ppm, IQR = 52.7–114.9 ppm). From BSE images, the enargite appears to be unzoned (Fig. 8C), but LA-ICP-MS depth profiles show small variations in the signals of some trace elements and Cu (Fig. 13). Despite the presence of a number of trace elements in significant concentration in the enargite, none of them display a systematic correlation with another trace element.
Sulfur IsotopesIsotopic compositions of pyrite and sulfate (alunite and bar-
ite) were measured to better understand the physiocochemi-cal conditions of ore formation. In particular, they were used to estimate temperature and assist in the interpretation of fO2 and pH conditions.
Method
Because it is impossible to physically separate the fine-grained, intergrown pyrite and alunite, separation was achieved chemically in two stages. In the first stage, finely ground altered rock was reacted with a Cr-reducing solu-tion to liberate H2S from the sulfides (Canfield et al., 1986). This procedure stripped the sample of sulfide, allowing the solid residue to be filtered and reacted with Thode’s solution (Thode et al., 1961) to convert the remaining sulfur (sulfate) to H2S. In both cases, the resulting H2S was trapped using a zinc-acetate solution and reacted with a solution of AgNO3 to produce solid Ag2S that was purified and reacted with SF6
(Thode and Rees, 1979) prior to introduction into a Thermo Finnigan MAT 253 dual-inlet gas-source mass spectrometer at McGill University for measurement of sulfur isotope ratios, with IAEA-S-1 as an internal standard (Sharman, 2011). The ratios are reported relative to V-CDT in δ notation.
Results
Two samples of argillically and advanced argillically altered material and one sample of pyrite and barite from the late barite-enargite veins were selected for sulfur isotope analysis (Table 4). The sulfate concentration in the preliminary analy-sis was below the detection limit but consistent δ34S values were obtained for pyrite. The δ33S, δ34S, and δ36S per mil val-ues for pyrite average –2.65 (± 1s = 0.25), –5.17 (± 1s = 0.48), and –9.93 (± 1s = 0.77), respectively. The standard deviations are small considering that the pyrite represents different gen-erations of mineralization.
Discussion
Geologic setting
The Bawone and Binebase deposits occur at the southeast-ern end of a young volcanic island with an active volcano to the northwest and a chain of extinct/dormant volcanic edifices to the south. Both deposits are hosted by rocks of the Bine-base Group, a thick andesitic sequence of alternating, inter-bedded porphyritic lava flows or epiclastic deposits and crystal tuffs that were probably deposited in close proximity to a vol-canic center. If, as seems likely, a volcano was located above the Binebase and Bawone deposits (and was thus close to the coast), its erosion would have been very rapid due to a combi-nation of rising sea level (as indicated by the marine deposits of the overlying Pinterang Formation), thermal subsidence as the magmatic center moved northwest, and the hot, wet trop-ical climate. Consequently, all traces of the volcanic edifice could have disappeared in tens of thousands of years.
Paleodepth and pressure
A very crude, approximate estimate of the depth and pres-sure of emplacement of the Bawone and Binebase deposits can be made by comparing their current elevation to that of the base of the crater of Awu volcano, the only active volcano on Sangihe Island. This assumes that the volcano overlying these deposits reached an elevation similar to that of Awu vol-cano, and although this cannot be known, it is suggested by the crater elevation of the somewhat larger dormant/extinct Kaki-raeng volcano located immediately to the west of the deposits. The elevation of the crater of this volcano is 1,006 m (it has likely been reduced in height due to erosion), whereas that of the crater of Awu volcano is 1,327 m (Fig. 1). By contrast, the Bawone and Binebase deposits are exposed at elevations of 86 and 65 m, respectively. Thus, if the crater of the volcano above the deposits was at an elevation similar to those of Awu
Fig. 12. BSE images (A, C, E, G) and corresponding copper map (B) or composite Cu (green), Fe (blue) and As/Se (red) maps (D, F, H) showing strong sector and growth zoning in py II. Brighter colors correspond to higher concentrations of the given element. (A) BSE image of complex, μm-scale, strongly growth zoned drusy pyrite overgrowing massive, porous pyrite, also zoned. (B) Cu map of the same crystal, light blue-green represents higher Cu concentration; the darker the blue, the lower is the Cu concentration. The growth zoning is perpendicular to the crystal growth direction and records the primary growth history (50 μm scale). (C, D) Drusy, py II with growth and sector zones and very high Cu concentrations (green) and variably As-rich (red) bands transitioning outward into massive, porous py II with lower Cu concentration and isolated zones of As enrichment (scale bar is 50 μm). (E, F) Cross section is through a euhedral py II crystal displaying growth zoning with alternating As (red) and Cu (green) enriched bands. Sector zoning most strongly evident as a Cu enrichment on three equivalent faces about a three-fold axis (scale bar is 500 μm). (G, H) Drusy py II crystals displaying complex growth zoning in either Cu (green) or Se (red) bands. Sector zoning in Cu is also present in the form of a cross at the center of a cubic pyrite grain, top-center (scale bar is 500 μm).
Table 4. Sulfur Isotope Compositions of Py I and Py II from the Bawone and Binebase Deposits
Samples δ33S δ34S δ36S
BID16-66.3 PyI –2.94 –5.73 –10.82BOD3-81.5 PyII –2.54 –4.93 –9.59BOD1-99.4 PyI –2.48 –4.86 –9.39
Note: The full analytical uncertainty (1s) for sulfur isotope analysis is estimated to be ±0.13‰ for δ34S values, based on the long-term standard deviation for repeat analyses of in-house standards

1724 KING ET AL.
and Kakiraeng volcanoes, it follows that the deposits formed at depths of approximately 900 to 1,300 m below the paleo-vent. These depths fall within the range of depths estimated for other high-sulfidation epithermal deposits (Jannas et al., 1990; Arribas, 1995; Cooke and Simmons, 2000). The depths inferred for Bawone and Binebase (900–1,300 m) correspond to lithostatic pressures of 250 to 350 bars or hydrostatic pres-sures of 90 to 125 bars (assuming the water table was near the paleosurface), respectively. As much of the mineralization is disseminated and there is no evidence of large through-going fractures that might have intersected the paleosurface, pres-sure was probably intermediate between the two extremes. In the discussion that follows, we therefore assume that the pres-sure accompanying hydrothermal alteration and gold mineral-ization was ~200 bars.
Temperature and pH
Earlier, we showed that advanced argillic (AA) and inter-mediate argillic (IA) alteration in the Bawone and Binebase deposits are characterized by the following mineral associa-tions: AA I (quartz + pyrite + pyrophyllite ± natroalunite), AA II (quartz + pyrite ± natroalunite ± dickite ± kaolinite), AA III (quartz + pyrite + kaolinite + alunite), IA I (quartz + kaolinite ± pyrite ± dickite), and IA II (quartz + illite ± pyrite). Here, we use stability relationships among these minerals in the system Al-Si-O-K-Na-Fe-H-S to make inferences about the tempera-ture and pH of the fluids responsible for the different types of
alteration (Figs. 14, 15). The total S concentration was assumed to be 0.01 m, consistent with that inferred for other high-sul-fidation epithermal systems (e.g., Muntean et al., 1990). At a pH below 2, aluminum is mobile, an observation confirmed by our mass balance calculations that provides evidence for local Al mobility. For these conditions, Al activity was assumed to be 0.1 (Knight, 1977; Fulignati et al., 1999). At higher pH, Al was assumed to be immobile and its activity buffered by the alumi-num silicate minerals (Stoffregen, 1987; Salvi et al., 1998).The Na/K ratio was taken to be 10, assuming equilibrium between natroalunite and alunite (natroalunite and alunite commonly occur together but their textural relationships could not be determined because of the very fine-grained nature of the rock), and the conclusion that alunite transformed to natroal-unite at a temperature of ~275°C (see below). Oxygen fugac-ity was inferred from the δ34S values for pyrite to be that of the hematite-magnetite buffer (see below). The activities of Fe and Si were assumed to have been buffered by pyrite and quartz, respectively, which are ubiquitous in the deposits.
At the conditions for which Figures 14 and 15 were con-structed, pyrite is stable above 250°C (hematite is stable below 250°C), making this the lower temperature limit for all alteration facies. Because kaolinite and quartz react to form pyrophyllite at temperatures greater than 280°C (Fig. 15), the coexistence of quartz and kaolinite in AA II, AA III, and IA I alteration zones constrains their temperatures to have been less than 280°C. Conversely, the presence of pyrophyllite in
S34
Fe57
Co59
Ni60
Cu65
Zn66
As75Se77
Ag107
Sb121
Te125
Au197
Pb208
Bi209
1
10
100
1000
10 000
100 000
1 000 000
Growth Zone 1 Growth Zone 2 Growth Zone 3
50 100 150 200 250
Time (s)
Sig
nal I
nten
sity
(cou
nts)
Fig. 13. An example of a depth profile through three growth zones of a py II crystal produced by LA-ICP-MS, in counts vs. time (depth) for major and trace elements. Arsenic, Te, and Au covary through the three growth zones and are independent of Co, Cu, Ni, Zn, Se, and Bi, whereas Ag, Pb, and to some extent Sb covary independently of the other two groups.
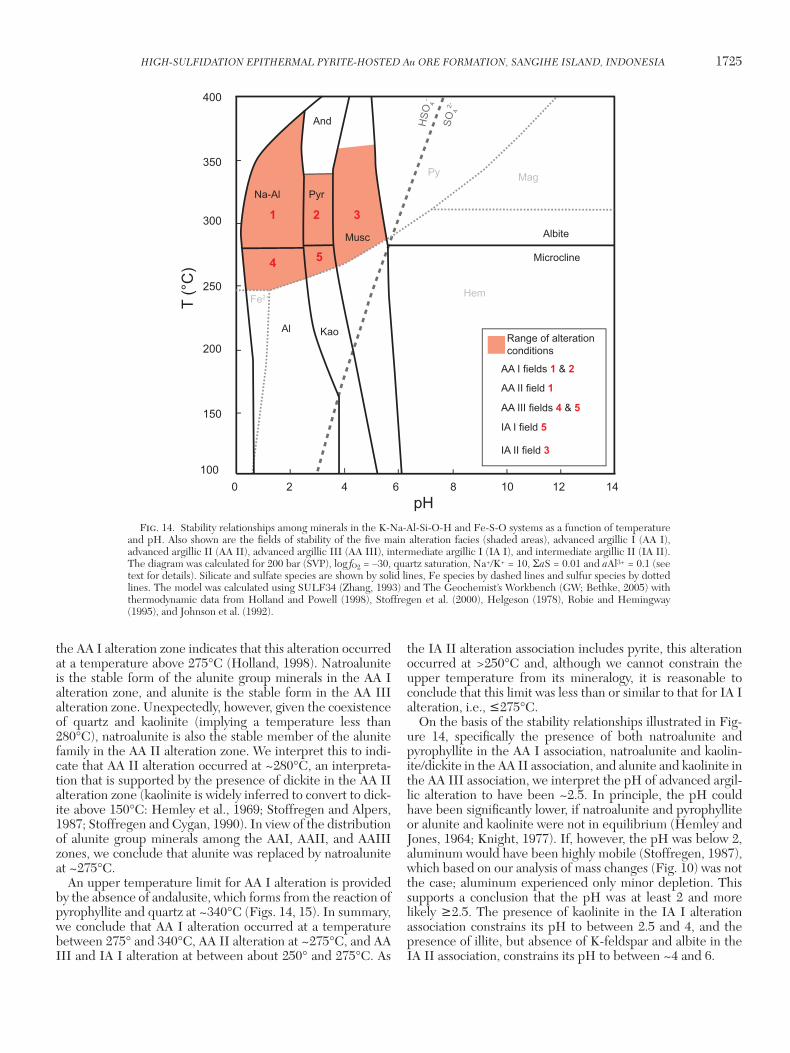
HIGH-SULFIDATION EPITHERMAL PYRITE-HOSTED Au ORE FORMATION, SANGIHE ISLAND, INDONESIA 1725
the AA I alteration zone indicates that this alteration occurred at a temperature above 275°C (Holland, 1998). Natroalunite is the stable form of the alunite group minerals in the AA I alteration zone, and alunite is the stable form in the AA III alteration zone. Unexpectedly, however, given the coexistence of quartz and kaolinite (implying a temperature less than 280°C), natroalunite is also the stable member of the alunite family in the AA II alteration zone. We interpret this to indi-cate that AA II alteration occurred at ~280°C, an interpreta-tion that is supported by the presence of dickite in the AA II alteration zone (kaolinite is widely inferred to convert to dick-ite above 150°C: Hemley et al., 1969; Stoffregen and Alpers, 1987; Stoffregen and Cygan, 1990). In view of the distribution of alunite group minerals among the AAI, AAII, and AAIII zones, we conclude that alunite was replaced by natroalunite at ~275°C.
An upper temperature limit for AA I alteration is provided by the absence of andalusite, which forms from the reaction of pyrophyllite and quartz at ~340°C (Figs. 14, 15). In summary, we conclude that AA I alteration occurred at a temperature between 275° and 340°C, AA II alteration at ~275°C, and AA III and IA I alteration at between about 250° and 275°C. As
the IA II alteration association includes pyrite, this alteration occurred at >250°C and, although we cannot constrain the upper temperature from its mineralogy, it is reasonable to conclude that this limit was less than or similar to that for IA I alteration, i.e., ≤275°C.
On the basis of the stability relationships illustrated in Fig-ure 14, specifically the presence of both natroalunite and pyrophyllite in the AA I association, natroalunite and kaolin-ite/dickite in the AA II association, and alunite and kaolinite in the AA III association, we interpret the pH of advanced argil-lic alteration to have been ~2.5. In principle, the pH could have been significantly lower, if natroalunite and pyrophyllite or alunite and kaolinite were not in equilibrium (Hemley and Jones, 1964; Knight, 1977). If, however, the pH was below 2, aluminum would have been highly mobile (Stoffregen, 1987), which based on our analysis of mass changes (Fig. 10) was not the case; aluminum experienced only minor depletion. This supports a conclusion that the pH was at least 2 and more likely ≥2.5. The presence of kaolinite in the IA I alteration association constrains its pH to between 2.5 and 4, and the presence of illite, but absence of K-feldspar and albite in the IA II association, constrains its pH to between ~4 and 6.
SO4
2-
HSO
4-
1 2 3
4 5
pH
T (°
C)
10 12 14100
200
250
300
350
400
0 2 4 6 8
150
Range of alteration conditions
AA I fields 1 & 2
IA II field 3
IA I field 5
AA III fields 4 & 5
AA II field 1
Py Mag
Fe2+ Hem
Microcline
Albite
Al
Na-Al Pyr
Kao
Musc
And
Fig. 14. Stability relationships among minerals in the K-Na-Al-Si-O-H and Fe-S-O systems as a function of temperature and pH. Also shown are the fields of stability of the five main alteration facies (shaded areas), advanced argillic I (AA I), advanced argillic II (AA II), advanced argillic III (AA III), intermediate argillic I (IA I), and intermediate argillic II (IA II). The diagram was calculated for 200 bar (SVP), log fO2 = –30, quartz saturation, Na+/K+ = 10, ΣaS = 0.01 and aAl3+ = 0.1 (see text for details). Silicate and sulfate species are shown by solid lines, Fe species by dashed lines and sulfur species by dotted lines. The model was calculated using SULF34 (Zhang, 1993) and The Geochemist’s Workbench (GW; Bethke, 2005) with thermodynamic data from Holland and Powell (1998), Stoffregen et al. (2000), Helgeson (1978), Robie and Hemingway (1995), and Johnson et al. (1992).

1726 KING ET AL.
fO2
Ore-forming high-sulfidation epithermal systems are char-acteristically oxidizing, with oxygen fugacity straddling or just below that of the hematite-magnetite buffer. For example, val-ues for ∆log fO2 (HM) reported for some other high-sulfidation deposits have ranges of 4.24 to –1.32 (Thiersch et al., 1997), 2.4 to 0.07 (Muntean et al., 1990) and <2.5 (Voudouris, 2011). If the sulfur source were dominantly magmatic, which is con-sidered to be the case for most high-sulfidation deposits (e.g., Muntean et al., 1990; Rye et al., 1992; Rye, 1993; Arribas, 1995;
Hedenquist et al., 1998b; Bethke et al., 2005; Deyell et al., 2005a, b; Fifarek and Rye, 2005; Taylor, 2007), the Σδ34S value of the fluid would have been approximately zero. Using this assumption, it is possible to calculate the δ34S of the fluid from the measured pyrite δ34S values and, in turn, calculate log fO2 for given pH values (Zhang, 1993). The negative δ34S values calculated for reduced sulfur (H2S) at Bawone and Binebase, assuming a temperature between 250° and 340°C, are simi-lar to those of other high-sulfidation deposits (Muntean et al., 1990; Hedenquist et al., 1994; Voudouris, 2010), and are consistent with sulfur isotope fractionation between sulfides/
MuscKaoAl Microcline
AlS
O4+
Py
Fe2+
Hem
Mag
PrH2S
SO
4 2-HS
O4-
HS
-
δ34H2S= -5
δ34H2S = -1
δ34H2S= -10
15
0
5
10
pH
log
fO2
-40
-35
250°C
-30
-25
-20
0 2 4 6 8
∆ lo
g fO
2 (H
M)
H2S
SO
4 2-HS
O4-
HS
-
SO2
Hem
Mag
PrFe+2
Py
MuscNa-Al Pyr Albite
AlSO4+
δ34H2S= -5
δ34H2S= -1
δ34H2S= -10 ∆ lo
g fO
2 (H
M)
-5
0
5
10
-30
-25
-20
0 2 4 6 8pH
log
fO2
-40
-35
300°C
Fig. 15. Log fO2-pH diagrams showing stability relationships for minerals in the K-Na-Al-Si-O-H and Fe-S-O systems (A) at 250°C, and (B) at 300°C. The diagrams were created assuming a pressure of 200 bar (SVP), quartz saturation, Na+/K+ = 10, ΣaS = 0.01 and aAl3+ = 0.1 (see text for details). Silicates and sulfate species are shown by solid lines, Fe-species by dashed lines and sulfur species by dotted lines. The red lines are δ34SH2S contours at –1, –5 (the measured δ34S value for Sangihe pyrite) and –10, and constrain the range of log fO2 values for Au-Ag mineralization to approximately –32 (Fig 16A) and –27 (Fig 16B) assuming a pH of 2.5 (see text for details). The term ∆log fO2 (HM) refers to the number of log units of fO2 above or below that of the hematite-magnetite buffer (calculated using The Geochemist’s Workbench).
A
B

HIGH-SULFIDATION EPITHERMAL PYRITE-HOSTED Au ORE FORMATION, SANGIHE ISLAND, INDONESIA 1727
sulfosalts and sulfates in an oxidizing environment (Arribas, 1995; Cooke and Simmons, 2000). The ∆log fO2 (HM) values corresponding to the δ34SH2S values for advanced and interme-diate argillic alteration are between 4 and –1 (Fig. 15; Table 5; Rye, 1993, 2005; Cooke and Simmons, 2000).
Metal transport
According to many researchers, there is a hyper-acidic “ground preparatory” or “pre-ore” stage of hydrothermal alter-ation in high-sulfidation epithermal systems that precedes gold mineralization and results in advanced argillic alteration (Stof-fregen, 1987; Hedenquist et al., 1994, 1998, 2000; Arribas, 1995). There is also a consensus among these researchers that the extreme acidity required to produce the advanced argillic alteration that characterizes this ground preparation stage can only be explained by interaction of the rocks with a condensed acidic vapor (e.g., Hedenquist et al., 1994, 2000). At Bawone and Binebase, the alteration does not reflect interaction with fluids having the extreme acidity of some high-sulfidation epithermal systems (residual “vuggy” silica is not observed). Nonetheless, the very low pH of ~2.5 estimated for the fluid requires that it was a liquid condensed from gas, as other fluids that might have been present in the system, such as meteoric water/groundwater, seawater and magmatic liquid would have had higher pH (Stoffregen and Alpers, 1987; Meyer and Hem-ley, 1967; Hemley et al., 1969; Stoffregen, 1987; White, 1957). Because advanced argillic alteration involved crystallization of auriferous and argentiferous pyrite (pyrite I) and this pyrite accounts for between 30 and 50% of the hypogene Au (Ag-Cu) mineralization in the Bawone and Binebase deposits, it there-fore follows that much of the gold and the other metals were introduced into the deposits by this condensed gas. Whether or not pyrite II and enargite, which were introduced later, also crystallized from this condensed gas is less clear but given the similar trace element and isotopic compositions of pyrite I and II, it is a strong possibility. There were also likely multiple iter-ations of this process as porosity was created and subsequently filled by alteration products (Berger and Henley, 2011).
Evidence that metals can be transported in high concentra-tions in magmatic vapors has been provided by analyses of the compositions of vapor inclusions, which have yielded poten-tially ore-forming concentrations of some metals, including ppm levels of Au and Ag (Audétat et al., 1998, 2008; Ulrich et al., 1999; Williams-Jones and Heinrich, 2005; Seo et al., 2009). In addition to the fluid inclusion data, there is also a growing body of evidence from experiments that Au, Ag and Cu can be transported in appreciable concentrations in aqueous vapor (Migdisov et al., 1999; Archibald et al., 2001, 2002; Migdisov and Williams-Jones, 2013; Hurtig and Williams-Jones, 2014).
For example, Migdisov and Williams-Jones (2013) and Hur-tig and Williams-Jones (2014) have shown that HCl-bearing aqueous gases can dissolve ppm levels of Ag and Au, respec-tively, at temperatures as low as 400°C. They have shown, moreover, that the solubility of these metals increases expo-nentially with increasing fH2O. At the temperature and pres-sure predicted for the formation of the Bawone and Binbase deposits, i.e., close to those of the H2O vapor-liquid boundary, conditions would have been optimal for the transport of gold and silver by magmatic vapor.
Direct evidence that condensed gases in environments analogous to those of high-sulfidation epithermal deposits can transport significant concentrations of metals is provided by Kawah Ijen, an active volcano in eastern Java, Indonesia. There, advanced argillic alteration (and residual silica altera-tion) is ongoing and accompanied by the crystallization of pyrite enriched in Cu, Ag, and Au (Scher et al., 2013). The fluid responsible for this alteration is a condensed magmatic gas with a pH <1 containing ppm concentrations of Cu and As (the concentrations of Au and Ag are below the level of detection). Although the concentrations of Cu, Ag, and Au in the Kawah Ijen pyrite are much lower than those in the pyrite at Bawone and Binebase (because of the much lower pressure and hence density of the gas), the metal ratios, e.g., Cu/Au and Ag/Au are very similar to those of the two Sangihe Island deposits (Fig. 16). We can therefore conclude that the two pyrite occurrences likely formed by the same process and that the fluid which transported the ore metals in the Bawone and Binebase deposits was therefore a magmatic gas. Several other ore deposit studies have also documented gold mineral-ization associated with early advanced argillic alteration (e.g., Muntean et al., 1990; Voudouris, 2011).
Ore deposition
For the reasons presented above, we propose that the fluid responsible for the formation of the Bawone and Binebase deposits was a condensed magmatic gas. However, we con-sider it likely that this gas encountered a physicochemical barrier, such as the water table or an impermeable cap rock. This seems to have been the case for the deeper mineraliza-tion at Bawone (Figs. 3A, 6A), as the gas condensed to a low-pH liquid from which the ore mineral (pyrite) precipitated or formed by replacement of primary iron-bearing minerals. According to this interpretation, the ore metals were trans-ported in the vapor as hydrated species, e.g., MeCl-H2O or MeHS-H2O (Migdisov et al., 1999; Williams-Jones and Hein-rich, 2005; Zezin et al., 2011b; Migdisov and Williams-Jones, 2013; Hurtig and Williams-Jones, 2014), whereas after con-densation of the vapor to liquid, they would have been trans-ported as charged or neutral aqueous species like MeCl2– or MeHSo (Crerar and Barnes, 1976; Gammons and Barnes, 1989; Zotov et al., 1990; Gammons and Williams-Jones, 1997; Mountain and Seward, 2003; Stefánsson and Seward, 2004; Williams-Jones et al., 2009).
If saturation of the fluid with the metal had occurred, ore deposition would have been controlled by reactions such as the following:
Au(HS)o + ½ H2O(l) = Au(s) + H2S + ¼ O2 (1)
AuCl2– + ½ H2O(l) = Au(s) + 2Cl– + H+ + ¼ O2(g) (2)
Table 5. Physicochemical Conditions for Each Alteration Facies Based on Stability Relationships Among Minerals and δ34S Values for Py I and Py
II
T pH log fO2 ∆log fO2 (HM buffer)
IA I 260–275 3–4 –34 to –31 +1 to +3IA II >265 4–6 –35 to –33 –1 to +2AA I 275–330 0.5–4 –28 to –27 +2 to +4AA II 270–275 0.5–4 –28 to –27 +1 to +4AA III 250–270 0.5–4 –33 to –32 +1 to +3

1728 KING ET AL.
However, as native gold does not occur in the deposits, instead, the gold occurs with other metals as nanoparticles in pyrite or within the structure of this mineral, it follows that gold was undersaturated in the liquid.
Deposition of gold and other metals is interpreted to have occurred as a result of their adsorption onto the faces of pyrite during crystal growth. This deposition began at the onset of advanced argillic alteration with the precipitation of pyrite I and continued with the precipitation of pyrite II. Adsorption of gold onto pyrite has been proposed previously as a mecha-nism to explain the occurrence of “invisible gold” in other epi-thermal deposits (e.g., Simon et al., 1999; Wilder and Seward, 2002; Pals et al., 2003). It also has been investigated experi-mentally at ambient pressure and temperature for pH values from 2 to 10. Results of these experiments for pyrite having negatively charged crystal faces show that over 90% of the gold in solution (undersaturated with respect to native gold)
is adsorbed at a pH <5 (Widler and Seward, 2002). Pyrite can also have positively charged faces if arsenic bearing (Favorov et al., 1974), but the effects of Cu on the surface properties of pyrite are unknown.
Pyrite I is an integral part of advanced and intermediate argillic alteration, and accounts for 30 to 50% of the gold in the Bawone deposit and in the hypogene part of the Bine-base deposit with an median concentration of 1.0 ppm Au; the median concentrations of Ag and Cu are 9.1 ppm and 0.44 wt %, respectively. The texturally complex pyrite II con-tains median values of 2.4 ppm Au, 3.7 ppm Ag, and 1.1 wt % Cu, and accounts for most of the remaining gold. Some gold and even more silver are present in enargite (median values of 0.6 ppm Au and 108 ppm Ag).
Insights into the conditions favorable for the uptake of gold by pyrite in the Bawone and Binebase deposits are afforded by the presence of both growth and sector zoning in pyrite II. The latter zoning reflects differences in the concentrations of elements on two nonequivalent faces within single growth zones, and enables partition coefficients to be calculated for these faces, which record the relative changes in physi-cochemical conditions during crystal growth (van Hinsberg and Schumacher, 2007). We have used analyses of sector and growth zones in pyrite II to determine the conditions favor-able for the incorporation of gold and other trace elements into pyrite. The element concentrations in two adjacent nonequivalent faces were measured for a series of growth zones and the partition coefficients (Kd) were calculated. We observed that the highest gold concentrations coincided with periods of growth marked by relatively constant Kd, and lower gold values coincided with sharp increases and decreases in the Kd (Fig. 17). Thus, in contrast to mineralization produced by saturation of an ore mineral, which is favored by rapid changes in the physicochemical conditions due to processes like mixing and boiling, concentration of gold in the Bawone and Binebase deposits was favored when physicochemical conditions were relatively stable.
Incorporation of trace elements in pyrite
Unlike many examples of deposits of invisible gold, the pyrite in the Bawone and Binebase deposits contains only trace quantities of As (Tables 3, A1, A2). Despite this low concentration of As relative to that in auriferous pyrite from other deposits (e.g., Reich et al., 2005), Au concentration cor-relates positively with the concentration of As (Figs. 11, 13, 16); the latter is a hundred times greater than the concentra-tion of Au in py I and py II. This correlation suggests that Au + As substituted for Fe, as has been proposed previously for other deposits containing gold hosted in pyrite (Cook and Chryssoulis, 1990; Fleet et al., 1993; Huston et al., 1995). It is also possible, however, that some or all of the gold occurs as nanoparticles within the pyrite. Although our data do not allow us to determine whether the gold was incorporated into the pyrite structure or is present as nanoparticles, Reich et al. (2005) have observed that in pyrite with Au/As > 0.02, gold occurs as microinclusions, whereas if the ratio is less than this, it is substituted into the pyrite structure. The average Au/As for pyrite in the Bawone and Binebase deposits is 0.019, sug-gesting that much of the gold may have been incorporated in the structure of this mineral.
1
10
100
1000
Cu
(ppm
)
1
10
100
1000
As
(ppm
)
0.0001 0.001 0.01 0.1 1 10Au (ppm)
0.01
0.1
1
10
100
1000
Ag
(ppm
)
Pyrite IPyrite II
Pyrite (Scher et al., 2013)
Fig. 16. Log-log plots comparing the trace element composition of py I and py II with that of pyrite from an active high-sulfidation epithermal system at Kawah Ijen volcano (Scher et al., 2013). From these plots, it is evident that the ratios, Cu/Au and Ag/Au of py I and py II, and particularly the Ag/Au ratio of py I, are broadly similar to those of Kawah Ijen pyrite.

HIGH-SULFIDATION EPITHERMAL PYRITE-HOSTED Au ORE FORMATION, SANGIHE ISLAND, INDONESIA 1729
Incorporation of Au in the pyrite structure is also favored by the presence of Te, which substitutes for the smaller S ion, thereby expanding the lattice and providing space for the large Au ion (Chouinard et al., 2005a; Bi et al., 2011). The presence of appreciable Te (concentrations of Te are tens (py I) to a hundred (py II) times greater than that of Au) and its positive correlation with Au (Fig. 14) suggests that this substi-tution was also important in the uptake of Au.
Although the As concentration in pyrite II is low compared to that of auriferous pyrite elsewhere, the Cu concentration is anomalously high, up to 6 wt % Cu (Abraitis et al., 2004). Sig-nificantly, most of the other examples of auriferous pyrite with high copper contents are also from high-sulfidation epithermal deposits, e.g., Pascua Lama (up to 1.5 wt % Cu; Chouinard et al., 2005a), Pueblo Viejo (up to 3.0 wt % Cu; Deditius et al., 2011) and Chelopech (up to 4.5 wt % Cu; Pacevski et al., 2008). Moreover, the exceptions, such as pyrite from the Coka Marin polymetallic deposit (up to 8 wt % Cu; Pacevski et al., 2008) have many characteristics of high-sulfidation deposits.
It has been shown that copper can be incorporated in the pyrite structure both as nanoparticles and by substitu-tion for Fe, even within a single ore deposit such as Peublo
Viejo (Huston et al., 1995; Oberthür et al., 1997; Deditius et al., 2011). However, there is no agreed upon mechanism to explain the rare and anomalous Cu concentrations in pyrite. Some studies have shown that Cu-rich pyrite is the result of recrystallization of Cu-phases (Pacevski et al., 2008). This was not the case at Bawone and Binebase because of the well-documented zoning that records the growth history of the crystals (Fig. 12). Other researchers have suggested oxidation of aqueous Cu+ and direct substitution of Cu2+ for Fe2+ (e.g., Chouinard et al., 2005a; Pacevski et al., 2008) accompanied by the incorporation of other trace elements that cause distortion of the lattice (e.g., Radcliff and McSween, 1970). Whatever the mechanism, it seems likely that the highly oxidizing condi-tions that are characteristic of high-sulfidation deposits play a role in the incorporation of Cu in the pyrite structure.
Genetic model
We propose that the metals forming the Bawone and Bine-base deposits originated from a relatively oxidized magma that was emplaced at high crustal levels and exsolved a low den-sity supercritical fluid (that subsequently evolved to vapor) into which metals (including Au, Ag, and Cu) partitioned
0 20 40 60 80 100Distance
11.46
16.79
2.65
12.22
2.23
KdCu lightAu (ppm)
1
2
3
4
0
Cu
(wt %
)
0
1
2
3
Kd
Fig. 17. A plot showing the variation in the partition coefficient (Kd; black line) and the concentration of Cu (red line) as a function of the distance (in percent) from the core to the rim of a single pyrite crystal (BID34-84). In this plot, the Kd corresponds to the ratio of the Cu concentration in one sector zone (the one with the higher overall Cu concentration, i.e., the “light” zone in BSE images, e.g., Fig. 13) to the Cu concentration in the adjacent sector zone (the “dark” zone), within the same growth zone. The Kd is inferred to vary inversely with temperature following van Hinsberg and Schumacher (2007). The yellow squares represent gold concentrations analyzed by LA-ICP-MS, with the width of the square corresponding to the diameter of the pit in relation to the growth zones. The vertical scale on the right hand side of the diagram indicates the Cu concentration. The highest gold concentrations correspond to regions where the Kd is stable, whereas lower gold concen-trations correspond to intervals over which there is a rapid change in Kd values; Cu concentrations show the same behavior.

1730 KING ET AL.
preferentially. The gold and other metals were transported as hydrated species that ascended through the volcanic pile via fractures and zones of enhanced permeability to depths between 900 and 1,300 m, where the vapor condensed at tem-peratures between 250° and 340°C to form an acidic liquid with a pH of ~2.5; fO2 ranged up to four log units above the hematite-magnetite buffer.
The acidic condensate altered the host andesite, replac-ing primary mafic minerals, such as hornblende, biotite, and magnetite, with auriferous py I (sulfidation), and converting feldspars to an advanced argillic alteration association that includes kaolinite, pyrophyllite, alunite, natroalunite, and dickite. If fluids had been previously neutralized by reactions with rocks or fluid/rock ratios were lower, the alteration led to an intermediate argillic I alteration association of kaolin-ite, quartz, and pyrite, and a distal intermediate argillic II alteration association of illite, quartz, and pyrite. The altera-tion also created porosity through the dissolution of minerals. During alteration, all major elements, except for Zr and Ti were depleted proximal to the main alteration/mineralization
conduits (Al and particularly Si experienced only minor deple-tion; Fig. 10). Iron and many trace elements, except for the REE, Rb and Cs, were enriched, in some cases by orders of magnitude, relative to their original abundance.
Auriferous py II was deposited in veins and in open space created by mineral dissolution. These same veins were frac-tured and the fractures filled by barite and enargite. Rare, late auriferous (electrum) barite-base metal (sphalerite and chal-copyrite) veins formed at Binebase.
Py I, which is associated with advanced and intermediate argillic alteration, and py II, precipitated under conditions for which metals, including gold, were undersaturated in the fluid. The metals, i.e., Au, Ag, and Cu, were adsorbed onto the surfaces of the growing pyrite crystals and incorpo-rated in the pyrite either as a solid solution or as nanopar-ticles. Some gold and silver were incorporated in enargite by the same mechanisms (Fig. 18). The Bawone and Binbase deposits were subsequently exhumed and partially oxidized, creating an upper zone of supergene-enriched oxide ore and deeper lower-grade hypogene ores.
Paleo water table
H2SH2O
SO2
CO2
Advanced Argillic
Argillic
Py II ± Ba-En veins
Impermeable
Impermeable
AuHS . nH2O
AuCl2 . nH2O
AgCl . nH2O
CuHS . nH2O
H2 SO42-
AuHSo AuCl2- H2O H2 SO4
2-
AuHSo CuHS. nH2O
AuHS . nH2O
AuCl2-
PyriteAu
Cu
Cu
Cu
A B C
Fig. 18. A cartoon cross section through the stratovolcano that may have hosted the Bawone and Binebase gold deposits. Moderately dipping flows and volcaniclastic units with variable porosity and permeability are crosscut by structures that permitted transfer of heat and fluids (red) upward. The latter caused hydrothermal alteration of the adjacent rocks (pink). Some of the conduits vented at the surface, producing solfataras, whereas others terminated at impermeable barriers, such as the welded andesite tuff in the Bawone deposit, or at perched water tables corresponding to permeable and less permeable/impermeable layers. The small circle in the cross section indicates the location of the large circles, labeled A to C. Circle A illustrates the transport of the metals as hydrated species in magmatic vapor rising through the volcanic pile and condensing at an impermeable boundary. Circle B shows the distribution of rocks altered by highly acidic condensed vapor, and the accom-panying pyrite-hosted gold (copper, silver) mineralization. Finally, Circle C depicts a pyrite crystal with two types of faces onto which copper and gold adsorbed preferentially from a gold-undersaturated condensed vapor to produce gold (copper, silver)-rich sector- and growth-zoned pyrite II. Multiple iterations of this process are likely required to produce an economic high-sulfidation deposit of this style.

HIGH-SULFIDATION EPITHERMAL PYRITE-HOSTED Au ORE FORMATION, SANGIHE ISLAND, INDONESIA 1731
ConclusionsTextural and geochemical observations provide compel-
ling evidence that the Bawone and Binebase gold deposits were the products of a condensed acidic magmatic vapor. This fluid produced the advanced argillic and intermediate argillic alteration that is characteristic of high-sulfidation epi-thermal systems and deposited gold, as well as copper and silver, either within the structure of pyrite or as nanoparticles within this mineral. The fluid did not deposit native gold or electrum (except in very late veins at Binebase) and so we conclude that it was undersaturated in respect to these met-als. Instead of precipitating directly from the fluid, gold and silver were concentrated by adsorption onto the surfaces of growing pyrite (and to a much lesser extent enargite) crystals, where they either formed nanoparticles or substituted for iron in the structure of the mineral. Much of the auriferous pyrite formed during advanced and intermediate argillic alteration as a result of the sulfidation of primary mafic minerals. Aurif-erous pyrite (py II) crystallized later, filling fractures in the earlier formed pyrite, and was joined even later by Au-Ag–bearing enargite that precipitated in reopened pyrite II veins. Although the later pyrite II is richer in Au than pyrite I, and enargite is richer in Ag than both pyrite generations, the pre-cious metals in both minerals are interpreted to have con-centrated from a condensed magmatic vapor by adsorption during crystal growth. The Bawone and Binebase deposits are part of the continuum of high-sulfidation deposits, formed from a condensed magmatic vapor, and record a mineralizing process that likely has contributed to the formation of many other high-sulfidation deposits.
AcknowledgmentsThe authors thank East Asia Minerals for their financial and
logistical support, in particular Tom Mulja for suggesting the project and for his assistance and comments. The field com-ponent of the research would not have been possible without the help of Arodji Wisanggono, Johnnedy Situmorang, Mardy Posumah, Grace Kapal, and the staff on Sangihe Island and in Jakarta. Simon Jackson and Jeanne Percival at the GSC, Boswell Wing and Libby Sharman of the Sulfur Isotope labo-ratory at McGill University, Lang Shi and Jeanne Paquette provided invaluable assistance with the analytical aspects of the research. The project was funded by East Asia Minerals and an NSERC-CRD grant to A.E. Williams-Jones and G. Williams-Jones with additional support by DIVEX. Construc-tive reviews by R. Fifarek, R.W. Henley, and associate editor D. John improved the paper considerably.
REFERENCESAbraitis, P.K., Pattrick, R.A.D., and Vaughan, D.J., 2004, Variations in the
compositional, textural and electrical properties of natural pyrite: A review: International Journal of Mineral Processing, v. 74, p. 41–59.
Agrawal, S., Guevara, M., and Verma, S., 2008, Tectonic discrimination of basic and ultrabasic volcanic rocks through log-transformed ratios of immo-bile trace elements: International Geology Review, v. 50, p. 1057–1079.
Archibald, S., Migdisov, A.A., and Williams-Jones, A.E., 2001, The stability of Au-chloride complexes in water vapor at elevated temperatures and pres-sures: Geochimica et Cosmochimica Acta, v. 65, p. 4413–4423.
Archibald, S.M., Migdisov, A.A., and Williams-Jones, A.E., 2002, An experi-mental study of the stability of copper chloride complexes in water vapor at elevated temperatures and pressures: Geochimica et Cosmochimica Acta, v. 66, p. 1611–1619.
Arribas, A.R., 1995, Characteristics of high-sulphidation epithermal deposits, and their relation to magmatic fluid, in Thompson, J.F.H. ed., Magmas, fluids, and ore deposits, Mineralogical Association of Canada, Short Course, v. 23, p. 419–454.
Audétat, A., Günther, D., and Heinrich, C.A., 1998, Formation of a mag-matic-hydrothermal ore deposit: Insights with LA-ICP-MS analysis of fluid inclusions: Science, v. 279, p. 2091–2094.
Audétat, A., Pettke, T., Heinrich, C.A., and Bodnar, R.J., 2008, Special Paper: The composition of magmatic-hydrothermal fluids in barren and mineral-ized intrusions: Economic Geology, v. 103, p. 877–908.
Beaulieu, S., 2010, InterRidge global database of active submarine hydro-thermal vent fields: prepared for InterRidge, Version 2.0: World Wide Web electronic publication, http://www.interridge.org.IRvents.
Berger, B.R., and Henley, R.W., 2011, Magmatic-vapor expansion and the for-mation of high-sulfidation gold deposits: Structural controls on hydrother-mal alteration and ore mineralization: Ore Geology Reviews, v. 39, p. 75–90.
Bethke, C.M., 2005, The Geochemist’s Workbench Release 6.0: GWB Essen-tials Guide: University of Illinois: Urbana, Illinois.
Bethke, P.M., Rye, R.O., Stoffregen, R.E., and Vikre, P.G., 2005, Evolution of the magmatic-hydrothermal acid-sulfate system at Summitville, Colo-rado: Integration of geological, stable-isotope, and fluid-inclusion evidence: Chemical Geology, v. 215, p. 281–315.
Bi, S.-J., Li, J.-W., Zhou, M.-F., and Li, Z.-K., 2011, Gold distribution in As-deficient pyrite and telluride mineralogy of the Yangzhaiyu gold deposit, Xiaoqinling district, southern North China craton: Mineralium Deposita, v. 46, p. 925–941.
Canfield, D.E., Raiswell, R., Westrich, J.T., Reaves, C.M., and Berner, R.A., 1986, The use of chromium reduction in the analysis of reduced inorganic sulfur in sediments and shales: Chemical Geology, v. 54, p. 149–155.
Chouinard, A., Paquette, J., and Williams-Jones, A.E., 2005a, Crystallo-graphic controls on trace-element incorporation in auriferous pyrite from the Pascua epithermal high-sulphidation deposit, Chile-Argentina: The Canadian Mineralogist, v. 43, p. 951–963.
Chouinard, A., Williams-Jones, A.E., Leonardson, R.W., Hodgson, C.J., Silva, P., Tellez, C., Vega, J., and Rojas, F., 2005b, Geology and genesis of the multistage high-sulfidation epithermal Pascua Au-Ag-Cu deposit, Chile and Argentina: Economic Geology, v. 100, p. 463–490.
Cook, N.J., and Chryssoulis, S.L., 1990, Concentrations of “invisible gold” in the common sulfides: The Canadian Mineralogist, v. 28, p. 1–16.
Cooke, D.R., and Simmons, S.F., 2000, Characteristics and genesis of epith-ermal gold deposits: Reviews in Economic Geology, v. 13, p. 221–244.
Crerar, D.A., and Barnes, H.L., 1976, Ore solution chemistry; V, Solubilities of chalcopyrite and chalcocite assemblages in hydrothermal solution at 200° to 350°C: Economic Geology, v. 71, p. 772–794.
Deditius, A.P., Utsunomiya, S., Renock, D., Ewing, R., Ramana, C., Becker, U., and Kesler, S.E., 2008, A proposed new type of arsenian pyrite: Compo-sition, nanostructure and geological significance: Geochimica et Cosmochi-mica Acta, v. 72, p. 2919–2933.
Deditius, A.P., Utsunomiya, S., Ewing, R.C., Chryssoulis, S.L., Venter, D., and Kesler, S.E., 2009, Decoupled geochemical behavior of As and Cu in hydrothermal systems: Geology, v. 37, p. 707–710.
Deditius, A.P., Utsunomiya, S., Reich, M., Kesler, S.E., Ewing, R.C., Hough, R., and Walshe, J., 2011, Trace metal nanoparticles in pyrite: Ore Geology Reviews, v. 42, p. 32–46.
de Vos, J., van den Hoek Ostende, L.W., and van den Bergh, G.D., 2007, Pattern in insular evolution of mammals: A key to island palaeogeography, in Renema, W. ed., Biogeography, Time, and Place: Distributions, barriers, and islands: Dordrecht, The Netherlands, Springer, p. 315–345.
Deyell, C.L., 2005a, Alunite in the Pascua-Lama high-sulfidation deposit: Constraints on alteration and ore deposition using stable isotope geochem-istry: Economic Geology, v. 100, p. 131–148.
Deyell, C.L., Rye, R.O., Landis, G.P., and Bissig, T., 2005b, Alunite and the role of magmatic fluids in the Tambo high-sulfidation deposit, El Indio–Pascua belt, Chile: Chemical Geology, v. 215, p. 185–218.
Favorov, V.A., Krasnikov, V.I., and Sychugov, V.S., 1974, Variations in semi-conductor properties of pyrite and arsenopyrite and their determinants: International Geology Review, v. 16, p. 385–394.
Fifarek, R.H., and Rye, R.O., 2005, Stable-isotope geochemistry of the Pie-rina high-sulfidation Au–Ag deposit, Peru: Influence of hydrodynamics on SO4
2−–H2S sulfur isotopic exchange in magmatic-steam and steam-heated environments: Chemical Geology, v. 215, p. 253–279.
Fleet, M.E., Chryssoulis, S.L., MacLean, P.J., Davidson, R., and Weisener, C.G., 1993, Arsenian pyrite from gold deposits: Au and As distribution

1732 KING ET AL.
investigated by SIMS and EMP, and color staining and surface oxidation by XPS and LIMS: The Canadian Mineralogist, v. 31, p. 1–17.
Fulignati, P., Gioncada, A., and Sbrana, A., 1998, Geologic model of the mag-matic-hydrothermal system of Vulcano (Aeolian Islands, Italy): Mineralogy and Petrology, v. 62, p. 195–222.
Fulignati, P., Gioncada, A., and Sbrana, A., 1999, Rare-earth element (REE) behaviour in the alteration facies of the active magmatic-hydrothermal sys-tem of Vulcano (Aeolian Islands Italy): Journal of Volcanology and Geother-mal Research, v. 88, p. 325–342.
Gammons, C.H., and Barnes, H.L., 1989, The solubility of Ag2S in near-neu-tral aqueous sulfide solutions at 25 to 300°C: Geochimica et Cosmochimica Acta, v. 53, p. 279–290.
Gammons, C.H., and Williams-Jones, A.E., 1997, Chemical mobility of gold in the porphyry-epithermal environment: Economic Geology, v. 92, p. 45–59.
Garwin, S.L., 1990, South Sangihe Regional Reconnaissance Program: Jakarta, Indonesia, Report for P.T. Meares Soputan Mining, 84 p.
Grant, A., 1986, The isocon diagram: A simple solution to Gresens’ equation for metasomatic alteration: Economic Geology, v. 81, p. 1976–1982.
Hall, R., 1996, Reconstructing Cenozoic Southeast Asia, in Hall, R., and Blundell, D. eds., Tectonic evolution of Southeast Asia: Geological Society, London, Special Publication 106, p. 153–184.
——2000, Neogene history of collision in the Halmahera region, Indonesia, in Proceedings of the Indonesian Petroleum Association 27th Annual Con-vention, Jakarta, Indonesia, p. 487–493.
Hedenquist, J.W., Matsuhisa, Y., Izawa, E., White, N.C., Giggenbach, W.F., and Aoki, M., 1994, Geology, geochemistry, and origin of high sulfidation Cu-Au mineralization in the Nansatsu district, Japan: Economic Geol-ogy, v. 89, p. l–30.
Hedenquist, J.W., Arribas, A.R., and Reynolds, J.T., 1998, Evolution of an intrusion-centered hydrothermal system: Far Southeast-Lepanto porphyry and epithermal Cu-Au deposits, Philippines: Economic Geology, v. 93, p. 373–404.
Hedenquist, J.W., Arribas, A.R., and Gonzalez-Urien, E., 2000, Explora-tion for epithermal ore deposits: Reviews in Economic Geology, v. 13, p. 245–277.
Heinrich, C.A., Günther, D., Audétat, A., Ulrich, T., and Frischknecht, R., 1999, Metal fractionation between magmatic brine and vapor, determined by microanalysis of fluid inclusions: Geology, v. 27, p. 755–758.
Helgeson, H.C., 1978, Summary and critique of the thermodynamic proper-ties of rock-forming minerals: American Journal of Science, v. 278, p. 1–229.
Hemley, J.J., Hostetler, P.B., Gude, A.J., and Mountjoy, W.T., 1969, Some stability relations of alunite: Economic Geology, v. 64, p. 599–612.
Hemley, J.J., and Jones, W.R., 1964, Chemical aspects of hydrothermal altera-tion with emphasis on hydrogen metasomatism: Economic Geology, v. 59, p. 538–569.
Henley, R.W., and Berger, B.R., 2011, Magmatic-vapor expansion and the formation of high-sulfidation gold deposits: Chemical controls on alteration and mineralization: Ore Geology Reviews, v. 39, p. 63–74.
Holland, T.J.B., and Powell, R., 1998, An internally consistent thermody-namic data set for phases of petrological interest: Journal of Metamorphic Geology, v. 16, p. 309–343.
Hopf, S., 1993, Behaviour of rare earth elements in geothermal systems of New Zealand: Journal of Geochemical Exploration, v. 47, p. 333–357.
Hurtig, N., and Williams-Jones, A.E., 2014, An experimental study of the transport of gold through hydration of AuCl in aqueous vapour and vapour-like fluids: Geochimica et Cosmochimica Acta, v. 127, p. 305–325.
Huston, D.L., Sie, S.H., Suter, G.F., Cooke, D.R., and Both, R.A., 1995, Sulfide deposits: Part I. Proton microprobe analyses of pyrite, and part II. Selenium levels in pyrite: Comparison with δ34S values and implications for the source of sulfur in volcanogenic hydrothermal systems: Economic Geology, v. 90, p. 1167–1196.
Jannas, R.R., Beane, R.E., and Ahler, B.A., 1990, Gold and copper mineral-ization at the El Indio deposit, Chile: Journal of Geochemical Exploration, v. 36, p. 233–266.
Johnson, J.W., Oelkers, E.H., and Helgeson, H.C., 1992, SUPCRT92: A soft-ware package for calculating the standard molal thermodynamic properties of minerals, gases, aqueous species, and reactions from 1 to 5000 bar and 0 to 1000°C: Computers & Geosciences, v. 18, p. 899–947.
Karakaya, N., 2009, REE and HFS element behaviour in the alteration facies of the Erenler Dagı Volcanics (Konya, Turkey) and kaolinite occurrence: Journal of Geochemical Exploration, v. 101, p. 185–208.
Kesler, S.E., Russell, N., Seaward, M., Rivera, J., McCurdy, K., Cumming,
G.L., and Sutter, J.F., 1981, Geology and geochemistry of sulfide mineral-ization underlying the Pueblo Viejo gold-silver oxide deposit, Dominican Republic: Economic Geology, v. 76, p. 1096–1117.
Knight, J.E., 1977, A thermochemical study of alunite, enargite, luzonite, and tennantite deposits: Economic Geology, v. 72, p. 1321–1336.
Landtwing, M.R., Furrer, C.F., Redmond, P.B., Pettke, T., Guillong, M., and Heinrich, C.A., 2010, The Bingham Canyon porphyry Cu-Mo-Au deposit: III. Zoned copper-gold ore deposition by magmatic vapor expansion: Eco-nomic Geology, v. 105, p. 91–118.
Lewis, A.J., Palmer, M.R., Sturchio, N.C., and Kemp, A.J., 1997, The rare earth element geochemistry of acid-sulphate and acid-sulphate-chloride geothermal systems from Yellowstone National Park, Wyoming, USA: Geo-chimica et Cosmochimica Acta, v. 61, p. 695–706.
Lottermoser, B.G., 1992, Rare earth elements and hydrothermal ore forma-tion processes: Ore Geology Reviews, v. 7, p. 25–41.
MacLean, W.H., and Kranidiotis, P., 1987, Immobile elements as monitors of mass transfer in hydrothermal alteration: Phelps Dodge massive sulfide deposit, Matagami, Quebec: Economic Geology, v. 82, p. 951–962.
Maske, S., and Skinner, B.J., 1971, Studies of the sulfosalts of copper: I. Phases and phase relations in the system Cu-As-S: Economic Geology, v. 66, p. 901–918.
Mavrogenes, J., Henley, R.W., Reyes, A.G., and Berger, B., 2010, Sulfosalt melts: Evidence of high-temperature vapor transport of metals in the for-mation of high-sulfidation lode gold deposits: Economic Geology, v. 105, p. 257–262.
Meyer, C., and Hemley, J., 1967, Wall rock alteration, in Barnes, H.L., ed., Geochemistry of hydrothermal ore deposits: New York, Holt, Rinehart, and Winston, p. 166–234.
Michard, A., 1989, Rare earth element systematics in hydrothermal fluids: Geochimica et Cosmochimica Acta, v. 53, p. 745–750.
Migdisov, A.A., and Williams-Jones, A.E., 2013, A predictive model for trans-port of silver chloride by aqueous vapor in ore-forming magmatic-hydrother-mal systems: Geochimica et Cosmochimica Actamica, v. 104, p. 123–135.
Migdisov, A.A., Williams-Jones, A.E., and Suleimenov, O.M., 1999, Solubility of chlorargyrite (AgCl) in water vapor at elevated temperatures and pres-sures: Geochimica et Cosmochimica Acta, v. 63, p. 3817–3827.
Migdisov, A.A., Williams-Jones, A.E., and Wagner, T., 2009, An experimental study of the solubility and speciation of the rare earth elements (III) in fluo-ride- and chloride-bearing aqueous solutions at temperatures up to 300°C: Geochimica et Cosmochimica Acta, v. 73, p. 7087–7109.
Miller, S.E., Heath, G.R., and Gonzalez, R.D., 1982, Effects of temperature on the sorption of lanthanides by montmorillonite: Clays and Clay Minerals, v. 30, p. 111–122.
Moritz, R., Kouzmanov, K., and Petrunov, R., 2004, Late Cretaceous Cu-Au epithermal deposits of the Panagyurishte district, Srednogorie zone, Bul-garia: Swiss Bulletin of Mineralogy and Petrology, v. 84, p. 79–99.
Morrice, M.G., and Gill, J.B., 1986, Spatial patterns in the mineraloogy of island arc magma series: Sangihe Arc, Indonesia: Journal of Volcanology and Geothermal Research, v. 29, p. 311–353.
Morrice, M.G., Jezek, P.A., Gill, J.B., Whitford, D.J., and Monoarfa, M., 1983, An introduction to the Sangihe Arc: Volcanism accompanying arc-arc collision in the Molucca Sea, Indonesia: Journal of Volcanology and Geo-thermal Research, v. 19, p. 135–165.
Mountain, B.W., and Seward, T.M., 2003, Hydrosulfide/sulfide complexes of copper (I): Experimental confirmation of the stoichiometry and stability of Cu (HS)2– to elevated temperatures: Geochimica et Cosmochimica Acta, v. 67, p. 3005–3014.
Muntean, J.L., Kesler, S.E., and Russell, N., 1990, Evolution of the Monte Negro acid sulfate Au-Ag deposit, Pueblo Viejo, Dominican Republic: Important factors in grade development: Economic Geology, v. 85, p. 1738–1758.
Oberthür, T., Weiser, T., Amanor, J., and Chryssoulis, S., 1997, Mineralogi-cal setting and distribution of gold in quartz veins and sulfide ores of the Ashanti mine and other deposits in the Ashanti belt of Ghana: Genetic implications: Mineralium Deposita, v. 32, p. 2–15.
Pacevski, A., Libowitzky, E., Zivkovic, P., Dimitrijevic, R., and Cvetkovic, L., 2008, Copper-bearing pyrite from the Coka Marin polymetallic deposit, Serbia: Mineral inclusions or true solid-solution?: The Canadian Mineralo-gist, v. 46, p. 249–261.
Pals, D.W., Spry, P.G., and Chryssoulis, S.L., 2003, Invisible gold and tel-lurium in arsenic-rich pyrite from the Emperor gold deposit, Fiji: Implica-tions for gold distribution and deposition: Economic Geology, v. 98, p. 479–493.
HIGH-SULFIDATION EPITHERMAL PYRITE-HOSTED Au ORE FORMATION, SANGIHE ISLAND, INDONESIA 1733
Posfai, M., and Buseck, P.R., 1998, Relationships between microstructure and composition in enargite and luzonite: The American Mineralogist, v. 83, p. 373–382.
Radcliff, D., and McSween, H.T., 1970, Copper zoning in pyrite from Cerro de Pasco, Peru: Reply: The American Mineralogist, v. 55, p. 527–528.
Reich, M.R., Kesler, S.E., Utsunomiya, S., Palenik, C.S., Chryssoulis, S.L., and Ewing, R., 2005, Solubility of gold in arsenian pyrite: Geochimica et Cosmochimica Acta, v. 69, p. 2781–2796.
Robie, R.A., and Hemingway, B.S., 1995, Thermodynamic properties of min-erals and related substances at 298.15 K and 1 Bar (105 Pascals) pressure and at higher temperatures: U.S. Geological Survey Bulletin 2131, p. 461.
Rye, R.O., 1993, The evolution of magmatic fluids in the epithermal envi-ronment: The stable isotope perspective: Economic Geology, v. 88, p. 733–752.
——2005, A review of the stable-isotope geochemistry of sulfate minerals in selected igneous environments and related hydrothermal systems: Chemi-cal Geology, v. 215, p. 5–36.
Rye, R.O., Bethke, P.M., and Wasserman, M.D., 1992, The stable isotope geochemistry of acid sulfate alteration: Economic Geology, v. 87, p. 225–262.
Salaün, A., Villemant, B., Gérard, M., Komorowski, J.-C., and Michel, A., 2011, Hydrothermal alteration in andesitic volcanoes: Trace element redistribution in active and ancient hydrothermal systems of Guadeloupe (Lesser Antilles): Journal of Geochemical Exploration, v. 111, p. 59–83.
Salvi, S., Pokrovski, G.S., and Schott, J., 1998, Experimental investigation of aluminum-silica aqueous complexing at 300°C: Chemical Geology, v. 151, p. 51–67.
Scher, S., Williams-Jones, A.E., and Williams-Jones, G., 2013, Fumarolic activity, acid-sulfate alteration, and high sulfidation epithermal precious metal mineralization in the crater of Kawah Ijen volcano, Java, Indonesia: Economic Geology, v. 108, p. 1099–1118.
Seo, J.H., Guillong, M., and Heinrich, C.A., 2009, The role of sulfur in the formation of magmatic–hydrothermal copper–gold deposits: Earth and Planetary Science Letters, v. 282, p. 323–328.
Sharman, E.R., 2011, Application of multiple sulfur isotope analysis to Archean ore-forming processes: Unpublished Ph.D. Thesis, Montréal, Canada, McGill Univesity, 196 p.
Simon, G., Huang, H., Penner-Hahn, J.E., Kesler, S.E., and Kao, L.-S., 1999, Oxidation state of gold and arsenic in gold-bearing arsenian pyrite: Ameri-can Mineralogist, v. 84, p. 1071–1079.
Springer, G., 1969, Compositional variations in enargite and luzonite: Min-eralium Deposita, v. 4, p. 72–74.
Stefánsson, A., and Seward, T.M., 2004, Gold(I) complexing in aqueous sul-phide solutions to 500°C at 500 bar: Geochimica et Cosmochimica Acta, v. 68, p. 4121–4143.
Stoffregen, R.E., 1987, Genesis of acid-sulfate alteration and Au-Cu-Ag mineralization at Summitville, Colorado: Economic Geology, v. 82, p. 1575–1591.
Stoffregen, R.E., and Alpers, C.N., 1987, Woodhouseite and svanbergite in hydrothermal ore deposits: Products of apatite destruction during advanced argillic alteration: The Canadian Mineralogist, v. 25, p. 201–211.
Stoffregen, R.E., and Cygan, G.L., 1990, An experimental study of Na-K exchange between alunite and aqueous sulfate solutions: The American Mineralogist, v. 75, p. 209–220.
Stoffregen, R.E., Alpers, C.N., and Jambor, J.L., 2000, Alunite-jarosite crys-tallography, thermodynamics, and geochronology: Reviews in Mineralogy and Geochemistry, v. 40, p. 453–479.
Stone, M., 2010, Sangihe property, Sangihe Island, North Sulawesi, Indone-sia: Independent technical report, 130 p.
Taylor, B.E., 2007, Epithermal gold deposits, in Goodfellow, W.D. ed., Min-eral deposits of Canada: A synthesis of major deposit-types, district metal-logeny, the evolution of geological provinces, and exploration methods: Geological Association of Canada, Mineral Deposits Division, St. John’s, p. 113–139.
Thiersch, P.C., Williams-Jones, A.E., and Clark, J.R., 1997, Epithermal min-eralization and ore controls of the Shasta Au-Ag deposit, Toodoggone Dis-trict, British Columbia, Canada: Mineralium Deposita, v. 32, p. 44–57.
Thode, H.G., Monster, J., and Dunford, H.B., 1961, Sulphur isotope geo-chemistry: Geochimica et Cosmochimica Acta, v. 25, p. 150–174.
Thode, H.G., and Rees, C., 1979, Sulphur isotopes in lunar and meteorite samples: Proceedings of Lunar Planetary Science Conference 10th, Hous-ton, Texas, March 13–17, 1979, p. 1629–1636.
Ulrich, T., Gunther, D., and Heinrich, C.A., 1999, Gold concentrations of magmatic brines and the metal budget of porphyry copper deposits: Nature, v. 399, p. 676–679.
van Hinsberg, V.J., and Schumacher, J.C., 2007, Intersector element parti-tioning in tourmaline: A potentially powerful single crystal thermometer: Contributions to Mineralogy and Petrology, v. 153, p. 289–301.
Voudouris, P.C., 2010, Conditions of formation of the Mavrokoryfi high-sulfidation epithermal Cu-Ag-Au-Te mineralization (Petrota Graben, NE Greece): Mineralogy and Petrology, v. 101, p. 97–113.
Warren, I., Simmons, S.F., and Mauk, J.L., 2007, Whole-rock geochemical techniques for evaluating hydrothermal alteration, mass changes, and com-positional gradients associated with epithermal Au-Ag mineralization: Eco-nomic Geology, v. 102, p. 923–948.
White, D., 1957, Thermal waters of volcanic origin: Geological Society of America Bulletin, v. 68, p. 1637–1657.
White, N.C., and Hedenquist, J.W., 1990, Epithermal environments and styles of mineralization: Variations and their causes, and guidelines for exploration: Journal of Geochemical Exploration, v. 36, p. 445–474.
Wilder, A.M., and Seward, T.M., 2002, The adsorption of gold(I) hydrosulfide complexes by iron sufide surfaces: Geochimica et Cosmochimica Acta, v. 66, p. 383–402.
Williams-Jones, A.E., and Heinrich, C.A., 2005, Vapor transport of metals and the formation of magmatic-hydrothermal ore deposits: Economic Geology, v. 100, p. 1287–1312.
Williams-Jones, A.E., Migdisov, A.A., Archibald, S.A., and Xiao, Z., 2002, Vapor-transport of ore metals, in Hellmann, R., and Wood, S.A. eds., Water-rock interactions, ore deposits, and environmental geochemistry: A tribute to David A. Crerar: The Geochemical Society, p. 279–306.
Williams-Jones, A.E., Bowell, R.J., and Migdisov, A.A., 2009, Gold in solu-tion: Elements, v. 5, p. 281–287.
Zezin, D., Migdisov, A.A., and Williams-Jones, A.E., 2011a, PVTx proper-ties of H2O-H2S fluid mixtures at elevated temperature and pressure based on new experimental data: Geochimica et Cosmochimica Acta, v. 75, p. 5483–5495.
——2011b, The solubility of gold in H2O-H2S vapour at elevated tempera-ture and pressure: Geochimica et Cosmochimica Acta, v. 75, p. 5140–5153.
Zhang, X., 1993, SULF34: A QUICKBASIC program for calculating sulfur isotope distribution in log fO2-pH diagram: Computers & Geosciences, v. 19, p. 817–823.
Zotov, N., Petrov, K., and Dimitrova-Pankova, M., 1990, Infrared spectra of Cu (II)-Co (II) mixed hydroxide nitrates: Journal of Physics and Chemistry of Solids, v. 51, p. 1199–1205.