high-speed force spectroscopy unfolds titin at the
TRANSCRIPT
High-speed force spectroscopy unfolds titin at the
velocity of molecular dynamics simulations.
Felix Rico, Laura Gonzalez, Ignacio Casuso, Manel Puig-Vidal, Simon
Scheuring
To cite this version:
Felix Rico, Laura Gonzalez, Ignacio Casuso, Manel Puig-Vidal, Simon Scheuring. High-speedforce spectroscopy unfolds titin at the velocity of molecular dynamics simulations.: Experimentmeets simulation: HS-FS. Science, American Association for the Advancement of Science, 2013,342 (6159), pp.741-3. <10.1126/science.1239764>. <inserm-01309044>
HAL Id: inserm-01309044
http://www.hal.inserm.fr/inserm-01309044
Submitted on 28 Apr 2016
HAL is a multi-disciplinary open accessarchive for the deposit and dissemination of sci-entific research documents, whether they are pub-lished or not. The documents may come fromteaching and research institutions in France orabroad, or from public or private research centers.
L’archive ouverte pluridisciplinaire HAL, estdestinee au depot et a la diffusion de documentsscientifiques de niveau recherche, publies ou non,emanant des etablissements d’enseignement et derecherche francais ou etrangers, des laboratoirespublics ou prives.

Rico et al. 2013 – Experiment meets simulation: HS-FS – Science
1
High-speed force spectroscopy unfolds titin at the velocity of molecular dynamics simulations
Felix Rico1, Laura Gonzalez2, Ignacio Casuso1, Manel Puig-Vidal2 & Simon Scheuring1*
1 U1006 INSERM, Université Aix-Marseille, Parc Scientifique et Technologique de Luminy, 163
avenue de Luminy, 13009 Marseille, France 2 Bioelectronics Group, Department of Electronics, Universitat de Barcelona, c/ Marti Franques
1, 08028 Barcelona, Spain
*Correspondence should be addressed to S. Scheuring
Email: [email protected]
Tel.: ++33-4-91828777, Fax: ++33-4-91828701
Rico et al. 2013 – Experiment meets simulation: HS-FS – Science
2
(Abstract) The mechanical unfolding of muscle protein titin by atomic force microscopy
(AFM) was a landmark in our developing understanding of single biomolecule
mechanics. Molecular dynamics simulations offered atomic-level descriptions of
the forced unfolding. However, experiment and simulation could not be directly
compared because they differed in pulling velocity by orders of magnitude. We
have developed high-speed force spectroscopy (HS-FS) to unfold titin at
velocities reached by simulation (~4 mm/s). We show that a small β-strand pair
of an Ig domain dynamically unfolds and refolds, buffering pulling forces up to
~100pN. The distance to the unfolding barrier is larger than previously
estimated, but in better agreement with atomistic predictions. The ability to
directly compare experiment and simulation is likely to be important in studying
biomechanical processes.
(OneSentenceSummary) Experimentally accessing timescales previously only accessible to simulations
suggests roughness in the energy landscape.
Rico et al. 2013 – Experiment meets simulation: HS-FS – Science
3
(MainText) Titin is a molecular spring in muscle sarcomeres important in striated muscle
function and implicated in diseases such as heart failure (1). Titin composes
~300 modules including immunoglobulin (Ig)-type, fibronectin III-type and PEVK
domains (2). Force spectroscopy (FS) unfolding of individual titin molecules,
using optical tweezers (3, 4) and AFM (5) opened a new research field relating
protein mechanics, structure and folding. AFM force-extension curves revealed
saw-tooth-like patterns (periodicity 25-28 nm), reporting the unfolding of
individual Ig-like domains (5). Combination of AFM experiments with steered
molecular dynamics (SMD) simulations enriched atomic level descriptions (6-8)
of receptor/ligand binding (9, 10) and forced protein unfolding (5). Forced
unfolding (pulling speed 0.3-0.5 µm/s) of titin I91 (8, 11, 12) resulted in ~0.7 nm
extension of each domain which correlated with the separation of antiparallel β-
strands A and B observed in SMD simulations (8, 11). Subsequent rupture of
the A’-G β-strand pair lead to complete domain unfolding (11, 13, 14). However,
about six orders of magnitude velocity difference prevented direct comparison
of SMD with FS. Indeed, simulations resulted in unfolding forces of ~1 nN,
nearly one order of magnitude higher than experimental values (11, 12).
Improved computational abilities have allowed simulations which unfolded I91
at 2800 µm/s (still ~2.5 orders of magnitude faster than experiment) reporting
forces of ~500 pN (15).
High-speed AFM (HS-AFM; (16)) allows imaging biomolecules at video rate (17-
19), through miniaturization of piezoelectric elements and the cantilever (20).
Based on HS-AFM, we developed HS-FS with short cantilevers (21). This
allowed pulling titin molecules at speeds up to ~4000 µm/s, about 2.5 orders of
magnitude faster than conventional AFM and reaching current limits for SMD
simulations.
Our HS-FS setup is composed of a miniature piezoelectric actuator and a short
cantilever with small viscous damping (0.035 pN/(µm/s)) (Fig. 1A, Fig. S1 and
Fig. S2). Using HS-FS titin I91 concatemers were unfolded at pulling velocities

Rico et al. 2013 – Experiment meets simulation: HS-FS – Science
4
ranging over six orders of magnitude, from 0.0097 µm/s to 3870 µm/s. Only
force curves with at least 3 saw-tooth-like unfolding peaks were analyzed (22)
(Fig. 1B, Fig. S3). As reported before (5, 23), unfolding forces increased with
pulling velocity (Fig. 2A). At slow velocities, HS-FS unfolding forces are in
excellent agreement with conventional FS (Fig. 2B). At pulling velocities higher
than previously (> 100 µm/s), unfolding forces follow a steeper slope that reach
values over 500 pN and overlap with those obtained by simulations (Fig. 2B). A
varying slope in the plot of mean rupture forces versus the logarithm of the
velocity (force spectrum) have been observed for receptor/ligand interactions
(24-26), but have rarely been documented for protein unfolding (27), probably
due to the limited range of accessible pulling rates. The microscopic model
developed by Hummer and Szabo (26, 28) allowed us to fit the wide range of
pulling velocities and describes well the nonlinear upturn in the dynamic force
spectrum (26, 28) (Fig. 2B and SI, Data Analysis). According to this theory, at
moderate velocities, unfolding is dominated by the pulling rate and stochastic
fluctuations, i.e. spontaneous unfolding of the domain under a given force. At
high velocities, stochastic fluctuations of the protein along the unfolding
pathway become irrelevant and the unfolding process becomes deterministic
(28), because the protein is pulled so fast that it has no time to explore its
energy landscape. Importantly, as the slope in the dynamic force spectrum is
related to the position of the energy barrier, the slope upturn at high velocities
corresponds to a shift of the barrier closer to the native state. From our data, the
regime transition occurs at experimental velocities ~1000 µm/s and a critical
force of ~350 pN (SI). Our fastest experiment at 3870 µm/s is situated at the
beginning of the deterministic regime, while most of the HS-FS data points
characterize the transition from the stochastic to the deterministic regimes
(Fig. 2B). SMD simulations at much higher velocities (>>1000 µm/s) have
generally been carried out in this deterministic regime. Although SMD
simulation derived forces are in agreement with our fastest pulling data, the
theoretically predicted trend deviates from simulations at velocities >104 µm/s.
These deviations may be explained by slight differences in the simulated
conditions (e.g. temperature) or by the simple cusp-shape of the potential in the
Rico et al. 2013 – Experiment meets simulation: HS-FS – Science
5
theory. More refined theories may be necessary to describe the unfolding at
very high velocities. The model fit results in an energy landscape where the
unfolding transition barrier (xβ) is located at 0.89 nm and the molecular elasticity
(km) is 376 pN/nm, leading to an unfolding barrier height (ΔG) of 36 kBT, and a
spontaneous unfolding rate k0 of 2·10-10 s-1 (Fig. S4). Similar values were
obtained by fitting a unified model valid for different potential shapes (28) to the
unfolding forces at velocities ≤100 µm/s, suggesting that the reported
parameters are independent of the potential shape (Fig. S6). Our barrier
position (0.89 nm) is larger than previous experimental estimates (0.25 nm (23);
0.30 nm (5)) but in better agreement with the distance (1.1-1.4 nm) at which the
secondary structure of I91 breaks in simulations (8, 15). The relatively narrow
range of experimental velocities in former FS experiments did not show an
upturn in the force spectra and hence justified the Bell-Evans assumption of a
fixed distance to the transition barrier under force. Our experiments at higher
velocities show that this assumption is not valid. Furthermore, the data allowed
us to estimate a diffusion coefficient of the protein along the reaction coordinate
of the free energy landscape D ~ 4x10³ nm2/s (SI). This is orders of magnitude
slower than diffusion coefficients of proteins in solution (~108 nm2/s) (29). Slow
diffusion has been interpreted as a result of cantilever viscous damping (30) or
by local minima along the unfolding pathway (31). Given the much smaller
damping coefficient of the cantilevers used here, our data supports the
hypothesis that roughness in the free energy landscape slows unfolding.
Although our estimated barrier height (36.4 kBT) is similar to that measured from
chemical unfolding (37 kBT), the intrinsic unfolding rate (2·10-10 s-1) is much
slower than estimates from FS at slow pulling velocity (3.3·10-4 s-1) and
chemical unfolding (4.9·10-4 s-1) (23). The fast intrinsic dissociation rate from
slow FS and Bell-Evans analysis suggests an oversimplified view of forced
unfolding, while chemical unfolding explores unrestricted unfolding pathways
different from the physiologically relevant directional unfolding during muscle
relaxation. Indeed, our slow k0 suggests that the titin I91 domains unfold only
very rarely at the estimated physiological forces (~5 pN) acting on distal titin Ig
domains (32).
Rico et al. 2013 – Experiment meets simulation: HS-FS – Science
6
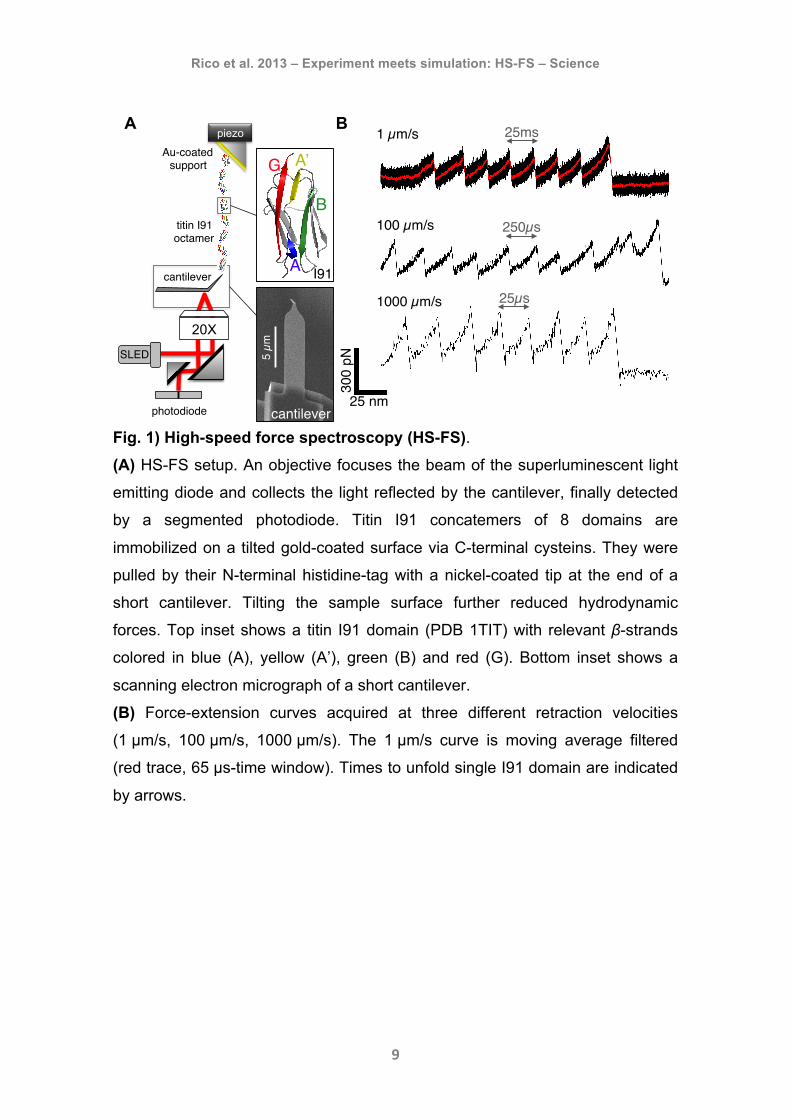
The use of short cantilevers with fast response (τc~0.7 µs, Fig. 1) allowed us
not only to pull fast but also at conventional velocities (10 to 1000 nm/s) with µs
time-resolution. This response time is almost three orders of magnitude shorter
than that of conventional cantilevers and allowed estimating a lower limit of the
relaxation time of the unfolded polypeptide chain (< 2µs, Fig. S3). Before
complete domain unfolding, an intermediate state has previously been
documented by the so-called “hump” in force curves (Fig. 3A, arrows). This
intermediate state is characterized by a force drop in the stretching regime
(Fig. 3A, arrows), caused by the separation of the A-B β-strand pair as revealed
by simulations (11, 12). HS-FS measurements show separation of the A-B β-
strand pair in several domains within one microsecond (Fig. 3B, first peak).
Additionally, at high retraction speeds (>1 mm/s), not only the first domain
presented a “hump” before unfolding but also consecutive domains. The
percentage of domains displaying intermediate unfolding decreased from ~95%
at the lowest to ~40% at the highest velocities. At 2 mm/s, the time between
domain unfolding is ~10 µs (Fig. 3B). Thus, this short time-lapse following the
preceding domain unfolding is enough for refolding domains into their native
state. This result allows us to set the lower limit for the refolding rate from the
intermediate to the native state to at least ~105 s-1, much faster than previous
estimates (25 s-1) (11).
We analyzed the intermediate unfolding state up to 2000 µm/s, beyond this
velocity it is difficult to assess an accurate measurement (Fig. 3, Fig. S3). At
conventional pulling velocities the average unfolding forces to the intermediate
are independent of pulling rate. At velocities faster than ~100 µm/s, average
”hump” forces increase drastically, reaching values up to ~300 pN (Fig. 3C),
consistent with “hump” forces observed in simulations (15). The slow pulling
regime (<100 µm/s) is dominated by near-equilibrium unfolding and refolding of
the A-B β-strand pair and defines the equilibrium force (Fig. 3A). At higher
velocities refolding of the A-B β-strand pair is negligible and the structure
unfolds stochastically at forces that increase with the logarithm of the pulling
rate (33) (Fig. 3C and SI). The model fitted our results with an unfolding rate at
Rico et al. 2013 – Experiment meets simulation: HS-FS – Science
7
zero force from native to intermediate kNI0 of 7·103 s-1, an even faster folding
rate of kIN0 of 4·105 s-1, a distance to the transition barrier of only 0.06 nm, and
an equilibrium force of 113 pN where kNI0 = kIN
0 = 2.8·104 s-1. This results in an
equilibrium free energy difference between the native and intermediate states of
~4.1 kBT, in agreement with the expected energy of three hydrogen bonds.
Although the absolute values of the calculated rates should be interpreted with
care, the refolding rate of 4·105 s-1 is in excellent agreement with the lower limit
(~105 s-1) determined directly through observation of reformed A-B β-strand
pairs in high-velocity unfolding traces (Fig. S3). This suggests fast dynamic
equilibrium of β-strands A and B at pulling forces up to (~100 pN), probably
maintained by the antiparallel structure, consistent with equilibration and during
pulling in SMD runs (12, 15). Furthermore, a recent computational small protein
folding study reported a 21 µs average time to fold an antiparallel three β-strand
domain (34). This suggests a novel insight in the β-sheet A-B and maybe short
β-folds in general: unfolding at fast and refolding at even faster rates as a
feature of their structural equilibrium.
The combination of SMD with experimental FS has been important in
understanding protein unfolding and mechanical stability. Our HS-FS
methodology provides pulling velocities over six orders of magnitude and
provides µs time resolution achieving rates comparable to SMD simulations,
and thus allowing direct comparison of experimental and simulated unfolding
forces. We expect that the now accessible dynamic range of HS-FS will
stimulate the development of novel theories. Our results propose detailed
mechanisms of the various steps during titin I91 unfolding: At zero and
moderate forces, the protein fluctuates between the native and intermediate
states. Under increasing force, only the intermediate state is populated. Thus
the tethered molecule reveals slow diffusion along the unfolding pathway that
combined to a high energy barrier results in high mechanical stability. Direct
comparison of FS and SMD simulations will likely provide new insights into
other important biological processes, such as lipid membrane dynamics (35)
and receptor/ligand unbinding (7, 9).

Rico et al. 2013 – Experiment meets simulation: HS-FS – Science
8
Rico et al. 2013 – Experiment meets simulation: HS-FS – Science
9
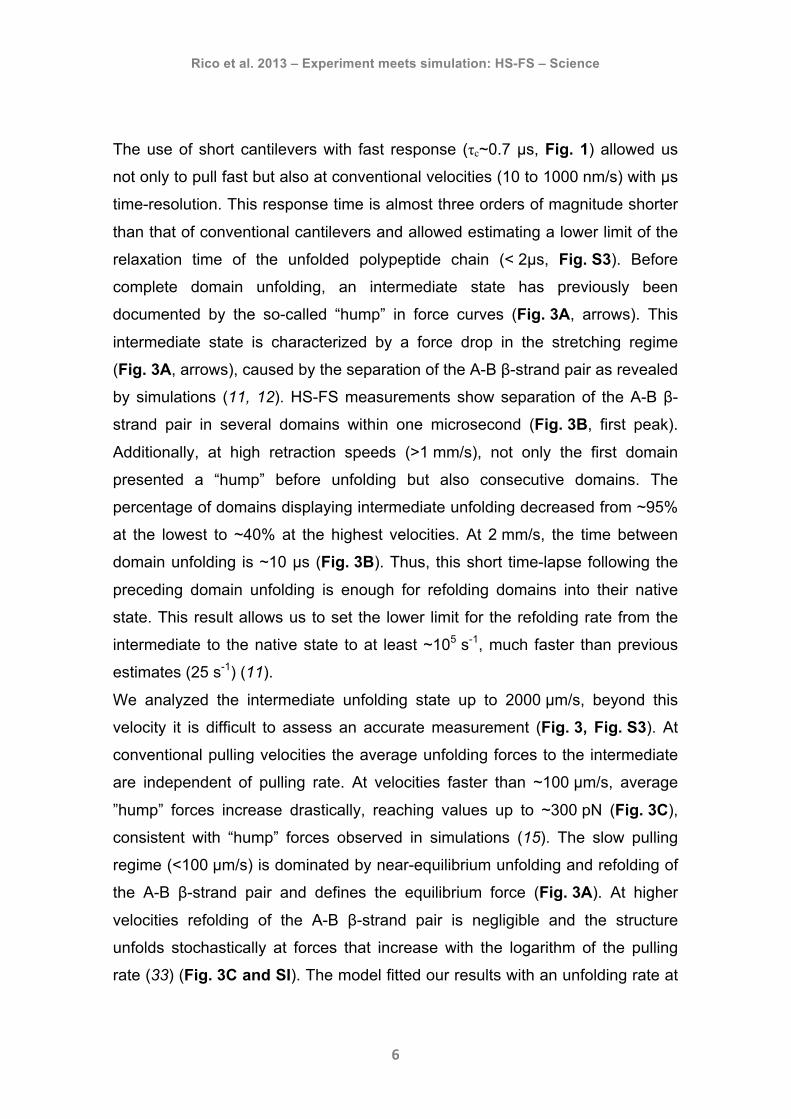
Fig. 1) High-speed force spectroscopy (HS-FS). (A) HS-FS setup. An objective focuses the beam of the superluminescent light
emitting diode and collects the light reflected by the cantilever, finally detected
by a segmented photodiode. Titin I91 concatemers of 8 domains are
immobilized on a tilted gold-coated surface via C-terminal cysteins. They were
pulled by their N-terminal histidine-tag with a nickel-coated tip at the end of a
short cantilever. Tilting the sample surface further reduced hydrodynamic
forces. Top inset shows a titin I91 domain (PDB 1TIT) with relevant β-strands
colored in blue (A), yellow (A’), green (B) and red (G). Bottom inset shows a
scanning electron micrograph of a short cantilever.
(B) Force-extension curves acquired at three different retraction velocities
(1 µm/s, 100 µm/s, 1000 µm/s). The 1 µm/s curve is moving average filtered
(red trace, 65 µs-time window). Times to unfold single I91 domain are indicated
by arrows.
Figure 1
25 nm!
300
pN!
1000 µm/s!
100 µm/s!
1 µm/s!A B 25ms!
250µs!
25µs!
piezo
5 µm
!I91!
titin I91!octamer!
cantilever
Au-coated!support!
photodiode cantilever!
A’
A
G
B
SLED!
20X
Rico et al. 2013 – Experiment meets simulation: HS-FS – Science
10
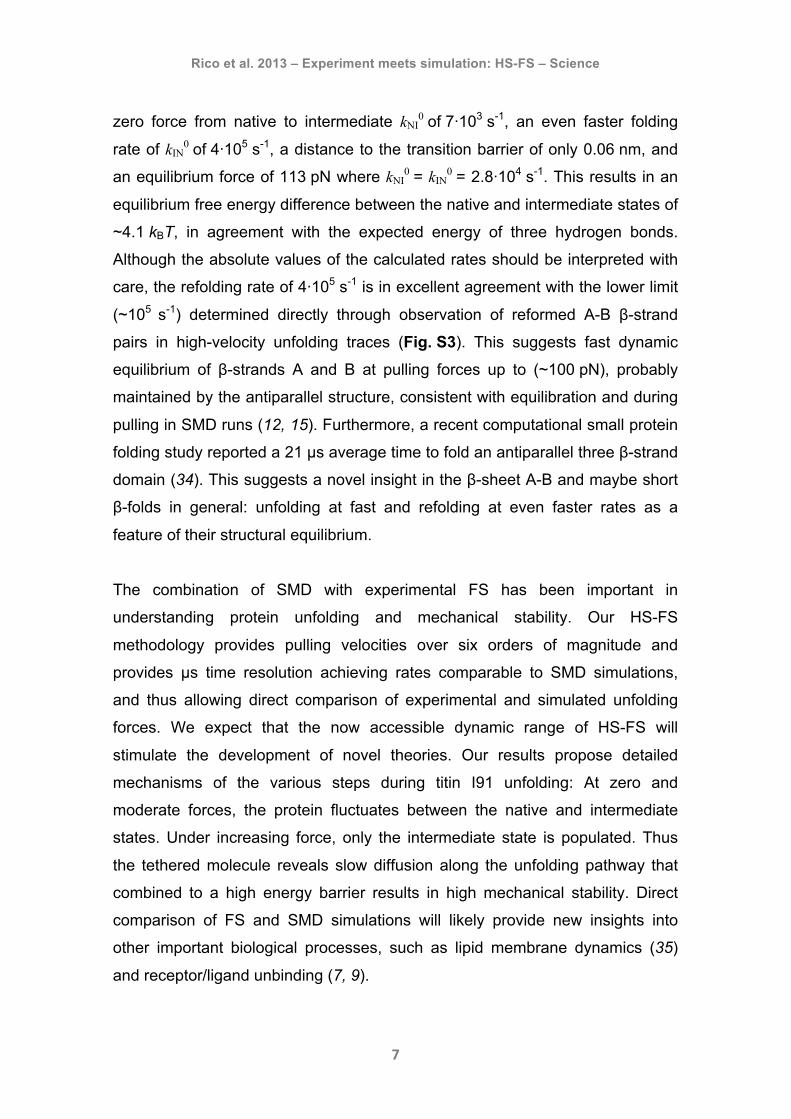
Fig. 2) High-speed dynamic force spectrum of titin I91. (A) Unfolding force histograms of the 1 µm/s, 100 µm/s and 1000 µm/s
retraction velocity experiments.
(B) Average unfolding forces versus retraction velocity obtained using HS-FS
(●, error bars denote standard deviations), conventional FS (□) and steered
molecular dynamics simulations (△, data from Lee et al. (15)). Solid red line is
the fit to the entire dynamic range of HS-FS with the full microscopic model (26)
with fitting parameters (± SD) of xβ = 0.89 ± 0.05 nm, D = 3925 ± 183 nm2/s and
km = 376 ± 28 pN/nm.
800
600
400
200
0
Fo
rce
(p
N)
10-3 10
-1 101 10
3 105
Velocity (µm/s)
experiment (HS-FS) experiment (conventional FS) simulation (Lee et al. 2009)
600400200
Force (pN)
1000 µm/s!
100 µm/s!
1 µm/s!
A B
Figure 2

Rico et al. 2013 – Experiment meets simulation: HS-FS – Science
11
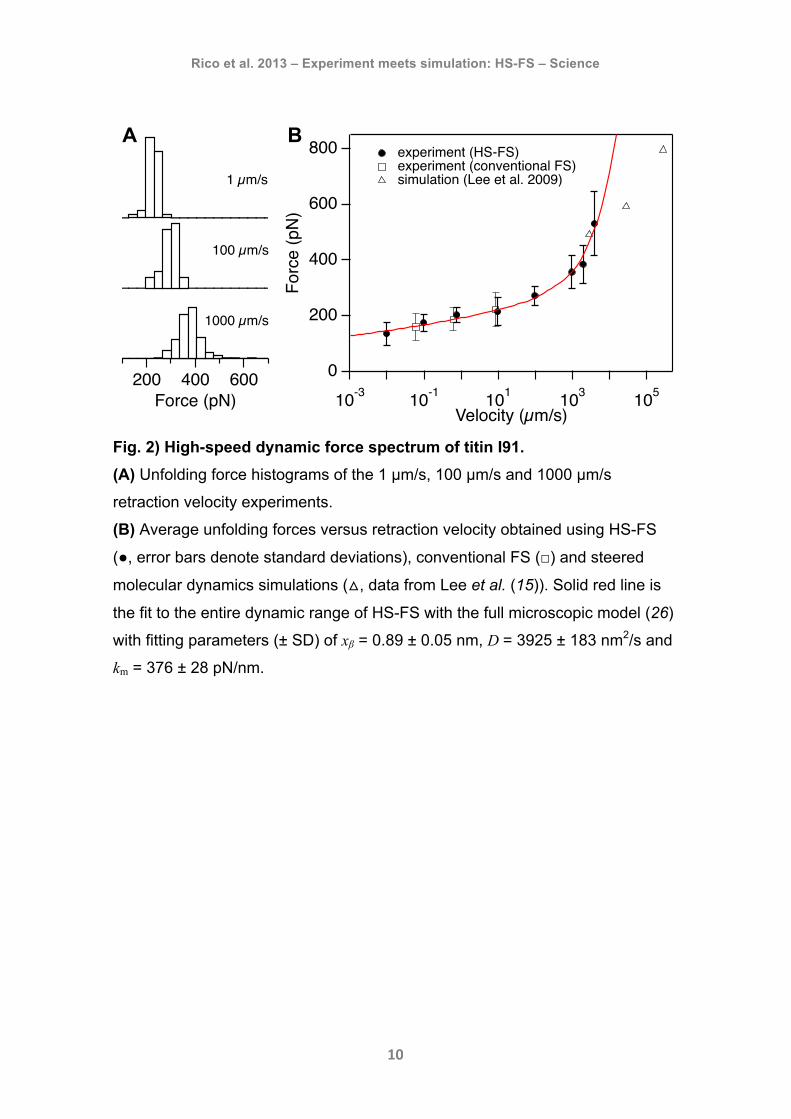
Fig. 3) High-speed force spectroscopy of unfolding intermediate. (A) (Left) Force-extension trace at 1 µm/s (moving average filtered with 65 µs-
time window) showing the intermediate unfolding state “hump” (arrow)
separating antiparallel β-strands A and B. Cantilever fluctuations above the
noise level of the trace are interpreted as hopping between intermediate states
of the remaining folded domains (see Fig. S5). Colored lines are worm-like
chain (WLC) model fits. (Right) Force-extension trace (black line) at 1000 µm/s
showing the intermediate unfolding state “hump” (arrow). Red lines are the best
200p
N
5nm
1000 µm/s
13µs!
2000 µm/s!
A
350300250200150100
50
Forc
e (p
N)
10-2 10-1 100 101 102 103 104
Velocity (µm/s)
B
100p
N
5nm
1 µm/s
Figure 3
C
25 nm! 300 pN!

Rico et al. 2013 – Experiment meets simulation: HS-FS – Science
12
fits of the WLC model to the hump and complete unfolding peaks. The
difference between the contour lengths is consistent with a separation of n
times 0.7 nm of each A-B β-strand pair of the remaining folded domains (11).
(B) Force-extension curve at 2000 µm/s showing unfolding of four I91 domains.
Red lines are WLC fits to the “hump” and complete unfolding peaks. The
contour length distance difference between the “hump” and the complete
unfolding decreases with the decreasing number of remaining folded domains.
(C) Dynamic force spectrum of the intermediate unfolding state. Solid red line is
the best fit of the model developed by Friddle et al. (33) to the experimental
data with fitting parameters (± SD) xt = 0.060 ± 0.004 nm, feq = 113 ± 1 pN and
kNI =
€
6959 −990+1398( ) s-1.
References 1. D.S.Hermanetal.,NewEngl.J.Med.366,619(2012).2. K.Maruyamaetal.,J.Biochem.(Tokyo).82,317(1977).3. M.s.S.Z.Kellermayer,S.B.Smith,H.L.Granzier,C.Bustamante,Science
276,1112(1997).4. L.Tskhovrebova,J.Trinick,J.A.Sleep,R.M.Simmons,Nature387,308
(1997).5. M.Rief,M.Gautel,F.Oesterhelt,J.M.Fernandez,H.E.Gaub,Science276,
1109(1997).6. H.Grubmuller,B.Heymann,P.fTavan,Science271,997(1996).7. S.Izrailev,S.Stepaniants,M.Balsera,Y.Oono,K.Schulten,Biophys.J.72,
1568(1997).8. H.Lu,B.Isralewitz,A.Krammer,V.Vogel,K.Schulten,Biophys.J.75,662
(1998).9. E.L.Florin,V.T.Moy,H.E.Gaub,Science264,415(1994).10. G.U.Lee,L.A.Chrisey,R.J.Colton,Science266,771(1994).11. P.E.Marszaleketal.,Nature402,100(1999).12. H.Lu,K.Schulten,Biophys.J.79,51(2000).13. S.B.Fowleretal.,J.Mol.Biol.322,841(2002).14. R.B.Bestetal.,J.Mol.Biol.330,867(2003).15. E.H.Lee,J.Hsin,M.Sotomayor,G.Comellas,K.Schulten,Structure17,1295
(2009).16. T.Andoetal.,ProceedingsoftheNationalAcademyofSciences98,12468
(2001).17. T.Uchihashi,R.Iino,T.Ando,H.Noji,Science333,755(2011).18. N.Kodera,D.Yamamoto,R.Ishikawa,T.Ando,Nature468,72(2010).19. I.Casusoetal.,NatNano7,525(2012).20. T.Ando,T.Uchihashi,T.Fukuma,Prog.Surf.Sci.83,337(2008).21. M.B.Vianietal.,J.Appl.Phys.86,2258(1999).

Rico et al. 2013 – Experiment meets simulation: HS-FS – Science
13
22. R.B.Bestetal.,Anal.Chim.Acta479,87(2003).23. M.Carrion-Vazquezetal.,ProceedingsoftheNationalAcademyofSciences
96,3694(1999).24. R.Merkel,P.Nassoy,A.Leung,K.Ritchie,E.Evans,Nature397,50(1999).25. X.H.Zhang,E.Wojcikiewicz,V.T.Moy,Biophys.J.83,2270(2002).26. G.Hummer,A.Szabo,Biophys.J.85,5(2003).27. Z.T.Yew,M.Schlierf,M.Rief,E.Paci,PhysicalReviewE81,031923(2009).28. O.K.Dudko,G.Hummer,A.Szabo,Phys.Rev.Lett.96,(2006).29. L.J.Lapidus,W.A.Eaton,J.Hofrichter,ProceedingsoftheNationalAcademy
ofSciences97,7220(2000).30. R.Berkovichetal.,ProceedingsoftheNationalAcademyofSciences109,
14416(2012).31. H.Lannon,J.S.Haghpanah,J.K.Montclare,E.Vanden-Eijnden,J.Brujic,Phys.
Rev.Lett.110,128301(2013).32. H.Lietal.,Nature418,998(2002).33. R.W.Friddle,A.Noy,J.J.DeYoreo,ProceedingsoftheNationalAcademyof
Sciences109,13573(2012).34. K.Lindorff-Larsen,S.Piana,R.O.Dror,D.E.Shaw,Science334,517(2011).35. L.Redondo-Morata,M.I.Giannotti,F.Sanz,Langmuir28,6403(2012).36. H.J.Butt,M.Jaschke,Nanotechnology6,1(1995).37. J.L.Hutter,J.Bechhoefer,Rev.Sci.Instrum.64,1868(1993).38. J.M.Nunesetal.,Angew.Chem.Int.Ed.49,3528(2010).39. P.M.Williamsetal.,Nature422,446(2003).
Acknowledgments:TheauthorsthankAlfonsoSastreandJordiOteraforhelpfuldiscussions.ThisstudywassupportedbyaEuropeanResearchCouncil(ERC)StartingGrant(#310080),andanAgenceNationaldelaRecherche(ANR)grant(#ANR-12-BS10-009-01).LauraGonzalezwasrecipientofatravelgrants(FPIgrantBES-2010-031186fromtheSpanishMinisteriodeEconomíayCompetitividad)and(STSMCOSTActionTD1002-10006).
Supplementary Materials:
Materials and Methods SupplementaryText Figs. S1 to S6