high spatial resolution surface imaging and analysis of fungal cells using …€¦ · ·...
TRANSCRIPT

High spatial resolution surface imaging and analysis of fungal cells using SEM and AFM.Susan G. W. Kaminskyj a and Tanya E. S. Dahms b,caDepartment of Biology, University of Saskatchewan, 112 Science Place, Saskatoon SK S7N 5E2bDepartment of Chemistry and Biochemistry, University of Regina, 6000 Wascana Parkway,
Regina SK S4S 0A2cCorresponding author. Telephone +1 306 585 4246; email [email protected]
1. Introduction2. Imaging with scanning electron microscopy (SEM) and atomic force microscopy (AFM)3. Scanning electron microscopy
3.1 Cryo-SEM (low temperature SEM)3.2 Environmental scanning electron microscopy (ESEM)3.3 Dual beam SEM
4. Atomic force microscopy and force spectroscopy4.1 AFM of Living Cells4.2 AFM and FS of Fungal Cells and Cell Walls4.3 Integration of AFM with other Biophysical Techniques
5. Conclusions and future prospectsAcknowledgementsReferences
Keywords: Atomic force microscopy, cell surface, force spectroscopy, live fungal cells, nanometer scale, picoNewton force sensitivity, physical properties, scanning electron microscopy, surface chemistry, topography, ultrastructure
AbstractWe review the use of scanning electron microscopy (SEM), atomic force microscopy (AFM) and force spectroscopy (FS) for probing the ultrastructure, chemistry, physical characteristics and motion of fungal cells. When first developed, SEM was used to image fixed/dehydrated/gold coated specimens, but here we describe more recent SEM developments as they apply to fungal cells. Cryo SEM offers high resolution for frozen fungal samples, whereas environmental SEM allows the analysis of robust samples (e.g. spores) under ambient conditions. Dual beam SEM, the most recently developed, adds manipulation capabilities along with element detection. AFM has similar lateral and better depth resolution compared to SEM, and can image live cells including growing fungal hyphae. FS can analyze cell wall chemistry, elasticity and dynamic cell characteristics. The integration of AFM with optical microscopy will allow examination of individual molecules or cellular structures in the context of fungal cell architecture. SEM and AFM are complementary techniques that are clarifying our understanding of fungal biology.
1

1. Introduction
Many fungal species contribute to ecosystem stability, traditional and modern forms of biotechnology, or are experimental model systems. Others threaten the human food supply, or are emerging threats to human health. These substantial positive and negative impacts of fungi on human and ecosystem activities make it essential that we better understand fungal diversity, biology, and ecology.
Cells are composed of genetic material (DNA and RNA), gene products (proteins) and metabolic products (carbohydrates, lipids, metabolites), many in combination (e.g., glycoproteins) or including inorganic components. Cell structure, function and composition are intrinsically interrelated so that understanding fungal cell biology requires information on multiple aspects of cell structure and function. Most cells are less than 10 μm in at least one dimension, so microscopy is used to study their properties across the range from sub-cellular structures to multicellular assemblies.
This review focuses on the imaging and analysis of fungal cells using high resolution techniques, particularly scanning electron microscopy (SEM), atomic force microscopy (AFM), and force spectroscopy (FS).
2. Imaging with scanning electron microscopy and atomic force microscopy
AFM and SEM images have comparable lateral resolution (5 – 100 nm), at least for some specimens (McKeown et al., 1996, Protasoni et al., 2003; Melling et al., 2004; Ma et al., 2005). AFM has the advantage of being able to image live cells under ambient and physiological conditions. AFM is theoretically capable of higher resolution imaging than SEM (McKeown et al., 1996), but this may not be realized for many samples. The lateral resolution of SEM is limited by the size/brightness of the beam and the sensitivity of the detector, whereas AFM resolution is determined by the physical size and radius of curvature of the AFM tip and sample roughness. AFM is a physical technique in which the image is a convolution of tip and sample surface features. AFM tips are typically 1-2 nm, and potentially can be as small as 0.5 nm for a single carbon nanotube (Cheung et al., 2000). SEM has a large depth of focus, whereas the range of the z piezo limits the depth available to AFM, but offers accuracy in this dimension not available to SEM. Limitations in piezo feedback when an AFM tip transverses a steep slope can result in dramatic “edge effects”, whereas SEM z resolution is enhanced when the beam hits the sample surface at a glancing angle. AFM and SEM can provide excellent images up to 40, 000 × magnification, and sometimes considerably higher depending on the specimen, instrument, and preparation.
3. Scanning electron microscopy
Transmission EM (TEM), which was developed before SEM, is used to probe the structures of fixed, sectioned or freeze-etched fungal samples, producing two-dimensional (flat) images. These images can be combined, at first laboriously (Heath and Kaminskyj, 1989), and now computationally, (Hohmann-Marriott et al., 2006) to provide detailed information about cytoplasmic organization. When used in conjunction with immunolocalization, TEM can be an effective method to study cell wall composition (e.g. Wolski et al., 2007). We will focus our discussion on the complementary surface techniques, SEM and AFM.
SEM provides lifelike three-dimensional visualization at high resolution. For fungi, SEM is commonly used to document morphology and spatial relationships. Most SEM specimens are imaged at ambient temperature in a high vacuum (ca 10-8 Torr), having first been chemically fixed,
2
dehydrated, and coated with a conductive material (e.g. gold) to prevent charge buildup from the electron beam. Specimen preparation for ambient temperature SEM can be highly sophisticated (Hall and Hawes, 1991), but as it is not novel it will not be considered here, apart from noting that cautious specimen interpretation is essential (Crang and Klomparens, 1988) regardless of preservation and imaging method.
Ambient and low temperature (LT, also called cryoSEM) SEM have been reviewed by Hall and Hawes (1991). Environmental SEM (ESEM, also called variable pressure, VP-SEM) has recently been reviewed by Muscariello et al. (2005). Navratil et al. (2006) reviewed diverse microscopic techniques including SEM, but not AFM. Comprehensive volumes edited by McIntosh (2007) and Taatjes and Mossman (2006) cover current developments in transmission electron microscopy (TEM) and in TEM and other imaging methods, respectively.
Plant and fungal cells are supported by internal hydrostatic pressure acting on the cell wall, rather than the proteinaceous cytoskeleton as with animal cells, although a comparable cytoskeleton is essential for cell function. Surprisingly, it is possible to image certain specimens under high vacuum without pre-treatment even though fungal and plant cells collapse upon dehydration. Leaf surfaces of the carnivorous plant Pinguicula have trapping glands that secrete sticky mucus. These appear to maintain a lifelike morphology in a high vacuum for a few minutes before collapsing, and can be imaged at 200 × magnification with excellent quality (Heslop-Harrison, 1970). Considerably more resistant to high vacuum and irradiation are spores of the fungus Sordaria (Read and Lord, 1991), which can be imaged in high vacuum up to at least 340 × magnification. Regardless of whether spores were imaged dried or fresh, and even following irradiation levels that would be lethal to animal cells, these spores could germinate, grow, and mate normally. However, these examples are exceptional, and Sordaria hyphae did not survive high vacuum (Read and Lord, 1991).
3.1 Cryo-SEM
CryoSEM can be used to image cells in a frozen hydrated state, and thus is a significant development for high resolution imaging of fungi and plants (reviewed in Hall and Hawes, 1991; Read et al., 1983; Read and Jeffree, 1991). Fungal cells are relatively easy to freeze compared to preservation by chemical fixation (Hess, 2007). Most freezing artefacts affect the cytoplasm (and thus TEM) but are not visible with SEM. CryoSEM is a descriptive term that encompasses studies using specimens that are rapidly frozen (e. g. Huang et al., 1994; Hess 2007) or slowly frozen under partial vacuum (Craig and Beaton, 1996) and visualized by SEM at low temperature. CryoSEM has also been used to describe rapidly-frozen, freeze-substituted, dehydrated specimens examined at ambient temperature (Braun and Howard 1994; Duncan and Howard, 2000).
Typically, cryoSEM samples are frozen by plunging into a nitrogen slush (−210 ºC) which liquefies (-196 ºC) as it is warmed by the specimen, but does not reach its boiling point (-192 ºC). Specimen preparation (sublimation, coating) and imaging steps are carried out between −180 ºC and −60 ºC, depending on the researcher. Above −135 ºC, water recrystallization can affect tissue preservation (see below). Most fungal cryoSEM specimens are destroyed upon thawing due to their water content and the damaging effect of cytoplasmic ice crystal formation on membrane integrity.
CryoSEM (and indeed, most modern SEM) imaging uses field emission (FE) electron sources. Developed by Crewe and Wall (1970), FE guns have single-crystal tungsten cathodes with tip radii of ~100 nm that are operated in an electron field of 106 V/cm. The FE beam is about 106 fold brighter than a thermionic source, so FE guns can be operated at low current or with fast scan rates on lightly coated specimens (coating raises specimen temperature), and still produce excellent images at high magnification.
3

CryoSEM reduces the number of steps in SEM specimen preparation, and generally reduces fixation and drying artefacts. Critical point drying (CPD) is considered by many to be the best method to avoid surface tension artefacts, however Refshauge et al. (2006) suggest that CPD can indeed induce extraction artefacts, since specimens are immersed in acetone, then liquid carbon dioxide. An alternative to CPD is lyophilization (freeze drying), which can produce excellent results provided the instrument has an efficient vacuum system. Unlike CPD, lyophilization does not expose specimens to chemicals. In addition to fungal cell imaging, cryoSEM provides excellent images of fungal exudates at least to 7000 × magnification (Braun and Howard, 1994; Duncan and Howard, 2000). CryoSEM should also be useful for studying biofilms, whose three-dimensional architecture is sensitive to water-related perturbations, but apart from Nagarkar and Williams (1997) this method has not been widely reported for biofilm studies.
CryoSEM paired with microanalysis can provide high spatial resolution for the localization of metabolic events. Ryan et al. (2003) used root samples frozen in liquid N2, whose surface had been planed flat with a cryomicrotome and then partially etched, to investigate mineral nutrient transfer between arbuscular mycorrhizal fungi and root cells. Elemental analysis (using energy dispersive X-ray spectroscopy, EDS) within and between colonized cells and arbuscular mycorrhizal fungi suggested that both arbuscules and intercellular hyphae could serve as sites for phosphorus transfer. Dijksterhuis et al. (2007) combined cryoSEM and electron spin resonance to study dormant fungal spores compared to spores following metabolic activation but prior to germination. Dormant Talaromyces spores had a dense, anisotropic cytoplasm, whereas during metabolic activation the cytoplasmic viscosity decreased dramatically. CryoSEM showed that spore sections had a homogeneous cytoplasm prior to initiation of germination, but following metabolic activation it was possible to see organelle profiles. Comparable changes were observed during Penicillium spore germination. Dijksterhuis et al. (2007) also showed that Talaromyces spores were more resistant to environmental stress, including high temperature and high pressure, than those of Penicillium, even though these are the sexual and asexual stages, respectively of the same organism. Daniel et al. (2004) combined cryoSEM and TEM immunocytochemistry to study early stages in lignocellulose decay by the white-rot fungus, Phlebia. Distributions of laccase versus manganese- and lignin-peroxidases showed that all three enzymes were important in the decay process, but that each likely had distinct roles.
CryoSEM is prone to certain artefacts, in particular, incomplete sublimation of surface moisture (e.g. Jansson et al., 2000), which obscures fine surface features. Water recrystallization, which becomes possible for pure water above −135 ºC, leads to dynamic changes in the solid phase that can create crystals from vitreous ice. Recrystallization is affected by solute content (which reduces the freezing point of the solution) and becomes more problematic over time or at relatively high (above −90 ºC) temperatures. Recrystallization can cause solute redistribution and formation of debris aggregates, which has been used to assess cell viability (Refshauge et al., 2006) and liquid versus gas content in internal spaces (McCully et al., 2000). Healthy turgid fungal hyphae prepared and imaged for ambient or cryoSEM have smooth surface contours (Hall and Hawes, 1991) at least below 2000 × magnification, consistent with in vivo light microscopy. Above 40,000 × magnification, the appearance of the fungal wall surface structure is more complex, since the surface subunits are resolved (Ma et al., 2005). Cryo-SEM images in which fungal cells appear partially collapsed (e. g. Rohde et al., 2002) may indicate shrinkage caused by prolonged sublimation. Another potential problem with cryoSEM is the difficulty in examining internal structures. Scheidegger and Brunner (1993) examined Hartig nets, ectomycorrhizal fungus-plant root interactions, within roots that had been fractured with a microtome. They produced excellent images of cell interfaces, but noted there was a problem controlling the fracture plane, and that there were few fractures within cells.
4

3.2 Environmental scanning electron microscopy (ESEM)
Environmental SEM is also called variable pressure SEM (VP-SEM). Typically, SEM imaging requires a high vacuum, ≤ 10-8 Torr (reviewed in Stewart, 1985). Few biological specimens tolerate these conditions without rapid collapse (Heslop-Harrison, 1970) and fewer still survive (Read and Lord, 1991). The environmental SEM (ESEM; reviewed in Stokes and Donald, 2000) uses a series of pressure limiting apertures (Muscariello et al., 2005) to allow the electron gun to operate at 10-7 Torr while preventing gas leakage from the specimen chamber, which can be maintained at 1 − 20 Torr. A gaseous secondary electron detector (GSED) exploits the gas in the specimen chamber for signal amplification. GSED operation produces positive ions that have the added benefit of limiting charging of non-conductive specimens (Stokes and Donald, 2000).
The relative humidity in an ESEM specimen chamber can be controlled (Stokes and Donald, 2000), so ESEM is particularly useful for hydrated materials (Muscariello et al., 2005; Stokes and Donald, 2000; Stokes, 2001). Although the pressure in an ESEM specimen chamber is 10 million fold higher than at the electron source (Stokes and Donald, 2000), it is still extremely low for fungal specimens apart from dormant spores. Li et al. (2001) examined untreated conidial heads of sporulating Stachybotrys using ESEM, gaining a good impression of the slime coat at 450 × magnification. However, surface details were not crisp above 1200 × magnification, and there was evidence of collapse for the spore-forming hyphae. Collins et al. (1993) used ESEM to image fungal spores and spore-forming structures at 200 to 2000 × magnification, and showed good preservation, and Chulalaksananukul et al. (2006) imaged Fusarium spore morphology at 500 × magnification. However, in neither study were the images as crisp as ambient temperature or cryo-SEM under high vacuum.
Apart from spores (Collins et al., 1993; Read and Lord, 1991), fungal cells are particularly sensitive to dehydration. Furthermore, they have low intrinsic contrast due to the low average atomic number. Sánchez et al. (2006) examined young fruit body initials of the mushroom, Pleurotus. ESEM images of uncoated fruit bodies were considerably less detailed than comparable specimens examined by cryoSEM. Collins et al. (1993) used heavy metal treatment (osmium tetroxide, potassium permanganate, iodine in potassium iodide) to improve contrast, and Priester et al. (2007) used a similar strategy (fixation and stains) to increase the contrast of Pseudomonas biofilms growing on a variety of substrates. Stokes (2003) showed that chemically fixed and unfixed biological materials (their model system is a breadcrumb) appeared similar with ESEM, but noted that many researchers used ‘slight fixation and partial alcohol dehydration’ to avoid artifacts. As with ambient pressure SEM, cautious interpretation of the potential effects of specimen preservation (or lack thereof) is important for analysis of ESEM-based studies (cf Crang and Klomparens, 1988). However even with contrasting agents, which negate the potential advantages of observing untreated specimens, the published images described above were typically 200 - 2000 × magnification and low resolution. More recent instruments combine cryoSEM with variable pressure capabilities. Assante et al. (2004) used a cryoSEM – ESEM to study Cladosporium mycoparasitism of Uromyces, with good images at least to 500 × magnification.
ESEM imaging of non-conductive specimens remains susceptible to specimen charging. Recently, Clode (2006) developed a method to exploit this as a contrasting technique (CCI, charge contrast imaging) for biological specimens. CCI requires flat specimens, i.e. planed with a cryomicrotome, but no other special preparation. Some specimens were stabilized by chemical fixation or were embedded in epoxy resin to facilitate microtoming. ESEM scanning causes charge buildup, which eventually leads to contrast enhancement related to cell composition. The details related to sample composition must be determined using other methods, such as X-ray spectrum
5
analysis.
3.3 Dual beam SEM
Dual beam SEM is a relatively recent development that adds manipulation (dissection, metal deposition, physical transfer) capabilities to SEM and TEM imaging, along with element detection using EDS. Thus, it becomes possible to select, prepare, image, and analyze specimens with high spatial precision. Dual beam SEM equipment is available from several manufacturers. The images presented here were obtained using a FEI Nova Nanolab 600 Dual Beam FIB/SEM system when one of us (SGWK) was a guest at the FEI NanoPort (Hillsboro, OR) facility. Capabilities of this instrument include field emission SEM and TEM imaging, focused ion beam (FIB) milling and deposition (Pt, W, C, Si), and EDS. Heymann et al. (2006) used this microscope to demonstrate dual beam SEM imaging of Saccharomyces at high resolution. Here, we used the same instrument to examine host-pathogen interactions in susceptible and resistant cultivars of wheat infected with the biotrophic powdery mildew fungus, Blumeria graminis tritici (Bgt). Obligate biotrophs must establish an intimate relationship with a living host cell to complete their life cycle.
Figure 1 shows the surface of a wheat leaf infected with the powdery mildew fungus, Blumeria graminis tritici that was frozen in liquid N2, lyophilized, and imaged without coating (Fig. 1a). Prolonged imaging, even at low beam current can cause damage, so the specimen was reinforced with a platinum patch (Fig. 1b). FIB milling was used to reveal the Bgt penetration site in a compatible interaction (Fig 1c). Specimens can be sequentially FIB milled and imaged, providing detailed information but at the cost of destroying the specimen. The appressorium in Fig. 1c (compatible interaction) had collapsed and was empty of cytoplasm, which had migrated into the haustorium through the penetration pore. In contrast, the appressorium in Fig. 1d (an incompatible interaction) contained cytoplasm because the infection was unsuccessful. The resistant plant had responded to attempted invasion by depositing additional wall material around the penetration peg.
Figure 2 shows stages in the production of a thin section from an incompatible Bgt-wheat interaction intended for elemental analysis by EDS. The region of interest was isolated by FIB milling (a), a liftout probe (LP) was attached by a platinum weld (b), the section was attached to a copper grid using a platinum weld, and the connection between the liftout probe and the section was severed by FIB milling (c). Finally, the section was thinned to less than 100 nm thickness by FIB milling (d). Figure 3 shows preliminary analysis of the thin section from Figure 2 using STEM and EDS. The region spanning the fungal and plant cell walls (arrow in Fig. 3a) at the attempted penetration site was analyzed by EDS (b), showing that in addition to the expected elements (C, Ca, Cl, K, O, Mg, Si associated with plant and fungal cells; Al, Pt associated with the sample preparation) there was abundant Mn. Gallium from the FIB milling process can sometimes be detected, but not in this example. Mn peroxidases are implicated in the production and neutralization of reactive oxygen species that are characteristic of host-pathogen interactions in many systems (Carver et al., 1998). The sensitivity threshold of EDS is about 1 % by weight, so important but less abundant inorganic components (e.g. iron, Liu et al. 2005) must be studied using other methods.
SEM modes spanning ambient to low temperatures, and high vacuum to variable pressure have been used with great success to describe and characterize fungal morphologies and fungal interactions with their surroundings. Recent developments in dual beam SEM instrumentation coupled with cryo-stabilization have the potential to reveal unprecedented information about fungal structure and function. Although imaging fungal hyphae with ESEM will likely continue to be constrained by technical issues, a complementary method, atomic force microscopy (AFM) can also provide high-resolution surface imaging as well as some forms of specimen manipulation.
6

4. Atomic force microscopy and force spectroscopy
Atomic force microscopy (AFM) is a physical raster scanning technique used to examine surface characteristics (Binnig et al., 1986). AFM produces images using a probe tip (nm-scale) that extends from a micro-cantilever with picoNewton (pN) sensitivity, all mounted on a piezoelectric scanner that has sub-nm accuracy. Probe-surface interactions change the cantilever deflection, and most commonly this is detected with an optical lever, in which a red laser reflects from the cantilever surface into a four-quadrant photodiode. Feedback control responds immediately to changes in tip-sample distance sending a signal to piezoelectric micropositioners, while the same signal received by the computer is converted into an image (reviewed in Takano et al., 1999).
The most common AFM modes for imaging biological samples are contact and intermittent contact, the latter also called tapping or dynamic mode. Contact mode uses piezoelectric micro-positioners controlled by a feedback loop to maintain a constant force between the tip and sample during raster scanning, and these adjustments are recorded to produce an image. In contact mode, horizontal and vertical deflections result from tip-sample interactions and surface topography, respectively. For intermittent contact mode, a tip made to oscillate near its resonant frequency is raster scanned across the sample. Tip-sample interactions give rise to changes in tip oscillation phase and amplitude producing phase and topography images, respectively. Lateral force and phase images reflect tip-sample interactions for very flat samples, but otherwise are convoluted with sample topography.
Force spectroscopy (FS), which has no SEM counterpart, is an approach-retract mode of the AF-microscope that can be used to assess cell surface compliance and elasticity. Jacot et al. (2006) showed that a microindentor can generate comparable surface measurements to FS, but the microindentor lacks AFM imaging which is important for facilitating spatial precision. FS quantification is based on Young’s modulus (modulus of elasticity), which is defined as the ratio of linear stress to linear strain (Takano et al., 1999). Radmacher et al. (1994) first developed FS for biological samples and then extended the technique to whole cells (Radmacher et al., 1996). The application of FS, and its related techniques, to microbial cells has been reviewed in Dague et al. (2007), Dupres et al. (2007) and Gaboriaud and Dufrêne (2007). Ma et al. (2005) used FS to show that growing hyphal tips and branch tips of the fungus Aspergillus nidulans were more compliant than mature basal regions, the first demonstration for the experimental validity of fungal tip growth models that were previously based on indirect results.
Since the introduction of AFM (Hansma et al., 1988), new methods and applications have developed rapidly (Santos and Castanho, 2004; Dupres et al., 2007; Lee et al., 2007; Gadegaard, 2006; Dvorak, 2003), along with innovative sample preparation techniques (Kirat et al., 2005). There were twelve AFM-related publications in 1988-1990 compared to 966 in the first half of 2007.
4.1 AFM Analysis of Living Cells
AFM has been used to measure cell surface topography (Butt et al., 1990), cell compliance, Young’s modulus (Radmacher et al., 1992), and cell volume (Schneider et al., 1997). AFM has also been used for cytological (Ross et al., 1998) and histological analyses (Osada et al., 1998), and as a robot for nano manipulation (Falvo et al., 1997). AFM can be used to recognize individual surface components on fungi (Touhami et al., 2003); using two-component recognition AFM imaging, two surface molecules can be studied simultaneously (Wang et al., 2007). All of these techniques can be applied to structure-function relationships of fungi. FS can extract components from live cells using chemically-modified AFM tips (Afrin et al., 2003), a technique that could be used to measure properties of fungal wall surface molecules. Extraction of single mRNA molecules (Uehara et al.,
7

2004) from living cells for studying the relationship between mRNA localization and cell polarity, and transfection using plasmid decorated AFM probes (Cuerrier et al., 2007) have potential applications to fungi. Colloid probe AFM has been used to study the molecular scale characteristics responsible for adhesion to surfaces (Salerno et al., 2007), which has direct applications for fungal biofilms, discussed below.
The AFM analysis of living cells with optimum relevance is technically challenging, since cells should be metabolically active rather than moribund. AFM image acquisition time can be slow (15 - 90 min), during which cells can move or change metabolically. Image resolution for live cell surfaces is often reduced compared to fixed cells (Ma et al., 2005), likely because intermolecular cross-linking (chemical fixation) increases surface resilience. A further complication is scanner drift, which produces spatial distortion. Shen et al. (2007) have developed an image correction method for live cell atomic force microscopy, and using a different method Spagnoli et al. (2007) have demonstrated drift-free AFM measurements of cell height and mechanical properties.
4.2 AFM and FS of Fungal Cells and Cell Walls
The components of fungal cell walls (reviewed in Latgé, 2007) have been characterized in bulk samples (Bartnicki-Garcia, 1968), examined using molecular genetic techniques (Bates et al., 2006), and are now being examined using Fourier transform infrared spectromicroscopy (Szeghalmi et al., 2007; Jilkine et al., in press). Fungal cells interact with their environment and with other organisms through their walls but until recently the ability to physically and chemically probe details of the fungal wall surface has been lacking. The ability to recognize individual surface components on live fungi (Touhami et al., 2003) will allow researchers to address fungal cell wall structure-function relationships critical to understanding host-pathogen interactions.
The first AFM images of living Sacchromyces cerevisiae (baker’s yeast) used cells immobilized on a Millipore filter (Kasas and Ikai, 1995) or on agar submerged in culture medium (Gad and Ikai, 1995). Yeast cell surfaces mapped using AFM probes decorated with antibodies (method reviewed in Hinterdorfer and Dufrêne, 2006) indicated a non-uniform distribution of mannan (Gad, 1997), which likely relates to wall maturation and to changes associated with bud scars. Ahimou et al. (2003) described AFM imaging of S. cerevisiae surface topography with 2 nm lateral resolution to monitor the effects of protease digestion on the cell wall, showing that the surface became progressively rougher, consistent with the erosion of mannoprotein. AFM probes covalently linked with antibodies have been used to assess adhesion between AFM tips and fungal cell surfaces (Hinterdorfer and Dufrêne, 2006). Thus, it is possible to understand at least some of the chemical changes that accompany yeast wall maturation using AFM-based methods. Unlike yeasts, filamentous fungi are multicellular. Dufrêne et al. (1999) characterized the surface ultrastructure and molecular characteristics of Phanerochaete chrysosporium spores using AFM probes functionalized with hydroxy- or methyl-groups to map their topography and relative hydrophobicity. Comparable high-resolution images of Aspergillus nidulans spore surfaces are shown in Figure 4. Dufrêne et al. (2001) used FS to probe fungal spores under various physiological and environmental conditions, showing a change from dormancy to germination (reviewed in Dufrêne, 2001). Figure 5a shows analogous force curves for A. nidulans asexual spore surfaces. Ma et al. (2006) showed that filamentous fungi are capable of remodeling hyphal as well as spore cell walls.
AFM has been used to study of the adhesive properties of S. cerevisiae (Bowen, 2001), and the human commensal/pathogenic yeasts Candida utilis (Dhadwar et al., 2003) and C. albicans (Kriznik, 2005) cells to various surfaces. Yeast cell adhesion in vitro is mainly driven by hydrophobic interactions between the substrate and cell wall (Bowen, 2001; Dhadwar et al., 2003), more specifically the microfibrillar cell wall surface structure (Kriznik, 2005), where filamentous
8
forms of C. albicans adhered three times more strongly than budding forms. Touhami et al. (2003) used FS and AFM tips modified with glucose oligomers or the lectin, conconavalin A, to measure cellular adhesion and individual lectin-mannan interactions associated with yeast flocculation, demonstrating the feasibility of single molecule FS on live cells. Emerson and Camesano (2004) examined the initial events in microbial adhesion that contribute to medical implant infections, along with ensuing growth, pathogenesis, and dissemination. FS was used to examine biofilm attachment, where C. parapsilopsis was immobilized on an AFM tip to quantify its adhesion to both silicon rubber and a Pseudomonas aeruginosa biofilm. Adherence was observed in each case, providing a link between the mechanical and chemical properties of the implant materials and the nanoscale interactions leading to microbial colonization and infection. FS was used to determine the interfacial forces and adhesion affinities of Aureobasidium pullulans, a potentially pathogenic yeast, to examine the role of the polysaccharide pullulan and other biomacromolecules in mediating adhesion and attachment during early- and late-exponential phase cells (Pouliot et al., 2005), showing that steric interactions were not sufficient to describe its adhesion behavior. Gotzinger and colleagues (2007) have applied FS to assess silica surface coatings with defined roughness, and their adhesive properties with S. cerevisiae.
Innovative work by Pelling et al. (2004) demonstrated a novel aspect of yeast biology, the dynamic activity of its cell wall. Local, temperature-dependent and concerted nanomechanical motion (~ 10 nN) in living S. cerevisiae was observed at frequencies and activation energies (derived from Arrhenius plots: ln ν versus 1/T) consistent with intracellular molecular motors that were distinct from those observed for the cell wall and bud scar (Pelling et al., 2005). These motions were sensitive to metabolic inhibitors, showing their dependence on cellular metabolism. Pelling et al. (2004) also calculated the linear velocity (observed frequency × cellular oscillation amplitude) for proteins to give operating speeds (2.6 - 4.9 μ/s) consistent with those of the cytoskeleton-dependent motor proteins.
Zhao et al. (2005 a, b) suggested that the elastic properties of azide-treated (moribund) Aspergillus nidulans spores and hyphae may be dependent on cell wall architecture rather than its composition. We used AFM and FS to establish a relationship between the maturation of live Aspergillus nidulans and cell wall rigidity for growing hyphae (Ma et al., 2005), and used Zhao’s equation (2005b):
E=0.80kwh Rh1.5
,
to determine Young’s moduli for the cell wall at a series of regions along hyphae. This equation incorporates the cell wall elastic modulus (E), the hyphal radius (R) measured by AFM, and the thickness of the cell wall (h) measured by TEM. Traditional difficulties associated with imaging live hyphae (Dufrêne, 2001), which only attach firmly to substrates by the spore, were overcome by growing A. nidulans across dialysis tubing underlaid with growth medium (Ma et al., 2005). Surface ultrastructure (AFM), adhesion and rigidity (FS) changed with maturation, showing a more ordered, rigid and less hydrophilic hyphal surface with maturation. Figure 4d shows a mature A. nidulans hyphal wall surface, possibly corresponding to the brush-like structure of polysaccharides at the fungal cell surface observed by TEM (reviewed in Osumi, 1998). Ma et al. (2005) showed that surface ultrastructure and cell wall rigidity varied with A. nidulans wall maturation. These properties also varied with A. nidulans developmental stage (Ma et al., 2006), for example, conidia versus hyphae (Figure 4, 5) and germlings (Ma et al., 2006), or under thermal stress for a temperature sensitive mutant (Figure 6). However, these studies do not rule out variations in wall composition as contributing to emergent wall properties.
AFM imaging and FS have shown that cell-cycle processes (particularly division) alter both
9

the surface ultrastructure and physiochemical properties of C. parapsilopsis (Mendez-Vilas et al., 2006). Canetta et al. (2006, a, b) demonstrated a structure-function relationship with a clear correlation between the surface ultrastructure of both S. cerevisiae and Schizosaccharomyces pombe and their physiological function under stress. Svaldo-Lanero et al. (2006) have used FS, and FS in combination with confocal laser scanning microscopy (CLSM; Svaldo-Lanero et al., 2007) to study the effects of encapsulation by polyelectrolyte layers on living S. cerevisiae cells, showing a correlation between local rigidity and duplication rate.
4.3. Integration of the AF Microscope with other Biophysical Instruments
There have been a number of technical advancements that will likely have application to fungi in the very near future, where the theme of integrated instrumentation is predominant. The physical integration of AFM and SEM would not be advantageous for biological applications, as it would compromise the ability to make measurements on live cells, one of the main advantages of AFM. However, AFM has been integrated with other biophysical instruments (reviewed by Ubbink and Zammaretti, 2005).
The combination of AFM with optical microscopes has the potential to extend the data from these imaging systems with more detailed biochemical information. Integrating AFM with near-field scanning optical microscopy (NSOM; Muramatsu et al., 1995; Rieti et al., 2004), epifluorescence and surface interference microscopy, (Nagao and Dvorak, 1998), Raman microscopy (Biju et al., 2007), patch clamp for monitoring ion channels (Besch et al., 2003; Lew, 2006), and two-photon fluorescence imaging (Gradinaru et al., 2004) would certainly add value to studies. For instance, Ma et al. (2005) have suggested the use of NSOM to simultaneously image the topography of hyphal surfaces and identify fluorescently labeled chemical components of the cell wall at spatial resolution beyond the optical diffraction limit.
The integration of AFM and confocal fluorescence microscopy (Rajwa et al., 2004; Haupt et al., 2006) offers the ability to track molecular components of cells in the context of cellular morphology, and the confocal component can be extended to fluorescence lifetime imaging (Micic et al., 2004). Spatially and temporally synchronized atomic force and total internal reflection fluorescence microscopy simultaneously records topography (AFM) and fluorescence (photon count) of labeled molecules, providing a powerful technique to image and manipulate cells and biomolecules (Kellermayer et al., 2006).
The AFM-based differential force microscope, with integrated epifluorescence imaging, has adjacent cantilevers on the same rigid support for increased measurement stability (Choy et al., 2007) and offers a sensitive method for quantifying force and displacement over long time-scales (min – h). This combined instrument is suitable for tracking slow biophysical processes in whole cells, with potential application to observing the dynamic interplay between actin filament networks and polarized growth. Takahashi et al. (2006) recently demonstrated, for the first time, the feasibility of imaging live cells with an integrated scanning electrochemical (SEC-), AF- and optical microscope. The instrument, using the “standing approach mode”, is capable of simultaneously collecting AFM/NSOM, AFM/optical/fluorescence or AFM/SECM images with an optical lateral resolution of 170 nm and electrochemical lateral resolution of 35 nm. Takahashi et al. (2006) show simultaneously collected topography/electrochemical and topography/optical/fluorescence images for the axons and cell body of PC12 cells under physiological conditions. All of these integrated AFM techniques, although certainly not trivial regarding data acquisition, are potentially applicable to fungi.
10

5. Conclusions and future prospects
Advances in SEM and AFM methodologies have made it possible to explore a variety of questions in fungal biology. The ability to couple imaging with molecular genetic manipulations offers the possibility of deepening our understanding of how molecular mechanisms of the cell drive morphological and structural changes, to further elaborate fungal cytology. Many techniques have been used in conjunction with SEM and AFM to determine molecular mechanisms alongside whole cell structural data, and the parallel development of technology has led to the integration of instrumentation for the simultaneous detection of different cellular properties and components (e.g. surface structure, rigidity, chemical composition, protein trafficking etc.), enabling researchers to tackle complex biological problems.
The establishment of new techniques opens the door to addressing many questions, which for fungi include unraveling the mechanisms that underscore host-pathogen interactions. Dual beam-cryo SEM-EDS is particularly suited to studying plant host-fungal interactions. One of the most exciting developments for AFM is its integration with optical microscopes, which allows the researcher to collect all of the data available to AFM while simultaneously tracking specific molecules at high resolution. This data can be combined to produce a multidimensional image embedded with chemical, biochemical, topographical and physical data.
The development of new imaging methods offers the possibility to address new types of biological questions. However, technical complexity and instrument cost for many of these analytical imaging methods necessitates multidisciplinary experimental teams. Taken together, this is an exciting time to be a biologist and/or biochemist.
11

Acknowledgements
SGWK is grateful to Trisha Rice, Brandon VanLeer, Michael Berna and Steven Dalakoudis, all from FEI, for their assistance with the dual beam SEM imaging. TESD thanks Laelie Snook for pioneering AFM imaging of fungal hyphae in our laboratory, Hui Ma for bringing the work to fruition and Chunhong Tian for continuing the project. The AFM used for this work was partially funded by the Canada Foundation for Innovation and the University of Regina Faculty of Science. SGWK and TESD are funded by Discovery Grants from the Natural Sciences and Engineering Research Council of Canada.
12

References
Afrin, R., Arakawa, H., Osada, T., Ikai, A., 2003. Extraction of membrane proteins from a living cell surface using the atomic force microscope and covalent crosslinkers. Cell Biochemistry and Biophysics 39, 101--117.
Ahimou, F., Touhami, A., Dufrêne, Y.F., 2003. Real-time imaging of the surface topography of living yeast cells by atomic force microscopy. Yeast 20, 25--30.
Assante, G., Maffi, D., Saracchi, M., Farina, G., Moricca, S., Ragazzi, A., 2004. Histological studies on the mycoparasitism of Cladosporium tenuissimum on urediniospores of Uromyces appendiculatus. Mycological Research 108, 170--182.
Bartnicki-Garcia, S., 1968. Cell wall chemistry, morphogenesis, and taxonomy of fungi. Annual Review of Microbiology 55, 87--108.
Bates, S., Hughes, H. B., Munro, C. A., Thomas W. P., MacCallum, D. M., Bertram, G., Atrih, A., Ferguson, M. A., Brown, A. J., Odds, F. C., Gow, N. A.R., 2006. Outer chain N-glycans are required for cell wall integrity and virulence of Candida albicans. Journal of Biological Chemistry 281, 90--98.
Besch, S., Snyder, K.V., Zhang, P.C., Sachs, F., 2003. Adapting the quesant nomad atomic force microscope for biology and patch-clamp atomic force microscopy. Cell Biochemistry and Biophysics 39, 195--210.
Biju, V., Pan, D., Gorby, Y.A., Fredrickson, J., McLean, J., Saffarini, D., Lu, H.P., 2007. Combined spectroscopic and topographic characterization of nanoscale domains and their distributions of a redox protein on bacterial cell surfaces. Langmuir 23, 1333--1338.
Binnig, G., Quate, C.F., Gerber, C. 1986. Atomic force microscope. Physical Review Letters 56, 930--933.
Bowen, W.R., Lovitt, R.W., Wright, C.J., 2001. Atomic force microscopy study of the adhesion of Saccharomyces cerevisiae. Journal of Colloid Interface Science 237, 54--61.
Braun, E.J., Howard, R.J., 1994. Adhesion of Cochliobolus heterosporus conidia and germlings to host plant surfaces. Experimental Mycology 18, 211--220.
Canetta, E., Adya, A.K., Walker, G.M., 2006. Atomic force microscopic study of the effects of ethanol on yeast cell surface morphology. FEMS Microbiology Letters 255, 308--315.
Canetta, E., Walker, G.M., Adya, A.K., 2006. Correlating yeast cell stress physiology to changes in the cell surface morphology: atomic force microscopic studies. Scientific World Journal. 6, 777--780.
Carver, T.L.W., Thomas, B.J., Robbins, M.P., Zeyen, R.J., 1998. Phenylalanine ammonia-lyase inhibition, autofluorescence, and localized accumulation of silicon, calcium and manganese in oat epidermis attacked by the powdery mildew fungus Blumeria graminis (DC) Speer. Physiological and Moleculare Plant Pathology 52, 223--243.
Choy, J. L., Parekh, S.H., Chaudhuri, O., Liu, A.P., Bustamante, C., Footer, M.J., Theriot, J.A., Fletcher, D.A., 2007. Differential force microscope for long time-scale biophysical measurements. Review of Scientific Instruments 78, 043711--043716.
Chulalaksananukul, S., Gadd, G.M., Sangvanich, P., Sihanonth, P., Piapukiew, J., Vangnai, A.S., 2006. Biodegradation of benzo(a)pyrene by a newly isolated Fusarium sp. FEMS Microbiology Letters 262, 99--106.
Clode, P.L., 2006. Charge contrast imaging of biomaterials in a variable pressure scanning electron microscope. Journal of Structural Biology 155, 505--511.
Collins, S.P., Pope, R.K., Scheetz, R.W., Ray, R.I., Wagner, P.A., Little, B.J., 1993. Advantages of environmental scanning electron microscopy in studies of microorganisms. Microscopy Research and Technique 25, 398--405.
13

Craig, S., Beaton, C.D., 1996. A simple cryo-SEM method for delicate plant tissues. Journal of Microscopy 182, 102--105.
Crang, R.F.E., Klomparens, K.L., 1988. Artifacts in biological electron microscopy. Plenum Press, New York.
Crewe, AV., Wall, J., 1970. A scanning electron microscope with 5Å resolution. Journal of Molecular Biology 48, 375--393.
Cuerrier, C.M., Lebel, R., Grandbois, M., 2007. Single cell transfection using plasmid decorated AFM probes. Biochemical and Biophysical Research Communications 355, 632--636.
Dague, E., Gilbert, Y., Verbelen, C., Andre, G., Alsteens, D., Dufrêne, Y.F., 2007. Towards a nanoscale view of fungal surfaces. Yeast 24, 229--237.
Daniel, G., Volc, J., Niku-Paacola, M.-L., 2004. Cryo-FE-SEM and TEM immunotechniques reveal new details for understanding white-rot decay of lignocellulose. Comptes Rendus Biologies 327, 861--871.
Dhadwar, S.S., Bemman, T., Anderson, W.A., Chen, P., 2003. Yeast cell adhesion on oligopeptide modified surfaces. Biotechnology Advances 21, 395--406.
Dijksterhuis, J., Nijsse, J., Hoekstra, F.A., Golovina, E.A., 2007. High viscosity and anisotropy characterize the cytoplasm of fungal dormant stress-resistant spores. Eukaryotic Cell 6, 157--170.
Dufrêne, Y.F., 2001. Application of atomic force microscopy to microbial surfaces: From reconstituted cell surface layers to living cells. Micron 32, 153--165.
Dufrêne, Y.F., Boonaert, C.J.P., van der Mei, H.C., Busscher, H.J., Rouxhet, P.G. 2001. Probing molecular interactions and mechanical properties of microbial cell surfaces by atomic force microscopy. Ultramicroscopy 86, 113--120.
Dufrêne, Y.F., Boonaert, C.J.P., Gerin, P.A., Asther, M., Rouxhet, P.G., 1999. Direct probing of the surface ultrastructure and molecular interactions of dormant and germinating spores of Phanerochaete chrysosporium. Journal of Bacteriology 181, 5350--5354.
Duncan, K.E., Howard, R.J., 2000. Cytological analysis of wheat infection by the leaf blotch pathogen Mycosphaerella graminicola. Mycological Research 104, 1074--1082.
Dupres, V., Verbelen, C., Dufrêne, Y.F., 2007. Probing molecular recognition sites on biosurfaces using AFM. Biomaterials 28, 2393--2402.
Dvorak, J. A., 2003. The application of atomic force microscopy to the study of living vertebrate cells in culture. Methods. 29, 86--96.
El Kirat, K., Burton, I., Dupres, V., Dufrêne, Y.F., 2005. Sample preparation procedures for biological atomic force microscopy. Journal of Microscopy 218, 199--207.
Emerson, R. J., 4th, Camesano, T.A., 2004. Nanoscale investigation of pathogenic microbial adhesion to a biomaterial. Applied Environmental Microbiology 70, 6012--6022.
Falvo, M.R., Washburn, S., Superfine, R., Finch, M., Brooks, F.P. Jr, Chi, V. and Taylor, R.M. 2nd, 1997. Manipulation of individual viruses: Friction and mechanical properties. Biophysical Journal 72, 1396--1403.
Gaboriaud, F., Dufrêne, Y.F., 2007. Atomic force microscopy of microbial cells: application to nanomechanical properties, surface forces and molecular recognition forces. Colloids and Surfaces B: Biointerfaces 54, 10--19.
Gad, M., Itoh, A., Ikai, A., 1997. Mapping cell wall polysaccharides of living microbial cells using atomic force microscopy. Cell Biology International 21, 697--706.
Gad, M., Ikai, A., 1995. Method for immobilizing microbial cells on gel surface for dynamic AFM studies. Biophysical Journal 69, 2226--2233.
Gadegaard, N., 2006. Atomic force microscopy in biology: technology and techniques. Biotechnic Histochemistry 81, 87--97.
14

Gotzinger, M., Weigl, B., Peukert, W., Sommer, K., 2007. Effect of roughness on particle adhesion in aqueous solutions: a study of Saccharomyces cerevisiae and a silica particle. Colloids and Surfaces B: Biointerfaces 55, 44--50.
Gradinaru, C.C., Martinsson, P., Aartsma, T.J., Schmidt, T., 2004. Simultaneous atomic-force and two-photon fluorescence imaging of biological specimens in vivo. Ultramicroscopy 99, 235--245.
Hall, J.L., Hawes, C. H., 1991. Electron microscopy of plant cells. Academic Press, New York and Toronto.
Hansma, P.K., Elings, V.B., Marti, O., Bracker, C.E., 1988. Scanning tunneling microscopy and atomic force microscopy: Application to biology and technology. Science 242, 209--216.
Haupt, B.J., Pelling, A.E., Horton, M.A., 2006. Integrated confocal and scanning probe microscopy for biomedical research. Scientific World Journal 6, 1609--1618.
Heath, I.B., Kaminskyj, S., 1989. The organization of tip-growth-related organelles and microtubules revealed by quantitative analysis of freeze-substituted oomycete hyphae. Journal of Cell Science 93, 41--52
Heslop-Harrison, Y., 1970. Scanning electron microscopy of fresh leaves of Pinguicula. Science 167, 172--174.
Hess, M.W., 2007. Cryopreparation methodology for plant cell biology. In Cellular electron microscopy, Academic Press, New York.
Heymann, J.A.W., Hayles, M., Gestmann, I., Giannuzzi, L.A., Lich, B., Subramaniam, S., 2006. Site-specific 3D imaging of cells and tissues with a dual beam microscope. Journal of Structural Biology 155, 63--73.
Hinterdorfer, P., Dufrêne, Y.F., 2006. Detection and localization of single molecular recognition events using atomic force microscopy. Nature Methods 3, 347--355.
Hohmann-Marriott, M.F., Uchida, M., van de Meene, A.M.L., Garret, M., Hjelm, B.E., Kokoori, S., Roberson, R.W., 2006. Application of electron tomography to fungal ultrastructure studies. New Phytologist 172, 208--220.
Huang, C.X., Canny, M.J., Oates, K., McCully, M.E., 1994. Planing frozen hydrated plant specimens for SEM observation and EDX analysis. Microscopy Research and Technique 28, 67--74.
Jacot, J.G., Dianis, S., Schnall, J., Wong, J.Y., 2006. A simple microindentation technique for mapping the microscale compliance of soft hydrated materials and tissues. Journal of Biomedical Materials Research A 79, 485--494.
Jansson, H.-B., Persson, C., Odeslius, R., 2000. Growth and capture activities of nematophagous fungi in soil, visualized by low temperatures scanning electron microscopy. Mycologia 92, 10--15.
Jeffree, C.E., Read, N.D., 1991. Ambient- and low-temperature scanning electron microscopy of plants and fungi. In: Hall, J. F., Hawes, C., (Eds.) Electron microscopy of plant cells. Academic Press, New York and Toronto. pp. 313--414.
Jilkine K., Gough K.M., Julian R., Kaminskyj, S.G.W., 2007. A sensitive method for examining whole cell biochemical composition in single cells of filamentous fungi using synchrotron FTIR spectromicroscopy. Journal of Inorganic Biochemistry, In press.
Kasas, S., Ikai, A., 1995. A method for anchoring round shaped cells for atomic force microscope imaging. Biophysical Journal 68, 1678--1680.
Kellermayer, M. S., Karsai, A., Kengyel, A., Nagy, A., Bianco, P., Huber, T., Kulcsar, A., Niedetzky, C., Proksch, R., Grama, L., 2006. Spatially and temporally synchronized atomic force and total internal reflection fluorescence microscopy for imaging and manipulating cells and biomolecules. Biophysical Journal 91, 2665--2677.
15
Kriznik, A., Bouillot, M., Coulon, J., Gaboriaud, F., 2005. Morphological specificity of yeast and filamentous Candida albicans forms on surface properties. Rendus Biologies 328, 928--935.
Latgé, J.-P., 2007. The cell wall: a carbohydrate armour for the fungal cell. Molecular Microbiology 66, 279--290.
Lee, C.K., Wang, Y.M., Huang, L.S., Lin, S., 2007. Atomic force microscopy: determination of unbinding force, off rate and energy barrier for protein-ligand interaction. Micron 38, 446--461.
Lew, R.R., 2006. Use of Double Barrel Micropipettes to Voltage-Clamp Plant and Fungal Cells.Volcov, A.G. (Ed.) In: Plant Electrophysiology, Springer, Berlin and Heidelberg.
Li, G., Xi, N., Wang, D.H., 2006. Probing membrane proteins using atomic force microscopy. Journal of Cellular Biochemistry 97, 1191--1197.
Li, S., Hartman, G.L., Jarvis, B.B., Tak, H., 2001. A Stachybotrys chartarum isolate from soybean. Mycopathologia 154, 41--49.
Liu, G., Sheng, X., Greenshields, D.L., Ogieglo, A., Kaminskyj, S., Selvaraj, G., Wei, Y., 2005. Profiling of wheat class-III peroxidase genes derived from powdery mildew attacked epidermis reveals distinct sequence-associated expression patterns. Molecular Plant-Microbe Interactions 18, 730--741.
Ma, H., Snook, L.A., Tian, C., Kaminskyj, S.G.W., Dahms, T.E.S., 2006. Fungal surface remodelling visualized by atomic force microscopy. Mycological Research 110, 879--886.
Ma, H., Snook, L.A., Kaminskyj, S.G.W., Dahms, T.E.S., 2005. Surface ultrastructure and elasticity in growing tips and mature regions of Aspergillus hyphae describe wall maturation. Microbiology 151, 3679--3688.
McCully, M.E., Shane, M.W., Baker, A.N., Huang, C.X., Ling, L.E.C., Canny, M.J., 2000. The reliability of cryoSEM for the observation and quantification of xylem embolisms and quantitative analysis of xylem sap in situ. Journal of Microscopy 198, 24--33.
McIntosh, R.J., 2007. Cellular electron microscopy. In: Methods in Cell Biology, 79. Academic Press, New York.
McKeown, T. A., Moss, S.T., Jones, E.B.G., 1996. Atomic force and electron microscopy of sporangial wall microfibrils in Linderina pennispora. Mycological Research 100, 821--826.
Melling, M., Karimian-Teherani, D., Mostler, S., Behnam, M., Hochmeister, S., 2004. 3-D morphological characterization of the liver parenchyma by atomic force microscopy and by scanning electron microscopy. Microscopy Research and Technique 64, 1--9.
Mendez-Vilas, A., Diaz, J., Donoso, M.G., Gallardo-Moreno, A.M., Gonzalez-Martin, M.L., 2006. Ultrastructural and physico-chemical heterogeneities of yeast surfaces revealed by mapping lateral-friction and normal-adhesion forces using an atomic force microscope. Antonie Van Leeuwenhoek 89, 495--509.
Micic, M., Hu, D., Suh, Y.D., Newton, G., Romine, M., Lu, H.P., 2004. Correlated atomic force microscopy and fluorescence lifetime imaging of live bacterial cells. Colloids and Surfaces B: Biointerfaces 34, 205--212.
Muramatsu, H., Chiba, N., Umemoto, T., Homma, K., Nakajima, K., Ataka, T., Ohta, S., Kusumi, A., Fujihira, M., 1995. Development of near-field optic/atomic force microscope for biological materials in aqueous solutions. Ultramicroscopy 61, 265--269.
Muscariello, L., Rosso, F., Marino, G., Giordano, A., Barbarisi, M., Cafiero, G., Barbarisi, A., 2005. A critical overview of ESEM applications in the biological field. Journal of Cell Physiology 205, 328--334.
Nagao, E., Dvorak, J.A., 1998. An integrated approach to the study of living cells by atomic force microscopy. Journal of Microscopy 191, 8--19.
Nagarkar, S., Williams, G.A., 1997. Comparative techniques to quantify cyanobacteria dominated epilithic biofilms on tropical rocky shores. Marine Ecology Progress Series 154, 281--291.
16

Navratil, M., Mabbott, G.A., Arriaga, E.A., 2006. Chemical microscopy applied to biologicalsystems. Analytical Chemistry 78, 4005--4019.
Osada, T., Arakawa, H., Ichikawa, M., Ikai, A., 1998. Atomic force microscopy of histological sections using a new electron beam etching method. Journal of Microscopy 189, 43--49.
Osumi, M., 1998. The ultrastructure of yeast: cell wall formation. Micron 29, 207--233.Pelling, A. E., Sehati, S., Gralla, E.B., Gimzewski, J.K., 2005. Time dependence of the frequency
and amplitude of the local nanomechanical motion of yeast. Nanomedicine 1, 178--183.Pelling, A.E., Sehati, S., Gralla, E.B., Valentine, J.S., Gimzewski, J.K., 2004. Local
nanomechanical motion of the cell wall of Saccharomyces cerevisiae. Science 305, 1147--1150.
Pouliot, J.M., Walton, I., Nolen-Parkhouse, M., Abu-Lail, L.I., Camesano, T.A., 2005. Adhesion of Aureobasidium pullulans is controlled by uronic acid based polymers and pullulan. Biomacromolecules 6, 1122--1131.
Priester, J.H., Horst, A.M., Van De Werhorst, L.C., Saleta, J.L., Mertes, L.A.K., Holden, P.A., 2007. Enhanced visualization of microbial biofilms by staining and environmental scanning electron microscopy. Journal of Microbiological Methods 68, 577--587.
Protasoni, M., de Eguileor, M., Congiu, T., Grimaldi, A., Reguzzoni, M., 2003. The extracellular matrix of the cuticle of Gordius panigettensis (Gordioiidae, Nematomorpha): observations by TEM, SEM and AFM. Tissue and Cell 35, 306--311.
Radmacher, M., Fritz, M., Kacher, C.M., Cleveland, J.P., Hansma, P.K., 1996. Measuring the viscoelastic properties of human platelets with the atomic force microscope. Biophysical Journal 70, 556--567.
Radmacher, M., Cleveland, J.P., Fritz, M., Hansma, H.G., Hansma, P.K., 1994. Mapping interaction forces with the atomic force microscope. Biophysical Journal 66, 2159--2165.
Radmacher, M., Tillmann, R.W., Fritz, M., Gaub, H.E., 1992. From molecules to cells: imaging soft samples with the atomic force microscope. Science 257, 1900--1905.
Rajwa, B., McNally, H.A., Varadharajan, P., Sturgis, J., Robinson, J.P., 2004. AFM/CLSM data visualization and comparison using an open-source toolkit. Microscopy Research and Technique 64, 176--184.
Read, N.D., Lord, K.M., 1991. Examination of living fungal spores by scanning electron microscopy. Experimental Mycology 15, 132--139.
Refshauge, S., Watt, M., McCully, M.E., Huang, C.X., 2006. Frozen in time: A new method using cryo-scanning electron microscopy to visualize root-fungal interactions. New Phytologist 172, 369--374.
Rieti, S., Manni, V., Lisi, A., Giuliani, L., Sacco, D., D'Emilia, E., Cricenti, A., Generosi, R., Luce, M., Grimaldi, S., 2004. SNOM and AFM microscopy techniques to study the effect of non-ionizing radiation on the morphological and biochemical properties of human keratinocytes cell line (HaCaT). Journal of Microscopy 213, 20--28.
Rohde, M., Schwienbacher, M., Nikolaus, T., Heesemann, J., Ebel, F. 2002. Detection of early phase specific appendages during germination of Aspergillus fumigatus conidia. FEMS Microbiology Letters 206, 99--105.
Ross, B., Motherby, H., Saurenbach, F., Frohn, J., Kube, M., Bocking, A., 1998. Atomic force microscopy in effusion cytology. Analytical and Quantitative Cytology and Histology 20, 97--104.
Ryan, M. H., McCully, M.E., Huang, C.X., 2003. Location and quantification of phosphorus and other elements in fully hydrated, soil grown arbuscular mycorrhizas: a cryo-analytical scanning electron microscopy study. New Phytologist 160, 429--441.
17

Salerno, M.B., Li, X., Logan, B.E., 2007. Adhesion characteristics of two Burkholderia cepacia strains examined using colloid probe microscopy and gradient force analysis. Colloids and Surfaces B: Biointerfaces 59, 46--51.
Sánchez, C., Moore, D., Díaz-Godínez, G., 2006. Microscopic observations of the early development of Pleurotus pulmonarius fruit bodies. Mycologia 98, 682--669.
Santos, N.C., Castanho, M.A., 2004. An overview of the biophysical applications of atomic force microscopy. Biophysical Chemistry 107, 133--149.
Scheidegger, C., Brunner, I., 1993. Freeze-fracturing for low temperature scanning electron microscopy of Hartig net in synthesized Picea abies - Hebeloma crustiliniforme and Tricholoma vaccinum ectomytorrhizas. New Phytologist 123, 123--132.
Schneider, S.W., Yano, Y., Sumpio, B.E., Jena, B.P., Geibel, J.P., Gekle, M., Oberleithner, H., 1997. Rapid aldosterone-induced cell volume increase of endothelial cells measured by the atomic force microscope. Cell Biology International 21, 759--768.
Schultz, C., 2006.Cell imaging techniques: Methods and protocols. In: Methods in molecular biology, 319. Taatjes, D.J., Mossman, B.T. (Eds.), Wiley-VCH Verlag GmbH & Co., Weinheim.
Shen, Y., Sun, J.L., Zhang, A., Hu, J., Xu, L.X., 2007. A new image correction method for live cell atomic force microscopy. Physics in Medicine and Biology 52, 2185--2196.
Spagnoli, C., Beyder, A., Besch, S.R., Sachs, F., 2007. Drift-free atomic force microscopy measurements of cell height and mechanical properties. Review of Scientific Instruments 78, 036111--036113.
Stewart, A.D.G., 1985. The origins and development of scanning electron microscopy. Journal of Microscopy 139, 121--127.
Stokes, D.J., 2003. Recent advances in electron imaging, image interpretation and applications: Environmental scanning electron microscopy. Philosophical Transactions of the Royal Society of London A 361, 2771--2787.
Stokes, D.J., Donald, A.M., 2000. In situ mechanical testing of dry and hydrated breadcrumb in the environmental scanning electron microscope (ESEM). Journal of Materials Science 35, 599--607.
Svaldo-Lanero, T., Cavalleri, O., Krol, S., Rolandi R., Gliozzi, A., 2006. Mechanical properties of single living cells encapsulated in polyelectrolyte matrixes. Journal of Biotechnology 124, 723--731.
Svaldo-Lanero, T., Krol, S., Magrassi, R., Diaspro, A., Rolandi, R., Gliozzi, A., Cavalleri, O., 2007. Morphology, mechanical properties and viability of encapsulated cells. Ultramicroscopy 107, 913--921.
Szeghalmi A., Kaminskyj, S., Gough, K.M., 2007. A synchrotron FTIR microspectroscopy investigation of fungal hyphae grown under optimal and stressed conditions. Analytical and Bioanalytical Chemistry, 387, 1779--1789
Takahashi, Y., Hirano, Y., Yasukawa, T., Shiku, H., Yamada H., Matsue, T., 2006. Topographic, electrochemical, and optical images captured using standing approach mode scanning electrochemical/optical microscopy. Langmuir 22, 10299--10306.
Takano, H., Kenseth, J.R., Wong, S.S., O'Brien, J.C., Porter, M.D. 1999. Chemical and biochemical analysis using scanning force microscopy. Chemical Reviews 99, 2845--2890.
Touhami, A., Hoffmann, B., Vasella, A., Denis, F.A., Dufrêne, Y.F., 2003. Aggregation of yeast cells: direct measurement of discrete lectin-carbohydrate interactions. Microbiology 149, 2873--2878.
Ubbink, J., Schar-Zammaretti, P., 2005. Probing bacterial interactions: integrated approaches combining atomic force microscopy, electron microscopy and biophysical techniques. Micron 36, 293--320.
18

Uehara, H., Osada, T., Ikai, A., 2004. Quantitative measurement of mRNA at different loci within an individual living cell. Ultramicroscopy 100, 197--201.
Wolski, E., Maldonado, S., Daleo, G., Andreu, A., 2007. Cell wall α-1,3-glucans from a biocontrol isolate of Rhizoctonia: immunocytolocalization and relationship with α-glucanase activity from potato sprouts. Mycological Research 111, 976--984.
Woolley, A.T., Cheung, C.L., Hafner, J.H., Lieber, C.M., 2000. Structural biology with carbon nanotube AFM probes. Chemical Biology 7, R193--204.
Zhao, L., Schaefer, D., Marten, M.R., 2005a. Assessment of elasticity and topography of Aspergillus nidulans spores via atomic force microscopy. Applied Environmental Microbiology 71, 955--960.
Zhao, L., Schaefer, D., Xu, H., Modi, S.J., LaCourse, W.R., Marten, M.R., 2005b. Elastic properties of the cell wall of Aspergillus nidulans studied with atomic force microscopy. Biotechnology Progress 21, 292--299.
19

Figure 1. The powdery mildew fungus, Blumeria graminis tritici (Bgt), 24 h after inoculation onto the leaf surface of compatible (a-c) and incompatible (d) wheat strains. Infected leaves were frozen at -80 ºC on a metal block and then lyophilized, so no chemical treatments were used during preservation. a) A Bgt spore (S) has germinated and formed an appressorium (A), in order to penetrate the leaf epidermis. This sample was imaged uncoated. The infection structures on the compatible leaf surface are collapsing as the Bgt cytoplasm migrates from the spore through the germtube and appressorium and into the haustorium (not shown), which forms beneath the appressorium within the leaf for nutrient acquisition. b) Leaf surfaces could be damaged (oval) by prolonged imaging even at beam currents below 100 pA, so prior to additional manipulation, regions of interest were protected with a platinum patch (Pt), about 50 nm thick, whose edge is indicated by the arrow. c) A region of the leaf epidermis was removed using a focused ion beam, to reveal where the appressorium had penetrated. This collapsed appressorium is devoid of cytoplasm, which has migrated through the penetration pore (P). d) An incompatible Bgt-wheat interaction, showing an attempted penetration site (P). The wheat leaf responded to attempted invasion by reinforcing the wall with additional material. Unlike the compatible interaction shown in a and c, the appressorium growing on the incompatible surface still contained cytoplasm, whose freeze-dried remnants are visible within the appressorium, so it had not collapsed.Bar in a (for a and b) = 10 μm; bar in c (for c and d) = 1 μm
20

Figure 2. SEM image of an incompatible interaction between Blumeria graminis tritici, and a wheat leaf from a resistant cultivar. The fungal structures on the leaf had not collapsed since they still contained cytoplasm that had been prevented from migrating into the leaf. a, b) Creating a thin section for STEM imaging and EDS analyses, using a procedure called in situ lift out. a) Isolating a thin section of leaf containing the attempted penetration site. b) The section is released after attaching the liftout probe (LP) with a Pt weld, and severing the sides of the section using the focused ion beam. c) The specimen is attached to a copper grid (Cu) prior to using a Pt weld. The liftout probe (LP) can then be detached.d) Fine milling for STEM imaging and chemical analysis by EDS (circled area), shown from the opposite side. The section has been fine milled to reduce its thickness (original thickness, ~ 1 μm; final thickness, < 100 nm).
21
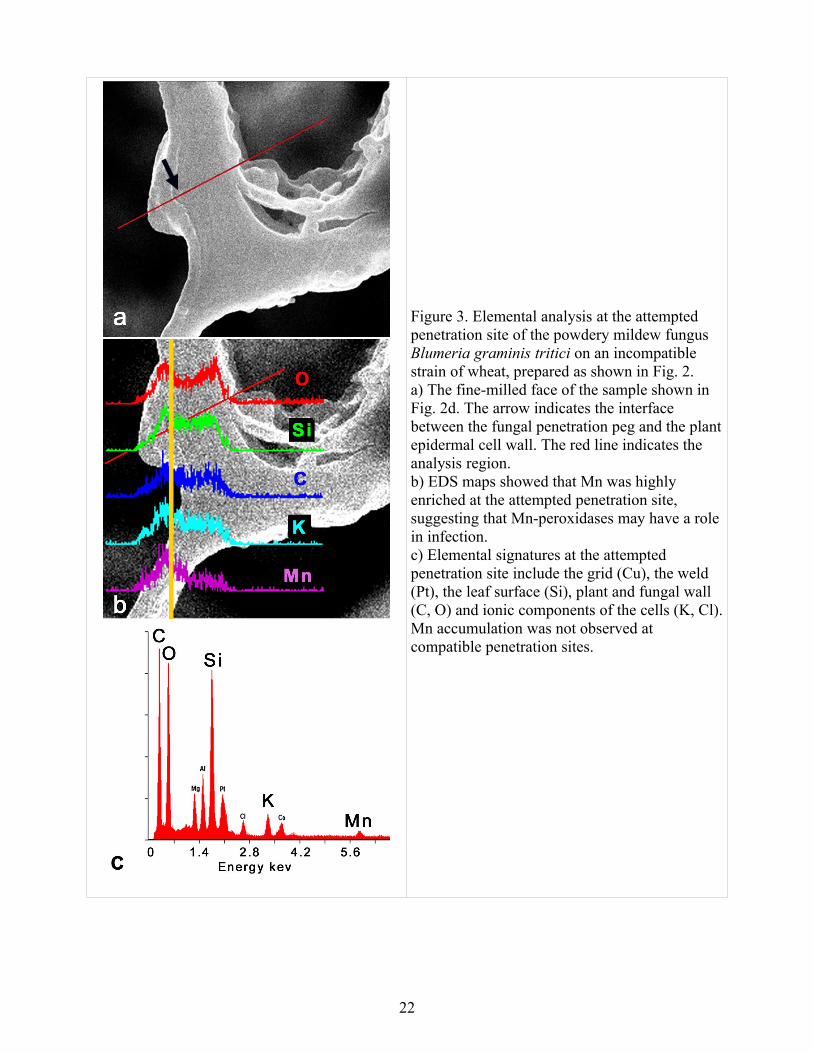
Figure 3. Elemental analysis at the attempted penetration site of the powdery mildew fungus Blumeria graminis tritici on an incompatible strain of wheat, prepared as shown in Fig. 2. a) The fine-milled face of the sample shown in Fig. 2d. The arrow indicates the interface between the fungal penetration peg and the plant epidermal cell wall. The red line indicates the analysis region. b) EDS maps showed that Mn was highly enriched at the attempted penetration site, suggesting that Mn-peroxidases may have a role in infection.c) Elemental signatures at the attempted penetration site include the grid (Cu), the weld (Pt), the leaf surface (Si), plant and fungal wall (C, O) and ionic components of the cells (K, Cl). Mn accumulation was not observed at compatible penetration sites.
22

Figure 4. Aspergillus nidulans visualized by atomic force microscopy, showing dry (a-c) and swollen (d-e) asexual spores, and a hypha (f-g). a) Topography of a whole spore, collected from a dry culture and imaged by contact mode AFM (bar = 1 µm). Lateral force images of the spore surface were imaged by contact mode AFM at b) medium (bar = 300 nm) and c) high resolution showing the hydrophobin rodlet layer on the spore surface (bar = 30 nm). These are hydrophobic proteins on the surface of aerial structures and air-dispersed spores, which form characteristic rodlets 10 nm wide by many nm long. The topography of a swollen spore was imaged following incubation in media at d) low (bar = 1 µm) and e) high resolution to highlight surface features. There is obvious rearrangement of the conidial surface (a-c) structure following imbibition, accompanied by rodlet loss and/or rearrangement (d, e). A mature hypha (f) is 3 μm in diameter (bar = 1 μm), and the high resolution image (g) of the surface shows the relatively ordered lateral packing of the mature hyphal wall (bar = 100 nm).
23
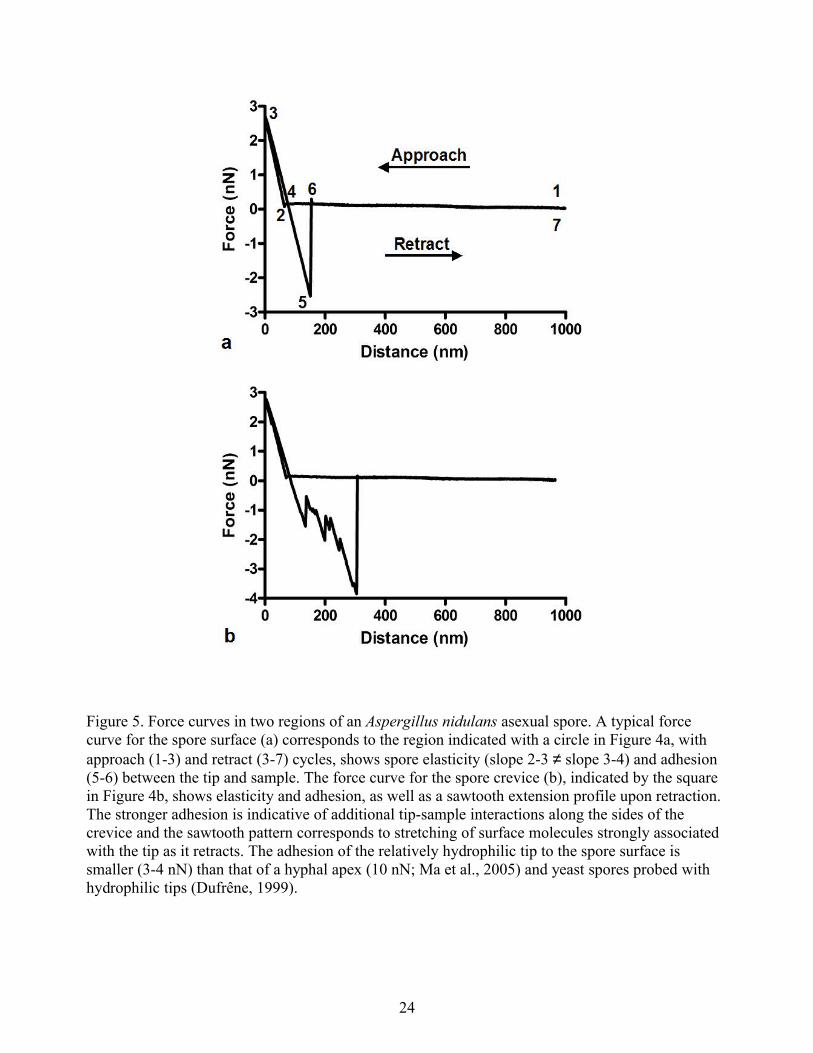
Figure 5. Force curves in two regions of an Aspergillus nidulans asexual spore. A typical force curve for the spore surface (a) corresponds to the region indicated with a circle in Figure 4a, with approach (1-3) and retract (3-7) cycles, shows spore elasticity (slope 2-3 ≠ slope 3-4) and adhesion (5-6) between the tip and sample. The force curve for the spore crevice (b), indicated by the square in Figure 4b, shows elasticity and adhesion, as well as a sawtooth extension profile upon retraction. The stronger adhesion is indicative of additional tip-sample interactions along the sides of the crevice and the sawtooth pattern corresponds to stretching of surface molecules strongly associated with the tip as it retracts. The adhesion of the relatively hydrophilic tip to the spore surface is smaller (3-4 nN) than that of a hyphal apex (10 nN; Ma et al., 2005) and yeast spores probed with hydrophilic tips (Dufrêne, 1999).
24

Figure 6. Lateral force (a, c) and topography (b, d) AFM images of the Aspergillus nidulans hypA1 temperature sensitive morphogenesis mutant grown initially at 42 ºC to produce the poorly-polarized mutant phenotype (bracket), transitioned to the wild-type phenotype with a temperature shift. The lateral force (a) and topography (b) images of the mutant show a poorly-polarized center approximately 10 μm in diameter arising from growth at 42 ºC, and three polarized hyphae (40 - 45 μm each) that formed following the temperature shift (28 ºC). Bar = 1 μm. High resolution lateral force (c) and topography (d) images show transition in subunit size and lateral packing from the more disordered cell wall of the poorly polarized wall produced at 42 ºC (bottom) towards the mature hyphal wall of the polarized hypha produced at 28 ºC (top). Bar = 100 nm. The lateral force mode is a convolution of tip-sample interactions and surface topography for rough samples, providing AFM images with greater contrast.
25