high spatial resolution land use and land cover mapping of
TRANSCRIPT
291 VOL. 46(3) 2016: 291 - 302
http://dx.doi.org/10.1590/1809-4392201505504
ACTAAMAZONICA
High spatial resolution land use and land cover mapping of the Brazilian Legal Amazon in 2008 using Landsat-5/TM and MODIS dataCláudio Aparecido de ALMEIDA1*, Alexandre Camargo COUTINHO2, Júlio César Dalla Mora ESQUERDO2, Marcos ADAMI3 , Adriano VENTURIERI4, Cesar Guerreiro DINIZ3, Nadine DESSAY5, Laurent DURIEUX5, Alessandra Rodrigues GOMES3
1 National Institute for Space Research (INPE) - Image Processing Division, Av. dos Astronautas, 1758, São José dos Campos, SP, Brazil.2 Brazilian Agricultural Research Corporation (EMBRAPA ) - Agriculture Informatics, Av. André Tosello, nº 209, Campinas, SP, Brazil. 3 National Institute for Space Research (INPE) - Amazon Regional Center, Av. Perimetral 2651, Belém, PA, Brazil. 4 Brazilian Agricultural Research Corporation (EMBRAPA ) - Eastern Amazon Trav. Dr. Enéas Pinheiro, s/n°, Belém, PA, Brazil. 5 Institut de Recherche pour le Développement (IRD) - Unité Espace-Dev, 500 rue JF Breton – Montpellier, France.
* Corresponding Author: [email protected]
ABSTRACTUnderstanding spatial patterns of land use and land cover is essential for studies addressing biodiversity, climate change and environmental modeling as well as for the design and monitoring of land use policies. The aim of this study was to create a detailed map of land use land cover of the deforested areas of the Brazilian Legal Amazon up to 2008. Deforestation data from and uses were mapped with Landsat-5/TM images analysed with techniques, such as linear spectral mixture model, threshold slicing and visual interpretation, aided by temporal information extracted from NDVI MODIS time series. The result is a high spatial resolution of land use and land cover map of the entire Brazilian Legal Amazon for the year 2008 and corresponding calculation of area occupied by different land use classes. The results showed that the four classes of Pasture covered 62% of the deforested areas of the Brazilian Legal Amazon, followed by Secondary Vegetation with 21%. The area occupied by Annual Agriculture covered less than 5% of deforested areas; the remaining areas were distributed among six other land use classes. The maps generated from this project – called TerraClass - are available at INPE’s web site (http://www.inpe.br/cra/projetos_pesquisas/terraclass2008.php).KEYWORDS: Remote Sensing, Tropical Deforestation, TerraClass, Image Processing.
Mapeamento do uso e cobertura da terra na Amazônia Legal Brasileira com alta resolução espacial utilizando dados Landsat-5/TM e MODISRESUMOEntender o padrão espacial do uso e cobertura da terra é essencial para estudos de biodiversidade, mudanças climáticas e modelagem ambiental, bem como para concepção e acompanhamento de políticas direcionadas ao uso da terra. O objetivo deste estudo foi criar um mapa detalhado do uso e cobertura da terra para a porção desflorestada da Amazônia Legal Brasileira, até 2008. Dados de desflorestamento e uso foram mapeados usando imagens Landsat-5/TM analisadas com técnicas como modelo linear de mistura espectral, fatiamento e interpretação visual, auxiliados por informações temporais de NDVI extraídas de série temporal de dados MODIS. O resultado deste estudo é um mapa de uso e cobertura da terra com alta resolução espacial para toda Amazônia Legal Brasileira, para o ano de 2008, e os respectivos percentuais da área ocupada por diferentes classes de uso da terra. O resultado mostrou que, quatro classes de pastagens cobrem 62% da área desflorestada da Amazônia Legal Brasileira, seguida pela vegetação secundária com 21%. A área ocupada pela agricultura anual cobriu menos de 5% das áreas desflorestadas; as áreas restantes estavam distribuídas em outras seis classes de uso da terra. Os mapas gerados por este projeto, chamado TerraClass, estão disponíveis no site do INPE (http://www.inpe.br/cra/projetos_pesquisas/terraclass2008.php). PALAVRAS-CHAVE: Sensoriamento Remoto, Desflorestamento Tropical, TerraClass, Processamento de Imagens.
292 VOL. 46(3) 2016: 291 - 302 ALMEIDA et al.
High spatial resolution land use and land cover mapping of the Brazilian Legal Amazon in 2008 using Landsat-5/TM and MODIS data
ACTAAMAZONICA
INTRODUCTIONOver the last decades, many global scale, land use and
land cover products based on coarse spatial resolution remote sensing data, have become available. For example, in the early 2000s, land cover maps at 1000 m spatial resolution such as Global Land Cover (GLC) 2000 (Bartholome et al. 2002) and MODIS Global Land Cover (Friedl et al. 2002) were released. Later, higher resolution data of land cover were made available, including the MODIS collection 5 Global Land Cover (Friedl et al. 2010) at 500 m spatial resolution and the GLOBCOVER 2005 and 2009 products (Arino et al. 2007; Bontemps et al. 2010) at 300 m spatial resolution. While these products offered important advances in mapping global trends, applications relevant for national or regional decision-making require even finer resolution, particularly as the results of land use change analysis have been reported to differ depending on the scale of mapping. (Rozon et al. 2015).
In this work, the area under study is the Brazilian Legal Amazon. The Brazilian National Institute for Space Research (INPE) has been producing data on spatial extent of deforestation in this region since 1988 through the Program for Deforestation Monitoring in the Brazilian Legal Amazon (PRODES). TerraClass is a complement to PRODES by adding information about what was the land use and land cover spatial distribution and regional statistics in the deforested areas up to 2008. According to PRODES, deforestation in the Brazilian Amazon up to 2008 amounted to 719,710 km2 (INPE 2015) nearly twice the size of Germany’s land area, for comparison. The scale of this deforestation has an impact on ecosystem services, biodiversity, water cycle and the carbon cycle (Fearnside 2006). Yet, in addition to the biological impacts of deforestation in the region, this deforested area is an issue of interest as it now encompasses highly diverse socio-economic environments (Margulis 2003; Morton et al. 2006; Barona et al. 2010) as one example, research within the Brazilian Amazon has suggested that over the last two decades, macro-economic forces have played an increasing role in deforestation in the Brazilian Amazon: large-scale cattle raising, industrial timber and wood, soybean and infrastructure investments are thought to have an increasingly greater role (Margulis 2003; Coutinho 2009).
TerraClass projects represents a concerted effort to monitor Land Use and Land Cover in the Brazilian Legal Amazon. This study offers to researchers a greater ability to trace out different classes of land use change over time, which can shed further light into the original land-uses post-deforestation and test how land use land cover and socio-economic dynamics may be changing over time across the entire region. Access to more historical data, along with continued monitoring in the years ahead, will allow make more rigorous analysis of both
the drivers of deforestation and more accurate estimates of greenhouse gas sinks and emissions.
Therefore, to assist and promote better-informed land use planning and decision making for the Amazon region, INPE and the Brazilian Agricultural Research Corporation (Embrapa) have started a technical partnership in this study, which aimed to create a detailed map of land use land cover of the deforested areas of Brazilian Legal Amazon up to 2008.
MATERIALS AND METHODSStudy area
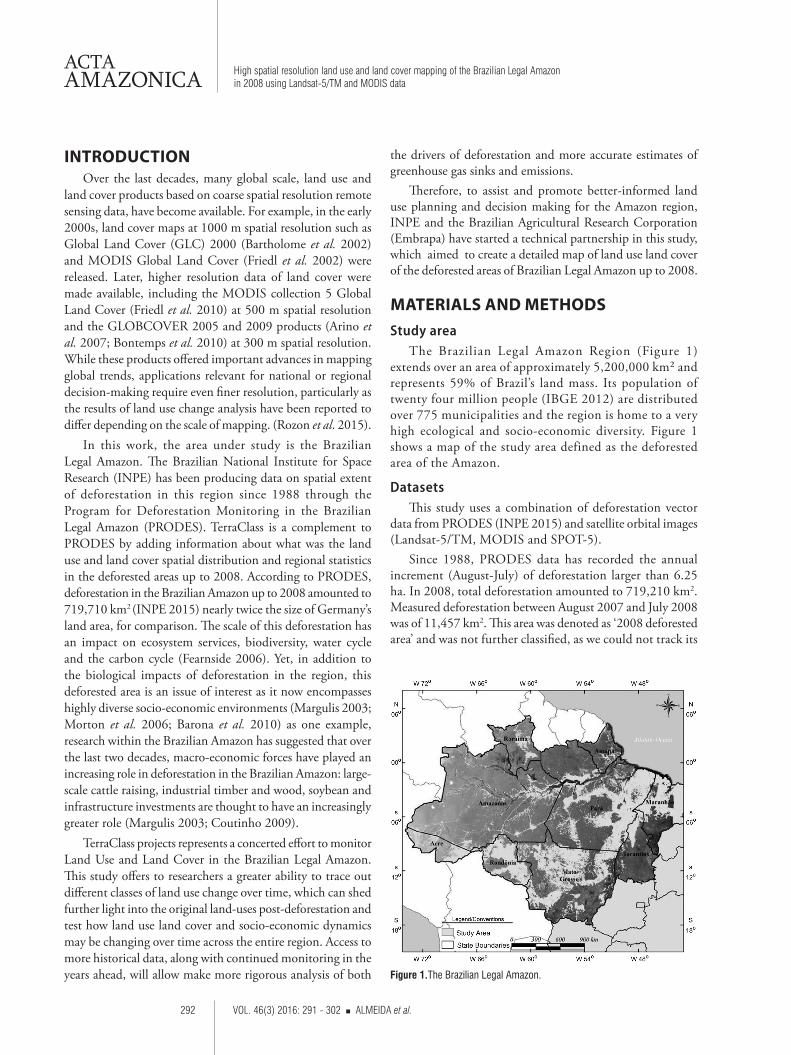
The Brazilian Legal Amazon Region (Figure 1) extends over an area of approximately 5,200,000 km² and represents 59% of Brazil’s land mass. Its population of twenty four million people (IBGE 2012) are distributed over 775 municipalities and the region is home to a very high ecological and socio-economic diversity. Figure 1 shows a map of the study area defined as the deforested area of the Amazon.
DatasetsThis study uses a combination of deforestation vector
data from PRODES (INPE 2015) and satellite orbital images (Landsat-5/TM, MODIS and SPOT-5).
Since 1988, PRODES data has recorded the annual increment (August-July) of deforestation larger than 6.25 ha. In 2008, total deforestation amounted to 719,210 km2. Measured deforestation between August 2007 and July 2008 was of 11,457 km2. This area was denoted as ‘2008 deforested area’ and was not further classified, as we could not track its
Figure 1.The Brazilian Legal Amazon.

293 VOL. 46(3) 2016: 291 - 302 ALMEIDA et al.
High spatial resolution land use and land cover mapping of the Brazilian Legal Amazon in 2008 using Landsat-5/TM and MODIS data
ACTAAMAZONICA
evolution into other land cover types using 2008 images. The PRODES data was used to provide a mask of areas for use in the subsequent land cover classification procedures.
Landsat images have been successfully used in deforestation monitoring and land use and land cover studies, due mainly to its high spatial resolution (30 m) and capacity to discriminate objects and vegetation typology (Dubreuil et al. 2008; Bodart et al. 2011). This study used 214 geo-referenced Landsat-5/TM images available from the INPE´s Image catalog (http://www.dgi.inpe.br/CDSR/). The Landsat images are the same used to generate PRODES deforestation products. This set of images was collected mainly for the period July-September 2008 (187 scenes) when cloud cover is at its lowest in the Amazon. The Landsat images were the primary key source data for our land cover classification.
Due to its high temporal resolution of 1-2 days (compared to Landsat’s 16-18 days), Moderate Resolution Imaging Spectroradiometer (MODIS) images have been widely used for continuous land use and land cover mapping, despite their limited spatial resolution of 250-1000 m (Eva et al. 2010; Verbesselt et al. 2012; Atzberger 2013). This study employs data from the MODIS Normalized Difference Vegetation Index (NDVI) MOD13Q1 product (NASA 2001) over the period from August 2007 to July
2008 to identify annual crop areas based on their seasonal phenology. The MODIS product used is a 16-day composite of the highest quality pixels from daily images at a spatial resolution of 250 m.
TerraClass land cover classification was validated using SPOT-5 HRG (High Geometric Resolution) data in “panchromatic” mode (PAN, 0.51 – 0.73 µm) at 2.5 m spatial resolution. The geometric accuracy of these images is sufficient for their use in photointerpretation (Jensen 2009) and they were used here to assess our mapping accuracy.
Land Cover ClassificationThe methodology combines products of high spatial
and temporal resolution to increase the mapping efficiency of land use and land cover (LULC) in the Brazilian Amazon. Table 1 lists the twelve classes of land uses used this region, which also represent the main types of land use land cover in the region. Figure 2 provides a flowchart of the methodological approach described in this paper. Land cover classification was attained by a sequence of operations, each one solving a classification decision and defining the region to be addressed by the next operation. The sequence of operations occurred in the order described in the following text.
Table 1. Main types of Land Cover in deforested areas of the Brazilian Amazon.
Thematic Categories Description
Deforestation 2008Areas recently deforested covered by soil, shrubs, herbage and felled trees with no defined land use at this stage, defined as areas that were mapped by PRODES project as deforested in 2008.
Urban areaPopulation concentration forming small inhabited places, villages and cities that present differentiated infrastructure from the rural areas with street design and higher density of dwellings such as houses, buildings and other public spaces.
Mining Areas of mineral extraction with the presence of bare soil and deforestation in the proximity of water bodies.
Mosaic of Uses Characterized by land cover units that, due to the spatial resolution of the satellite images, cannot be broken down further into specific components. For example, this classification might include family agriculture practiced in conjunction with the traditional cattle raising.
Annual Crops Extensive areas with predominance of annual crops, specially grains, highly technological such as certified seeds, enriched soil, chemicals, fertilizers, mechanization among other resources.
Herbaceous PasturePasture in productive process with predominance of herbage and coverage between 90 and 100% by different species of grass.
Shrubby PastureAreas of pasture in productive process with predominance of herbage and coverage by species of grass between 50% and 80% associated to the presence of shrubby vegetation with coverage between 20% and 50%.
Pasture with exposed soilPasture areas, exhibiting signs of severe degradation, containing at least 50% bare soil.
Regeneration with PastureAreas that were clear-cut, later developed as pasture and are at the beginning of a regenerative process containing shrubs and early successional vegetation.
Secondary VegetationAreas that were clear-cut and are at an advanced stage of regeneration with trees and shrubs. Includes areas that were used for forestry (silviculture) or permanent agriculture with use of native or exotic species.
OthersAreas not encompassed by other categories such as rocky or mountain outcrops, river shores and sand banks, among others.
Non-observed areaAreas not possible to be interpreted due to clouds or cloud shade at the moment of the satellite overpass or recently burned areas.

294 VOL. 46(3) 2016: 291 - 302 ALMEIDA et al.
High spatial resolution land use and land cover mapping of the Brazilian Legal Amazon in 2008 using Landsat-5/TM and MODIS data
ACTAAMAZONICA
Deforestation maskTerraClass has as study area the polygons defined as
deforested areas by PRODES up to 2007.
Generation and clipping of fraction imagesSecond, to aid in the analysis, we applied a linear spectral
mixture model methodology, developed by Mello et al. (2003) to obtain the soil, shade and vegetation fractions for each single pixel in the Landsat-5/TM images. The endmembers spectral signatures were acquired directly from each Landsat-5/TM images using representative targets of green vegetation, soil and shade. This procedure has been widely used in literature (Shimabukuro et al. 1998; Lu 2003; Mello et al. 2003) We then used the deforestation mask to eliminate already classified areas from analysis (i.e. forested areas), leaving only deforested areas for subsequent classification.
Visual InterpretationThrough visual interpretation step four low-frequency
land cover classes were identified and mapped: urban areas, mining, others and non-observed areas due to cloud cover. This visual interpretation procedure has been reported in the literature to as a reliable method to characterize specific features (Novo 2008; Jensen 2009; Ponzoni et al. 2012), and it is based on the analysis of color, shape, texture, size and attributes of neighbouring pixels. An interpretation key was developed (shown in Table 2) so as to minimize errors due to subjective interpretation as well as to standardize the process among the technical personnel involved. These areas were then masked out from the deforested area.
Secondary vegetationIn this study, secondary vegetation consisted of originally
forested areas that had been clear cut, used for silviculture,
agriculture or pasture and then left to regenerate, taking on a forest appearance again.
The areas mapped as secondary vegetation are in various stages of development, from initial stages, when the canopy is homogeneous and few species are found, to advanced stages when canopy heterogeneity and species diversity is similar to the original forest (Vieira et al. 2003).
Secondary vegetation areas were identified using the fraction images and color composite images of Landsat-5/TM bands 3, 4 and 5. With the vegetation fraction images from the linear mixture model, it was possible to identify a threshold above which land cover is dominated by secondary vegetation. These values varied for each image and once the spectral pattern was identified, the technique of image slicing was applied to create a thematic image (Almeida et al. 2010).
The image slicing results were used to create a group of thematic images of the secondary vegetation. Additional editing of imperfections found in secondary vegetation mapping was conducted with the aid of the color composites and the final secondary vegetation polygons were masked out of the fractional images.
AgricultureTo map annual crops, we used an automatic classification
procedure based on the spectral and temporal characteristics of the MODIS Normalized Difference Vegetation Index (NDVI) (Rouse et al. 1974). Areas covered by annual crops present a particular seasonal biomass variation which allows the distinction of this class from other land covers based on behaviour of the NDVI time series of each pixel during the growing cycle (Adami et al. 2005; Rudorff et al. 2011; Arvor et al. 2012a).
Figure 2. TerraClass project flowchart.

295 VOL. 46(3) 2016: 291 - 302 ALMEIDA et al.
High spatial resolution land use and land cover mapping of the Brazilian Legal Amazon in 2008 using Landsat-5/TM and MODIS data
ACTAAMAZONICA
The analysis was applied over 23 dates of MODIS-NDVI composites, acquired for the nine Amazon States between August 2007 and July 2008. The applied method has been demonstrated as useful for crop identification and mapping, especially in large mechanized agriculture areas (Adami et al. 2005; Arvor et al. 2012b; Vuolo and Atzberger 2012).
The adopted mapping method used the maximum and minimum NDVI values identified throughout the time series, based on the premise that each target presents a typical temporal behaviour. That is, in the case of the annual crops, the vegetation indices present low values at the beginning of the growing cycle, when the amount of biomass is low and the spectral response is influenced by the soil and, as the crops grow and gain biomass, the indices respond with higher values until reaching the vegetative peak. There is a decrease in value at the beginning of senescence, until they reach the same levels of the beginning of the cycle. This pattern is represented in figure 3. Considering this typical
temporal behaviour of the farming areas, the annual crop pixel mapping was done using the difference between the NDVI values at vegetative peak and the values at the cycle beginning, when there is greatest distance between them.
To minimize clouds interference in the temporal analysis, prior to classification, we applied an image filtering technique on the MODIS images based on harmonic analysis using HANTS algorithm, Harmonic Analysis of NDVI Time Series (Roerink et al. 2000)
The standard amplitude between maximum and minimum NDVI values was estimated based on known agricultural areas previously identified on Landsat-5/TM scenes. MODIS NDVI temporal profiles were generated for those areas to evaluate the seasonal variation of the biomass during the growing cycle and determine best periods to obtain maximum and minimum NDVI values. Once the standard difference value was established, a classification procedure based on an IDL (Interactive
Table 2. Visual interpretation key.
Urban Area
ColorMagenta and Cyan
TonalityMedium to High
TextureRoughened with systematic pattern
FormRegular
MiningColorMagenta and Cyan
TonalityMedium to High
TextureSmoother
FormIrregular
Mosaic of UsesColorMagenta
TonalityMedium to High
TextureRoughened and heterogeneous
FormIrregular
Annual CropsColorMagenta
TonalityMedium to Light
TextureSmoother
FormRegular
Herbaceous PastureColorMagenta
TonalityLight
TextureSmoother
FormRegular or Irregular
Shrubs Pasture
ColorMagenta or light green
TonalityLight
TextureSmoother
FormRegular or Irregular
Pasture with exposed soilColorMagenta and Cyan
TonalityLight or Medium
TextureSmoother
FormRegular or Irregular
Regeneration with PastureColorMagenta or light green
TonalityLight or Medium
TextureSmoother or Slightly Roughened
FormRegular or Irregular
Secondary VegetationColorGreen
TonalityLight or Medium
TextureSmoother or Roughened
FormRegular or Irregular
OthersColorDoes not apply
TonalityDoes not apply
TextureDoes not apply
FormIrregular
Non-observed areaColorWhite and various shades of black
TonalityHigh
TextureSmoother
FormIrregular

296 VOL. 46(3) 2016: 291 - 302 ALMEIDA et al.
High spatial resolution land use and land cover mapping of the Brazilian Legal Amazon in 2008 using Landsat-5/TM and MODIS data
ACTAAMAZONICA
Data Language) code (Roerink et al. 2000) was applied to produce a binary image with the location of the MODIS pixels classified as annual crops, named “agricultural MODIS mask”.
The agricultural MODIS mask was employed to choose sample areas for the supervised classification of Landsat-5/TM images. First, image segmentation was conducted to discriminate spectrally homogeneous fields. Segmentation was based on the Regional Growth the algorithm available in the SPRING software (Câmara et al. 1996). It requires two parameters to aggregate pixels into homogeneous fields: the similarity and area thresholds. The similarity threshold is defined as the Euclidian distance between the grey values of two adjacent pixels or fields while the area threshold is defined as the minimum area in number of pixels to be considered as a field. There is no standard value for these thresholds as they depend on the land use spatial patterns present in each landscape. Consequently, the user has to make several approximations until a segmentation scheme is considered adequate. In our study, we found optimal similarity values between 10 and 20 grey levels and an optimal minimum area of 49 pixels giving a minimum mapping area of 4.4ha.
Following segmentation, supervised classification of the Landsat-5/TM images was conducted using the Bhattacharya classifier available in SPRING (Câmara et al. 1996). The final map of the annual crops therefore combines the temporal information of the MODIS images with the spatial resolution of Landsat-5/TM images. Following final classification and additional manual editing of eventual misclassifications, the agricultural polygons were identified in the deforested area and masked out of the fraction image.
Figure 3. MODIS/NDVI temporal profiles of annual agriculture, forest and pasture between August 2007 and July 2008.
Pasture and mosaic of usesThe final stage of analysis involved the classification of the
remaining area dominated by pasture into four categories, Herbaceous Pasture, Shrubs Pasture, Regeneration with Pasture and Bare Soil Pasture, and a final miscellaneous ‘mosaic of uses’ category among the remaining land areas. Segmentation of fraction images was conducted as described above which was followed by a visual classification of polygons based on the interpretation key presented in Table 2 to attain consistent and precise identification of individual categories (Kelly et al. 1999; Jensen 2009).
These five land cover classes represent distinct land occupation patterns in the Amazon, as suggested by Poccard-Chapuis et al. (2005), and identifying them allows researchers to observe the land abandonment and forest regeneration processes. As reported by Uhl et al. (1988), abandoned pastures appear as forest regeneration with distinct biomass accumulations that vary according to time since last land use and the its intensity and duration. Other authors (Morton et al. 2006; Barona et al. 2010) pointed out that part of the soy development in the Amazon region has occurred by replacing pastures with soybeans, which may have been associated with have induced pasture expansion towards the deforestation frontier. Thus identifying and quantifying pastures spatial distribution according to its vegetative condition is essential to examine these hypothesis.
Fieldwork, final verification and data mosaicDuring our study, we collected 3,800 geo-referenced
photographs, in a field mission that covered more than 10,000 km in the Brazilian Amazon. These photographs were used as support material during the interpretation process, and are

297 VOL. 46(3) 2016: 291 - 302 ALMEIDA et al.
High spatial resolution land use and land cover mapping of the Brazilian Legal Amazon in 2008 using Landsat-5/TM and MODIS data
ACTAAMAZONICA
publicly available on the INPE’s website (www.obt.inpe.br/fototeca/fototeca.html).
At the end of the interpretation step, technicians external to the project verified the entire classification process aiming to reduce errors from divergent interpretation. The interpretation key showed in Table 2 was used in this step.
The validation consisted of taking a geographically random sample of 535 points from all of the 12 categories identified. The number of sample points was determined so as to reach a statistical consistency with the level of confidence (95%) and a confidence interval of 5% for the polygon population of approximately 2.5 million cases.
The procedure adopted for the validation of points was based initially on the visual identification of classes using SPOT-5 HRG at 2.5 m spatial resolution images, which were then overlapped and compared to the map produced by TerraClass.
The final TerraClass map covering the entire Brazilian Amazon was composed by the final classified product combined with PRODES regional data of forested areas in 2008, non-forested vegetation and water bodies.
RESULTSTable 3 summarizes the results of the land use and land
cover classification in the deforested areas of the Brazilian Legal Amazon. The land use category with the largest territorial coverage is Herbaceous Pasture which occurred in 46.7% of the deforested areas. When Shrubs and Regeneration Pasture
are also considered, this figure goes up to 62.1% of the total deforested area. In the table 4 it can see that Herbaceous Pasture is found in 335,700 km2 of the Amazon deforested area with the largest incidence in Mato Grosso (MT), Para (PA) and Rondonia (RO) States with areas of 107,500 km2, 107,300 km2 and 52,900 km2, respectively, representing 79.6% of total Herbaceous Pasture cover.
Table 3. Land Use and Land Cover by class for the Brazilian Amazon in 2008.
Area (km²)Percentage
Cover
Cumulative Percentage
Cover
Herbaceous Pasture 335,714.94 46.68 46.68
Secondary Vegetation 150,815.31 20.67 67.65
Shrubs Pasture 62,823.75 8.74 76.38
Pasture with Regeneration 48,027.37 6.68 83.06
Non-observed Area 45,406.27 6.31 89.37
Annual Crops 34,927.24 4.86 94.23
Mosaic of Uses 24,416.57 3.39 97.63
Urban Area 3,818.14 0.53 98.16
Mining 730.68 0.10 98.26
Pasture with exposed soil 594.19 0.08 98.34
Others 477.88 0.07 98.41
Deforestation 2008 11,458.64 1.59 100.00
TOTAL 719,210.98 100
Table 4. Distribution of the areas corresponding to each thematic category mapped by State (km² x 1000). Hyphens are used to denote the lack of occurrence of specific land use categories in particular states.
Class Acre Amapa Amazonas MaranhaoMato
GrossoPara Rondonia Roraima Tocantins TOTAL
Forest 144.6 110.8 1,426.5 36.0 316.9 888.5 128.1 152.6 10.0 3,214.0
Non-forest 0.1 25.6 48.3 112.6 377.3 73.7 24.4 60.9 230.3 953.3
Hydrograph 0.2 3.6 52.2 4.4 4.8 44.3 2.1 1.8 1.5 114.9
Deforestation 2008 0.3 0.1 0.5 1.2 3.2 4.8 0.9 0.4 0.1 11.5
Annual Crops - <0.05 0.1 0.2 31.0 2.1 1.4 <0.05 0.1 34.9
Mosaic of Uses 1.5 0.2 2.9 4.5 2.3 11.4 0.8 0.7 <0.05 24.4
Urban area 0.2 0.1 0.5 0.8 0.5 1.3 0.4 0.0 0.1 3.8
Mining - <0.05 <0.05 <0.05 0.2 0.3 0.1 <0.05 <0.05 0.7
Others <0.05 <0.05 0.1 0.1 0.1 0.1 <0.05 <0.05 <0.05 0.5
Herbaceous Pasture 11.5 0.4 6.6 31.1 107.5 107.3 52.9 2.7 15.8 335.7
Shrubs Pasture 0.9 0.1 1.7 7.1 18.0 22.7 6.9 0.9 4.6 62.8
Regeneration with Pasture 0.6 0.3 2.2 8.8 11.2 16.2 5.9 0.9 1.9 48.0
Bare Soil Pasture <0.05 - <0.05 <0.05 0.3 0.2 <0.05 - <0.05 0.6
Secondary Vegetation 3.8 1.0 15.7 21.5 28.0 57.6 13.3 2.5 7.4 150.8
Non-observed area 0.4 0.5 1.7 22.2 2.1 17.4 0.3 0.8 <0.05 45.4
TOTAL 164.2 142.8 1,559.0 250.6 903.4 1,247.8 237.6 224.3 271.8 5,001.4

298 VOL. 46(3) 2016: 291 - 302 ALMEIDA et al.
High spatial resolution land use and land cover mapping of the Brazilian Legal Amazon in 2008 using Landsat-5/TM and MODIS data
ACTAAMAZONICA
The three pasture categories (Herbaceous, Shrub and Regeneration with Pasture) cover a total of 79.1% of the deforested area in Rondonia State, 66.9% of the deforested area in Mato Grosso State and 60.6% of the deforested area in Para State. Thus, in Rondonia and Mato Grosso the percentage of deforested area converted to pasture is higher than the Amazon average (62.1%). Conversely, pastures cover only 31.2% and 32.8% of the total deforested areas in Amapa (AP) and Amazonas (AM), well below the Amazonian average.
Secondary Vegetation accounted for 150,800 km2 (21%) of the total deforested area. The largest proportion of secondary vegetation was verified in the Amazonas (49%) and in Amapa (37%) States. The lowest values, by contrast, were those in the States of Mato Grosso and Rondonia, with respectively 13.7% and 16.1% of the total deforested area of these States.
Annual crops were observed over an area of 34,900 km2
(for comparison, an area approximately as large as the land
Figure 4. TerraClass 2008 map for the entire Brazilian Amazon. This figure is in color in the electronic version.
area of the Netherlands), mainly in Mato Grosso where the total area amounted to 31,000 km2, or approximately 88.6% of the total Amazon annual crop area. Conversely, the State of Acre had no identifiable annual crop cover.
Table 4 reports the classification figures by state; and figure 4 shows the final land use and land cover map in the Brazilian Legal Amazon. Figure 5 highlights the Mato Grosso State land use and land cover.
The TerraClass mapping results were visually verified using SPOT 5 very high spatial resolution (2.5 m) satellite images from which 535 reference sample points were randomly selected from the Para and Mato Grosso States. These States were chosen because they had many high resolution images available, they represent 62% of the Brazilian Legal Amazon and they feature every land use and land cover classes mapped in this study. Based on the 535 reference points, it was possible to determine the classification error showed in Table 5.

299 VOL. 46(3) 2016: 291 - 302 ALMEIDA et al.
High spatial resolution land use and land cover mapping of the Brazilian Legal Amazon in 2008 using Landsat-5/TM and MODIS data
ACTAAMAZONICA
Figure 5. Detailed TerraClass mapping of Mato Grosso (MT). This figure is in color in the electronic version.
Table 5. TerraClass classification validation verified against SPOT satellite images.
Thematic classes
Spot images (Reference)
Annual Crops
Mosaic of Occupations
Herbaceus Pasture
Shrubs Pasture
Pasture with regeneration
Secondary Vegetation
Total Inclusion Error (%)
AC MU HP SP PR SV Total Commission Error
Annual Crops (AC) 33 2 1 36 8.3
Mosaic of Uses (MU) 19 1 1 3 24 20.8
Herbaceous Pasture (HP) 199 39 12 10 260 23.5
Shrubs Pasture (SP) 1 10 45 7 5 68 33.8
Pasture with regeneration (PR) 2 19 7 28 32.1
Secondary Vegetation (SV) 1 3 7 6 7 95 119 20.2
Total 34 23 221 91 45 121 535
Omission Error (%) 2.9 17.4 10.0 50.5 57.8 21.5
Global accuracy map 76,64%
Kappa index 0.67

300 VOL. 46(3) 2016: 291 - 302 ALMEIDA et al.
High spatial resolution land use and land cover mapping of the Brazilian Legal Amazon in 2008 using Landsat-5/TM and MODIS data
ACTAAMAZONICA
DISCUSSIONThe dominance of pasture-based areas in deforested areas
(62.1%) evidence the importance of this land use in the region (Poccard-Chapuis et al. 2005; Brandão et al. 2006; Bowman et al. 2012). Other studies have already suggested that livestock expansion ranks among the most important driver of deforestations in the region (Wassenaar et al. 2007; Barona et al. 2010; Espindola et al. 2012). While the 2008 TerraClass result alone cannot conclusively state that cattle expansion has been causing deforestation, per se, it does show that cattle has come to occupy a significant portion of the areas under direct use. Combined with further analysis forwards and backwards in time, researchers can then assess at what point the forest was converted, and which land uses subsequently occurred on those areas.
When merged, two classes of pasture -- Shrubs Pasture and Pasture with Regeneration, characteristically with low level of management and consequently low productivity, accounted for 15.42% of the land use in deforested areas. This represents more than three times the area occupied by annual agriculture, and also a third of the area occupied by the other classes of pasture. These figures may suggest that if guided by appropriate public policies, it is feasible to induce the expansion of both agriculture and livestock production with a minor impact on deforestation (Sayer and Cassman 2013; Ceddia et al. 2014; Villoria et al. 2014).
The second largest land cover is Secondary Vegetation, which represents 21% of the total deforested area – a number that agrees with previous estimates (MMA 2006; Almeida et al. 2010). These areas play an important role in biodiversity conservation in tropical forest fragments (Pardini et al. 2005).
Yet secondary forests are also affected by their neighbouring land uses: recent studies suggest that secondary forest areas adjacent to areas of high deforestation often suffer a similar fate. (Soler et al. 2014; Jakovac et al. 2015).
Annual crops thought of by many as a key force for deforestation in the Amazon, covered circa 5% of the area mapped as deforested by PRODES in 2008. This result differs from Morton et al. (2006), which suggested that soybeans crops were one of the major deforestation vectors in Mato Grasso, between 2001 and 2004. Part of this difference can be explained by the temporal limitation, 2001 up to 2004, when deforestation data indicated a high rate of forest conversion (INPE 2015). But this period is also marked by a sharp change in the soybean market, caused mainly by the establishment of the soy moratorium by the major traders and the implementation of the Rural Environmental Registry (Rudorff et al. 2011; Gibbs et al. 2014;). All these types of dynamics underscore the importance of monitoring changes over time within of the Brazilian Amazon so as to assess the advance of agriculture within the Amazon biome in face of other drivers for land use change.
The agreement index between the map obtained by TerraClass and the validation points using SPOT data was 76.64% and the Kappa index 0.67. Over half the classification errors (75 of 125) as consequence of the split of the pasture land use into three categories. These classification errors can be attributed to the difficulty in distinguishing among these classes, as all pasture categories exhibit similar ground structure (grasses, weeds and shrubs), and differ primarily in the relative prevalence of these components. As pointed out by Powell et al. (2004), classifying areas by degree of transition frequently involves significant subjective judgment and possibly disagreement even among experienced interpreters. When some time interval rests between mapping and validation, even as little as few months of difference can result in conflicting classification of pastures between the analysis and validation, since distinct management, stocking, or even changes in the rainfall can affect the area’s condition. To mitigate this problem in future analyses, detailed spectral characterization of pasture types may help minimize classification errors. Nevertheless TerraClass classification was able to efficiently distinguish major land use and land cover classes. When pasture classes are merged into one single class the agreement rise to 89.7% and the Kappa index increases to 0.79.
CONCLUSIONS The results of TerraClass 2008 Project showed the
predominance of pastures (62%) and secondary vegetation (21%) among the Amazonian post-deforestation landscape. At the same time, annual crop cultivation, historically referred as one of the most important vectors of deforestation, was present in less than 5% of the deforested areas in the Brazilian Legal Amazon in 2008. In general, results from validation with high spatial imagery (SPOT 5) indicate that the TerraClass classification methodology, using MODIS and Landsat data, appears reasonably accurate for the discrimination of the major land use and land cover classes in the Amazon region. Further editions of TerraClass Project opens up new opportunities for scientists and policy makers to track changes in land cover and land use in the Brazilian Amazon at high resolution, as well as to assess the initial drivers of deforestation and monitor how deforestation dynamics may also be changing over time and space.
ACKNOWLEDGMENTSThe authors wish to thank the Coordination for the
Improvement of Higher Level Personnel (Capes), for providing scholarships (Process BEX 6083/13-3), UMR ESPACE-DEV by hosting the PhD project of the first author. We are thankful to Dr’s Dalton Valeriano, David Galbraith, Katia Fernandes, and to Elinor Benami for the many constructive comments and suggestions on the manuscript. The World Bank, the Brazilian Ministry of Science Technology and Innovation, and

301 VOL. 46(3) 2016: 291 - 302 ALMEIDA et al.
High spatial resolution land use and land cover mapping of the Brazilian Legal Amazon in 2008 using Landsat-5/TM and MODIS data
ACTAAMAZONICA
the Brazilian Ministry of the Environment are thanked here for the funding of the TerraClass project. By dedication of National Institute for Space Research (INPE) and Brazilian Agricultural Research Corporation (Embrapa) technical teams.
REFERENCESAdami, M.; Moreira, M.A.; Rudorff, B.F.T.; Freitas, C.C.; Faria, R.T.
De 2005. Direct expansion in the estimate of agricultural cultures by regular segments. Revista Brasileira de Cartografia, 2: 22–27.
Almeida, C.A. de; Valeriano, D.M.; Isabel, M., Escada, S., Rennó, D., 2010. Estimativa de área de vegetação secundária na Amazônia Legal Brasileira. Acta Amazonica, 40, 289–302.
Arino, O.; Gross, D.; Ranera, F.; Bourg, L.; Leroy, M.; Bicheron, P.; Latham, J. 2007. GlobCover: ESA service for global land cover from MERIS, in: Geoscience and Remote Sensing Symposium, 2007. IGARSS 2007. IEEE International, 2412–2415.
Arvor, D.; Dubreuil, V.; Simões, M.; Bégué, A. 2012a. Mapping and spatial analysis of the soybean agricultural frontier in Mato Grosso, Brazil, using remote sensing data. GeoJournal 78, 833–850.
Arvor, D.; Meirelles, M.; Dubreuil, V.; Bégué, A.; Shimabukuro, Y. 2012b. Analyzing the agricultural transition in Mato Grosso, Brazil, using satellite-derived indices. Applied Geography, 32, 702–713.
Atzberger, C. 2013. Advances in Remote Sensing of Agriculture: Context Description, Existing Operational Monitoring Systems and Major Information Needs. Remote Sensing, 5, 949–981.
Barona, E.; Ramankutty, N.; Hyman, G.; Coomes, O.T. 2010. The role of pasture and soybean in deforestation of the Brazilian Amazon. Environmental Research Letters, 5, 024002.
Bartholome, E., Belward, A.S., Achard, F., Eva, H., Fritz, S., Bartalev, S. 2002. GLC 2000 Global Land Cover mapping for the year 2000 Project status November 2002. Institute for Environment and Sustenability (VA) Italy. 62p
Bodart, C.; Eva, H.; Beuchle, R.; Raši, R.; Simonetti, D.; Stibig, H.J.; Brink, A.; Lindquist, E.; Achard, F. 2011. Pre-processing of a sample of multi-scene and multi-date Landsat imagery used to monitor forest cover changes over the tropics. ISPRS Journal of. Photogrammetry and Remote Sensing, 66, 555–563.
Bontemps, S.; Defourny, P.; Eric, V.B. 2010. GLOBCOVER 2009 Products Description and Validation Report. ESA, Belgium. 30p
Bowman, M.S.; Soares-Filho, B.S.; Merry, F.D.; Nepstad, D.C.; Rodrigues, H.; Almeida, O.T. 2012. Persistence of cattle ranching in the Brazilian Amazon: A spatial analysis of the rationale for beef production. Land use policy, 29, 558–568.
Brandão, A.S.P.; Rezende, G.C. de; Marques, R.W. da C. 2006. Crescimento agrícola no período 1999/2004: a explosão da soja e da pecuária bovina e seu impacto sobre o meio ambiente. Economia Aplicada, 10, 249–266.
Câmara, G.; Souza, R.C.M.; Freitas, U.M.; Garrido, J.; 1996. Spring: Integrating remote sensing and gis by object-oriented data modelling. Computers & Graphics, 20, 395–403.
Ceddia, M.G.; Bardsley, N.O.; Gomez-y-Paloma, S.; Sedlacek, S. 2014. Governance, agricultural intensification, and land sparing in tropical South America. Proceedings of the National Academy of Sciences, 111, 7242–7247
Coutinho, A.C. 2009. Condicionantes da expansão da fronteira agricola em Mato Grosso. Revista de Política Agrícola, 17, 80–97.
Dubreuil, V.; Laques, A.-E.; Nédélec, V.; Arvor, D.; Gurgel, H. 2008. Paysages et fronts pionniers amazoniens sous le regard des satellites : l’exemple du Mato Grosso. L’Espace Géographique, 37, 57–74.
Espindola, G.M.; de Aguiar, A.P.D.; Pebesma, E.; Câmara, G.; Fonseca, L. 2012. Agricultural land use dynamics in the Brazilian Amazon based on remote sensing and census data. Applied Geography, 32, 240–252.
Eva, H.; Carboni, S.; Achard, F.; Stach, N.; Durieux, L.; Faure, J.-F.; Mollicone, D. 2010. Monitoring forest areas from continental to territorial levels using a sample of medium spatial resolution satellite imagery. ISPRS Journal of. Photogrammetry and Remote Sensing, 65, 191–197.
Fearnside, P.M. 2006. Desmatamento na Amazônia: dinâmica, impactos e controle. Acta Amazonica, 36, 395–400.
Friedl, M.A.; McIver, D.K.; Hodges, J.C.F.; Zhang, X.Y.; Muchoney, D.; Strahler, A.H. 2002. Global land cover mapping from MODIS: algorithms and early results. Remote Sensing of Environment, 83, 287–302.
Friedl, M.A.; Sulla-Menashe, D.; Tan, B.; Schneider, A.; Ramankutty, N.; Sibley, A.; Huang, X. 2010. MODIS Collection 5 global land cover: Algorithm refinements and characterization of new datasets. Remote Sensing of Environment, 114, 168–182.
Gibbs, H.K.; Rausch, L.; Munger, J.; Schelly, I.; Morton, D.C.; Noojipady, P.; Barreto, P.; Micol, L.; Walker, N.F. 2014. Brazil’s Soy Moratorium. Science, 347, 377–378.
IBGE, 2012. IBGE Cidades@ (www.ibge.gov.br/cidadesat/topwindow.htm?1) Acesso em 27/05/2012.
INPE, 2015. Projeto PRODES - Monitoramento da Floresta Amazônica Brasileira por Satélite (www.dpi.inpe.br/prodesdigital/prodesmunicipal.php) Acesso em 12/08/2015.
Jakovac, C.C.; Peña-Claros, M.; Kuyper, T.W.; Bongers, F. 2015. Loss of secondary-forest resilience by land-use intensification in the Amazon. Journal of Ecology, 103, 67–77.
Jensen, J.R. 2009. Sensoriamento Remoto do Ambiente, 2da ed. Parêntese Editora, São José dos Campos, 2009, 598p.
Kelly, M.; Estes, J.E.; Knight, K.A. 1999. lmage Interpretation Keys for Validation of Global Data Sets. Photogrammetric Engineering & Remote Sensing, 65, 1041–1049.
Lu, D. 2003. Linear mixture model applied to Amazonian vegetation classification. Remote Sensing of Environment, 87, 456–469.
Margulis, S. 2003. Causes of Deforestation of the Brazilian Amazon, World Bank Working Papers. The World Bank, Washington, 80p.
Mello, E.M.K.; Moreira, J.C.; Santos, J.R. dos; Shimabukuro, Y.; Duarte, V.; Souza, I. de M.; Barbosa, C.C.; Souza, R.C.M.; Paiva, J.A. de C. 2003. Tecnicas de Modelo de Mistura Espectral Segmentação e Classificação de Imagens TM/LANDSAT para o
302 VOL. 46(3) 2016: 291 - 302 ALMEIDA et al.
High spatial resolution land use and land cover mapping of the Brazilian Legal Amazon in 2008 using Landsat-5/TM and MODIS data
ACTAAMAZONICA
Mapeamento do Desflorestamento da Amazônia, in: XI SBSR. Belo Horizonte, 2807–2814.
MMA, 2006. Uso e cobertura da terra na Floresta Amazônica (Subprojeto 106/2004-PROBIO) (http://sistemas.mma.gov.br/sigepro/arquivos/_6/Relatorio_PROBIO_V2.pdf ) Acesso em 06/01/2016.
Morton, D.C.; DeFries, R.S.; Shimabukuro, Y.; Anderson, L.O.; Arai, E.; del Bon Espirito-Santo, F.; Freitas, R.; Morisette, J. 2006. Cropland expansion changes deforestation dynamics in the southern Brazilian Amazon. Proceedings of the National Academy of Sciences, 103, 14637–14641.
NASA, 2001. Land Processes Distributed Active Archive Center (LP DAAC) (https://lpdaac.usgs.gov/data_access) Acesso em 14/05/2014.
Novo, E.M.L. de M., 2008. Sensoriamento Remoto princípios e aplicações, 3ra ed. Edgar Blusher Ltda, São Paulo, 2008, 364p.
Pardini, R.; de Souza, S.M.; Braga-Neto, R.; Metzger, J.P. 2005. The role of forest structure, fragment size and corridors in maintaining small mammal abundance and diversity in an Atlantic forest landscape. Biological Conservation, 124, 253–266.
Poccard-Chapuis, R.; Thales, M.; Venturieri, A.; Piketty, M.; Mertens, B.; Veiga, J.B. da; Tourrand, J. 2005. Filières de production et développement La filière viande : un levier pour contrôler les dynamiques pionnières en Amazonie brésilienne ? Cahiers d’études et de recherches francophones / Agricultures, 14, 53–58.
Ponzoni, F.J.; Shimabukuro, Y.; Kuplich, T.M.; 2012. Sensoriamento Remoto da Vegetação, 2da ed. Oficina de Textos, São Paulo, 2012, 160p.
Powell, R.L.; Matzke, N.; de Souza Jr., C.; Clark, M.; Numata, I.; Hess, L.L.; Roberts, D.A. 2004. Sources of error in accuracy assessment of thematic land-cover maps in the Brazilian Amazon. Remote Sensing of Environment, 90, 221–234.
Roerink, G.J.; Menenti, M.; Verhoef, W. 2000. Reconstructing cloudfree NDVI composites using Fourier analysis of time series. International Journal of Remote Sensing, 21, 1911–1917.
Rouse, J.W.; Haas, R.H.; Schell, J.A.; Deering, D.W., 1974. Monitoring vegetation systems in the Great Plains with ERTS, in: 3d ERTS-1 Symposium, NASA, Goddard Space Flight Center, United States, 309–317.
Rozon, C.; Lucotte, M.; Davidson, R.; Paquet, S.; Oestreicher, J.S.; Mertens, F.; Passos, C.J.S.; Romana, C. 2015. Spatial and temporal evolution of family-farming land use in the Tapajós region of the Brazilian Amazon. Acta Amazonica, 45, 203-214
Rudorff, B.F.T.; Adami, M.; Aguiar, D.A.; Moreira, M.A.; Mello, M.P.; Fabiani, L.; Amaral, D.F.; Pires, B.M. 2011. The soy moratorium in the Amazon biome monitored by remote sensing images. Remote Sensing, 3, 185–202.
Sayer, J.; Cassman, K.G. 2013. Agricultural innovation to protect the environment. Proceedings of the National Academy of Sciences, 110, 8345–8348.
Shimabukuro, Y.; Batista, G.T.; Mello, E.M.K.; Moreira, J.C.; Duarte, V. 1998. Using shade fraction image segmentation to evaluate deforestation in Landsat Thematic Mapper images of the Amazon Region. International Journal of Remote Sensing, 19, 535–541.
Soler, L.D.S.; Verburg, P.H.; Alves, D. 2014. Evolution of Land Use in the Brazilian Amazon: From Frontier Expansion to Market Chain Dynamics. Land 3, 981–1014.
Uhl, A.C.; Buschbacher, R.; Serrao, E.A.S. 1988. Abandoned Pastures in Eastern Amazonia. I. Patterns of Plant Succession. Journal of Ecology, 76, 663–681.
Verbesselt, J.; Zeileis, A.; Herold, M. 2012. Near real-time disturbance detection using satellite image time series. Remote Sensing of Environment, 123, 98–108.
Vieira, I.C.G.; Almeida, A.S. de; Davidson, E.A.; Stone, T.A.; Carvalho, C.J.R. de; Guerrero, J.B. 2003. Classifying successional forests using Landsat spectral properties and ecological characteristics in eastern Amazônia. Remote Sensing of Environment, 87, 470–481.
Villoria, N.B.; Byerlee, D.; Stevenson, J. 2014. The Effects of Agricultural Technological Progress on Deforestation: What Do We Really Know? Applied Economic Perspectives and Policy, 36, 211–237.
Vuolo, F.; Atzberger, C. 2012. Exploiting the Classification Performance of Support Vector Machines with Multi-Temporal Moderate-Resolution Imaging Spectroradiometer (MODIS) Data in Areas of Agreement and Disagreement of Existing Land Cover Products. Remote Sensing, 4, 3143–3167.
Wassenaar, T.; Gerber, P.; Verburg, P.H.; Rosales, M.; Ibrahim, M.; Steinfeld, H. 2007. Projecting land use changes in the Neotropics: The geography of pasture expansion into forest. Global Environmental Change, 17, 86–104.
Recebido 25/11/2015Aceito em 04/02/2016