high school science performance assessments: an ... · high school science performance assessments:...
TRANSCRIPT

High School Science Performance Assessments:
An Examination of Instruments for Massachusetts
Report for the Massachusetts Department of Elementary & Secondary Education
by
Education Development Center, Inc.
Submitted by (in alphabetical order): Pamela Ellis, Ph.D.; Erica Jablonski, M.A.; Abigail Jurist Levy, Ph.D., Principal Investigator; and Amie Mansfield, Ph.D., Project Director
1

Contents Executive Summary 3
The Issues Addressed 7
What We Did to Learn More 15
What We Found 18
Discussion and Areas for Future Research 28
Bibliography 32
Appendices
A. Guide for Describing High School Science Performance Assessments 35
B. Table Summarizing Characteristics of the Instruments 39
C. Assessment Development Flow Charts 40
D. Data Sources for State Profiles 41
E. Sample Items—Connecticut 42
F. Sample Items—Louisiana 45
G. Sample Items—New York 47
H. Sample NAEP Performance Task with Scoring Rubric 48
2

Executive Summary This report provides state decision makers with an overview of components associated with the development and implementation of nine science performance assessments from across the United States. There is currently no single set of guidelines to introduce decision makers to the characteristics of science performance assessments, to help them align their assessment needs with instruments’ design and structure, or to anticipate the issues that arise with the development and implementation of a science performance assessment instrument at the state or district level. Also noteworthy is the timing of this report with respect to NCLB’s requirement for science assessment. The 2007–08 school year represents the first in which all U.S. students will be required to participate in a state science test at grades 3–5, 6–9 and 10–12. Given this emphasis, we anticipate that science assessments will evolve and that it will be important to convey the ways that assessments have changed in order for each to consider what is best to adopt. In addition to the federal requirement for science assessment, students in Massachusetts will be required to pass a science or technology/engineering MCAS assessment as a state graduation requirement. Starting with the class of 2010, students will need to pass one of four high school science and technology/engineering tests (Biology, Chemistry, Introductory Physics, or Technology/Engineering). There has been some concern that these paper-and-pencil tests may diminish opportunities for students to experience hands-on investigations and learn about the true nature of scientific inquiry. Therefore, the Massachusetts Department of Elementary and Secondary Education (MA ESE) would like to know more about large-scale performance-based assessments in science. In response, staff of the Center for Science Education (CSE), Education Development Center, Inc. (EDC), has prepared this report to answer the question: How has a targeted sample of nine science performance assessments addressed the components of performance-assessment instruments that are of critical interest to MA ESE? The components of interest are: • Development • Piloting • Technical qualities • Administration • Scoring • Reporting • Costs This report provides a description of how selected states have developed and administered science performance assessments to support policy makers in taking informed next steps. Performance assessment1 is generally recognized as a form of testing that requires students to perform a task rather than select an answer from a ready-made list (e.g., selected-response format like multiple choice or matching). This task (or set of tasks) is then scored by experienced raters,
1 Also referred to in the literature as alternative or authentic assessment.
3

such as teachers or other trained staff, who judge the quality of students’ work based on an agreed-upon set of criteria. Because performance assessments require students to actively engage with a task in order to show their understanding and proficiency around complex and realistic problems (Herman, Aschbacher & Winters, 1992), they can be complicated and challenging both to develop and to implement. However, if designed properly, performance assessments can provide an indication of what students are able to do with their knowledge by requiring students to demonstrate what they know through various tasks, such as generating scientific hypotheses, conducting experiments, writing essays, or solving mathematical problems (Office of Technology Assessment, 1992). We collaborated with the MA ESE to create a specific definition of science performance assessment. Its definition comprised two parts. First, the content to be assessed had to be the scientific inquiry or investigative process, which is further defined as the means by which students can • make observations, raise questions, and formulate hypotheses; • design and conduct scientific investigations; • analyze and interpret results of scientific investigations; and • communicate and apply the results of scientific investigations.
Second, the assessment should require a student to display understanding of the scientific inquiry process via hands-on (either real or simulation) tasks. However, since few assessments we identified in the national scan (only Connecticut, Louisiana, and New York) met both parts of the definition, it was broadened to include written, constructed responses related to an investigation or experiment. Nine science performance assessments from eleven states were selected from across the country based on criteria developed by EDC and the MA ESE. The states included in the report are Colorado, Connecticut, Kentucky, Louisiana, Minnesota, New Hampshire, New York, Ohio, Rhode Island, Vermont, and Washington. (Note that New Hampshire, Rhode Island, and Vermont use a common assessment. For practical and logistical reasons, we focused our data collection on Vermont alone.) Through interviews with states’ departments of education assessment experts, and documentation available on state departments of education Web sites, we collected information on the identified components for nine science performance assessments. Given the limited number of states with a “true” performance assessment (Connecticut, Louisiana, and New York), and that the inclusion of assessments with constructed responses is consistent with the definition of performance assessment per U.S. Congress’ Office of Technology Assessment, we also reviewed the additional six states for further context to learn about test development. In responding to Massachusetts’ and other states’ questions about science performance assessments, this report does not address several aspects of the instruments examined, and it is important to state them clearly at the outset. This report does not advocate for a particular instrument nor does it make judgments about the quality or suitability of any of the instruments that are examined. Similarly, this report does not provide an evaluation of the degree to which
4
items within the assessments accurately measure the student outcomes of interest. This would require a level of scrutiny and analysis well beyond the scope of this report. Likewise, specific item-level information included in this report is minimal. This is a result of test security measures and related concerns. Instead, this report focuses on illustrating the range of ways in which the components of performance assessments have been addressed as well as the issues that decision makers should be aware of when designing and implementing a performance assessment in their states or districts. We found that methods for development, administration, and building support among teachers and administrators vary across the nine science performance assessments examined. Similarities emerged around piloting, technical qualities, and reporting practices. The cost of developing and implementing science performance assessments is difficult to capture with specificity; however, the evidence available suggests that it is quite high for all the identified performance assessments. Selected findings for each component are: • Development: While many of the assessments (six of the nine) relied on collaboration
between test development vendors and teachers, the responsibilities of the partners and makeup of the teams varied widely between states. o Building support among teachers and principals: Four states reported a specific
strategy for building local support for science performance assessments. The remaining states either reported that they did not have a strategy or that they relied on people at the local level to promote buy-in for the assessments.
• Piloting: The majority (seven of nine science performance assessments) included a pilot phase in their development, though the length and scope of the pilots varied.
• Technical qualities: Of the nine high school science performance assessments examined, six only had constructed-response items while three incorporated some form of performance task. All states reported statistics on test items, and all states that have administered their assessments showed evidence of reliability and validity.
• Administration: One state, Minnesota, administers its test online, while all other states administer assessments by paper and pencil. All but Minnesota offer some form of accommodation to meet students’ specific learning needs as necessary.
• Scoring: Scoring the assessments and reporting on student achievement varied across the states in a range of ways including where the scoring is done, the turnaround time, manual vs. computer scoring, and how and at what level the scores are reported.
• Reporting: Nearly all states reported assessment results at the student level and presented both raw and scaled scores.
• Costs: Cost information was difficult to retrieve and was not itemized consistently across states. In five instances, states were identified as the sole funders of assessments, while in two others, state and federal sources were both mentioned. Annual costs ranged from approximately $600,000 to several million dollars.
The findings suggest points that merit further discussion and consideration in the field. These include: • The cost of developing and implementing performance assessments is difficult to capture
with specificity thus hindering further discussion.
5

6
• The literature stresses the importance of building support for a performance assessment; however, the majority of states did not report having support strategies in place.
• States’ multi-level reporting practices can be used to help inform school and district improvement plans, yet the combination of the administration and scoring schedules precludes using the assessments formatively at the student level.
• The impact of NCLB in advancing science assessments overall may be quite prominent, but NCLB and/or state mandates do not appear to be responsible for the hands-on performance assessments we found.
• We used the most inclusive definition of performance assessment for this report; thus, a high percentage of constructed-response assessments are included. Yet, it is important to recall that the states implementing these constructed-response assessments would not consider them to be performance assessments because they were not “hands-on.”

The Issues Addressed Starting with the class of 2010, students in Massachusetts will be required to pass a science or technology/engineering state assessment as a state graduation requirement. To be specific, they will need to pass one of four high school science and technology/engineering MCAS tests (Biology, Chemistry, Introductory Physics, or Technology/Engineering). These tests are based on the Massachusetts content standards in the Science and Technology/Engineering Curriculum Framework and consists of about two thirds multiple-choice items and one third constructed-response items. Although Massachusetts has inquiry standards at the high school level, they are currently not directly assessed on the Science and Technology/Engineering MCAS tests. There has been some concern among educators and the general public that these paper-and-pencil tests may diminish opportunities for students to experience hands-on investigations and learn about the true nature of scientific inquiry. Therefore, the Massachusetts Department of Elementary and Secondary Education (MA ESE) has requested help from Education Development Center, Inc. (EDC), in expanding its knowledge of science performance assessments, and more specifically, in understanding the factors associated with developing and implementing such instruments. In the New England region, Vermont, New Hampshire, Connecticut, and New York already have science performance assessments in place, and the MA ESE is now exploring high school science performance-based assessments. Science leaders in MA ESE had requested EDC’s help in understanding the factors associated with developing and implementing such instruments. This report should provide the MA ESE with a research-based foundation of knowledge to support it in taking informed next steps. The Performance Assessment Links in Science (PALS) web site, indexed by the National Science Education Standards (http://www.nap.edu/readingroom/books/nses/), refers to Herman, Aschbacher & Winters’ (1992) definition of performance assessments as a type of assessment that “requires students to actively accomplish complex and significant tasks, while bringing to bear prior knowledge, recent learning and relevant skills to solve realistic or authentic problems.” Performance assessments provide an indication of what students “can do with what they know,” compared with traditional assessments, which often only tap “what students know” (p. 2). According to Klassen (2006), traditional “low-inference testing, based on the assumption that knowledge could be de-contextualized, was replaced by contextual assessment methodologies in science education, such as performance assessments, not on account of direct criticism, but rather on. . .the change from behavioral to cognitive psychology, developments in the philosophy of science, and the rise of constructivism” (p. 820). In the mid-1990s, states and districts increasingly included performance assessments in their testing programs “to shed light on the thinking and learning processes of students, and to encourage teachers to focus their teaching based on the content and skills of the test” (National Center for Education Statistics, 1996, p. iii). In response to the MA ESE request, staff members from EDC’s Center for Science Education worked with MA ESE personnel to conduct a national scan to identify science performance assessments that have been implemented at the national or state level and that met the following criteria:
7
• The performance assessment measured students’ understanding of the scientific inquiry process, which is further defined as the means by which students can o make observations, raise questions, and formulate hypotheses; o design and conduct scientific investigations; o analyze and interpret results of scientific investigations; and o communicate and apply the results of scientific investigations.
• The performance assessment was administered to high school students. • The performance assessment was administered to a population of at least 50,000 students. It is important to note that initially the MA ESE requested information be collected on performance-based assessments that require students to display understanding of the scientific inquiry process via hands-on (either real or simulation) tasks. However, since few assessments we identified in the national scan fulfilled all of the criteria (only 3 of the 23 identified), they were broadened to include written, constructed-responses related to an investigation or experiment. This broader set of criteria mirrors the variation discussed below. This initial work served as the foundation for the research discussed in this report. The expectation was that—should the scan identify appropriate performance assessments—we would pursue to describe the particular assessments in more depth. The findings of the original national scan are summarized on page 18, and provide an introduction to the findings that are the focus of this report. This report was guided by the following research question:
How has a targeted sample of nine high school science performance assessments addressed the components of performance-assessment instruments that are of critical interest to MA ESE?
To answer this question, we focused on nine specific high school science performance assessment instruments identified in the earlier national scan. The descriptions of these instruments focus on the components of performance assessment instruments that MA ESE identified as most important. These components are specified on page 17, with additional information and detail provided in Appendices A and B. Although the components themselves are relevant for performance assessments in many different subjects, this report focuses on the ways in which they have been addressed with regard to science. We have written this report for an audience that has some familiarity with the assessment field and an interest in the policy implications of the findings. In addition to this report, EDC has developed other products for the MA ESE:
(1) A guide for describing the components of high school science performance assessments that reflects the interests of MA ESE and has been operationalized to allow for consistent and systematic description across instrument types and disciplines (see Appendix A)
(2) A table that summarizes the characteristics of the instruments and provides readers with a convenient, comparative view (Appendix B)
8

Project Objectives The objective of this report is to familiarize decision makers at MA ESE with the components of science performance assessment instruments and with the issues associated with their development and implementation at the state and district levels. As discussed later in the literature review, performance assessments are complex and challenging both to develop and to implement. No single guideline currently exists to introduce decision makers to the characteristics of science performance assessments, to help them align their assessment needs with instruments’ design and structure, or to anticipate the issues that arise with the development and implementation of a science performance assessment instrument at the state or district level. In responding to MA ESE questions about science performance assessments, we examined several aspects of the instruments that this report does not address, and it is important to state them clearly at the outset. We do not advocate for a particular instrument, nor do we make judgments about the quality or suitability of any of the instruments that were examined. Similarly, we have not assessed the degree to which items within the assessments accurately measure the student outcomes of interest. This would require a level of scrutiny and analysis far beyond the scope of this report. Likewise, specific item-level information included in this report is minimal as a result of test security and related concerns. Instead, this report focuses on illustrating the range of ways in which the components of performance assessments have been addressed and the issues that decision makers need to be aware of when considering the design and implementation of a performance assessment in their states or districts. Summary of Relevant Research The sections below summarize our background research on the definition of performance assessments, their value, and their components. This literature provides a context for the subsequent discussion of methods, findings, and implications. We have relied heavily here on those researchers who were influential in the study of performance assessments during the 1990s, when this field was making significant advances. In fact, much of the recent literature on performance assessment refers back to these authoritative studies, which focus on conceptually explaining what performance assessments are and on their associated components, issues, and technical qualities. Definition and Value of Performance Assessment Performance assessment became a prominent topic in the mid-1980s and 1990s, and it was during that period that much of the research and publishing on this subject occurred. Klassen’s 2006 article in the journal Science Education is a case in point: his discussion of performance assessments in science relies on the definitions provided by Ruiz-Primo & Shavelson (1996), Baker, O’Neil, and Linn (1994), and Willson (1991). In The Language of Learning: A Guide to Education Terms, McBrien and Brandt (1997) find that definitions of performance assessment vary, although all refer to the notion of authentic tasks such as activities, exercises, or problems that require students to show what they can do. Defined by the U.S. Congressional Office of Technology Assessment (OTA) (1992, p. 5), performance assessments are “testing methods that require students to create an answer or product that demonstrates their knowledge and skills and take many forms including: conducting experiments, writing extended essays, and doing mathematical computations.”
9

Further, according to the OTA, performance assessment is best understood as a continuum of assessment formats ranging from the simplest student-constructed responses to comprehensive demonstrations or collections of work over time. According to Robert Lukhele and his colleagues (1993, p. 2), constructed responses may be understood as “any question format that requires the test taker to produce a response in any way other than selecting from a list of alternative answers. Constructed-response tasks may be as simple as a short-answer question, or adding an arrow to a diagram. They may require the test taker to organize and write an essay, solve a multi-step mathematics problem, draw a diagram or graph, or write an explanation of a procedure.” Whatever the format, common features of performance assessments involve students’ construction rather than selection of a response, direct observation of student behavior on tasks resembling those commonly required for functioning in the scientific field, and illumination of students’ learning and thinking processes. Finally, the OTA explains that performance assessments must measure what is taught in the curriculum and that there are two terms that represent core or essential attributes of a performance assessment:
1. Performance: A student's active generation of a response is observable either directly or indirectly via a permanent product.
2. Authentic: The nature of the task and context in which the assessment occurs is relevant and represents "real world" problems or issues.
The global economy of the 21st century requires a different set of knowledge and skills than workers needed in the past. These labor-market demands are driving education reforms, and helping students develop these skills necessitates a shift in teaching and assessment. Today, students must develop the ability to access, inquire into, think critically about, and carefully analyze information (Business-Higher Education Forum, 2007; Partnership for 21st Century Skills, 2005). Performance assessments address these societal demands by providing complementary information to traditional test data; it measures what students are able to do with the content they learn in school, not only whether they have learned the curriculum content. In other words, performance assessments can provide insight into how well students are able to apply knowledge to solve new problems. In recognition of this fact and the OTA continuum of assessment formats, states across the nation such as Kentucky, Louisiana, and Washington (to name a few) have incorporated into their statewide assessment systems a broad view of performance assessments. Across this spectrum of performance assessments, states have items that are short- and extended-constructed responses and/or performance tasks. This variation in assessment format is evidenced in the assessments that we have profiled in this report. Kentucky and Washington include constructed responses. In contrast, Louisiana includes a comprehensive science task on its exam, which requires extended responses using “scientific investigation” displayed through text, graphs, charts, etc. (See example in Appendix E). Connecticut and New York both include hands-on performance tasks for students to demonstrate their competencies in these investigative skills. These performance assessments, which do not in and of themselves necessarily follow NCLB requirements, are components of these states’ larger state tests, which do satisfy NCLB. Development of Performance Assessments Science is a fertile ground for engaging students in inquiry and critical thinking; thus, it naturally
10

lends itself to performance assessment. Developing and implementing a sound, supported performance-assessment program requires the consideration of many components, both technical and practical. The previous section discussed the background literature on the definition and value of performance assessments. This section reviews the background literature on particular components of developing performance assessments that we examined for each of the nine selected state assessments. The assessment research community has examined many of these components closely, and a summary of findings regarding those components relevant to this report is presented below.
A note to the reader: Not all of the components that are of interest to the research community were of equal interest to MA ESE. Conversely, several aspects of developing and implementing performance assessments were of interest to MA ESE but were not addressed in the literature. Therefore, there is not a one-to-one correspondence between the topics discussed below and those we present in the assessment profiles and findings sections of this report. For example, administration and scoring procedures were of great interest to MA ESE, because of the difference between how a paper-and-pencil test would be administered and scored compared with a hands-on, performance-based assessment, but these issues are not addressed in the literature. While alignment of assessment to standards has received significant attention in the literature, MA ESE custom builds their assessments to directly align with their state standards, and therefore they are already very familiar with this aspect of assessment. Therefore, we offer the following summaries as an overview and context for this report.
Alignment to Standards. The importance of aligning a performance assessment to learning standards was found in a 2002 in-depth, case study of six large-scale performance assessment programs conducted by Pearson, Calfee, Walker-Webb, and Fleischer (2002). Pearson et al. found that states that were able to build assessments at the same time as, or after, developing and disseminating standards, encountered less resistance from key constituencies when compared with states in which assessments were developed before the standards were in place. The researchers further noted that if an assessment can be tied directly to a broadly accepted framework or set of standards, it does not have to stand on its own; the framework provides the assessment with an aura of legitimacy that it might not possess on its own. Building support among teachers and principals. Our understanding of the importance of building support for performance assessments draws from Pearson et al.’s 2002 study of five states where performance assessments in a variety of subjects had been in place. The authors found that building support for the assessment is essential and involves a combination of politics, information, and communication. Pearson et al. advise states to make sure that those who are likely to resist the effort are brought into the information loop early, and developing materials that can be shared broadly with the public is also essential. Finally, they assert that there “is no substitute…for getting the word out in public and professional meetings where the [performance assessments] can be explained and where concerns can be expressed and responded to directly” (p. 24). The authors described a variety of activities to create buy-in and build support. Maryland, for example, made a broad array of documents available for a variety of audiences—including psychometricians, teachers, parents, and the general public—which were very helpful in building understanding and support. Another approach, used by assessment developers in Washington
11

State, called for giving the test to the legislature, which “proved invaluable in building understanding of the kinds of standards that can only be captured through [performance assessments]” (p. 24). Pearson et al. (2002) found that states often involved teachers in developing assessments, which in turn helped earn teacher support. In some states, teachers were centrally involved in the review process: serving on committees that were charged with reviewing items and tasks; administering, scoring, and reporting; and selecting anchors for performance tasks and portfolios. Another way to build support among teachers is to provide professional development about and through the performance-assessment process. In fact, the Pearson et al. (2002) found that the lack of professional development can be viewed as an obstacle to successful implementation. In one case study state, pockets of resistance existed within the teaching profession but not among teachers who got involved in the assessment-development process. These professional development opportunities focused on providing teachers with the skills and tools they needed to develop and incorporate constructed-response questions into classroom teaching. Pearson et al.’s study echoed the “anecdotal evidence about the positive consequences that accrue to students in the classrooms of teachers who embrace performance assessment…. When teachers see dramatic changes in student performance and in students’ willingness to accept responsibility for their own growth and achievement, they get hooked on performance assessment” (p. 25). Format of Assessment. Determining the format of the assessment itself (e.g., constructed response, computer-based activities, hands-on activities, and year-long portfolio projects) is nearly as important as aligning the assessments and standards.2 Selecting the format of the performance assessment can depend on the standards themselves (e.g., conducting hands-on activities to measure abilities to design and carry out experiments or writing essays in which students must critically think about, integrate, and apply information). Another important issue is the purpose of the assessment: portfolio formats are often used to demonstrate students’ growth over a period of time, whereas a single, one-time assessment is used to demonstrate cumulative student knowledge at one moment in time (Khattri, Reeve, & Kane, 1998). Piloting. The pilot of an assessment, which usually spans a few years, is a crucial step in assessment development (DeBoer, Herrmann, & Gogos, 2007). Whether the assessment is “homegrown” (developed under the supervision of the state, employing subject matter and psychometric experts) or commercially contracted (“off the shelf”), piloting provides data for psychometric analysis. This analysis provides technical feedback to the assessment development to ensure the feasibility of the activities and to improve the validity and reliability of it before its large-scale use. This feedback can identify any characteristics or qualities of the assessment that may need reworking. While plans for this stage are not documented to any extent in the literature (though the psychometric results are), a pilot is an important step in the assessment-development process that often informs subsequent decisions about design and/or implementation. Such decisions can include the number of students and schools selected to participate in the pilot, recruitment strategies (e.g., voluntary or selection-based), and efforts to capture a diverse student population (Pearson et al., 2002). 2 Given the broad definition of performance assessment, either of these aforementioned formats meet the common criteria that students construct, rather than select, responses.
12
Technical Quality. Technical quality is key to developing and implementing a performance assessment. Validity, reliability, and generalizability are the three aspects of technical quality commonly addressed in the literature. a. Validity. Messick (1996) warns of two major threats to validity of performance assessments:
construct under-representation (an assessment that is too narrowly focused) and construct-irrelevant variance (assessments that tap knowledge and skills not relevant to the content around which the assessment was designed). In an overview of the elements that must be considered when judging content representativeness for performance assessment items, Crocker (1997) includes: “(a) the relevance of the test item content to the knowledge domain of interest and (b) the balance of coverage of the items in relation to the breadth of the domain.” Investigations into item bias are another necessary step in validating performance assessments. Bias exists when there is evidence of differential validity for any subgroup of the population being assessed. Fairness also relates to equity and the opportunities (or lack thereof) that the assessed population has to the same quality of educational experiences. According to Dunbar, Koretz, and Hoover (1991), studies of performance assessments in science are found to have considerable variance in mean performance from one ethnic group to another. The issue of item bias is critical across all types of assessments, and there is a wealth of information in the literature. It is beyond the scope of this report to explore item bias in any depth here, but the reader may refer to the work of Osterlind (1983), Holland and Wainer (1993), Berk (1982), Scheuneman (1982a, 1982b, 1984), and Hambleton and Rodgers (1995).
b. Reliability. Examining the reliability of the assessment refers to the ability of the assessment to measure across subjects consistently over time. Aspects of reliability that are particularly important to performance assessments include the reliability of the instrument itself, inter-rater reliability, where to set cut-off scores, and how to deal with scores that fall near those cut-off points (Jaeger, Mullis, Bourque, & Shakrani, 1996; Khattri et al., 1998; Shavelson, Baxter, and Gao, 1993).
Assuring inter-rater reliability presents several challenges. “[T]he complexity of the assessment tasks, the myriad of answers they can elicit, and the number of people used to score them—with (possibly) different frames of reference—yield a very high potential for low inter-rater reliability” (Office of Educational Research and Improvement, U.S. Department of Education, 1997). These factors emphasize the importance of investing in rater training for scoring assessments. An example of a successful large-scale performance assessment implementation with a rigorous reliability review in place is the National Assessment of Educational Progress (NAEP), a national test administered to selected students nationwide every other year. For performance-based tasks on NAEP, scoring is based on both the procedures used for carrying out the investigation as well as the results of those procedures (WestEd and Council of Chief State School Officers, 2007). In 1996, nearly 9 million constructed responses in mathematics and science were scored by a total of 675 scorers, with an elapsed scoring time of only 12.5
13

weeks (Calderone, King, and Horkay, 1997). Appendix H includes a sample performance task from the 1996 fourth-grade assessment and its scoring rubric. With all assessments, inter-rater reliability is a key concern. Calderone et al. explain that a high level of inter-rater reliability in scoring was achieved through the following steps: • The development of focused, explicit scoring guides that match the assessment
frameworks • Recruitment and rigorous training of qualified scorers, including post-training qualifying
tests • The use of a digital-image-processing-and-scoring system that allows all responses to a
particular exercise to be scored continuously until done, thus enhancing validity and reliability of scorer judgments
• Monitoring scorer consistency by “backreading” approximately 10% of each scorer’s ratings, and calibrating scores to be sure that scorer drift (the tendency to grade an item higher or lower over time) is minimized
• Checking for inter-rater reliability to ensure consistent ratings • Keeping careful documentation of the entire process
c. Generalizability. Generalizability of a performance task allows inferring beyond the task
itself to a broader set of skills and abilities related to the performance assessment and, thus, is intricately related to the content-representative and construct-related validity of the assessment. “[The] issue of generalizability of score inferences across tasks and contexts goes to the very heart of score meaning. Indeed, setting the boundaries of score meaning is precisely what generalizability evidence is meant to address. However, because of the extensive time required for the typical performance task, there is a conflict in performance assessment between time-intensive depth of examination and the breadth of domain coverage needed for generalizability of construct interpretation” (Messick, 1996, p. 11). Here, Messick has pointed out the relationship between the knowledge and skill required to complete a performance task and the generalizations that can be made based on students’ performance. In other words, a central tension exists between the depth and breadth of knowledge and skills that are tapped in a specific performance task and the extent to which generalizations regarding those knowledge and skills can be made. One way to address this is through using “matrix-sampling,” where different samples of students perform different (but only a few) sets of tasks, thus minimizing the amount of time spent by any single group of students, while enabling many groups to complete a variety of assessment items. Scores are evaluated in the aggregate, permitting comparisons between larger groups, such as districts, states, or nations, rather than at the individual student level. This makes matrix sampling useful for large-scale efforts, as successfully used in NEAP (Calderone et al., 1997).
Reporting. According to Navarrete & Gustke (1996), it is important to remember that there is no best way to report student data. Reporting can be approached in a variety of ways at the student, school, and state levels. Reporting decisions often depend on the purpose of the assessment, formative or summative, which can include but is not limited to: • giving students feedback on their work,
14

• informing parents on the progress of their child(ren), • comparing how groups of students/schools progress over time, and • improving teaching and learning. Cost. Performance assessments can be expensive compared with traditional modes of testing. Costs include resources required to develop an assessment (e.g., content experts, psychometric experts, contracts with private companies, any student materials required for the assessment, and pilot studies) as well as costs associated with involving teachers in development and scoring (e.g., training, substitutes, scorers’ time). Although professional development that instructs teachers how to use and score performance assessments is critical to the assessments’ success (Khattri et al., 1998), the level of training required for reliable scoring of these assessments is expensive—particularly compared with traditional forms of testing. The U.S. OTA estimates that the cost of using performance assessments can be from 3 to 10 times greater than the costs associated with traditional tests. Other estimates have suggested they could be up to 60 times more costly (Hoepfl, 2000). Hardy (1995) examined several large-scale performance-assessment programs and found that development costs ranged from $5,000 to over $14,000 per performance task. He found that costs tend to be lower when the student outcomes are well-defined, when smaller sample sizes are used to pilot assessment tasks, and when the size of the development teams is kept to a minimum. Hardy also noted that costs varied by content area. Particular costs associated with performance assessment kits for science and mathematics tasks developed by NAEP, by the Educational Testing Service (ETS) for the state of Georgia, and others ranged in cost from a low of $.70 to a high of $13.50 per kit. Hardy (1995) notes that as performance assessments are more widely used their cost per assessment unit will likely decrease. Based on the research literature, the components described above are key in constructing and implementing sound performance-assessment programs. They include both practical considerations, such as building support for implementation and cost, as well as technical considerations, such as alignment to standards, format, piloting, and the evaluation of psychometric properties. These components form the framework that is used to systematically describe the nine assessment instruments selected for this report. Being informed regarding how different assessment instruments addressed each of these components will assist decision makers in their efforts to implement large-scale performance-assessment programs.
What We Did to Learn More The research that led to this report was guided by the following research question:
How has a targeted sample of nine high school science performance assessments addressed the components of performance-assessment instruments that are of critical interest to MA ESE?
To answer this question, a data-collection guide was developed that operationalized the issues of interest to the MA ESE; information was gathered, primarily through interviews, and
15

supplemented by documentation provided by state departments of education staff and/or Web sites. Further details of our methodology are described below. Research Plan Our research plan consisted of five stages: 1. Specifying the definition of science performance assessment to be applied.
To initiate the work, we consulted the MA ESE for the specific definition of a science performance assessment that it wanted to apply. Its definition comprised two parts. First, the content to be assessed had to be the scientific inquiry or investigative process, which is further defined as the means by which students can • make observations, raise questions, and formulate hypotheses; • design and conduct scientific investigations; • analyze and interpret results of scientific investigations; and • communicate and apply the results of scientific investigations. Second, the assessment should require a student to display understanding of the scientific inquiry process via hands-on (either real or simulation) tasks. However, since few assessments we identified in the national scan met both parts of the definition (only New York, Connecticut, and Louisiana out of the 23), it was broadened to include written, constructed responses related to an investigation or experiment. Therefore, to meet the definition of a science performance assessment for the purposes of this project, a task or question should either a. require a student to manipulate materials or, b. require a student to refer in writing to either something they did or manipulated or to a
written description of an experiment. The context of the item could be any science discipline, but the content of interest is the process of scientific inquiry. The performance assessment could be an entire instrument or one or more items embedded in a larger instrument. It should be noted that including written, constructed responses in the definition of a performance assessment broadened the scope beyond what is typically used in the field. As a result, we made very specific inquiries about the nature of assessment items in order to determine whether or not they met this definition. In addition, we only included high school science performance assessments in this report per consultation with the MA ESE. At this stage, the MA ESE was most interested in high school assessments because of its new graduation requirement at the high school level as mentioned previously. 2. Selecting State Assessments for Profiling The first step was to choose nine science performance assessments from the previously completed national scan for in-depth profiling. We selected the states (shown in Table 1) in partnership with the MA ESE. The rationale for selection was to achieve variation of assessments across two criteria: (1) number of students taking the test in either a district or state (for the information to be meaningful to the MA ESE, assessments had to be administered to a
16

population of at least 50,000 students), and (2) a variety of assessment formats. Table 1: Profiled State Size and Assessment Format State Size* Assessment Format Colorado Medium Constructed-response**
Connecticut Small Hands-on lab experiment and open-ended questions about the lab
Kentucky Medium Constructed-response Louisiana Medium Short answer; comprehensive science task Minnesota Medium Constructed-response (computer-based) New York Large Constructed-response; performance test N.H./R.I./Vt. Small Constructed-response Ohio Large Constructed-response Washington Large Constructed-response *Small: states with student populations <500,000; Medium: states with student populations 500,000–749,999; Large: states with student populations >750,000 **The terms used in this table reflect the actual terms used by the states. It is important to note here that three states administer the same assessment: New Hampshire, Rhode Island, and Vermont. As stated earlier, these states belong to NECAP and share in the development and administration of the NECAP tests. As a consequence, in this report we refer to nine assessments and eleven states; however, the information we gathered on the NECAP science performance assessment came from Vermont alone. Eight of the nine selected assessments were developed for individual states, and the NECAP assessment was a collaborative effort to pool resources on the part of these three small states. 3. Identifying Components of Science Performance Assessments to Profile The next step was to identify the specific components of the assessments about which to gather information. We developed this list of components (described in more detail in Appendix A: Guide for Describing High School Science Performance Assessments) in collaboration with the MA ESE during several discussions in the summer of 2007. Our national scan findings were the starting point for these discussions, and the list below identifies the components the MA ESE identified as important to its decision-making processes.3 • Development
o Building Support Among Teachers and Principals • Piloting • Technical Qualities • Administration • Scoring • Reporting • Costs 4. Interview Guidelines and Consent 3 Recall that the earlier review of research explored some, but not all of these components, and in some cases, only particular aspects of a single component.
17

With the assistance of our partners at the MA ESE, we developed the guidelines for describing performance assessments that were used to structure our interviews with key informants (see Appendix A). For each of the nine assessments selected, we obtained verbal consent from appropriate personnel in each of the states. In securing consent, we shared our goals, processes, and proposed products with each assessment’s informant. 5. Data Collection and Analysis Data collection was conducted from September 2007 to January 2008. In addition to gathering information via reviews of existing documentation regarding each assessment (which included Web and printed documents), we sought a key informant for each assessment and interviewed one for eight of the nine assessments. Information on the ninth assessment was provided by the state’s extensive assessment Web site. Appendix D displays the data sources for the descriptions of the performance assessments. Finally, the data collected for this report was influenced by two outside factors: we had uneven access to information across states and we collected data in the year states were preparing to implement the NCLB requirement to assess science standards. In many cases, state assessment specialists were accessible and forthcoming with information pertaining to the assessments; however, the level of detail they provided varied widely. It is also important to note the timing of this work with respect to NCLB’s requirements on science assessment. The 2007-08 school year represents the first one in which students are required to participate in a science test at grades 3–5, 6–9 and 10–12. Given this emphasis, we anticipate that science assessments will evolve and that it will be important, in the future, to convey the ways that assessments have changed in order for jurisdictions to consider what is best for them to adopt. Given this policy shift, it is likely that education researchers will conduct further studies on the nature of these new science assessments—and particularly science performance assessments—within the next few years.
What We Found EDC’s task was to gather specific information about and create detailed profiles for nine state-administered science performance assessments. As described earlier, these nine assessments were selected from a larger group of 23 assessments that were identified and summarized for an earlier national scan that primarily relied on information collected from publicly available Web sites. Highlights from Findings of the National Scan Highlights from the earlier, national work serve as a backdrop to this project’s findings and are described below:
• All 50 states and the District of Columbia either have in place or are currently developing or piloting a state science assessment.
• Twenty-three states were identified as having a science performance assessment, with the broadened definition of including open-response items.
18

19
• Fourteen science performance assessments fit the project’s criteria of currently being implemented (as opposed to still under development) and were administered to students between grades 9 and 12:
o Colorado o Connecticut o Delaware o Florida o Kentucky o Louisiana o Minnesota
o New Hampshire o New York o Ohio o Rhode Island o Vermont o Washington o Wyoming
• Web sites for 8 of the 50 states identified their science assessments as being commercially developed, i.e., developed by an external vendor, as opposed to states’ internal departments of education testing staff
• Of the 23 states that had some form of science performance assessment, 17 included these assessments as open-response items that were part of a larger assessment.
• Of the 23 states that had some form of science performance assessment, 7 used assessments that were lab or materials based:
o Connecticut o Louisiana o New Hampshire o New York
o Rhode Island o Vermont o Wyoming
• Of the 14 state performance assessments that fit the project’s criteria and were currently being implemented, 8 were administered in grade 11 and 5 were administered in grade 10. For New York, the assessment is administered in grades 9, 10, 11 or 12, depending on course completions.
Please note a caveat to the findings of the national scan: While the findings provide a national landscape of science assessment, we gathered the information from only publicly available Web sites, or, in some cases, via brief email exchanges from the states’ assessment personnel. Although all efforts were made to portray these science assessments as accurately as possible, it is possible that there are some gaps in these data. Findings of the Nine Science Performance Assessments The findings presented below are drawn from our telephone interviews with state-level assessment specialists, review of departments of education Web sites, and examination of publicly available assessment-related documents. These findings are also presented in table form in Appendix B. Where possible, we will distinguish those instances in which our data refer to only the science-performance portion of an assessment. Because Connecticut, Louisiana, and New York are of key interest to the MA ESE, we will highlight findings from those states as appropriate. Assessment Development The science disciplines assessed and the students tested vary from state to state; both of these factors were foundational to the development process. For example, over half of the state tests

assess and report on earth science, inquiry, and/or physics/physical science; however, life science is a close second. Chemistry or biology are most often tested in combination in a life science test rather than tested alone. About half of the tests are given to tenth graders and just under half to eleventh graders. Respondents from one state pointed out that its test can be retaken as needed at the higher grades if students do not pass it the first time. Item writing appears to be the first step in the assessment development process for six of the nine tests (Connecticut, Kentucky, Louisiana, New York, Ohio, and Washington); and all assessments were reported to be aligned with their states’ science standards. Seven of the nine state science performance assessments (Colorado, Connecticut, Kentucky, Louisiana, New York, Ohio, and NECAP states) were developed collaboratively. Collaborations always involved contractors, who most often worked with teachers, and sometimes included state officials as well. Only two states (Minnesota and Washington) relied solely on their own teachers and/or advisory experts for their science performance assessment development. No state relied exclusively on an external contractor for the entire development process without involving teachers in item reviews; however, the explicit oversight responsibilities of each state’s department of education were not explored in this project. Charts 1 and 2 in Appendix C provide a visual for the development paths of Connecticut and New York. According to Chart 1, which displays the development path for Connecticut, items go through three rounds of review before being selected (or not). After items are selected, they are released to a live test. For New York, item writing is done in the first year of development. Chart 2 details further the development path for New York and indicates more involvement from the vendor in the third year. Louisiana reports that items are developed continually and has a content committee comprising teachers (rotating) who review and finalize items. Different from other states, NECAP articulates a step in which the concepts proposed by the contractor for the assessment are reviewed and agreed upon by DOE staff before item writing begins. Table 2 displays the developer and the professional development offered to teachers for each assessment. Sample test items for Connecticut, Louisiana, and New York are featured in Appendix E, F, and G respectively.
Table 2: Assessment Development for Nine States State(s) Developer Professional Development Offering
Colorado Vendor, teachers
Meet with teachers for one week in summer.
Ongoing: Teachers are involved with assessment events that include Science Anchor Review, Content Validity and Alignment Review, and Science Standard Setting during the spring months.
Connecticut Vendor, teachers, content experts, Fairness and Content Committee, DOE
District test coordinators host half-day test-administration workshops for teachers prior to the assessment.
20

State(s) Developer Professional Development Offering
Kentucky Vendor, content advisory committees
The state offers a two- to three-hour session, prior to the summer writing session reviewing issues of format, quality, etc., and then ongoing opportunities.
Louisiana Vendor, teachers
PD available for teachers on content committee. 1. As part of committee membership, teachers receive one hour of item-writing training at the start of the first committee meeting. 2. Statewide training is available on item writing in the form of several workshops.
Minnesota 200–300 randomly selected science teachers
One three-day training session regarding a storyboard, scenario-based test, followed by one-day sessions covering additional storyboard topics, item-writing, etc. using a teacher panel and other formats.
New York
Teacher examination committee, department subject and testing specialists, vendor
To become an item writer, teachers must attend a New York State Education Department item-writer training session (held annually). In addition, test sample drafts are made available for teachers.
New Hampshire, Rhode Island, and Vermont* (NECAP)
Two vendors, heavy reliance on teacher review teams
At the time of this report, professional development is being planned. A practice test will be annotated and made available in February 2009. The vendor is developing teacher workshops on how to use and incorporate test information. Vermont is planning additional professional development on this topic. As part of the contract with Measured Progress, test interpretation workshops will be offered when results are released.
Ohio
Vendor; review committees including state officials; teachers; bias committee; content advisors; range-finding, external experts, community members
A series of workshops for teachers on item scoring and how to demonstrate expectations to students.
Washington Science Assessment Leadership Team
A series of scenario-writing workshops are offered to teachers.
*All three states will be listed as a single entry because they use the same assessment instrument, the New England Common Assessment Program (NECAP). The training that teachers receive as part of the assessment development process most often focuses on writing items and scoring responses. This training often serves as a valuable professional development opportunity as well, and all states that administer the nine assessments described in this report offer some kind of training. At the same time, these experiences vary greatly in content and duration. When described, the content covered in these experiences most often pertained to item writing (Kentucky, Louisiana, Minnesota, New York and Washington),
21

although training in assessment scoring is provided in Ohio and is planned for the NECAP states. Connecticut and the NECAP states provide training sessions in test administration. In terms of their length, informants described sessions as varying from one hour to one week. Although the literature notes the importance of building support among teachers and principals, few states in our sample indicated that this is a priority. This might be because states are developing science assessments in reaction to accountability mandates, whether state or federal. The assessments are not being developed because educators feel the need for more data about student performance. All the states referred to some sort of regulation as the rationale for developing their performance assessments. Specifically, each state with its own assessment cited state laws, while those interviewed about the NECAP assessments cited federal NCLB requirements. In the three states where hands-on performance assessments were included in the state test—New York, Connecticut, and Louisiana—state regulations were reported as drivers, and the development of their assessments pre-dated the implementation of NCLB. States conducting testing in response to state mandates reflected a range of experiences in working with external collaborators in the assessment-development process. For instance, national technical advisory panels supported the assessment decisions made in Kentucky and Washington, while in Colorado, the state department of education relied on state stakeholders. One way that state differences play out is demonstrated in the extent to which they attempt to elicit district or school buy-in to the assessment process. In five of the nine states, there are no buy-in strategies in place. In three states—Minnesota, Ohio and New York—building support from teachers and principals takes the form of either meetings with or surveys distributed to teachers and others in the educational community. In the states using the NECAP assessment, building this support is presumably varied, as it is left up to the local school districts. Assessment Piloting Our review of the research indicated that the pilot phase of assessment development is a crucial step in ensuring the validity and reliability of an assessment. Given the importance of piloting, we anticipated that our sample states would likely pilot their test items over an extended period. As shown in Table 3 below, the majority of states generally spent one to two years piloting their science performance assessments. New York, however, reported spending approximately three years piloting its assessment, which includes a hands-on lab component. Colorado reported that it does not pilot or field test any items with students due to the involvement of teachers and science-content experts prior to release. According to Colorado state officials, the significant time spent reviewing and developing test items mitigated the need for piloting.
Table 3: Assessment Piloting Time and Sampling Framework
State(s) Length of Time Sampling Framework Colorado No piloting Not applicable.
Connecticut 1 year Ten diverse schools participated in piloting for curriculum-embedded tasks.
Kentucky Unavailable Unavailable
22
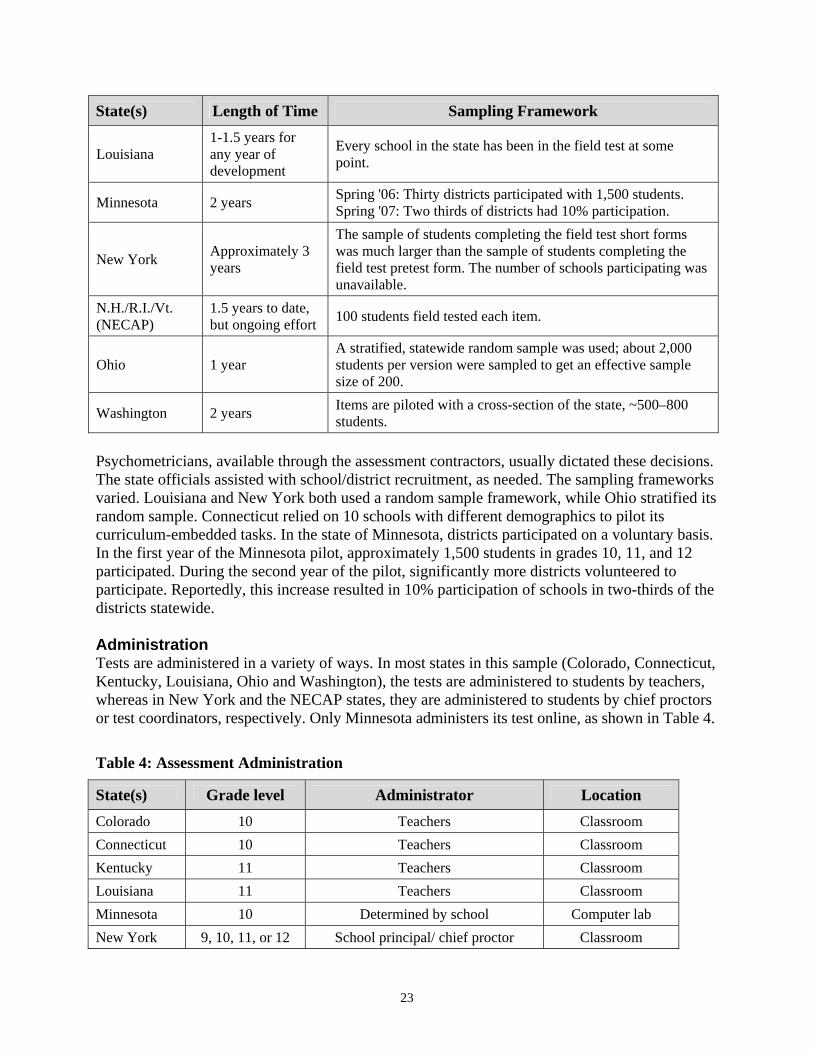
State(s) Length of Time Sampling Framework
Louisiana 1-1.5 years for any year of development
Every school in the state has been in the field test at some point.
Minnesota 2 years Spring '06: Thirty districts participated with 1,500 students. Spring '07: Two thirds of districts had 10% participation.
New York Approximately 3 years
The sample of students completing the field test short forms was much larger than the sample of students completing the field test pretest form. The number of schools participating was unavailable.
N.H./R.I./Vt. (NECAP)
1.5 years to date, but ongoing effort 100 students field tested each item.
Ohio 1 year A stratified, statewide random sample was used; about 2,000 students per version were sampled to get an effective sample size of 200.
Washington 2 years Items are piloted with a cross-section of the state, ~500–800 students.
Psychometricians, available through the assessment contractors, usually dictated these decisions. The state officials assisted with school/district recruitment, as needed. The sampling frameworks varied. Louisiana and New York both used a random sample framework, while Ohio stratified its random sample. Connecticut relied on 10 schools with different demographics to pilot its curriculum-embedded tasks. In the state of Minnesota, districts participated on a voluntary basis. In the first year of the Minnesota pilot, approximately 1,500 students in grades 10, 11, and 12 participated. During the second year of the pilot, significantly more districts volunteered to participate. Reportedly, this increase resulted in 10% participation of schools in two-thirds of the districts statewide. Administration Tests are administered in a variety of ways. In most states in this sample (Colorado, Connecticut, Kentucky, Louisiana, Ohio and Washington), the tests are administered to students by teachers, whereas in New York and the NECAP states, they are administered to students by chief proctors or test coordinators, respectively. Only Minnesota administers its test online, as shown in Table 4.
Table 4: Assessment Administration
State(s) Grade level Administrator Location Colorado 10 Teachers Classroom Connecticut 10 Teachers Classroom Kentucky 11 Teachers Classroom Louisiana 11 Teachers Classroom Minnesota 10 Determined by school Computer lab New York 9, 10, 11, or 12 School principal/ chief proctor Classroom
23

State(s) Grade level Administrator Location N.H./R.I./Vt. (NECAP) 11 Test coordinator Classroom or
Computer lab Ohio 10 Teachers Classroom Washington 10 Teachers Classroom All but one state had some accommodations in place for students with disabilities or English language learners. Minnesota did not have accommodations because its online test engine has been unable to handle them. The state does, however, plan to have some accommodations—specifically visual with additional environmental accommodations in the online component—starting in spring 2008. Six of the remaining eight state assessments explicitly indicate that they offer accommodations for visual impairments, and five states referred to language accommodations. To accommodate English language learners, Connecticut offers readers who provide directions for the assessment in the native language. In addition, four states specified extending the allowed time, three states cited modifications for hearing disabilities, and two states mentioned modifications for physical disabilities. Louisiana and New York make accommodations for language, visual, time, and physical disabilities, among others. The assessments we reviewed are always administered during the spring semester, although New York also provides some limited administrations in January and August. Tests are most often administered in classrooms (Colorado, Connecticut, Kentucky, Ohio, and Washington). However, for two of the tests (those in Louisiana and the NECAP states), administration depends upon the facilities available at particular schools. In two states (Minnesota and New York), assessments are not done in classrooms but in specific settings, namely, computer labs or official assessment centers, respectively. Because the assessment in Ohio is a graduation requirement, state officials also administer it in prisons for incarcerated youth. New York’s test is also a graduation requirement, but the data reviewed did not provide prisons as a setting in which tests are administered to juvenile prisoners. Test security is another important aspect of administration. Security includes keeping testing materials protected and limiting opportunities for test takers to share information about the tests. The states in our sample reported a range of measures to ensure security of their performance assessments. Connecticut addresses its security concerns by using bar-coded labels, keeping tests locked in storage, and collating tests by schools. Once the tests have been administered, Connecticut requires that they all (completed or not) are returned to the state by couriers. Three states mentioned the identification of responsible parties/administrators, methods to link students to particular tests (e.g., New York), as well as measures to keep the tests under lock and key (e.g., Connecticut). Two states kept a count of tests and restricted circulation of test materials. There was only one instance each of using data encryption, shrink-wrapping, or maintaining student seating distance as a security strategy. Some schools in Louisiana take the extra precaution of having students take the science test in non-science classrooms to avoid access to visual displays that may provide answers. With the exception of Minnesota, all states administer a paper-and-pencil exam. The Minnesota test is completed entirely by computer, through Web-enabled and installed software. Table 5
24

summarizes the assessment format, number of items, and completion time for each state’s test. Note that the item format reflects the terminology used by each state, and the completion time refers to the performance assessment section of the exam.
Table 5: Assessment Administration
State(s) Assessment Item Format Number of Science Items
Completion Time for Performance Assessment (minutes)
Colorado Constructed-response 23 65 (3 sessions) Connecticut Open-ended; hands-on lab experiment 30 100 (2 sessions) Kentucky Constructed-response 5 90 Louisiana Short answer; comprehensive science task 4; 1 60 Minnesota Constructed-response (computer-based) 8 60 to 150 New York Constructed-response; performance test 6 36 N.H./R.I./Vt. (NECAP) Constructed-response 7–8 90
Ohio Constructed-response 6 150 Washington Constructed-response 14 90 (2 sessions) Technical Qualities Generally, all states in our sample report statistics on test items. The item analyses are usually performed by the contractor, and the results are described in the technical reports released to the state. In Appendix B, we have provided the item analyses that were conducted and reported for each test. For example, in Colorado, CTB-McGraw Hill samples item data from what are deemed “valid” cases. Valid cases are generally considered to be student assessment data collected from the prescribed standardized environment, usually excluding accommodations. Students who received an oral assessment would be excluded as a valid case. Item analyses of valid cases of constructed-responses in Colorado include item-to-total correlation and p-values, as detailed in its technical report (CTB McGraw Hill, 2007). All states that have administered their assessments showed evidence of reliability and validity. Colorado uses Cronbach’s alpha to measure internal consistency, inter-rater reliability of constructed-responses, item-to-total correlation, and differential item functioning as indicators of reliability. Louisiana also uses Cronbach’s alpha and triangulates that measurement with stratified alpha to account for constructed-response items. Content validity, as evidenced by the correspondence of the test content with the content domain, is often ensured by the involvement of teachers and science content experts in item development and review. Some states have chosen to rely on advisory committees, consisting of external content experts and often teachers, to confirm the construct representation and construct relevance of the assessments. For example, Louisiana, Kentucky, and Ohio have content committees.
25

Scoring Scoring the assessments varied across the instruments in a range of ways, as shown in Table 6. For all but two tests, scoring was the responsibility of contractors rather than state personnel, as noted in the section above. The scoring turnaround time ranged from one and a half to six months, with the majority responding that scoring was completed in approximately two to three months. All assessments were scored manually; in the two states that indicated that they used computers for scoring, it was only done for certain sections (such as multiple-choice items) of the assessment.
Table 6: Assessment Scoring
State(s) Scorer Background Turnaround Time (months) Manual/Machine
Colorado Contractor hires 2.5 Connecticut Teachers or other college graduates 2-3 Kentucky College graduates in related fields 5-6 Louisiana Contractor hires 2 Minnesota Contractor hires 2-3 New York Teachers Unavailable N.H./R.I./Vt. (NECAP) B.A. and science teaching experience Unavailable
Ohio B.A. with science background 1.5 Washington Contractor hires 2
All Manual
It appears to be standard practice for contractors to recruit, hire, and supervise scorers. State officials can obtain reports of rater accuracy. To improve inter-rater reliability, Washington uses double scorers. Double scoring, in turn, attributes to higher scoring costs for this state. Ohio requires that raters maintain 80% accuracy or be dismissed. Kentucky has required its vendor to locate a scoring center within the state so that state officials can oversee scoring standards. Reporting All of the nine state assessments report scores at the school level; eight also report at the district and state levels; six report at the state, district, and student levels. One state reports scores at the county level. Scores for these assessments were most often reported in raw scores as well as in scaled form. Table 7 displays these reporting practices.
Table 7: Assessment Reporting
State Reporting Level* Content Categories Raw/Scaled
R/S
Colorado St, Sc, D, Sta
a) Experimental design & investigations b) Results & data analysis c) Physics d) Chemistry
R & S
26

State Reporting Level*
Raw/Scaled Content Categories R/S c) Earth Science
Connecticut St, Sc, D, Sta
a) Conceptual understanding (all multiple-choice items for each strand) b) Scientific inquiry, literacy, & numeracy (1 constructed-response item for each strand). Strands are energy transformations; chemical structures and properties; global interdependence; cell chemistry and biotechnology; genetics, evolution and biodiversity
R & S
Kentucky St, Sc, D, Sta
a) Earth & space science (16%) b) Physical science (25%) c) Life science (25%) d) Unifying concepts (34%)
R
Louisiana St, Sc, D, Sta
a) Physical science b) Life science c) Earth & space science d) Science & the environment
R & S
Minnesota Sc, D, Sta a) History and nature of science b) Life science R & S
New York Sc, D, Cty, Sta
a) Biology b) Chemistry c) Earth science d) Living environment e) Physics
Unavailable
N.H./R.I./Vt. (NECAP) St, Sc, D, Sta a) Inquiry- context S
Ohio St, Sc, D, Sta
a) Science & technology b) Scientific inquiry & scientific ways of knowing c) Earth & space sciences d) Life sciences e) Physical science
R & S
Washington Sc, D, Sta a) Systems of science b) Inquiry in science c) Application of science
Scaled
* St = student; Sc = school; D = district; Cty = county; Sta = state Costs We were not always able to collect cost data related to the state science performance assessments. We received no cost related information for one state, and in only one instance did we receive information itemized by the requested categories. The information that was most readily available was related to which entities were paying for the performance assessments. In five instances, states were identified as the sole funders of assessments, while in two others,
27

state and federal sources were both mentioned. See Table 8 for specifics). Actual figures were only provided four times and in or across different categories. One state cited development costs (separate from administrative costs or the cost of performance-based materials) at $670,000 per year. Two other states reported on combined development and administrative costs: one reported costs of $4 million annually, while the other reported a $75-million-dollar contract with its vendor. A fourth state would only say that its six-year development and administrative costs were in the millions, and that its performance-based-materials costs were paid for using technology money. A fifth state, where the development process is ongoing, gauged its costs this year to be $600,000, with the caveat that costs change yearly and that this has been the most expensive year to date. One state offered specifics exclusively about administrative costs, which it calculated as $35 per student for scoring of constructed-response items due to the use of double readers. Another state put itemized assessment contract information online, although that does not include total costs. This state cited one reason for not having cost information was that the costs have shifted from the state to the district, particularly with regard to the cost of performance-based materials.
Table 8: Assessment Costs and Responsibilities
State(s) Development and Admin Costs Fund Source Colorado Not available State
Connecticut Not available State
Kentucky $75M State
Louisiana Not available State
Minnesota $670K/year for item development and computerization only State
New York Not available Not available
N.H./R.I./Vt. (NECAP) $3M Federal and State
Ohio Not available State
Washington $4M State
Discussion and Areas for Future Research Overall, the findings in this report indicate that science performance assessments vary across states. Although we looked at a range of components, we found some interesting issues raised by the cross-state analysis in the areas of cost, professional development (both to link assessments to instructional practice and to develop support for the assessment), reporting, and the impact of NCLB. Given that 2008–2009 is the first year that NCLB requires students to take a science assessment test, we suspect this overall field of study will only expand in coming years.
28

Cost For policy makers considering the value of investing in the development of a science performance assessment, it is worth stating the obvious: we found that the cost of developing and implementing performance assessments is difficult to capture with specificity. In most instances, information regarding costs was either not easily accessible or in a form that was so general as to prohibit a breakdown and more specific analysis. As a result, this report can only confirm the literature’s finding that the costs associated with developing and implementing a statewide performance assessment program appear to be quite high. At the same time, it highlights the need for more current and specific cost data, as decision makers weigh these apparent high costs against the long-term benefits of such an investment. Impact on Teachers Since this assessment review was intended to shed light on the process of developing and implementing a science performance assessment, we necessarily did not inquire as to the tests’ impact on teaching or learning. However, the finding that all states provided training to teachers as part of the development process suggests a possible impact on teachers’ instruction. We see the potential to improve instruction in the nature of the professional development provided to teachers in the assessments we studied—most of it centered on the validity and alignment of the assessments to standards, item-writing, and scoring. With regard to scoring, for example, the impact of teachers’ increased understanding of scoring rubrics to improve student achievement has been documented in the literature (see, for example, Schafer, Swanson and Bene, 2001). Vermont’s professional development is unique in that it includes showing teachers how to use the assessments and how to incorporate related concepts in the classroom. This practice also suggests possible instructional and achievement benefits. Arriving at the most beneficial and efficient array of professional development offerings associated with a performance assessment is a valid goal for policymakers. The fact that the states we studied varied in the nature, scope, and duration of professional development suggests that there was no favored approach. It appears that states are balancing their resources, capacities, and challenges in unique ways that reflect their contexts and conditions. Although the research on performance assessment stresses the need to build the support not only from teachers but also from parents, legislators, and the general public, few states in our sample follow that advice. When asked about buy-in strategies in this study, states responded only with references to building support among teachers. Moreover, of the three states where the performance assessments involved hands-on tasks (New York, Connecticut, and Louisiana), which presumably would face the greatest opposition, only New York and Louisiana mentioned specific strategies for gaining teacher support. Consistent with Pearson et al. (2002), however, some of the states considered teachers’ involvement in the development process as an activity with multiple benefits: a contribution to the assessment construction, professional development, and a means to elicit teacher support. Timeliness of Reporting A well-known assessment issue that is not particular to the performance assessments studied in this project has to do with the timeliness of reporting student outcomes (Brown-Chidsey, Davis,
29

& Maya, 2003; Paek, 2005). While administration schedules and reporting practices were consistent among states, the amount of time taken to score assessments varied widely. Specifically, all states reported administering performance assessments in the spring and all but one state presently report assessment scores at the student, school, and district levels. However, in terms of the time required for scoring the assessments, state responses varied greatly, ranging from six weeks to six months. While states’ multi-level reporting practices can be used to help inform school and district improvement plans, the combination of the administration and scoring schedules precludes using the assessments formatively at the student level. For all assessments included in this study, a school year ends (and often a new school year begins) before student-level score reports are released. This time delay means that teachers do not get the chance to review the test results and adjust their instruction to meet their students’ needs (Flanigan & Harrison, 2005, p. 635). Impact of NCLB In light of the increasing importance of testing science achievement as a consequence of NCLB, it is worth looking at the role that NCLB played in the development of the performance assessments we studied. It appears that the impact of NCLB in advancing science assessments overall may be quite prominent, but its relationship to science performance assessments is varied. For example, it became clear from the previous national scan that, at this time, all 50 states have science tests in place. Some have been using them for several years, while others are finishing up their pilots. These tests use items in multiple-choice/short-answer/constructed-response formats, and they are designed to meet NCLB requirements. In contrast, of the assessments described in this report, the NECAP assessment is the only one that is based solely on NCLB requirements, whereas others based their development decisions on state mandates that followed NCLB guidelines. The “hands-on” assessments, found in New York, Connecticut, and Louisiana, were either already developed or in the development process when NCLB was put in place. Therefore, it is reasonable to conclude that NCLB and/or state mandates are the drivers for testing high school students in science, but they do not appear to be responsible for the three hands-on performance assessments we described. In fact, given the high costs of developing and implementing science performance assessments, it may be more accurate to credit the states themselves for exceeding federal requirements at their own expense in order to gain a more comprehensive understanding of their students’ scientific knowledge and understanding. Finally, it is worth considering what we can and cannot say about the status of science performance assessments nationwide based on the format of the performance assessments we studied. First, because we sought statewide mandated assessments, and the costs associated with developing and implementing hands-on assessments are so high, it is not surprising that there are so few hands-on, performance assessments in use. It was in light of this fact that the MA ESE decided to use the most inclusive definition of performance assessment such that students could manipulate materials and/or answer a constructed-response item as long as the item required students to refer either to something they did or manipulated or to a written description of an experiment. Second, although this broad definition falls within the parameters of the literature, as the review of research shows, we also recognize that this is not the understanding of a performance assessment in its “purest form.” To this point, the majority of the constructed-
30

response performance assessments included in this study are not labeled as performance assessments by the states implementing them, nor would it be likely that others would label them as such. Only the performance assessments found in New York, Connecticut, and Louisiana meet the commonly accepted definition of a performance assessment.
31
Bibliography
Baker, E., O’Neil, H. F., Jr., & Linn, R. L. (1994). Policy and validity prospects for performance-based assessment. Journal for the Education of the Gifted, 17(4), 332– 353.
Berk, R.A. (Ed.). (1982). Handbook of methods for detecting test bias. Baltimore, MD: The Johns Hopkins University Press.
Brown-Chidsey, R., Davis, L., & Maya, C. (2003). Sources of variance in curriculum-based measures of silent reading. Psychology in the Schools, 40, 363-377.
Business Higher Education Forum. (1997). Spanning the chasm: Corporate and academic cooperation to improve work-force preparation. Retrieved on January 21, 2008, from http://www.bhef.com/publications/spanningthechasmtaskforceonhighperformanceworkandworkerstheacademicconnection.pdf.
Calderone, J., King, L. M., & Horkay, N. (Eds). (1997). The NAEP guide: A description of the content and methods of the 1997 and 1998 assessments. (Report No. NCES 97-990). Washington, DC: National Assessment of Educational Progress, U.S. Department of Education. (ERIC Document Reproduction Service No. ED 412 294).
Crocker, L. (1997). Assessing content representativeness of performance assessment exercises. Applied Measurement in Education, 10(1), 83–95.
CTB McGraw Hill (2007). Colorado Student Assessment Program technical report 2007. Monterey, CA: Author.
Darling-Hammond, L. & Wise, A. (1985). Beyond standardization: State standards and school improvement. Elementary School Journal, 85(3), 315–336.
DeBoer, G., Herrmann, C., & Gogos, A. (2007). Assessment linked to science learning goals: Probing student thinking during item development. Paper presented at the National Association for Research on Science Teaching Annual Conference, New Orleans, LA, April 15-18, 2007.
Dunbar, S., Koretz, D., & Hoover, H. (1991). Quality control in the development and use of performance assessments. Applied Measurement in Education 4(4), 289–303.
Flanigan, D. & Harrison, P. (2005). Contemporary intellectual assessment, second edition: Theories, tests, and issues. Guilford Press: New York.
Hambleton, R. & Rodgers, J. (1995). Item bias review. Practical Assessment, Research & Evaluation, 4(6). Retrieved April 1, 2008 from http://PAREonline.net/getvn.asp?v=4&n=6
Hardy, R. A. (1995). Examining the costs of performance assessment. Applied Measurement in Education 8(2), 121–134.
Herman, J. L., Aschbacher, P. R. & Winters, L. (1992). A practical guide to alternative assessment. Alexandria, VA: Association for Supervision and Curriculum Development.
Hoepfl, M. (2000). Large scale authentic assessment [Electronic version]. Retrieved December 18, 2006, from http://www-tcall.tamu.edu/erica/docs/custer/custer6.pdf
32
Holland, P. W. & Wainer H. (1993). Differential item functioning. Hillsdale, NJ: Lawrence Erlbaum Associates.
Institute for Interactive Media & Learning. (2008). Key Terms in Assessment. University of Technology Sydney. Available: http://www.iml.uts.edu.au/assessment/glossary.html
Jaeger, R. M., Mullis, I. V. S., Bourque, M. L., & Shakrani, S. (1996). Validity of performance assessments. In G. W. Phillips (Ed.), Technical issues in large-scale performance assessment (pp. 79–115). Washington, DC: U.S. Department of Education, Office of Educational Research and Improvement.
Khattri, N., Reeve, A., & Kane, M. (1998). Principles and practices of performance assessment. Mahwah, NJ: Lawrence Erlbaum Associates.
Klassen, S. (2006). Contextual assessment in science education: Background, issues and policy. Science Education, 90(5), 820–851.
Learning Results: Parameters for Essential Instruction, Chapter 132 ME Reg. 05 -071 (2007). Available: http://mainegov-images.informe.org/education/lres/pei/sci_tech102207.pdf.
Linn, R. (1987). Accountability: The comparison of educational systems and the quality of test results. Educational Policy, 1(2), 181–198.
Lukhele, R, Thissen, D., and Wainer, H. (1993). On the relative value of multiple-choice, constructed-response, and examinee-selected items on two achievement tests. Program Statistics Research Technical Report No. 93-28. Princeton, NJ: Educational Testing Service.
Madaus, G. (1985). Public policy and the testing profession:You've never had it so good? Educational Measurement: Issues and Practices, 4(1), 5–11.
Massachusetts Department of Education (2000). The Massachusetts Comprehensive Assessment System: 1999 MCAS technical report. Malden, MA: Author.
McBrien, J. L., & Brandt, R. S. (1997). The language of learning: A guide to education terms. Alexandria, VA: Association for Supervision and Curriculum Development.
Messick, S. (1996). Validity of performance assessments. In G. W. Phillips (Ed.), Technical issues in large-scale performance assessment (pp. 1-18). Washington, DC: U.S. Department of Education, Office of Educational Research and Improvement.
Moss, P.A. (1994) Can there be validity without reliability? Educational Researcher, 23(2), 5-12
Navarrete, C. & Gustke, C. (1996). A guide to performance assessment for linguistically diverse students. [Electronic version]: Retrieved January 18, 2006, from http://www.ncela.gwu.edu/pubs/eacwest/performance/index.htm#reporting
Office of Educational Research and Improvement, U.S. Department of Education. (1997). Assessment of student performance: April 1997 [Electronic version]: Retrieved December 18, 2006, from http://www.ed.gov/pubs/SER/ASP/stude1-2.html
Office of Technology Assessment (1992). Testing in American schools: Asking the right questions. OTA-SET-519, NTIS order #PB92-170091.
Osterlind, S.J. (1983). Test item bias. Thousand Oaks, CA: Sage Publications.
Paek, P. (2005). Recent trends in comparability studies: Using testing and assessment to promote
33

learning. PEM Research Report 05-05. Available: http://www.pearsoned.com/RESRPTS_FOR_POSTING/ASSESSMENT_RESEARCH/AR4.%20PEM%20Recent%20Trends%20in%20Comparability%20%2005_05.pdf
Partnership for 21st Century Skills. (2005). Results that matter: 21st century skills and high school reform. Retrieved January 23, 2008, from http://www.21stcenturyskills.org
Pearson, P. D., Calfee, R., Walker-Webb P. L., & Fleischer, S. (2002). The role of performance-based assessments in large-scale accountability systems: Lessons learned from the inside [Electronic version]. Retrieved December 17, 2006, from http://www.ccsso.org/content/pdfs/TILSACalfee.pdf.
Performance Assessment Links in Science: An interactive resource bank for science performance assessment tasks. Retrieved March 19, 2008, from http://pals.sri.com/guide/glossary.html.
Ruiz-Primo, M. A., & Shavelson, R. J. (1996). Rhetoric and reality in science performance assessment. Journal of Research in Science Teaching, 33(10), 1045–1063.
Schafer, W., Swanson, G., & Bene, N. (2001). Effects of teacher knowledge of rubrics on student achievement in four content areas. Applied Measurement in Education. Vol. 14, No. 2, 151–170.
Scheuneman, J. D. (1982a). A new look at bias in aptitude tests. In P. Merrifield (Ed.), New directions for testing and measurement: Measuring human abilities, No. 12. San Francisco: Jossey-Bass.
Scheuneman, J. D. (1982b). A posteriori analyses of biased items. In R.A. Berk (Ed.), Handbook of methods for detecting test bias. Baltimore, MD: The Johns Hopkins University Press.
Scheuneman, J. D. (1984). A theoretical framework for the exploration of causes and effects of bias in testing. Educational Psychology, 19(4), 219–225.
Shavelson, R., Baxter, G., & Gao, X. (1993). Sampling variability of performance assessments. Journal of Educational Measurement, 30(3), 215–232.
WestEd & Council of Chief State School Officers. (2007). Science framework for the 2009 National Assessment of Educational Progress. Washington, DC: National Assessment Governing Board.
Willson,V. L. (1991). Performance assessment, psychometric theory, and cognitive learning theory: Ships crossing in the night. Contemporary Education, 62(4), 250–254.
34

Appendix A
Guide for Describing High School Science Performance Assessments This guide outlines the types of information that should be gathered on each science performance assessment. Piloting and Development: 1. Length of time
• Length of time for the piloting process to take place • Over a continuous period • Done at more than one time
2. Recruitment of schools/students
• Random sample or other type of sampling method • Selection process for schools/students • If voluntary, type of volunteer schools
o # students per school o distribution of schools in the state socio-economically o ethnically and geographically o representative of schools in the state
• If mandatory, selection criteria 3. Sampling Framework/Size
• Size of piloting sample o number of schools, grades, number of students per school o distribution of schools in the state with regard to SES, ethnicity, geographically o how representative was the sample of the state in general
• What was the sample design o experimental, quasi-experimental, non-experimental
• Comparison of sampled size to the universe 4. Aligned with state standards
• Yes/No
5. Developer • Who developed the assessment
o Teachers, vendor • Frequency of meetings/consultations • Phone, face-to-face, email • If more than one party, level of collaboration
6. How/When?
35

• How it was developed • What the development process included • The logistics that were taken into account • When the development occurred
o during what time period o how long it took
7. Professional Development
• Was there PD offered to teachers regarding the assessment? • If so, what did it look like
o cost of PD o amount and duration of PD o incentive for participants, e.g., credits or release time
Administration 1. Administration of the test
• Teachers • Administrators • Other
2. Grade level(s) taking the assessment 3. Accommodations for any particular subgroups
• Yes/No • Explain/describe
4. When the is test administered
• Fall, spring, other 5. Where the test is administered
• Classroom • Lab • Other
6. Security issues present
• Keeping materials locked and away from students/teachers prior to use • Other • Post-assessment security issues
7. If the assessment involves hands on lab work:
• Safety issues • Steps for student safety, e.g., goggles, gloves, etc.
Technical Qualities 1. Format of assessment
• Computer-based
36

• Portfolio • Lab • Paper-pencil • Other
2. Reliability and Validity
• Reliability measures applied • Results of reliability measures • Validity measures applied • Results of validity measures
3. Types of items
• Constructed-response • Short answer • Multiple choice • Presence of graphing items or other visual-type responses
4. Number of items
• Number of items of each type in the assessment 5. Item analysis
• Yes/No • Who (e.g., DOE or outside company) • Purpose (e.g., for DIF/bias) • Type of item analysis that was conducted
6. Expected amount of time
• If not a hands-on task – how much time for the performance assessment items • If hands-on task, how much time to complete performance task itself • If hands-on, how much time to complete items related to performance task
7. Number of years implemented as an operational assessment Reporting 1. Levels that are reported
• Student, school, district, state, and/or national reporting 2. Content reporting categories
• Physics, Chemistry, etc. 3. How assessment scores are reported
• Scaled, raw, aggregated, disaggregated • Range of the scale • Other comments about the decision to scale or challenges in scaling
4. How the assessment is scored
37
• By hand, with rubric, by machine/computer 5. Who scores the assessments
• Teachers, contractors, other 6. Turnaround time for scoring (student distribution date, when scores reported) Building Support among Teachers and Principals: 1. Surveys
• Identify groups: teachers, parents, community • Purpose of survey (for each group surveyed)
2. Meetings
• Identify groups: teachers, parents, community • Purpose • Other buy-in attempts
3. Regulations/Laws: Identify any regulations or laws that influenced the use of performance
assessments or the way a state has applied them • How they have had an influence
4. Other Costs 1. Development 2. Administration 3. Performance based materials 4. Total 5. Source of funds Follow-up 1. Other contacts to add information to the description 2. Documents pertaining to the assessment to add information to the description
• Where they can be obtained • Who could send hard copy, fax, email
38

Appendix B
Tables Summarizing Characteristics of the Instruments (Because of formatting incompatibilities, this Excel document, is provided in a separate attachment including eight worksheets. Each worksheet should be printed out in horizontal format on legal sized paper) Worksheet 1. Piloting Worksheet 2. Development Worksheet 3. Administration Worksheet 4. Technical Qualities Worksheet 5. Reporting Worksheet 6. Building Support Among Teachers and Principals Worksheet 7. Costs Worksheet 8. Notes
39
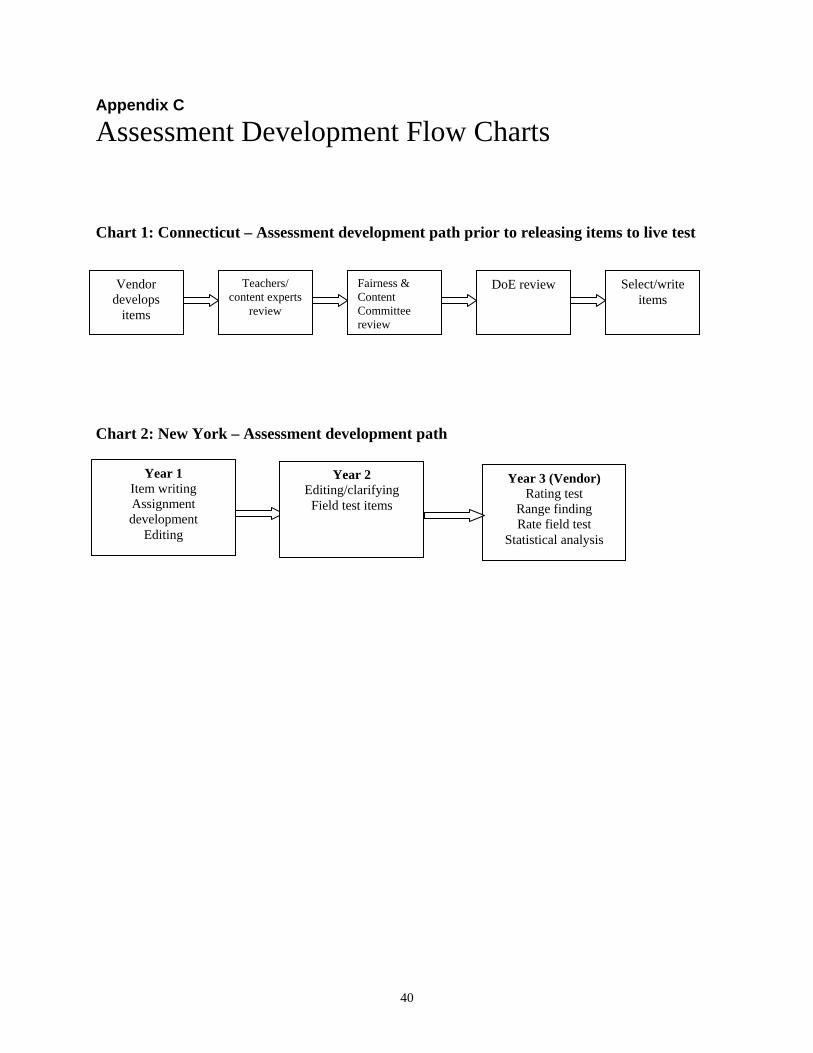
Appendix C
Assessment Development Flow Charts Chart 1: Connecticut – Assessment development path prior to releasing items to live test
Chart 2: New York – Assessment development path
Year 3 (Vendor) Rating test
Range finding Rate field test
Statistical analysis
Year 1 Item writing Assignment development
Editing
Year 2 Editing/clarifying
Field test items
Vendor develops
items
Teachers/ content experts
review
Fairness & Content Committee review
DoE review Select/write items
40

Appendix D
Data Sources for States Profiled State Data Source(s) Colorado Interview and documents from state DoE
Connecticut Interview and documents from state DoE
Kentucky Interview and documents from state DoE
Louisiana Interview and documents from state DoE
Minnesota Interview and documents from state DoE
New York Documents from state DoE Web site and DoE comments
N.H./R.I./Vt. (NECAP) Interview and documents from VT state DoE
Ohio Interview and documents from state DoE
Washington Interview and documents from state DoE *All three states are listed here as a single entry because they use the same assessment instrument, the New England Common Assessment Program (NECAP).
41

Appendix E
Sample Items—Connecticut Connecticut – Laboratory Investigation – Global Interdependence Curriculum-embedded tasks, in conjunction with Connecticut Academic Performance Test: Generation III (CAPT) NOTE: Constructed response sample items were not available .
Acid Rain
Student Materials
Acid rain is a major environmental issue throughout Connecticut and much of the United States. Acid rain occurs when pollutants, such as sulfur dioxide from coal burning power plants and nitrogen oxides from car exhaust, combine with the moisture in the atmosphere to create sulfuric and nitric acids. Precipitation with a pH of 5.5 or lower is considered acid rain.
Acid rain not only affects wildlife in rivers and lakes but also does tremendous damage to buildings and monuments made of stone. Millions of dollars are spent annually on cleaning and renovating these structures because of acid rain. Your Task Your town council is commissioning a new statue to be displayed downtown. You and your lab partner will conduct an experiment to investigate the effect of acid rain on various building materials in order to make a recommendation to the town council as to the best material to use for the statue. In your experiment, vinegar will simulate acid rain. You have been provided with the following materials and equipment. It may not be necessary to use all of the equipment that has been provided. Suggested materials:
Proposed building materials: containers with lids limestone chips graduated cylinder marble chips vinegar (simulates acid rain) red sandstone chips pH paper/meter pea stone safety goggles access to a balance
42
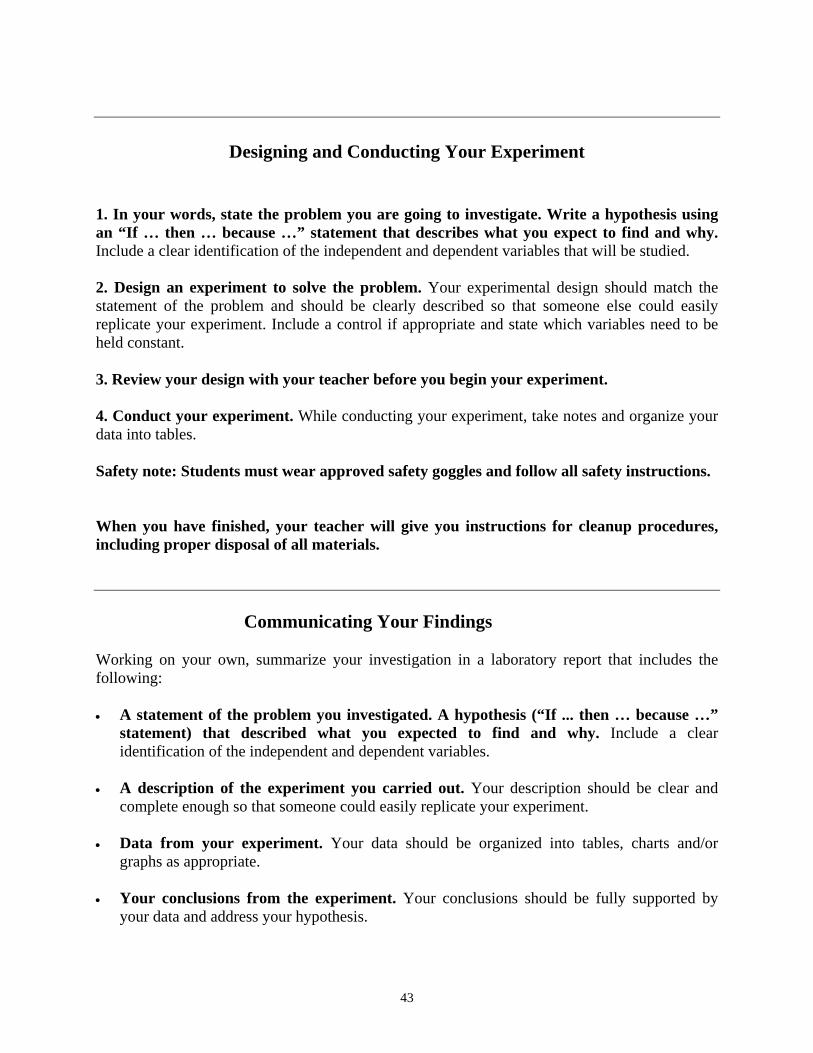
Designing and Conducting Your Experiment
1. In your words, state the problem you are going to investigate. Write a hypothesis using an “If … then … because …” statement that describes what you expect to find and why. Include a clear identification of the independent and dependent variables that will be studied. 2. Design an experiment to solve the problem. Your experimental design should match the statement of the problem and should be clearly described so that someone else could easily replicate your experiment. Include a control if appropriate and state which variables need to be held constant. 3. Review your design with your teacher before you begin your experiment. 4. Conduct your experiment. While conducting your experiment, take notes and organize your data into tables. Safety note: Students must wear approved safety goggles and follow all safety instructions. When you have finished, your teacher will give you instructions for cleanup procedures, including proper disposal of all materials.
Communicating Your Findings Working on your own, summarize your investigation in a laboratory report that includes the following: • A statement of the problem you investigated. A hypothesis (“If ... then … because …”
statement) that described what you expected to find and why. Include a clear identification of the independent and dependent variables.
• A description of the experiment you carried out. Your description should be clear and
complete enough so that someone could easily replicate your experiment. • Data from your experiment. Your data should be organized into tables, charts and/or
graphs as appropriate. • Your conclusions from the experiment. Your conclusions should be fully supported by
your data and address your hypothesis.
43
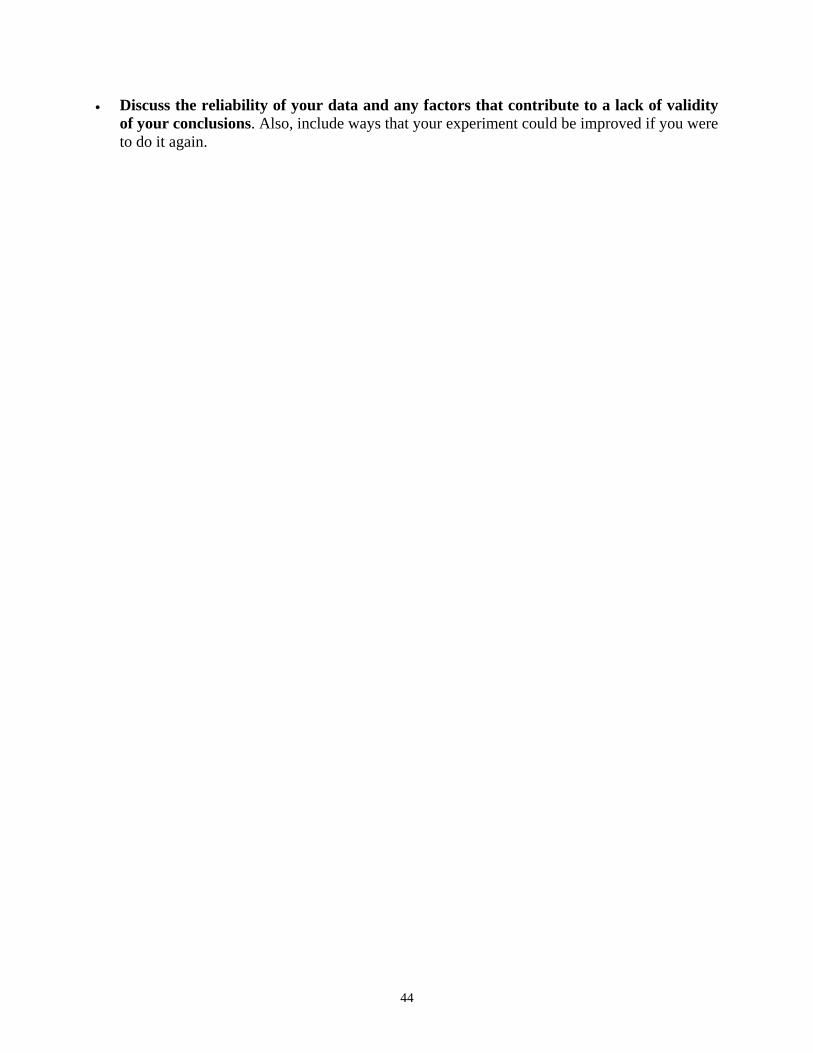
• Discuss the reliability of your data and any factors that contribute to a lack of validity of your conclusions. Also, include ways that your experiment could be improved if you were to do it again.
44

Appendix F
Sample Items—Louisiana Louisiana – Graduation Exit Exam Grade 11 Short Answer: Life Science Cells produce proteins that are essential to the proper function and structure of organisms. DNA and RNA are involved in protein production. A. Explain how DNA is involved in protein formation. B. Explain how RNA is involved in protein formation. Physical Science Suppose you have a mixture of sand and salt in a beaker. Describe a practical procedure you could use to obtain a sample of sand and a sample of salt from this mixture. Comprehensive Science Task TASK DESCRIPTION Homeostasis is the maintenance of the internal environment of an organism within a fairly narrow range that is necessary for the organism to survive. A high school biology class studied the homeostatic regulation of temperature in the human body. Variations in the external environment, as well as the release of excess heat due to the metabolic processes occurring within the body, could affect the body’s temperature. The class discovered that there are many ways the body regulates the amount of heat transmitted to the environment. They wondered whether all people have the same body surface temperature and whether the process of releasing excess heat is the same for everyone. They became most interested in the organ systems that regulate dilation of capillaries near the surface of the skin so that blood can give up excess heat by radiation or conduction to the surrounding environment. The biology class proposed the following: If the body produces excess heat in muscles and other tissues when a person exercises, the nervous system should react to dilate the capillaries near the surface, so excess heat dissipates. Evidence of this reaction is the flushed appearance of a person who has just finished jogging. Knowing this, the students reasoned that the removal of heat through the skin should result in an elevated body surface temperature after exercise. This raised two questions. • Does the body surface temperature increase during exercise, and, if so, do all areas of the
surface change the same amount? • Are changes in body surface temperature during exercise the same for males and females? To answer these questions, the students designed an experiment. They selected five locations on the body to monitor temperature changes: the neck, the forearm, the waist, the thigh, and the calf. The locations are illustrated in the diagram on this page. They used an electronic device with a temperature probe specially designed to quickly measure body surface temperature. The
45

temperature was taken by pressing the probe against the skin for a minimum of ten seconds. Ten members of the class, five girls and five boys, volunteered to be the subjects in the experiment. Each subject wore gym shoes, shorts, and a loose shirt during an individually scheduled testing period that lasted about fifteen minutes. Two other students were scheduled for each session, one to act as the timer and the second to gather body surface temperature data. Each subject first sat perfectly still for ten minutes. At the end of that time, the “at rest” temperatures of the five body locations were measured and recorded. Next, the subject ran in place at a consistent rate for five minutes. Immediately after the subject stopped running, the “after exercise” temperatures of the five locations were measured. The change in body temperature for each of the five locations is shown in the data table below. Positive numbers indicate an increase in temperature, and negative numbers indicate a decrease in temperature. Use the task information and the data in the table to answer question 1: 1. Before the experiment began, the students had written two questions that they wanted to
answer, but they did not translate those questions into a hypothesis. Write a hypothesis that could have guided this experiment.
Use the information below to answer question 2: One student in the class stated, “The data show that dilation of blood vessels near the surface of the skin during and after exercise allows faster loss of excess heat to the exterior environment, causing an elevated surface temperature. This process allows the body to maintain its internal temperature of 37_C.” 2. Identify one flaw in this conclusion. Explain why it is a flaw. 3. One of the questions the students asked was, “Does the body surface temperature increase
during exercise, and, if so, do all areas of the surface change the same amount?” Give a response to this question. Use the data to support your answer.
4. When a person exercises, temperature changes occur on the person’s body surface.
A. Identify and explain how two organ systems cause most areas of the body’s surface to have a higher temperature during and immediately after strenuous exercise.
B. Identify and explain how the organ systems you described in part A contribute to
homeostatic regulation of the body’s internal temperature.
46

Appendix G
Sample Items—New York New York Regents Examination – Earth Science 1. On the diagram in your answer booklet, draw the apparent path of the Sun across the sky on
September 23 from sunrise to sunset.
2. On the diagram in your answer booklet, draw the shadow of the vertical post as it would appear at solar noon on September 23.
3. Place an X on the diagram in your answer booklet to indicate the altitude of the Sun at solar noon on June 21.
4. How many degrees will the Sun appear to move across the sky from 1 p.m. to 3 p.m. on June 21?
5. At which latitude is this vertical post located? Include the unit and compass direction in your answer.
47

48
Appendix H
Sample NAEP Performance Task with Scoring Rubric Using a Pencil to Test Fresh and Salt Water You have been given a bag with some things in it that you will work with during the next 20 minutes. Take all of the things out of the bag and put them on your desk. Now look at the picture below. Do you have everything that is shown in the picture? If you are missing anything, raise your hand and you will be given the things you need.
Now you will use the things on your desk to do some activities and answer some questions about those activities. Follow the directions step-by-step and write your answers to the questions in the space provided in your booklet. Rainwater and the water in streams and lakes are called fresh water. Fresh water has very little salt in it and is quite different from salt water, which is found in oceans. One way you can tell the difference between fresh water and salt water is by doing the following tests. 1. Open the bottle labeled Fresh Water Pour all of the fresh water into the cylinder. Put the cap
back on the bottle. After you add the fresh water to the cylinder, what is the total amount of water in the cylinder milliliters (mL)?
Now use the red marker to draw a short line on the side of the cylinder to show how much
water is in it. Scoring Guide Scoring Rationale: Student demonstrates an ability to measure the volume of water in a graduated cylinder. (The water sample in the bottle of freshwater has been pre-measured to be 95mL.) 3 = Complete - Student response is 94 - 96 mL. 2 = Partial - Student response is 90 - 93.99 mL. 1 = Unsatisfactory/Incorrect - Student response is < 90 mL or >96 mL.