high salt reduces the activation of il-4– and il- · were produced from the bm of c57bl/6 mice...
TRANSCRIPT

High salt reduces the activation of IL-4– and IL-13–stimulated macrophages
Katrina J. Binger, … , Jens Titze, Dominik N. Müller
J Clin Invest. 2015;125(11):4223-4238. https://doi.org/10.1172/JCI80919.
A high intake of dietary salt (NaCl) has been implicated in the development of hypertension,chronic inflammation, and autoimmune diseases. We have recently shown that salt has aproinflammatory effect and boosts the activation of Th17 cells and the activation of classical,LPS-induced macrophages (M1). Here, we examined how the activation of alternative (M2)macrophages is affected by salt. In stark contrast to Th17 cells and M1 macrophages, highsalt blunted the alternative activation of BM-derived mouse macrophages stimulated with IL-4 and IL-13, M(IL-4+IL-13) macrophages. Salt-induced reduction of M(IL-4+IL-13) activationwas not associated with increased polarization toward a proinflammatory M1 phenotype. Invitro, high salt decreased the ability of M(IL-4+IL-13) macrophages to suppress effector Tcell proliferation. Moreover, mice fed a high salt diet exhibited reduced M2 activationfollowing chitin injection and delayed wound healing compared with control animals. Wefurther identified a high salt–induced reduction in glycolysis and mitochondrial metabolicoutput, coupled with blunted AKT and mTOR signaling, which indicates a mechanism bywhich NaCl inhibits full M2 macrophage activation. Collectively, this study providesevidence that high salt reduces noninflammatory innate immune cell activation and maythus lead to an overall imbalance in immune homeostasis.
Research Article Cardiology Immunology Nephrology Vascular biology
Find the latest version:
http://jci.me/80919/pdf

The Journal of Clinical Investigation R e s e a R c h a R t i c l e
4 2 2 3jci.org Volume 125 Number 11 November 2015
IntroductionHigh intake of dietary salt (NaCl) has been implicated in cardio-vascular disease (1, 2), chronic inflammation (3), autoimmune diseases (4), and cancer (5). The effect of salt on hypertension has been well established; however, controversy remains as to precisely what level of NaCl intake is safe (1, 6, 7), highlighting a poor understanding of underlying mechanisms. While genetics strongly contributes to the development of the above diseases (8–11), the marked rise in autoimmune and inflammatory dis-ease incidence suggests that environmental factors such as the Western diet, high in both sodium and fat, might play a role. On high-salt diets (HSDs), both humans and experimental animals do not exhibit elevated plasma sodium levels, due to tight renal regulation of plasma electrolytes. In contrast, we have described an unexpected storage compartment where sodium accumulates within the skin and muscle via a mechanism independent of the kidney (12–17). This increase in interstitial sodium has been cal-
culated to be approximately 40 mM greater than that measured in plasma (17–20). Interestingly, lymphoid tissues also display a higher osmolarity (19, 21). The influence of increased osmo-larity in certain compartments of the body on the activation, function, and recruitment of immune cells has been the focus of research (16, 18, 22, 23).
We and others have shown that proinflammatory Th17 cells have a boosted activation when cultured with cytokines in the pres-ence of an additional 40 mM NaCl (22, 24). In this study, serum- and glucocorticoid-regulated kinase 1 (SGK1) and tonicity-respon-sive enhancer binding protein (TonEBP, also known as NFAT5) were identified as key mediators of this salt-augmented activa-tion of Th17 cells. Additionally, HSD accelerated and aggravated murine experimental autoimmune encephalitis (22, 24). More recently, we have shown that so-called classically activated, or M1 proinflammatory macrophages (e.g., those stimulated with LPS), also exhibit exaggerated responses when activated in the presence of high NaCl (18). Macrophages are highly heterogeneous immune cells with a continuous spectrum of activation states (25); at the opposite end to M1-activated macrophages are the alternatively activated M2 macrophages (e.g., those stimulated with IL-4 and IL-13) (26). M2 macrophages have been shown to play central roles in mediating Th2 immunity, wound healing, and the suppression of effector T cell function, and they are not considered proinflam-matory (27). In addition, M2 macrophages have been shown to be
A high intake of dietary salt (NaCl) has been implicated in the development of hypertension, chronic inflammation, and autoimmune diseases. We have recently shown that salt has a proinflammatory effect and boosts the activation of Th17 cells and the activation of classical, LPS-induced macrophages (M1). Here, we examined how the activation of alternative (M2) macrophages is affected by salt. In stark contrast to Th17 cells and M1 macrophages, high salt blunted the alternative activation of BM-derived mouse macrophages stimulated with IL-4 and IL-13, M(IL-4+IL-13) macrophages. Salt-induced reduction of M(IL-4+IL-13) activation was not associated with increased polarization toward a proinflammatory M1 phenotype. In vitro, high salt decreased the ability of M(IL-4+IL-13) macrophages to suppress effector T cell proliferation. Moreover, mice fed a high salt diet exhibited reduced M2 activation following chitin injection and delayed wound healing compared with control animals. We further identified a high salt–induced reduction in glycolysis and mitochondrial metabolic output, coupled with blunted AKT and mTOR signaling, which indicates a mechanism by which NaCl inhibits full M2 macrophage activation. Collectively, this study provides evidence that high salt reduces noninflammatory innate immune cell activation and may thus lead to an overall imbalance in immune homeostasis.
High salt reduces the activation of IL-4– and IL-13–stimulated macrophagesKatrina J. Binger,1,2 Matthias Gebhardt,1,2 Matthias Heinig,2 Carola Rintisch,2 Agnes Schroeder,3 Wolfgang Neuhofer,4 Karl Hilgers,3 Arndt Manzel,3 Christian Schwartz,3 Markus Kleinewietfeld,5,6 Jakob Voelkl,7 Valentin Schatz,8 Ralf A. Linker,3 Florian Lang,7 David Voehringer,3 Mark D. Wright,9 Norbert Hubner,2 Ralf Dechend,1,10 Jonathan Jantsch,8 Jens Titze,3,11 and Dominik N. Müller1,2,12
1Experimental and Clinical Research Center, an institutional cooperation between the Charité Medical Faculty and the Max-Delbruck Center for Molecular Medicine, Berlin, Germany. 2Max-Delbruck Center
for Molecular Medicine, Berlin, Germany. 3University Hospital Erlangen at the Friedrich-Alexander-University (FAU) Erlangen-Nuremberg, Erlangen, Germany. 4Medical Clinic V, University Hospital Mannheim,
University Hospital Heidelberg, Mannheim, Germany. 5Translational Immunology, Medical Faculty Carl Gustav Carus, TU Dresden, Dresden, Germany. 6DFG-Center for Regenerative Therapies Dresden (CRTD),
Dresden, Germany. 7University of Tuebingen, Tuebingen, Germany. 8University Hospital Regensburg, Regensburg, Germany. 9Department of Immunology, Monash University, Melbourne, Australia. 10HELI-
OS-Klinikum Berlin, Berlin, Germany. 11Vanderbilt University, Nashville, Tennessee, USA. 12German Centre for Cardiovascular Research Partner Site, Berlin, Germany.
Related Commentary: p. 4002
Authorship note: Katrina J. Binger and Matthias Gebhardt contributed equally to this work.Conflict of interest: The authors have declared that no conflict of interest exists.Submitted: January 9, 2015; Accepted: August 25, 2015.Reference information: J Clin Invest. 2015;125(11):4223–4238. doi:10.1172/JCI80919.

The Journal of Clinical Investigation R e s e a R c h a R t i c l e
4 2 2 4 jci.org Volume 125 Number 11 November 2015
cognate cytokines (31, 32). While the acquisition of a M2 state is pri-marily reliant on STAT6 signaling, it has recently been shown that the long-term maintenance and augmentation of this phenotype is dependent on cellular metabolism. This is driven by key metabolic regulators, including the peroxisome proliferator receptor γ (PPARγ) (33, 34), carbohydrate kinases (35), and lysosomal acid lipase (36), and by the nutrient-sensing signaling pathways Akt and mTOR (37).
important in preventing the development of autoimmune diseases (28–30), while their contribution to hypertension and cardiovas-cular diseases is largely unknown.
Several signaling pathways and transcription factors have been shown to be important for the activation of M2 macrophages. This includes the STAT6, which becomes phosphorylated following recruitment to the IL-4 and IL-13 receptors after the binding of their
Figure 1. High salt blunts the expression of M(IL-4+IL-13) signature genes. (A) Schematic of in vitro stimulation of macrophages. Indicated is the final media concentration of Na+ per condition, where 139 mM is normal, isotonic media. BMC, BM cells. (B) Macrophages were stimulated with IL-4 and IL-13 (M[IL-4+IL-13]) in the absence (none) or with an additional 40 mM NaCl for 24 hours. Unstimulated (M[0]) macrophages were treated similarly. The expres-sion of M(IL-4+IL-13) signature genes was determined by qPCR. The experiment was repeated at least 3 times independently. n = 6 (technical). *P < 0.05 vs. M(0) and #P < 0.05 vs. M(IL-4+IL-13) none by 1-way ANOVA. (C) Macrophages were stimulated with IL-4 and IL-13 as in B or with an additional 40 mM Na-gluconate for 24 hours, and signature gene expression was analyzed by qPCR. The experiment was repeated at least 3 times independently. n = 5 (technical). *P < 0.0001 vs. M(0); #P < 0.001 vs. M(IL-4+IL-13) none by 1-way ANOVA.
The Journal of Clinical Investigation R e s e a R c h a R t i c l e
4 2 2 5jci.org Volume 125 Number 11 November 2015
cell function. This study shows that increased salt also perturbs antiinflammatory immune cells and, thus, might further imbal-ance immune homeostasis.
ResultsSalt blunts M(IL-4+IL-13) macrophage activation. Macrophages were produced from the BM of C57BL/6 mice (BM-derived macrophages, BMDM) and stimulated with IL-4 and IL-13 for 24 hours. To determine the effect of salt on their activation, we increased the concentration of NaCl in the media by an addi-tional 40 mM, i.e., from 139 mM (normal, isotonic media) to
In this study, we have examined how the activation of M(IL-4+IL-13) macrophages (our in vitro–generated M2 mac-rophages; nomenclature according to ref. 26) is affected by NaCl-induced hypertonicity. In contrast to our previous studies with proinflammatory immune cells, we find that NaCl blunts the activation of M(IL-4+IL-13) macrophages in a Sgk1- and Nfat5-independent manner. The reduced M(IL-4+IL-13) activa-tion was not associated with acquisition of a proinflammatory M1 phenotype. We further identify perturbations in Akt signal-ing and the metabolic capacity of M(IL-4+IL-13) macrophages, indicating a new mechanism by which salt modulates immune
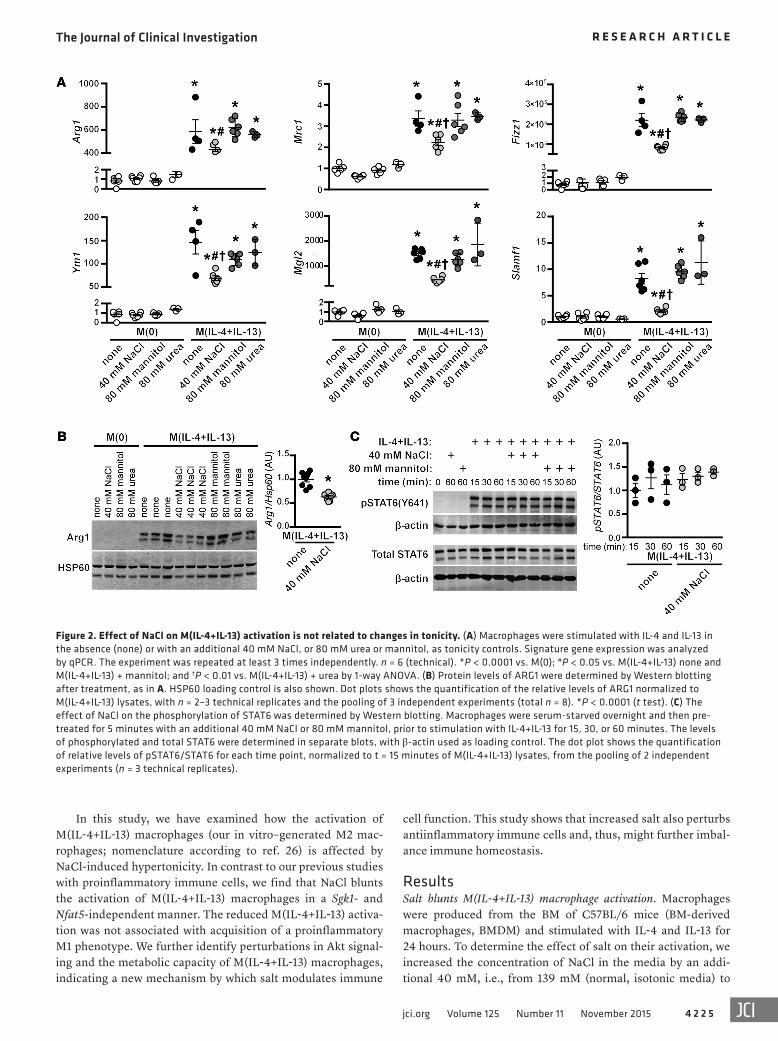
Figure 2. Effect of NaCl on M(IL-4+IL-13) activation is not related to changes in tonicity. (A) Macrophages were stimulated with IL-4 and IL-13 in the absence (none) or with an additional 40 mM NaCl, or 80 mM urea or mannitol, as tonicity controls. Signature gene expression was analyzed by qPCR. The experiment was repeated at least 3 times independently. n = 6 (technical). *P < 0.0001 vs. M(0); #P < 0.05 vs. M(IL-4+IL-13) none and M(IL-4+IL-13) + mannitol; and †P < 0.01 vs. M(IL-4+IL-13) + urea by 1-way ANOVA. (B) Protein levels of ARG1 were determined by Western blotting after treatment, as in A. HSP60 loading control is also shown. Dot plots shows the quantification of the relative levels of ARG1 normalized to M(IL-4+IL-13) lysates, with n = 2–3 technical replicates and the pooling of 3 independent experiments (total n = 8). *P < 0.0001 (t test). (C) The effect of NaCl on the phosphorylation of STAT6 was determined by Western blotting. Macrophages were serum-starved overnight and then pre-treated for 5 minutes with an additional 40 mM NaCl or 80 mM mannitol, prior to stimulation with IL-4+IL-13 for 15, 30, or 60 minutes. The levels of phosphorylated and total STAT6 were determined in separate blots, with β-actin used as loading control. The dot plot shows the quantification of relative levels of pSTAT6/STAT6 for each time point, normalized to t = 15 minutes of M(IL-4+IL-13) lysates, from the pooling of 2 independent experiments (n = 3 technical replicates).

The Journal of Clinical Investigation R e s e a R c h a R t i c l e
4 2 2 6 jci.org Volume 125 Number 11 November 2015
Figure 3. Salt does not induce an M1 phenotype in M(IL-4+IL-13)-activated macrophages. (A) BMDM were stimulated with LPS — M(LPS) — in the absence (none) or presence of an additional 40 mM NaCl or 80 mM mannitol for 24 hours. The expression of Nos2 was determined by qPCR. n = 6 (technical). *P < 0.001 vs. M(0); #P < 0.001 vs. M(LPS) none; and †P < 0.001 vs. M(LPS) + 80 mM mannitol. (B) Macrophages were activated to M(0), M(IL-4+IL-13), or M(LPS) as in A. Nos2, Il6, and Tnfa gene expression was determined by qPCR. n = 6 (technical). *P < 0.001 vs. M(0); #P < 0.05 vs. M(IL-4+IL-13) none; and †P < 0.05 vs. M(IL-4+IL-13) none and M(IL-4+IL-13) + 40 mM NaCl. (C) Macrophages were activated to M(0), M(IL-4+IL-13), or M(LPS) as in A, and genome-wide gene expression was determined by microarray. ChIP-seq was performed for H3K4me3 and H4ac chromatin modifications. Principle component (PC) analysis was performed on all genes in 2 independent, biological replicates. (D) Left: Macrophages were pretreated with an additional 40 mM NaCl and then stimulated with IL-4+IL-13 or LPS for 15, 30, or 60 min. The levels of phosphorylated and total IκBα were determined by Western blotting, with Hsp60 as control. Right: The expression of Ikba by qPCR. n = 6 (technical). *P < 0.01 vs. M(LPS). (E) CD38 surface expression as mean fluorescence intensity (MFI) by flow cytometry in macrophages activated to M(0), M(IL-4+IL-13), or M(LPS) alone (none) as in A. n = 2 technical replicates and the pooling of 3 indepen-dent experiments (total n = 6). *P < 0.01 vs. M(0) none, M(0) + 40 mM NaCl, M(IL-4+IL-13) none, and M(IL-4+IL-13) + 40 mM NaCl; and #P < 0.05 vs. M(LPS). (F) Left: The percentage of BMDM infected with Leishmania major after 72 hours. Right: Nitrate levels. The experiment was repeated independently 3 times and then pooled. n = 8–10 (technical). *P < 0.05 vs. M(0) none, M(0) + 40 mM NaCl, and M(IL-4+IL-13) none; **P < 0.01 vs. all other groups; #P < 0.0001 vs. M(IL-4+IL-13) + 40 mM NaCl; and †P < 0.001 vs. M(LPS) none. Statistics in A, B, and D–F were analyzed by 1-way ANOVA.

The Journal of Clinical Investigation R e s e a R c h a R t i c l e
4 2 2 7jci.org Volume 125 Number 11 November 2015
3). Furthermore, at extended stimulation times, we observed an even greater reduction in M(IL-4+IL-13) signature gene expres-sion, which — in the case of Mrc1, Fizz1, and Mgl2 — equalized after 1 week (Supplemental Figure 3). We also addressed whether preactivated macrophages were similarly sensitive to increased NaCl. The salt-blunted expression of Ym1, Arg1, and Mrc1 was rescued by first incubating macrophages alone with IL-4+IL-13 for 24 hours, before increasing the concentration of NaCl by 40 mM for another 24 hours (Supplemental Figure 4). Finally, in vivo differentiated macrophages isolated from the peritoneal cavity of C57Bl/6 mice stimulated with IL-4+IL-13 were similarly affected by NaCl (Supplemental Figure 5).
Our next question was whether the effect of NaCl on M(IL-4+IL-13) activation was simply due to an increase in tonicity, rather than a specific action of Na+/Cl–. To address this, we repeated the stimulation with IL-4+IL-13 in the presence of 2 non-ionic osmolytes: mannitol, which increases tonicity but does not enter the cell, and urea, which increases osmolality and is able to pass through the cell membrane. In contrast to the effect with high salt, the addition of 80 mM urea or mannitol — which have equiv-alent osmolality and tonicity to 40 mM NaCl, respectively — did not blunt the induction of M(IL-4+IL-13) signature genes (Figure 2A). This differential effect was also observed by Western blotting, as NaCl specifically reduced the protein levels of ARG1, which was not affected by urea or mannitol (Figure 2B).
179 mM (this condition is hereafter referred to as high salt; Fig-ure 1A). This increase in sodium of an additional 40 mM was chosen since it mimics the interstitial accumulation of NaCl in rodents on HSDs (17–20). The activation of M(IL-4+IL-13) mac-rophages is typically characterized by the induction of a panel of signature genes: Arg1 (arginase 1), Mrc1 (mannose receptor), Fizz1 (resistin-like α), Ym1 (chitinase-like 3), Mgl2 (macrophage galactose-type C-type lectin 2), and Slamf1 (signaling lympho-cyte activation molecule 1). Activation in the presence of this additional 40 mM NaCl for 24 hours significantly blunted the upregulation of these genes (Figure 1B) but was not associated with a reduction in the overall purity of the macrophage cultures (defined as F4/80+CD11b+), cell size (Supplemental Figure 1), or cell viability (Supplemental Figure 2). We observed a NaCl dose response, where a reduction in M(IL-4+IL-13) signature gene expression was observed with an increase of only 10 mM NaCl, with 40 mM producing a maximal response (Supplemental Fig-ure 3). Decreased viability was observed only at much higher concentrations of NaCl (>80 mM) (data not shown). Moreover, we observed that the sodium ion was essential for this effect, as stimulation with sodium gluconate similarly blunted M(IL-4+IL-13) signature gene expression (Figure 1C). We next exam-ined the effect of salt on M(IL-4+IL-13) signature gene expres-sion over time and observed a reduced expression of several genes at early time points (1 and 3 hours) (Supplemental Figure
Figure 4. High salt reduces the suppressive capacity of M(IL-4+IL-13) macrophages. (A) Schematic of the in vitro coculture assay. Briefly, macrophages were activated into M(IL-4+IL-13) with/without an additional 40 mM NaCl for 24 hours. Excess salt was then removed by repeated washing of the cells. Coculture of CFSE-labeled CD4+ T cells (from whole splenocytes) and preactivated macrophages occurred in the presence of plate-bound α-CD3 and α-CD28, but without any additional salt. CD4+ T cell proliferation was monitored by flow cytometry. (B) CFSE fluorescence histograms of gated CD4+ T cells incubated with macrophages at a ratio of 6:1 (T cell/macrophage). Macrophages were unactivated (M[0]) or activated with IL-4+IL-13 in the absence (none) or with high salt. (C) Quantification of B. Bars show the mean percentage of proliferating CD4+ T cells (n = 5 technical replicates). The experiment was repeated at least 3 times independently. *P < 0.05 vs. M(0) and #P < 0.05 vs. M(IL-4+IL-13) none by 1-way ANOVA. (D) The level of PD-L2 expression of macrophages from B was determined by flow cytometry. Numbers above each line indicate the mean fluorescence intensity. A similar trend was observed in 3 independent experiments.

The Journal of Clinical Investigation R e s e a R c h a R t i c l e
4 2 2 8 jci.org Volume 125 Number 11 November 2015
The activation of M(IL-4+IL-13) macrophages is dependent on signaling through the transcription factor STAT6, where — upon its phosphorylation — it translocates to the nucleus to regu-late transcription. To determine whether NaCl was affecting this process, macrophages were pretreated in isotonic media or with high salt for 5 minutes, before stimulation with IL-4 and IL-13. No effect was observed on STAT6 phosphorylation (Figure 2C), indi-cating that the ligation of IL-4 or IL-13 to their cognate receptors was not perturbed by high salt, nor were the molecular mecha-nisms essential for the phosphorylation of STAT6.
Salt does not induce an M1 phenotype in M(IL-4+IL-13)-activated macrophages. We have recently shown that high salt augments the activation of proinflammatory LPS-stimulated macrophages, M(LPS) (18). In this study, we demonstrated that, in combina-tion with LPS stimulation, NaCl boosted M(LPS) function by an increased expression of Nos2, augmenting nitrate production, and enhancing antimicrobial activity (18). As mentioned, mac-rophages have a spectrum of activation states, ranging from proinflammatory (e.g. M[LPS]) at one end, to the noninflamma-tory M(IL-4+IL-13) macrophages at the other (26). A shift from
Figure 5. HSD reduces M2 activation in vivo. (A) Mice were fed an NSD or an HSD for 14 days, at which point chitin was injected i.p. After 2 days, PECs were collected from the i.p. space by lavage and the desired immune populations were sorted by FACS and analyzed by qPCR. (B) Representative flow cytometry plots showing staining for macrophages (CD11b+F4/80+) of PECs from mice on NSD and HSD. (C) Quantification from B of the proportion and actual number of macrophages in PECs from mice on each respective diet. n = 4 (biological). (D) Gating strategy for the isolation of the desired immune populations by FACS. Following the gating of macrophages (Mac; CD11b+F4/80+) cells were then gated on CD11b–F4/80– and subsequently sorted as B220+ (B cells), CD3+ (T cells), or B220–CD3– (Neg). The final purity of each sorted population is shown below, where macrophages were >85% and all other populations were >90%. (E) The expression of M2 signature genes in immune cell populations sorted from PECs as described in D. (n = 4 NSD vs. n = 4 HSD biological replicates). *P < 0.05, #P < 0.01, and †P < 0.0001 by 2-way ANOVA.
The Journal of Clinical Investigation R e s e a R c h a R t i c l e
4 2 2 9jci.org Volume 125 Number 11 November 2015
non- to proinflammatory macrophage activation is thought to be central to the development of autoimmune diseases (28–30) and inflammatory conditions, such as type 2 diabetes (38). We thus examined whether the blunted M(IL-4+IL-13) activation by NaCl (Figures 1 and 2) was accompanied by a shift toward proinflam-matory macrophage activation. We examined several parame-ters of M(LPS) activation, including gene expression of specific M(LPS) markers Nos2, Il6, and Tnf (Figure 3, A and B), as well as genome-wide transcriptome (microarray) and epigenetic analysis (Figure 3C); the induction of a proinflammatory signaling path-way related to NF-κB (Figure 3D); and the protein expression of an M(LPS) surface marker, CD38, by flow cytometry (Figure 3E). In none of these analyses did we detect an induction of an M(LPS) phenotype in M(IL-4+IL-13) macrophages activated in high salt. Moreover, functional analyses of BMDM infected with leishmania parasites revealed that only M(LPS) macrophages stimulated in the presence of high salt produced a sufficient amount of nitrate
in order to significantly affect L. major viability (Figure 3F). Taken together, the blunted M(IL-4+IL-13) activation with high NaCl is not accompanied by an increased polarization toward a proinflam-matory M(LPS) phenotype.
Reduction in M(IL-4+IL-13) suppressive capacity with activation in high salt. Noninflammatory M(IL-4+IL-13) macrophages can suppress CD8+ and CD4+ T cell proliferation, which depends on STAT6 activation and cell-cell contact (32). To assess whether high salt had a functional effect on this suppressive capacity of M(IL-4+IL-13) macrophages, we established a macrophage/T cell coculture assay (Figure 4). Briefly, macrophages were preac-tivated to M(IL-4+IL-13) alone or in high salt for 24 hours before extensive washing to remove excess salt. Only after this procedure were macrophages cocultured with prestimulated splenocytes in isotonic media for a further 3.5 days. CD4+ T cells exhibited high levels of proliferation in the presence of nonactivated — M(0) — macrophages. The addition of preactivated M(IL-4+IL-13) macro-
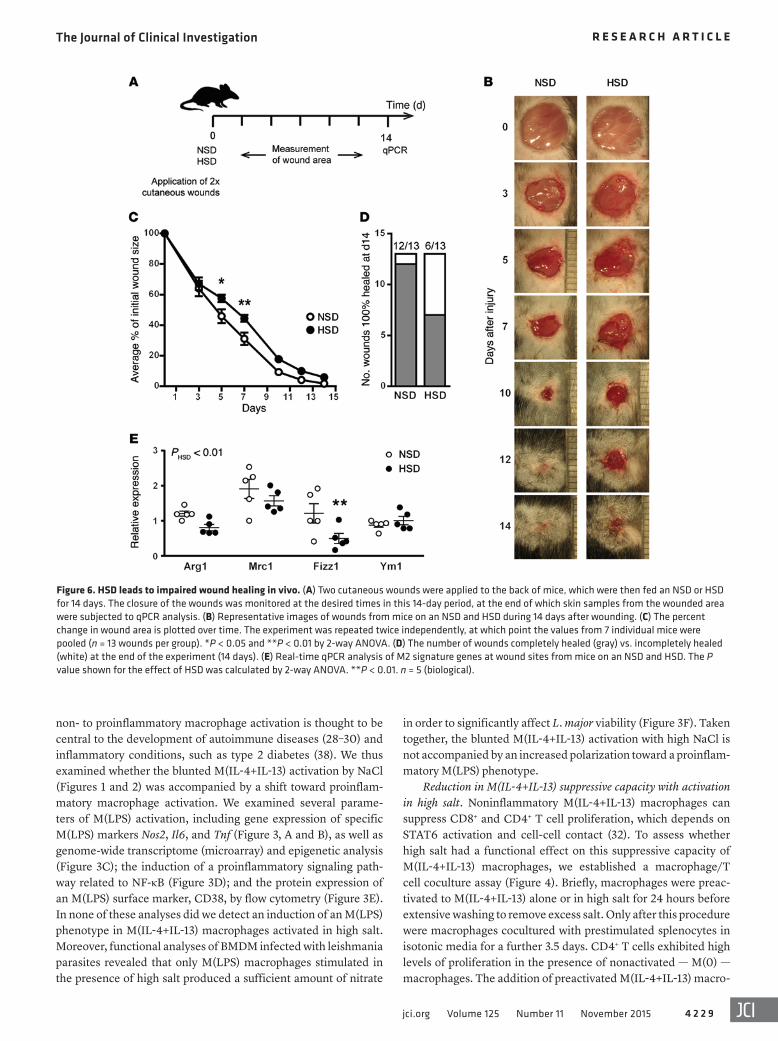
Figure 6. HSD leads to impaired wound healing in vivo. (A) Two cutaneous wounds were applied to the back of mice, which were then fed an NSD or HSD for 14 days. The closure of the wounds was monitored at the desired times in this 14-day period, at the end of which skin samples from the wounded area were subjected to qPCR analysis. (B) Representative images of wounds from mice on an NSD and HSD during 14 days after wounding. (C) The percent change in wound area is plotted over time. The experiment was repeated twice independently, at which point the values from 7 individual mice were pooled (n = 13 wounds per group). *P < 0.05 and **P < 0.01 by 2-way ANOVA. (D) The number of wounds completely healed (gray) vs. incompletely healed (white) at the end of the experiment (14 days). (E) Real-time qPCR analysis of M2 signature genes at wound sites from mice on an NSD and HSD. The P value shown for the effect of HSD was calculated by 2-way ANOVA. **P < 0.01. n = 5 (biological).

The Journal of Clinical Investigation R e s e a R c h a R t i c l e
4 2 3 0 jci.org Volume 125 Number 11 November 2015
which were not altered by additional NaCl, indicating that puta-tive MDSC contamination is not contributing to our observed loss in T cell suppression (Supplemental Figure 1). Furthermore, since the suppressive ability of M(IL-4+IL-13) macrophages is shown to be mediated by cell-cell contact (32), we examined the expression of programmed cell death 1 ligand 2 (PD-L2) by flow cytometry (Figure 4D). Activation to M(IL-4+IL-13) resulted in a more than 2-fold increase in PD-L2 expression, which was reduced with high salt. This indicates that NaCl reduces the expression of the key-suppressive machinery of tolerogenic macrophages.
phages inhibited CD4+ T cell proliferation. In contrast, T cell pro-liferation was significantly less suppressed by macrophages that were preactivated to M(IL-4+IL-13) in high salt (Figure 4, B and C). This effect was also observed at other T cell/macrophage ratios (Supplemental Figure 6). We also examined the macrophage cul-tures for the putative contamination of myeloid-derived suppres-sor cells (MDSCs) — a myeloid lineage immune cell that can be generated from BM cells and is also capable of suppressing T cell proliferation (39, 40). We detected extremely low proportions of MDSCs (<0.2%) in M(IL-4+IL-13)-activated macrophage cultures,
Figure 7. Salt modifies epigenetic marks of M(IL-4+IL-13) genes. (A and B) ChIP-seq was performed to identify the effect of salt on transcriptionally activating epi-genetic modifications upon M(IL-4+IL-13) induction. Only genes that had a corre-sponding increased gene expression upon M(IL-4+IL-13) activation were analyzed further. The H3K4me3 (A) and H4ac (B) marks (counts) upon activation to M(IL-4+IL-13) in the absence (none) or presence of 40 mM NaCl is presented. M(IL-4+IL-13) signature genes analyzed in Figure 1 and Slc6a12 are indicated on each graph. A single technical replicate was generated for each group, which was repeated in 2 independent experiments and then pooled (total of n = 2). (C) Summary of the effect of M(IL-4+IL-13) activation on genes with an increased expression and either a concordant increase (>1.3-fold), no change (nc), or decrease (<0.7-fold) in H3K4me3 and H4ac chromatin marks. The number of genes that were changed (>1.2-fold) upon activation in the presence of an additional 40 mM NaCl is shown. n = 2 (biological). (D) Representative H3K4me3 counts around the promoter region of M(IL-4+IL-13) signature genes Mgl2 and Slamf1, and the tonicity responsive mol-ecule Slc6a12. The total H3K4me3 counts were normalized by library size.

The Journal of Clinical Investigation R e s e a R c h a R t i c l e
4 2 3 1jci.org Volume 125 Number 11 November 2015
Figure 8. Salt modulates M(IL-4+IL-13) cellular metabolism. (A) Macrophages were activated to M(IL-4+IL-13) ± high salt for 24 hours as before, and gene expression was analyzed by microarray. M(IL-4+IL-13) signature genes from Figure 1 and Slc6a12 are indicated. Salt-modulated M(IL-4+IL-13) genes were subjected to GO analysis (right). The top 20 GO terms (FDR < 0.065) are shown. (B) Schematic of the major cellular metabolic pathways: glycolysis and OXPHOS. (C) OCR of unstimulated (M[0]) or M(IL-4+IL-13)-activated macrophages without (none) or with high salt for 24 hours, followed by sequential treatment with Oligomycin (to inhibit mitochondrial respiration), FCCP (to elucidate maximal respiration), and rotenone plus antimycin A (Rot+A) (to mea-sure nonmitochondrial respiration). Also basal OCR, basal ECAR, and SRC in 3 independent experiments were pooled (total n = 14). *P < 0.05 vs. M(0) and #P < 0.05 vs. M(IL-4+IL-13). (D) Mitochondrial mass by staining cells with MitoTracker red and flow cytometry. n = 6 (2 independent experiments pooled). (E) Mitochondrial content was measured by the ratio of mitochondrial (mt) DNA to nuclear (N) DNA. n = 5 (technical). (F) ECAR of M(0) or M(IL-4+IL-13) activated as in C, followed by sequential treatment with glucose (to initiate glycolysis), Oligomycin, and 2-deoxy glucose (DG) (to inhibit glycolysis). The rate of glycolysis was calculated based on the difference between basal ECAR and the maximal ECAR, following glucose stimulation. Two independent experiments were pooled (total n = 10). *P < 0.05 vs. M(0) and #P < 0.05 vs. M(IL-4+IL-13). (G) One-hour lactate production from supernatants by fluoro-metric assay. Two independent experiments were pooled (total n = 7). (H) Glucose uptake of macrophages activated as indicated for 24 hours, followed by incubation of the cells with 2NB-DG for 1 hour and analysis by flow cytometry. Three independent experiments were pooled (total n = 9). *P < 0.05 vs. M(0) none. Statistics in C, F, and H) were analyzed by 1-way ANOVA.

The Journal of Clinical Investigation R e s e a R c h a R t i c l e
4 2 3 2 jci.org Volume 125 Number 11 November 2015
are induced in the peritoneal space (41). Subsequently, analysis of the expression of M2 signature genes in peritoneal exudate cells (PECs) is used as an indicator of the extent of M2 activation (37, 42). To examine the effect of salt on this process, C57BL/6 mice were fed a normal-salt diet (NSD) or an HSD for 14 days, before i.p.
HSD reduces chitin-elicited macrophage activation in vivo. We next tested whether salt also affected M2 activation in vivo. We employed a well-established model to examine the IL-4–depen-dent activation of macrophages in the peritoneal cavity. Following i.p. injection of chitin ([C8H13O5N)]n), ARG1+ M2-like macrophages
Figure 9. High NaCl blunts the induction of AKT and mTOR signaling. (A) The effect of NaCl on AKT phosphorylation was determined by Western blot-ting. Macrophages were serum-starved overnight and then pretreated with 40 mM NaCl for 5 minutes, prior to stimulation with IL-4+IL-13 for 15, 30, or 60 minutes. The levels of total AKT were determined in a separate blot, with β-actin as a loading control. Also shown is phospho-p70S6K. Quantification of phospho-AKT/total AKT levels, normalized to t = 0, was obtained by pooling the mean levels from 3 independent experiments (total n = 4). *P < 0.05 vs. M(IL-4+IL-13) none by 2-way ANOVA. (B) Macrophages were stimulated with IL-4 and IL-13 in the absence (none) or with an additional 40 mM NaCl, or with an AKT inhibitor (LY294002, 50 μM) for 24 hours, and signature gene expression was analyzed by qPCR. n = 5 (technical). *P < 0.05 vs. M(0) none and M(0) + 40 mM NaCl; #P < 0.001 vs. M(IL-4+IL-13) none; †P < 0.001 vs. M(IL-4+IL-13) + 40 mM NaCl; and ‡P < 0.05 vs. M(IL-4+IL-13) + LY294002 none by 1-way ANOVA. (C) Schematic for the generation of BMDM with constitutively active Akt (NH[2]-terminally myristoylation signal-attached AKT; MyrAkt). Western blot (right) shows a robust induction of phosphorylated AKT after treatment of BMDM MyrAkt macrophages with TAT-Cre for 2 days. BMDM from WT macrophages treated with TAT-Cre similarly are shown. (D) BMDM from WT and MyrAkt mice were treated with TAT-Cre as in C and then stimulated with IL-4 and IL-13 in the absence (none) or with an additional 40 mM NaCl for 24 hours, and signature gene expression was analyzed by qPCR. Two independent stimulations were performed, which were then pooled (total n = 10–12 technical). *P < 0.05; **P < 0.01; and ***P < 0.001 by 2-way ANOVA.

The Journal of Clinical Investigation R e s e a R c h a R t i c l e
4 2 3 3jci.org Volume 125 Number 11 November 2015
(Figure 6A and Supplemental Figure 8). Mice on an HSD had no change in the rate of wound healing in the initial phase (0–3 days) but had a significant delay in wound healing during the later stages (3–7 days) (Figure 6, B and C). After 1 week, mice on an NSD exhibited a 69% reduction in wound area, while mice fed an HSD showed a delayed wound closure (56%). Additionally, mice on an HSD had only 6/13 wounds completely healed after 14 days, while only 1/13 wounds from mice on an NSD remained incompletely healed after 14 days (Figure 6D). These findings are reminiscent of a recent study that demonstrated that macrophage-specific KO of the transcription factor KLF4 perturbs M2 activation and in vivo wound healing at a similar rate and amount as what we observed (~70% reduction in WT vs. ~55% reduction in Klf4 KO after 8 days) (47). We also examined the expression of M(IL-4+IL-13) signature genes in wound samples (Figure 6E). By 2-way ANOVA, a signifi-cant effect of HSD was observed, particularly in Fizz1 expression. We have previously shown that HSD augments Th17 responses in vivo (22), and we also examined the skin expression of IL-17A in the same wound samples, comparing them to a prototype Th17 disease: psoriasis. In contrast to skin samples of animals affected with psoriasis, we did not observe any amplification of IL-17A (data not shown), indicating that Th17 responses do not play a major role in the wound-healing model employed here.
Collectively, the data here demonstrates that HSD delays wound healing to a similar extent to that observed in other mac-rophage-specific KO models (47) and furthermore reduces the expression of M(IL-4+IL-13) signature genes in wound samples. However, it is highly plausible that HSD affects many other cell types important for wound healing (e.g., neutrophils and fibrob-lasts), so we cannot safely conclude that high salt impairs in vivo wound healing exclusively by reducing M2 activation. It would be interesting to study the effect of HSD on M2 activation in other in vivo models, such as helminth infection.
injection of chitin (Figure 5A). PECs were then isolated by lavage and analyzed by flow cytometry. There was no significant effect of HSD on the proportion or number of macrophages (Figure 5, B and C), or other major immune populations such as B cells, T cells, and negative cells (CD11b–F4/80–B220–CD3–) (Supplemental Figure 7). To examine the effect of HSD specifically on macrophage activa-tion, we sorted PECs into the major immune populations described above by FACS (Figure 5D and Supplemental Figure 7), for subse-quent gene expression analysis by quantitative PCR (qPCR) (Figure 5A). In line with the in vitro experiments (Figure 1), HSD resulted in a significant reduction in Arg1 and Fizz1 expression. HSD tended to decrease Ym1 expression — an effect, however, not reaching statis-tical significance (P = 0.07). Other M(IL-4+IL-13) signature genes, Mgl2 and Slamf1, were not reduced in isolated chitin-elicited mac-rophages (Supplemental Figure 7). Similar results were observed in unsorted, chitin-elicited adherent PECs, which were enriched for macrophages and B cells, and exhibited reduced Mrc1, Fizz1, and Mgl2 expression (Supplemental Figure 7). Taken together, the results indicate that HSD attenuates M2 activation in vivo.
HSD leads to delayed wound healing in vivo. Wound healing is a complex process, involving the coordinated action of multiple cell types to resolve inflammation and promote collagen deposi-tion and tissue repair (43, 44). Upon wounding, macrophages are rapidly recruited to the site of injury, where M1-activated mac-rophages drive the initial proinflammatory response, followed by the infiltration of M2-activated macrophages for tissue heal-ing and repair (45). While M2-activated macrophages play a key role in promoting wound healing, they are not solely responsible, since PU.1 KO mice — which lack macrophages, neutrophils, and mast cells — are still able to exhibit wound healing (46). To test the effect of salt, 2 cutaneous back wounds were inflicted to WT C57BL/6 mice, which were then fed NSD and HSD as before, and the closure of the wounds was monitored for a further 14 days
Figure 10. Summary of the effect of high NaCl on the activation of macrophages. In the presence of noninflammatory signals (e.g., IL-4 and IL-13), this study has shown that NaCl reduces macrophage activation. In contrast, with a proinflammatory stimuli (e.g., LPS), salt augments macrophage activation (18). Furthermore, without a stimulus, M(0) macrophages exhibit an altered homeostasis. Together, we hypothesize that NaCl does not have a general and nonspecific effect on macrophages homeostasis, but rather, its effect is orchestrated via modulating specific signaling pathways and cellular processes essential for macrophage activation.
The Journal of Clinical Investigation R e s e a R c h a R t i c l e
4 2 3 4 jci.org Volume 125 Number 11 November 2015
This was not the case for M(LPS)-activated macrophages, which did not show any H3K4me3 marks around the Mgl2 TSS and, inter-estingly, exhibited an increased amount of H3K4me3 around the Slamf1 TSS, which was further augmented on LPS stimulation in high salt (Figure 7D). Additionally, Slc6a12, a tonicity-responsive channel that showed the highest upregulation in gene expression upon treatment with high salt alone or in combination with ILs or LPS, also displayed an induction in both H3K4me3 (Figure 7D) and H4ac marks (data not shown). Collectively, these results indi-cate that M(IL-4+IL-13) activation in the presence of NaCl results in a mild change in posttranslational histone modifications at the TSS of several genes important for M(IL-4+IL-13) induction.
Salt modulates M(IL-4+IL-13) cellular metabolism. We next performed detailed analyses of changes in the transcriptional pro-gram of M(IL-4+IL-13) macrophages activated in isotonic media, or with an additional 40 mM NaCl, with the aim to identify distur-bances in pathways or individual genes that may account for our observed blunted activation with salt. Of the 803 genes that were upregulated upon induction from M(0) to M(IL-4+IL-13), 259 of these differed (increased or reduced) by more than 1.2-fold when similarly activated in high salt (Figure 8A). Of note, M(IL-4+IL-13) signature genes identified in Figure 1B to be affected by high salt had a similarly blunted induction in the microarray. Additionally, Slc6a12 had a similarly increased gene expression to that shown previously. To identify pathways and/or cellular programs affected by salt, we performed gene ontology (GO) analysis on the 259 salt-sensitive M(IL-4+IL-13) genes. The top 20 GO terms are shown. Notably, many terms that were related to immune cell activation and proliferation were identified as being affected upon activation in the presence of high salt, supporting the functional results pre-sented in Figures 4–6. Additionally, several terms related to cellu-lar metabolism were identified.
Cellular metabolism or respiration is essential for the general growth, survival, and proliferation of all cell types. It is character-ized by 2 major pathways: glycolysis and oxidative phosphoryla-tion (OXPHOS) (Figure 8B). While glycolysis produces far less ATP than OXPHOS, it has several advantages in that it is quick and yields metabolic intermediates required for growth and prolifera-tion (50). It has been demonstrated in a number of recent publica-tions (51–55) that activated immune cells frequently undergo large metabolic “switches” to use predominantly glycolysis or OXPHOS in order to cope with the increased metabolic demands associated with activation. This includes macrophages where, upon activa-tion, M1 macrophages become glycolytic and M2 macrophages instead primarily rely on OXPHOS and fatty acid oxidation to meet their metabolic requirements (36).
To validate the GO term results from above and explore if NaCl modulates cellular metabolism, we conducted extracellular flux analysis of M(0) and macrophages activated for 24 hours to M(IL-4+IL-13) alone or in high salt. In line with previous studies (35, 36), activation to M(IL-4+IL-13) resulted in an increase in the basal mitochondrial oxygen consumption rate (OCR) and extra-cellular acidification rate (ECAR) (Figure 8C). We next calculated the spare respiratory capacity (SRC), which provides informa-tion regarding the maximal mitochondrial respiration of the cell. Activation to M(IL-4+IL-13) in high salt resulted in a significant decrease in SRC, indicating that NaCl blunts the OXPHOS capac-
SGK1 and NFAT5 do not mediate NaCl effect in IL-4+IL-13–acti-vated macrophages. Our previous work showed that the augmen-tation of proinflammatory Th17 and M1 macrophage activation by salt was mediated via SGK1 and NFAT5 (18, 22). SGK1 is also important for the activation of Th2 cells in the absence of NaCl (48). However, upon activation to M(IL-4+IL-13) no induction of Nfat5 or Sgk1 was observed, which was only mildly upregulated with the addition of 40 mM NaCl (Supplemental Figure 9). This is in stark contrast to solute carrier family 6 member 12 (Slc6a12), which encodes a betaine transporter essential for the compensa-tory response of cells to high tonicity (49), which exhibited a high level of upregulation upon the addition of 40 mM NaCl. Further-more, Nfat5 and Sgk1 KO BMDM stimulated with IL-4+IL-13 were unaffected and showed robust induction of M(IL-4+IL-13) signa-ture genes, and importantly, failed to rescue the effect of NaCl on M(IL-4+IL-13) signature gene expression (Supplemental Figure 9). Collectively, this indicates that NaCl mediates its effect on M(IL-4+IL-13)-activated macrophages via a different mechanism to that described for proinflammatory immune cells such as Th17 cells and M1-activated macrophages (18, 22, 24).
Salt modifies epigenetic marks important for M(IL-4+IL-13) acti-vation. Our data indicates that salt attenuates the activation and function of M(IL-4+IL-13) macrophages. However, this effect was not mediated by blunted STAT6 signaling or reduced cell viability, by inducing transactivation into a proinflammatory phenotype, nor via a known proinflammatory/tonicity-responsive pathway involving the molecules NFAT5 and SGK1. It has been demon-strated that the reduced epigenetic modifications of a nodal M(IL-4+IL-13) transcription factor, Irf4, resulted in a decreased induction of signature genes (42). Since we also identified that the induction of Irf4 was affected by salt (data not shown), we hypoth-esized that salt may modulate epigenetic signatures essential for M(IL-4+IL-13) activation. We performed further analysis of our genome-wide epigenetic data (Figure 3C), where we performed ChIP with antibodies against 2 transcriptionally activating chro-matin marks: histone 3 lysine 4 trimethylation (H3K4me3) and histone 4 acetylation (H4ac), followed by sequencing (ChIP-seq). We identified 2,568 genes that were differential (false discovery rate [FDR] < 0.05) in transcription, H3K4me3 or H4ac, or vari-ous combinations, upon stimulation with IL-4+IL-13 in normal, isotonic media (Supplemental Tables 1 and 2). As both H3K4me3 and H4ac have been identified to be important for the activation of gene expression, we further analyzed only those genes that simultaneously had an increased gene expression upon IL-4 and IL-13 stimulation (803 genes; Figure 7, A and B, and Supplemental Table 2). We identified 3 types of gene clusters upon activation to M(IL-4+IL-13); all clusters contained genes with induced expres-sion and then had either a concordant increase, decrease, or no change in either of the chromatin modifications (Figure 7C). We then evaluated the effect of high salt on these 2 chromatin modi-fications. Overall, several M(IL-4+IL-13) genes had a reduction in H3K4me3 marks (Figure 7C, left), while more genes had increased H4ac reads on activation with high salt (Figure 7C, right, Supple-mental Figure 10, and Supplemental Table 2). Two M(IL-4+IL-13) signature genes (Mgl2 and Slamf1) had clearly reduced H3K4me3 marks at their transcription start sites (TSS) in M(IL-4+IL-13) mac-rophages activated with an additional 40 mM NaCl (Figure 7D).

The Journal of Clinical Investigation R e s e a R c h a R t i c l e
4 2 3 5jci.org Volume 125 Number 11 November 2015
sion of M2 signature genes was measured. As before, WT BMDM exhibited a significantly reduced induction of the genes Mrc1, Ym1, and Mgl2 when stimulated with IL-4+IL-13 in the presence of an additional 40 mM NaCl. However, this blunted expression by NaCl was rescued in MyrAkt BMDM (Figure 9D). Taken together, these results suggest that blunted Akt may contribute to the reduc-tion of M2 macrophage activation with high salt.
DiscussionWe have shown here that a modest, and physiologic, increase in salt significantly reduces the activation of M(IL-4+IL-13) macro-phages. Importantly, this also translated to an effect on M2 func-tion in vivo. Different from our previous studies with Th17 cells (22) and proinflammatory M(LPS) (18), the effect by salt on M(IL-4+IL-13) macrophages was independent of the salt-responsive molecules SGK1 and NFAT5. In contrast, we found the action of salt to be mediated via perturbations in AKT/mTOR signaling and cellular metabolism.
Sodium ions seem to play an essential role in the effect described here, as the induction of hypertonicity by nonionic osmolytes, such as mannitol and urea, did not reduce M(IL-4+IL-13) activation. In our previous studies with Th17 cells (22) and M(LPS) macrophages (18), we revealed that sodium medi-ated its effect by boosting a proinflammatory SGK1-NFAT5 sig-naling cascade. These molecules are activated by p38/MAPK, a homologue to HOG1, the ancient yeast hypertonic stress response element that is considered part of a proinflammatory signaling cascade important for the development of inflammation (56). In the current study, we found no evidence for Sgk1 or Nfat5 in mediating the effect of salt on M(IL-4+IL-13) activation; however, this is in fact not surprising. M(IL-4+IL-13) macrophages are not considered to be proinflammatory, so IL-4+IL-13 stimulation does not activate this signaling cascade (26). Furthermore, we do not observe that stimulation with IL-4+IL-13 in high NaCl leads to the acquisition of a proinflammatory phenotype. Taking these previ-ously published studies (18, 22) together with our present results, we propose that high NaCl does not trigger a general and non-specific effect on macrophage activation. Rather, we hypothesize that, in combination with specific stimuli, NaCl either augments (e.g., with LPS) or reduces (e.g., with IL-4+IL-13) the signaling pathways and cellular processes essential for macrophage acti-vation (Figure 10). Furthermore, we also observe in the current study that unstimulated M(0) macrophages treated with high salt have increased cellular metabolism (glycolysis and OXPHOS) and a slightly decreased viability, indicating that, in the absence of a stimulus, NaCl affects macrophage function again differently (Fig-ure 10). Additionally, in a recent study, Ip et al. have described that LPS preactivated macrophages have enhanced inflammasome activation and IL-1β secretion with high-salt stimulation (57), indi-cating that the timing by which the macrophage experiences the stimuli, and salt again differentially modulates activation. In vivo, we thus postulate that the effect of NaCl on macrophage activa-tion and function is governed by the environmental milieu bathing macrophages. Thus, elucidation of the effect of NaCl on macro-phage activation in combination with other stimuli and environ-mental milieu will be crucial for understanding the consequence of high salt on macrophage function in vivo.
ity of these activated macrophages (Figure 8C). This was not asso-ciated with a decreased mitochondrial mass (Figure 8D) or content (Figure 8E). Interestingly, the opposite was true for unstimulated — M(0) — macrophages incubated with an additional 40 mM NaCl, which instead had an increased SRC (Figure 8C).
We next explored whether glycolysis in M(IL-4+IL-13)-acti-vated macrophages was similarly affected by the addition of 40 mM NaCl. Again, extracellular flux analyses were performed of M(0) and M(IL-4+IL-13) macrophages activated for 24 hours, fol-lowed by exchange into glucose-free media, and then the maxi-mal response of the cells upon stimulation with glucose was used as a measure of the rate of glycolysis (Figure 8F). Activation of M(IL-4+IL-13) in isotonic media was associated with an increase in glycolysis, which was, again, reduced in M(IL-4+IL-13) macro-phages activated in an additional 40 mM NaCl. The opposite was true for unstimulated — M(0) — macrophages incubated with an additional 40 mM NaCl, which instead had an increased rate of glycolysis. Finally, we analyzed the amount of lactate production and glucose uptake in 1 hour. No difference in lactate production was observed (Figure 8G); however, NaCl-treated M(0) and M(IL-4+IL-13) macrophages took up significantly less fluorescently labeled glucose (NBDG; Figure 8H). Collectively, these analyses indicate that high NaCl blunts the increase in OXPHOS and gly-colysis necessary for M(IL-4+IL-13) activation.
High NaCl blunts the induction of AKT and mTOR signaling. As both the gene expression and extracellular flux experiments revealed that salt alters cellular metabolism, we next hypothe-sized that AKT/mTOR signaling might be affected, as these sig-naling pathways are known to be important for nutrient sensing and orchestrating the “switches” in metabolism necessary for immune cell activation. Furthermore, AKT signaling was recently identified to synergize with STAT6 signaling to ensure full com-mitment to an M(IL-4) activation state (37). To investigate this, we pretreated macrophages in isotonic media or high salt for 5 minutes, before stimulation with IL-4 and IL-13. Upon stimula-tion with IL-4+IL-13, an increase was evident in the phosphory-lation of AKTS473 and p70S6KT389, a downstream target of mTOR signaling that is itself downstream of pAKT signaling (Figure 9A). The increased phosphorylation of both proteins with IL-4+IL-13 was blunted upon stimulation in the presence of high salt. We next investigated the effect of AKT inhibition (with the inhibitor LY294002) on the expression of our panel of M(IL-4+IL-13) sig-nature genes. AKT inhibition attenuated the activation of M(IL-4+IL-13) signature genes (Figure 9B) — a result similar to that observed previously with M(IL-4) expression (37).
We next generated BMDM from transgenic mice that express constitutively active Akt (MyrAkt). In this model, MyrAkt expres-sion is inducible, so BM cells were first differentiated into BMDM — in the absence of Cre recombinanse — to ensure that the devel-opment of macrophages from MyrAkt mice was identical to WT controls (MyrAktinactive). Following the 7-day differentiation pro-cedure, recombinant Cre recombinase (TAT-Cre) was added to induce excision of the stop cassette and thus MyrAkt expres-sion (MyrAktactive). A high level of basal Akt phosphorylation was observed in MyrAktactive BMDM (Figure 9C). MyrAktactive and WT BMDM were then left unstimulated, or stimulated with IL-4+IL-13 alone or with an additional 40 mM NaCl for 24 hours, and expres-

The Journal of Clinical Investigation R e s e a R c h a R t i c l e
4 2 3 6 jci.org Volume 125 Number 11 November 2015
and pathological conditions — and subsequent determination of the effect of these molecules on immune cell activation will be essential information for further understanding of a number of diseases, including cardiovascular, infectious, and autoim-mune diseases.
The effect of salt on immune cells may not necessarily be only pathogenic. Under physiological conditions, we postulate that the storage of sodium within the interstitial space primes effector immune cells, so when they encounter secondary signals from cytokines and antigens, they can mount a rapid and strong response (18, 22). The regulation of the concentration of this inter-stitial sodium is thus of high importance for physiology; this has been shown by us to be regulated by residing unactivated mac-rophages via a VEGF-C and lymphatic hyperplasia axis (16, 17). However, under conditions of dietary excess (e.g., with the West-ern diet) and with predisposing genetic influences, the concentra-tion of sodium that immune cells are exposed to may rise. Taken together with our previous study where salt augmented Th17 and M(LPS) activation (18, 22), we postulate that excessive and chronic sodium chloride intake causes immune cells to experience higher sodium concentrations and thus creates an overall proin-flammatory environment; the activation of proinflammatory cells such as Th17 and M(LPS) macrophages are boosted, while cells such as M(IL-4+IL-13) macrophages are disfavored. Collectively, we hypothesize that the overall balance between effector and reg-ulatory arms of the immune system is disturbed by salt. Future studies to elucidate mechanisms that may influence changes in sodium storage will thus be essential for understanding the increased incidence of inflammatory and autoimmune diseases in Western societies.
MethodsPlease see the Supplemental Methods for full experimental procedures, including Supplemental Figure 11 and Supplemental Tables 3 and 4.
Mice. Primary cultures of macrophages were generated from the BM of male 10–12 week old WT (C57BL/6JOlaHsd; Harlan), Sgk1 KO (Sv129J) (63), Nfat5 inducible-KO mice (C57BL/6; ERT2-CreER, Nfat5fl/fl) (64), or MyrAkt inducible-expression mice (Klaus Rajewsky MDC, Berlin, Germany). Female mice were not included in this study. Mice were fed normal chow diets (V1124-300, Ssniff) unless indicated. Mice were housed under standard light-dark–cycled conditions with SPF conditions. Mice were observed daily in order to minimize harm.
In vitro activation of BMDMs. Mouse BM cells were differentiated into macrophages by cultivation in normal isotonic DMEM media supplemented with L929-generated CSF-1 for 7 days. For activation experiments, macrophages were exchanged into normal isotonic RPMI media ([Na+] = 139 mM), which did not contain CSF-1, and were then left unstimulated or stimulated with recombinant mouse IL-4 (10 ng/μl) and IL-13 (10 ng/μl) for 24 hours. For the analysis of the effect of salt, an additional 40 mM of NaCl was added to the media, result-ing in a final concentration of Na+ of 179 mM. Tonicity experiments were performed in the same manner, where an additional 80 mM urea or 80 mM mannitol — which have an equivalent osmolality and tonic-ity to 40 mM NaCl, respectively — were added.
Assessment of HSD on M2 macrophage activation. For all in vivo experiments, male age-matched C57BL/6JOlaHsd mice (Harlan) were randomly assigned to receive an HSD (4% NaCl in chow plus 1% in the
We propose here that blunted AKT/mTOR signaling and cellular metabolism is a mechanism by which high salt reduces M(IL-4+IL-13) activation. AKT was recently shown to be impor-tant in synergizing with STAT6 signaling to acquire complete M(IL-4) activation (37). In their study, the attenuation of AKT signaling, either by genetic modulation or chemical inhibition, resulted in an impaired M(IL-4) activation, independent of an effect on STAT6 phosphorylation (37). Byles et al. additionally identified a regulatory loop between AKT/mTOR upon stimula-tion of macrophages with IL-4 (37). In support of this, we addi-tionally observed impaired activation of a downstream target of AKT, mTOR (p70S6K). Furthermore, with constitutive active AKT signaling, we were able to rescue the effect of NaCl on reducing M(IL-4+IL-13) gene expression.
Since AKT/mTOR is known to regulate cellular responses to changes in nutrient and energy availability, we hypothe-sized that an outcome of this decreased signaling would be a reduction in M(IL-4+IL-13) cellular metabolism. We have demonstrated that M(IL-4+IL-13) macrophages, like M(IL-4), depend mainly on OXPHOS (36). While high-salt treatment did not affect basal OCR, it reduced the mitochondrial respi-ratory reserve of M(IL-4+IL-13) macrophages and further-more reduced the rate of glycolysis and glucose uptake. Taken together, these effects point toward reduced energy availabil-ity for full activation of M(IL-4+IL-13) macrophages stimu-lated in high NaCl. Similar to this, it was recently shown that chemically blocking fatty acid oxidation with etoxomir caused a decreased mitochondrial oxygen consumption and subse-quently led to a reduction in M(IL-4) signature gene expression and function (36), supporting our notion that reduced metabo-lism can blunt M2 activation. In light of many recent publica-tions demonstrating that the proper activation and function of many different immune cells is acutely sensitive to changes in cellular metabolism (35, 36, 51, 53, 55, 58), our results suggest a mechanism by which a subtle change in extracellular salt could affect a number of different immune cells by causing altera-tions in cellular metabolism. This mechanism has recently been described for several other components of the cellular micro-environment, where it was shown that subtle, local changes in molecules such as galactose (58), lactate (59), and succi-nate (60) had profound effects on the activation of immune cells that experience this altered environment. Interestingly, Tregs have an analogous metabolism to M(IL-4+IL-13) where they predominantly employ mitochondrial OXPHOS. In con-trast, proinflammatory M(IFN-γ+LPS) macrophages and Th17 cells primarily utilize glycolysis to meet their bioenergenetic demands (36, 61). Therefore, it is tempting to speculate that a shift toward high glycolysis is a hallmark of inflammatory cells, whereas OXPHOS is a hallmark of noninflammatory cells (62). Determining how salt modulates the cellular metabolism of proinflammatory immune cells is the focus of our future work. While we have focused here (and in our previous studies) on extracellular salt and its effect on immune cell activation, we acknowledge that other molecules may be similarly modulatory in vivo. Therefore, we propose that detailed identification of the composition (e.g., electrolytes and metabolites) of microen-vironments where immune cells reside — under physiological

The Journal of Clinical Investigation R e s e a R c h a R t i c l e
4 2 3 7jci.org Volume 125 Number 11 November 2015
Study approval. Animal experiments were approved by LAGeSo (Ber-lin, Germany) and Regierung von Mittelfranken (Ansbach, Germany).
Accession numbers. The microarray and ChIP-seq datasets are available in the EMBL-EBI database (http://www.ebi.ac.uk/) under the accession numbers E-MTAB-3163 and E-MTAB-3140, respectively.
AcknowledgmentsWe would like to thank Jana Czychi, Lajos Marko, Gabriel N’Diaye, Britta Schlund, Eva Bauer, Jennifer Hähnel, and Michaela Arend for their advice and technical assistance; Tomoharu Yasuda, San-drine Sander, and Klaus Rajewsky (MDC, Berlin, Germany) for their suggestions; and Thomas Rathjen (MDC, Berlin, Germany) for assistance with the seahorse experiments. D.N. Müller, J. Jantsch, D. Voehringer, and J. Titze were supported by the DFG. The Ger-man Centre for Cardiovascular Research (DZHK) supported D.N. Müller (BER 1.1 VD). M. Gebhardt was supported by the TransCard Program (MDC Berlin). The German Ministry for Economics and Technology (50WB1218), the Interdisciplinary Center for Clinical Research Erlangen, and the NIH (RO1 HL118579-01) also supported J. Titze. K.J. Binger is a recipient of an Australian National Health and Medical Research Council C.J. Martin Fellowship (APP1037633).
Address correspondence to: Dominik N. Müller, Experimental and Clinical Research Center, an institutional cooperation between the Charité Medical Faculty and the Max-Delbruck Center for Molecular Medicine, Berlin, 13125, Germany. Phone: 49.30.450.540.286; E-mail: [email protected]. Or to: Katrina J. Binger, Baker IDI Heart and Diabetes Institute, 75 Commercial Rd, Melbourne, 3004, Australia. Phone: 61.0.3.8532.1111; E-mail: [email protected].
drinking water) or an NSD (0.4 % in chow plus tap water) for 14 days. Diets were obtained from Ssniff. The injection of chitin was performed essentially as described previously (37). For the assessment of HSD on wound healing, two 8-mm excisional wounds, one on each side of the midline of the back, were applied. The length and width of the wounds were then measured for a further 14 days. The percent total wound area was calculated, compared with day 0 of the respective animal.
Statistics. All data is presented as mean ± SEM. For in vivo exper-iments, no animals were excluded from analysis, while for in vitro experiments, outliers were first excluded using a Grubbs’ statistical test. Normality of data was assessed according to the Kolmogorov-Smirnov test and was then analyzed by either 2-sided Student’s t tests (paramet-ric) or a Mann-Whitney U test (for nonparametric data). For analysis of more than 2 groups, 1-way ANOVA (parametric) or Kruskal-Wallis (non-parametric) tests were performed and, for all significant outcomes, a Tukey’s or Dunn’s (respectively) post hoc comparison was performed, after confirming the homogeneity of variances by Levene’s test. Analy-sis of pAKT levels by Western blotting was done by 2-way repeated mea-sures ANOVA. All tests were 2-sided. Exact P values are presented when significance was obtained. The number of animals for statistical power was chosen based on analysis of previous studies investigating the influ-ence of NaCl on immune cell function (ref. 22; n = 12), activation of M2 in vivo by chitin administration (ref. 37; n = 5), or assessment of wound healing (ref. 47; n = 9). In vivo experiments were repeated indepen-dently twice and then pooled. For in vitro experiments, an appropriate number of technical replicates was used to obtain statistical power; this depended on the number of groups analyzed and was determined based on previous experience. All in vitro experiments were repeated at least 3 times independently (biological replicates).
1. Mozaffarian D, et al. Global sodium consumption and death from cardiovascular causes. N Engl J Med. 2014;371(7):624–634.
2. He FJ, Li J, Macgregor GA. Effect of longer-term modest salt reduction on blood pressure. Cochrane Database Syst Rev. 2013;4:CD004937.
3. Sundstrom B, Johansson I, Rantapaa-Dahlqvist S. Interaction between dietary sodium and smoking increases the risk for rheumatoid arthritis: results from a nested case-control study. Rheumatology (Oxford). 2014;54(3):487–493.
4. Farez MF, Fiol MP, Gaitán MI, Quintana FJ, Correale J. Sodium intake is associated with increased disease activity in multiple sclerosis. J Neurol Neurosurg Psychiatry. 2015;86(1):26–31.
5. D’Elia L, Galletti F, Strazzullo P. Dietary salt intake and risk of gastric cancer. Cancer Treat Res. 2014;159:83–95.
6. Mente A, et al. Association of urinary sodium and potassium excretion with blood pressure. N Engl J Med. 2014;371(7):601–611.
7. O’Donnell M, et al. Urinary sodium and potas-sium excretion, mortality, and cardiovascular events. N Engl J Med. 2014;371(7):612–623.
8. Wain LV, et al. Genome-wide association study identifies six new loci influencing pulse pres-sure and mean arterial pressure. Nat Genet. 2011;43(10):1005–1011.
9. Ehret GB, et al. Genetic variants in novel path-ways influence blood pressure and cardiovascu-lar disease risk. Nature. 2011;478(7367):103–109.
10. Deloukas P, et al. Large-scale association analysis identifies new risk loci for coronary artery dis-ease. Nat Genet. 2013;45(1):25–33.
11. Beecham AH, et al. Analysis of immune-related loci identifies 48 new susceptibility variants for multiple sclerosis. Nat Genet. 2013;45(11):1353–1360.
12. Titze J. Sodium balance is not just a renal affair. Curr Opin Nephrol Hypertens. 2014;23(2):101–105.
13. Dahlmann A, et al. Magnetic resonance-determined sodium removal from tissue stores in hemodialysis patients. Kidney Int. 2015;87(2):434–441.
14. Kopp C, et al. 23Na magnetic resonance imag-ing-determined tissue sodium in healthy sub-jects and hypertensive patients. Hypertension. 2013;61(3):635–640.
15. Kopp C, et al. (23)Na magnetic resonance imaging of tissue sodium. Hypertension. 2012;59(1):167–172.
16. Machnik A, et al. Macrophages regulate salt-de-pendent volume and blood pressure by a vascular endothelial growth factor-C-dependent buffering mechanism. Nat Med. 2009;15(5):545–552.
17. Wiig H, et al. Immune cells control skin lym-phatic electrolyte homeostasis and blood pres-sure. J Clin Invest. 2013;123(7):2803–2815.
18. Jantsch J, et al. Cutaneous Na+ storage strength-ens the antimicrobial barrier function of the skin and boosts macrophage-driven host defense. Cell Metab. 2015;21(3):493–501.
19. Szabo G, Magyar Z. Electrolyte concentrations in
subcutaneous tissue fluid and lymph. Lymphol-ogy. 1982;15(4):174–177.
20. Titze J, et al. Glycosaminoglycan polymerization may enable osmotically inactive Na+ storage in the skin. Am J Physiol Heart Circ Physiol. 2004;287(1):H203–H208.
21. Go WY, Liu X, Roti MA, Liu F, Ho SN. NFAT5/TonEBP mutant mice define osmotic stress as a critical feature of the lymphoid micro-environment. Proc Natl Acad Sci U S A. 2004;101(29):10673–10678.
22. Kleinewietfeld M, et al. Sodium chloride drives autoimmune disease by the induction of patho-genic TH17 cells. Nature. 2013;496(7446):518–522.
23. Muller S, et al. Salt-dependent chemotaxis of macrophages. PLoS One. 2013;8(9):e73439.
24. Wu C, et al. Induction of pathogenic TH17 cells by inducible salt-sensing kinase SGK1. Nature. 2013;496(7446):513–517.
25. Xue J, et al. Transcriptome-based network anal-ysis reveals a spectrum model of human macro-phage activation. Immunity. 2014;40(2):274–288.
26. Murray PJ, et al. Macrophage activation and polarization: nomenclature and experimental guidelines. Immunity. 2014;41(1):14–20.
27. Mosser DM, Edwards JP. Exploring the full spec-trum of macrophage activation. Nat Rev Immu-nol. 2008;8(12):958–969.
28. Parsa R, et al. Adoptive transfer of immunomod-ulatory M2 macrophages prevents type 1 diabetes in NOD mice. Diabetes. 2012;61(11):2881–2892.

The Journal of Clinical Investigation R e s e a R c h a R t i c l e
4 2 3 8 jci.org Volume 125 Number 11 November 2015
29. Jiang HR, et al. IL-33 attenuates EAE by suppress-ing IL-17 and IFN-γ production and inducing alternatively activated macrophages. Eur J Immu-nol. 2012;42(7):1804–1814.
30. Mikita J, et al. Altered M1/M2 activation patterns of monocytes in severe relapsing experimen-tal rat model of multiple sclerosis. Mult Scler. 2011;17(1):2–15.
31. Szanto A, et al. STAT6 transcription factor is a facilitator of the nuclear receptor PPARγ-regu-lated gene expression in macrophages and den-dritic cells. Immunity. 2010;33(5):699–712.
32. Huber S, Hoffmann R, Muskens F, Voehringer D. Alternatively activated macrophages inhibit T-cell proliferation by Stat6-dependent expres-sion of PD-L2. Blood. 2010;116(17):3311–3320.
33. Bouhlel MA, et al. PPARγ activation primes human monocytes into alternative M2 macro-phages with anti-inflammatory properties. Cell Metab. 2007;6(2):137–143.
34. Odegaard JI, et al. Macrophage-specific PPARγ controls alternative activation and improves insu-lin resistance. Nature. 2007;447(7148):1116–1120.
35. Haschemi A, et al. The sedoheptulose kinase CARKL directs macrophage polarization through control of glucose metabolism. Cell Metab. 2012;15(6):813–826.
36. Huang SC, et al. Cell-intrinsic lysosomal lipolysis is essential for alternative activation of macro-phages. Nat Immunol. 2014;15(9):846–855.
37. Byles V, et al. The TSC-mTOR pathway regu-lates macrophage polarization. Nat Commun. 2013;4:2834.
38. Lumeng CN, Bodzin JL, Saltiel AR. Obesity induces a phenotypic switch in adipose tis-sue macrophage polarization. J Clin Invest. 2007;117(1):175–184.
39. Li L, et al. Role of myeloid-derived suppressor cells in glucocorticoid-mediated amelioration of FSGS. J Am Soc Nephrol. 2015;26(9):2183–2197.
40. Marigo I, et al. Tumor-induced tolerance and immune suppression depend on the C/EBPβ tran-scription factor. Immunity. 2010;32(6):790–802.
41. Reese TA, et al. Chitin induces accumulation in tissue of innate immune cells associated with allergy. Nature. 2007;447(7140):92–96.
42. Satoh T, et al. The Jmjd3-Irf4 axis regulates M2 macrophage polarization and host responses against helminth infection. Nat Immunol. 2010;11(10):936–944.
43. Martin P. Wound healing--aiming for perfect skin regeneration. Science. 1997;276(5309):75–81.
44. Singer AJ, Clark RA. Cutaneous wound healing. N Engl J Med. 1999;341(10):738–746.
45. Deonarine K, et al. Gene expression profiling of cutaneous wound healing. J Transl Med. 2007;5:11.
46. Martin P, et al. Wound healing in the PU. Curr Biol. 2003;13(13):1122–1128.
47. Liao X, et al. Kruppel-like factor 4 regu-lates macrophage polarization. J Clin Invest. 2011;121(7):2736–2749.
48. Heikamp EB, et al. The AGC kinase SGK1 regulates TH1 and TH2 differentiation down-stream of the mTORC2 complex. Nat Immunol. 2014;15(5):457–464.
49. Lang F. Effect of cell hydration on metabolism. Nestle Nutr Inst Workshop Ser. 2011;69:115–126.
50. Pearce EL, Poffenberger MC, Chang CH, Jones RG. Fueling immunity: insights into metabolism and lymphocyte function. Science. 2013;342(6155):1242454.
51. O’Sullivan D, et al. Memory CD8(+) T cells use cell-intrinsic lipolysis to support the metabolic programming necessary for development. Immu-nity. 2014;41(1):75–88.
52. van der Windt GJ, et al. CD8 memory T cells have a bioenergetic advantage that underlies their rapid recall ability. Proc Natl Acad Sci U S A. 2013;110(35):14336–14341.
53. Man K, et al. The transcription factor IRF4 is essential for TCR affinity-mediated metabolic programming and clonal expansion of T cells. Nat Immunol. 2013;14(11):1155–1165.
54. Everts B, et al. TLR-driven early glycolytic reprogramming via the kinases TBK1-IKKvarε supports the anabolic demands of dendritic cell activation. Nat Immunol. 2014;15(4):323–332.
55. Everts B, et al. Commitment to glycolysis sustains survival of NO-producing inflammatory den-dritic cells. Blood. 2012;120(7):1422–1431.
56. Zarubin T, Han J. Activation and signaling of the p38 MAP kinase pathway. Cell Res. 2005;15(1):11–18.
57. Ip WK, Medzhitov R. Macrophages monitor tissue osmolarity and induce inflamma-tory response through NLRP3 and NLRC4 inflammasome activation. Nat Commun. 2015;6:6931.
58. Chang CH, et al. Posttranscriptional control of T cell effector function by aerobic glycolysis. Cell. 2013;153(6):1239–1251.
59. Colegio OR, et al. Functional polarization of tumour-associated macrophages by tumour-de-rived lactic acid. Nature. 2014;513(7519):559–563.
60. Tannahill GM, et al. Succinate is an inflammatory signal that induces IL-1β through HIF-1α. Nature. 2013;496(7444):238–242.
61. Shi LZ, et al. HIF1α-dependent glycolytic path-way orchestrates a metabolic checkpoint for the differentiation of TH17 and Treg cells. J Exp Med. 2011;208(7):1367–1376.
62. Ganeshan K, Chawla A. Metabolic regulation of immune responses. Annu Rev Immunol. 2014;32:609–634.
63. Wulff P, et al. Impaired renal Na(+) retention in the sgk1-knockout mouse. J Clin Invest. 2002;110(9):1263–1268.
64. Kueper C, Beck FX, Neuhofer W. Generation of a conditional knockout allele for the NFAT5 gene in mice. Front Physiol. 2015;5:507.