high resolution geodynamo simulation by yin-yang grid and
TRANSCRIPT

High Resolution Geodynamo Simulation byYin-Yang Grid and its Visualizations
Akira Kageyama1, Takehiro Miyagoshi2, and Nobuaki Ohno3
1 Earth Simulator Center, JAMSTEC, Showa-machi 3173-25, Kanazawa-ku,Yokohama 236-0001, Japan [email protected]
2 Earth Simulator Center, JAMSTEC, Showa-machi 3173-25, Kanazawa-ku,Yokohama 236-0001, Japan [email protected]
3 Earth Simulator Center, JAMSTEC, Showa-machi 3173-25, Kanazawa-ku,Yokohama 236-0001, Japan n [email protected]
The highest resolution simulation of geodynamo is performed. The base gridsystem is the Yin-Yang grid, a spherical overset grid with two congruent com-ponents each of which is a part of the usual spherical polar coordinates. Highparallelization rate of the Yin-Yang geodynamo code has enabled us to per-form the geodynamo simulation with the viscosity one order of magnitudesmaller than the previoius calculations. The resulting flow and the generatedmagnetic field have fairly different structures compared with previous simula-tions. To analyze the three-dimensional structure of the new dynamo regime,we applied our original visualization tools, Armada and VFIVE. Armada isa software rendering program based on the ray-casting algorithm. Since Ar-mada is parallelized with OpenMP and MPI and does not require any graphicshardware or OpenGL, it runs on general supercomputers. VFIVE is a virtualreality visualization software for CAVE-type virtual reality systems. Owingto the interactive, immersive, and three-dimensional visualization by VFIVEin the CAVE room, we have found an unpexpected structure of the electriccurrent field.
1 Introduction
The compass points to the north since the Earth’s surface is surrounded byits intrinsic magnetic field of the dipolar structure. The dipole field is gener-ated by electric current in the Earth’s core. The generation mechanism of thecurrent, or the geodynamo, is one of the most important problems of the geo-science. The Earth is composed of two spherical layers (see Fig. 1); the mantleand the core. The outer part of the core is molten iron and the geomagneticfield is generated there by magnetohydrodynamic (MHD) dynamo process.
61

2 Akira Kageyama, Takehiro Miyagoshi, and Nobuaki Ohno
Fig. 1. Simulation model. The Earth’s magnetic field is generated in the outer partof the iron core of the planet which is in the liquid state. The magnetohydrodynamicequation in a rotating spherical shell is solved by the geodynamo simulation.
The difficulty of the numerical simulation of geodynamo comes from ex-treme conditions of the liquid core as a rotating fluid system. A characteristiclength in a rotating fluid system is thickness of the Ekman layer, which isgiven by δ =
√ν/Ω , where ν is viscosity and Ω is the system’s rotation rate.
For the Earth’s outer core, δ is about 1 cm, that is much smaller than theradius Ro of the core, 3500 km.
A non-dimensional number defined from δ and Ro is the Ekman numberEk ≡ δ2/R2
o, which stands for the ratio between the viscous force and theCoriolis force. The Ekman number of the Earth’s outer core is Ek = O(10−15).The smallness of this value is a symbol of the difficulty of direct numericalsimulation (DNS) of the geodynamo.
We started the DNS approach to the geodynamo simulation in 1995 [1].The value of Ek at that time was O(10−4). Glatzmaier and Roberts [2] per-formed the geodynamo simulation almost at the same time in which dipolefield generation and even its reversal were simulated, but they adopted eddydiffusivities in their simulation. In accordance with the development of thehigh performance computer (HPC), the Ek of the geodynamo DNS has beingsteadily, though slowly, descending.
Recently, we have performed a geodynamo simulation with Ek of O(10−7),which is the smallest value ever achieved [3]. We made use of the Yin-Yanggrid to make it possible to perform such a small Ek simulation. The resultingflow and the magnetic field were qualitatively different from those observedin previous simulations.
To analyze the three-dimensional structure of the flow and the magneticfield in this new dynamo regime, we needed to develop and customize ouroriginal visualization tools, since the total size of the output data for onesimulation run reaches to more than 3 TB. In addition to its size, the spatial
62
Geodynamo Simulation by Yin-Yang Grid 3
complexities of the simulated vector fields, including flow velocity, vorticity,magnetic field, and electric current field, prevent a straightforward visualiza-tion.
We applied our original visualization software, Aramda, to analyze thegeodymo data. Armada is a software rendering tool, meaning that it requiresno graphics hardware (graphics board) to generate images. The speed up of theimage generation in Armada is realized by the parallelization with OpenMPand MPI. Details of Armada and its applications to geodynamo simulation isdescribed in section 4.
The virtual reality (VR) technology is rapidly growing these years. Amongvarious paradigms of VR, a room-sized, projector-based, immersive displaysystem called CAVE produces the highest quality of VR. We have been de-veloping a VR visualization software for the CAVE system for a decade. Thesoftware, named VFIVE, played a key role to grasp the three-dimensionalstructure of the flow and magnetic field in our geodynamo simulation. Wewill describe the VR visualization by VFIVE in section 5.
2 Simulation Model
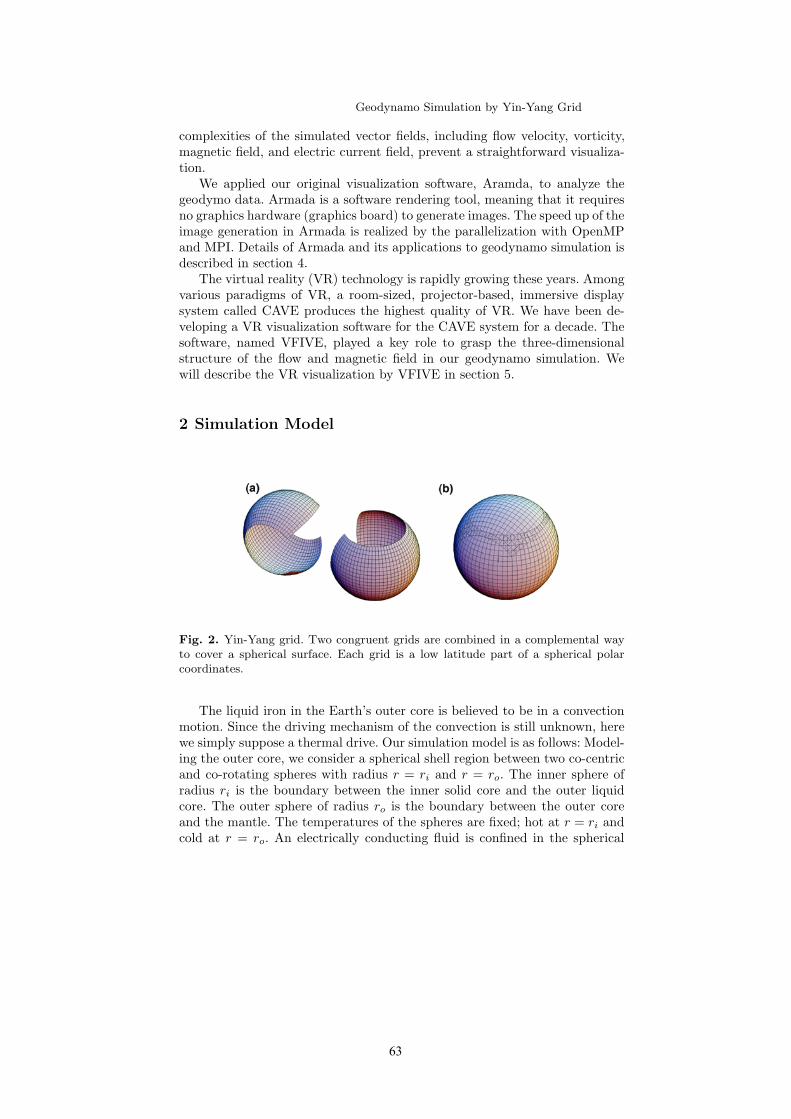
Fig. 2. Yin-Yang grid. Two congruent grids are combined in a complemental wayto cover a spherical surface. Each grid is a low latitude part of a spherical polarcoordinates.
The liquid iron in the Earth’s outer core is believed to be in a convectionmotion. Since the driving mechanism of the convection is still unknown, herewe simply suppose a thermal drive. Our simulation model is as follows: Model-ing the outer core, we consider a spherical shell region between two co-centricand co-rotating spheres with radius r = ri and r = ro. The inner sphere ofradius ri is the boundary between the inner solid core and the outer liquidcore. The outer sphere of radius ro is the boundary between the outer coreand the mantle. The temperatures of the spheres are fixed; hot at r = ri andcold at r = ro. An electrically conducting fluid is confined in the spherical
63
4 Akira Kageyama, Takehiro Miyagoshi, and Nobuaki Ohno
shell region. The inward central gravity causes thermal convection if the tem-perature difference between the spheres is large enough. We numerically solvethe time development of the MHD equations in the spherical shell. We putrandom perturbations of the temperature and the magnetic field at the be-ginning of the simulation. The thermal convection of the MHD fluid amplifiesthe seed magnetic field.
We applied a spherical grid system named Yin-Yang grid [4, 5] to this geo-dynamo simulation. The Yin-Yang grid is a kind of overset grid [6], appliedto the spherical geometry. Two congruent grids, Yin-grid and Yang-grid, arecombined in a complemental way with partial overlap to cover the full spher-ical shell region, see Fig. 2.
The grid size in this simulation is 511 (in r)× 514 (in θ)× 1, 538 (in φ)×2 (Yin and Yang) with r radius (0.3 ≤ r ≤ 1.0), θ colatitude (π/4 ≤ θ ≤3π/4), and φ longitude (−3π/4 ≤ φ ≤ 3π/4). For this simulation, we have used512 nodes or 4096 processors of the Earth Simulator, which is the maximumsize allowed for a calculation. The speed is about 15 TFLOPS, which is about46% of the theoretical peak performance.
3 Simulation Results
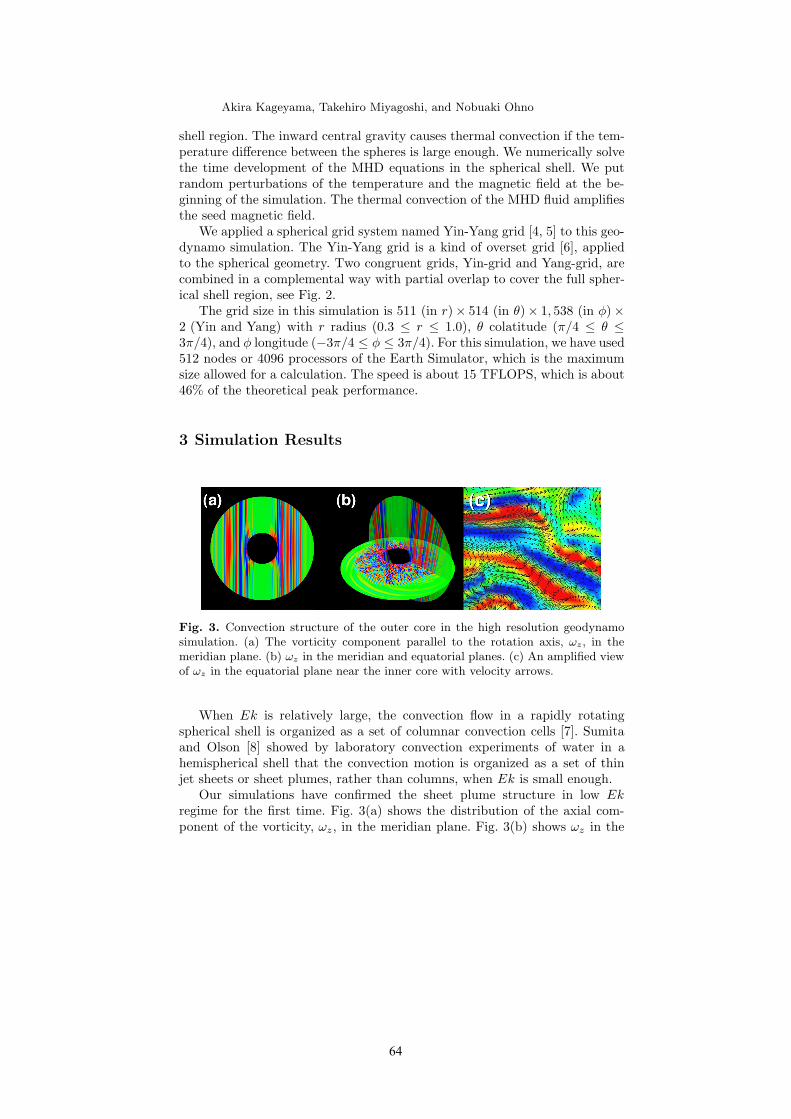
Fig. 3. Convection structure of the outer core in the high resolution geodynamosimulation. (a) The vorticity component parallel to the rotation axis, ωz, in themeridian plane. (b) ωz in the meridian and equatorial planes. (c) An amplified viewof ωz in the equatorial plane near the inner core with velocity arrows.
When Ek is relatively large, the convection flow in a rapidly rotatingspherical shell is organized as a set of columnar convection cells [7]. Sumitaand Olson [8] showed by laboratory convection experiments of water in ahemispherical shell that the convection motion is organized as a set of thinjet sheets or sheet plumes, rather than columns, when Ek is small enough.
Our simulations have confirmed the sheet plume structure in low Ekregime for the first time. Fig. 3(a) shows the distribution of the axial com-ponent of the vorticity, ωz, in the meridian plane. Fig. 3(b) shows ωz in the
64
Geodynamo Simulation by Yin-Yang Grid 5
equatorial and meridian planes. The flow is composed of many plumes elon-gated in s direction, where we use the cylindrical coordinates (s,φ , z). Theplume structure is composed of jet flow in positive s-direction and negatives-direction, side by side as shown in the amplified view of colored ωz withvelocity arrows in Fig. 3(c).
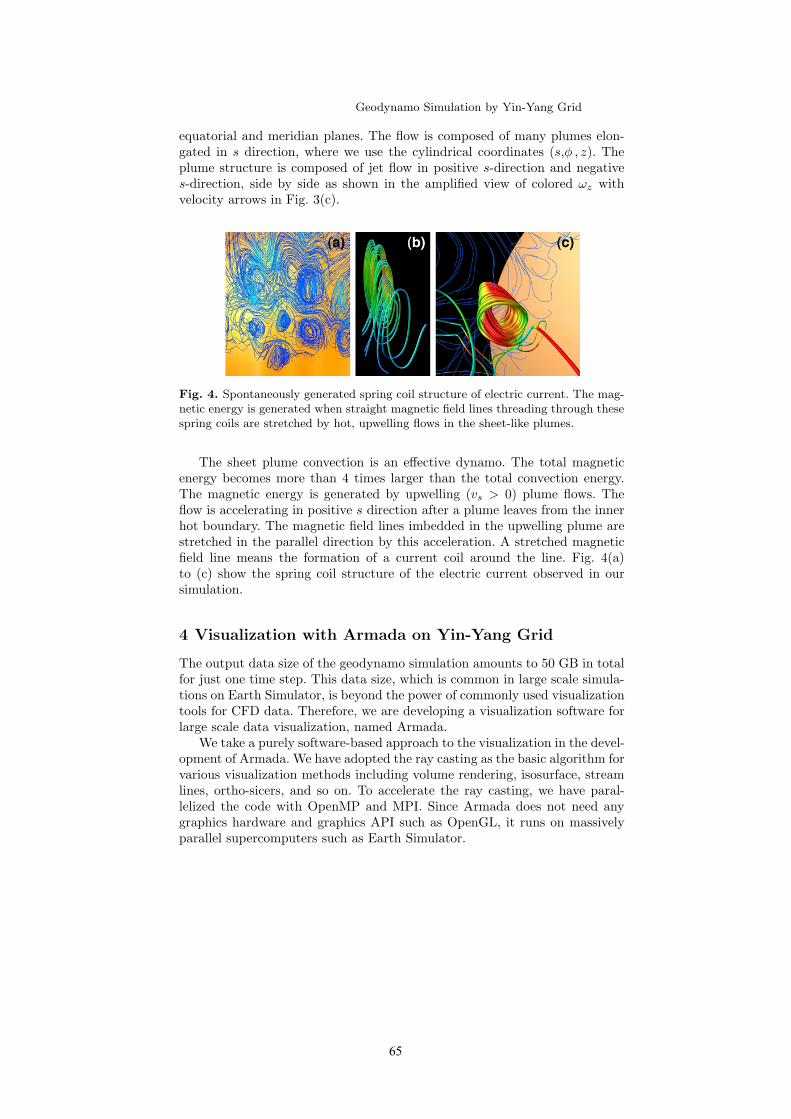
Fig. 4. Spontaneously generated spring coil structure of electric current. The mag-netic energy is generated when straight magnetic field lines threading through thesespring coils are stretched by hot, upwelling flows in the sheet-like plumes.
The sheet plume convection is an effective dynamo. The total magneticenergy becomes more than 4 times larger than the total convection energy.The magnetic energy is generated by upwelling (vs > 0) plume flows. Theflow is accelerating in positive s direction after a plume leaves from the innerhot boundary. The magnetic field lines imbedded in the upwelling plume arestretched in the parallel direction by this acceleration. A stretched magneticfield line means the formation of a current coil around the line. Fig. 4(a)to (c) show the spring coil structure of the electric current observed in oursimulation.
4 Visualization with Armada on Yin-Yang Grid
The output data size of the geodynamo simulation amounts to 50 GB in totalfor just one time step. This data size, which is common in large scale simula-tions on Earth Simulator, is beyond the power of commonly used visualizationtools for CFD data. Therefore, we are developing a visualization software forlarge scale data visualization, named Armada.
We take a purely software-based approach to the visualization in the devel-opment of Armada. We have adopted the ray casting as the basic algorithm forvarious visualization methods including volume rendering, isosurface, streamlines, ortho-sicers, and so on. To accelerate the ray casting, we have paral-lelized the code with OpenMP and MPI. Since Armada does not need anygraphics hardware and graphics API such as OpenGL, it runs on massivelyparallel supercomputers such as Earth Simulator.
65
6 Akira Kageyama, Takehiro Miyagoshi, and Nobuaki Ohno
Fig. 5. Sample visualizations by Aramda, a parallel rendering software tool tovisualize large scale simulation data. Since Armada is a parallelized visualizationtool with OpenMP and MPI and requires no graphics hardware, it runs on generalsupercomputers. Vector arrows in the panel (a) as well as stream tubes in the panel(b) are generated by the software cay-casting.
We are developing three different versions of Armada that adopt (i) Carte-sian coordinates data, (ii) spherical coordinates data, and (iii) Yin-Yang griddata. We applied the Yin-Yang version of Armada for the visualization of thegeodynamo simulation. The images of Fig. 3(a) & (b) and Fig. 5(a) & (b) aregenerated by the Yin-Yang version of Armada. As Fig. 5 shows, Armada gen-erates vector arrows as well as stream tubes. We have found that Armada is apowerful tool for visualization of large scale simulation such as the Yin-Yanggeodynamo simulation.
5 Visualization by CAVE VR system with VFIVE
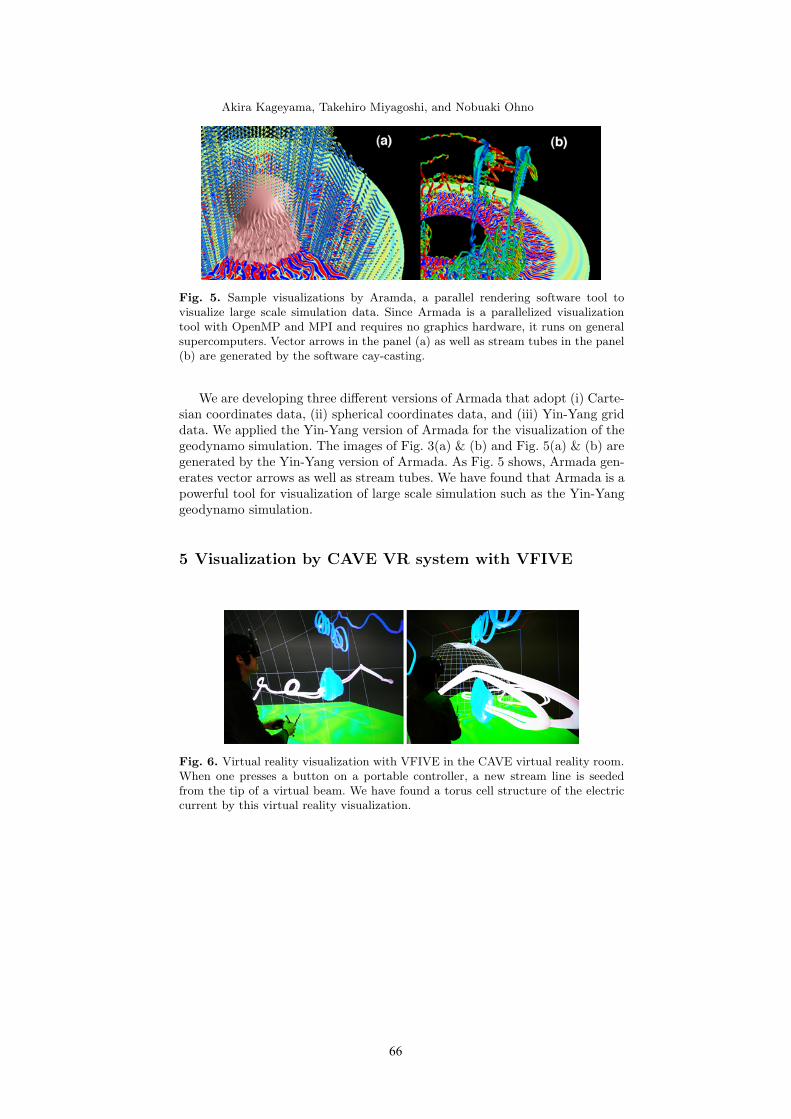
Fig. 6. Virtual reality visualization with VFIVE in the CAVE virtual reality room.When one presses a button on a portable controller, a new stream line is seededfrom the tip of a virtual beam. We have found a torus cell structure of the electriccurrent by this virtual reality visualization.
66

Geodynamo Simulation by Yin-Yang Grid 7
It is generally difficult to grasp three-dimensional structure of a vectorfield such as the convection velocity or magnetic field. We are using a virtualreality (VR) technology to visualize highly complicated structure in three-dimensional VR space. Among various VR systems, CAVE [9] provides themost powerful VR environment.
The CAVE is a room-sized, projector-based, and immersive-type VR sys-tem. The arena of the CAVE is a cubic room surrounded by four screens (threewall screens and a floor screen). The position and angle of the viewer’s headin the CAVE room is tracked in real time. Stereo images on the screens arerefreshed with the proper perspective of the viewer’s eyes.
We have been developing an interactive visualization software calledVFIVE [10, 11, 12] for CAVE systems. Various visualization methods areimplemented in VFIVE, including isosurface, global slice planes, local sliceplanes, volume rendering, etc. for scalar field data, and particle tracer, streamlines & tubes, local 3-D arrows, thousands of tracer particles in a spot light,line-integral-convolution, etc. for vector field data.
Since the spatial resolution of the geodynamo simulation is too fine forthe straightforward visualization in the CAVE, we made use of the region-of-interest (ROI) function that is recently implemented in VFIVE. A user canvisualize the data with finer and finer resolution as he or she specifies smallerand smaller ROI. The ROI can be intuitively specified in the CAVE room bya hand motion.
Among various visualization methods, the stream line and the stream tubeare very useful to visualize the magnetic and current fields, see Fig. 6. Pressinga button of the wand, a portable controller in the CAVE, generates a shortbeam from the wand tip. The beam points the seeding position of the streamline tracing. When the button is released, a particle that denotes the streamline’s tip starts moving following the vector field. The particle flies in theCAVE room in front of the user’s eyes. Repeated clickings of the wand buttongenerate a sequence of new stream lines.
The electric current is basically organized as a set of spring-coils as wedescribed above. By this VFIVE visualization in the CAVE, we have foundthat some of the current coils have an intriguing structure—in those coils astring of the electric current line makes a closed surface of a torus. The findingof this torus cell of the current field would have been difficult, if possible, byother visualization methods.
6 Summary
We have developed a new geodynamo simulation code based on the Yin-Yanggrid whose speed reaches more than 15 TFLOPS on 4096 processors on EarthSimulator. This speed has enabled us to perform highest resolution simulationof the geodynamo.
67
8 Akira Kageyama, Takehiro Miyagoshi, and Nobuaki Ohno
We have found that the convection structure of the outer core is fairlydifferent from other simulations performed so far in which the Ekman numberwas roughly one order of magnitude larger. The convection was organized asa set of sheet-like plume structures, in contrast to the columnar structureobserved so far.
A strong magnetic field is generated by the sheet plume convection. Themagnetic energy is generated when magnetic field lines are stretched out inthe upwelling part of the sheet plumes. The stretched straight magnetic linesare surrounded by helical-shaped electric current lines. The plume sheets andthe helical currents were analyzed in detail by our original visualization tools,Armada and VFIVE.
Armada is a parallelized visualization program that is developed as a gen-eral purpose visualization for large scale simulation data. Since Armada re-quires no graphics hardware or OpenGL, it runs on general HPCs. Amongvarious versions of Armada we have used the Yin-Yang version that acceptsdata defined on the Yin-Yang grid. Since the Yin-Yang grid is applied in vari-ous fields these days, the Yin-Yang version of Armada will be useful for thosesimulations, too.
VFIVE is a virtual reality visualization software for the CAVE-type VRsystem. The interactive, immersive, and three-dimensional visualization pro-vided by VFIVE was the key to grasp the characteristic structure of the mag-netic field and the electric field in our geodynamo simulation. We concludethat the virtual reality technology is a very powerful, almost indispensable,tool when we analyze highly complicated structure of vector fields in three-dimentional space.
References
1. Kageyama A, et al. (1995) Phys Plasmas 2:1421–14312. Glatzmaier G A, Roberts P H (1995) Nature 377:203–2093. Kageyama A, Miyagoshi T, Sato T (2008) Nature 454:1106–11094. Kageyama A, Sato T (2004) Geochem Geophys Geosyst 5:1–155. Kageyama A et al (2004) proceedings of SC2004 35–436. Chesshire G, Henshaw W D (1990) J Comput Phys 90:1–647. Busse F H (2002) Phys Fluids 14:1301–13148. Sumita I, Olson P (2000) Phys Earth Planet Inter 117:153–1709. Cruz-Neira C, Sandin D J, DeFanti T A (1993) Proceedings of SIGGRAPH ’93
135–14210. Kageyama A, Tamura Y, Sato T (2000) Prog Theor Phys Suppl 138:665–67311. Ohno N, Kageyama A, Kusano K (2006) J Plasma Phys 72:1069–107212. Ohno N, Kageyama A (2007) Phys Earth Planet Inter 163:305–311
68