high-resolution elemental abundance analysis of the hyades
TRANSCRIPT
Mon. Not. R. Astron. Soc. 415, 563–575 (2011) doi:10.1111/j.1365-2966.2011.18728.x
High-resolution elemental abundance analysis of the Hyadessupercluster�
G. M. De Silva,1† K. C. Freeman,2 J. Bland-Hawthorn,3 M. Asplund,4 M. Williams5
and J. Holmberg6
1Australian Astronomical Observatory, PO Box 296, NSW 1710, Australia2Research School of Astronomy and Astrophysics, Mount Stromlo Observatory, Australian National University, ACT 2611, Australia3Institute of Astronomy, School of Physics, University of Sydney, NSW 2006, Australia4Max Planck Institute for Astrophysics, Karl-Schwarzschild-strasse 1, Garching 85741, Germany5Astrophysikalisches Institut Potsdam, An der Sternwarte 16, Potsdam D-14482, Germany6The Niels Bohr Institute, Astronomy Group, Juliane Maries Vej 30, 2100 Copenhagen, Denmark
Accepted 2011 March 16. Received 2011 March 16; in original form 2011 January 20
ABSTRACTThe existence of a kinematically defined moving group of stars centred at U = −40, V =−17 km s−1, referred to as the Hyades supercluster, has been suggested to be the debrisof an originally large star-forming event, with its core being the present-day Hyades opencluster. Using high-resolution UV-Visual Echelle Spectrograph (UVES) spectra, we presentthe elemental abundances for a range of alpha, Fe-peak and neutron-capture elements for 26proposed supercluster stars. Our results show that the sample stars display a heterogeneousabundance distribution, with a clump around [Fe/H] = +0.15. We also calculate stellar radialvelocities and U, V , W space velocities. Enforcing strict chemical and kinematical membershipcriteria, we find that four supercluster stars share the Hyades open cluster abundances andkinematics, while many of the remaining stars fit the disc field kinematics and abundance range.We discuss our findings in the context of the Hyades supercluster being a dispersed star-formingremnant, a stellar stream of purely dynamical origin or a result of several processes.
Key words: Galaxy: abundances – Galaxy: disc – open clusters and associations: individual:Hyades supercluster.
1 IN T RO D U C T I O N
To obtain a detailed physical understanding of the events that shapedthe Galactic disc, we must examine its individual stars. The chemicalabundances as measured from stellar photospheres can be indicativeof the conditions of a star’s birth site. Different chemical elementsare synthesized during different stages of stellar evolution and aredistributed to the interstellar medium via supernova explosions orstellar winds. By studying the abundances of these elements we canestimate the frequency and importance of each synthesis process.Therefore the chemical abundance patterns within the disc stars canbe regarded as a fossil imprint and hold key information of the eventsthat took place during the disc’s formation and evolutionary history.The long-term goal of Galactic Archaeology is to reconstruct theoriginal star-forming events of the Galaxy. Employing the techniqueof chemical tagging (Freeman & Bland-Hawthorn 2002) to discstars, one can identify the now-dispersed ancient stellar aggregates,the building blocks of the Galactic disc.
�Based on observations made at the European Southern Observatory,Paranal, Chile (ESO programmes 080.D-0094(A) and 381.B-0045(A)).†E-mail: [email protected]
Candidates for such fossil stellar aggregates are moving groupsand superclusters, where their stellar members are unbound butshare a common motion around the Galaxy. Analogous to stellarstreams in the Galaxy halo which are remnants of merged satel-lites, old moving groups and superclusters may represent the an-cient stellar building blocks of the disc. A strong advocate forthe reality of these groups was Olin Eggen, who identified sev-eral moving groups and superclusters (Eggen 1958–1998). Withthe availability of the Hipparcos catalogue of parallaxes and propermotions it became possible to study these substructures in unprece-dented detail. Several studies have analysed the Hipparcos cata-logue and re-identified the classical groups as well as found newones (Antoja et al. 2008; Bovy, Hogg & Roweis 2009; Zhao, Zhao& Chen 2009). Essentially, all of these studies have focused purelyon the dynamical/kinematical nature of the substructures in thedisc.
Thus moving groups and superclusters provide disc substructuresthat can be identified through kinematics. However, it is not yet clearif all, or indeed the majority, of these substructures actually originatefrom star-forming clusters that have or are in the process of beingdispersed. Such substructures can equally well be the result of thedynamical interaction between the stars in the field and the centralbar or the spiral structure of the Milky Way (see e.g. Dehnen 1998).
C© 2011 The AuthorsMonthly Notices of the Royal Astronomical Society C© 2011 RAS

564 G. M. De Silva et al.
Therefore not all kinematically defined disc substructures representthe debris of a single star formation event.
1.1 The Hyades supercluster
The existence of a dispersed kinematically defined group of starsassociated with the Hyades open cluster was proposed by Eggen(1970), as a part of a larger star-forming event, where the outercluster stars have dispersed into the Hyades supercluster, leavingonly its core members in the present-day Hyades open cluster. Theexistence of the kinematically defined Hyades supercluster is wellestablished observationally (e.g. in Hipparcos, RAVE and Geneva–Copenhagen survey), where a concentration of stars are found atU ∼ −40 km s−1 and V ∼ −20 km s−1 in the U–V velocity plane.Throughout this article we consider the direction of the U-velocityto be positive towards the Galactic centre. However, many studiessuggest that this overdensity of stars consists of a mixture of fieldstars that have been resonantly swept up by a passing spiral waveand is not the result of a dispersed stellar aggregate (Famaey et al.2005; Bovy & Hogg 2010; Minchev et al. 2010).
With kinematical information alone it is difficult to address thereality of dispersed stellar aggregates. The dissipative formationand dynamical evolution of the Galaxy means much of the kine-matical information is limited to the last event of scattering, wherethe original kinematical information has been modified as a re-sult of latter events. Therefore only the most recent events can betraced with kinematics, masking the initial identity. However, thechemical information in the form of elemental abundances of indi-vidual stars remains preserved. Present-day open clusters are chem-ically homogeneous (De Silva et al. 2006; Pancino et al. 2010),which demonstrates that the stars’ natal chemical composition isunaltered. Therefore, along with kinematical information, chemicalprobing of moving groups and superclusters offers the possibil-ity to determine their initial identity. Detailed abundance study ofthe HR 1614 moving group (De Silva et al. 2007a) demonstratedthat its member stars are chemically homogeneous and clearly dis-tinguishable from the disc field stars, indicating that it is a dis-persed relic of an earlier star-forming event (see also Bubar &King 2010, for the case of Wolf 630 moving group). Conversely,an example of a dynamically defined group is the Hercules stream,which is not chemically homogeneous and its abundance patternsare not distinguishable from the field stars (Bensby et al. 2007).When inspected in velocity space alone, both the HR 1614 mov-ing group and the Hercules stream satisfy the requirements fora dispersing cluster remnant, while chemical probing shows thatthey have very different origins. These examples demonstrate thatchemical information is essential to identify dispersed group mem-bers, and that dynamical information alone cannot be used to un-cover the true history behind any comoving group of stars in thedisc.
Despite the wealth of information obtainable via chemical prob-ing, elemental abundance analysis of the kinematically defined mov-ing groups is not available in the literature, possibly due to the largereffort required to measure accurate abundances. In this paper wepresent the high-resolution elemental abundances for a sample ofproposed Hyades supercluster stars and examine its possible ori-gins.
2 SAMPLE SELECTION
Assuming that the Hyades supercluster is a part of a larger structureproduced by a dissolving star formation site, we can expect that
the site would dissolve along a dispersion orbit. These paths alongwhich a gently disrupting system would dissolve, can be approx-imated by closed ellipses when viewed from a frame rotating atthe local value of � − κ/2, where � is the local angular veloc-ity of rotation near the Sun and κ is the epicyclic frequency. Thestars move clockwise around these ellipses with angular velocityapproximately κ/2 and gradually spread out around them. In thiswork, the adopted velocity of Hyades supercluster stars near theSun was U = −40, V = −17 km s−1, consistent with the currentlyaccepted motion of the Hyades open cluster and the correspondingoverdensity regions seen in the Geneva–Copenhagen survey.
Wilson (1990) observed low-latitude K giant stars from theMichigan catalogue (Houk 1982) in the expected direction ofthe Hyades supercluster dispersion orbit. The observations werecarried out using the coude spectrograph on the Mt StromloObservatory 74-inch telescope. The data of R ∼ 20 000 cen-tred at 5200 Å were cross-correlated against template spectra toderive metallicities and radial velocities. Wilson found a con-centration of stars in the abundance range −0.2 to −0.1 lyingclose to the Hyades dispersion orbit loci in the radial velocity–longitude plane, which he interpreted as being stars associated withthe dispersing Hyades systems. The currently accepted Hyadesopen cluster metallicity is [Fe/H] = +0.13 dex based on high-resolution abundances (Paulson Sneden & Cochran 2003; Primaset al., in preparation). While we cannot accurately compare high-resolution Fe abundances with the early metallicity derivations dueto likely zero-point offsets, it is interesting that a concentrationof stars was found along the dispersion orbits in this metallicitybin.
We selected stars likely to be dispersing Hyades superclusterstars based on Wilson’s results for high-resolution observations. Ouranalysis will test the hypothesis of the disrupting system discussedabove. We also targeted F-type probable member stars as publishedin Eggen (1998), which had Hipparcos identification. Table 1 liststhe IDs, coordinates, V magnitude and colour for all the observedstars. In the last column of Table 1, E98 indicates stars selectedfrom Eggen (1998) and W indicates those selected from Wilson’sthesis.
3 O BSERVATI ONS
High-resolution and high signal-to-noise ratio spectra of probablemembers of the Hyades supercluster were observed using the VLTUV-Visual Echelle Spectrograph (UVES) at UT2 in the frameworkof programmes 080.D-0094(A) and 381.B-0045(A). A total of 45probable member stars were submitted for service mode observa-tions, using the UVES Red arm standard setting at 520 nm whichprovides complete spectral coverage from 4200 to 6200 Å, andemployed a 0.8-arcsec slit to achieve a spectral resolving powerof 60 000. The typical signal-to-noise (S/N) ratio was 100 pixel−1.The data were reduced with the latest UVES ESO-MIDAS pipeline.The resulting spectra were normalized using the continuum task inthe IRAF package.1
Out of the total 45 targets observed, only 26 could be used forabundance analysis. The other 19 stars showed broadened spectrallines due to high rotation and were hence discarded from furtheranalysis. 17 of these stars were from Eggen (1998), likely to be
1 IRAF is distributed by the National Optical Astronomy Observatory, whichis operated by the Association of Universities for Research in Astronomy,Inc., under cooperative agreement with the National Science Foundation.
C© 2011 The Authors, MNRAS 415, 563–575Monthly Notices of the Royal Astronomical Society C© 2011 RAS
Abundances of the Hyades supercluster 565
Table 1. Total sample of observed stars.
ID RA Dec. V B − V Notes
HD 25102 03 59 40.4935 +10 19 49.448 6.34 0.42 E98HD 26737 04 14 30.4203 +22 27 06.713 7.04 0.43 E98HD 27429 04 20 25.1095 +18 44 33.390 6.09 0.38 E98HD 27534 04 21 32.2686 +18 25 03.297 6.78 0.45 E98HD 27848 04 24 22.2727 +17 04 44.225 6.95 0.46 E98HD 27991 04 25 37.3171 +15 56 27.636 6.45 9.45 E98HD 28394 04 29 20.5531 +17 32 41.766 7.01 0.51 E98HD 28608 04 30 57.1723 +10 45 06.365 7.02 0.47 E98HD 28736 04 32 04.8091 +05 24 36.126 6.35 0.43 E98HD 30912 04 52 47.1170 +27 53 50.947 5.97 0.34 E98HD 50643 06 53 21.8408 −18 55 58.238 6.13 0.16 E98HD 69511 08 15 58.8226 −35 54 11.486 6.16 1.57 WHD 69836 08 17 30.5546 −35 10 14.009 8.57 1.08 WHD 72320 08 30 29.1090 −42 54 34.058 8.95 0.94 WHD 72630 08 32 23.7142 −41 29 53.544 9.49 1.01 WHD 73657 08 37 48.1209 −42 19 11.404 7.85 1.18 WHD 73829 08 38 44.3768 −43 08 16.205 9.42 1.27 WHD 74165 08 40 53.4114 −40 40 55.841 9.12 1.16 WHD 74166 08 40 42.6510 −42 20 26.606 7.62 1.29 WHD 74529 08 42 43.4206 −47 14 25.097 8.41 1.19 WHD 74900 08 45 13.1890 −41 52 44.224 7.96 1.17 WHD 75058 08 46 21.9930 −38 18 19.552 8.94 1.08 WHD 75171 08 44 29.9575 −65 49 31.544 6.03 0.19 E98HD 76128 08 52 47.7716 −41 25 49.269 7.90 1.40 WHD 77117 08 58 37.7029 −47 04 17.465 9.46 0.52 WHD 77241 08 59 30.6086 −48 49 11.118 9.98 1.02 WHD 78002 09 04 19.8280 −43 20 22.225 9.45 1.05 WHD 78097 09 04 46.8967 −44 48 37.337 7.61 1.63 WHD 78204 09 05 02.8562 −50 52 45.128 9.95 1.04 WHD 78402 09 06 16.1539 −49 04 41.490 9.88 0.93 WHD 78528 09 06 57.8364 −49 38 22.415 8.86 1.59 WHD 78959 09 09 29.8423 −44 33 59.972 7.80 1.75 WHD 80571 09 19 07.6889 −46 38 22.151 7.88 1.09 WHD 80911 09 20 41.4133 −50 42 09.173 8.56 1.73 WHD 81278 09 22 52.1556 −52 08 04.264 8.48 1.08 WHD 82438 09 30 12.8630 −52 01 55.341 9.00 1.64 WHD 83234 09 35 04.8294 −54 36 14.833 8.56 1.42 WHD 84598 09 44 53.2380 −50 00 36.850 7.45 0.97 WHD 86757 09 58 56.8698 −54 37 13.983 8.36 1.59 WHD 97840 11 15 02.4004 −33 19 03.880 6.99 0.32 E98HD 112734 12 58 33.8230 +28 19 10.449 6.94 0.26 E98HD 117374 13 40 55.4795 −85 47 09.756 5.56 0.17 E98HD 121164 13 53 10.2822 +28 38 53.273 5.91 0.19 E98HD 122721 14 04 14.5737 −33 06 19.948 9.16 1.06 E98HD 218475 23 08 22.9309 −07 16 01.221 8.31 0.33 E98
F-type dwarfs, and two stars were K giants from Wilson’s thesis.Of the 26 sharp-lined spectra, only one star was from the sample ofEggen (1998).
4 A BU N DA N C E A NA LY S I S
4.1 Model atmospheres and spectral lines
The elemental abundances were derived based on equivalent (EW)measurements and spectral synthesis, making use of the latest ver-sion of the MOOG code (Sneden 1973). The EWs were measured byfitting a Gaussian profile to each line using the interactive SPLOTfunction in IRAF. On occasions the local continuum level was ad-justed by eye. Abundances of Mn, Ba, La and Ce were derived usingthe synth routine of the MOOG code to account for line blending andhyperfine structures. Interpolated Kurucz model atmospheres based
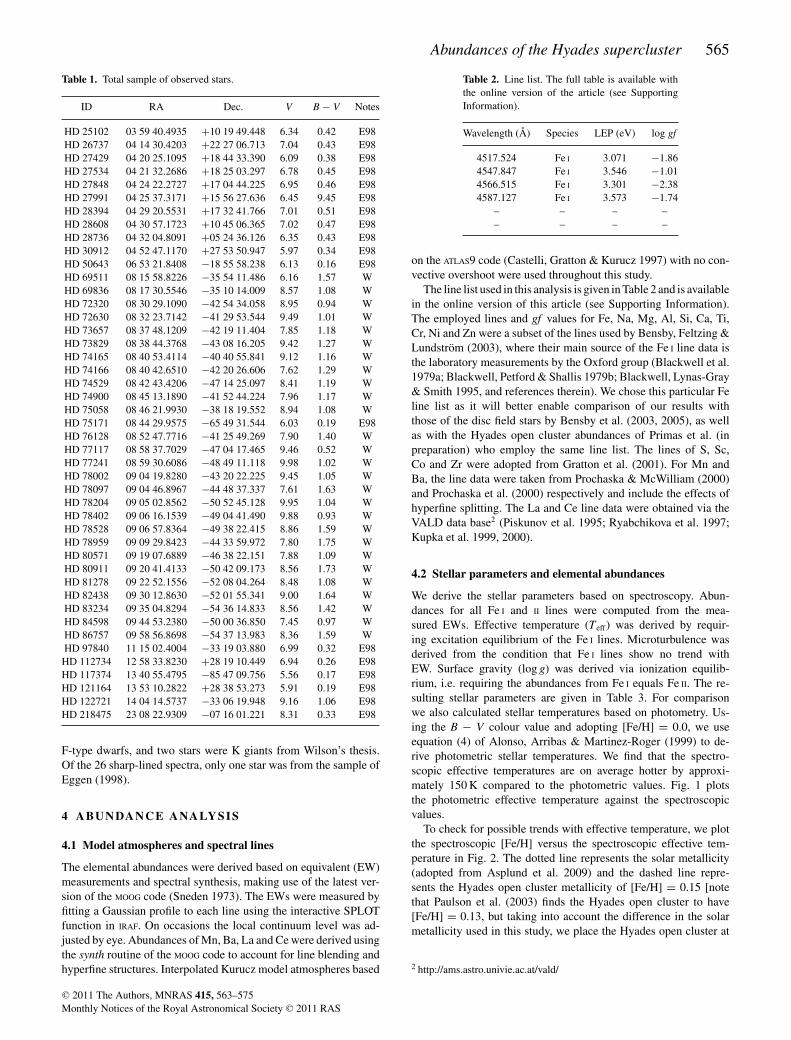
Table 2. Line list. The full table is available withthe online version of the article (see SupportingInformation).
Wavelength (Å) Species LEP (eV) log gf
4517.524 Fe I 3.071 −1.864547.847 Fe I 3.546 −1.014566.515 Fe I 3.301 −2.384587.127 Fe I 3.573 −1.74
– – – –– – – –
on the ATLAS9 code (Castelli, Gratton & Kurucz 1997) with no con-vective overshoot were used throughout this study.
The line list used in this analysis is given in Table 2 and is availablein the online version of this article (see Supporting Information).The employed lines and gf values for Fe, Na, Mg, Al, Si, Ca, Ti,Cr, Ni and Zn were a subset of the lines used by Bensby, Feltzing &Lundstrom (2003), where their main source of the Fe I line data isthe laboratory measurements by the Oxford group (Blackwell et al.1979a; Blackwell, Petford & Shallis 1979b; Blackwell, Lynas-Gray& Smith 1995, and references therein). We chose this particular Feline list as it will better enable comparison of our results withthose of the disc field stars by Bensby et al. (2003, 2005), as wellas with the Hyades open cluster abundances of Primas et al. (inpreparation) who employ the same line list. The lines of S, Sc,Co and Zr were adopted from Gratton et al. (2001). For Mn andBa, the line data were taken from Prochaska & McWilliam (2000)and Prochaska et al. (2000) respectively and include the effects ofhyperfine splitting. The La and Ce line data were obtained via theVALD data base2 (Piskunov et al. 1995; Ryabchikova et al. 1997;Kupka et al. 1999, 2000).
4.2 Stellar parameters and elemental abundances
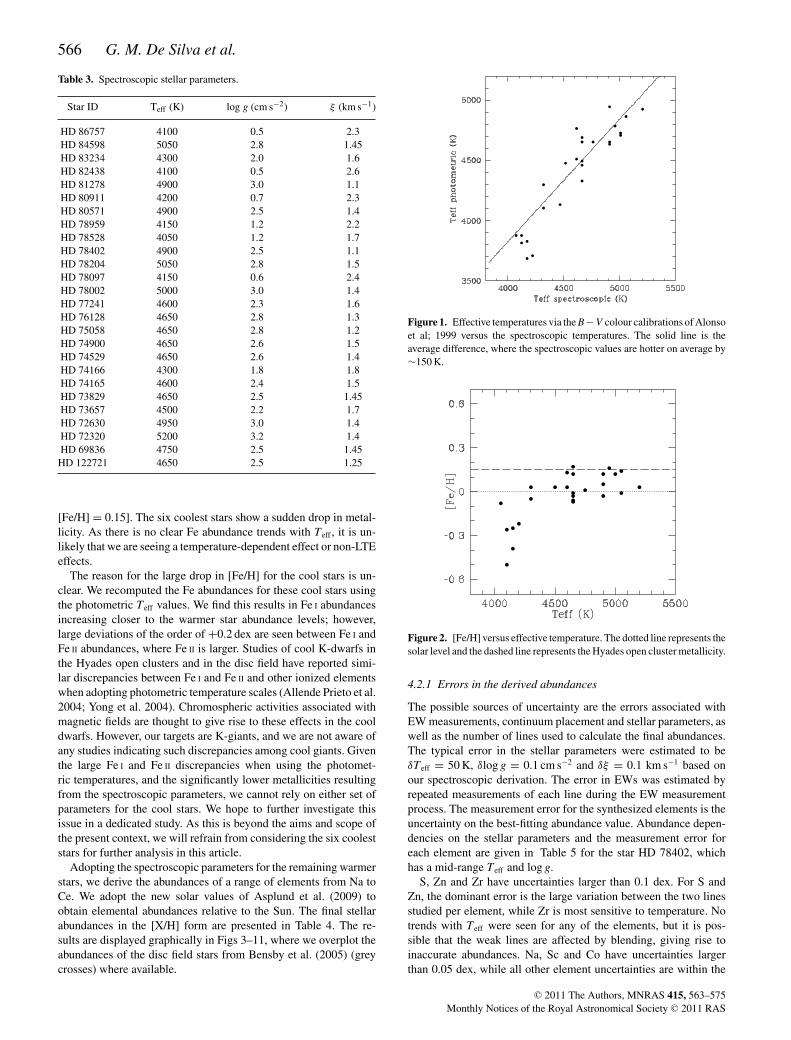
We derive the stellar parameters based on spectroscopy. Abun-dances for all Fe I and II lines were computed from the mea-sured EWs. Effective temperature (Teff ) was derived by requir-ing excitation equilibrium of the Fe I lines. Microturbulence wasderived from the condition that Fe I lines show no trend withEW. Surface gravity (log g) was derived via ionization equilib-rium, i.e. requiring the abundances from Fe I equals Fe II. The re-sulting stellar parameters are given in Table 3. For comparisonwe also calculated stellar temperatures based on photometry. Us-ing the B − V colour value and adopting [Fe/H] = 0.0, we useequation (4) of Alonso, Arribas & Martinez-Roger (1999) to de-rive photometric stellar temperatures. We find that the spectro-scopic effective temperatures are on average hotter by approxi-mately 150 K compared to the photometric values. Fig. 1 plotsthe photometric effective temperature against the spectroscopicvalues.
To check for possible trends with effective temperature, we plotthe spectroscopic [Fe/H] versus the spectroscopic effective tem-perature in Fig. 2. The dotted line represents the solar metallicity(adopted from Asplund et al. 2009) and the dashed line repre-sents the Hyades open cluster metallicity of [Fe/H] = 0.15 [notethat Paulson et al. (2003) finds the Hyades open cluster to have[Fe/H] = 0.13, but taking into account the difference in the solarmetallicity used in this study, we place the Hyades open cluster at
2 http://ams.astro.univie.ac.at/vald/
C© 2011 The Authors, MNRAS 415, 563–575Monthly Notices of the Royal Astronomical Society C© 2011 RAS
566 G. M. De Silva et al.
Table 3. Spectroscopic stellar parameters.
Star ID Teff (K) log g (cm s−2) ξ (km s−1)
HD 86757 4100 0.5 2.3HD 84598 5050 2.8 1.45HD 83234 4300 2.0 1.6HD 82438 4100 0.5 2.6HD 81278 4900 3.0 1.1HD 80911 4200 0.7 2.3HD 80571 4900 2.5 1.4HD 78959 4150 1.2 2.2HD 78528 4050 1.2 1.7HD 78402 4900 2.5 1.1HD 78204 5050 2.8 1.5HD 78097 4150 0.6 2.4HD 78002 5000 3.0 1.4HD 77241 4600 2.3 1.6HD 76128 4650 2.8 1.3HD 75058 4650 2.8 1.2HD 74900 4650 2.6 1.5HD 74529 4650 2.6 1.4HD 74166 4300 1.8 1.8HD 74165 4600 2.4 1.5HD 73829 4650 2.5 1.45HD 73657 4500 2.2 1.7HD 72630 4950 3.0 1.4HD 72320 5200 3.2 1.4HD 69836 4750 2.5 1.45HD 122721 4650 2.5 1.25
[Fe/H] = 0.15]. The six coolest stars show a sudden drop in metal-licity. As there is no clear Fe abundance trends with Teff , it is un-likely that we are seeing a temperature-dependent effect or non-LTEeffects.
The reason for the large drop in [Fe/H] for the cool stars is un-clear. We recomputed the Fe abundances for these cool stars usingthe photometric Teff values. We find this results in Fe I abundancesincreasing closer to the warmer star abundance levels; however,large deviations of the order of +0.2 dex are seen between Fe I andFe II abundances, where Fe II is larger. Studies of cool K-dwarfs inthe Hyades open clusters and in the disc field have reported simi-lar discrepancies between Fe I and Fe II and other ionized elementswhen adopting photometric temperature scales (Allende Prieto et al.2004; Yong et al. 2004). Chromospheric activities associated withmagnetic fields are thought to give rise to these effects in the cooldwarfs. However, our targets are K-giants, and we are not aware ofany studies indicating such discrepancies among cool giants. Giventhe large Fe I and Fe II discrepancies when using the photomet-ric temperatures, and the significantly lower metallicities resultingfrom the spectroscopic parameters, we cannot rely on either set ofparameters for the cool stars. We hope to further investigate thisissue in a dedicated study. As this is beyond the aims and scope ofthe present context, we will refrain from considering the six cooleststars for further analysis in this article.
Adopting the spectroscopic parameters for the remaining warmerstars, we derive the abundances of a range of elements from Na toCe. We adopt the new solar values of Asplund et al. (2009) toobtain elemental abundances relative to the Sun. The final stellarabundances in the [X/H] form are presented in Table 4. The re-sults are displayed graphically in Figs 3–11, where we overplot theabundances of the disc field stars from Bensby et al. (2005) (greycrosses) where available.
Figure 1. Effective temperatures via the B − V colour calibrations of Alonsoet al; 1999 versus the spectroscopic temperatures. The solid line is theaverage difference, where the spectroscopic values are hotter on average by∼150 K.
Figure 2. [Fe/H] versus effective temperature. The dotted line represents thesolar level and the dashed line represents the Hyades open cluster metallicity.
4.2.1 Errors in the derived abundances
The possible sources of uncertainty are the errors associated withEW measurements, continuum placement and stellar parameters, aswell as the number of lines used to calculate the final abundances.The typical error in the stellar parameters were estimated to beδTeff = 50 K, δlog g = 0.1 cm s−2 and δξ = 0.1 km s−1 based onour spectroscopic derivation. The error in EWs was estimated byrepeated measurements of each line during the EW measurementprocess. The measurement error for the synthesized elements is theuncertainty on the best-fitting abundance value. Abundance depen-dencies on the stellar parameters and the measurement error foreach element are given in Table 5 for the star HD 78402, whichhas a mid-range Teff and log g.
S, Zn and Zr have uncertainties larger than 0.1 dex. For S andZn, the dominant error is the large variation between the two linesstudied per element, while Zr is most sensitive to temperature. Notrends with Teff were seen for any of the elements, but it is pos-sible that the weak lines are affected by blending, giving rise toinaccurate abundances. Na, Sc and Co have uncertainties largerthan 0.05 dex, while all other element uncertainties are within the
C© 2011 The Authors, MNRAS 415, 563–575Monthly Notices of the Royal Astronomical Society C© 2011 RAS
Abundances of the Hyades supercluster 567Ta
ble
4.E
lem
enta
labu
ndan
ces.
ID[F
e/H
][N
a/H
][M
g/H
][A
l/H]
[Si/H
][S
/H]
[Ca/
H]
[Sc/
H]
[Ti/H
][C
r/H
][M
n/H
][C
o/H
][N
i/H]
[Zn/
H]
[Zr/
H]
[Ba/
H]
[La/
H]
[Ce/
H]
HD
8459
8−0
.01
0.17
0.10
0.05
0.05
−0.0
60.
020.
04−0
.08
−0.0
2−0
.08
-0.1
2−0
.05
0.07
0.16
0.42
0.10
0.13
HD
8323
40.
030.
110.
000.
310.
150.
210.
010.
050.
200.
080.
030.
060.
07−0
.04
0.49
0.00
0.26
0.37
HD
8127
80.
120.
080.
130.
200.
270.
380.
140.
150.
080.
120.
120.
280.
210.
380.
060.
400.
160.
20H
D80
571
0.05
0.02
0.03
0.12
0.17
0.02
−0.0
50.
14−0
.11
−0.0
4−0
.08
0.03
0.04
0.10
0.04
0.17
0.02
0.10
HD
7840
2−0
.03
−0.0
20.
150.
140.
050.
010.
070.
170.
190.
07−0
.03
0.03
0.07
0.15
0.36
0.47
0.36
0.45
HD
7820
40.
140.
340.
220.
240.
180.
170.
19−0
.02
0.04
0.16
0.16
0.09
0.12
0.02
0.34
0.37
0.18
0.22
HD
7800
20.
120.
320.
190.
180.
230.
330.
160.
140.
070.
140.
130.
120.
160.
160.
190.
400.
150.
22H
D77
241
0.13
0.34
0.19
0.36
0.41
0.38
0.08
0.14
0.09
0.16
0.16
0.31
0.24
0.24
0.14
0.03
0.00
0.04
HD
7612
80.
170.
110.
100.
250.
320.
290.
030.
280.
050.
150.
120.
200.
190.
550.
160.
370.
160.
25H
D75
058
−0.0
30.
020.
040.
070.
120.
020.
020.
00−0
.09
−0.0
6−0
.05
0.05
−0.0
10.
25−0
.15
0.15
−0.0
7−0
.05
HD
7490
0−0
.01
0.07
0.14
0.20
0.23
0.15
0.01
0.11
0.00
−0.0
2−0
.07
0.10
0.05
0.32
−0.0
50.
10−0
.02
0.05
HD
7452
90.
120.
190.
040.
210.
220.
270.
030.
05−0
.10
0.02
−0.0
40.
040.
010.
160.
080.
09−0
.05
−0.0
5H
D74
166
−0.0
50.
190.
080.
210.
020.
24−0
.13
−0.1
1−0
.17
−0.0
9–
-0.1
3−0
.11
−0.1
80.
11–
––
HD
7416
50.
030.
110.
120.
280.
150.
15−0
.01
0.01
−0.0
10.
05−0
.03
0.05
0.00
0.14
0.14
0.02
−0.0
60.
03H
D73
829
−0.0
70.
07−0
.02
0.07
0.15
0.00
−0.1
1−0
.08
−0.1
2−0
.11
0.01
-0.0
4−0
.06
0.04
−0.0
30.
000.
000.
05H
D73
657
0.03
0.18
0.07
0.17
0.25
0.15
−0.0
9−0
.08
−0.1
5−0
.06
−0.0
4-0
.04
−0.0
30.
020.
03−0
.07
−0.0
20.
02H
D72
630
0.16
0.28
0.25
0.28
0.24
0.19
0.19
0.16
0.11
0.19
0.17
0.18
0.17
0.25
0.31
0.43
0.18
0.20
HD
7232
00.
030.
160.
070.
120.
090.
050.
080.
040.
000.
050.
01-0
.09
−0.0
20.
050.
200.
570.
300.
40H
D69
836
0.01
−0.0
10.
090.
120.
170.
06−0
.03
0.11
−0.0
9−0
.04
−0.0
10.
070.
070.
19−0
.02
0.30
0.05
0.15
HD
1227
21−0
.06
0.00
0.01
0.08
0.11
0.00
−0.0
40.
02−0
.12
−0.0
7−0
.04
-0.0
3−0
.02
0.12
−0.0
10.
370.
150.
22
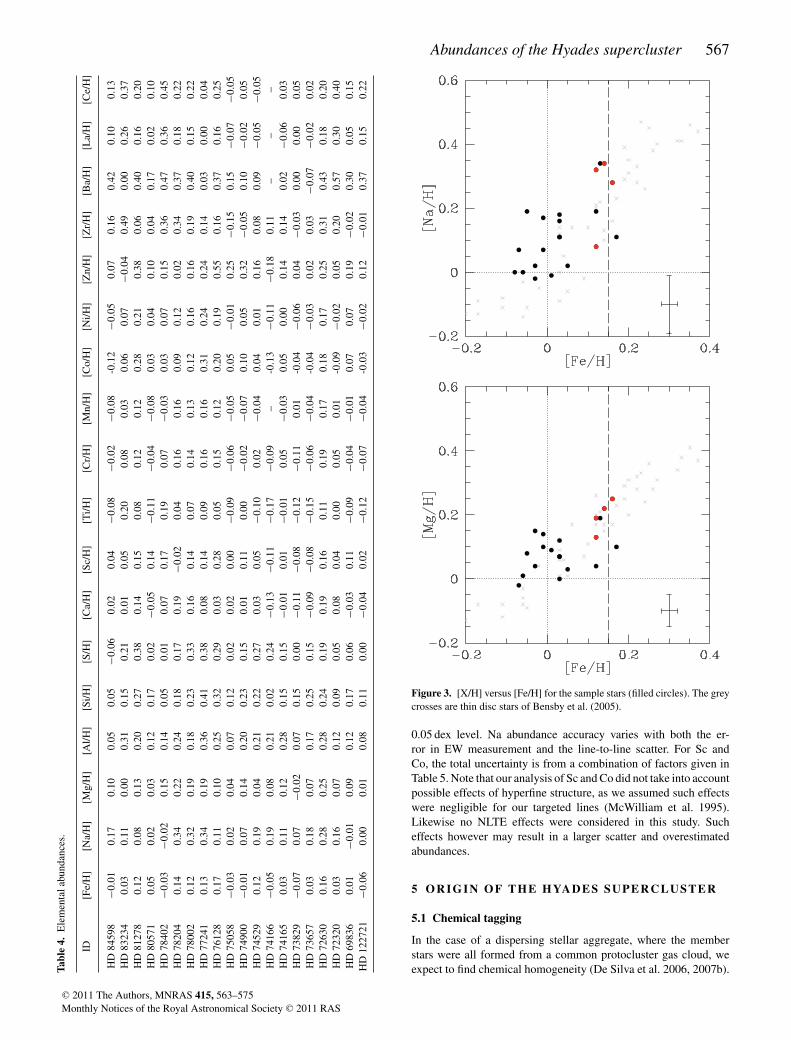
Figure 3. [X/H] versus [Fe/H] for the sample stars (filled circles). The greycrosses are thin disc stars of Bensby et al. (2005).
0.05 dex level. Na abundance accuracy varies with both the er-ror in EW measurement and the line-to-line scatter. For Sc andCo, the total uncertainty is from a combination of factors given inTable 5. Note that our analysis of Sc and Co did not take into accountpossible effects of hyperfine structure, as we assumed such effectswere negligible for our targeted lines (McWilliam et al. 1995).Likewise no NLTE effects were considered in this study. Sucheffects however may result in a larger scatter and overestimatedabundances.
5 O R I G I N O F TH E H YA D E S SU P E R C L U S T E R
5.1 Chemical tagging
In the case of a dispersing stellar aggregate, where the memberstars were all formed from a common protocluster gas cloud, weexpect to find chemical homogeneity (De Silva et al. 2006, 2007b).
C© 2011 The Authors, MNRAS 415, 563–575Monthly Notices of the Royal Astronomical Society C© 2011 RAS
568 G. M. De Silva et al.
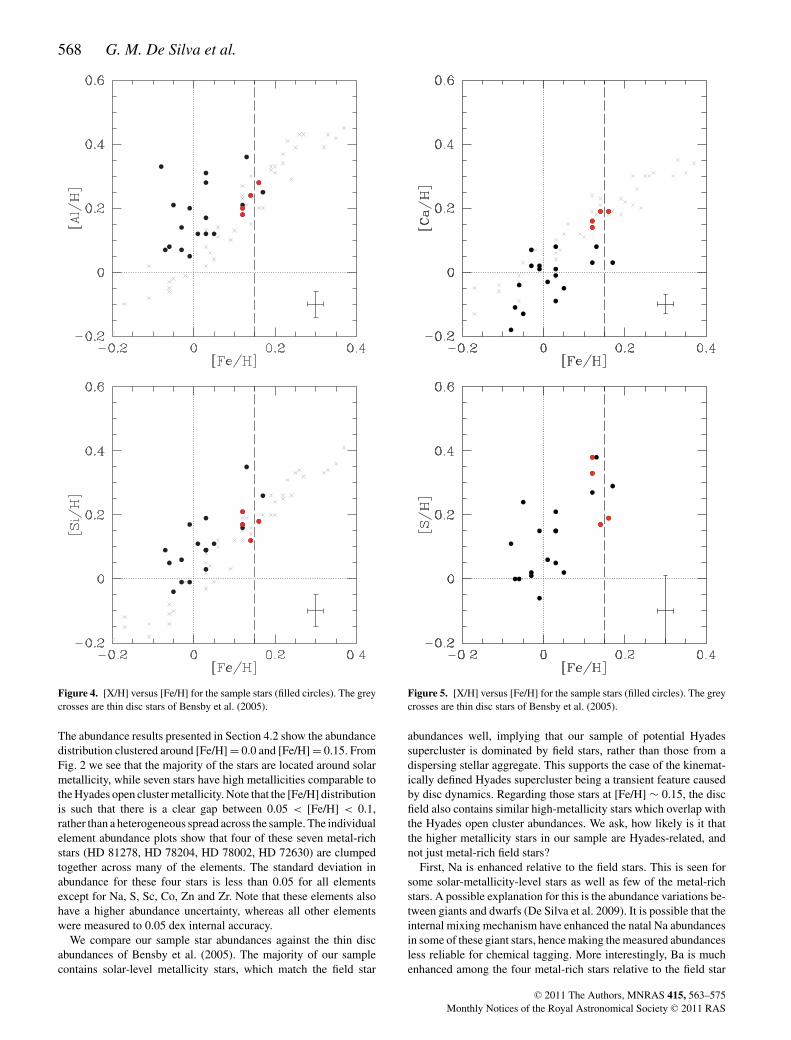
Figure 4. [X/H] versus [Fe/H] for the sample stars (filled circles). The greycrosses are thin disc stars of Bensby et al. (2005).
The abundance results presented in Section 4.2 show the abundancedistribution clustered around [Fe/H] = 0.0 and [Fe/H] = 0.15. FromFig. 2 we see that the majority of the stars are located around solarmetallicity, while seven stars have high metallicities comparable tothe Hyades open cluster metallicity. Note that the [Fe/H] distributionis such that there is a clear gap between 0.05 < [Fe/H] < 0.1,rather than a heterogeneous spread across the sample. The individualelement abundance plots show that four of these seven metal-richstars (HD 81278, HD 78204, HD 78002, HD 72630) are clumpedtogether across many of the elements. The standard deviation inabundance for these four stars is less than 0.05 for all elementsexcept for Na, S, Sc, Co, Zn and Zr. Note that these elements alsohave a higher abundance uncertainty, whereas all other elementswere measured to 0.05 dex internal accuracy.
We compare our sample star abundances against the thin discabundances of Bensby et al. (2005). The majority of our samplecontains solar-level metallicity stars, which match the field star
Figure 5. [X/H] versus [Fe/H] for the sample stars (filled circles). The greycrosses are thin disc stars of Bensby et al. (2005).
abundances well, implying that our sample of potential Hyadessupercluster is dominated by field stars, rather than those from adispersing stellar aggregate. This supports the case of the kinemat-ically defined Hyades supercluster being a transient feature causedby disc dynamics. Regarding those stars at [Fe/H] ∼ 0.15, the discfield also contains similar high-metallicity stars which overlap withthe Hyades open cluster abundances. We ask, how likely is it thatthe higher metallicity stars in our sample are Hyades-related, andnot just metal-rich field stars?
First, Na is enhanced relative to the field stars. This is seen forsome solar-metallicity-level stars as well as few of the metal-richstars. A possible explanation for this is the abundance variations be-tween giants and dwarfs (De Silva et al. 2009). It is possible that theinternal mixing mechanism have enhanced the natal Na abundancesin some of these giant stars, hence making the measured abundancesless reliable for chemical tagging. More interestingly, Ba is muchenhanced among the four metal-rich stars relative to the field star
C© 2011 The Authors, MNRAS 415, 563–575Monthly Notices of the Royal Astronomical Society C© 2011 RAS
Abundances of the Hyades supercluster 569
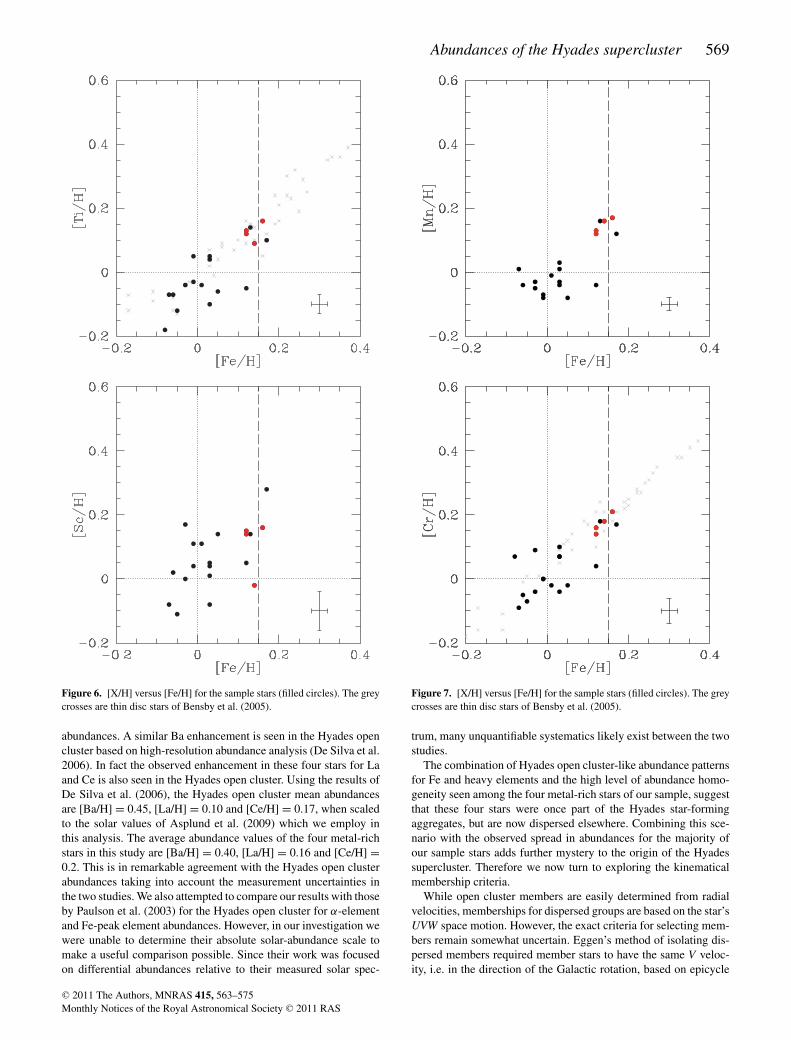
Figure 6. [X/H] versus [Fe/H] for the sample stars (filled circles). The greycrosses are thin disc stars of Bensby et al. (2005).
abundances. A similar Ba enhancement is seen in the Hyades opencluster based on high-resolution abundance analysis (De Silva et al.2006). In fact the observed enhancement in these four stars for Laand Ce is also seen in the Hyades open cluster. Using the results ofDe Silva et al. (2006), the Hyades open cluster mean abundancesare [Ba/H] = 0.45, [La/H] = 0.10 and [Ce/H] = 0.17, when scaledto the solar values of Asplund et al. (2009) which we employ inthis analysis. The average abundance values of the four metal-richstars in this study are [Ba/H] = 0.40, [La/H] = 0.16 and [Ce/H] =0.2. This is in remarkable agreement with the Hyades open clusterabundances taking into account the measurement uncertainties inthe two studies. We also attempted to compare our results with thoseby Paulson et al. (2003) for the Hyades open cluster for α-elementand Fe-peak element abundances. However, in our investigation wewere unable to determine their absolute solar-abundance scale tomake a useful comparison possible. Since their work was focusedon differential abundances relative to their measured solar spec-
Figure 7. [X/H] versus [Fe/H] for the sample stars (filled circles). The greycrosses are thin disc stars of Bensby et al. (2005).
trum, many unquantifiable systematics likely exist between the twostudies.
The combination of Hyades open cluster-like abundance patternsfor Fe and heavy elements and the high level of abundance homo-geneity seen among the four metal-rich stars of our sample, suggestthat these four stars were once part of the Hyades star-formingaggregates, but are now dispersed elsewhere. Combining this sce-nario with the observed spread in abundances for the majority ofour sample stars adds further mystery to the origin of the Hyadessupercluster. Therefore we now turn to exploring the kinematicalmembership criteria.
While open cluster members are easily determined from radialvelocities, memberships for dispersed groups are based on the star’sUVW space motion. However, the exact criteria for selecting mem-bers remain somewhat uncertain. Eggen’s method of isolating dis-persed members required member stars to have the same V veloc-ity, i.e. in the direction of the Galactic rotation, based on epicycle
C© 2011 The Authors, MNRAS 415, 563–575Monthly Notices of the Royal Astronomical Society C© 2011 RAS
570 G. M. De Silva et al.
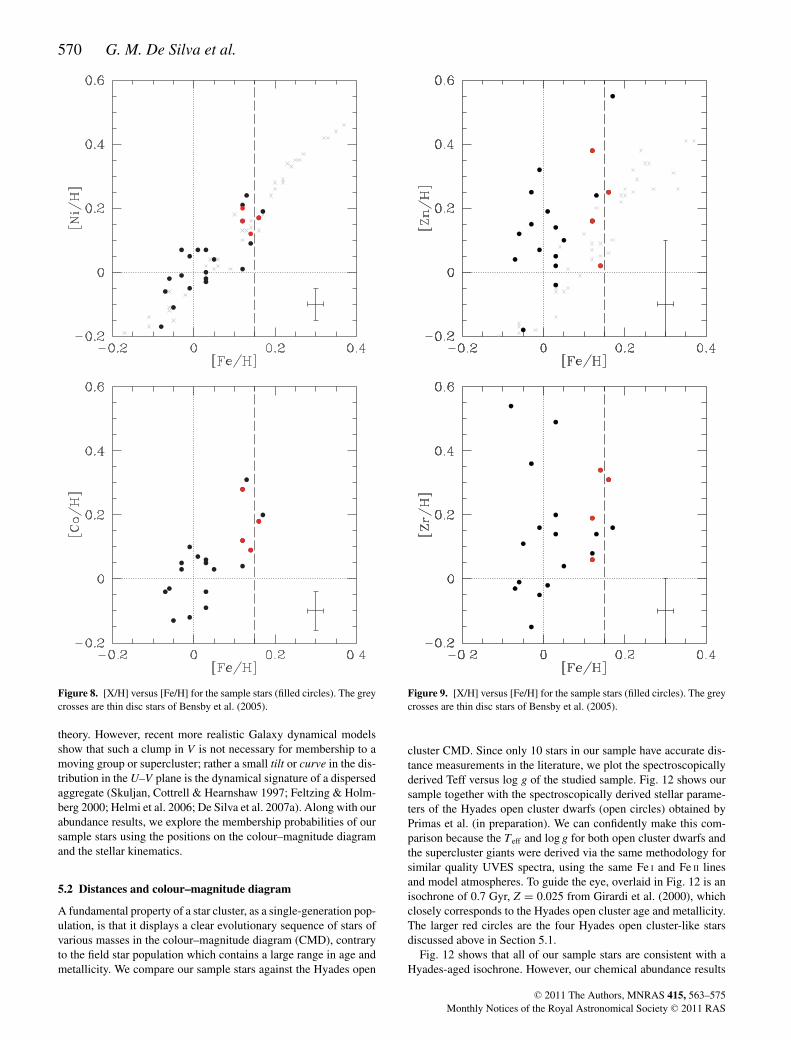
Figure 8. [X/H] versus [Fe/H] for the sample stars (filled circles). The greycrosses are thin disc stars of Bensby et al. (2005).
theory. However, recent more realistic Galaxy dynamical modelsshow that such a clump in V is not necessary for membership to amoving group or supercluster; rather a small tilt or curve in the dis-tribution in the U–V plane is the dynamical signature of a dispersedaggregate (Skuljan, Cottrell & Hearnshaw 1997; Feltzing & Holm-berg 2000; Helmi et al. 2006; De Silva et al. 2007a). Along with ourabundance results, we explore the membership probabilities of oursample stars using the positions on the colour–magnitude diagramand the stellar kinematics.
5.2 Distances and colour–magnitude diagram
A fundamental property of a star cluster, as a single-generation pop-ulation, is that it displays a clear evolutionary sequence of stars ofvarious masses in the colour–magnitude diagram (CMD), contraryto the field star population which contains a large range in age andmetallicity. We compare our sample stars against the Hyades open
Figure 9. [X/H] versus [Fe/H] for the sample stars (filled circles). The greycrosses are thin disc stars of Bensby et al. (2005).
cluster CMD. Since only 10 stars in our sample have accurate dis-tance measurements in the literature, we plot the spectroscopicallyderived Teff versus log g of the studied sample. Fig. 12 shows oursample together with the spectroscopically derived stellar parame-ters of the Hyades open cluster dwarfs (open circles) obtained byPrimas et al. (in preparation). We can confidently make this com-parison because the Teff and log g for both open cluster dwarfs andthe supercluster giants were derived via the same methodology forsimilar quality UVES spectra, using the same Fe I and Fe II linesand model atmospheres. To guide the eye, overlaid in Fig. 12 is anisochrone of 0.7 Gyr, Z = 0.025 from Girardi et al. (2000), whichclosely corresponds to the Hyades open cluster age and metallicity.The larger red circles are the four Hyades open cluster-like starsdiscussed above in Section 5.1.
Fig. 12 shows that all of our sample stars are consistent with aHyades-aged isochrone. However, our chemical abundance results
C© 2011 The Authors, MNRAS 415, 563–575Monthly Notices of the Royal Astronomical Society C© 2011 RAS

Abundances of the Hyades supercluster 571
Figure 10. [X/H] versus [Fe/H] for the sample stars (filled circles). Thegrey crosses are thin disc stars of Bensby et al. (2005).
in Section 5.1 show that only four stars are likely associated withthe Hyades star-forming event. Therefore lying along the isochronealone is not a sufficient condition for group membership.
Using Fig. 12, we can use the best-fitting isochrone to derive thedistances for each of our sample stars. By comparing the location ofeach star on the isochrone, we determined the equivalent absoluteV magnitude from the isochrone. With the determined absolutemagnitudes and the known apparent magnitudes, we derive thedistances of the sample stars. Table 6 lists the derived distancesand Fig. 13 shows the location of our stars in X-Y and X-Z spatialcoordinates, where X-Y is in the Galactic plane. The open circlerepresents the location of the Hyades open cluster. The four redstars with Hyades-like abundances lie outside the open cluster andare not present members of the bound open cluster.
Figure 11. [X/H] versus [Fe/H] for the sample stars (filled circles). Thegrey crosses are thin disc stars of Bensby et al. (2005).
5.3 Radial velocities
Radial velocities for our target stars were calculated from our high-resolution spectra using the DAOSPEC code (Stetson & Pancino 2008),which matches lines with measured equivalent widths against a linelist. A comprehensive and realistic line list for stellar spectra wasobtained using the extract stellar on the VALD data base. We usedour line list for a [Fe/H] = −0.7, Teff = 5500, log g = 4.25, ξ = 1.3star, where for our radial velocity calculation of Hyades stars wecan expect little effect of the stellar parameter differences. DAOSPEC
was run on three 100-Å intervals at 5600–5700, 5800–5900 and6000–6100 Å where DAOSPEC returns a radial velocity estimate witha corresponding dispersion by comparison with the line list. Theradial velocity was obtained for each star from a weighted averageof the three measurements, after correcting to heliocentric radialvelocity. The final values are listed in column 2 of Table 7.
5.4 U, V, W velocities
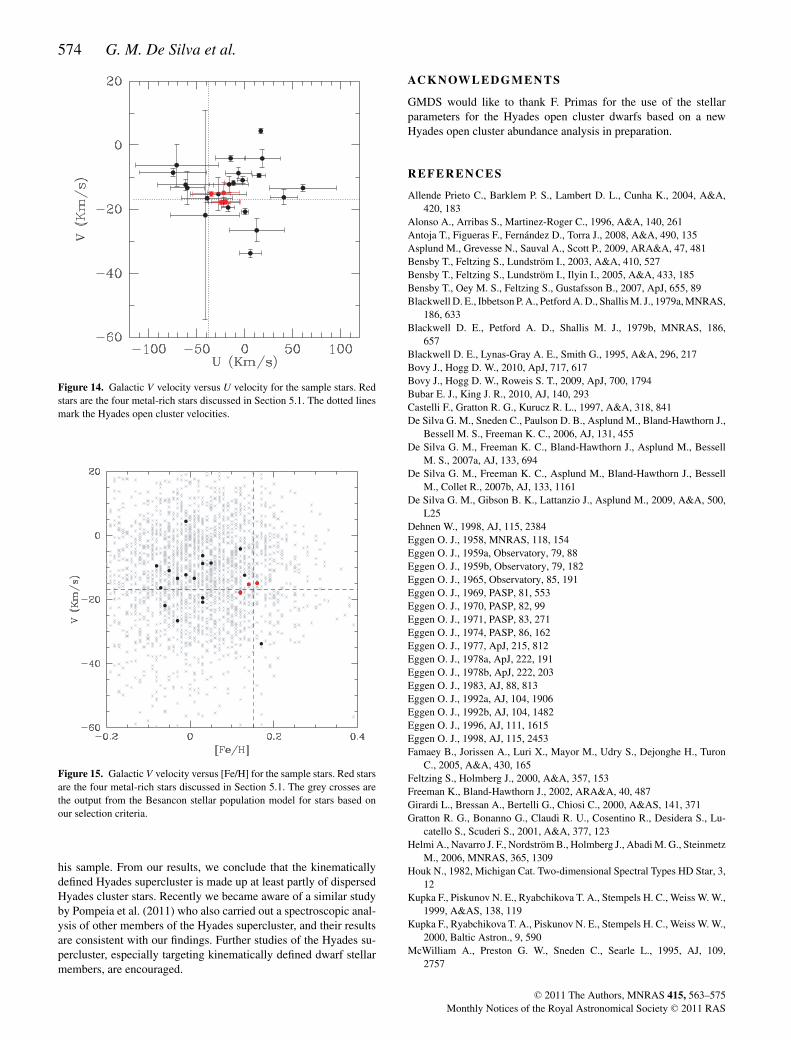
Using the derived distances, radial velocities and proper motionsfrom the Tycho-2 catalogue, we calculate the space velocities as-suming a right-handed Cartesian UVW velocities centred on thesolar position, with the U velocity positive towards the Galacticcentre. Velocities were corrected to the local standard of rest (LSR)using the peculiar motion of the Sun given by Dehnen (1998) of10, 5.3, 7.2 km s−1 in U, V and W, respectively. Errors in UVW werecalculated using a Monte Carlo simulation of 1000 realizations topropagate the errors in distance (where we assumed a 20 per centerror), proper motion and radial velocity into the space velocities,from whence the dispersions were calculated. The results are tab-ulated in Table 7 and the V versus U values are plotted in Fig. 14,where the dotted line marks the V velocity of the Hyades open clus-ter and the red circles highlight the four Hyades open cluster-likestars discussed earlier in Section 5.1.
We find that our sample stars are located within ±20 km s−1 ofthe Hyades cluster V velocity. Stars with large velocity deviationsare most likely unrelated field stars based on the kinematical mem-bership criterion. This shows that the hypothesis used by Wilson
C© 2011 The Authors, MNRAS 415, 563–575Monthly Notices of the Royal Astronomical Society C© 2011 RAS
572 G. M. De Silva et al.
Tabl
e5.
Abu
ndan
cese
nsiti
vitie
sfo
rth
est
arH
D78
402.
Para
met
erFe
Na
Mg
Al
SiS
Ca
ScT
iC
rM
nC
oN
iZ
nZ
rB
aL
aC
e
Tef
f±
50±0
.01
±0.0
4±0
.03
∓0.0
2±0
.03
±0.0
1±0
.02
∓0.0
1±0
.01
±0.0
2±0
.01
±0.0
1±0
.01
±0.0
5±0
.08
±0.0
2±0
.02
±0.0
2lo
gg
±0.
1±0
.01
∓0.0
2∓0
.04
±0.0
1∓0
.04
∓0.0
1∓0
.01
±0.0
1±0
.04
±0.0
20.
0±0
.02
±0.0
3±0
.01
±0.0
2±0
.01
±0.0
30.
00ξ
±0.
1∓0
.02
∓0.0
2∓0
.02
∓0.0
1∓0
.04
±0.0
2∓0
.04
∓0.0
3∓0
.05
±0.0
1∓0
.01
±0.0
20.
00±0
.01
±0.0
2∓0
.03
∓0.0
20.
00�
EW
/Syn
th±0
.02
±0.0
6±0
.05
±0.0
4±0
.03
±0.0
3±0
.03
±0.0
3±0
.02
±0.0
2±0
.02
±0.0
2±0
.02
±0.0
3±0
.03
±0.0
2±0
.02
±0.0
2σ
(lin
e-to
-lin
e)±0
.01
±0.0
7±0
.03
−±0
.02
±0.1
±0.0
2±0
.06
±0.0
3±0
.01
±0.0
1±0
.05
±0.0
2±0
.2±0
.03
±0.0
4−
−To
tal
±0.0
2±0
.09
±0.0
5±0
.04
±0.0
5±0
.11
±0.0
3±0
.06
±0.0
3±0
.04
± 0.0
2±0
.06
±0.0
5±0
.2±0
.1±0
.04
±0.0
4±0
.03
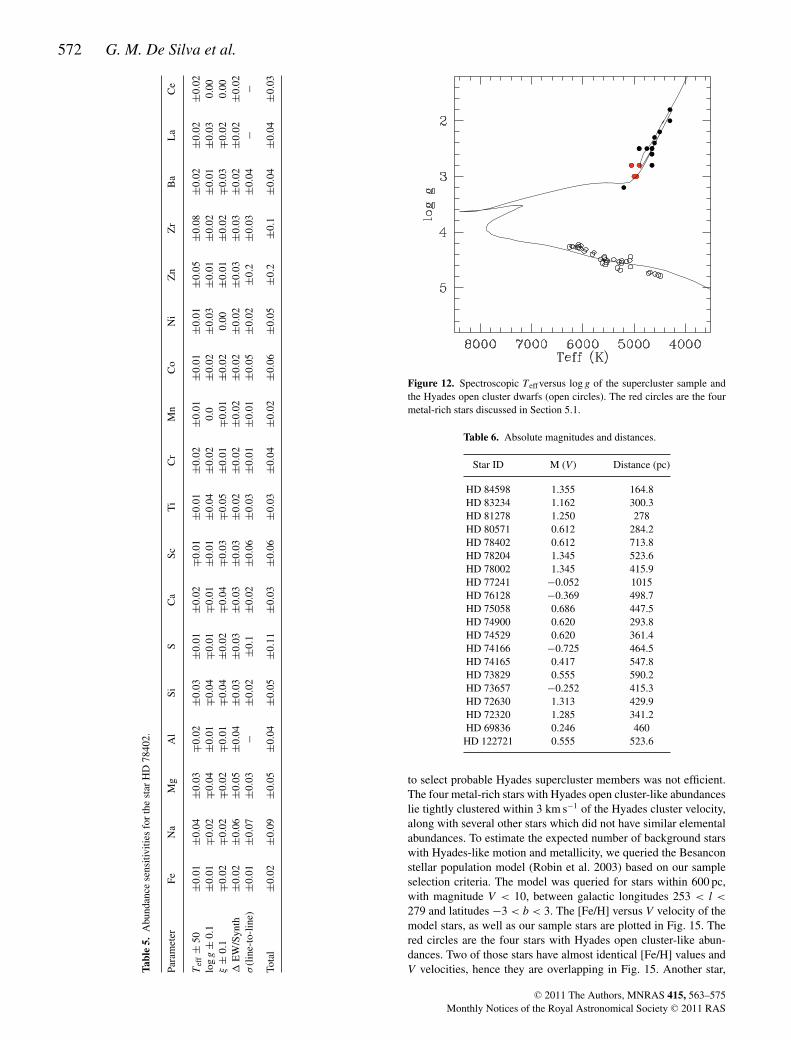
Figure 12. Spectroscopic Teffversus log g of the supercluster sample andthe Hyades open cluster dwarfs (open circles). The red circles are the fourmetal-rich stars discussed in Section 5.1.
Table 6. Absolute magnitudes and distances.
Star ID M (V) Distance (pc)
HD 84598 1.355 164.8HD 83234 1.162 300.3HD 81278 1.250 278HD 80571 0.612 284.2HD 78402 0.612 713.8HD 78204 1.345 523.6HD 78002 1.345 415.9HD 77241 −0.052 1015HD 76128 −0.369 498.7HD 75058 0.686 447.5HD 74900 0.620 293.8HD 74529 0.620 361.4HD 74166 −0.725 464.5HD 74165 0.417 547.8HD 73829 0.555 590.2HD 73657 −0.252 415.3HD 72630 1.313 429.9HD 72320 1.285 341.2HD 69836 0.246 460
HD 122721 0.555 523.6
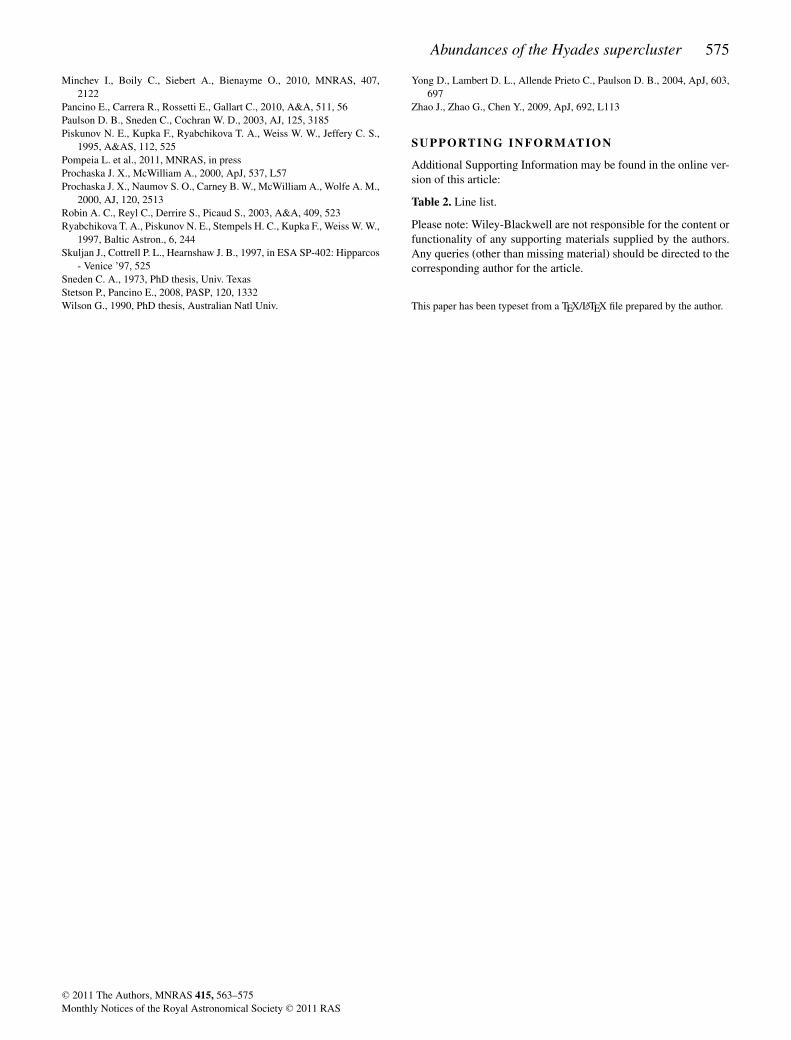
to select probable Hyades supercluster members was not efficient.The four metal-rich stars with Hyades open cluster-like abundanceslie tightly clustered within 3 km s−1 of the Hyades cluster velocity,along with several other stars which did not have similar elementalabundances. To estimate the expected number of background starswith Hyades-like motion and metallicity, we queried the Besanconstellar population model (Robin et al. 2003) based on our sampleselection criteria. The model was queried for stars within 600 pc,with magnitude V < 10, between galactic longitudes 253 < l <
279 and latitudes −3 < b < 3. The [Fe/H] versus V velocity of themodel stars, as well as our sample stars are plotted in Fig. 15. Thered circles are the four stars with Hyades open cluster-like abun-dances. Two of those stars have almost identical [Fe/H] values andV velocities, hence they are overlapping in Fig. 15. Another star,
C© 2011 The Authors, MNRAS 415, 563–575Monthly Notices of the Royal Astronomical Society C© 2011 RAS

Abundances of the Hyades supercluster 573
Figure 13. The location of the sample stars in X-Y and X-Z plane, where X-Yis in the Galactic plane. The open circle represents the Hyades open clusterand the red stars are the four metal-rich stars with Hyades-like abundancesdiscussed in Section 5.1.
HD 77241, also lies close to the open cluster velocity. Despitehaving a similarly high metallicity, this star did not have similarabundance levels across the other studied elements. Enforcing boththe kinematical and chemical tagging criteria, we confirm that thesefour stars are likely to be former members of the Hyades opencluster.
6 C O N C L U S I O N
We have obtained high-resolution spectra of 45 proposed Hyadessupercluster members, which were selected based on early estimatesof the targets’ metallicity and position along the expected dispersionorbit of the Hyades supercluster, as well as F-type Hipparcos stars
from Eggen (1998). The observing results showed that only 26 starswere suitable for a detailed abundance analysis. The abundancedistribution showed a double-peaked distribution, with two clearclustering of stars – one around solar metallicity and the otheraround Hyades open cluster metallicity.
Four of the stars with Hyades open cluster metallicity also sharedsimilar abundance patterns, with the star-to-star scatter being within0.05 across all elements except for Na, S, Sc, Co, Zn and Zr. Pos-sible deviations due to stellar evolutionary effects as well as largerabundance uncertainty in this analysis make these six elements lessreliable for chemical tagging than the other elements analysed inthis study. Further, the four stars’ abundances for Ba, La and Cematch the abundances observed in the Hyades open cluster. Theseheavy elements are produced predominantly via the slow neutroncapture process, where the likely sites of formation are Type II su-pernova explosion. Therefore, the heavy element abundances arenot modified during the lifetime of the giant and subgiant stars wehave studied, and the measured abundances should represent theabundance levels laid out during the stars’ birth in a protoclustercloud.
Examining the space velocities of our targets revealed that oursample stars are within ±20 km s−1 of the Hyades open cluster V ve-locity. Those velocity outliers are most likely to be non-members ofthe kinematically defined Hyades supercluster. Applying both kine-matical and chemical criteria, we find that four stars are likely dis-persed members from an earlier Hyades star-forming event. Thesefour stars share Hyades-like kinematics and chemical abundances,but spatially they are located away from the Hyades open cluster.Therefore, these four stars are clearly supercluster members ratherthan open cluster members. The rest of the stars are either non-members of the supercluster or they are kinematically membersof a comoving group, but are otherwise unrelated to the Hyadesstar-forming event.
The presented results are primarily a test of the Hyades clus-ter disruption hypothesis of Wilson (1990). We find ∼15 per centof his sample are supercluster members based on kinematics andchemical abundances. Our study only included one slow rotatingstar from Eggen (1998), hence we are unable to test the validity of
Table 7. Radial and Galactic space velocities.
Star ID RV (km s−1) RV error U (km s−1) U error V (km s−1) V error W (km s−1) W error
HD 84598 1.07 0.71 15.05 0.51 4.41 0.72 1.81 0.59HD 83234 11.42 0.51 −8.68 13.42 −8.78 1.77 16.02 9.15HD 81278 20.18 0.54 −26.87 10.28 −17.93 0.72 26.15 10.06HD 80571 15.13 0.48 −77.95 35.93 −8.63 1.14 25.25 35.33HD 78402 18.12 0.54 59.80 35.68 −13.41 1.02 32.01 39.13HD 78204 19.51 0.68 −37.43 20.28 −15.27 0.89 10.43 21.79HD 78002 25.39 0.61 −22.19 15.41 −17.71 0.83 5.41 17.17HD 77241 18.74 0.58 −64.74 29.73 −12.43 1.73 17.54 33.33HD 76128 40.41 0.57 3.98 11.96 −33.82 1.28 32.03 18.06HD 75058 27.90 0.49 10.71 29.27 −26.65 3.56 −54.89 36.91HD 74900 21.12 0.48 −18.49 20.31 −12.29 2.58 −13.73 25.69HD 74529 11.50 0.55 16.59 19.29 −4.19 2.71 −39.80 24.88HD 74166 18.15 0.66 −4.18 5.47 −11.01 1.06 6.11 6.61HD 74165 24.77 0.59 −74.18 43.84 −6.30 6.59 −26.33 57.07HD 73829 17.43 0.53 39.52 14.36 −16.36 2.34 11.66 18.65HD 73657 28.84 0.59 −19.58 6.99 −19.51 1.25 11.73 9.31HD 72630 25.62 0.60 −24.37 17.40 −14.92 3.08 13.99 11.47HD 72320 27.73 0.61 −1.57 3.95 −20.85 0.99 3.87 5.54HD 69836 38.72 0.64 −62.88 17.95 −13.40 5.28 10.21 27.25HD 122721 −28.80 0.47 −43.79 36.83 −21.92 32.68 −9.04 14.38
C© 2011 The Authors, MNRAS 415, 563–575Monthly Notices of the Royal Astronomical Society C© 2011 RAS
574 G. M. De Silva et al.
Figure 14. Galactic V velocity versus U velocity for the sample stars. Redstars are the four metal-rich stars discussed in Section 5.1. The dotted linesmark the Hyades open cluster velocities.
Figure 15. Galactic V velocity versus [Fe/H] for the sample stars. Red starsare the four metal-rich stars discussed in Section 5.1. The grey crosses arethe output from the Besancon stellar population model for stars based onour selection criteria.
his sample. From our results, we conclude that the kinematicallydefined Hyades supercluster is made up at least partly of dispersedHyades cluster stars. Recently we became aware of a similar studyby Pompeia et al. (2011) who also carried out a spectroscopic anal-ysis of other members of the Hyades supercluster, and their resultsare consistent with our findings. Further studies of the Hyades su-percluster, especially targeting kinematically defined dwarf stellarmembers, are encouraged.
AC K N OW L E D G M E N T S
GMDS would like to thank F. Primas for the use of the stellarparameters for the Hyades open cluster dwarfs based on a newHyades open cluster abundance analysis in preparation.
REFERENCES
Allende Prieto C., Barklem P. S., Lambert D. L., Cunha K., 2004, A&A,420, 183
Alonso A., Arribas S., Martinez-Roger C., 1996, A&A, 140, 261Antoja T., Figueras F., Fernandez D., Torra J., 2008, A&A, 490, 135Asplund M., Grevesse N., Sauval A., Scott P., 2009, ARA&A, 47, 481Bensby T., Feltzing S., Lundstrom I., 2003, A&A, 410, 527Bensby T., Feltzing S., Lundstrom I., Ilyin I., 2005, A&A, 433, 185Bensby T., Oey M. S., Feltzing S., Gustafsson B., 2007, ApJ, 655, 89Blackwell D. E., Ibbetson P. A., Petford A. D., Shallis M. J., 1979a, MNRAS,
186, 633Blackwell D. E., Petford A. D., Shallis M. J., 1979b, MNRAS, 186,
657Blackwell D. E., Lynas-Gray A. E., Smith G., 1995, A&A, 296, 217Bovy J., Hogg D. W., 2010, ApJ, 717, 617Bovy J., Hogg D. W., Roweis S. T., 2009, ApJ, 700, 1794Bubar E. J., King J. R., 2010, AJ, 140, 293Castelli F., Gratton R. G., Kurucz R. L., 1997, A&A, 318, 841De Silva G. M., Sneden C., Paulson D. B., Asplund M., Bland-Hawthorn J.,
Bessell M. S., Freeman K. C., 2006, AJ, 131, 455De Silva G. M., Freeman K. C., Bland-Hawthorn J., Asplund M., Bessell
M. S., 2007a, AJ, 133, 694De Silva G. M., Freeman K. C., Asplund M., Bland-Hawthorn J., Bessell
M., Collet R., 2007b, AJ, 133, 1161De Silva G. M., Gibson B. K., Lattanzio J., Asplund M., 2009, A&A, 500,
L25Dehnen W., 1998, AJ, 115, 2384Eggen O. J., 1958, MNRAS, 118, 154Eggen O. J., 1959a, Observatory, 79, 88Eggen O. J., 1959b, Observatory, 79, 182Eggen O. J., 1965, Observatory, 85, 191Eggen O. J., 1969, PASP, 81, 553Eggen O. J., 1970, PASP, 82, 99Eggen O. J., 1971, PASP, 83, 271Eggen O. J., 1974, PASP, 86, 162Eggen O. J., 1977, ApJ, 215, 812Eggen O. J., 1978a, ApJ, 222, 191Eggen O. J., 1978b, ApJ, 222, 203Eggen O. J., 1983, AJ, 88, 813Eggen O. J., 1992a, AJ, 104, 1906Eggen O. J., 1992b, AJ, 104, 1482Eggen O. J., 1996, AJ, 111, 1615Eggen O. J., 1998, AJ, 115, 2453Famaey B., Jorissen A., Luri X., Mayor M., Udry S., Dejonghe H., Turon
C., 2005, A&A, 430, 165Feltzing S., Holmberg J., 2000, A&A, 357, 153Freeman K., Bland-Hawthorn J., 2002, ARA&A, 40, 487Girardi L., Bressan A., Bertelli G., Chiosi C., 2000, A&AS, 141, 371Gratton R. G., Bonanno G., Claudi R. U., Cosentino R., Desidera S., Lu-
catello S., Scuderi S., 2001, A&A, 377, 123Helmi A., Navarro J. F., Nordstrom B., Holmberg J., Abadi M. G., Steinmetz
M., 2006, MNRAS, 365, 1309Houk N., 1982, Michigan Cat. Two-dimensional Spectral Types HD Star, 3,
12Kupka F., Piskunov N. E., Ryabchikova T. A., Stempels H. C., Weiss W. W.,
1999, A&AS, 138, 119Kupka F., Ryabchikova T. A., Piskunov N. E., Stempels H. C., Weiss W. W.,
2000, Baltic Astron., 9, 590McWilliam A., Preston G. W., Sneden C., Searle L., 1995, AJ, 109,
2757
C© 2011 The Authors, MNRAS 415, 563–575Monthly Notices of the Royal Astronomical Society C© 2011 RAS
Abundances of the Hyades supercluster 575
Minchev I., Boily C., Siebert A., Bienayme O., 2010, MNRAS, 407,2122
Pancino E., Carrera R., Rossetti E., Gallart C., 2010, A&A, 511, 56Paulson D. B., Sneden C., Cochran W. D., 2003, AJ, 125, 3185Piskunov N. E., Kupka F., Ryabchikova T. A., Weiss W. W., Jeffery C. S.,
1995, A&AS, 112, 525Pompeia L. et al., 2011, MNRAS, in pressProchaska J. X., McWilliam A., 2000, ApJ, 537, L57Prochaska J. X., Naumov S. O., Carney B. W., McWilliam A., Wolfe A. M.,
2000, AJ, 120, 2513Robin A. C., Reyl C., Derrire S., Picaud S., 2003, A&A, 409, 523Ryabchikova T. A., Piskunov N. E., Stempels H. C., Kupka F., Weiss W. W.,
1997, Baltic Astron., 6, 244Skuljan J., Cottrell P. L., Hearnshaw J. B., 1997, in ESA SP-402: Hipparcos
- Venice ’97, 525Sneden C. A., 1973, PhD thesis, Univ. TexasStetson P., Pancino E., 2008, PASP, 120, 1332Wilson G., 1990, PhD thesis, Australian Natl Univ.
Yong D., Lambert D. L., Allende Prieto C., Paulson D. B., 2004, ApJ, 603,697
Zhao J., Zhao G., Chen Y., 2009, ApJ, 692, L113
SUPPORTI NG INFORMATI ON
Additional Supporting Information may be found in the online ver-sion of this article:
Table 2. Line list.
Please note: Wiley-Blackwell are not responsible for the content orfunctionality of any supporting materials supplied by the authors.Any queries (other than missing material) should be directed to thecorresponding author for the article.
This paper has been typeset from a TEX/LATEX file prepared by the author.
C© 2011 The Authors, MNRAS 415, 563–575Monthly Notices of the Royal Astronomical Society C© 2011 RAS