high reliability power system design - ieee sección · pdf filehigh reliability power...
TRANSCRIPT

High ReliabilityHigh ReliabilityPower System DesignPower System Design
Keene M. Matsuda, P.E.Regional Electrical Manager
Senior Member IEEEIEEE/PES Distinguished Lecturer
Buenos Aires, ArgentinaJune 25 & 26, 2009
Page - 2
Redundant Power Trains for Increased Reliability
The most basic driving element in increasing power system reliability is to have redundant or alternate power trains to power the end load device should a particular piece of the power system fail or be unavailable
The unavailability of equipment can a simple failure, but also planned maintenance
Page - 3
Redundant Power Trains for Increased Reliability
The most common method by far is designing a power system with two power trains, A and B
Such an A and B system then requires a second source of power
Could be a second utility source, or a standby diesel engine-generator or other source of power
Page - 4
Failure Analysis – Single Point of Failure
Failure analysis is driven by the concept of “single points of failure”
A single point of failure is a single point in the power system beyond which the power system is down from the failed piece of equipment
Example is the single transformer, or MCC, etc. in the above example
Page - 5
Failure Analysis – Coincident Damage
A secondary failure analysis concept is “coincident damage”
Coincident damage is where the failure of one piece of equipment damages a piece of the alternate equipment power train
Example is a pull box with both A circuit and B circuit cables
Should the A cables explode during fault conditions, the arc flash could easily damage the B cables in close proximity
Page - 6
Limitations of Redundancy
Easy to keep adding equipment to power system to increase reliability
Also adding cost
Degree of final power system redundancy depends on owner’s available budget
Simply adding more power trains results in diminishing returns on investment, or asymptotic curve
Page - 7
Limitations of Redundancy
The driving factor for owner is what value is placed on continued operation
Or can be how catastrophic an outage is to the plant and for how long
If the plant can be down without great adverse impact, then adding costs to the power system for increased reliability is not necessary
This is rarely the case
Page - 8
Limitations of Redundancy
So, we have to find an acceptable common ground to establish design criteria
A hospital is one obvious example where reliability requirements are very high
Another example is a highway tunnel where the public could be at risk should the power system fail
Page - 9
Page - 10
Reliability Calculation for Power Systems
Reliability calculation can be performed on any power system
Most useful when comparing the reliability index between different systems
Page - 11
Reliability Calculation for Power Systems
Gastonia wanted to improve reliability and safety of existing power system
We originally identified about 20 alternatives
Narrowed down to about 6 alternatives
Added slight variations to 6 alternatives for a total of 16 options representing alternative paths
Calculated reliability index for all 16 options
Provided cost estimate for each option to assign “value” to reliability improvements
Page - 12
Reliability Calculation for Power Systems
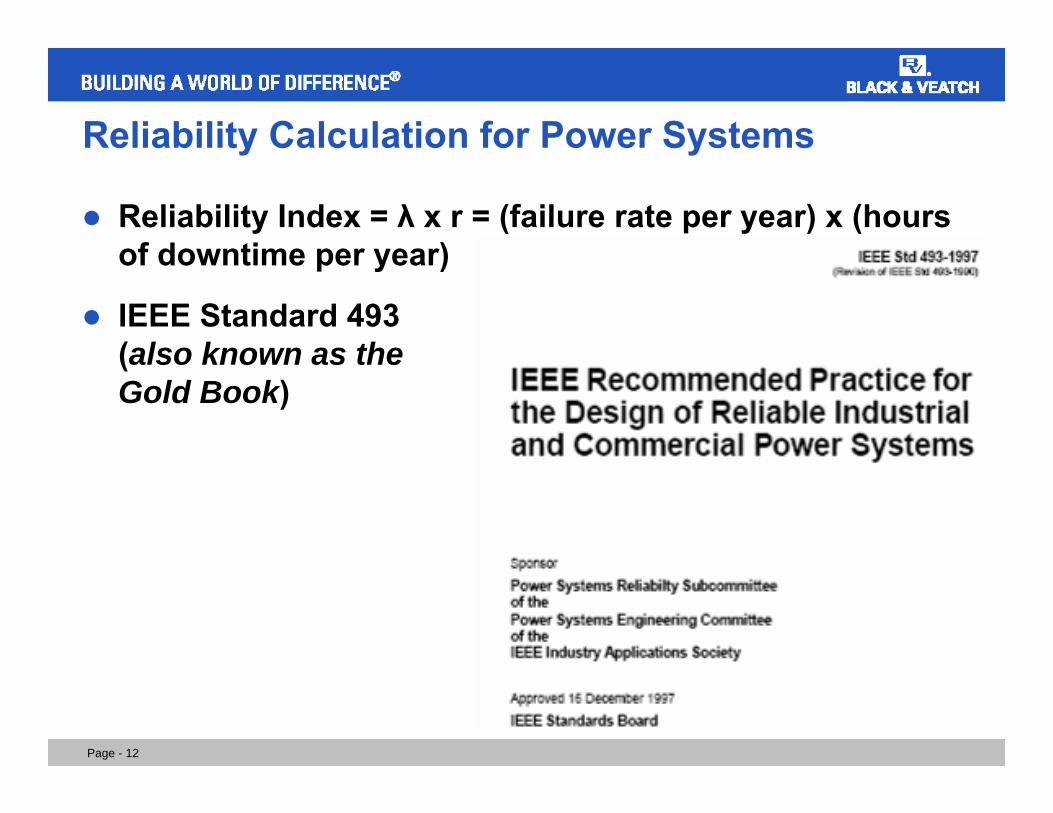
Reliability Index = λ x r = (failure rate per year) x (hours of downtime per year)
IEEE Standard 493 (also known as theGold Book)
Page - 13
Reliability Calculation for Power Systems
For reliability values for typical electrical equipment in a power system:
Used IEEE 493, Table 7-1, page 105: Reliability Data of Industrial Plants, for transformers, breakers, cables, swgr, gens, etc.
Data represents many years of compiling data by IEEE on failure types and failure rates
Data is updated periodically
For comparison purposes, important to be consistent in use of reliability data
Page - 14
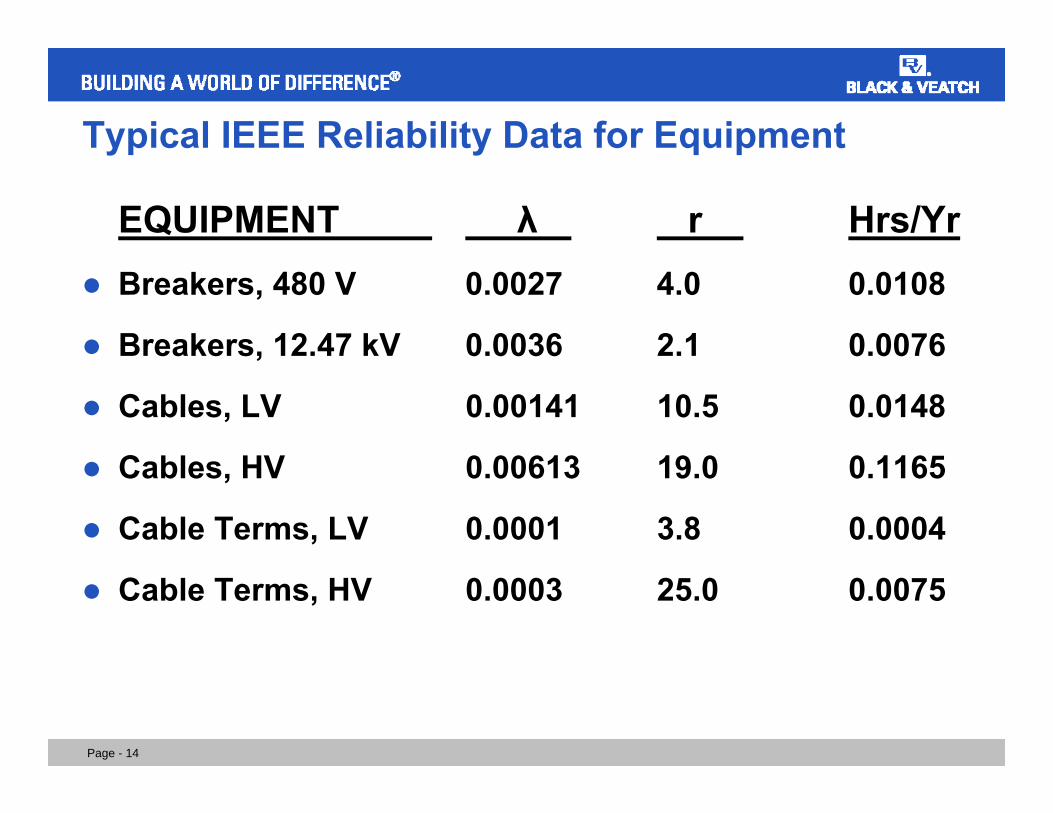
Typical IEEE Reliability Data for Equipment
EQUIPMENT λ r Hrs/YrBreakers, 480 V 0.0027 4.0 0.0108
Breakers, 12.47 kV 0.0036 2.1 0.0076
Cables, LV 0.00141 10.5 0.0148
Cables, HV 0.00613 19.0 0.1165
Cable Terms, LV 0.0001 3.8 0.0004
Cable Terms, HV 0.0003 25.0 0.0075
Page - 15
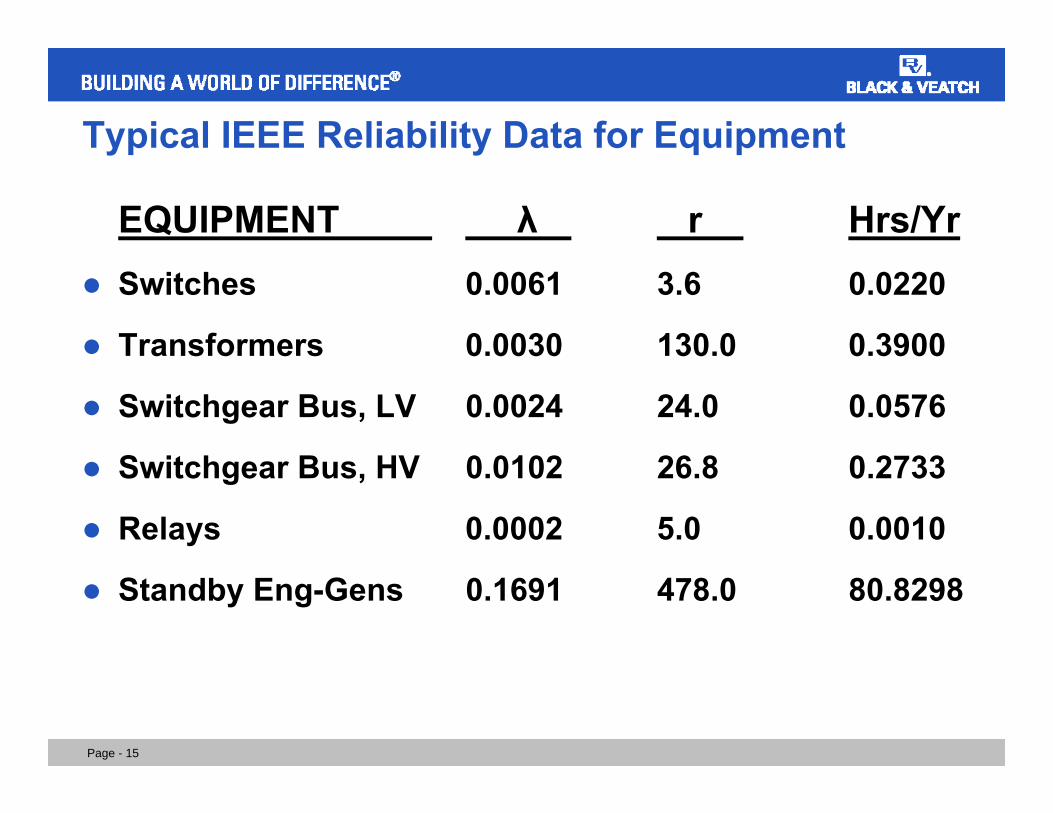
Typical IEEE Reliability Data for Equipment
EQUIPMENT λ r Hrs/YrSwitches 0.0061 3.6 0.0220
Transformers 0.0030 130.0 0.3900
Switchgear Bus, LV 0.0024 24.0 0.0576
Switchgear Bus, HV 0.0102 26.8 0.2733
Relays 0.0002 5.0 0.0010
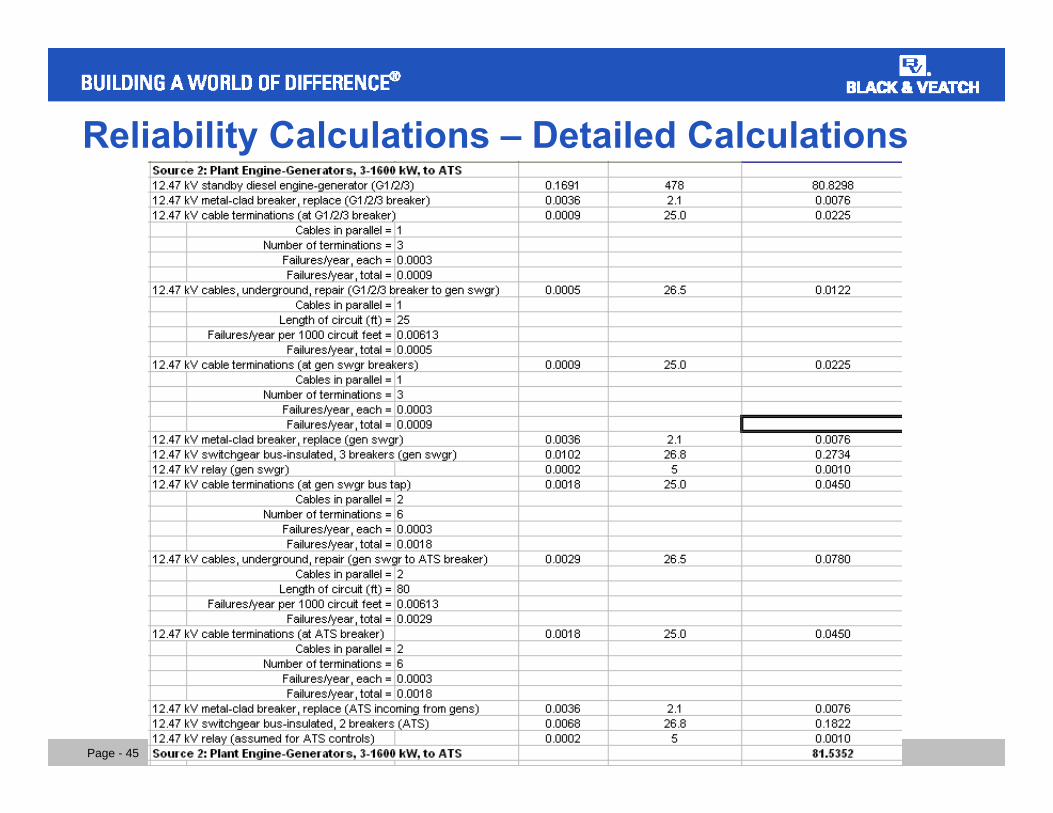
Standby Eng-Gens 0.1691 478.0 80.8298
Page - 16
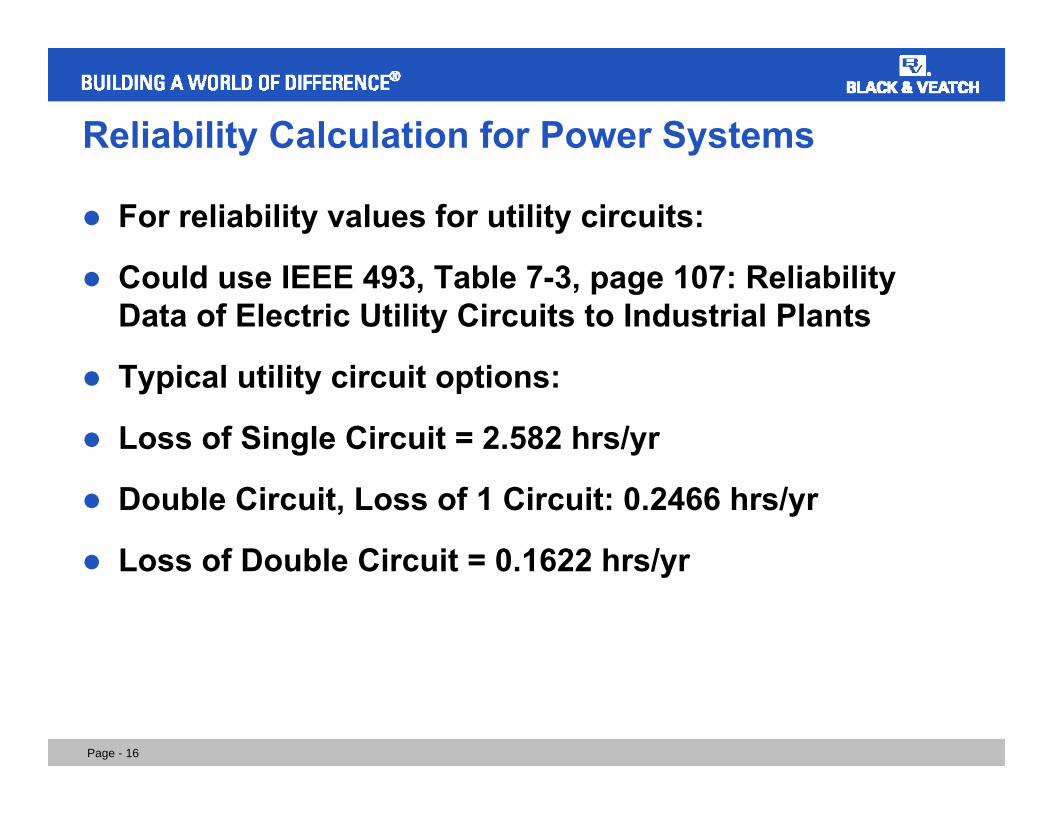
Reliability Calculation for Power Systems
For reliability values for utility circuits:
Could use IEEE 493, Table 7-3, page 107: Reliability Data of Electric Utility Circuits to Industrial Plants
Typical utility circuit options:
Loss of Single Circuit = 2.582 hrs/yr
Double Circuit, Loss of 1 Circuit: 0.2466 hrs/yr
Loss of Double Circuit = 0.1622 hrs/yr
Page - 17
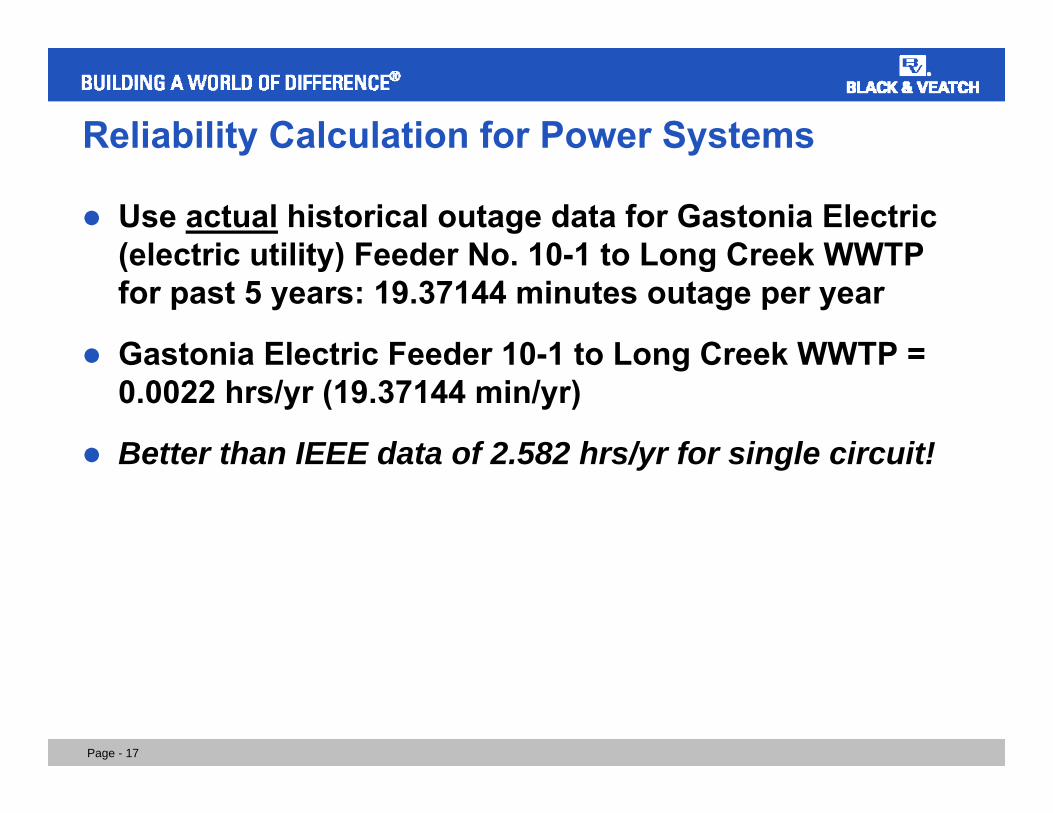
Reliability Calculation for Power Systems
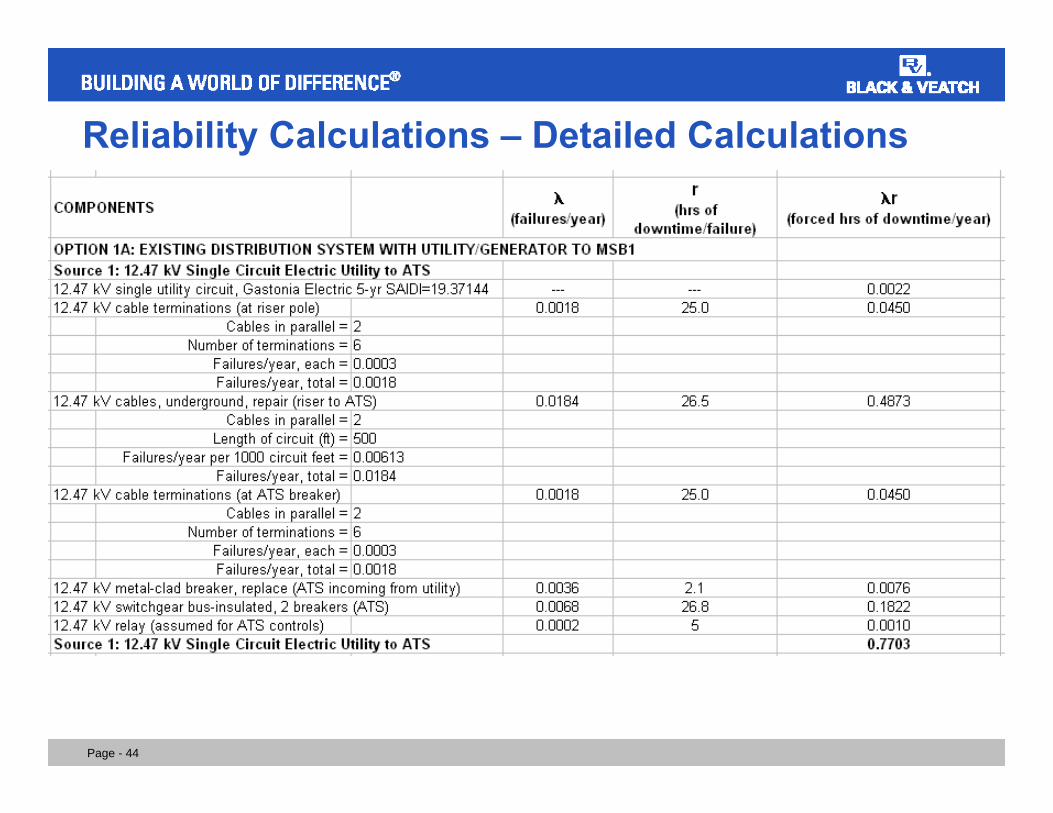
Use actual historical outage data for Gastonia Electric (electric utility) Feeder No. 10-1 to Long Creek WWTP for past 5 years: 19.37144 minutes outage per year
Gastonia Electric Feeder 10-1 to Long Creek WWTP = 0.0022 hrs/yr (19.37144 min/yr)
Better than IEEE data of 2.582 hrs/yr for single circuit!
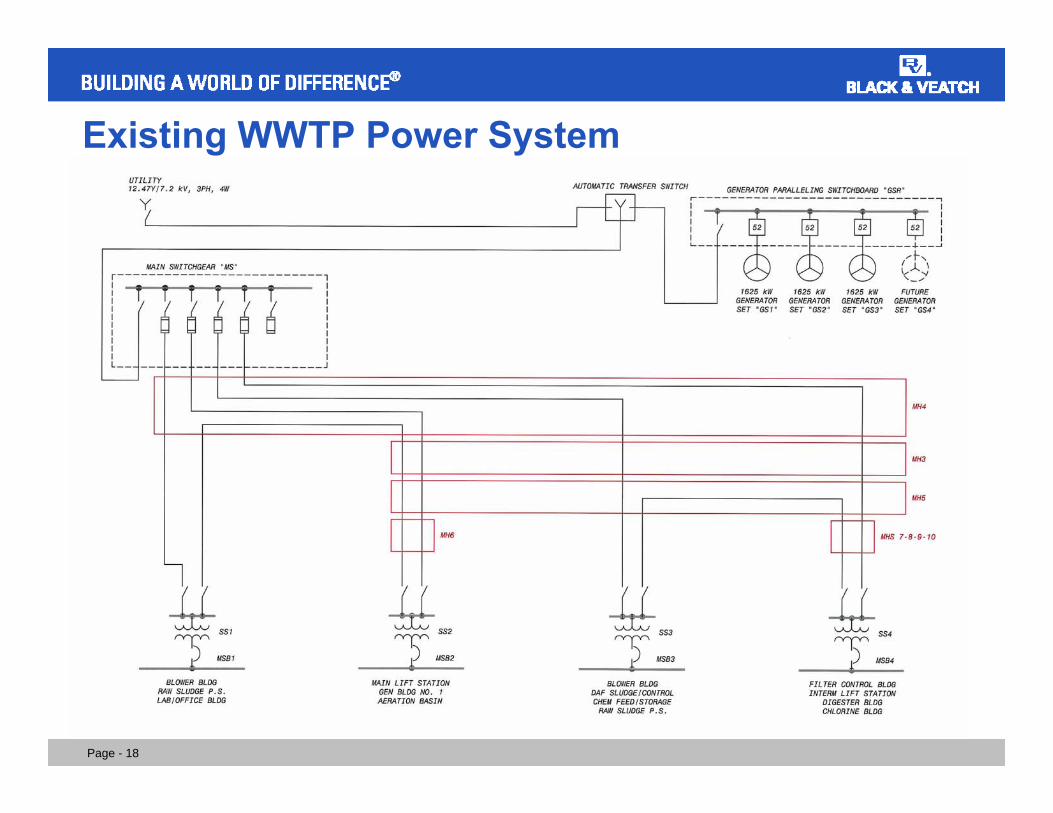
Page - 18
Existing WWTP Power System
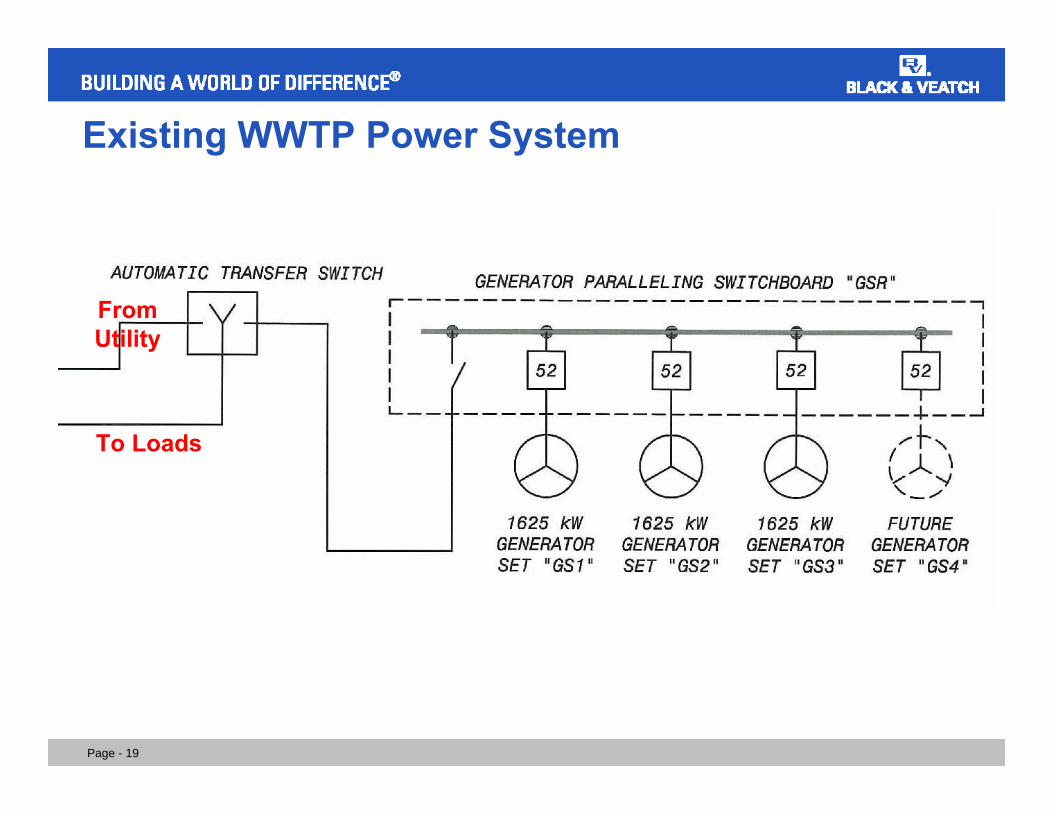
Page - 19
Existing WWTP Power System
FromUtility
To Loads
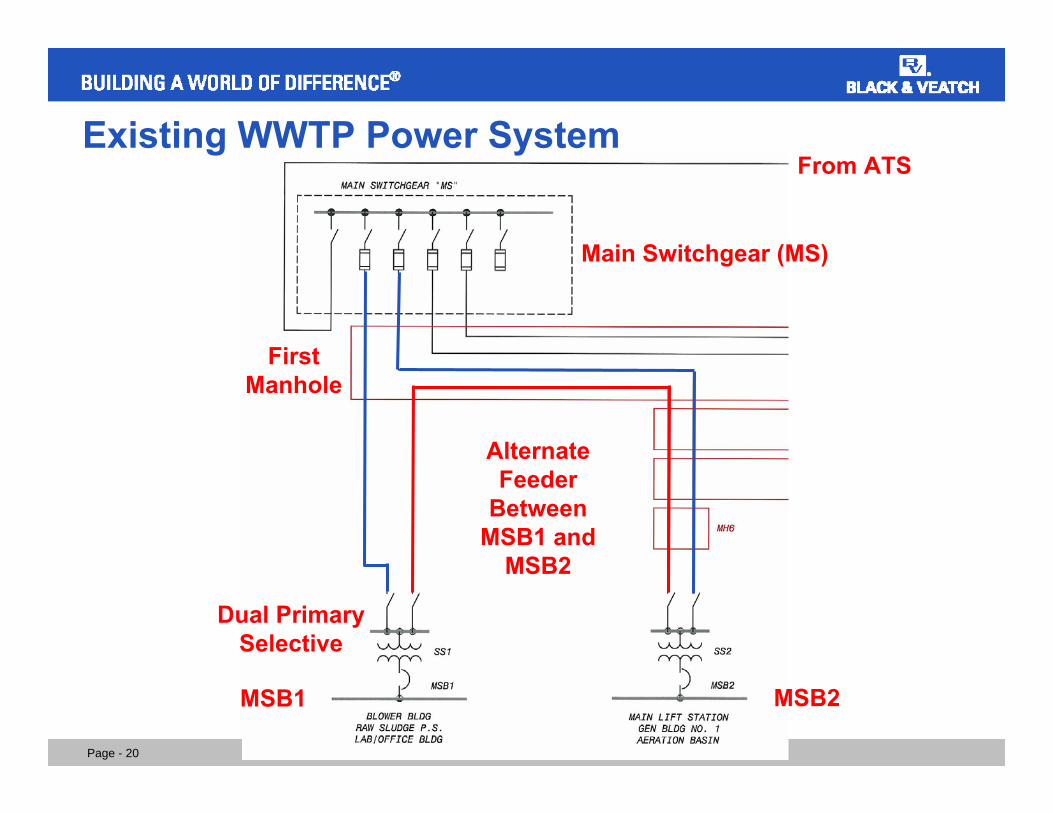
Page - 20
Existing WWTP Power SystemFrom ATS
First Manhole
MSB1 MSB2
Dual Primary Selective
Alternate Feeder
Between MSB1 and
MSB2
Main Switchgear (MS)
Page - 21
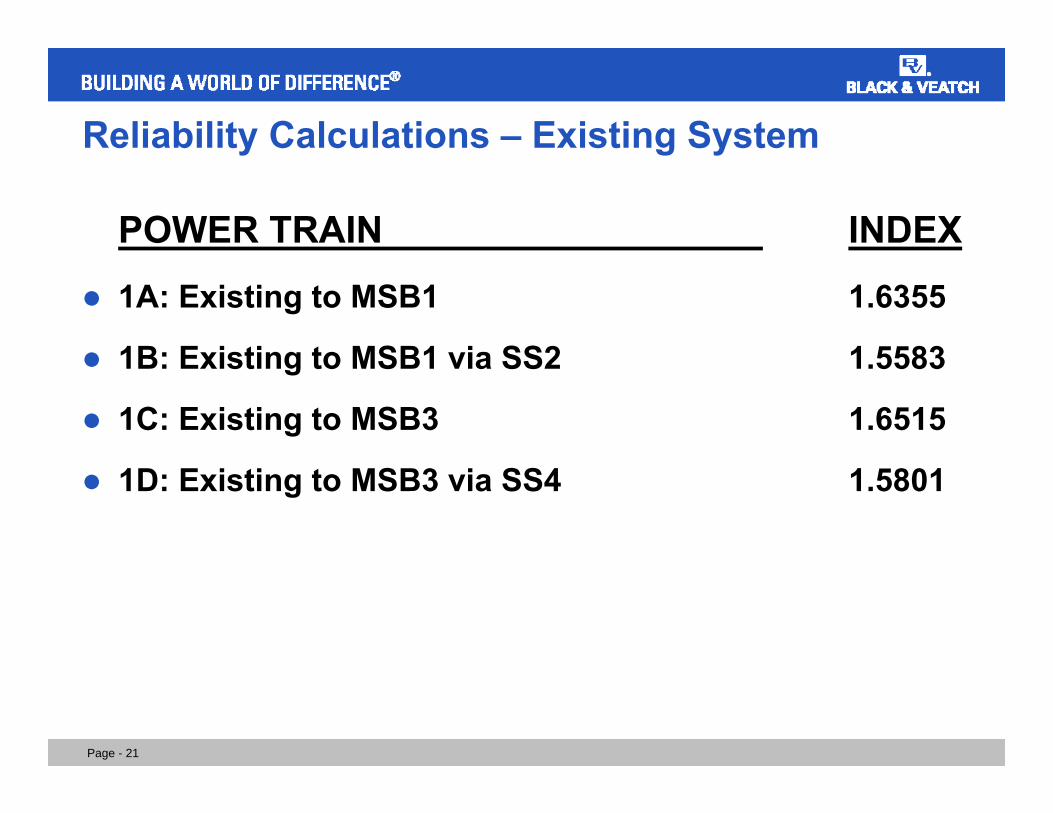
Reliability Calculations – Existing System
POWER TRAIN INDEX
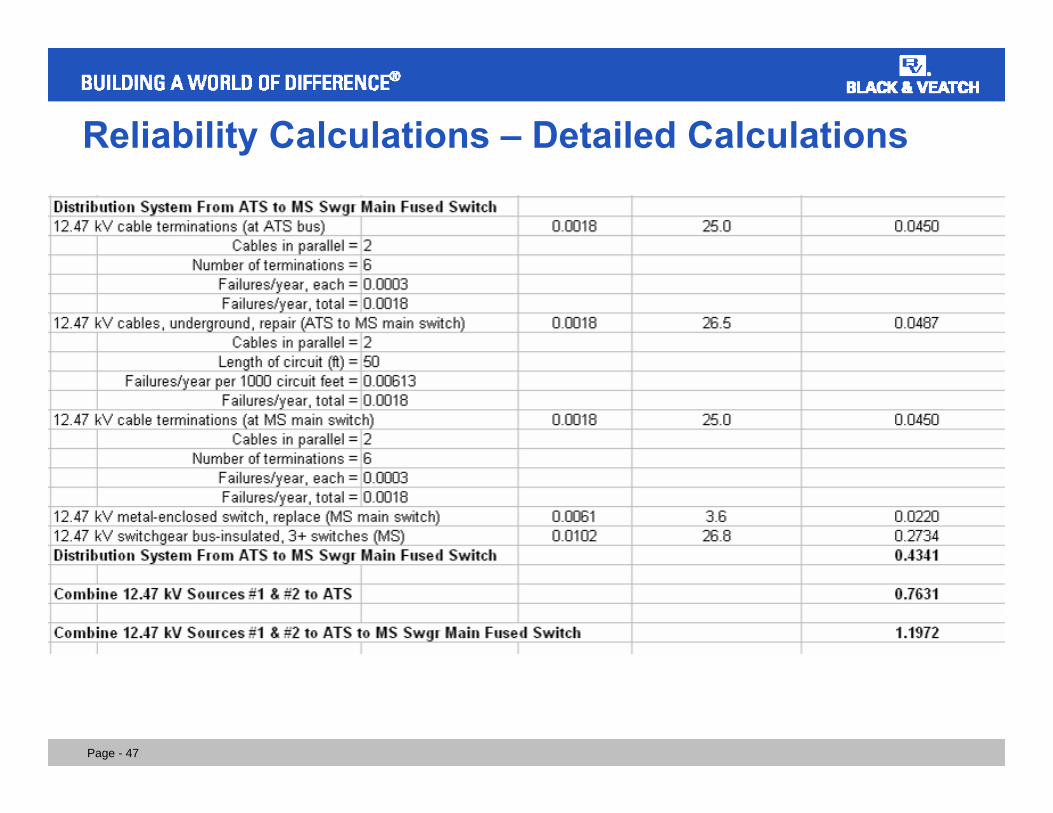
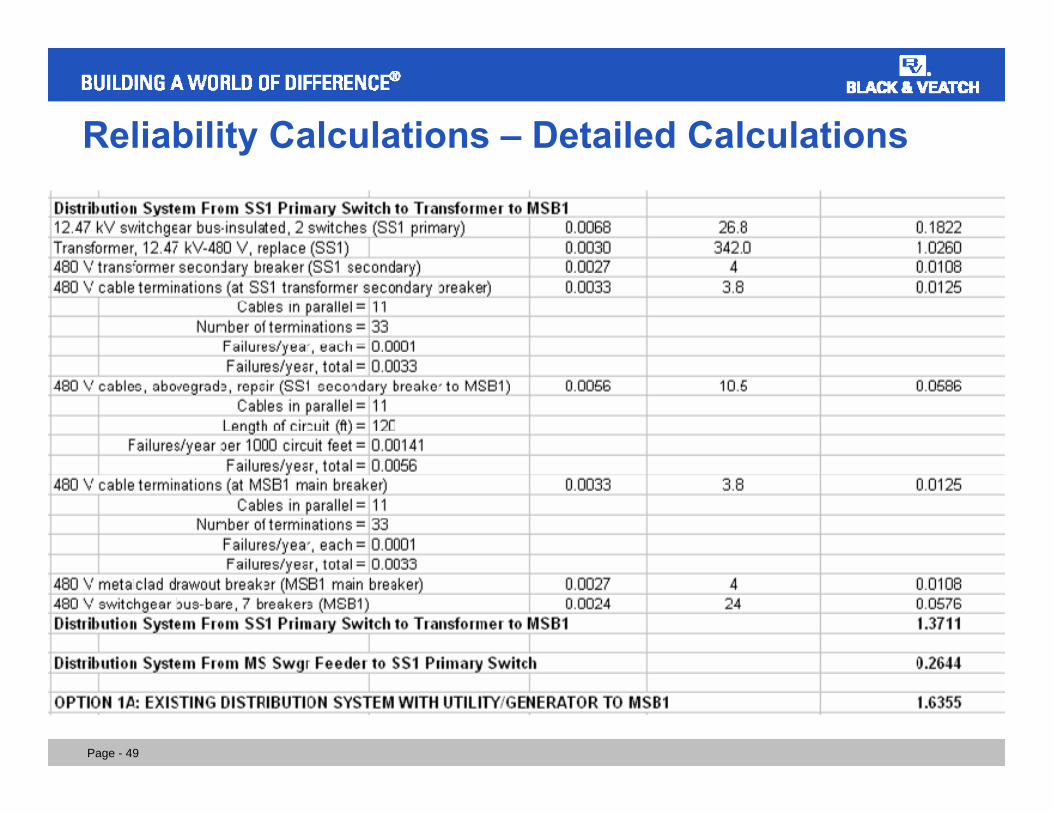
1A: Existing to MSB1 1.6355
1B: Existing to MSB1 via SS2 1.5583
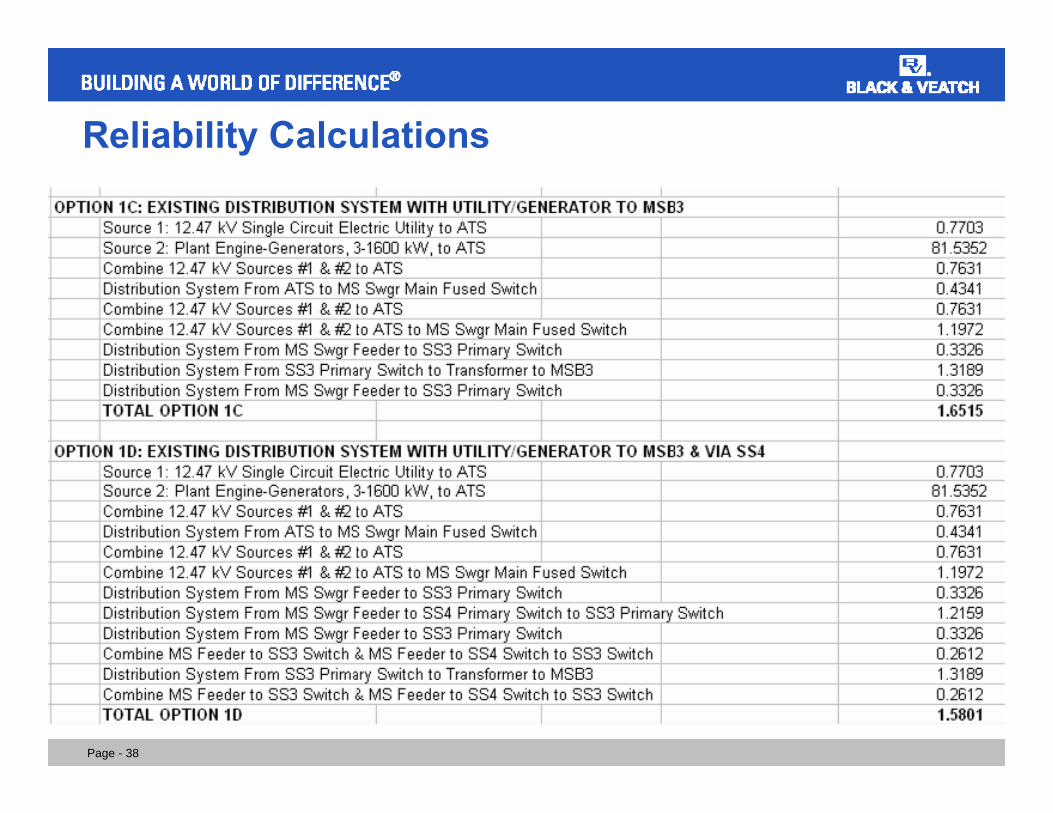
1C: Existing to MSB3 1.6515
1D: Existing to MSB3 via SS4 1.5801
Page - 22
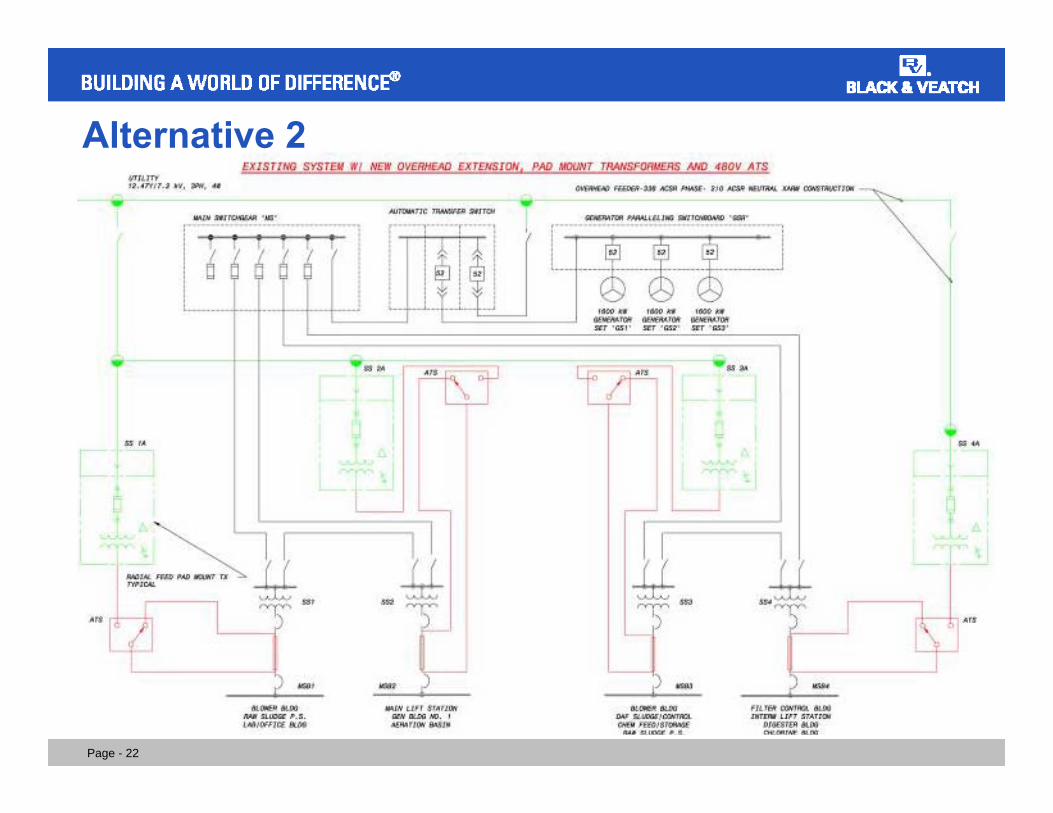
Alternative 2
Page - 23
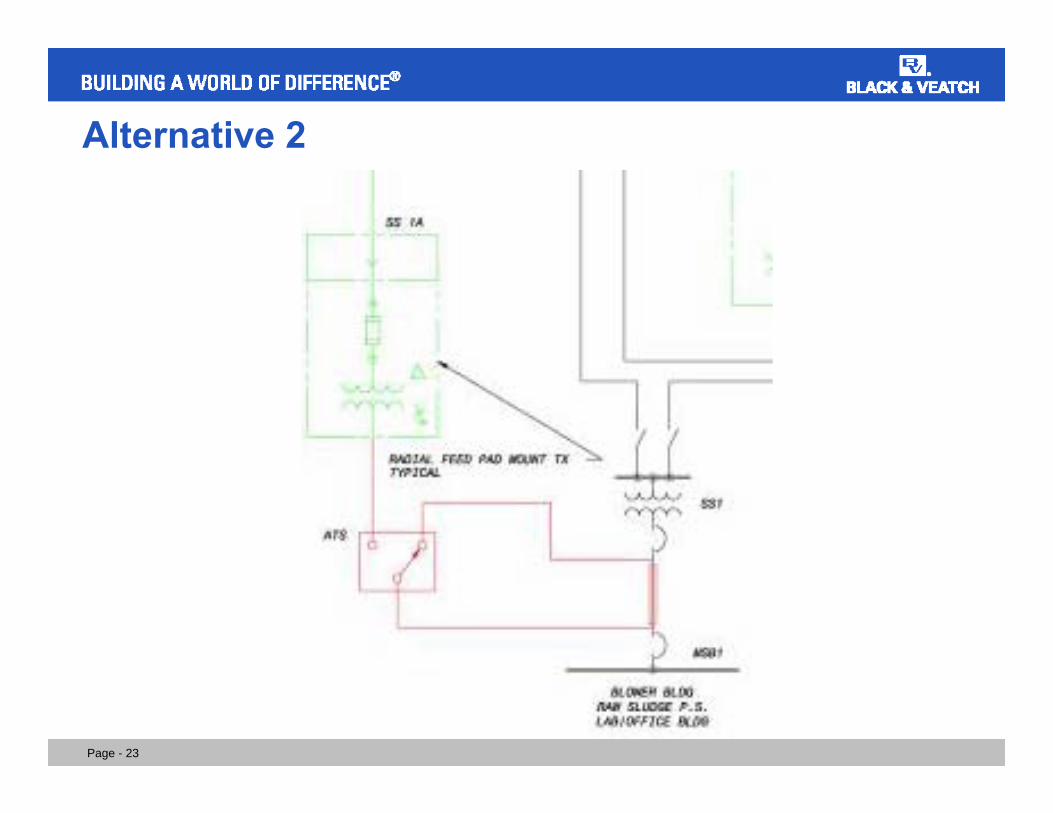
Alternative 2
Page - 24
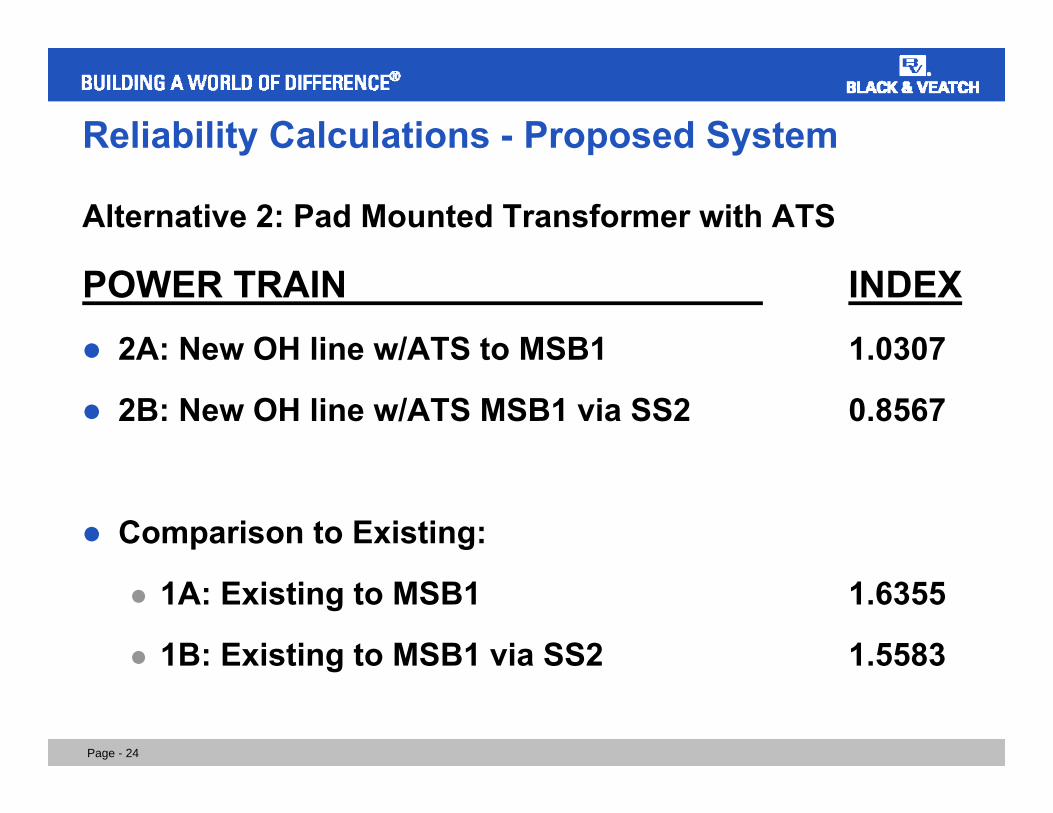
Reliability Calculations - Proposed System
Alternative 2: Pad Mounted Transformer with ATS
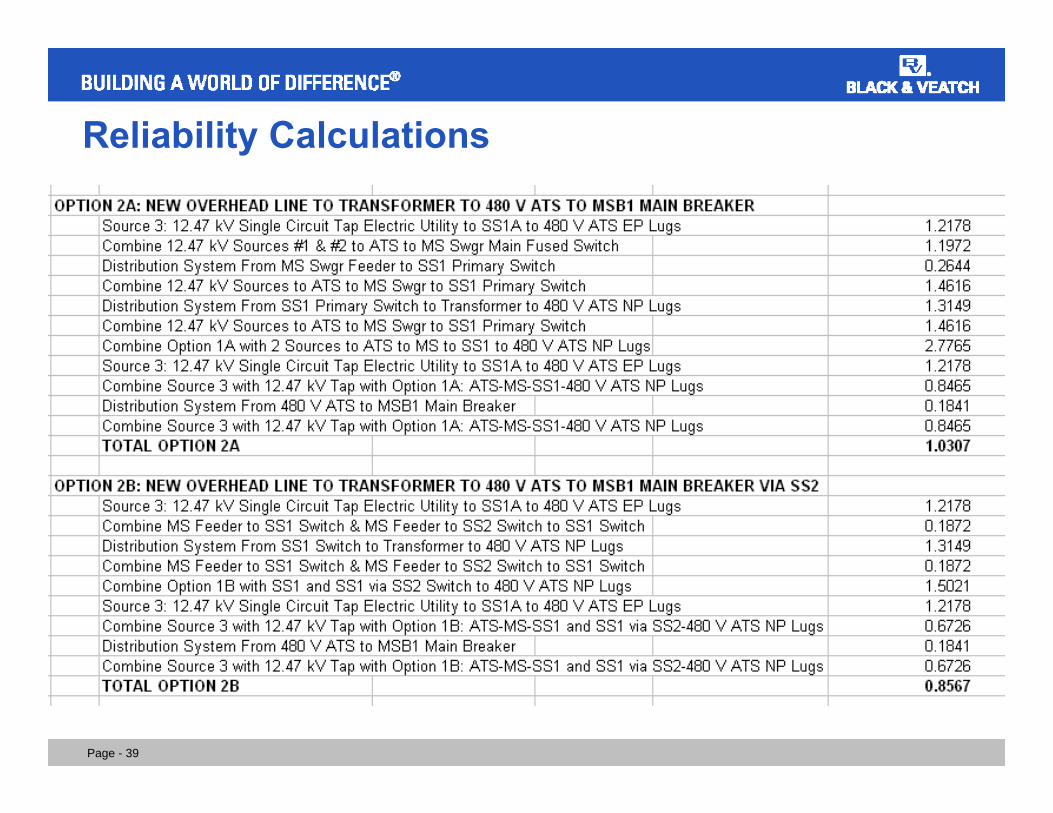
POWER TRAIN INDEX2A: New OH line w/ATS to MSB1 1.0307
2B: New OH line w/ATS MSB1 via SS2 0.8567
Comparison to Existing:
1A: Existing to MSB1 1.6355
1B: Existing to MSB1 via SS2 1.5583
Page - 25
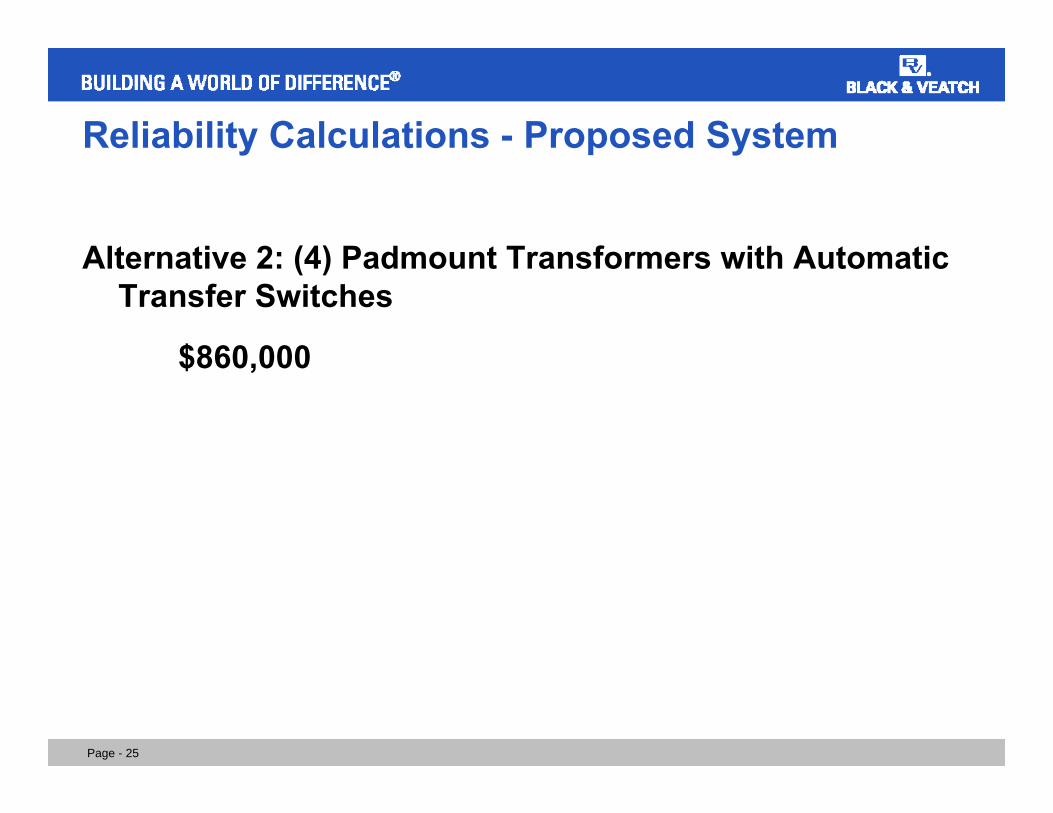
Reliability Calculations - Proposed System
Alternative 2: (4) Padmount Transformers with Automatic Transfer Switches
$860,000
Page - 26
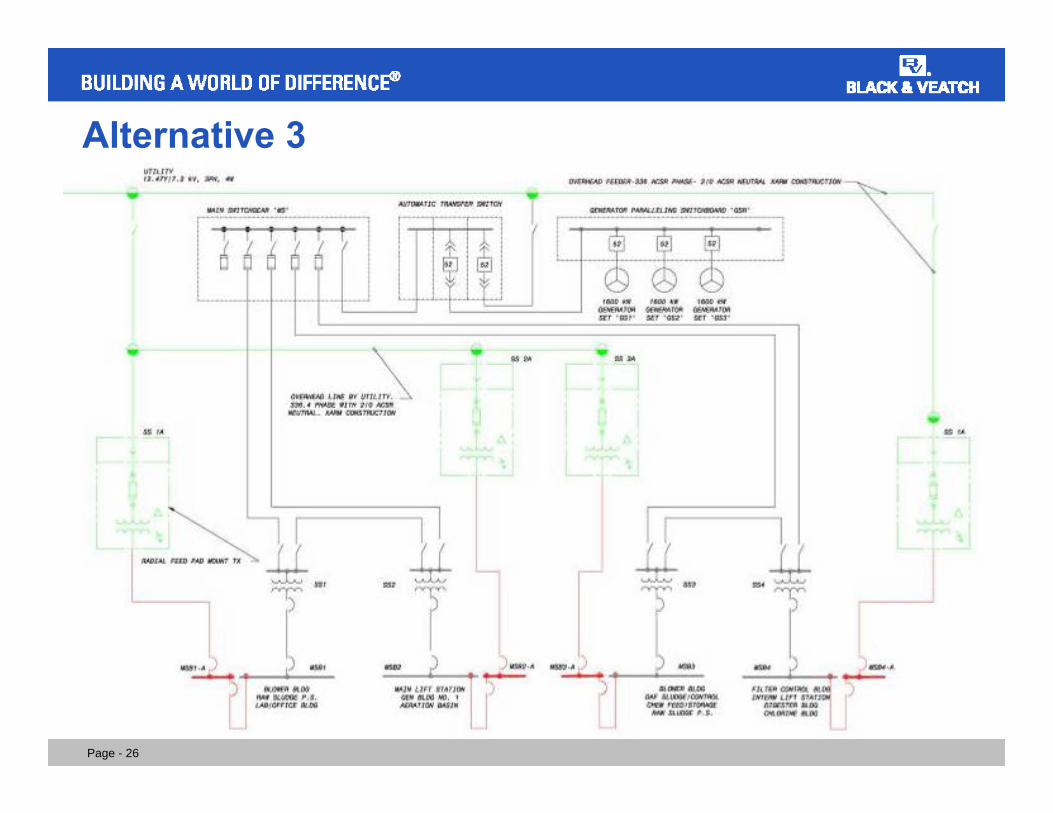
Alternative 3
Page - 27
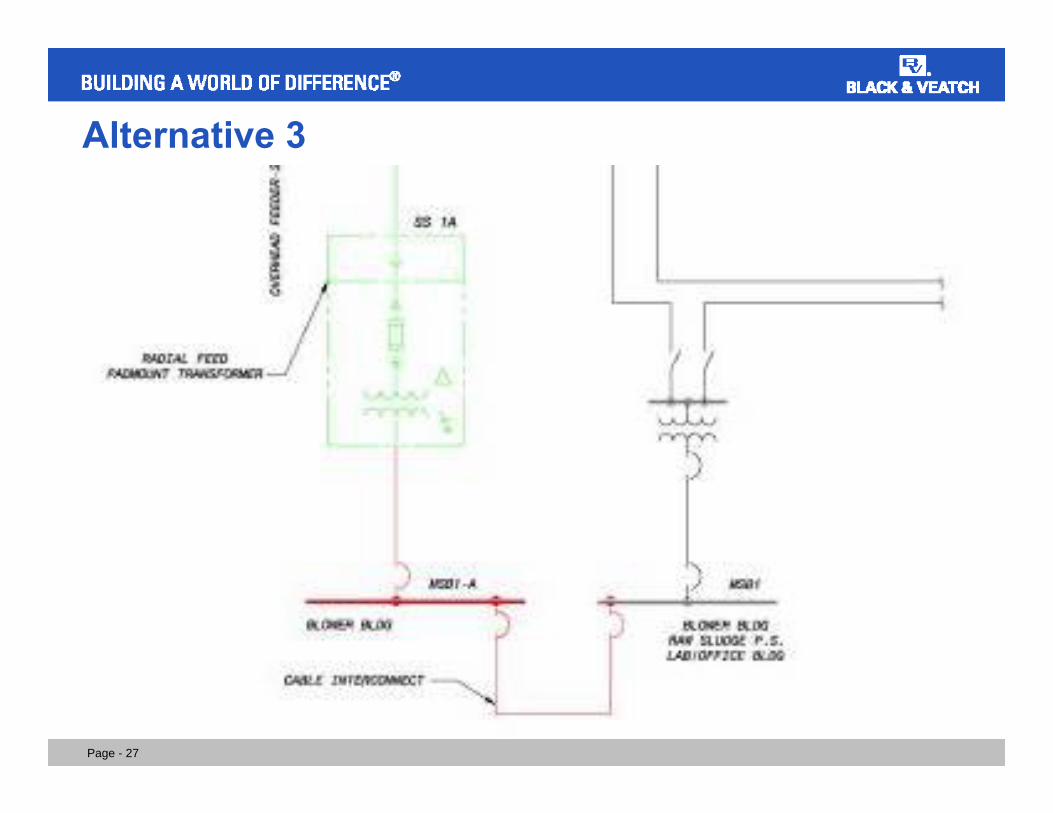
Alternative 3
Page - 28
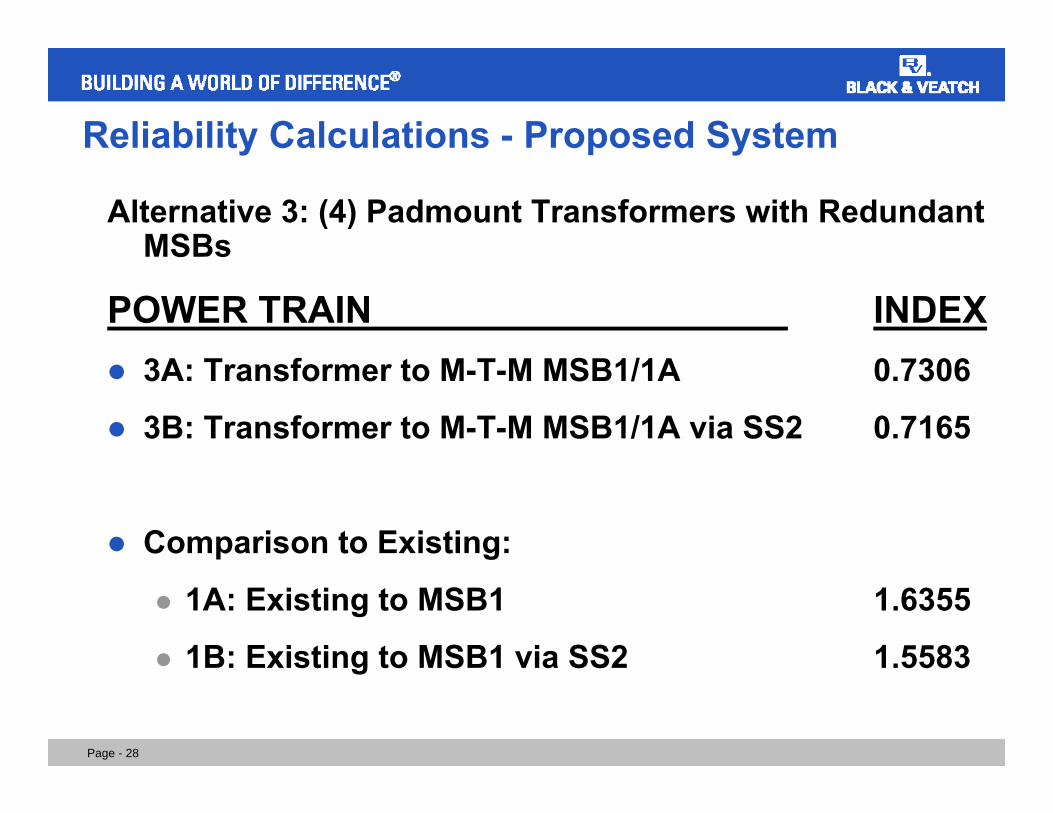
Reliability Calculations - Proposed System
Alternative 3: (4) Padmount Transformers with Redundant MSBs
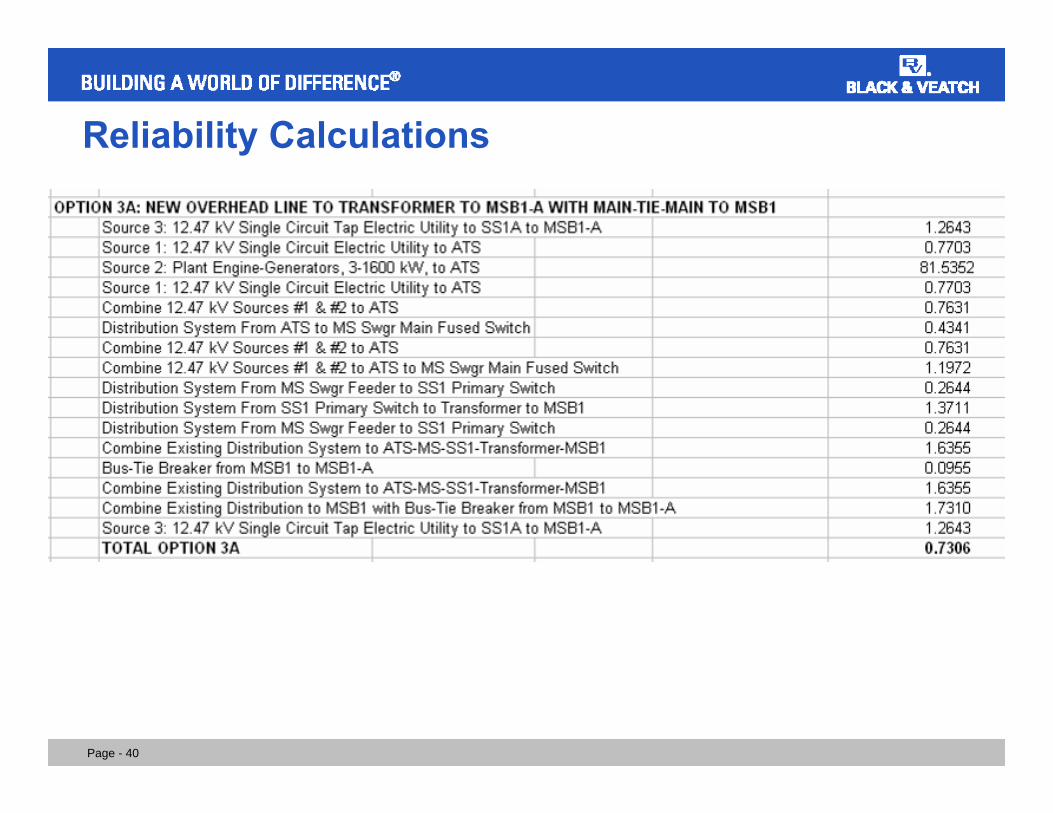
POWER TRAIN INDEX3A: Transformer to M-T-M MSB1/1A 0.7306
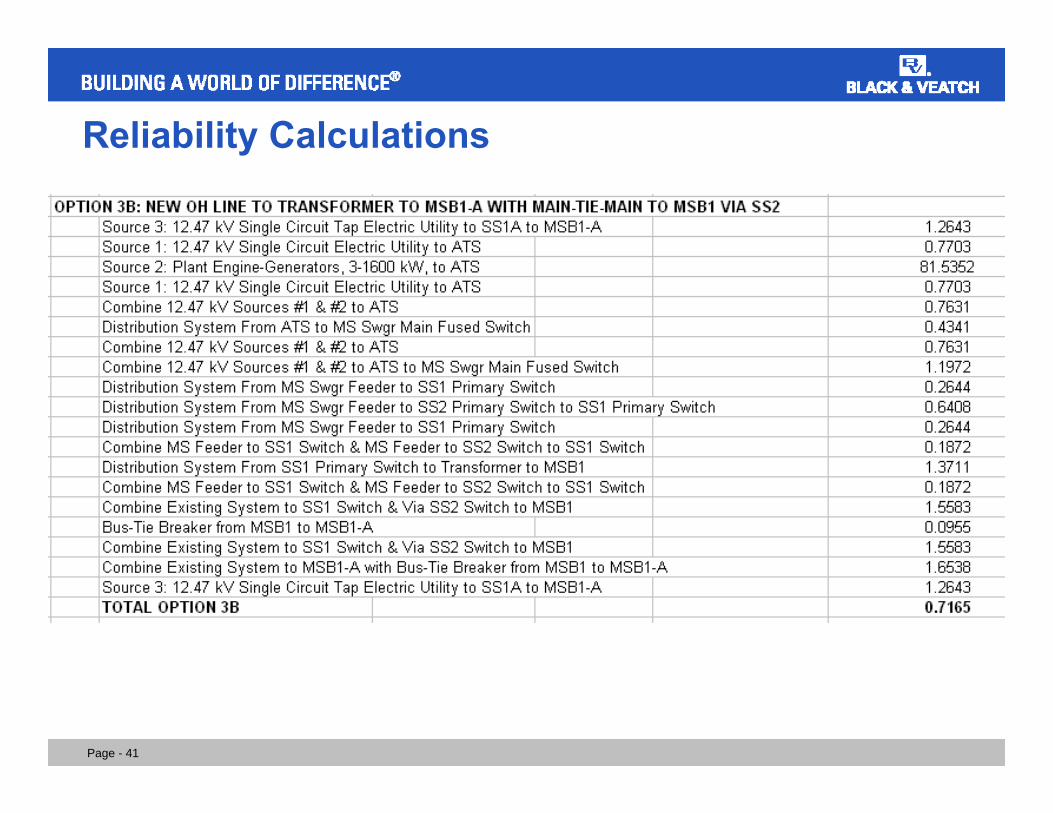
3B: Transformer to M-T-M MSB1/1A via SS2 0.7165
Comparison to Existing:
1A: Existing to MSB1 1.6355
1B: Existing to MSB1 via SS2 1.5583
Page - 29
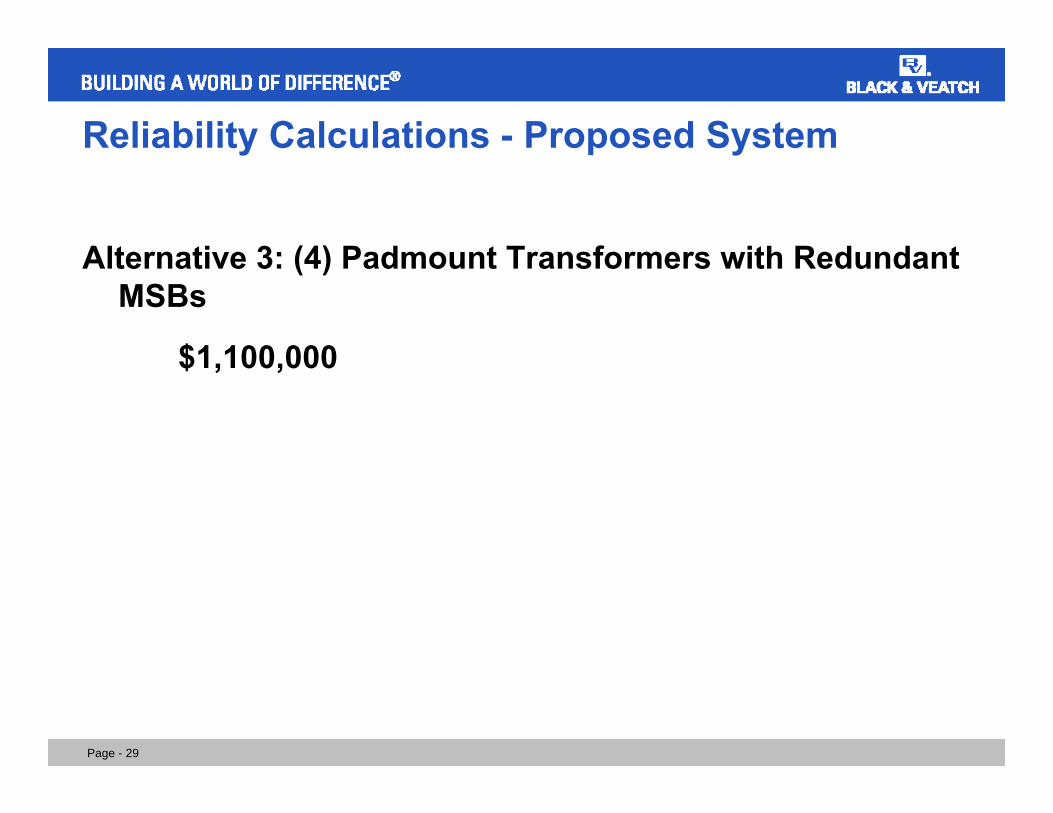
Reliability Calculations - Proposed System
Alternative 3: (4) Padmount Transformers with Redundant MSBs
$1,100,000
Page - 30
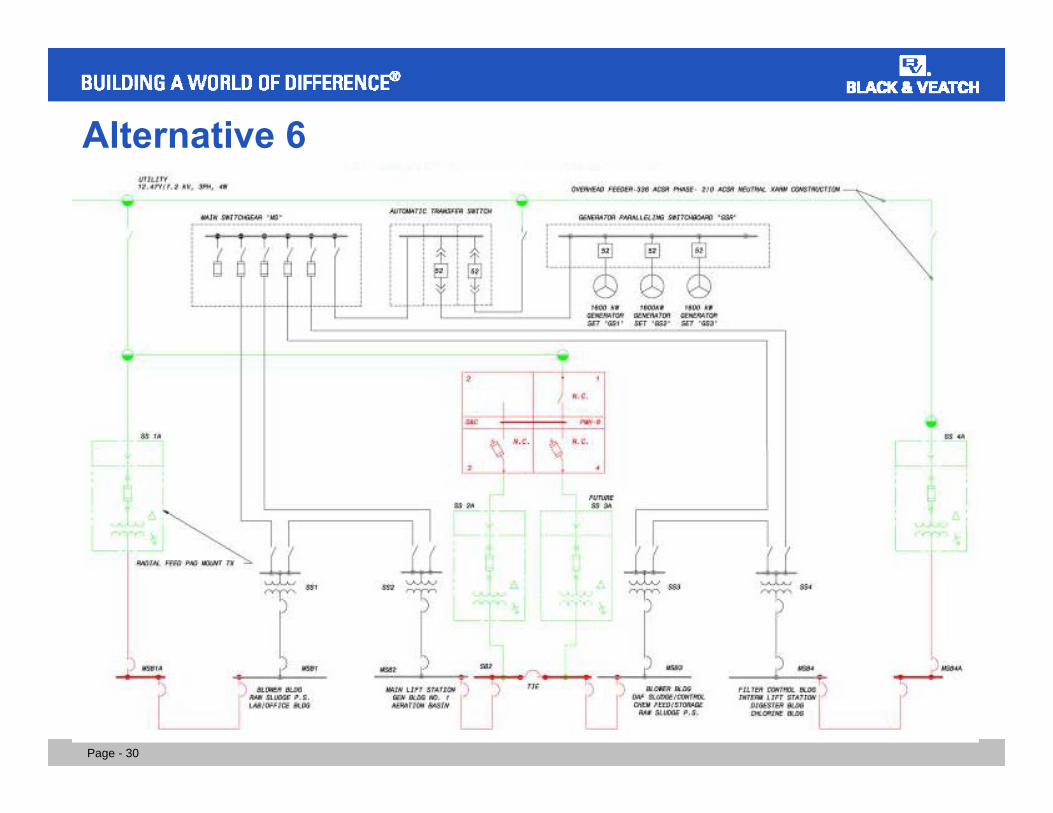
Alternative 6
Page - 31
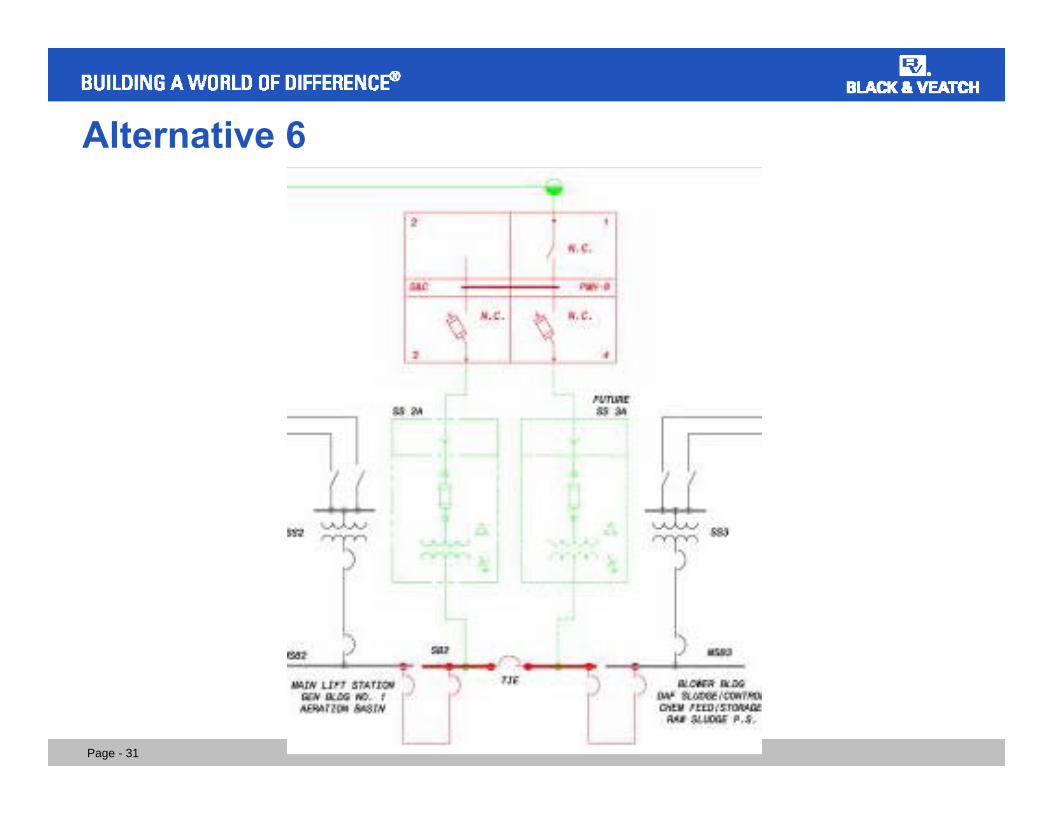
Alternative 6
Page - 32
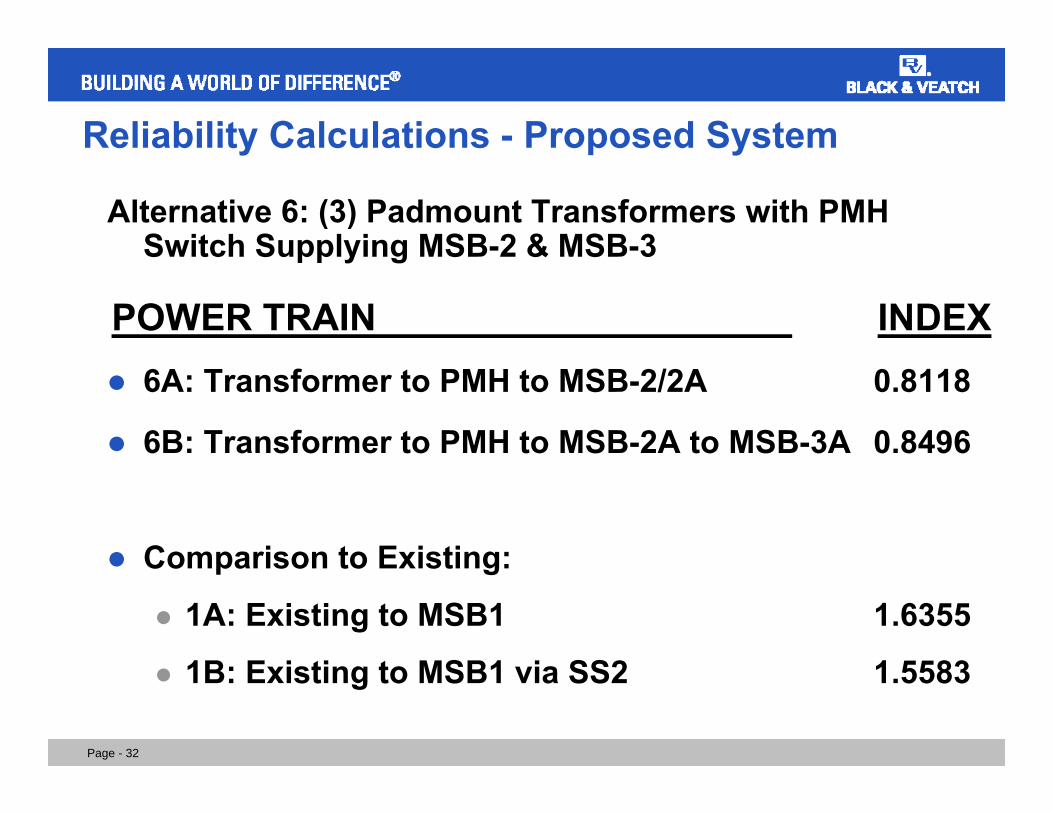
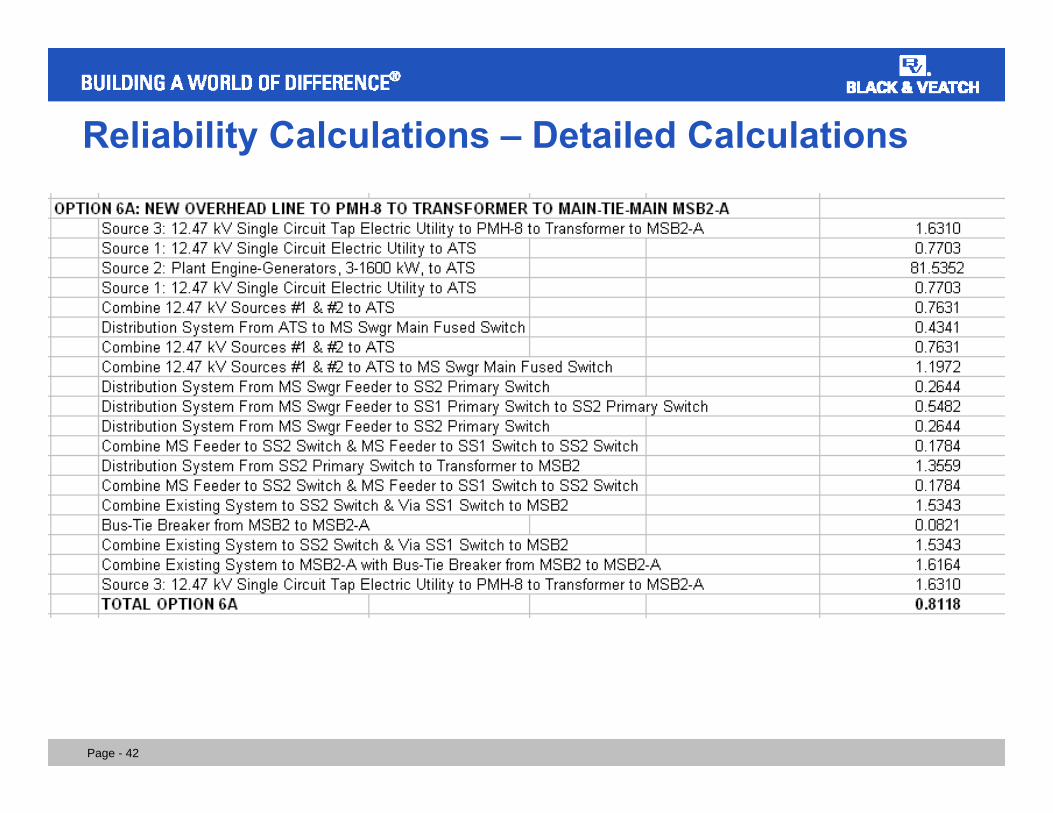
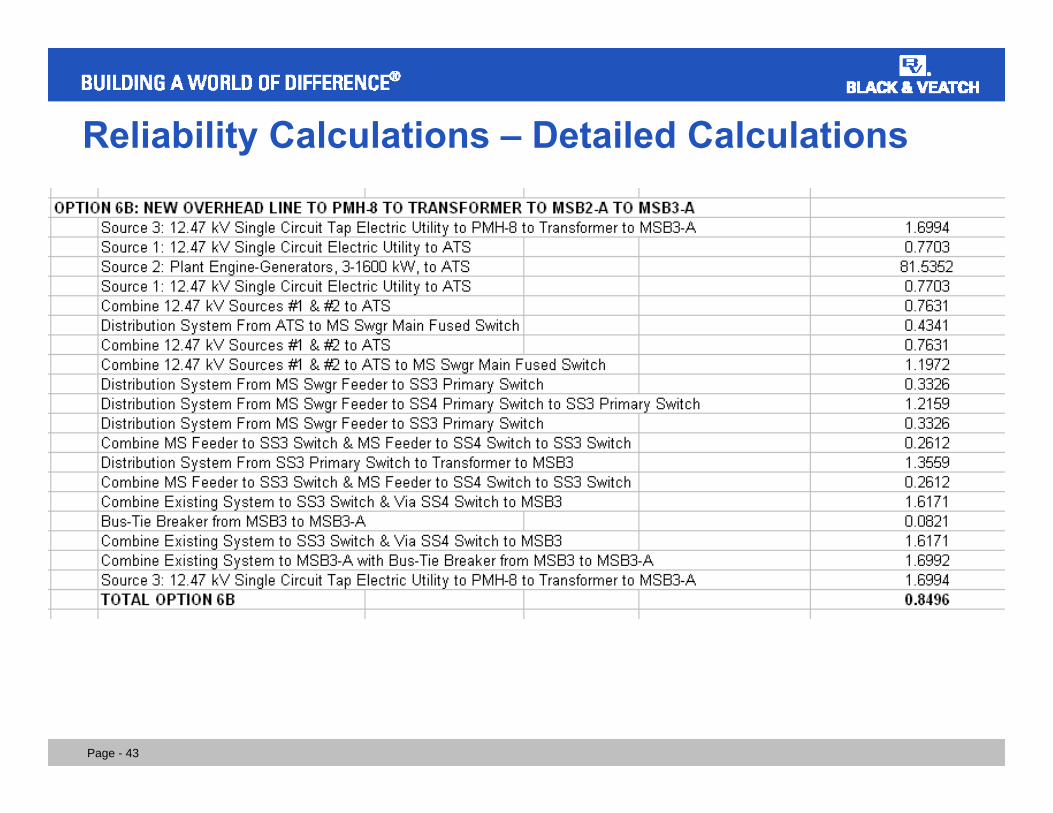
Reliability Calculations - Proposed System
Alternative 6: (3) Padmount Transformers with PMH Switch Supplying MSB-2 & MSB-3
POWER TRAIN INDEX6A: Transformer to PMH to MSB-2/2A 0.8118
6B: Transformer to PMH to MSB-2A to MSB-3A 0.8496
Comparison to Existing:
1A: Existing to MSB1 1.6355
1B: Existing to MSB1 via SS2 1.5583
Page - 33
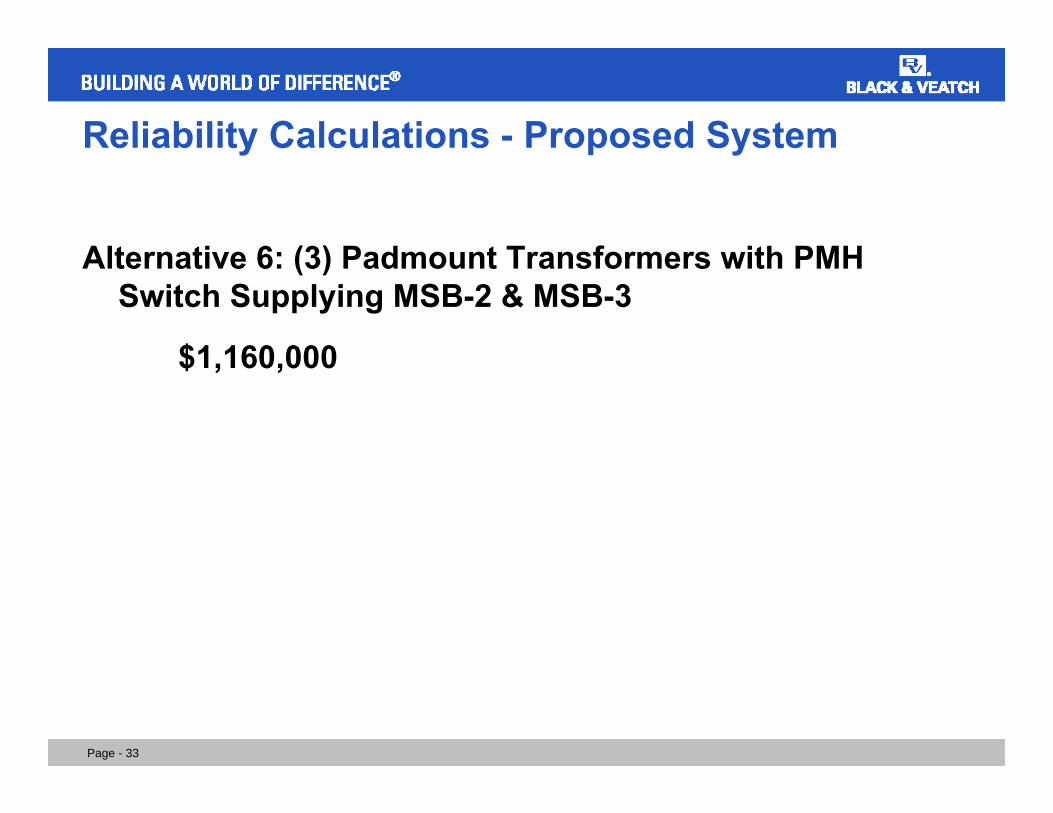
Reliability Calculations - Proposed System
Alternative 6: (3) Padmount Transformers with PMH Switch Supplying MSB-2 & MSB-3
$1,160,000
Page - 34
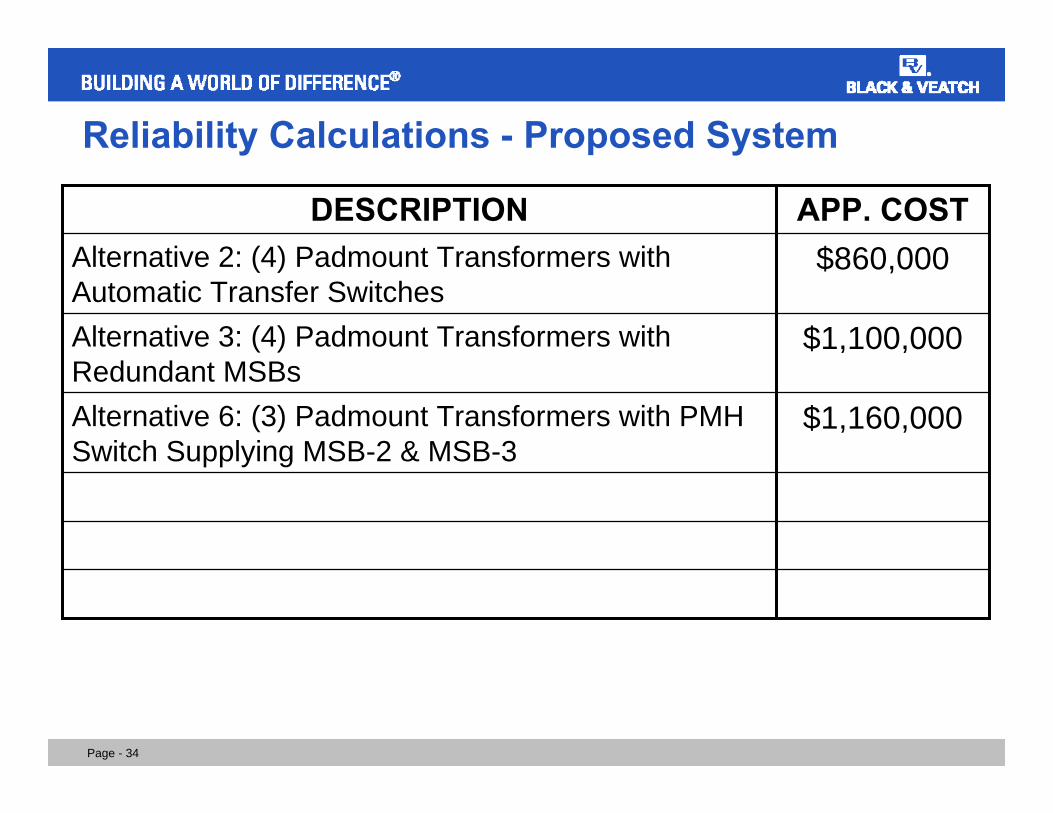
Reliability Calculations - Proposed System
Alternative 6: (3) Padmount Transformers with PMH Switch Supplying MSB-2 & MSB-3
Alternative 3: (4) Padmount Transformers with Redundant MSBs
Alternative 2: (4) Padmount Transformers with Automatic Transfer Switches
DESCRIPTION
$1,160,000
$1,100,000
$860,000APP. COST
Page - 35
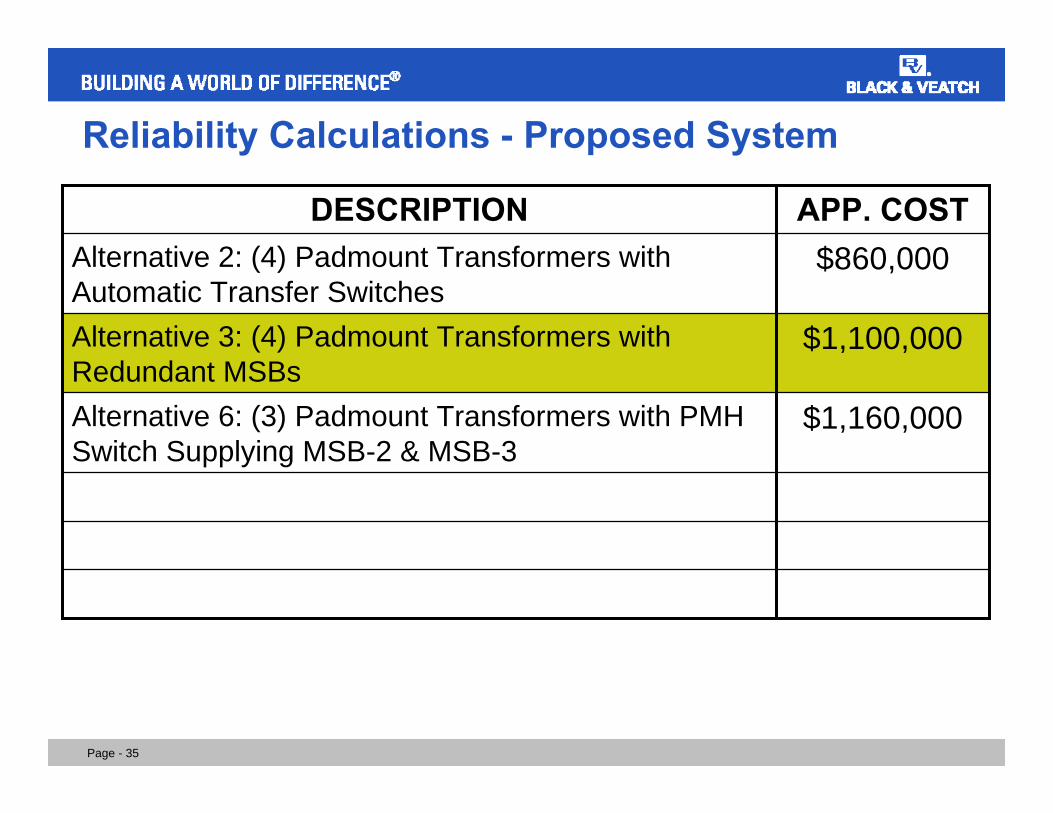
Reliability Calculations - Proposed System
Alternative 6: (3) Padmount Transformers with PMH Switch Supplying MSB-2 & MSB-3
Alternative 3: (4) Padmount Transformers with Redundant MSBs
Alternative 2: (4) Padmount Transformers with Automatic Transfer Switches
DESCRIPTION
$1,160,000
$1,100,000
$860,000APP. COST
Page - 36
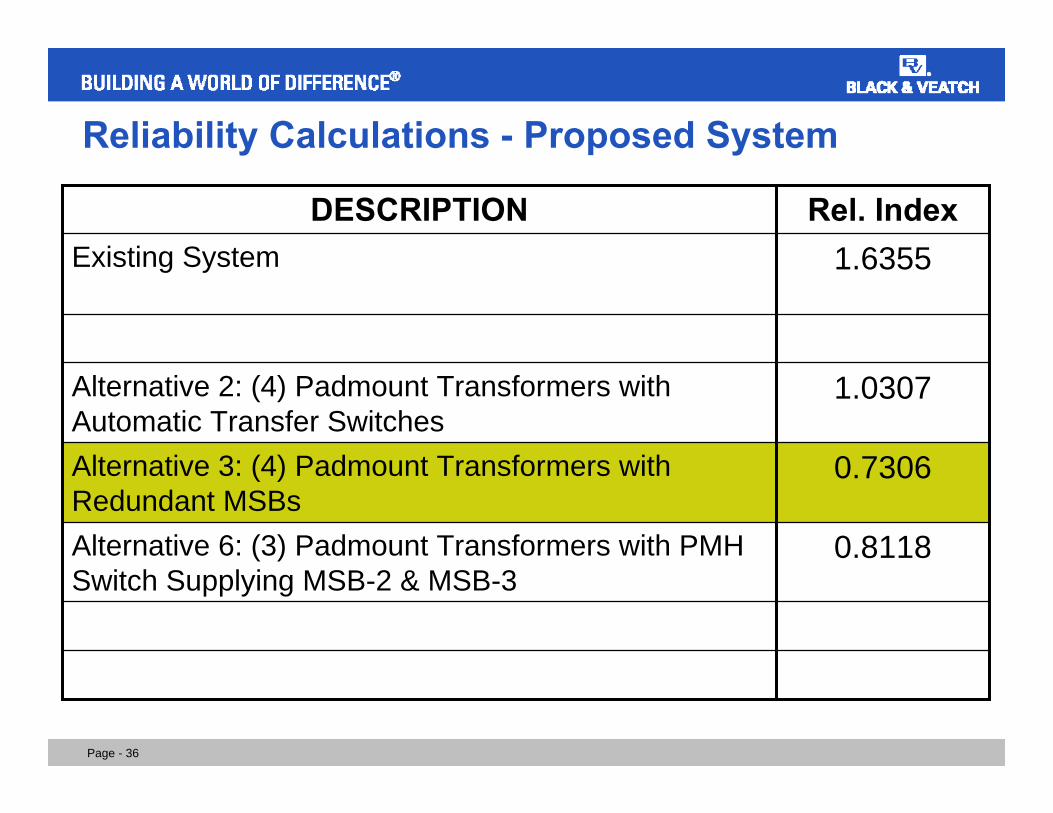
Reliability Calculations - Proposed System
1.0307Alternative 2: (4) Padmount Transformers with Automatic Transfer Switches
0.7306Alternative 3: (4) Padmount Transformers with Redundant MSBs
0.8118Alternative 6: (3) Padmount Transformers with PMH Switch Supplying MSB-2 & MSB-3
1.6355Existing SystemDESCRIPTION Rel. Index
Page - 37
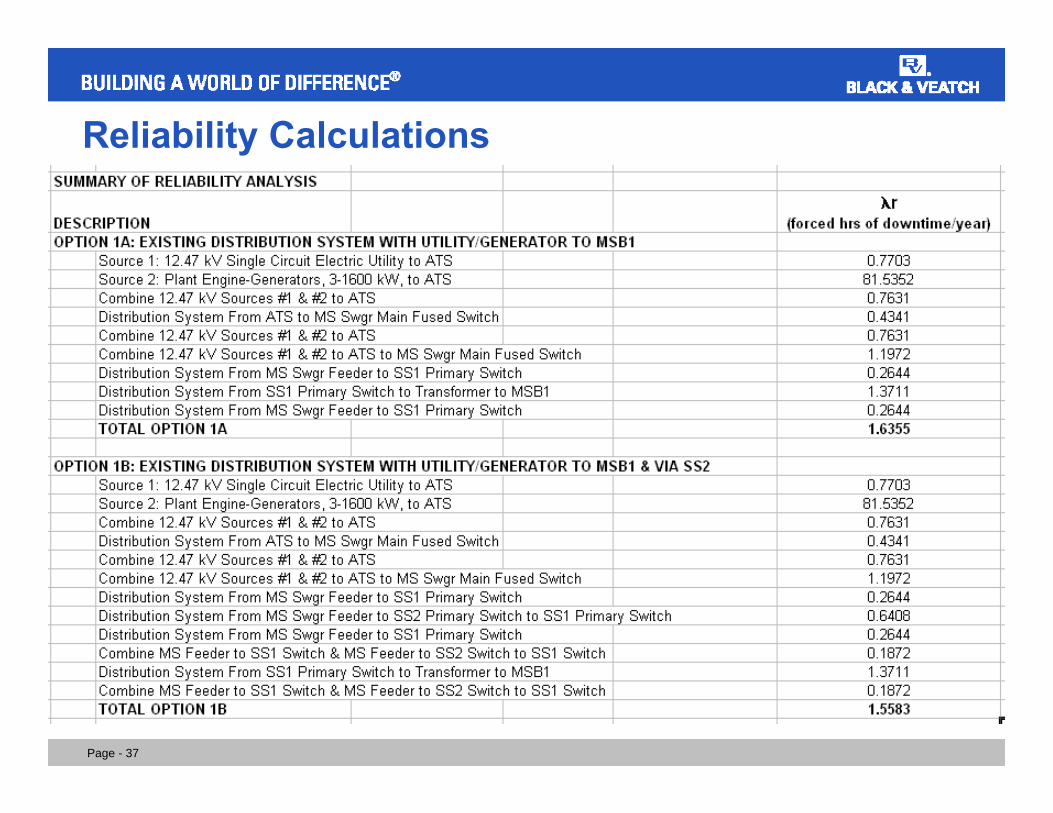
Reliability Calculations
Page - 38
Reliability Calculations
Page - 39
Reliability Calculations
Page - 40
Reliability Calculations
Page - 41
Reliability Calculations
Page - 42
Reliability Calculations – Detailed Calculations
Page - 43
Reliability Calculations – Detailed Calculations
Page - 44
Reliability Calculations – Detailed Calculations
Page - 45
Reliability Calculations – Detailed Calculations

Page - 46
Reliability Calculations – Detailed Calculations
Page - 47
Reliability Calculations – Detailed Calculations
Page - 48
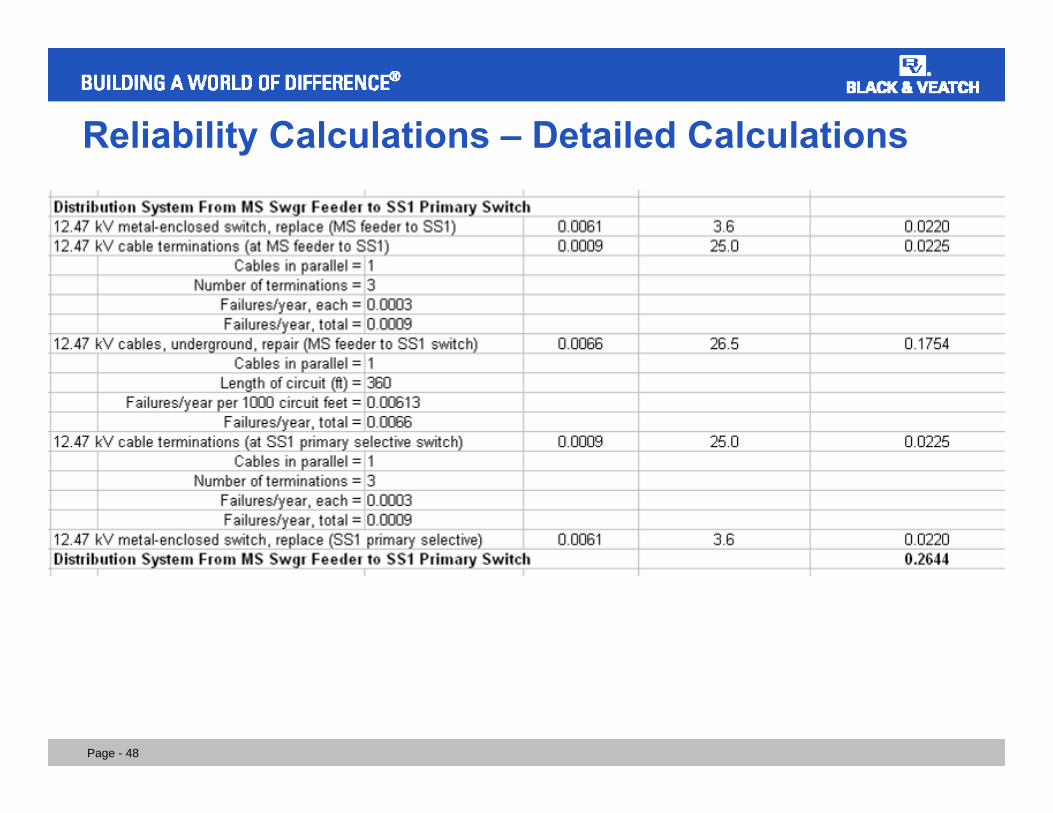
Reliability Calculations – Detailed Calculations
Page - 49
Reliability Calculations – Detailed Calculations

Page - 50