high pressure thawing of raw poultry meats
TRANSCRIPT
University of Nebraska - LincolnDigitalCommons@University of Nebraska - LincolnDissertations, Theses, & Student Research in FoodScience and Technology Food Science and Technology Department
Summer 7-30-2019
HIGH PRESSURE THAWING OF RAWPOULTRY MEATSAli AlqaraghuliUniversity of Nebraska - Lincoln, [email protected]
Follow this and additional works at: https://digitalcommons.unl.edu/foodscidiss
Part of the Food Science Commons
This Article is brought to you for free and open access by the Food Science and Technology Department at DigitalCommons@University of Nebraska -Lincoln. It has been accepted for inclusion in Dissertations, Theses, & Student Research in Food Science and Technology by an authorizedadministrator of DigitalCommons@University of Nebraska - Lincoln.
Alqaraghuli, Ali, "HIGH PRESSURE THAWING OF RAW POULTRY MEATS" (2019). Dissertations, Theses, & Student Research inFood Science and Technology. 101.https://digitalcommons.unl.edu/foodscidiss/101

HIGH PRESSURE THAWING OF RAW POULTRY MEATS
By
Ali Alqaraghuli
A THESIS
Presented to the Faculty of
The Graduate College at the University of Nebraska
In Partial Fulfillment of Requirements
For the Degree of Master of Science
Major: Food Science and Technology
Under the Supervision of Professor Mary-Grace C. Danao
Lincoln, Nebraska
July 2019

HIGH PRESSURE THAWING OF RAW POULTRY MEATS
Ali Alqaraghuli, M.S.
University of Nebraska, 2019
Advisor: Mary-Grace C. Danao
The melting temperature of water reaches its minimum when pressurized from 0
°C at atmospheric pressure down to -22 °C at 220 MPa, showing that frozen products at
atmospheric pressure (0.1 MPa) can be thawed rapidly by simply increasing the pressure
to 210-250 MPa. High pressure thawing (HPT) of poultry meats (ground chicken,
chicken breast, thigh, liver, gizzard, and heart) commonly used in the raw pet food
industry was evaluated at 240 MPa, two processing fluid temperatures (refrigerated, 0-10
°C and room, 20-30 °C), and four holding times (1, 180, 360, and 540 s). Changes in
color via 𝐿𝐿*𝑎𝑎*𝑏𝑏* measurements (∆𝐸𝐸), core temperature (𝑇𝑇𝑐𝑐), thawed percentage (𝑥𝑥𝑡𝑡, %
w/w), and thawing rate (�̇�𝑥𝑡𝑡, % per min) were measured. Results showed that no
significant color change was detected with HPT treatment at 240 MPa across holding
times tested. Core temperatures of -2 to -5 °C were achieved, meaning all meat types
were tempered during HPT. In fact, on average, 46.7-80.7 % (w/w) of the meat was
thawed after HPT treatment for 180-540 s. Compared to thawing in air and water, or
using a microwave, discoloration of thawed raw meats was highest after microwave
thawing (∆𝐸𝐸 = 11.5) and lowest with HPT treatment (∆𝐸𝐸 = 1.27 and 1.39 at refrigerated
and room temperatures, respectively). Average core temperatures were highest with HPT
(𝑇𝑇𝑐𝑐 = -2.21 °C and -3.52 °C at room and refrigerated temperatures, respectively),
followed by microwave thawing (𝑇𝑇𝑐𝑐 = -3.58 °C), and thawing in either air or water (𝑇𝑇𝑐𝑐

ranged from -4.16 to -4.43 °C). Microwave thawing delivered the highest average thawed
percentage (𝑥𝑥𝑡𝑡 = 84.5 % w/w) and thawing rate (�̇�𝑥𝑡𝑡 = 29.6 % min-1), followed by HPT at
room temperatures (𝑥𝑥𝑡𝑡 = 74.0 % w/w and �̇�𝑥𝑡𝑡 = 13.9 % min-1), HPT at refrigerated
temperatures (𝑥𝑥𝑡𝑡 = 65.8 % w/w and �̇�𝑥𝑡𝑡 = 12.0 % min-1). Thawing in still air and still water
resulted in the lowest thawed percentages (𝑥𝑥𝑡𝑡 = 44.1-55.1 % w/w) and thawing rates (�̇�𝑥𝑡𝑡 =
0.30-2.00 % w/w). HPT thawing rates were half as fast as that of microwave thawing, 10
times faster than thawing in still water, and 22-45 times faster than thawing in still air.
Only HPT could thaw raw poultry meats at a fast rate with minimum change in color.
Results from this study are useful to meat processors interested in reducing thawing time
while maintaining raw quality of the meat during tempering.

iv
Acknowledgments
Indeed, the patient will be given their reward without the account, I am beholden
to the highly benevolent and merciful almighty ALLAH whose grace and blessings helped
me to reach this far in my academic pursuits.
First and foremost, I express my special appreciation and thanks to my academic
advisor, Dr. Mary-Grace Danao, for accepting me into her group and organizing my
academic journey. It has been an honor to be her student. She has taught me, both
consciously and unconsciously how good engineering, processing, and research is
conducted. Also, I would like to thank the advisory committee members, Dr. Curtis
Weller, Dr. Joe Baumert, and Dr. Gary Sullivan for simultaneously encouraging, guiding,
and supporting my research ideas and my work.
I would like to thank my wife Linh for being the best wife in the world. Thank you
for your love and all your support. Thank you for standing beside me throughout my study
and writing this thesis. She has been my inspiration and motivation for continuing to
improve my knowledge and move my academic journey forward. I also thank my
wonderful children: Lana, Zaid, and Leen, for always making me smile and for
understanding on those weekend mornings when I was studying and writing instead of
playing games. I hope that one day they can read this book and understand why I spent so
much time in front of my computer.
I also want to thank my parents. I have been extremely fortunate in my life to have
parents who have shown me unconditional love and support. The relationships and bonds
that I have with my parents hold an enormous amount of meaning to me.

v
I would like to thank the fellow students who contributed in some way to the work
described in this thesis. Special thanks go to Isaac Rukundo and Elizabeth Moderow.
Also, to my classmates, thank you for listening, offering me advice, and supporting me
through this entire process. Special thanks go to Lisbeth Vallecilla Yepez, Basim Alohli,
Mohammed Abdulmutallab, Anna Rose Pilapil, and Snigdha Guha. Special thanks go to
my friends and family members for all their well-wishes/prayers, phone calls, e-mails,
texts, editing advice, and being there whenever I needed a friend, including Omar,
Marwan, Ahmed, Abdulrahman Alqaraghuli, Maytham, Bushraa, Zina, Zahraa Maytham,
Bilal Mahdi and Talal Faisal.
Lastly, I want to thank the Department of Food Science and Technology at the
University of Nebraska Lincoln for kindly sponsoring my study and created such a good
opportunity for me which contributed dramatically to develop and succeed my future
endeavors. They have played an important role in the development of my identity and
shaping the individual that I am today.

vi
Dedication
This thesis is dedicated to my parents, my wife, Linh, and my kids, Lana, Zaid,
and Leen. Their constant love and caring are every reason for where I am and what I am.

vii
Table of Contents
Acknowledgments.............................................................................................................. iv
Dedication .......................................................................................................................... vi
Table of Contents .............................................................................................................. vii
List of Tables ...................................................................................................................... x
List of Figures .................................................................................................................... xi
Chapter 1. Introduction ....................................................................................................... 1
Chapter 2. Literature Review .............................................................................................. 4
2.1. High pressure processing (HPP) .............................................................................. 4
2.2. Applications of HPP in food processing .................................................................. 4
2.3. High pressure thawing ............................................................................................. 6
Chapter 3. Materials and Methods .................................................................................... 13
3.1. High pressure thawing ........................................................................................... 13
3.1.1. Experimental design........................................................................................ 13
3.1.2. Sample preparation ......................................................................................... 13
3.1.3. High pressure thawing .................................................................................... 14
3.1.4. Quality measurements ..................................................................................... 16
3.1.5. Data analysis ................................................................................................... 17

viii
3.1.6. Statistical tests ................................................................................................. 18
3.2. Meat thawing in still air, still water, or a microwave ............................................ 19
3.2.1. Thawing in air ................................................................................................. 19
3.2.2. Thawing in water ............................................................................................ 19
3.2.3. Thawing in a microwave ................................................................................. 20
3.2.4. Data and statistical analyses............................................................................ 20
Chapter 4. High Pressure Thawing of Poultry Meats ....................................................... 22
4.1. Pressure- and temperature-time profiles ................................................................ 22
4.2. Pearson correlation coefficients ............................................................................. 26
4.3 Color change ........................................................................................................... 27
4.4. Core temperature .................................................................................................... 27
4.5. Thawed percentage ................................................................................................ 30
4.6. Thawing rate .......................................................................................................... 32
Chapter 5. Thawing Chicken Livers in Still Air, Still Water,........................................... 35
and a Microwave ............................................................................................................... 35
5.1. Temperature-time profiles ..................................................................................... 35
5.2. Color change .......................................................................................................... 35
5.3. Core temperature, thawed percentage, and thawing rate ....................................... 38
Chapter 6. Conclusions and Future Work ......................................................................... 39

ix References ......................................................................................................................... 41
Appendix A. Preliminary Testing of High Pressure Thawing .......................................... 45
A.1. Materials and methods .......................................................................................... 45
A.1.1. Sample preparation ........................................................................................ 45
A.1.2. High pressure thawing ................................................................................... 46
A.1.3. Quality measurements .................................................................................... 46
A.2. Results ................................................................................................................... 46
Appendix B. SAS Code .................................................................................................... 48
B.1. Objective 1 - CORR Procedure ............................................................................. 48
B.2. Objective 1 – ANOVA Procedure ......................................................................... 50
B.3. Objective 2 – ANOVA Procedure ......................................................................... 56

x
List of Tables
Table 2.1. Summary of high pressure thawing of animal proteins in the literature… 10
Table 2.2. Summary of high pressure pasteurization of poultry meats in the literature…………………………………………………………………. 12
Table 4.1. Pearson correlation coefficients among independent and dependent, or response, variables………………………………………………………. 26
Table 5.1. Comparison of mean quality measurements of thawing chicken liver in still air, still water, microwave, and high pressure thawing (HPT) at 240 MPa……………………………………………………………………… 38
Table A.1. Thawed percentages and thawing rates of frozen ground meats at 240 MPa and room temperature for 3-9 min of holding time………………... 47

xi
List of Figures
Figure 2.1. Pressures used in commercial applications of high pressure processing. Adapted from Considine et al. 2008) ………………………………… 6
Figure 2.2. Different modes of high pressure freezing and thawing: pressure-shift freezing (acdf), pressure-induced thawing (fdca), pressure-assisted freezing (abef), and pressure-assisted thawing (feba). In reality, the terms pressure-shift, pressure-assisted, and pressure-induced are used interchangeably in the literature (Denys et al., 2001)………………….. 8
Figure 3.1. Preparing samples involved (a) filling 100 ml silicone beakers, (b) taking 𝐿𝐿∗𝑎𝑎∗𝑏𝑏∗ measurements prior to freezing, and (c) packing frozen samples in vacuum-sealed pouches……………………………………. 14
Figure 3.2. Setting up the high pressure thawing tests involved (a) loading five samples into the vessel, (b) attaching the vessel to the hydraulic lift of the HPP equipment, (c) lowering the vessel into the pressure chamber, and (d) programming the ramp up and ramp down rates, pressure level, and holding time in the HPP equipment controller…………………….. 15
Figure 3.3. Example of pressure- and temperature-time profiles during high pressure thawing at 240 MPa for 9 min at (a) refrigerated and (b) room temperatures……………………………………………………………. 16
Figure 3.4. Quality measurements taken after high pressure thawing treatments included (a) core temperature, (b) mass fractions of the frozen and thawed portions, and (c) 𝐿𝐿∗𝑎𝑎∗𝑏𝑏∗ values………………………………... 17
Figure 3.5. Top and side views of thawing in still water test……………………..... 20
Figure 4.1. Pressure- and temperature-time profiles of three replicated high pressure processing cycles at refrigerated temperatures, 240 MPa, and holding times of (a) 1 s, (d-f) 180 s, (g-i) 360 s, and (j-l) 540 s. Each replication contained one sample each of ground chicken, livers, breast tenders, thighs, and gizzards………………………………………….... 23
Figure 4.2. Pressure- and temperature-time profiles of three replicated high pressure processing cycles at room temepratures, 240 MPa, and holding times of (a-c) 1 s, (d-f) 180 s, (g-i) 360 s, and (j-l) 540 s. Each replication contained one sample each of ground chicken, livers, breast tenders, thighs, and gizzards…………………………………………… 24

xii Figure 4.3. Pressure- and temperature-time profiles of one high pressure
processing cycle at refrigerated and room temperatures, 240 MPa, and holding times of (a-b) 1 s, (c-d) 180 s, (e-f) 360 s, and (g-h) 540 s. Each replication contained three samples of chicken hearts…………... 25
Figure 4.4. Variations in color change (∆𝐸𝐸) of raw chicken meats after high pressure thawing at 240 MPa across different (a) processing fluid temperatures, 𝑇𝑇𝑓𝑓; (b) holding times, 𝑡𝑡; and (c) meat type, 𝑀𝑀. Solid boxplots represent color change for frozen meat portion after high pressure thawing (HPT), while hashed boxplots represent color change for thawed meat position. Solid circles represent samples that fall outside the 10th and 90th percentiles. All data below the dashed line, ∆𝐸𝐸 = 2.0, show no perceptible change in color. *Data for chicken hearts and pooled color data for all samples are shown here for comparison only……………………………………………………….. 28
Figure 4.5. Variations in core temperature (𝑇𝑇𝑐𝑐) of raw chicken meats after high pressure thawing at 240 MPa across different (a) processing fluid temperatures, 𝑇𝑇𝑓𝑓; (b) holding times, 𝑡𝑡; and (c) meat type, 𝑀𝑀. Solid circles above and below each boxplot represent the 5th and 95th percentiles. The dashed reference lines show the range (-2 to -5 °C) of tempered meat temperatures used in the food industry. Means with the same letter do not differ significantly (𝑝𝑝 > 0.05). *Data for chicken hearts are shown here for comparison only, but were not included in the analysis of variance (ANOVA)…………………………………… 29
Figure 4.6. Variations in thawed percentage (𝑥𝑥𝑡𝑡) of raw chicken meats after high pressure thawing at 240 MPa across different (a) processing fluid temperatures, 𝑇𝑇𝑓𝑓; (b) holding times, 𝑡𝑡; and (c) meat type, 𝑀𝑀. Solid circles above and below each boxplot represent the 5th and 95th percentiles. Means with the same letter do not differ significantly (𝑝𝑝 > 0.05). *Data for chicken hearts are shown here for comparison only, but were not included in the analysis of variance (ANOVA)…………. 31
Figure 4.7. Relationship between thawed percentage (𝑥𝑥𝑡𝑡) and core temperature (𝑇𝑇𝑐𝑐)……………………………………………………………………… 32

xiii Figure 4.8. Variations in thawing rate (�̇�𝑥𝑡𝑡) of raw chicken meats after high pressure
thawing at 240 MPa across different (a) processing fluid temperatures, 𝑇𝑇𝑓𝑓; (b) holding times, 𝑡𝑡; and (c) meat type, 𝑀𝑀. Solid circles above and below each boxplot represent the 5th and 95th percentiles. Means with the same letter do not differ significantly (𝑝𝑝 > 0.05). *Data for 1 s holding time and for chicken hearts are shown here for comparison only, but were not included in the analysis of variance (ANOVA)……………………………………………………………….
34
Figure 5.1. Temperature-time profiles from three replications of thawing chicken liver samples in still air at refrigerated and room temperatures………... 36
Figure 5.2. Temperature-time profiles from three replications of thawing chicken liver samples in still water at refrigerated and room temperatures…….. 37
Figure 6.1. A thermal imaging camera was used to show (a) the temperature distributions over the product surface and along its cross section and (b) the temperatures at select points on its surface and core…………… 40
Figure A.1. From left to right: High pressure thawing (HPT) of frozen ground chicken, ground pork, and ground turkey at 240 MPa and room temperature for (a) 3 min and (b) 6 min. In each picture, the top row shows the frozen meat portions, while the bottom row shows the thawed meat portions, of the samples after HPT………………………. 47

1
Chapter 1. Introduction
Freezing is a common postharvest treatment used to extend the shelf life of raw
and processed meats, thereby making thawing an essential process to undergo prior to
utilization and consumption of the preserved meats. Conventional thawing of meats
require tempering, or holding, the products at refrigerated temperatures for a few hours or
days, depending on the size and shape of the products. Ambient conditions and the rate at
which thawing takes place has a huge impact on the safety, structure, and overall quality
of the meats. The longer it takes to thaw frozen meats, the greater the chance of microbial
growth, color changes, and moisture or drip losses. Therefore, a quick thawing method is
needed by meat processors to prevent these safety and quality losses, as well as to
improve their manufacturing efficiency. A processing technique that is capable of
addressing this need is high pressure processing (HPP).
HPP is a novel non-thermal technology with a wide range of applications in the
food industry. Conventional thawing of meats can be viewed as a two-dimensional
process in which two process variables – temperature and time – can be adjusted to
produce a desired end result in the product. With HPP, a third process variable – pressure
– can be adjusted along with temperature and time – to manipulate the phase of water in
the product. For example, when a frozen meat product of cylindrical shape with an initial
core temperature of -10 °C is tempered in a cold water bath or cold room at atmospheric
pressure (0.1 MPa), its core temperature increases until it reaches equilibrium with the
surrounding fluid. When the product is tempered in a cold water bath at high pressures
(100-300 MPa, gauge), the water transitions readily from solid to liquid phase since the

2 melting points of water are lower at these immense pressures compared to that of 0 °C at
0.1 MPa. At 100-300 MPa, thawing may proceed faster than at 0.1 MPa since the
temperature difference between the processing fluid and frozen product is greater, thus
increasing the rate of heat transfer between the fluid and the product.
For conventional chilling, freezing, and thawing of meats, there are many
publications in the literature that discuss effects of chilling and freezing on the safety and
quality of meats, but less information is available for thawing. The same is true for
pressure-assisted or pressure-induced thawing (PAT or PIT) of meats. Most of the
literature has focused more on the effects of PAT or PIT of seafoods (e.g., fish fillets)
than meats. This is likely due to the higher retail value of seafoods, wherein the costs of
HPP treatment, which can be as much as $0.70 per pound of product, can be absorbed in
the selling price of seafoods than in the selling price of commodity meats.
One segment of the meat industry that has been able to absorb the costs of HPP
treatment is raw pet food manufacturing. “Clean label” trends seen in human foods have
extended to the pet food industry, resulting in “wild” and “paleo” diets for pets, which are
largely based on meats, fish, fruits, vegetables, and excludes grains. During processing,
muscle and organ meats undergo several unit operations such as freezing, thawing, and
grinding prior to being blended with other ingredients. The product blend may undergo
several freeze-thaw cycles during processing and storage. For example, the product may
be frozen as it moves from one processing plant to another. Once it arrives at the second
plant, it may be tempered or thawed so that it can be ground or blended with other
ingredients. It may be frozen once again after it is packaged and ready for distribution.

3 Once it reaches a retail outlet, it may be thawed again. Many of the raw pet food products
available in the market are in fresh, frozen, or freeze-dried form. Some manufacturers
already utilize HPP to pasteurize their raw pet food product, and thus may be open to
high pressure thawing (HPT) despite the added costs, if it means decreasing thawing
times and increasing their production throughput.
Therefore, the overall objective of this study was to investigate the use of high
pressure thawing on different types of poultry, specifically chicken, meats used in the raw
pet food industry. The specific objectives of the study were to:
1. determine the effects of different meat types (ground, breast tenders, thighs, liver,
gizzard, and heart), holding times (𝑡𝑡 = 1, 180, 360, and 540 s), and processing fluid
temperatures [𝑇𝑇𝑓𝑓 = refrigerated (0-10°C) or room (20-30°C)] on color change (∆𝐸𝐸),
core temperature (𝑇𝑇𝑐𝑐, °C), thawed percentage (𝑥𝑥𝑡𝑡, % w/w) and thawing rate (�̇�𝑥𝑡𝑡, %
min-1), and
2. compare the �̇�𝑥𝑡𝑡 of chicken liver when thawed in still water or still air at two fluid
temperatures [𝑇𝑇𝑓𝑓 = refrigerated (0-10°C) or room (20-30°C)] and in a microwave to
�̇�𝑥𝑡𝑡 of chicken liver thawed at 240 MPa at refrigerated and room temperatures.
The thesis contained herein consists of six chapters. Chapter 1 provides an
introduction, motivation, and objectives of the study. Chapter 2 presents a review of the
literature on high pressure thawing of meats. Chapter 3 describes the experiment design,
materials, methods, and statistical analyses used in the study. Chapters 4 and 5 presents
the results of the experiments conducted for Objectives 1 and 2, respectively. Chapter 6
summarizes the conclusions and recommendations for future work.

4
Chapter 2. Literature Review
2.1. High pressure processing (HPP)
The effect of high pressures on foods was first revealed at the end of the
nineteenth century by Bert Hite at West Virginia University when he used pressures of up
to 600 MPa to extend the shelf life of milk (Hite, 1899). Subsequent studies have
demonstrated the use of high pressures (above 100 MPa) to treat food materials. The
equipment used in the first HPP studies was simple in idea, consisting of packing
products into a tube filled with water, sealed, and placed inside a steel cylinder (Hite,
1899). The cylinder was then placed between two steel blocks and pressurized with a
steel piston along its axis. Lack of robust high pressure equipment and instrumentation
and controls to operate it safely hindered the application of HPP in food processing for
the next 90 years (Rastogi et al., 2007). In the 1990s, the first commercially produced
HPP acidic foods and jams entered the Japanese market (Thakur and Nelson, 1998).
Since then, HPP has been applied to various types of foods (e.g., deli meats, hams, ready-
to-eat meals, sauces, fruit and vegetable juices, and dairy products). The global market
for foods treated with HPP reached approximately $9.8 billion in 2015 and is expected to
rise to nearly $55 billion by 2025 (Visiongain, 2015).
2.2. Applications of HPP in food processing
Food products for HPP treatment are packaged in flexible materials, loaded into a
vessel or container, which is lowered into and sealed in a pressure chamber (Barbosa-
Canovas et al., 1998; Deplace and Mertens, 1993). A pressurizing medium, typically

5 water, is used to fill the chamber. To build pressure inside the chamber, its volume may
be decreased hydraulically or additional water is pumped in slowly. The rate at which
pressure builds up inside the chamber is called the “ramping up rate.” The hydraulic press
or water pump stops when the desired, or set, pressure is reached. The food products are
held at this elevated pressure for a desired amount of time, called “holding time”, during
which the hydraulic press or water pump maintains the desired pressure level in the
chamber. Once the holding time has been achieved, the HPP cycle is said to be
“complete” and the pressure is slowly released. The rate of pressure release is called the
“ramping down rate.” At the end of pressure release, the pressurizing fluid water is
drained and the pressure-treated food products are removed from the vessel.
In the U.S. food industry, HPP is commonly used to inactivate vegetative bacteria
(e.g., pathogens and spoilage microorganisms) in foods as a non-thermal pasteurization or
shelf-life extender technique (Figure 2.1). The United States Food and Drug
Administration (FDA) and the United States Department of Agriculture Food Safety
Inspection Service (USDA FSIS) have accepted HPP technology as a means of
controlling Listeria monocytogenes as a post-lethality treatment of ready-to-eat (RTE)
foods and cured meats (USDA FSIS, 2014). Commercial applications of HPP are to
shuck oysters and shellfish and control for Vibrio parahaemolyticus at or near 300 MPa
(Ma and Su, 2011), inactivation of vegetative cells of L. monocytogenes, Escherichia coli
O157:H7, and Salmonella spp. in high water activity foods and meats (Simonin et al.,
2012) typically at 350-600 MPa, and denaturation of proteins, such as enzymes and

6 allergens in foods at 150-800 MPa (Hu et al., 2011; Johnson et al., 2013; Li et al., 2012;
Li et al., 2013).
Figure 2.1. Pressures used in commercial applications of high pressure processing. Adapted from Considine et al. (2008).
2.3. High pressure thawing
Several studies have explored using high pressures to thaw food products, such as
meats, but it has not been commercially applied. In HPT, pressures of 210-250 MPa are
applied, which causes the solid ice in the foods to transition to the liquid phase at
relatively low temperatures (Figure 2.2). In fact, pure liquid water and ice forms I and III
have a triple point at 209.9 MPa and -22 oC in the phase diagram of water (Knorr et al.,
1998). Ice form I is the normal hexagonal crystalline ice on earth, while ice form III is a
tetragonal crystalline ice that is more dense than water (Chaplin, 2019). This triple point
Top of Mount Everest [Patm = 0.03 MPa]
Sea level [Patm = 0.1 MPa]
Bottom of the Mariana Trench [Patm = 39.6 MPa]
Center of the Earth
Seafood processing (shucking) [Pgauge = 100-300 MPa]Pasteurization [Pgauge = 400-600 MPa]Protein denaturation [Pgauge = 150-900 MPa]
Pressure range for the existence of all biological life on Earth
Commercial applications of high pressure processing
Pressure (MPa)
0.1
1
10
100
1000
10000
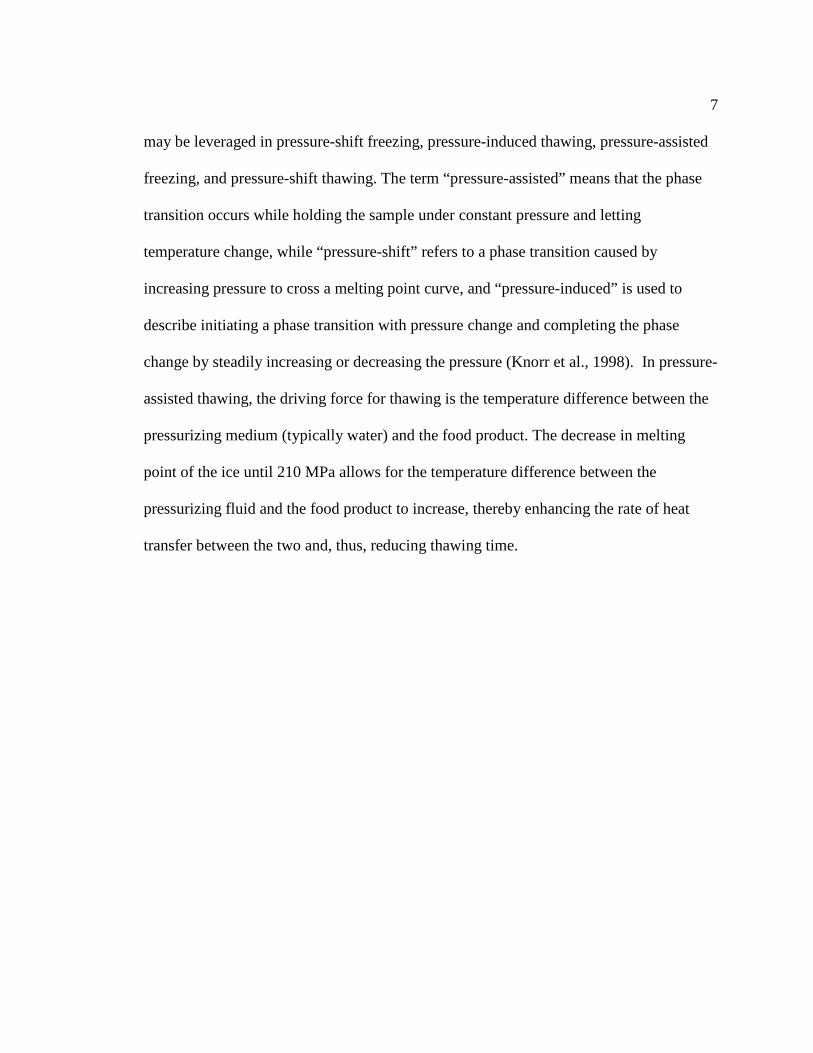
7 may be leveraged in pressure-shift freezing, pressure-induced thawing, pressure-assisted
freezing, and pressure-shift thawing. The term “pressure-assisted” means that the phase
transition occurs while holding the sample under constant pressure and letting
temperature change, while “pressure-shift” refers to a phase transition caused by
increasing pressure to cross a melting point curve, and “pressure-induced” is used to
describe initiating a phase transition with pressure change and completing the phase
change by steadily increasing or decreasing the pressure (Knorr et al., 1998). In pressure-
assisted thawing, the driving force for thawing is the temperature difference between the
pressurizing medium (typically water) and the food product. The decrease in melting
point of the ice until 210 MPa allows for the temperature difference between the
pressurizing fluid and the food product to increase, thereby enhancing the rate of heat
transfer between the two and, thus, reducing thawing time.

8
Figure 2.2. Different modes of high pressure freezing and thawing: pressure-shift freezing (acdf), pressure-induced thawing (fdca), pressure-assisted freezing (abef), and pressure-assisted thawing (feba). In reality, the terms pressure-shift, pressure-assisted, and pressure-induced are used interchangeably in the literature (Denys et al., 2001).
Table 2.1 summarizes studies that have explored HPT of raw meat products.
Rouillé et al. (2002) compared the drip volume from HPT treatment of frozen spiny
dogfish (Squalus acanthias) and frozen scallops (Pecten irradians) at 100-200 MPa for 6-
60 min at 10 °C to thawing in water at 12 °C for 60 min. They showed, overall, HPT was
faster than thawing in water and that drip losses in spiny dogfish after thawing was
significantly decreased with HPT, but only marginally decreased in scallops. In a similar
study, Chevalier et al. (1998) compared thawing of whiting fish (Gadus merlangus) at
50-200 MPa at 7-13 °C until core temperatures reached 5 °C to thawing in water at 10 °C
for 60 min. For HPT treatment, they also compared the effect of pressurization rate,
Pressure (MPa)
0 100 200 300 400 500
Tem
pera
ture
(o C)
-40
-30
-20
-10
0
10
20
30
40
a b c
def
Ice I Ice III
Ice II
Ice V
Liquid water

9 testing at two levels – 42 and 100 and 100 MPa min-1. For the HPT conditions tested,
they found the effective thawing times to be inversely proportional with pressure and
ranged from 15-35 min. The reduction in thawing time was by a factor of four. Drip
losses were higher at the lower ramping up rate and decreased with holding time, but
were, overall, not different from thawing in water. However, HPT at 150 MPa or greater
caused significant protein denaturation. Schubring et al. (2003) found similar results.
Color of redfish, whiting, and cod fillets were not changed by HPT, but discoloration, or
significant lightening, of salmon and rainbow trout was observed. Smaller but uniform
decreases in redness and increases in yellowness were observed. Thaw drip and microbial
quality, as measured by total aerobic counts (colony forming units per gram, cfu/g) and
Shewanella putrefaciens counts (cfu/g) were found to be lower with HPT compared to
thawing in water. However, HPT at 200 MPa led to denaturation of the muscle proteins,
which directly affected the quality deterioration assessed during sensory evaluation.
Similar results on discoloration of salmon (Salmo salar) fillets and decreased drip loss
with increasing pressure level by HPT at 200 MPa at 20 °C by Zhu et al. (2004) and in
silver pomfret (Pampus argenteus) by Cui et al. (2019) when processed at 150 MPa at 20
°C. HP-treated carp (Cyprinus carpio) lost their transparency, increasing in lightness as
pressure increased from 100 to 300 MPa, and showed protein denaturation (Yoshioka et
al., 1996). From these reports, HPT can be used to thaw fish fillets more rapidly than
thawing in water, with decreased drip losses but significant lightening in color and
protein denaturation at pressures at or above 150 MPa.

10 Table 2.1. Summary of high pressure thawing of animal proteins in the literature.
Meat product and sample size or form Pressure (MPa, gauge)
Holding time (min)
Reference
Spiny dogfish Fillets (150 x 100 x 30 mm3)
100-200
20-50 Rouillé et al. (2002)
Scallops Frozen packs holding 210 g, 2 cm thick
100-200 6-30 Rouillé et al. (2002)
Whiting Fillets (20-25 cm long x 15-20 mm thick)
50-200 15-35 Chevalier et al. (1998)
Various fish speciesa
Fillets frozen in 42 mm dia x 200 mm long cylindrical packs
200 60 Schubring et al. (2003)
Atlantic salmon
Fillets, 90 ± 15 g 100-200 17-23b Zhu et al. (2004)
Silver pomfret 100 ± 10 g 100-200 10 Cui et al. (2019)
Carp Whole, 600 g 100-300 10 Yoshioka et al. (1996)
Ground beef Frozen and molded in 120, 150, and 450 ml plastic beakers
140-350 5-30 Zhao et al. (1998)
Pork Cylinders (50 mm dia x 1900 mm long)
50-200 39-72 Park et al. (2006)
aCod, whiting, redfish, haddock, salmon, and rainbow trout. bPressure was held until product core temperature reached 10 °C.
For other animal proteins, Zhao et al. (1998) applied 140-350 MPa to thaw raw
ground beef at room temperature for 5-30 min. A color change ∆𝐸𝐸 = 2.81 was observed
at 210 MPa, which increased to 5.42 at 280 MPa, resulting from increased lightness (𝐿𝐿∗
value) and decreased redness (𝑎𝑎∗ value), which showed that the beef protein was
denatured by HPT but, at pressures below 210 MPa, the discoloration may only be
noticeable at a glance (Mokrzycki and Tatol, 2011). Application of HPT to pork was
carried out by Park et al. (2006). Frozen pork samples were treated at 50-200 MPa at 15
°C for 39-72 min. They found a significant increase in pH after HPT, owing to protein

11 denaturation (Angsupanich et al., 1999; Hong et al., 2005), decreased drip loss, and
significant color change at pressures above 150 MPa, as others have reported. The
whitening effect was attributed to globin denaturation and/or to heme displacement or
release that occur at 200-350 MPa (de Lamballerie-Anton et al., 2002).
To date, HPT has not been applied to raw poultry meats, but pasteurization by
HPP has (Table 2.2). Sheen et al. (2015) reports inactivating more than 5-log cfu/g of
Salmonella spp. in raw ground chicken when treated with HPP at 450 MPa for 10 min,
and greater than 7-log cfu/g reduction was achieved at 550 MPa for 10 min. Similarly,
Huang et al. (2018) reported log reduction in E. coli O157:H7 in ground chicken
increased from 0.43 to 2.67 log cfu/g as pressure was increased from 200 to 400 MPa and
applied at 4 °C for 15 min. No reduction in E. coli O157:H7 was achieved at pressures
below 200 MPa. For raw chicken breast fillets, Kruk et al. (2011) found reductions of
8.4- log cfu/g of E. coli, 3.3-log cfu/g Salmonella Typhimurium, and 7.3-log cfu/g of
Listeria monocytogenes, immediately after HPP treatment at 450 MPa for 5 min.
Similarly, Argyri et al. (2018) reported a 5-log reduction of Salmonella enterica and a
reduction in indigenous microbiota (Brochothrix thermosphacta, Pseudomonas spp.,
Enterobacteriaceae, lactic acid bacteria, yeast and molds, Salmonella spp., Listeria
monocytogenes, and Campylobacter spp.) to below detection limits in raw chicken breast
fillets within two days after HPP at 500 MPa for 10 min. Using poultry sausages, Yuste et
al. (2000) found at least a 7-log cfu/g reduction when treated at 500 MPa for at least 10
min at 50-70 °C, which was comparable to the reduction achieved through standard
cooking of the sausages at 75 °C for 30 min. Finally, in cooked chicken pureé (Gerber,

12 Fremont, MI, USA), at least 350 MPa for 10 min was needed to reduce Campylobacter
jejuni by 5-log cfu/g (Solomon and Hoover, 2004). These studies provide evidence that
HPP can be used to control for pathogens and spoilage microorganisms in raw and
cooked chicken products at holding times (5 min or greater) and temperatures (10 °C or
higher) that may be outside of typical processing parameters used by HPP tollers in the
U.S., which are 425-580 MPa for 5-7 min at 4-10 °C (Farkas and Hoover, 2000). Beyond
these ranges, HPP costs significantly increase.
Table 2.2. Summary of high pressure pasteurization of poultry meats in the literature.
Poultry product
Pathogen Pressure (MPa, gauge)
Holding time (min)
Temperature (°C)
Reference
Raw ground chicken
Salmonella spp. 250-550 5-15 6-10 Sheen et al. (2015)
Raw ground chicken
Escherichia coli O157:H7
250-350 10-20 -15 to 7 Huang et al. (2018)
Raw chicken breast fillets
Salmonella typhimurium
Escherichia coli
Listeria monocytogenes
300-600 5 15 Kruk et al. (2011)
Raw chicken breast fillets
Salmonella enterica ser. Enteriditis
500 10 18-20 Argyri et al. (2018)
Poultry sausage
Salmonella enteriditis
500 10, 30 50-70 Yuste et al. (2000)
Cooked chicken pureé
Campylobacter jejuni
100-400 10 25 Solomon and Hoover (2004)

13
Chapter 3. Materials and Methods
3.1. High pressure thawing
3.1.1. Experimental design
A completely randomized design (CRD) of one pressure (𝑃𝑃𝑔𝑔𝑔𝑔𝑔𝑔𝑔𝑔𝑔𝑔: 240 MPa) x four
holding times (𝑡𝑡: 1, 180, 360, and 540 s) x two pressurizing fluid temperatures [𝑇𝑇𝑓𝑓:
refrigerated (4-10 °C) and room (20-30 °C)] with three replications (i.e., HPP cycles) was
conducted using five chicken meat types (ground, 𝑀𝑀1; livers, 𝑀𝑀2; breast tenders, 𝑀𝑀3;
chicken thighs, 𝑀𝑀4; and gizzards, 𝑀𝑀5). A sixth meat type (hearts) was tested afterwards
with three subsamples in only one replication of each 𝑃𝑃-𝑡𝑡-𝑇𝑇𝑓𝑓 treatment combination, but
was not included in the statistical analysis of the CRD. All pressure values reported are
gauge pressures.
A set of preliminary tests were conducted in October and November 2018 to
assess these treatment levels. A description of the test procedures and their results are
summarized in Appendix A.
3.1.2. Sample preparation
Chicken meats were purchased from supermarkets in the Lincoln, NE area or
donated by a local raw pet food company. Meats were thawed at 4 °C prior to sample
preparation. For each meat type, a sample was prepared by packing 120-155 g of meat
into a 100 ml silicone beaker (SUPVOX, purchased from Amazon, LLC, Seattle, WA,
USA) using a digital scale (Model No. W-01-500 by WAOAW, purchased from Amazon,
LLC, Seattle, WA, USA; 0.01 g resolution), forming a 5.0 cm dia. x 7.06 cm height
sample (Figure 3.1). [𝐿𝐿∗𝑎𝑎∗𝑏𝑏∗]𝑟𝑟𝑔𝑔𝑓𝑓 measurements were taken at the top of each cylindrical

14 sample using a portable colorimeter (Model No. WR-10QC by CTI, purchased from
Amazon, LLC, Seattle, WA, USA) with an 8 mm aperture and D65 light source, and
recorded as the reference for subsequent color change (∆𝐸𝐸) calculations. A 6.0 cm long
bamboo skewer was placed along the centerline of the product, but only up to the center
point of the cylindrical product. The sample was then frozen at -10 °C for 8-12 h, after
which it was removed from the silicone mold and packed in a 15 cm x 20 cm pouch made
of 3-mil thick polyethylene plastic (Product No. S-956, Uline, Pleasant Prairie, WI,
USA). It was sealed at -90 kPa of vacuum pressure (Model No. VP250, VacMaster,
Overland Park, KS, USA). The packed sample was then returned to the -10 °C freezer
and stored until high pressure thawing. A total of 24 samples was prepared for each meat
type, for a grand total of 144 samples used in this experiment.
Figure 3.1. Preparing samples involved (a) filling 100 ml silicone beakers, (b) taking 𝐿𝐿*𝑎𝑎*𝑏𝑏* measurements prior to freezing, and (c) packing frozen samples in vacuum-
sealed pouches.
3.1.3. High pressure thawing
A sample each of 𝑀𝑀1-𝑀𝑀5 was loaded into the perforated stainless steel vessel, or
container, of a 2L HPP machine (Model FPG-9400, Stansted Fluid Power, Ltd., Harlow,
(a) (b) (c)

15 Essex, UK) (Figure 3.2). The vessel could hold a maximum of five samples given the
sample shape and size chosen in this study. The vessel was then attached to the loading
pins of the machine and lowered into the pressure chamber. The machine was
programmed to ramp up pressure at a rate of 240 MPa min-1 until 240 MPa was reached,
hold for 1, 180, 360, or 540 s (depending on test 𝑡𝑡), and ramp down pressure at a rate of
3000 MPa min-1.
Figure 3.2. Setting up the high pressure thawing tests involved (a) loading five samples into the vessel, (b) attaching the vessel to the hydraulic lift of the HPP equipment, (c) lowering the vessel into the pressure chamber, and (d) programming the ramp up and ramp down rates, pressure level, and holding time in the HPP equipment controller.
(a) (b)
(c) (d)
pressure chamber
controller

16 At the start of the HPP cycle, the pressurizing medium – propylene glycol
solution (20% v/v) – was pumped into the pressure chamber. It was cooled down to the
test 𝑇𝑇𝑓𝑓 using chilled ethylene glycol in the jacket surrounding the chamber (Figure 3.3).
Once the chamber was filled, pressure was built up by continuously pumping additional
pressurizing fluid into the chamber until 240 MPa was achieved, and then the pressure
was held for the set 𝑡𝑡. Practically, the high ramp down rate de-pressurized the chamber
instantaneously.
Figure 3.3. Example pressure- and temperature-time profiles during high pressure thawing at 240 MPa for 9 min at (a) refrigerated and (b) room temperatures.
3.1.4. Quality measurements
The treated samples were unloaded from the vessel and washed under cold
running tap water for 30 s. Each sample was unwrapped and its core temperature (𝑇𝑇𝑐𝑐) was
measured using a Type K thermocouple and datalogger (Model No. HH309A, Omega
Engineering, Inc., Norwalk, CT, USA) (Figure 3.4). The sample was manually separated
Time (min)
0 3 6 9 12
Pres
sure
(MPa
)
0
50
100
150
200
250
300
Time (min)
0 3 6 9 12
Flui
d te
mpe
ratu
re (o C)
0
5
10
15
20
25
30P = 240.2 ± 2.4 MPa
T = 19.4 ± 2.7 oC
P = 241.0 ± 2.9 MPa
T = 6.9 ± 3.7 oC
(a) (b)

17 into frozen (𝑚𝑚𝑓𝑓) and thawed (𝑚𝑚𝑡𝑡) portions. The thawed portion included the liquid purge.
Each portion was weighed using the same digital scale used in sample preparation.
𝐿𝐿∗𝑎𝑎∗𝑏𝑏∗ measurements of each fraction were taken using the same portable colorimeter
used prior to freezing the samples.
Figure 3.4. Quality measurements taken after high pressure thawing treatments included (a) core temperature, (b) mass fractions of frozen and thawed portions, and (c) 𝐿𝐿*𝑎𝑎*𝑏𝑏*
values.
3.1.5. Data analysis
∆𝐸𝐸𝑓𝑓 exhibited by the frozen portion was calculated against the initial [𝐿𝐿∗𝑎𝑎∗𝑏𝑏∗]𝑟𝑟𝑔𝑔𝑓𝑓
measurements of the fresh meat samples:
∆𝐸𝐸𝑓𝑓 = ��𝐿𝐿𝑓𝑓 − 𝐿𝐿𝑟𝑟𝑔𝑔𝑓𝑓�2
+ �𝑎𝑎𝑓𝑓 − 𝑎𝑎𝑟𝑟𝑔𝑔𝑓𝑓�2
+ �𝑏𝑏𝑓𝑓 − 𝑏𝑏𝑟𝑟𝑔𝑔𝑓𝑓�2 [3.1]
Likewise, ∆𝐸𝐸𝑡𝑡 exhibited by the thawed portion was calculated using Equation 3.1, using
the 𝐿𝐿∗𝑎𝑎∗𝑏𝑏∗ measurements of the thawed portion. Resulting ∆𝐸𝐸𝑓𝑓 and ∆𝐸𝐸𝑡𝑡 below a value of
1.0 were interpreted as having no perceptible color change from the fresh samples, while
those having a value of 1.0 to 2.0 had a color change that were perceptible through close
observation and/or by an experienced observer (Mokrzycki and Tatol, 2011). ∆𝐸𝐸 values
(c) (b) (a)

18 between 2.0 and 3.0 were color changes that were perceptible at a glance, even by an
inexperienced observer. A clear difference in color was deemed noticeable when ∆𝐸𝐸 was
between 3.0 and 5.0, and a significant color change occurred when ∆𝐸𝐸 was greater than
5.0.
Thawed percentage (𝑥𝑥𝑡𝑡) achieved was calculated as the percent mass fraction of
the thawed portion to the total meat sample:
𝑥𝑥𝑡𝑡 =𝑚𝑚𝑡𝑡
𝑚𝑚𝑓𝑓 + 𝑚𝑚𝑡𝑡× 100% [3.2]
while the thawing rate (�̇�𝑥𝑡𝑡) was the 𝑥𝑥𝑡𝑡 achieved with applied holding time (𝑡𝑡):
�̇�𝑥𝑡𝑡 =𝑥𝑥𝑡𝑡𝑡𝑡
× 100% =𝑚𝑚𝑡𝑡
�𝑚𝑚𝑓𝑓 + 𝑚𝑚𝑡𝑡�𝑡𝑡× 100% [3.3]
3.1.6. Statistical tests
Pearson correlation coefficients between meat type, holding time, pressurizing
fluid temperature, core temperature, color changes, thawed percentage, and thawing rate
were computed using the CORR procedure in SAS (Version 9.4, SAS Institute, Inc.,
Cary, NC, USA). Correlation was deemed strong when the coefficient was above 0.80,
moderate at coefficients between 0.60 to 0.80, and weak when coefficients were below
0.60. Significance was tested at α = 0.05 level. Means comparisons across treatments
were conducted using the analysis of variance (ANOVA) procedure in SAS. All SAS
codes are included in Appendix B.

19 3.2. Meat thawing in still air, still water, or a microwave
For comparison, chicken liver (𝑀𝑀2) samples were thawed in air or water, each at
two fluid temperatures [𝑇𝑇𝑓𝑓: refrigerated (4-10 °C) and room (20-30 °C)], for hours until
the samples had core temperatures above -2 °C.
3.2.1. Thawing in air
For each replication, four 𝑀𝑀2 subsamples were prepared according to the
procedures described in Section 3.1.2, except two subsamples had Type K thermocouples
inserted in them, instead of bamboo skewers. As there were three replications in this
experiment, a total of 12 subsamples were prepared.
During testing, four subsamples were placed in a container at either refrigerated
or room temperature. Type K thermocouples were used to monitor the core temperatures
of the third and fourth samples, as well as the air temperature, and were recorded by a
datalogger (Model HH309A, Omega Engineering, Inc., Norwalk, CT, USA). When the
average core temperature readings of the two subsamples outfitted with thermocouples
were between -6 to -8 °C, the first subsample was removed, its color measured, and
separated into frozen and thawed portions. The same quality measurements were
conducted to the second, third, and fourth subsamples when the average core temperature
readings reached -4 to -5, -2 to -2.5, and 0 to 1 °C, respectively.
3.2.2. Thawing in water
A total of 12 𝑀𝑀2 samples were prepared in the same manner as described in
Section 3.2.1. The same testing procedures and quality measurements (i.e., 𝐿𝐿∗𝑎𝑎∗𝑏𝑏∗, 𝑇𝑇𝑐𝑐,
𝑚𝑚𝑓𝑓, and 𝑚𝑚𝑡𝑡) described in Section 3.2.1 were used except the subsamples were submerged

20 in the same propylene glycol solution (20% v/v) used as the pressurizing fluid in the HPP
(Figure 3.5).
Figure 3.5. Top and side views of thawing in still water test.
3.2.3. Thawing in a microwave
A total of nine 𝑀𝑀2 samples were prepared in the same manner as described in
Section 3.2.1 and thawed in a 1200 W microwave at its lowest power setting (P10 or 10%
power) (Model No. MT4155SPQ, Whirlpool Corporation, Benton Harbor, MI, USA) at
either 2, 3, or 4 min. Afterwards, quality measurements (i.e., 𝐿𝐿∗𝑎𝑎∗𝑏𝑏∗, 𝑇𝑇𝑐𝑐, 𝑚𝑚𝑓𝑓, and 𝑚𝑚𝑡𝑡)
described in Section 3.2.1 were made.
3.2.4. Data and statistical analyses
Color change of the thawed portion only, thawed percentage, and thawing rate
were calculated in the same manner as described in Section 3.1.5 and were compared to
those found with high pressure thawing. For thawing in still air and still water,
temperature-time curves were generated using the average temperature data for the third
and fourth subsamples in each test. Thawing times for the first and second subsamples
were estimated by linearly interpolating the temperature-time curves and used to
calculate thawing rate. For microwave thawing, the time in the microwave was used to

21 calculate thawing rate. Means comparisons across thawing treatments and up to when
core temperatures reached -2 °C were conducted using the ANOVA procedure in SAS,
the code for which is included in Appendix B.

22
Chapter 4. High Pressure Thawing of Poultry Meats
4.1. Pressure- and temperature-time profiles
Pressure- and temperature-time profiles collected by the HPP equipment showed
that average pressures in the chamber achieved during testing ranged from 239.0-246.1
MPa with standard deviations increasing from 0.1-5.7 MPa, generally as 𝑡𝑡 increased
(Figures 4.1 to 4.3). While the HPP equipment’s chiller was set to 4 °C during testing at
refrigerated conditions, 𝑇𝑇𝑓𝑓 ranged from 4.1-18.7 °C. In the 12 total replications of testing
across four 𝑡𝑡, the average 𝑇𝑇𝑓𝑓 was at 10 °C or below for only four of those replications
(Figures 4.1 and 4.3). 𝑇𝑇𝑓𝑓 was not adequately controlled since the equipment was set up to
pump in pressurizing fluid at room temperature and it relied on the chilled water jacket of
the chamber to cool the fluid down. During shorter 𝑡𝑡 (e.g., 1, 180, and 360 s), there was
not enough time to cool the fluid down to the test 𝑇𝑇𝑓𝑓. Therefore, the temperature range for
refrigerated conditions in the experiments was modified to 4 to 19 °C. The replicated
tests conducted under room temperature conditions had 𝑇𝑇𝑓𝑓 ranging from 20 to 28 °C
(Figures 4.2 and 4.3).

23
Figure 4.1. Pressure- and temperature-time profiles of three replicated high pressure processing cycles at refrigerated temperatures, 240 MPa, and holding times of (a-c) 1 s, (d-f) 180 s, (g-i) 360 s, and (j-l) 540 s. Each replication contained one sample each of
ground chicken, livers, breast tenders, thighs, and gizzards.
Time (min)
0 3 6 9 12
Flui
d te
mpe
ratu
re (o C)
0
5
10
15
20
25
30
Time (min)
0 3 6 9 12
Time (min)
0 3 6 9 12
Pres
sure
(MPa
)
0
50
100
150
200
250
300
Flui
d te
mpe
ratu
re (o C)
0
5
10
15
20
25
30
Pres
sure
(MPa
)
0
50
100
150
200
250
300
Flui
d te
mpe
ratu
re (o C)
0
5
10
15
20
25
30
Pres
sure
(MPa
)
0
50
100
150
200
250
300
Flui
d te
mpe
ratu
re (o C)
0
5
10
15
20
25
30Pr
essu
re (M
Pa)
0
50
100
150
200
250
300
P = 243.6 ± 0.2 MPa
T = 16.9 ± 0.0 oC
P = 240.6 ± 0.1 MPa
T = 18.7 ± 0.1 oC
P = 239.8 ± 0.1 MPa
T = 12.8 ± 0.1 oC
P = 241.0 ± 3.8 MPa
T = 10.1 ± 3.6 oC
P = 239.5 ± 2.5 MPa
T = 13.2 ± 4.9 oC
P = 239.0 ± 5.7 MPa
T = 11.7 ± 3.4 oC
P = 245.7 ± 5.4 MPa
T = 14.3 ± 3.4 oC
P = 239.9 ± 2.7 MPa
T = 11.1 ± 3.5 oC
P = 240.5 ± 2.7 MPa
T = 8.5 ± 6.3 oC
P = 239.7 ± 2.6 MPa
T = 9.4 ± 4.1 oC
P = 239.5 ± 2.9 MPa
T = 9.2 ± 1.7 oC
P = 239.4 ± 2.8 MPa
T = 4.1 ± 3.6 oC
(a) (b) (c)
(d) (e) (f)
(g) (h) (i)
(j) (k) (l)
Replication 1 Replication 2 Replication 3

24
Figure 4.2. Pressure- and temperature-time profiles of three replicated high pressure processing cycles at room temperatures, 240 MPa, and holding times of (a-c) 1 s, (d-f)
180 s, (g-i) 360 s, and (j-l) 540 s. Each replication contained one sample each of ground chicken, livers, breast tenders, thighs, and gizzards.
Flui
d te
mpe
ratu
re (o C)
0
5
10
15
20
25
30
35
Time (min)
0 3 6 9 12
Flui
d te
mpe
ratu
re (o C)
0
5
10
15
20
25
30
35
Time (min)
0 3 6 9 12
Flui
d te
mpe
ratu
re (o C)
0
5
10
15
20
25
30
35
Pres
sure
(MPa
)
0
50
100
150
200
250
300
350Pr
essu
re (M
Pa)
0
50
100
150
200
250
300
350
Pres
sure
(MPa
)
0
50
100
150
200
250
300
350
Flui
d te
mpe
ratu
re (o C)
0
5
10
15
20
25
30
35
Time (min)
0 3 6 9 12
Pres
sure
(MPa
)
0
50
100
150
200
250
300
350
P = 242.8 ± 0.1 MPaT = 28.1 ± 0.1 oC
P = 245.3 ± 0.1 MPaT = 24.4 ± 0.2 oC
P = 241.3 ± 0.4 MPaT = 26.6 ± 0.1 oC
P = 240.6 ± 2.9 MPaT = 21.7 ± 2.4 oC
P = 240.6 ± 4.0 MPaT = 23.6 ± 2.1 oC
P = 241.7 ± 2.3 MPaT = 26.8 ± 4.0 oC
P = 241.0 ± 4.0 MPaT = 24.1 ± 2.8 oC
P = 240.7 ± 2.9 MPaT = 18.8 ± 3.1 oC
P = 240.2 ± 3.0 MPaT = 22.7 ± 3.3 oC
P = 240.3 ± 2.9 MPaT = 22.4 ± 2.2 oC
P = 240.7 ± 3.2 MPaT = 22.0 ± 2.5 oC
P = 240.5 ± 3.2 MPaT = 22.0 ± 3.2 oC
(a) (b) (c)
(d) (e) (f)
(g) (h) (i)
(j) (k) (l)
Replication 1 Replication 2 Replication 3

25
Figure 4.3. Pressure- and temperature-time profiles of one high pressure processing cycle at refrigerated and room temperatures, 240 MPa, and holding times of (a-b) 1 s, (c-d) 180 s, (e-f) 360 s, and (g-h) 540 s. Each replication contained three samples of chicken
hearts.
Pres
sure
(MPa
)
0
50
100
150
200
250
300
Pres
sure
(MPa
)
0
50
100
150
200
250
300
Flui
d te
mpe
ratu
re (o C)
0
5
10
15
20
25
30
Flui
d te
mpe
ratu
re (o C)
0
5
10
15
20
25
30
Pres
sure
(MPa
)
0
50
100
150
200
250
300
Flui
d te
mpe
ratu
re (o C)
0
5
10
15
20
25
30
P = 239.9 ± 2.9 MPaT = 22.9 ± 1.6 oC
P = 246.1 ± 0.1 MPaT = 25.3 ± 0.1 oC
P = 241.1 ± 3.6 MPaT = 20.6 ± 2.8 oC
P = 239.8 ± 2.7 MPa
T = 10.1 ± 3.2 oC
P = 240.4 ± 2.7 MPa
T = 10.7 ± 3.2 oC
P = 244.1 ± 0.8 MPaT = 16.8 ± 0.2 oC
Time (min)
0 3 6 9 12
Pres
sure
(MPa
)
0
50
100
150
200
250
300
Time (min)
0 3 6 9 12
Flui
d te
mpe
ratu
re (o C)
0
5
10
15
20
25
30P = 240.2 ± 2.4 MPa
T = 19.4 ± 2.7 oC
P = 241.0 ± 2.9 MPa
T = 6.9 ± 3.7 oC
(a) (b)
(c) (d)
(e) (f)
(g) (h)
Refrigerated Room temperature

26
4.2. Pearson correlation coefficients
Pearson correlation coefficients showed that the three test variables – 𝑇𝑇𝑓𝑓, 𝑡𝑡, and 𝑀𝑀
– were independent of each other (Table 4.1). Of the response variables, the strongest
correlation was found between 𝑥𝑥𝑡𝑡 and 𝑡𝑡 (𝑝𝑝 < 0.0001), followed by moderate correlations
between 𝑇𝑇𝑐𝑐 and 𝑡𝑡 (𝑝𝑝 < 0.0001), �̇�𝑥𝑡𝑡 and 𝑡𝑡 (𝑝𝑝 < 0.0001), 𝑇𝑇𝑐𝑐 and 𝑥𝑥𝑡𝑡 (𝑝𝑝 < 0.0001), and 𝑥𝑥𝑡𝑡 and
�̇�𝑥𝑡𝑡 (𝑝𝑝 < 0.0001). Other response variables were weakly correlated with each other (Table
4.1). 𝑀𝑀 was found was not correlated with any of the response variables, except with 𝑇𝑇𝑐𝑐,
but that correlation was weak.
Table 4.1. Pearson correlation coefficients among independent and dependent, or response, variables.
𝑡𝑡a 𝑀𝑀 𝑇𝑇𝑐𝑐 ∆𝐸𝐸𝑓𝑓 ∆𝐸𝐸𝑡𝑡 𝑥𝑥𝑡𝑡 �̇�𝑥𝑡𝑡 Processing fluid temperature (𝑇𝑇𝑓𝑓, °C)
0.0 0.0 0.387** 0.094 0.185* 0.231* 0.069
Holding time (𝑡𝑡, s) 0.0 0.612** 0.509** 0.415** 0.922** -0.741**
Meat type (𝑀𝑀) 0.361** 0.127 0.112 0.060 0.000
Core temperature (𝑇𝑇𝑐𝑐, °C)
0.525** 0.467** 0.744** -0.386
Color change – frozen portion (∆𝐸𝐸𝑓𝑓)
0.494** 0.537** 0.127
Color change – thawed portion (∆𝐸𝐸𝑡𝑡)
0.476** -0.389**
Thawed percentage (𝑥𝑥𝑡𝑡, % w/w)
-0.689**
Thawing rate (�̇�𝑥𝑡𝑡, % min-1)
aIndependent variables: processing fluid temperature (𝑇𝑇𝑓𝑓), holding time (𝑡𝑡), meat type (𝑀𝑀) were not correlated. Five chicken meat types (ground, liver, breast tenders, thighs, and gizzards) were included in this analysis. Data for chicken hearts were excluded.
*Statistical significance uses 𝑝𝑝 ≤ 0.05. **Statistical significance uses 𝑝𝑝 ≤ 0.01.

27 4.3 Color change
Color change (∆𝐸𝐸𝑓𝑓 and ∆𝐸𝐸𝑡𝑡) were found to be constant with 𝑇𝑇𝑓𝑓, but increased with
𝑡𝑡, as suggested by the Pearson correlation coefficients (Figure 4.4). However, the overall
average ∆𝐸𝐸𝑓𝑓 and ∆𝐸𝐸𝑡𝑡 values were between 0.5 and 1.5, which meant the changes brought
on by HPT at 240 MPa were perceptible only through close observation or by trained
professionals. Thighs and organ meats (liver, gizzards and hearts), which typically have a
dark color, exhibited the highest ∆𝐸𝐸 values so any denaturation caused by pressure or
temperature would be noticeable.
4.4. Core temperature
𝑇𝑇𝑐𝑐 increased with 𝑇𝑇𝑓𝑓 and 𝑡𝑡 (Figure 4.5) and, on average, ranged from -2 to -4 °C
after HPT, which falls within the range of -2 to -5 °C that is typically desired for
tempering in the meat industry. The average 𝑇𝑇𝑐𝑐 as 𝑡𝑡 increased from 1, 180, 360 to 540 s
were -4.2, -3.5, -2.7, and -2.2 °C, respectively. Based on preliminary tests that showed
average initial temperatures of the frozen meat samples were -10 °C, it was remarkable to
see that even 1.2 min of processing time (i.e., pressure ramp up time plus 1 s of holding
time) at 240 MPa, could deliver a difference of at least -6 °C in 𝑇𝑇𝑐𝑐. Among the meat types
tested, gizzards exhibited the highest 𝑇𝑇𝑐𝑐 values followed by thighs, liver, and breast
tenders. Ground chicken had the lowest average 𝑇𝑇𝑐𝑐. The three subsamples of chicken
hearts had a comparable average 𝑇𝑇𝑐𝑐 as the other organ meats – livers and gizzards. There
were no interactions between independent variables (i.e., 𝑇𝑇𝑓𝑓 × 𝑡𝑡, 𝑝𝑝 = 0.21; 𝑇𝑇𝑓𝑓 × 𝑀𝑀, 𝑝𝑝 =
0.78; and 𝑀𝑀 × 𝑡𝑡, 𝑝𝑝 = 1.00).

28
Figure 4.4. Variations in color change (∆𝐸𝐸) of raw chicken meats after high pressure thawing at 240 MPa across different (a) processing fluid temperatures, 𝑇𝑇𝑓𝑓; (b) holding times, 𝑡𝑡; and (c) meat type, 𝑀𝑀. Solid boxplots represent color change for frozen meat
portion after high pressure thawing (HPT), while hashed boxplots represent color change for thawed meat portion. Solid circles represent samples that fall outside the 10th and 90th
percentiles. All data below the dashed line, ∆𝐸𝐸 = 2.0, show no perceptible change in color. *Data for chicken hearts and pooled color data for all samples are shown here for
comparison only.
Holding time (s)Processing fluid temperature (oC)
Colo
r cha
nge
(DE f o
r DE t)
0.0
0.5
1.0
1.5
2.0
2.5
3.0
3.5
Refrigerated (4-19oC)
Room (20-28oC)
1 180 360 540
(a) (b)
Meat type
Colo
r cha
nge
(DE f o
r DE t)
0.0
0.5
1.0
1.5
2.0
2.5
3.0
3.5(c)
Ground Liver Breast tenders
Thigh Gizzard Heart All*

29
Figure 4.5. Variations in core temperature (𝑇𝑇𝑐𝑐) of raw chicken meats after high pressure thawing at 240 MPa across different (a) processing fluid temperatures, 𝑇𝑇𝑓𝑓; (b) holding
times, 𝑡𝑡; and (c) meat type, 𝑀𝑀. Solid circles above and below each boxplot represent the 5th and 95th percentiles. The dashed reference lines show the range (-2 to -5 °C) of
tempered meat temperatures used in the food industry. Means with the same letter do not differ significantly (𝑝𝑝 > 0.05). *Data for chicken hearts are shown here for comparison
only, but were not included in the analysis of variance (ANOVA).
Fluid temperature (TF, oC)
Core
tem
pera
ture
(Tc, o C)
-8
-6
-4
-2
0
2
Holding time (t, min)
Chicken meat type (M)
Core
tem
pera
ture
(Tc, o C)
-8
-6
-4
-2
0
2
Refrigerated(4-19 oC)
Room(20-28 oC)
1 180 360 540
Ground Liver Breast Thigh Gizzard Heart(1 rep w/3
subsamples)
-2.67a-3.63b -2.22a-2.68a-3.51b-4.21c
-2.48a-2.95ab-3.19b -3.20b-3.94c
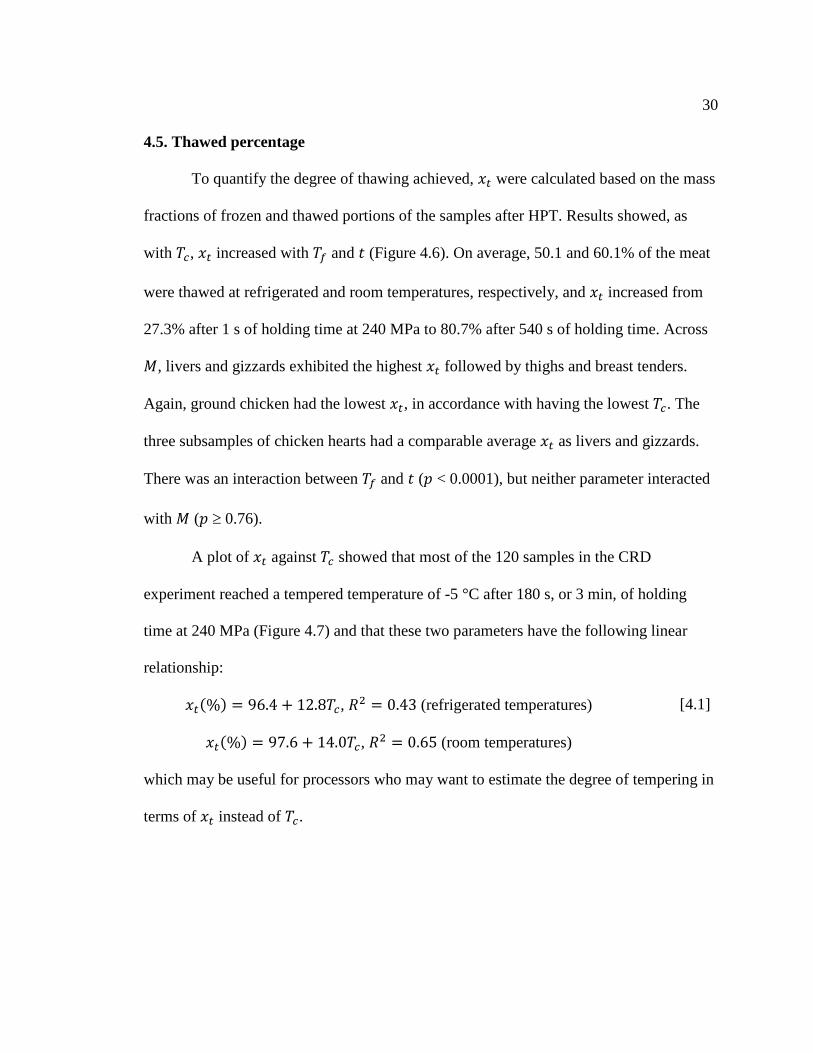
30 4.5. Thawed percentage
To quantify the degree of thawing achieved, 𝑥𝑥𝑡𝑡 were calculated based on the mass
fractions of frozen and thawed portions of the samples after HPT. Results showed, as
with 𝑇𝑇𝑐𝑐, 𝑥𝑥𝑡𝑡 increased with 𝑇𝑇𝑓𝑓 and 𝑡𝑡 (Figure 4.6). On average, 50.1 and 60.1% of the meat
were thawed at refrigerated and room temperatures, respectively, and 𝑥𝑥𝑡𝑡 increased from
27.3% after 1 s of holding time at 240 MPa to 80.7% after 540 s of holding time. Across
𝑀𝑀, livers and gizzards exhibited the highest 𝑥𝑥𝑡𝑡 followed by thighs and breast tenders.
Again, ground chicken had the lowest 𝑥𝑥𝑡𝑡, in accordance with having the lowest 𝑇𝑇𝑐𝑐. The
three subsamples of chicken hearts had a comparable average 𝑥𝑥𝑡𝑡 as livers and gizzards.
There was an interaction between 𝑇𝑇𝑓𝑓 and 𝑡𝑡 (𝑝𝑝 < 0.0001), but neither parameter interacted
with 𝑀𝑀 (𝑝𝑝 ≥ 0.76).
A plot of 𝑥𝑥𝑡𝑡 against 𝑇𝑇𝑐𝑐 showed that most of the 120 samples in the CRD
experiment reached a tempered temperature of -5 °C after 180 s, or 3 min, of holding
time at 240 MPa (Figure 4.7) and that these two parameters have the following linear
relationship:
𝑥𝑥𝑡𝑡(%) = 96.4 + 12.8𝑇𝑇𝑐𝑐, 𝑅𝑅2 = 0.43 (refrigerated temperatures)
𝑥𝑥𝑡𝑡(%) = 97.6 + 14.0𝑇𝑇𝑐𝑐, 𝑅𝑅2 = 0.65 (room temperatures)
[4.1]
which may be useful for processors who may want to estimate the degree of tempering in
terms of 𝑥𝑥𝑡𝑡 instead of 𝑇𝑇𝑐𝑐.

31
Figure 4.6. Variations in thawed percentage (𝑥𝑥𝑡𝑡) of raw poultry meats after high pressure
thawing at 240 MPa across different (a) processing fluid temperatures, 𝑇𝑇𝑓𝑓; (b) holding times, 𝑡𝑡; and (c) meat type, 𝑀𝑀. Solid circles above and below each boxplot represent the 5th and 95th percentiles. Means with the same letter do not differ significantly (𝑝𝑝 > 0.05). *Data for chicken hearts are shown here for comparison only, but were not included in
the analysis of variance (ANOVA.)
Fluid temperature (TF, oC)
Thaw
ed p
erce
ntag
e (x
t, %)
0
20
40
60
80
100
Holding time (t, min)
Chicken meat type (M)
Thaw
ed p
erce
ntag
e (x
t, %)
0
20
40
60
80
100
Refrigerated(4-19 oC)
Room(20-28 oC)
1 180 360 540
Ground Liver Breast Thigh Gizzard Heart(1 rep w/3
subsamples)
60.1a50.1b 80.7a65.6b46.7c27.3d
57.9ab54.2bc60.7a 52.6c50.1c

32
Figure 4.7. Relationship between thawed percentage (𝑥𝑥𝑡𝑡) and core temperature (𝑇𝑇𝑐𝑐).
4.6. Thawing rate
When 𝑥𝑥𝑡𝑡 values were normalized to 𝑡𝑡, the average �̇�𝑥𝑡𝑡 for 1 s were 100 times
greater than those for the other treatments – i.e., 1618 % min-1 for 1 s vs. 15.6, 10.9, and
9.0 % min-1 for 180, 360, and 540 s of holding at 240 MPa (Figure 4.8). Therefore, for
the ANOVA, �̇�𝑥𝑡𝑡 data for 1 s were excluded. ANOVA results showed that average �̇�𝑥𝑡𝑡
increased with 𝑇𝑇𝑓𝑓 – 10.5 and 13.2 % min-1 at refrigerated and room temperatures,
Thaw
ed p
erce
ntag
e (x
t, %)
0
20
40
60
80
100
Core temperature (Tc, oC)
-8 -6 -4 -2 0 2
Thaw
ed p
erce
ntag
e (x
t, %)
0
20
40
60
80
100
Refrigerated(4-19 oC)
Room(20-28 oC)
1 s
1 s
180 s
180 s
360 s
360 s
540 s
540 s

33 respectively, and followed the same trends with 𝑀𝑀 as 𝑥𝑥𝑡𝑡. The average �̇�𝑥𝑡𝑡 decreased
exponentially with 𝑡𝑡. Because of the batch nature of HPP, costs of HPT are expected to
remain high and there will be a diminishing return on thawing over processing time, i.e.,
there was less thawing that occurred as holding time was extended. The difference in
average �̇�𝑥𝑡𝑡 values between 360 s and 540 s was 1.9 % min-1, which when multiplied by
the 3 min extension time, led to only an additional 5.7 % (w/w) of meat thawed.
Depending on the amount or volume of raw product to be thawed, such small gains in
thawed percentage may be achieved cost-effectively during cold storage after HPT
treatment. As with 𝑇𝑇𝑐𝑐 and 𝑥𝑥𝑡𝑡, livers and gizzards had the highest �̇�𝑥𝑡𝑡, followed by thighs,
breast tenders, and ground chicken. As with 𝑥𝑥𝑡𝑡, there was an interaction between 𝑇𝑇𝑓𝑓 and 𝑡𝑡
(𝑝𝑝 < 0.0001), but neither parameter interacted with 𝑀𝑀 (𝑝𝑝 > 0.50).

34
Figure 4.8. Variations in thawing rate (�̇�𝑥𝑡𝑡) of raw chicken meats after high pressure thawing at 240 MPa across different (a) processing fluid temperatures, 𝑇𝑇𝑓𝑓; (b) holding
times, 𝑡𝑡; and (c) meat type, 𝑀𝑀. Solid circles above and below each boxplot represent the 5th and 95th percentiles. Means with the same letter do not differ significantly (𝑝𝑝 > 0.05). *Data for 1 s holding time and for chicken hearts are shown here for comparison only,
but were not included in the analysis of variance (ANOVA.)
Fluid temperature (TF, oC)
Thaw
ing
rate
(% m
in-1
)*
1
10
100
1000
Holding time (t, min)
Chicken meat type (M)
Thaw
ing
rate
(% m
in-1
)*
0
5
10
15
20
25
Refrigerated(4-19 oC)
Room(20-28 oC)
1 180 360 540
Ground Liver Breast Thigh Gizzard Heart(1 rep w/3
subsamples)
13.2a10.5b 8.97c10.9b15.6a
12.6ab11.6bc13.0a 11.2c10.7c

35
Chapter 5. Thawing Chicken Livers in Still Air, Still Water,
and a Microwave
5.1. Temperature-time profiles
Temperature-time profiles from thawing in still air at refrigerated (4 °C) and room
(21 °C) temperatures are shown in Figure 5.1. On average, thawing at 4 °C took 11.0 ±
1.0 h while, at 21 °C, thawing time was reduced to 4.3 ± 0.5 h. Thawing in still water, on
the other hand, was much faster. On average, it took just under 4.3 ± 0.6 h to thaw at 4 oC
and, approximately, 1.3 ± 0.1 h to thaw at 21 oC (Figure 5.2). Thawing in a microwave at
10% power level took, on average, 3 min.
5.2. Color change
The average ∆𝐸𝐸𝑡𝑡 for thawing in still air at 4 and 21°C were 2.62 and 1.97,
respectively, and were comparable to those found for thawing in still water, 1.63 and
1.32, at the same temperatures, respectively (Table 5.1). These values suggest the color
changes observed at these thawing treatments were minimal and comparable those
observed for HPT at 240 MPa, which were 1.27 at 4 °C and 1.39 at 20 °C. These color
changes were one order of magnitude less than those observed with microwave thawing
(∆𝐸𝐸 = 11.5).

36
Figure 5.1. Temperature-time profiles from three replications of thawing chicken liver samples in still air at refrigerated and room temperatures.
Tem
pera
ture
(o C)
-10
0
10
20Te
mpe
ratu
re (o C)
-10
0
10
20
Tem
pera
ture
(o C)
-10
0
10
20
4.4 ± 2.9
4.2 ± 1.8
4.3 ± 2.6
Tem
pera
ture
(o C)
-10
0
10
20
30 20.6 ± 2.4
Tem
pera
ture
(o C)
-10
0
10
20
30 21.6 ± 0.6
0 60 120 180 240 300 360 420 480 540 600 660 720 780
Tem
pera
ture
(o C)
-10
0
10
20
3021.7 ± 0.8
Time (min)
air
average core
Replication 1
Replication 2
Replication 3
Replication 1
Replication 2
Replication 3

37
Figure 5.2. Temperature-time profiles from three replications of thawing chicken liver samples in still water at refrigerated and room temperatures.
Tem
pera
ture
(o C)
-20
-10
0
10Te
mpe
ratu
re (o C)
-20
-10
0
10
Tem
pera
ture
(o C)
-20
-10
0
10
Tem
pera
ture
(o C)
-20-10
0102030
Tem
pera
ture
(o C)
-20-10
0102030
Time (min)
0 60 120 180 240 300
Tem
pera
ture
(o C)
-20-10
0102030
3.4 ± 2.1 water
average core
3.9 ± 1.9
3.5 ± 1.4
17.2 ± 1.3
17.4 ± 1.2
16.8 ± 1.0
Replication 1
Replication 2
Replication 3
Replication 1
Replication 2
Replication 3

38 Table 5.1. Comparison of mean quality measurementsa of thawing chicken liver in still air, still water, microwave, and high pressure thawing (HPT) at 240 MPa.
Still air Still water Microwave HPT at 240 MPa 4 °C 20 °C 4 °C 20 °C 4 °C 20 °C
Color change – thawed portion (∆𝐸𝐸𝑡𝑡)
2.62b 1.97b 1.63b 1.32b 11.5a 1.27b 1.39b
Core temperature (𝑇𝑇𝑐𝑐) -4.2ab -4.3b -4.2ab -4.4b -3.6ab -3.5ab -2.2a
Thawed percentage (𝑥𝑥𝑡𝑡) 44.1c 46.9bc 51.3bc 55.1bc 84.5a 65.8abc 74.0ab
Thawing rate (�̇�𝑥𝑡𝑡) 0.30c 0.54c 1.06c 2.00c 29.6a 12.0b 13.9b aAcross the row, means with the same letter do not differ significantly (𝑝𝑝 > 0.05).
5.3. Core temperature, thawed percentage, and thawing rate
Of the thawing treatments tested, HPT at 240 MPa and 20 °C delivered the
highest 𝑇𝑇𝑐𝑐, followed by HPT at 240 MPa and 4 °C, microwave thawing, and thawing in
either still air or water at 4 °C. Average 𝑇𝑇𝑐𝑐 were lowest at thawing in either still air or
water at 20 °C. Microwave thawing yielded the highest 𝑥𝑥𝑡𝑡 and �̇�𝑥𝑡𝑡, followed by HPT at
240 MPa, thawing in still water, and then thawing in still air. While HPT at 240 MPa had
�̇�𝑥𝑡𝑡 values half that of microwave thawing, 10 times greater than that of thawing in still
water, and 22-45 times greater than that of thawing in still air, it was also the thawing
treatment that delivered the lowest ∆𝐸𝐸𝑡𝑡. These results for HPT at 240 MPa are favorable
to raw meat processors looking for a rapid thawing technique that maximizes the
microbial quality of their product, while minimizing adverse color changes during
thawing.

39
Chapter 6. Conclusions and Future Work
In this thesis, HPT of raw chicken meats was achieved at 240 MPa for 0.1 to 540
s, at either refrigerated or room temperatures. Results showed that while lightness (𝐿𝐿∗
value) of the raw meats increased and their redness (𝑎𝑎∗ value) decreased, overall ∆𝐸𝐸 were
below 2.0 and not noticeable beyond close inspection or by an experienced observer.
Across the treatment combinations tested, 𝑇𝑇𝑐𝑐 reached tempering temperatures (-2 to -5
°C) typically used in the meat processing industry. Since the samples were effectively
tempered, they were easy to manipulate and separate into frozen and thawed portions. 𝑇𝑇𝑐𝑐
and 𝑥𝑥𝑡𝑡 were moderately correlated. As 𝑡𝑡 increased, 𝑇𝑇𝑐𝑐 and 𝑥𝑥𝑡𝑡 increased, but �̇�𝑥𝑡𝑡 decreased,
suggesting that there was not much benefit in HPT treatment beyond 6 min since HPP
costs would increase at a faster rate than thawing would.
Of the different thawing treatments tested, microwave thawing yielded the highest
∆𝐸𝐸𝑡𝑡 and �̇�𝑥𝑡𝑡, thawing in still air and still water yielded the lowest �̇�𝑥𝑡𝑡. HPT at 240 MPa
resulted in the lowest ∆𝐸𝐸𝑡𝑡 and �̇�𝑥𝑡𝑡 values half that microwave thawing but at least 10 times
greater than those found in thawing in still air and still water. These results make HPT a
favorable thawing technique for meat processor who want fast thawing rates that induce
zero color change to their raw products.
The following suggestions are made to improve the methods used in the study.
First, a thermal imaging camera may provide a quick estimate of the temperature
distribution across the surface and cross-section of the HPT-treated meat product, after it
has been sliced (Figure 6.1a and 6.1b). This may provide a better measure of meat

40 tempering without manually separating the product into its thawed and frozen portions,
during which warm hands could further thaw the product.
Figure 6.1. A thermal imaging camera was used to show (a) the temperature distributions over the product surface and along its cross section and (b) the temperatures at select
points on its surface and core.
Second, the 2L HPP equipment (Model FPG-9400, Stansted Fluid Power Ltd.,
Harlow, Essex, UK) was capable of logging core temperatures of two samples held under
pressure, but the thermocouple connectors were fractured, allowing processing fluid to
seep into the connectors and de-stabilize temperature measurements. Replacing these
connectors would enable researchers to log core temperatures during HPT and allow for a
more accurate estimate of 𝑇𝑇𝑐𝑐 and �̇�𝑥𝑡𝑡. Finally, in order for meat processors to adopt HPT,
its scalability will need to be tested and thawing rates will need to be determined for
industrial-size meat samples (at least 1 kg and slab or cylindrical shapes).
(a) (b)

41
References
Angsupanich, K. & Ledward, D.A. (1998). High pressure treatment effects on cod (Gadus morhua) muscle. Food Chemistry, 63, 39-50.
Argyri, A.A., Papadopoulou, O.S., Nisiotou, A., Tassou, C.C., & Chorianopoulos, N. (2018). Effect of high pressure processing on the survival of Salmonella enteriditis on shelf-life of chicken fillets. Food Microbiology, 70, 55-64.
Barbosa-Cánovas, G.V., Pothakaramury, U.R., Palou, E., & Swanson, B.G. (1997). Nonthermal Preservation of Foods, New York, NY: Marcel Dekker, Inc.
Chaplin, M. Water phase diagram. (2019). http://www1.lsbu.ac.uk/water/water_phase_diagram.html Accessed 1, March 2019.
Chevalier, D., Le Bail, A., Chourot, J.M., & Chantreau, P. (1999). High pressure thawing of fish (whiting): Influence of the process parameters on drip losses. Lebensmittel-Wissenschaft & Technologie, 32, 25-31.
Considine, K.M., Kelly, A.L., Fitzgerald, G.F., Hill, C., & Sleator, R.D. (2008). High-pressure processing – effects on microbial food safety and food quality. FEMS Microbial Letters, 281(1), 1-9.
Cui, Y., Xuan, X., Ling, J., Liao, X., Zhang, H., Shang, H., & Lin, X. (2019). Effects of high hydrostatic pressure-assisted thawing on the physicochemical characteristics of silver pomfret (Pampus argenteus). Food Science and Nutrition, 7, 1573-1583.
de Lamballerie-Anton, M., Taylor, R.G., & Culioli, J. (2002). High pressure processing of meat. In: Meat Processing Improving Quality, edited by Kerry, J.S., Kerry, J.H., & Ledward, D. New York: CRC Press, pp. 318-319.
Denys, S., Schluter, O., Henrickz, E.G., & Knorr, D. (2001). Effects of high pressure on water-ice transitions in foods. In: Ultra High Pressure Treatments of Foods, edited by Hendrickx, M.E.G. & Knorr, D. New York, NY: Kluwer Academic/Plenum Publishers, pp. 215-248.
Farkas, D.F. & Hoover, D.G. (2000). High pressure processing. Kinetics of microbial inactivation for alternative food processing technologies. Journal of Food Science, 65(s8), 47-64.
Hite, B.H. (1899). The effect of pressure in the preservation of milk: a preliminary report. Bulletin of the West Virginia Agricultural Experiment Station of Morgantown, W.V., 54, 15-35.

42 Hong, G.P., Park, S.H., Kim, J.Y., Lee, S.K., & Min, S.G. (2005). Effects of time-
dependent high pressure treatment on physico-chemical properties of pork. Food Science and Biotechnology, 14, 808-812.
Hu, C.Q., Chen, H.B., Gao, J.Y., Luo, C.P., Ma, X.J., & Tong, P. (2011). High-pressure microfluidisation-induced changes in the antigenicity and conformation of allergen Ara h 2 purified from Chinese peanut. Journal of the Science of Food and Agriculture, 91, 1304-1309.
Huang, C-Y., Sheen, S., Sommers, C., & Sheen, L-Y. (2018). Modeling the survival of Escherichia coli O157:H7 under hydrostatic pressure, process temperature, time, and allyl isothiocyanate stresses in ground chicken meat. Frontiers in Microbiology, 9, 1871.
Johnson, P.E., Van der Plancken, I., Balasa, A., Husband, F.A., Grauwet, T., Hendrickx, M., Knorr, D., Mills, E.N.C., & Mackie, A.R. (2010). High pressure, thermal and pulsed electric field-induced structural changes in selected food allergens. Molecural Nutrition and Food Research, 54(12), 1701-1710.
Knorr, D., Schlueter, O., & Heinz, V. (1998). Impact of high hydrostatic pressure on phase transitions of foods. Food Technology, 52(9), 42-45.
Kruk, Z.A., Yun, H., Rutley, D.L., Lee, E.J., Kim, Y.J., & Jo, C. (2011). The effect of high pressure on microbial population, meat quality and sensory characteristics of chicken breast fillet. Food Control, 22(1), 6-12.
Li, H., Zhu, K., Zhou, H., & Peng W. (2012). Effects of high hydrostatic pressure treatment on allergenicity and structural properties of soybean protein isolate for infant formula. Food Chemistry 132, 808-814.
Li, Y., Yang, W., Chung, S.Y., Chen, H., Ye, M., Teixeira, A.A., Gregory, J.F., Welt, B.A., & Shriver, S. (2013). Effect of pulsed ultraviolet light and high hydrostatic pressure on the antigenicity of almond protein extracts. Food Bioprocess Technology, 6, 431-440.
Ma, L. & Su, Y-C. (2011). Validation of high pressure processing for inactivating Vibrio parahaemolyticus in Pacific oysters (Crassostrea gigas). International Journal of Food Microbiology 144, 469-474.
Mertens, B. & Deplace G. (1993). Engineering aspects of high pressure technology in the food industry. Food Technology, 47(6), 164-169.
Mokrzycki, W.S. & Tatol, M. (2011). Colour difference Delta E – A survey. Machine Graphics and Vision, 20(4), 383-412.

43 Park, S.H., Ryu, H.S., Hong, G.P., & Min, S.G. (2006). Physical properties of frozen
pork thawed by high pressure assisted thawing process. Food Science and Technology International, 12(4), 347-352.
Rastogi, N.K., Raghavarao, K.S.M.S., Balasubramaniam, V.M., Niranjan, K., & Knorr, D. (2007). Opportunities and challenges in high pressure processing of foods. Critical Reviews in Food Science and Nutrition, 47(1), 69-112.
Rouillé, J., Lebail, A., Ramaswamy, H.S. & Leclerc, L. (2002). High pressure thawing of fish and shellfish. Journal of Food Engineering, 53, 83-88.
Schubring, R., Meyer, C., Schlüter, O., Boguslawski, S., & Knorr, D. (2003). Impact of high pressure thawing on the quality of fillets from various fish species. Innovative Food Science and Emerging Technologies, 4, 257-267.
Sheen, S., Cassidy, J., Scullen, B., Uknalis, J., & Sommers, C. (2015). Inactivation of Salmonella spp. in ground chicken using high pressure processing. Food Control 57, 41-47.
Simonin, H., Duranton, F. & de Lamballerie, M. (2012). New insights into the high-pressure processing of meat and meat products. Comprehensive Reviews in Food Science and Food Safety, 11(3), 285-306.
Solomon, E.B. & Hoover, D.G. (2004). Inactivation of Campylobacter jejuni by high hydrostatic pressure. Letters in Applied Microbiology, 38, 505-509.
Thakur, B. & Nelson, P. (1998). High pressure processing and preservation of food. Food Reviews International, 14(4), 427-447.
United States Department of Agriculture Food Safety Inspection Service. (2014). FSIS Compliance Guideline: Controlling Listeria monocytogenes in Post-Lethality Exposed Ready-to-Eat Meat and Poultry Products. Washington, DC: USDA FSIS.
Visiongain. The Food High Pressure Processing (HPP) Technologies Market Forecast 2015-2025: Pascalisation & Bridgmanisation Report. (2015). https://www.visiongain.com/report/the-food-high-pressure-processing-hpp-technologies-market-forecast-2015-2025/ Accessed 1 March 2019.
Yoshioka, K., Yamada, A., & Maki, T. (1996). Application of high pressurization to fish meat: Changes in the physical properties of carp skeletal muscle resulting from high pressure thawing. In: High Pressure Bioscience and Biotechnology, edited by Hayashi, R. & Balny, C. New York, NY: Elsevier Science B.V., pp. 369-375.
Yuste, J., Pla, R., & Mor-Mur, M. (2000). Salmonella enteriditis and aerobic mesophiles in inoculated poultry sausages manufactured with high-pressure processing. Letters in Applied Microbiology, 31, 374-377.

44 Zhao, Y., Flores, R.A., & Olson, D.G. (1998). High hydrostatic pressure effects on rapid
thawing of frozen beef. Journal of Food Science, 63(2), 272-275.
Zhu, S., Ramaswamy, H.S., & Simpson, B.K. (2004). Effect of high-pressure vs. conventional thawing on color, drip loss and texture of Atlantic salmon frozen by different methods. Lebensmittel-Wissenschaft & Technologie, 37, 291-299.

45
Appendix A. Preliminary Testing of High Pressure Thawing
Preliminary tests were conducted in October through November 2019 to develop
protocols for sample preparation and core temperature measurement, as well as determine
the various levels of independent variables for further study.
A.1. Materials and methods
A.1.1. Sample preparation
Frozen samples of ground chicken, chicken liver, ground turkey and ground pork
were prepared, first using empty tomato paste cans (6 oz. size) were used and then later
replaced with 100 ml silicone beakers used in the study. The silicone beakers allowed for
the preparation of more uniform and consistent sample size and shape. Color (𝐿𝐿∗𝑎𝑎∗𝑏𝑏∗)
measurements of the top surface of the meat cylinder were taken using a handheld
colorimeter (Model No. W-01-500 by WAOW, purchased from Amazon, LLC, Seattle,
WA, USA) with an 8 mm aperture and D65 light source. Type K thermocouples were
inserted into the core of each cylindrical sample prepared, prior to freezing. Laboratory
parafilm was used cover the thermocouple male connectors and prevent them from
getting wet and rusting during freezing at -10 °C.
Prior to HPT treatment, the core temperature of a frozen meat sample was
measured and recorded using a handheld thermocouple data logger (Model HH309A,
Omega Engineering, Ltd., Norwalk, CT, USA). The thermocouple connectors were once
again covered with laboratory parafilm. The frozen sample, along with the thermocouple,
was doubly vacuum packed using 3-mil thick polyethylene bags (Product No. S-956,

46 Uline, Pleasant Prairie, WI, USA) and a vacuum sealer at -90 kPa (Model No. VP250,
VacMaster, Overland Park, KS, USA).
A.1.2. High pressure thawing
HPT was tested using a 2L HPP equipment (Model No. FPG-9400, Stansted Fluid
Power, Ltd., Harlow, Essex, UK). Process parameters tested were pressure level (210 and
240 MPa), holding times (3, 6, and 9 min), and processing fluid temperatures
(refrigerated, 4-10 °C and room temperature, 20-30 °C).
A.1.3. Quality measurements
The same quality measurements – color change, core temperature, thawed
percentage, and thawing rate – were taken after HPT treatment, as described in Chapter 3.
A.2. Results
HPT-treated raw meat samples, regardless of pressure level, holding time, and
processing fluid temperatures showed little color change (∆𝐸𝐸 < 2.0). It was decided to
focus on one type of raw meat – chicken – for further study in a designed experiment.
For one replication of HPT at 240 MPa at room temperature and three holding
times, thawed percentage was found to increase generally with holding time, except for
ground chicken (Figure A.1, Table A.1). The low thawed percentage estimates at 6 min
of holding time likely resulted from drip losses, which were not included in the mass of
thawed portion. This test showed that care should be taken to include drip losses in the
mass of thawed portion to get a more accurate estimate of thawed percentage.
Nevertheless, thawing rate estimates were found to decrease with holding time.

47
Figure A.1. From left to right: High pressure thawing (HPT) of frozen ground chicken, ground pork, and ground turkey at 240 MPa and room temperature for (a) 3 min and (b) 6 min. In each picture, the top row shows the frozen portion, while the bottom row shows
the thawed portion, of the samples after HPT.
Table A.1. Thawed percentages and thawing rates of ground meats at 240 MPa and room temperature for 3-9 min of holding time.
Holding time (min)
Thawed percentage (% w/w) Thawing rate (% min-1) Chicken Pork Turkey Chicken Pork Turkey
3 68.1 68.4 54.6 22.7 22.8 18.2
6 65.2 75.7 49.1 10.9 12.6 8.2
9 58.6 91.1 81.7 6.5 10.1 9.1
Scale = 2.54 cm
(a)
(b)
Scale = 2.54 cm

48
Appendix B. SAS Code
B.1. Objective 1 - CORR Procedure
The following code for Pearson correlation coefficients was used to test for
correlations among processing fluid temperature (TF), holding time (t), core temperature
(TC), color changes of the frozen and thawed portions after high pressure thawing (DelEf
and DelEt, respectively), thawed percentage (TP), thawing rate (TR), and chicken meat
type (M). Note that only ground, livers, breast tenders, thighs, and gizzards (M = 1, 2, 3,
4, and 5, respectively) were included in this analysis of the completely randomized
design (CRD) experiment. Comparison of means was conducted using Tukey’s honestly
significant difference (HSD) test.
data ChickenThaw; input TF Time TC DelEf DelEt TP TR M; datalines; 4 1 -6.60 0.40 0.11 25.80 1548.50 1 4 1 -3.50 0.59 0.50 23.20 1391.80 1 4 1 -6.50 0.41 0.53 17.10 1025.10 1 20 1 -4.10 0.76 0.93 25.50 1530.20 1 20 1 -5.20 0.70 0.85 22.60 1358.10 1 20 1 -4.90 0.54 0.63 25.80 1548.80 1 4 180 -5.00 0.22 0.54 33.00 11.00 1 4 180 -3.30 0.17 0.40 38.40 12.80 1 4 180 -5.20 1.03 0.61 29.30 9.80 1 20 180 -4.60 0.84 1.79 45.50 15.20 1 20 180 -4.40 0.69 0.77 48.00 16.00 1 20 180 -2.80 0.83 1.23 53.00 17.70 1 4 360 -5.10 0.47 0.53 53.10 8.90 1 4 360 -4.20 0.53 1.00 65.60 10.90 1 4 360 -3.40 0.90 1.42 52.60 8.80 1 20 360 -2.50 0.79 0.93 67.90 11.30 1 20 360 -2.50 0.95 1.55 64.50 10.80 1 20 360 -2.20 1.22 0.66 62.30 10.40 1 4 540 -4.40 1.06 1.36 74.00 8.20 1 4 540 -4.40 1.08 0.22 71.20 7.90 1 4 540 -2.60 0.62 0.93 67.40 7.50 1 20 540 -3.50 0.76 1.00 78.20 8.70 1 20 540 -1.90 1.25 1.51 80.40 8.90 1 20 540 -1.80 1.48 2.30 76.80 8.50 1

49 4 1 -5.30 0.33 0.87 26.11 1566.60 2 4 1 -3.20 0.34 0.29 31.00 1859.60 2 4 1 -5.20 0.41 0.40 19.20 1152.60 2 20 1 -3.00 0.60 0.49 48.20 2892.50 2 20 1 -4.80 0.37 0.95 30.50 1829.60 2 20 1 -3.50 0.75 0.81 42.10 2525.70 2 4 180 -4.00 1.13 1.89 39.90 13.30 2 4 180 -3.80 1.76 0.15 52.60 17.50 2 4 180 -4.80 0.80 1.07 43.90 14.60 2 20 180 -4.40 1.24 0.86 52.90 17.60 2 20 180 -3.20 0.82 1.10 56.30 18.80 2 20 180 -2.70 0.90 1.07 65.60 21.90 2 4 360 -3.80 2.26 1.21 67.70 11.30 2 4 360 -3.20 1.95 1.78 66.00 11.00 2 4 360 -3.20 0.96 1.53 73.80 12.30 2 20 360 -2.50 1.09 1.26 81.80 13.60 2 20 360 -3.00 1.16 1.69 70.10 11.70 2 20 360 -0.20 0.60 1.00 75.30 12.50 2 4 540 -3.20 2.03 0.51 83.30 9.30 2 4 540 -3.40 1.01 1.36 80.80 9.00 2 4 540 -2.30 1.09 1.89 84.80 9.40 2 20 540 -2.70 0.99 1.19 83.80 9.30 2 20 540 -1.00 2.40 1.64 90.50 10.10 2 20 540 -0.20 2.31 2.74 89.80 10.00 2 4 1 -4.80 0.56 0.25 25.50 1527.90 3 4 1 -2.90 0.21 0.44 33.40 2002.60 3 4 1 -5.20 0.31 0.43 14.90 892.40 3 20 1 -4.20 0.27 1.06 31.70 1901.90 3 20 1 -4.40 0.27 0.16 27.40 1642.80 3 20 1 -3.80 0.14 0.20 29.80 1786.50 3 4 180 -4.00 0.80 0.35 30.90 10.30 3 4 180 -3.50 1.07 0.79 40.40 13.50 3 4 180 -4.40 1.00 0.40 32.90 11.00 3 20 180 -3.90 0.73 0.47 47.80 15.90 3 20 180 -3.00 0.20 0.69 61.40 20.50 3 20 180 -2.70 0.90 0.97 56.00 18.70 3 4 360 -3.50 0.63 0.39 54.00 9.00 3 4 360 -2.80 1.17 1.20 62.70 10.50 3 4 360 -3.60 0.25 0.58 53.30 8.90 3 20 360 -2.60 1.30 1.15 70.80 11.80 3 20 360 -2.30 0.93 1.00 64.90 10.80 3 20 360 -1.90 1.55 0.57 56.90 9.50 3 4 540 -3.00 1.20 1.34 77.00 8.60 3 4 540 -3.20 0.05 0.32 74.10 8.20 3 4 540 -1.70 1.48 1.76 67.70 7.50 3 20 540 -2.50 0.63 0.74 81.80 9.10 3 20 540 -1.70 0.34 1.04 84.90 9.40 3 20 540 -1.20 2.47 0.12 81.00 9.00 3 4 1 -4.00 0.61 0.53 23.90 1433.20 4 4 1 -2.90 0.95 0.11 32.20 1929.10 4 4 1 -5.00 0.34 0.91 14.50 872.10 4 20 1 -3.20 0.18 0.82 32.00 1920.30 4 20 1 -4.30 0.98 0.73 28.70 1720.50 4 20 1 -3.80 0.24 0.32 28.50 1708.10 4

50 4 180 -3.40 0.43 1.00 32.70 10.90 4 4 180 -3.50 1.14 0.50 40.80 13.60 4 4 180 -4.00 0.89 0.88 30.50 10.20 4 20 180 -3.20 0.71 2.01 51.10 17.00 4 20 180 -3.20 0.56 0.80 60.30 20.10 4 20 180 -2.10 0.87 1.27 58.30 19.40 4 4 360 -3.40 0.44 1.26 54.50 9.10 4 4 360 -2.80 0.67 1.31 67.20 11.20 4 4 360 -3.70 1.41 0.46 58.60 9.80 4 20 360 -2.10 0.99 1.26 70.40 11.70 4 20 360 -2.20 0.67 0.63 66.10 11.00 4 20 360 -1.20 1.71 2.03 66.60 11.10 4 4 540 -2.70 0.90 1.38 76.10 8.50 4 4 540 -3.20 0.80 0.76 77.40 8.60 4 4 540 -1.70 1.62 0.86 72.60 8.10 4 20 540 -2.50 1.02 1.36 84.40 9.40 4 20 540 -1.40 0.52 0.26 90.10 10.00 4 20 540 -1.40 2.73 2.86 83.40 9.30 4 4 1 -3.50 0.79 0.52 25.20 1512.20 5 4 1 -3.10 0.98 0.88 33.20 1990.50 5 4 1 -6.00 0.14 0.51 14.00 840.30 5 20 1 -2.90 0.27 1.02 30.00 1800.40 5 20 1 -3.00 0.92 0.39 27.10 1627.50 5 20 1 -3.50 0.65 0.78 28.80 1727.80 5 4 180 -2.80 1.06 0.80 42.50 14.20 5 4 180 -3.00 1.34 2.18 45.10 15.00 5 4 180 -3.50 0.61 1.08 30.10 10.00 5 20 180 -2.50 1.50 1.67 53.40 17.80 5 20 180 -2.50 0.72 1.20 62.40 20.80 5 20 180 -1.80 1.15 1.93 67.40 22.50 5 4 360 -2.90 1.99 0.53 65.30 10.90 5 4 360 -1.90 1.21 1.79 71.30 11.90 5 4 360 -3.00 1.52 1.11 63.10 10.50 5 20 360 -1.90 1.06 1.77 81.60 13.60 5 20 360 -1.50 1.95 2.09 65.90 11.00 5 20 360 -1.20 1.57 0.76 73.70 12.30 5 4 540 -2.30 0.41 0.76 81.60 9.10 5 4 540 -1.90 0.69 1.19 83.70 9.30 5 4 540 -1.60 1.99 2.97 80.80 9.00 5 20 540 -1.70 1.17 1.37 86.40 9.60 5 20 540 -0.80 1.66 1.71 88.70 9.90 5 20 540 -0.60 1.86 0.63 87.10 9.70 5
B.2. Objective 1 – ANOVA Procedure
Likewise, the following code was used to conduct an analysis of variance
(ANOVA) of the CRD for core temperature (TC) and thawed percentage (TP). A new
variable, Temp, to denote the actual average processing fluid temperature during testing,

51 but the analysis proceeded with using the nominal TF values (4 for refrigerated and 20
for room temperatures).
data ChickenThaw; input TF Temp Time TC DelEf DelEt TP TR M; datalines; 4 16.9 1 -6.60 0.40 0.11 25.80 1548.50 1 4 18.7 1 -3.50 0.59 0.50 23.20 1391.80 1 4 12.8 1 -6.50 0.41 0.53 17.10 1025.10 1 20 28.1 1 -4.10 0.76 0.93 25.50 1530.20 1 20 24.4 1 -5.20 0.70 0.85 22.60 1358.10 1 20 26.6 1 -4.90 0.54 0.63 25.80 1548.80 1 4 10.1 180 -5.00 0.22 0.54 33.00 11.00 1 4 13.2 180 -3.30 0.17 0.40 38.40 12.80 1 4 11.7 180 -5.20 1.03 0.61 29.30 9.80 1 20 21.7 180 -4.60 0.84 1.79 45.50 15.20 1 20 23.6 180 -4.40 0.69 0.77 48.00 16.00 1 20 26.8 180 -2.80 0.83 1.23 53.00 17.70 1 4 14.3 360 -5.10 0.47 0.53 53.10 8.90 1 4 11.1 360 -4.20 0.53 1.00 65.60 10.90 1 4 8.5 360 -3.40 0.90 1.42 52.60 8.80 1 20 24.1 360 -2.50 0.79 0.93 67.90 11.30 1 20 18.8 360 -2.50 0.95 1.55 64.50 10.80 1 20 22.7 360 -2.20 1.22 0.66 62.30 10.40 1 4 9.4 540 -4.40 1.06 1.36 74.00 8.20 1 4 9.2 540 -4.40 1.08 0.22 71.20 7.90 1 4 4.1 540 -2.60 0.62 0.93 67.40 7.50 1 20 22.4 540 -3.50 0.76 1.00 78.20 8.70 1 20 22.0 540 -1.90 1.25 1.51 80.40 8.90 1 20 22.0 540 -1.80 1.48 2.30 76.80 8.50 1 4 16.9 1 -5.30 0.33 0.87 26.11 1566.60 2 4 18.7 1 -3.20 0.34 0.29 31.00 1859.60 2 4 12.8 1 -5.20 0.41 0.40 19.20 1152.60 2 20 28.1 1 -3.00 0.60 0.49 48.20 2892.50 2 20 24.4 1 -4.80 0.37 0.95 30.50 1829.60 2 20 26.6 1 -3.50 0.75 0.81 42.10 2525.70 2 4 10.1 180 -4.00 1.13 1.89 39.90 13.30 2 4 13.2 180 -3.80 1.76 0.15 52.60 17.50 2 4 11.7 180 -4.80 0.80 1.07 43.90 14.60 2 20 21.7 180 -4.40 1.24 0.86 52.90 17.60 2 20 23.6 180 -3.20 0.82 1.10 56.30 18.80 2 20 26.8 180 -2.70 0.90 1.07 65.60 21.90 2 4 14.3 360 -3.80 2.26 1.21 67.70 11.30 2 4 11.1 360 -3.20 1.95 1.78 66.00 11.00 2 4 8.5 360 -3.20 0.96 1.53 73.80 12.30 2 20 24.1 360 -2.50 1.09 1.26 81.80 13.60 2 20 18.8 360 -3.00 1.16 1.69 70.10 11.70 2 20 22.7 360 -0.20 0.60 1.00 75.30 12.50 2 4 9.4 540 -3.20 2.03 0.51 83.30 9.30 2 4 9.2 540 -3.40 1.01 1.36 80.80 9.00 2

52 4 4.1 540 -2.30 1.09 1.89 84.80 9.40 2 20 22.4 540 -2.70 0.99 1.19 83.80 9.30 2 20 22.0 540 -1.00 2.40 1.64 90.50 10.10 2 20 22.0 540 -0.20 2.31 2.74 89.80 10.00 2 4 16.9 1 -4.80 0.56 0.25 25.50 1527.90 3 4 18.7 1 -2.90 0.21 0.44 33.40 2002.60 3 4 12.8 1 -5.20 0.31 0.43 14.90 892.40 3 20 28.1 1 -4.20 0.27 1.06 31.70 1901.90 3 20 24.4 1 -4.40 0.27 0.16 27.40 1642.80 3 20 26.6 1 -3.80 0.14 0.20 29.80 1786.50 3 4 10.1 180 -4.00 0.80 0.35 30.90 10.30 3 4 13.2 180 -3.50 1.07 0.79 40.40 13.50 3 4 11.7 180 -4.40 1.00 0.40 32.90 11.00 3 20 21.7 180 -3.90 0.73 0.47 47.80 15.90 3 20 23.6 180 -3.00 0.20 0.69 61.40 20.50 3 20 26.8 180 -2.70 0.90 0.97 56.00 18.70 3 4 14.3 360 -3.50 0.63 0.39 54.00 9.00 3 4 11.1 360 -2.80 1.17 1.20 62.70 10.50 3 4 8.5 360 -3.60 0.25 0.58 53.30 8.90 3 20 24.1 360 -2.60 1.30 1.15 70.80 11.80 3 20 18.8 360 -2.30 0.93 1.00 64.90 10.80 3 20 22.7 360 -1.90 1.55 0.57 56.90 9.50 3 4 9.4 540 -3.00 1.20 1.34 77.00 8.60 3 4 9.2 540 -3.20 0.05 0.32 74.10 8.20 3 4 4.1 540 -1.70 1.48 1.76 67.70 7.50 3 20 22.4 540 -2.50 0.63 0.74 81.80 9.10 3 20 22.0 540 -1.70 0.34 1.04 84.90 9.40 3 20 2.0 540 -1.20 2.47 0.12 81.00 9.00 3 4 16.9 1 -4.00 0.61 0.53 23.90 1433.20 4 4 18.7 1 -2.90 0.95 0.11 32.20 1929.10 4 4 12.8 1 -5.00 0.34 0.91 14.50 872.10 4 20 28.1 1 -3.20 0.18 0.82 32.00 1920.30 4 20 24.4 1 -4.30 0.98 0.73 28.70 1720.50 4 20 26.6 1 -3.80 0.24 0.32 28.50 1708.10 4 4 10.1 180 -3.40 0.43 1.00 32.70 10.90 4 4 13.2 180 -3.50 1.14 0.50 40.80 13.60 4 4 11.7 180 -4.00 0.89 0.88 30.50 10.20 4 20 21.7 180 -3.20 0.71 2.01 51.10 17.00 4 20 23.6 180 -3.20 0.56 0.80 60.30 20.10 4 20 26.8 180 -2.10 0.87 1.27 58.30 19.40 4 4 14.3 360 -3.40 0.44 1.26 54.50 9.10 4 4 11.1 360 -2.80 0.67 1.31 67.20 11.20 4 4 8.5 360 -3.70 1.41 0.46 58.60 9.80 4 20 24.1 360 -2.10 0.99 1.26 70.40 11.70 4 20 18.8 360 -2.20 0.67 0.63 66.10 11.00 4 20 22.7 360 -1.20 1.71 2.03 66.60 11.10 4 4 9.4 540 -2.70 0.90 1.38 76.10 8.50 4 4 9.2 540 -3.20 0.80 0.76 77.40 8.60 4 4 4.1 540 -1.70 1.62 0.86 72.60 8.10 4 20 22.4 540 -2.50 1.02 1.36 84.40 9.40 4 20 22.0 540 -1.40 0.52 0.26 90.10 10.00 4 20 22.0 540 -1.40 2.73 2.86 83.40 9.30 4 4 16.9 1 -3.50 0.79 0.52 25.20 1512.20 5 4 18.7 1 -3.10 0.98 0.88 33.20 1990.50 5

53 4 12.8 1 -6.00 0.14 0.51 14.00 840.30 5 20 28.1 1 -2.90 0.27 1.02 30.00 1800.40 5 20 24.4 1 -3.00 0.92 0.39 27.10 1627.50 5 20 26.6 1 -3.50 0.65 0.78 28.80 1727.80 5 4 10.1 180 -2.80 1.06 0.80 42.50 14.20 5 4 13.2 180 -3.00 1.34 2.18 45.10 15.00 5 4 11.7 180 -3.50 0.61 1.08 30.10 10.00 5 20 21.7 180 -2.50 1.50 1.67 53.40 17.80 5 20 23.6 180 -2.50 0.72 1.20 62.40 20.80 5 20 26.8 180 -1.80 1.15 1.93 67.40 22.50 5 4 14.3 360 -2.90 1.99 0.53 65.30 10.90 5 4 11.1 360 -1.90 1.21 1.79 71.30 11.90 5 4 8.5 360 -3.00 1.52 1.11 63.10 10.50 5 20 24.1 360 -1.90 1.06 1.77 81.60 13.60 5 20 18.8 360 -1.50 1.95 2.09 65.90 11.00 5 20 22.7 360 -1.20 1.57 0.76 73.70 12.30 5 4 9.4 540 -2.30 0.41 0.76 81.60 9.10 5 4 9.2 540 -1.90 0.69 1.19 83.70 9.30 5 4 4.1 540 -1.60 1.99 2.97 80.80 9.00 5 20 22.4 540 -1.70 1.17 1.37 86.40 9.60 5 20 22.0 540 -0.80 1.66 1.71 88.70 9.90 5 20 22.0 540 -0.60 1.86 0.63 87.10 9.70 5 ; proc print; proc anova data=ChickenThaw; class TF Time M; Model TC = TF Time M TF*Time TF*M Time*M; means TF Time M/tukey; means TF*Time TF*M Time*M; run; proc anova data=ChickenThaw; class TF Time M; Model TP = TF Time M TF*Time TF*M Time*M; means TF Time M/tukey; means TF*Time TF*M Time*M; run;

54
For the ANOVA for thawing rate (TR), data for 1 s holding time were excluded
and the following code was used.
data ChickenThaw2; input TF Time TC DelEf DelEt TP TR M; datalines; 4 180 -5.00 0.22 0.54 33.00 11.00 1 4 180 -3.30 0.17 0.40 38.40 12.80 1 4 180 -5.20 1.03 0.61 29.30 9.80 1 20 180 -4.60 0.84 1.79 45.50 15.20 1 20 180 -4.40 0.69 0.77 48.00 16.00 1 20 180 -2.80 0.83 1.23 53.00 17.70 1 4 360 -5.10 0.47 0.53 53.10 8.90 1 4 360 -4.20 0.53 1.00 65.60 10.90 1 4 360 -3.40 0.90 1.42 52.60 8.80 1 20 360 -2.50 0.79 0.93 67.90 11.30 1 20 360 -2.50 0.95 1.55 64.50 10.80 1 20 360 -2.20 1.22 0.66 62.30 10.40 1 4 540 -4.40 1.06 1.36 74.00 8.20 1 4 540 -4.40 1.08 0.22 71.20 7.90 1 4 540 -2.60 0.62 0.93 67.40 7.50 1 20 540 -3.50 0.76 1.00 78.20 8.70 1 20 540 -1.90 1.25 1.51 80.40 8.90 1 20 540 -1.80 1.48 2.30 76.80 8.50 1 4 180 -4.00 1.13 1.89 39.90 13.30 2 4 180 -3.80 1.76 0.15 52.60 17.50 2 4 180 -4.80 0.80 1.07 43.90 14.60 2 20 180 -4.40 1.24 0.86 52.90 17.60 2 20 180 -3.20 0.82 1.10 56.30 18.80 2 20 180 -2.70 0.90 1.07 65.60 21.90 2 4 360 -3.80 2.26 1.21 67.70 11.30 2 4 360 -3.20 1.95 1.78 66.00 11.00 2 4 360 -3.20 0.96 1.53 73.80 12.30 2 20 360 -2.50 1.09 1.26 81.80 13.60 2 20 360 -3.00 1.16 1.69 70.10 11.70 2 20 360 -0.20 0.60 1.00 75.30 12.50 2 4 540 -3.20 2.03 0.51 83.30 9.30 2 4 540 -3.40 1.01 1.36 80.80 9.00 2 4 540 -2.30 1.09 1.89 84.80 9.40 2 20 540 -2.70 0.99 1.19 83.80 9.30 2 20 540 -1.00 2.40 1.64 90.50 10.10 2 20 540 -0.20 2.31 2.74 89.80 10.00 2 4 180 -4.00 0.80 0.35 30.90 10.30 3 4 180 -3.50 1.07 0.79 40.40 13.50 3 4 180 -4.40 1.00 0.40 32.90 11.00 3 20 180 -3.90 0.73 0.47 47.80 15.90 3 20 180 -3.00 0.20 0.69 61.40 20.50 3 20 180 -2.70 0.90 0.97 56.00 18.70 3 4 360 -3.50 0.63 0.39 54.00 9.00 3 4 360 -2.80 1.17 1.20 62.70 10.50 3

55 4 360 -3.60 0.25 0.58 53.30 8.90 3 20 360 -2.60 1.30 1.15 70.80 11.80 3 20 360 -2.30 0.93 1.00 64.90 10.80 3 20 360 -1.90 1.55 0.57 56.90 9.50 3 4 540 -3.00 1.20 1.34 77.00 8.60 3 4 540 -3.20 0.05 0.32 74.10 8.20 3 4 540 -1.70 1.48 1.76 67.70 7.50 3 20 540 -2.50 0.63 0.74 81.80 9.10 3 20 540 -1.70 0.34 1.04 84.90 9.40 3 20 540 -1.20 2.47 0.12 81.00 9.00 3 4 180 -3.40 0.43 1.00 32.70 10.90 4 4 180 -3.50 1.14 0.50 40.80 13.60 4 4 180 -4.00 0.89 0.88 30.50 10.20 4 20 180 -3.20 0.71 2.01 51.10 17.00 4 20 180 -3.20 0.56 0.80 60.30 20.10 4 20 180 -2.10 0.87 1.27 58.30 19.40 4 4 360 -3.40 0.44 1.26 54.50 9.10 4 4 360 -2.80 0.67 1.31 67.20 11.20 4 4 360 -3.70 1.41 0.46 58.60 9.80 4 20 360 -2.10 0.99 1.26 70.40 11.70 4 20 360 -2.20 0.67 0.63 66.10 11.00 4 20 360 -1.20 1.71 2.03 66.60 11.10 4 4 540 -2.70 0.90 1.38 76.10 8.50 4 4 540 -3.20 0.80 0.76 77.40 8.60 4 4 540 -1.70 1.62 0.86 72.60 8.10 4 20 540 -2.50 1.02 1.36 84.40 9.40 4 20 540 -1.40 0.52 0.26 90.10 10.00 4 20 540 -1.40 2.73 2.86 83.40 9.30 4 4 180 -2.80 1.06 0.80 42.50 14.20 5 4 180 -3.00 1.34 2.18 45.10 15.00 5 4 180 -3.50 0.61 1.08 30.10 10.00 5 20 180 -2.50 1.50 1.67 53.40 17.80 5 20 180 -2.50 0.72 1.20 62.40 20.80 5 20 180 -1.80 1.15 1.93 67.40 22.50 5 4 360 -2.90 1.99 0.53 65.30 10.90 5 4 360 -1.90 1.21 1.79 71.30 11.90 5 4 360 -3.00 1.52 1.11 63.10 10.50 5 20 360 -1.90 1.06 1.77 81.60 13.60 5 20 360 -1.50 1.95 2.09 65.90 11.00 5 20 360 -1.20 1.57 0.76 73.70 12.30 5 4 540 -2.30 0.41 0.76 81.60 9.10 5 4 540 -1.90 0.69 1.19 83.70 9.30 5 4 540 -1.60 1.99 2.97 80.80 9.00 5 20 540 -1.70 1.17 1.37 86.40 9.60 5 20 540 -0.80 1.66 1.71 88.70 9.90 5 20 540 -0.60 1.86 0.63 87.10 9.70 5 ; proc print; proc anova data=ChickenThaw2; class TF Time M; Model TR = TF Time M TF*Time TF*M Time*M; means TF Time M/tukey; means TF*Time TF*M Time*M; run;

56 B.3. Objective 2 – ANOVA Procedure
ANOVA and Tukey’s HSD test for color change (DelE), core temperature (TC),
thawed percentage (TP), and thawing rate (TR) was conducted across the seven thawing
treatments (Trt): still air at 4 °C (Trt = 1) and at 20 °C (Trt = 2), still water at 4 °C (Trt =
3) and 20 °C (Trt = 4), microwave (Trt = 5), and high pressure thawing at 4 °C (Trt = 6)
and at 20 °C (Trt = 7).
data ChickenThaw3; input Trt TF TC TP TR DelE; datalines; 1 4 -5.8 19.2 0.34 1.29 1 4 -3.5 33.7 0.23 1.45 1 4 -2.6 77.2 0.30 3.01 1 4 -6.0 22.5 0.36 1.08 1 4 -4.5 32.9 0.35 2.88 1 4 -2.1 75.6 0.27 3.22 1 4 -6.0 25.1 0.38 1.36 1 4 -4.3 32.2 0.25 3.06 1 4 -2.6 78.5 0.25 6.26 2 20 -5.8 32.7 0.79 0.32 2 20 -4.7 40.5 0.71 1.71 2 20 -2.2 81.3 0.43 3.58 2 20 -6.2 20.6 0.54 0.93 2 20 -4.5 40.7 0.67 1.05 2 20 -2.3 78.9 0.46 3.67 2 20 -6.1 15.9 0.35 0.67 2 20 -4.4 38.5 0.53 1.46 2 20 -2.3 72.9 0.36 4.34 3 4 -6.0 38.1 2.08 0.66 3 4 -4.2 64.7 1.93 1.00 3 4 -2.3 71.5 0.81 2.88 3 4 -6.4 22.2 0.70 0.86 3 4 -4.5 48.0 0.83 1.21 3 4 -2.3 74.9 0.47 3.71 3 4 -5.5 22.3 0.91 0.63 3 4 -4.4 41.2 1.14 0.84 3 4 -2.3 78.8 0.68 2.89 4 20 -6.0 38.1 2.82 0.66 4 20 -4.5 64.7 2.99 1.00 4 20 -2.2 71.5 1.23 2.88 4 20 -7.2 22.2 1.85 0.33 4 20 -4.4 48.0 1.81 0.84 4 20 -2.7 74.1 1.58 2.48 4 20 -6.5 39.8 2.52 0.38

57 4 20 -4.1 54.2 1.81 0.79 4 20 -2.3 83.0 1.43 2.52 5 20 -4.2 70.1 35.1 4.58 5 20 -3.6 85.3 28.4 11.30 5 20 -3.1 92.5 23.1 18.73 5 20 -4.2 72.4 36.2 3.50 5 20 -3.4 88.5 29.5 10.24 5 20 -2.9 94.1 23.5 24.19 5 20 -4.3 73.7 36.9 4.08 5 20 -3.5 90.4 30.1 8.98 5 20 -3.0 93.2 23.3 17.48 6 4 -4.0 39.3 13.3 1.89 6 4 -3.8 52.6 17.5 0.15 6 4 -4.8 43.9 14.6 1.07 6 4 -3.8 67.7 11.3 1.21 6 4 -3.2 66.0 11.0 1.78 6 4 -3.2 73.8 12.3 1.53 6 4 -3.2 83.3 9.3 0.51 6 4 -3.4 80.8 9.0 1.36 6 4 -2.3 84.8 9.4 1.89 7 20 -4.4 52.9 17.6 0.86 7 20 -3.2 56.3 18.8 1.10 7 20 -2.7 65.6 21.9 1.07 7 20 -2.5 81.8 13.6 1.26 7 20 -3.0 70.1 11.7 1.69 7 20 -0.2 75.3 12.5 1.0 7 20 -2.7 83.8 9.3 1.19 7 20 -1.0 90.5 10.1 1.64 7 20 -0.2 89.8 10.0 2.74 ; proc print; proc anova data=ChickenThaw3; class Trt; Model DelE = Trt; means Trt/tukey; run; proc anova data=ChickenThaw3; class Trt; Model TC = Trt; means Trt/tukey; run; proc anova data=ChickenThaw3; class Trt; Model TP = Trt; means Trt/tukey; run; proc anova data=ChickenThaw3; class Trt; Model TR = Trt; means Trt/tukey; run;