high-precision abundances of elements in ... - kosmologi · pdf filep. e. nissen:...
TRANSCRIPT
arX
iv:1
504.
0759
8v1
[ast
ro-p
h.S
R]
28 A
pr 2
015
Astronomy & Astrophysicsmanuscript no. nissen.twins c© ESO 2015April 29, 2015
High-precision abundances of elements in solar twin stars ⋆
Trends with stellar age and elemental condensation temperature
P. E. Nissen1
Stellar Astrophysics Centre, Department of Physics and Astronomy, Aarhus University, Ny Munkegade 120, DK–8000 Aarhus C,Denmark. e-mail:[email protected].
Received 7 April 2015/ Accepted ......
ABSTRACT
Context. High-precision determinations of abundances of elements in the atmospheres of the Sun and solar twin stars indicate thatthe Sun has an unusual low ratio between refractory and volatile elements. This has led to the suggestion that the relation betweenabundance ratios, [X/Fe], and elemental condensation temperature,TC, can be used as a signature of the existence of terrestrial planetsaround a star.Aims. HARPS spectra withS/N >∼ 600 for 21 solar twin stars in the solar neighborhood and the Sun (observed via reflected light fromasteroids) are used to determine very precise (σ ∼ 0.01 dex) differential abundances of elements in order to see how well [X/Fe] iscorrelated withTC and other parameters such as stellar age.Methods. Abundances of C, O, Na, Mg, Al, Si, S, Ca, Ti, Cr, Fe, Ni, Zn, andY are derived from equivalent widths of weak andmedium-strong spectral lines using MARCS model atmospheres with parameters determined from the excitation and ionization bal-ance of Fe lines. Non-LTE effects are considered and taken into account for some of the elements. In addition, precise (σ <∼ 0.8 Gyr)stellar ages are obtained by interpolating between Yonsei-Yale isochrones in the logg-Teff diagram.Results. It is confirmed that the ratio between refractory and volatile elements is lower in the Sun than in most of the solar twins (onlyone star has the same [X/Fe]-TC distribution as the Sun), but for many stars, the relation between [X/Fe] andTC is not well defined.For several elements there is an astonishingly tight correlation between [X/Fe] and stellar age with amplitudes up to∼0.20 dex overan age interval of eight Gyr in contrast to the lack of correlation between [Fe/H] and age. While [Mg/Fe] increases with age, thes-process element yttrium shows the opposite behavior meaning that [Y/Mg] can be used as a sensitive chronometer for Galacticevolution. [Na/Fe] and [Ni/Fe] are not well correlated with stellar age, but define a tight Ni-Na relation similar to that previouslyfound for more metal-poor stars albeit with a smaller amplitude. Furthermore, the C/O ratio evolves very little with time, although[C/Fe] and [O/Fe] change by∼0.15 dex.Conclusions. The dependence of [X/Fe] on stellar age and the [Ni/Fe]- [Na/Fe] variations complicate the use of the [X/Fe]-TC relationas a possible signature for the existence of terrestrial planets around stars. The age trends for the various abundance ratios providenew constraints on supernovae yields and Galactic chemicalevolution, and the slow evolution of C/O for solar metallicity stars is ofinterest for discussions of the composition of exoplanets.
Key words. Stars: abundances – Stars: fundamental parameters – Stars:solar-type – (Stars:) planetary systems – Galaxy: disk –Galaxy: evolution
1. Introduction
In an important paper based on very precise determinations ofabundances in the Sun and 11 solar twin stars, Melendez et al.(2009) found that the Sun has a lower refractory to volatile el-ement ratio than most of the solar twins. They suggest that thismay be explained by the sequestration of refractory elements interrestrial planets and that the slope of abundances relative toiron, [X/Fe]1, as a function of elemental condensation tempera-ture,TC, in a solar-composition gas (Lodders 2003) can be usedas a signature of the existence of terrestrial planets around a star.This idea was supported by Ramırez et al. (2009), who in a studyof abundances of 64 solar-type stars find significant variations of
⋆ Based on data products from observations made with ESOTelescopes at the La Silla Paranal Observatory under programs givenin Table 1. Tables 2 and 3 are available in electronic form athttp://www.aanda.org.
1 For two elements, X and Y, with number densitiesNX and NY ,[X /Y] ≡ log(NX/NY)star − log(NX/NY)Sun.
the [X/Fe]-TC slope with only about 15% of the stars having aslope similar to that of the Sun.
The works of Melendez et al. (2009) and Ramırez et al.(2009) have triggered several papers investigating relations be-tween [X/Fe]-TC slopes and existence of planets around stars(Gonzalez et al. 2010; Gonzalez Hernandez et al. 2010, 2013;Schuler et al. 2011; Adibekyan et al. 2014; Maldonado et al.2015). The results obtained are not so conclusive, partly becausethe stars included span larger ranges inTeff, logg, and [Fe/H]than the solar twins in Melendez et al. (2009) making the abun-dance ratios less precise and introducing a dependence of thederived [X/Fe]-TC slopes on possible corrections for Galacticevolution effects. Thus, Gonzalez Hernandez et al. (2013) ob-tain both positive and negative slopes for ten stars with detectedsuper-Earth planets, and Adibekyan et al. (2014) find evidencethat the slope depends on stellar age. Furthermore, Schuleretal. (2011) show that the [X/Fe]-TC slope depends critically onwhether one consider refractory elements only (TC > 900 K) orinclude also volatile elements withTC < 900 K.
1
P. E. Nissen: High-precision abundances of elements in solar twin stars
Sequestration in terrestrial planets is not the only possibleexplanation of the low abundances of refractory elements intheSun. Onehag et al. (2014) found that the [X/Fe]-TC trend forsolar-type stars belonging to the open cluster M 67 agrees withthe trend for the Sun and suggest that the gas of the proto-cluster was depleted in refractory elements by formation andcleansing of dust before the stars formed. According to this, theSun may have formed in a dense stellar environment contraryto most of the solar twins. Similar scenarios are discussed byGaidos (2015), who suggests that [X/Fe]-TC correlations can beexplained by dust-gas segregation in circumstellar disks ratherthan formation of terrestrial planets.
Additional information on the connection between abun-dance ratios in stars and the occurrence of planets may be ob-tained from studies of wide binaries for which the two compo-nents have similarTeff and logg values. Dust-gas segregationbefore planet formation is likely to affect the chemical com-position of the components in the same way. In the case of 16Cyg A/B, for which the secondary component has a detectedplanet of at least 1.5 Jupiter mass (MJ), there is a difference[Fe/H](A–B) ≃ 0.04 dex (Ramırez et al. 2011) and a differencein the [X/Fe]-TC slope for refractory elements (Tucci Maia et al.2014), which may be explained by accretion of elements in therocky core of the giant planet around 16 Cyg B. Furthermore,the two components of XO-2, which are hosts of different plan-ets, have an abundance difference of∼ 0.05 dex for refractoryelements (Teske et al. 2015; Damasso et al. 2015). On the otherhand, Liu et al. (2014) did not detect any abundance differencesbetween the two components of HAT-P-1, for which the sec-ondary has a 0.5MJ planet.
Recent precise determinations of abundances in four so-lar twin stars: HD101364 (Melendez et al. 2012), HIP 102152(HD197027) (Monroe et al. 2013), 18 Sco (HD 146233)(Melendez et al. 2014a), and HD218544 (Melendez et al. 2014b)show that the first three mentioned stars have a similar depletionof refractory elements as the Sun, whereas 18 Sco has a [X/Fe]-TC slope for elements from carbon to zinc similar to the majorityof solar twin stars. Neutron capture elements in 18 Sco are, how-ever, significantly more abundant than lighter elements with thesame condensation temperature, and in HIP 102152 several ele-ments (N, Na, Co, and Ni), have abundance ratios with respectto Fe that clearly fall below the [X/Fe]-TC trend for the other el-ements. These anomalies suggest that the [X/Fe]-TC relation isnot so well defined as assumed in some of the works cited above,but that star-to-star variations in abundance ratios related to e.g.incomplete mixing of nucleosynthesis products or chemicalevo-lution play a role.
In order to make further studies of [X/Fe]-TC relations, Ihave derived very precise abundance ratios (σ[X /Fe]∼0.01 dex)for a sample of 21 solar twin stars for which high-resolutionHARPS spectra with signal-to-noise (S/N) ratios ranging from600 to more than 2000 are available. For the Sun a HARPSspectrum withS/N ≃ 1200 of reflected sunlight from Vesta isused. The sample is not well-suited for studying relations be-tween abundance ratios and occurrence of planets, because onlythree of the stars are known to be hosts of planets. On the otherhand, it is possible to study how well abundance ratios are cor-related withTC and to see if [X/Fe] depends on other parameterssuch as stellar age.
2. Observational data
Based on the precise effective temperatures, surface gravities andmetallicities derived by Sousa et al. (2008) from HARPS spec-
tra of FGK stars, a sample of solar twins was selected to haveparameters that agree with those of the Sun within±100 K inTeff, ±0.15 dex in logg, and±0.10 dex in [Fe/H]. Listed in Table1, 21 of these stars have HARPS spectra withS/N ≥ 600 aftercombination of spectra available in the ESO Science Archive.
The HARPS spectra have a resolution ofR ≃115 000 (Mayoret al. 2003). Individual spectra for a given star were combinedafter correction for Doppler shifts and then normalized with theIRAF continuum task using cubic splines with a scale length of∼100 Å in the blue spectral region (3800 - 5300 Å) and∼15 Å inthe red region (5350 - 6900 Å), for which the archive spectra aremore irregular. The S/N values given in Table 1 were estimatedfrom the rms variation of the flux in continuum regions for the4700 - 6900 Å spectral region, which contains the spectral linesapplied in this study. By including spectra obtained from 2011to 2013 (programs 183.C-0972 and 188.C-0265), the S/N is inmost cases significantly higher than that of the HARPS spectraapplied in previous studies of solar twin stars (e.g., Gonz´alezHernandez et al. 2010, 2013). For the stars in Table 1, the S/Nranges from 600 to 2400 with a median value of 1000.
The IRAFsplot task was used to measure equivalent widths(EWs) of spectral lines by Gaussian fitting relative to pseudo-continuum regions lying within 3 Å from the line measured.These regions do not necessarily represent the true continuum,but care was taken to use the same continuum windows in allstars, so that differences in EW between stars are precisely mea-sured given that the same instrument and resolution were appliedfor obtaining spectra. In this way differential abundances maybe obtained with a precision better than 0.01 dex as shown byBedell et al. (2014).
In order to achieve high-precision abundances relative to theSun, it is very important that a solar flux spectrum is obtainedwith the same spectrograph as applied for the solar twin stars(Bedell et al. 2014). As listed in Table 1, several such HARPSspectra are available based on reflected light from asteroids andthe Jupiter moon Ganymede. As the prime reference spectrumfor the Sun, the Vesta spectrum withS/N ≃ 1200 is adopted,but it is noted that the Ceres and Ganymede spectra agree verywell with that of Vesta. Equivalent widths measured in the Vestaspectrum and the combined spectrum of Ceres and Ganymede(S/N ≃ 700) have an rms difference of 0.35 mÅ only.
To illustrate the high quality of the spectra applied and thedifferential way of measuring EWs, Fig. 1 shows a comparisonof the Vesta spectrum with that of HD 27063, which turns outto have a very similar effective temperature (Teff= 5779 K) andsurface gravity (logg= 4.47) as the Sun. As seen from the differ-ence between the spectra in the lower panel of Fig. 1, lines cor-responding to refractory elements are somewhat stronger inthespectrum of HD 27063 than in the solar spectrum, whereas theline of the volatile element carbon at 5380.3Å is a bit strongerin the solar spectrum. HD 27063 turns out to be a star with ahigh refractory to volatile ratio compared to the Sun; i.e. [Fe/H]=0.064 and [C/H] = −0.018.
Oxygen is an important volatile element in addition to car-bon. Unfortunately, the HARPS spectra do not cover the Oitriplet at 7774 Å. Instead, the forbidden oxygen line at 6300.3Åwas used to derive [O/H]. For six stars telluric O2 lines happento disturb the [Oi] line in some of the spectra available. Suchspectra were excluded before making a combination of spectrato be used in the [Oi] region. This decreased the S/N of the [Oi]spectra somewhat, but in all cases it is around or above 500.
2

P. E. Nissen: High-precision abundances of elements in solar twin stars
Table 1. ESO/HARPS observing programs and S/N of combinedspectra.
Star ESO/HARPS program numbers S/N
HD 2071 072.C-0488, 183.C-0972, 188.C-0265 1050HD 8406 072.C-0488, 183.C-0972 700HD 20782 072.C-0488, 183.C-0972 1250HD 27063 072.C-0488 850HD 28471 072.C-0488, 183.C-0972 700HD 38277 072.C-0488, 183.C-0972 900HD 45184 072.C-0488, 183.C-0972 2400HD 45289 072.C-0488, 183.C-0972, 188.C-0265 1250HD 71334 072.C-0488, 183.C-0972, 188.C-0265 900HD 78429 072.C-0488 1200HD 88084 072.C-0488, 183.C-0972 800HD 92719 072.C-0488, 183.C-0972 1150HD 96116 072.C-0488, 183.C-0972, 188.C-0265 600HD 96423 072.C-0488, 183.C-0972, 188.C-0265 1200HD 134664 072.C-0488 850HD 146233 072.C-0488 850HD 183658 072.C-0488, 183.C-0972, 188.C-0265 1000HD 208704 072.C-0488, 183.C-0972, 188.C-0265 1100HD 210918 072.C-0488 1300HD 220507 072.C-0488, 183.C-0972, 188.C-0265 1100HD 222582 072.C-0488, 183.C-0972 1000Vesta 088.C-0323 1200Ceres 082.C-0357, 060.A-9036, 060.A-9700 500Ganymede 060.A-9036, 060.A-9700 450
Fig. 1. The solar flux HARPS spectrum around the Ci line at5380 Å obtained via reflected light from Vesta (thin, red line) incomparison with the HARPS spectrum of HD 27063 (thick, blueline). The lower panel shows the difference (HD 27063 – Sun)between the two spectra.
3. Model atmosphere analysis
The Uppsala EQWIDTH program, which is based on the as-sumption of local thermodynamic equilibrium (LTE), was usedto calculate equivalent widths as a function of element abun-dance for plane parallel (1D) MARCS model atmospheres(Gustafsson et al. 2008) representing the stars. Interpolation tothe observed EWs then yields the LTE abundances for the vari-ous elements.
3.1. Spectral lines
The spectral lines used are listed in Table 2. As seen, they fallin the spectral region 4700 - 6900 Å, where the S/N of HARPSspectra is higher and line blending less severe than in the blueregion. Strong lines, such as the NaD lines and the Mgb triplet,and lines significantly blended by stellar or telluric lineswereavoided except for the [Oi] λ6300.3 line, which is blended by aNi i line. For C, Na, Mg, and Al two lines are available for eachelement. Heavier elements have at least three lines and for Ti, Cr,and Fe both neutral and ionized lines are available. In the caseof Fe, only lines having EWSun < 70 mÅ were included. Thisresults in a list of 47 Fei lines with excitation potentials,χexc,ranging from 0.9 to 5.1 eV and nine Feii lines, which are usedto determine effective temperatures and surface gravities of thestars as described in Sect. 3.2.
As the analysis is made differentially to the Sun line by line,theg f -values of the spectral lines cancel out. Doppler broaden-ing due to microturbulence is specified by a depth-independentparameter,ξturb. Collisional broadening of Cai, Ti i, Cr i, Fei,Feii, and Nii lines caused by neutral hydrogen and helium atomsis based on quantum mechanical calculations (Anstee & O’Mara1995; Barklem & O’Mara 1998; Barklem et al. 2000; Barklem &Aspelund-Johansson 2005). For the remaining lines, the Unsold(1955) approximation with an enhancement factor of two wasapplied. If instead an enhancement factor of one is adopted,thedifferential abundances are not changed significantly due to thefact that the damping wings of the lines only contribute a smallfraction of the equivalent width.
The derivation of oxygen abundances impose a particularproblem, because the [Oi] λ6300.3 line is blended by a Nii linewith nearly the same wavelength (Allende-Prieto et al. 2001).Based on the MARCS solar model, logg f = −2.11 (Johanssonet al. 2003), and a solar nickel abundance ofA(Ni)⊙ = 6.15 (asdetermined from 17 weak Nii lines listed in Scott et al. 2009),the equivalent width of the Nii line is calculated to be 1.7 mÅ.After subtracting this value from the measured EW of the [Oi]- Ni i blend (5.3 mÅ), one gets EW([Oi])⊙ = 3.6 mÅ. For thestars, the measured EWs of the [Oi] - Ni i blend were correctedin the same way by subtracting the EW of the Nii line as calcu-lated for the model atmosphere of the star and the [Ni/H] valuederived.
3.2. Stellar parameters
Adopting solar parameters,Teff =5777 K, logg= 4.438, andξturb= 1.0 km s−1, the corresponding parameters of the stars weredetermined by requesting that [Fe/H] has no systematic depen-dence onχexc and EW of the lines and that the mean [Fe/H] val-ues derived from Fei and Feii lines, respectively, are equal. Theslope of [Fe/H] as a function of excitation potential is sensitiveto the effective temperature and the slope of [Fe/H] versus EWdepends on the microturbulence. The difference of [Fe/H] de-rived from Fei and Feii lines depends on the surface gravity viaits effect on the electron pressure in the stellar atmospheres, butit is also affected by the iron andα-element abundances, becausethese elements are important electron donors. Therefore, it it isnecessary to make a number of iterations using MARCS modelswith different parametersTeff, logg, [Fe/H], and [α/Fe] to ensurethat the excitation and ionization balance of Fe lines are fulfilled.These models are obtained from two sets of MARCS models: thestandard set with [α/Fe]= 0 at [Fe/H] ≥ 0 and [α/Fe] rising lin-early to [α/Fe]= 0.4 when [Fe/H] decreases from 0.0 to−1.0,and theα-enhanced set with [α/Fe] = 0.4 at all metallicities.
3

P. E. Nissen: High-precision abundances of elements in solar twin stars
Fig. 2. [Fe/H] derived from lines in the spectrum of HD 183658as a function of excitation potential (upper panel) and “normal-ized” equivalent width:EWnorm. = EW · 6000.0/λ [Å] (lowerpanel). Open circles refer to Fei lines and filled (red) circlesto Feii lines. The full drawn lines show linear fits to the Feidata for the derived parameters of the star. The dashed linesshow changes in the slopes ifTeff is decreased by 30 K (upperpanel) and the microturbulence is decreased by 0.1 km s−1 (lowerpanel).
Hence, it it possible to interpolate to a MARCS model with the[α/Fe] value2 of a star. This is of some importance for threeα-enhanced solar twins in this paper with [α/Fe]≃ 0.08. If modelswith [α/Fe] = 0.0 were adopted for these stars, the derived ef-fective temperature and gravity would change by∆Teff ≃ −8 Kand∆logg ≃ +0.025 dex, whereas the effect on [Fe/H] is only−0.003dex.
As a typical example, Fig. 2 shows [Fe/H] as a function ofχexc and EW obtained with the final model of HD 183658 (Teff,logg, [Fe/H], [α/Fe])= (5809 K, 4.402,+0.035, 0.007). The rmsscatter of [Fe/H] is 0.007dex for Fei lines and 0.011dex for Feiilines. Based on the 1-sigma errors of the slopes of [Fe/H] ver-susχexc and EW and the errors of the average Fe abundancesderived from Fei and Feii lines, respectively, the error analy-sis method described by Epstein et al. (2010) and Bensby et al.(2014) has been used to derive the errors ofTeff, logg, [Fe/H],andξturb. The estimated errors are nearly the same for all stars,i.e.,σ(Teff) = 6 K,σ(logg) = 0.012 dex,σ([Fe/H]) = 0.006 dex,andσ(ξturb) = 0.017 km s−1.
In the derivation of the model atmosphere parameters, smalldifferential non-LTE corrections for the Fei lines according toLind et al. (2012) have been included. The largest non-LTE ef-fects occur at the lowest gravities of the solar twin sample,i. e.,logg ∼ 4.25; [Fe/H] is increased by 0.003 to 0.004 dex and loggby 0.007 to 0.009 dex relative to the LTE values. Changes inTeffare negligible, i. e., ranging from+2 to−3 K.
The small errors quoted are only obtainable for samples ofsolar twin stars that can be analyzed differentially with respect
2 Defined as [α/Fe] = 14 · ([Mg/Fe] + [Si/Fe] + [Ca/Fe] + [Ti /Fe])
in this paper.
Fig. 3. Photometric gravities based on Hipparcos parallaxes as afunction of spectroscopic gravities determined from the Feion-ization balance.
to the Sun using the same list of Fe lines. Still, one may wonderif these errors are really realistic. To test this, I have comparedwith parameters recently determined for 88 solar twin starsbyRamırez et al. (2014b) based on spectra obtained with the 6.5 mClay Magellan Telescope and the MIKE spectrograph. The spec-tra haveS/N > 400 and resolutions ofR = 83 000 (65 000) inthe blue (red) spectral regions. A set of 91 Fei and 19 Feii lineswere analyzed with MARCS models to derive atmospheric pa-rameters with errors similar to those quoted above. For 14 starsin common with the present paper I get the following averagedifferences (Ramırez – this paper) and rms deviations:∆Teff =
0± 10 K,∆logg = 0.002± 0.020, and∆[Fe/H] = 0.000± 0.014.The rms deviations forTeff and logg are fully explainable by theerrors quoted in the two works, whereas the rms deviation for[Fe/H] is a bit larger than expected.
The parameters derived in this paper are also in good agree-ment with those derived from HARPS spectra by Sousa et al.(2008) based on an extensive list of 236 Fei and 36 Feii linesanalyzed by using a grid of Kurucz model atmospheres (Kurucz1993). The average differences (Sousa – this paper) and rms de-viations for the 21 solar twins in the present paper are:∆Teff =
−1±8 K,∆logg = 0.018±0.033, and∆[Fe/H] = −0.003±0.009.The deviations inTeff and [Fe/H] are compatible with the smallerrors quoted above, but the rms deviation in logg is larger thanexpected; stars with logg < 4.35 turn out to have systematicallyhigher logg values in Sousa et al. (2008) than in the present pa-per. These deviations are not seen when comparing with loggvalues from Ramırez et al. (2014b).
The spectroscopic surface gravities have also been comparedto photometric gravities determined from the relation
logg
g⊙= log
MM⊙+ 4 log
Teff
Teff,⊙+ 0.4(Mbol − Mbol,⊙), (1)
whereM is the mass of the star andMbol the absolute bolomet-ric magnitude. Hipparcos parallaxes (van Leeuwen 2007) wereused to derive absolute visual magnitudes from V magnitudesbased on Stromgren photometry (Olsen 1983), and bolometriccorrections were adopted from Casagrande et al. (2010). Stellarmasses were obtained by interpolating in the luminosity - logTeffdiagram between the Yonsei -Yale evolutionary tracks of Yi et al.(2003); see Nissen & Schuster (2012) for details. The estimatederror of logg (phot.) ranges from 0.02 to 0.04 dex depending pri-
4
P. E. Nissen: High-precision abundances of elements in solar twin stars
marily on the relative error of the parallax. A seen from Fig.3,there is a satisfactory agreement between the two sets of gravi-ties. The weighted mean deviation (logg (phot.) – logg (spec.))is 0.005 dex, and the rms deviation is as expected from the errorbars except for one star, HD 38277, which has a 3-sigma devi-ation. Its lower logg (phot.) could be explained if the star is aspectroscopic binary, but there is no indication of a componentin the HARPS spectra.
3.3. Non-LTE and 3D effects
Although the solar twin stars have atmospheric parameters closeto those of the Sun, effects of deviations from LTE may be im-portant considering the very high precision we are aiming at.
The detailed calculations by Lind et al. (2012) show that Feiilines are not affected by departures from LTE, but as mentionedin Sect. 3.2 there is a small non-LTE effect on Fe abundancesderived from Fei lines. Using the IDL program made availableby Lind et al. to calculate non-LTE corrections for the actualset of Fei lines applied, it is found that the largest differentialcorrection,∆[Fe/H] = 0.004, occurs for stars having gravitiesabout 0.15 dex below the solar gravity. Calculations of non-LTEcorrections as a function ofTeff, logg, and [Fe/H] for the linesof C i (Takeda & Honda 2005), Mgi (Zhao & Gehren 2000), Siand Zni (Takeda et al. 2005), and Cai (Mashonkina et al. 2007),suggest similar small differential corrections as in the case of theFei lines; hence the non-LTE effect on the corresponding abun-dance ratios, [X/Fe], is negligible, and the LTE ratio is thereforeadopted. For the two Nai lines applied,λ6154.2 andλ6160.7,the calculations of Lind et al. (2011), indicate similar numericalcorrections as in the case of Fei lines, but withopposite sign.Therefore, non-LTE corrections have been applied when deter-mining [Na/Fe] ratios; the most extreme correction is−0.008 dexfor HD 38277.
For the lines of Ali and Sii there seems to be no detailedcalculations of non-LTE effects as a function ofTeff, logg, and[Fe/H] for solar type stars, but the corrections for the Sun itselfare on the order of 0.01 dex only (Baumuller & Gehren 1996; Shiet al. 2008; Scott et al. 2015b). This suggests that differentialcorrections for the Al and Si abundances can be neglected. Itis probably also the case for Ni (Scott et al. 2015a), althoughextensive non-LTE calculations for Nii lines are still missing.
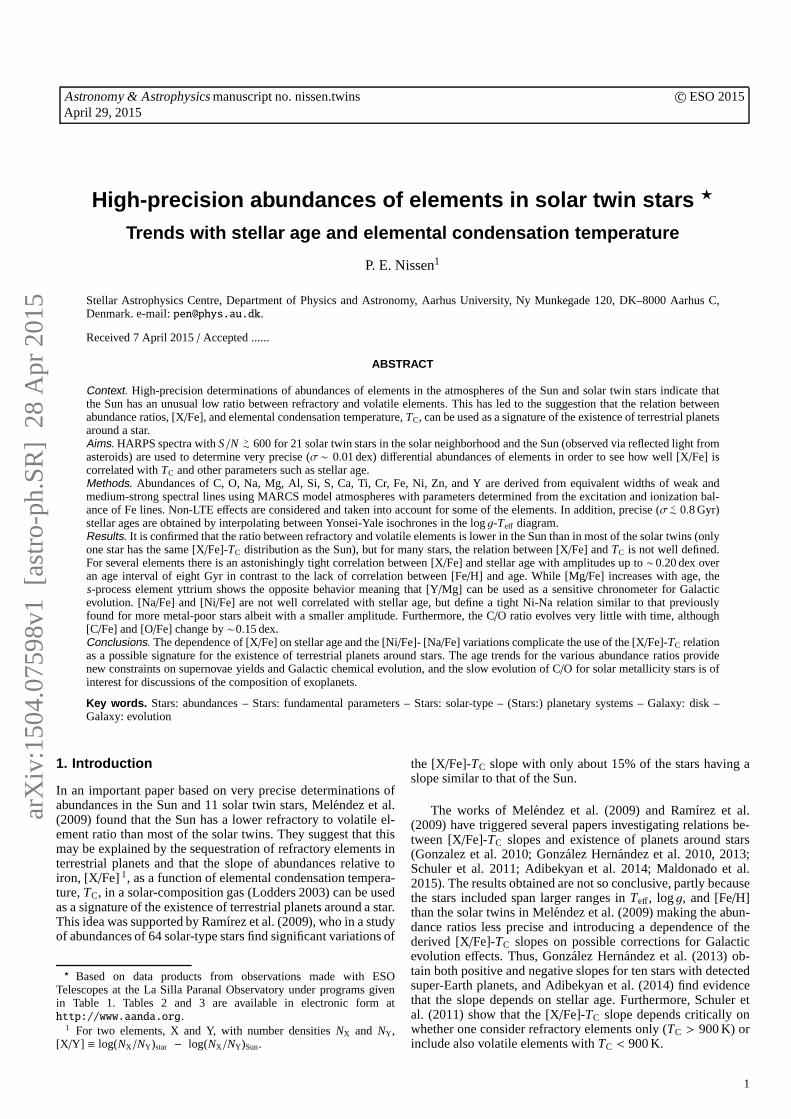
The statistical equilibrium calculations by Bergemann(2011) and Bergemann & Cescutti (2010) show that the Tiii andCr ii lines applied in this paper are formed in LTE in the solaratmosphere, whereas there are significant non-LTE effects forthe Tii and Cri lines. We may investigate this empirically bycomparing abundances derived from neutral and ionized lines,respectively. As seen from Fig. 4, there appears to be a trendof[Ti i/Ti ii] as a function of logg suggesting that solar twin starswith the lowest and highest gravities have differential non-LTEcorrections on the order of±0.01 dex for Ti abundances derivedfrom Ti i lines. In view of this, the Ti abundances derived fromTi ii lines will be adopted although only three such lines areavailable compared to 11 Tii lines. For Cr there is no signifi-cant trend of [Cri/Cr ii] versus logg and the rms scatter is only0.008 dex. In this case, the Cr abundance derived from Cri linesis adopted.
The oxygen abundances derived from the forbidden [Oi]line at 6300 Å are not affected by departures from LTE (e.g.,Kiselman 1993). This line is , however, sensitive to 3D hydro-dynamical (granulation) effects on the temperature structure ofthe stellar atmosphere (Asplund 2005). According to Nissenet
Fig. 4. The ratio of Ti abundances derived from Tii and Tiiilines, respectively, as a function of logg (upper panel) and thecorresponding ratio for Cr (lower panel).
al. (2002), this leads to 3D corrections that depend on effectivetemperature and metallicity. For the present sample of solar twinstars the largest differential effect on [O/H] is 0.007dex. For theother elements, one would expect 3D effects to be less signifi-cant, because the lines applied are formed deeper in the atmo-spheres, but this need to be confirmed by 3D model calculationspreferentially with non-LTE effects included.
The impact of magnetic fields on the temperature structureof stellar atmospheres is another potential problem. Magneto-hydrodynamic simulations of the solar atmosphere (Fabbianetal. 2010, 2012) show effects on the strength of Fei lines inducedprimarily by “magnetic heating” of the upper layers. For an av-erage vertical magnetic field strength of 100 G (Trujillo Buenoet al. 2004), the effect on the derived Fe abundance ranges from0.01 dex for weak lines formed in deep layers to 0.08 dex forstronger lines formed in the upper part of the photosphere. Theseresults have recently been confirmed by Moore et al. (2015), whoin addition find a correction on the order of+0.02 dex for theoxygen abundance derived from the [Oi] λ6300 line if a verticalmean field of 80 G is imposed. A similar correction is suggestedby the recent MHD simulations of Fabbian & Moreno-Insertis(2015).
These simulations raise the question if star-to-star differ-ences of the magnetic field strength lead to variations of abun-dance ratios among solar twin stars. If so, the ratio of Fe abun-dances determined from Fei and Feii lines (used for determiningthe gravity parameter) would also be affected, because of differ-ent depth of formation for neutral and ionized lines. As discussedin Sect. 3.2, there is, however, good agreement between spectro-scopic gravities and gravities determined via Hipparcos paral-laxes, which suggests that differences in magnetic field strengthdo not play a major role in the context of abundance variationsamong solar twin stars. Still, this is a problem that deserves fur-ther studies.
3.4. Abundance ratios and uncertainties
The derived abundance ratios, [X/Fe], are given in Table 3 to-gether with the atmospheric parameters of the stars. Due to thesystematic deviation between logg values derived in this paperand those of Sousa et al. (2008), four stars have gravities belowthe selection limit of logg= 4.29.
5

P. E. Nissen: High-precision abundances of elements in solar twin stars
Table 4. Uncertainties of abundance ratios.
Nlines σatm.par. σEW σadopted
[dex] [dex] [dex]
[C/Fe] 2 0.009 0.009 0.013[O/Fe] 1 0.008 indv. indv.
[Na/Fe] 2 0.002 0.004 0.007[Mg/Fe] 2 0.002 0.010 0.011[Al /Fe] 2 0.002 0.006 0.008[Si/Fe] 10 0.004 0.002 0.007[S/Fe] 4 0.009 0.012 0.016
[Ca/Fe] 7 0.002 0.003 0.006[Ti /Fe] 3 0.007 0.007 0.010[Cr/Fe] 10 0.001 0.003 0.006[Ni /Fe] 14 0.001 0.003 0.006[Zn/Fe] 3 0.004 0.009 0.011[Y /Fe] 3 0.007 0.005 0.010
The estimated 1-sigma errors of the differential abundanceratios are given in Table 4. Column three lists the error cor-responding to the uncertainty of the atmospheric parameters(σ(Teff) = ±6 K, σ(logg) = ±0.012,σ([Fe/H]) = 0.006 dexandσ(ξturb) = 0.017km s−1). For some of the abundance ratios,this error is very small, because the derived abundances of ele-ment X and Fe have almost the same dependence on the param-eters. Column four lists the error arising from the measurementof equivalent widths, calculated as the line-to-line scatter of theabundances derived divided by
√Nlines− 1, whereNlines is the
number of spectral lines applied. In the case of oxygen for whichonly the weak [Oi] λ6300.3 line was used,σEW was calculatedby assuming that the error of the equivalent width measurementisσ(EW) = ±0.2 mÅ. Finally, I have taken into account that dif-ferential 3D effects may introduce errors in the abundance ratiosup to 0.005 dex. Adding these error sources in quadrature leadsto the total adopted errors listed in the last column of Table4.
4. Stellar ages
As discussed in Sect. 5, it is interesting to have information onstellar ages. Although the stars belong to the main sequence, rel-ative ages may be derived from the precise values ofTeff andlogg as shown in Fig. 5, where the stars are compared to aYonsei-Yale set of isochrones (Yi et al. 2001; Kim et al. 2002).Using the IDL program made available by Kim et al. to calculateisochrones for the actual combination of [Fe/H] and [α/Fe] fora given star, it is possible to interpolate to the stellar ageand itsinternal 1-sigma error. The results are given in Table 5 togetherwith stellar masses derived fromTeff and logg. The internal errorof the mass is on the order of±0.01Msun.
As seen from Fig. 6, the stellar ages agree very well with thevalues of Ramırez et al. (2014b), who also determined ages fromYonsei-Yale isochrones in theTeff– logg diagram. The small sys-tematic deviation for the three oldest stars may be due to thefactthat they have enhanced [α/Fe] values ([α/Fe] ≃ 0.08), whichwere taken into account when deriving their ages in the presentpaper, but apparently not by Ramırez et al. (2014b).
Fig. 5. TheTeff– logg diagram of solar twin stars in comparisonwith Yonsei-Yale isochrones corresponding to ages given totheright in Gyr. The isochrones refer to [Fe/H]= 0.0 and [α/Fe]=0.0, but 5 Gyr isochrones corresponding to [Fe/H] = −0.05(dashed line) and [α/Fe] = +0.1 (dotted line) are also shown.The position of the Sun with an age of 4.55 Gyr is marked.
Fig. 6. Comparison of stellar ages derived in this paper with agesdetermined by Ramırez et al. (2014b).
5. Discussion
5.1. [X /Fe] - stellar age correlations
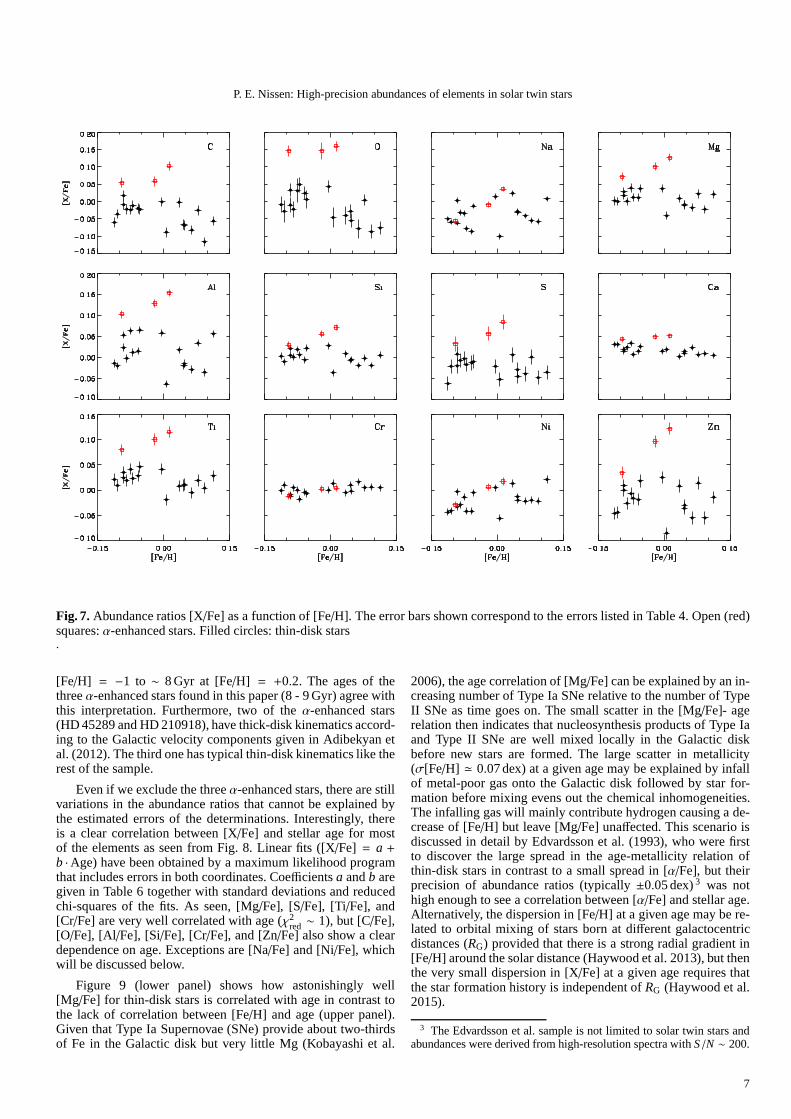
As seen from Fig. 7, the dispersion of [X/Fe] at a given [Fe/H]is larger than expected from the estimated error bars exceptinthe case of [Cr/Fe]. Three stars (HD 45289, HD 210918, andHD 220507) marked by open (red) squares stand out by havinghigh [X/Fe] ratios of the alpha-capture elements O, Mg, Si, S,and Ti, and are also high in C, Al, and Zn. These stars proba-bly belong to the class of metal-richα-enhanced stars first iden-tified by Adibekyan et al. (2011; 2012) as a population hav-ing [α/Fe] ≃ +0.1 in contrast to normal thin-disk stars with[α/Fe] ≃ +0.0. Bensby et al. (2014) confirm the existence ofsuch metal-richα-enhanced stars, and Haywood et al. (2013)show that they belong to a thick-disk sequence in the [α/Fe]- [Fe/H] diagram for which the ages range from∼ 13 Gyr at
6
P. E. Nissen: High-precision abundances of elements in solar twin stars
Fig. 7. Abundance ratios [X/Fe] as a function of [Fe/H]. The error bars shown correspond to the errors listed in Table 4. Open (red)squares:α-enhanced stars. Filled circles: thin-disk stars.
[Fe/H] = −1 to ∼ 8 Gyr at [Fe/H] = +0.2. The ages of thethreeα-enhanced stars found in this paper (8 - 9 Gyr) agree withthis interpretation. Furthermore, two of theα-enhanced stars(HD 45289 and HD 210918), have thick-disk kinematics accord-ing to the Galactic velocity components given in Adibekyan etal. (2012). The third one has typical thin-disk kinematics like therest of the sample.
Even if we exclude the threeα-enhanced stars, there are stillvariations in the abundance ratios that cannot be explainedbythe estimated errors of the determinations. Interestingly, thereis a clear correlation between [X/Fe] and stellar age for mostof the elements as seen from Fig. 8. Linear fits ([X/Fe] = a +b ·Age) have been obtained by a maximum likelihood programthat includes errors in both coordinates. Coefficientsa andb aregiven in Table 6 together with standard deviations and reducedchi-squares of the fits. As seen, [Mg/Fe], [S/Fe], [Ti/Fe], and[Cr/Fe] are very well correlated with age (χ2
red ∼ 1), but [C/Fe],[O/Fe], [Al/Fe], [Si/Fe], [Cr/Fe], and [Zn/Fe] also show a cleardependence on age. Exceptions are [Na/Fe] and [Ni/Fe], whichwill be discussed below.
Figure 9 (lower panel) shows how astonishingly well[Mg/Fe] for thin-disk stars is correlated with age in contrast tothe lack of correlation between [Fe/H] and age (upper panel).Given that Type Ia Supernovae (SNe) provide about two-thirdsof Fe in the Galactic disk but very little Mg (Kobayashi et al.
2006), the age correlation of [Mg/Fe] can be explained by an in-creasing number of Type Ia SNe relative to the number of TypeII SNe as time goes on. The small scatter in the [Mg/Fe]- agerelation then indicates that nucleosynthesis products of Type Iaand Type II SNe are well mixed locally in the Galactic diskbefore new stars are formed. The large scatter in metallicity(σ[Fe/H] ≃ 0.07 dex) at a given age may be explained by infallof metal-poor gas onto the Galactic disk followed by star for-mation before mixing evens out the chemical inhomogeneities.The infalling gas will mainly contribute hydrogen causing ade-crease of [Fe/H] but leave [Mg/Fe] unaffected. This scenario isdiscussed in detail by Edvardsson et al. (1993), who were firstto discover the large spread in the age-metallicity relation ofthin-disk stars in contrast to a small spread in [α/Fe], but theirprecision of abundance ratios (typically±0.05 dex)3 was nothigh enough to see a correlation between [α/Fe] and stellar age.Alternatively, the dispersion in [Fe/H] at a given age may be re-lated to orbital mixing of stars born at different galactocentricdistances (RG) provided that there is a strong radial gradient in[Fe/H] around the solar distance (Haywood et al. 2013), but thenthe very small dispersion in [X/Fe] at a given age requires thatthe star formation history is independent ofRG (Haywood et al.2015).
3 The Edvardsson et al. sample is not limited to solar twin stars andabundances were derived from high-resolution spectra withS/N ∼ 200.
7

P. E. Nissen: High-precision abundances of elements in solar twin stars
Fig. 8. Abundance ratios [X/Fe] as a function of stellar age for the thin-disk stars. The lines show maximum likelihood linear fits tothe data, with zero points and slope coefficients as given in Table 6.
As seen from Fig. 8 and Table 6, the slope of [X/Fe] versusage differs from element to element. To some extent this maybe explained in terms of differences in the relative contributionsof Type Ia and Type II SNe to the various elements, but it can-not explain that the age-slopes for C, O, and Al are significantlylarger than that of Mg, because for all four elements, the yieldof Type Ia SNe is negligible compared to the Type II SNe yield(e.g., Kobayashi et al. 2006). Hence, it seems that one has toin-clude an evolving initial mass function to explain the age trendsseen in Fig. 8. Asymptotic giant branch (AGB) stars (Karakas2010) should also be considered, but cannot solve the problem;they contribute C and Al (as well as Na) but no Fe, and henceincrease [X /Fe] for these elements as a function of increasingtime, i.e., decreasing stellar age.
The near-constancy of [Ca/Fe] as a function of stellar age(see Fig. 8) is another puzzling problem. According to yields ofsupernovae (Kobayashi et al. 2006), one would expect [Ca/Fe]to increase with age in the same way as [Si/Fe] and [S/Fe]. Asimilar problem is encountered in studies of abundance ratios inearly-type galaxies (Conroy et al. 2014); [Ca/Fe] is constant as afunction of stellar velocity dispersion in contrast to a rising trendfor the otherα-capture elements. Mulchaey et al. (2014) suggestthat this special behavior of Ca as well as the high Ca abundancein diffuse gas of clusters of galaxies is due to a new class oflow luminosity supernovae exemplified by SN 2005E, for whichthe amount of synthesized Ca is 5-10 times greater than that of
classical Type Ia SNe (Perets et al. 2010). Perhaps these Ca-richSNe are also important for the chemical evolution of the Galacticdisk.
Diffusion of elements (gravitational settling and radiativelevitation) should also be considered when discussing abun-dances of stars as a function of time. Helioseismology and mod-els of the Sun indicate that the surface abundances of heavy el-ements (and helium) have decreased by∼ 10 % relative to theirinitial values (Christensen Dalsgaard et al. 1996). According toTurcotte & Wimmer-Schweingruber (2002), the effect on [X/Fe]is, however, much smaller, i.e.,<0.004 dex for the elements dis-cussed in this paper. This means that diffusion can be neglectedwhen discussing the age trends of [X/Fe].
The s-process element yttrium is not included in Fig. 8, butin contrast to most of the other elements, [Y/Fe] decreases withstellar age as previously found for barium (Edvardsson et al.1993; Bensby et al. 2007). This is probably due to an increasingcontribution of Y and Ba from low-mass (1 -4MSun) AGB starsas time go on (Travaglio et al. 2004). As the slope of [Y/Fe] ver-sus age is quite steep (b = −0.033 dex Gyr−1 with opposite signto that of [Mg/Fe] (b = +0.009 dex Gyr−1), [Y /Mg] becomesa sensitive indicator of age as seen from Fig. 10. A maximumlikelihood fit to the data yields the relation
[Y /Mg] = 0.175 (±0.011)− 0.0404 (±0.0019) Age [Gyr] (2)
with χ2red = 0.71.
8

P. E. Nissen: High-precision abundances of elements in solar twin stars
Table 5. Stellar ages and masses.
Star Age Mass Notea
[Gyr] [ M⊙]
HD 2071 3.5 ± 0.8 0.97HD 8406 4.2 ± 0.8 0.96HD 20782 7.5 ± 0.4 0.97 1.8MJ
b
HD 27063 2.6 ± 0.6 1.04HD 28471 7.0 ± 0.4 0.97HD 38277 7.3 ± 0.4 1.01HD 45184 2.7 ± 0.5 1.06 0.04MJ
c
HD 45289∗ 8.5 ± 0.4 1.00HD 71334 8.1 ± 0.4 0.94HD 78429 7.5 ± 0.4 1.04HD 88084 6.0 ± 0.6 0.96HD 92719 2.7 ± 0.6 0.99HD 96116 0.7 ± 0.7 1.05HD 96423 6.0 ± 0.4 1.03HD 134664 2.3 ± 0.5 1.07HD 146233 3.8 ± 0.5 1.04HD 183658 5.0 ± 0.5 1.03HD 208704 6.9 ± 0.4 0.98HD 210918∗ 8.5 ± 0.4 0.96HD 220507∗ 8.8 ± 0.4 1.01HD 222582 6.5 ± 0.4 1.01 7.8MJ
d
Notes. (∗) α-enhanced star.(a) Mass of detected planet in units ofJupiter’s mass.(b) Jones et al. (2006).(c) Mayor et al. (2011).(d) Butleret al. (2006).
Table 6. Linear fits of [X/Fe] as a function of stellar age.
a b σ[X /Fe]a χ2red
[dex] 10−3 dex Gyr−1 [dex]
[C/Fe] −0.110 ± 0.011 +13.9 ± 2.0 0.025 2.7[O/Fe] −0.098 ± 0.015 +16.1 ± 2.8 0.030 1.9
[Na/Fe] −0.090 ± 0.035 +9.8 ± 6.3 0.039 20.6[Mg/Fe] −0.037 ± 0.005 +8.9 ± 0.9 0.011 0.8[Al /Fe] −0.074 ± 0.011 +16.7 ± 1.9 0.020 3.6[Si/Fe] −0.028 ± 0.005 +5.7 ± 0.9 0.012 2.4[S/Fe] −0.058 ± 0.007 +7.0 ± 1.3 0.015 0.8
[Ca/Fe] +0.020 ± 0.004 −0.6 ± 0.8 0.010 2.7[Ti /Fe] −0.013 ± 0.005 +6.3 ± 0.8 0.010 0.9[Cr/Fe] +0.014 ± 0.003 −2.6 ± 0.6 0.007 1.4[Ni /Fe] −0.044 ± 0.011 +4.8 ± 2.0 0.021 10.7[Zn/Fe] −0.079 ± 0.008 +11.7 ± 1.4 0.018 2.0[Y /Fe] +0.146 ± 0.011 −33.0 ± 2.0 0.023 1.6
Notes. (a) Standard deviation of [X/Fe] for the linear fit.
For elements having a condensation temperatures markedlydifferent from that of Fe, the variations in the [X/Fe]-TC slopediscussed in Sect. 5.2 contribute to the scatter in the [X/Fe]-agerelation. In particular, this effect may explain why the scatterin [C/Fe] and [O/Fe] is larger than expected from the estimatederrors of the determinations, i.e.,χ2
red = 2.7 and 1.9, respectively.[C/O], on the other hand, is not much affected by the [X/Fe]-TC slope variations, because the two elements have similar lowcondensation temperatures.
Fig. 9. [Fe/H] and [Mg/Fe] versus stellar age. Thin-disk stars areshown with filled circles andα-enhanced stars with open (red)squares. The line in the lower panel corresponds to the fit givenin Table 6.
Fig. 10. [Y /Mg] versus stellar age for thin-disk stars.
Recently, the C/O ratio4 in solar-type stars has been muchdiscussed, mainly because its value may influence the compo-sition of planets formed in circumstellar disks (e.g., Bondet al.2010; Fortney 2012; Gaidos 2015). In some studies (DelgadoMena et al. 2010; Petigura & Marcy 2011), C/O was found torange from∼ 0.4 to >∼ 1.0, i.e., up to a factor of two higherthan the solar ratio, C/O⊙ = 0.55± 0.10 (Asplund et al. 2009;
4 C/O is defined asNC/NO, whereNC andNO are the number densitiesof carbon and oxygen nuclei, respectively, and should not beconfusedwith the solar-normalized logarithmic ratio, [C/O].
9

P. E. Nissen: High-precision abundances of elements in solar twin stars
Fig. 11. The C/O ratio as a function of stellar age. The line showsthe evolution of C/O (normalized to a solar ratio of 0.55) accord-ing to the chemical evolution calculations of Gaidos (2015).
Caffau et al. 2011). This has led to speculations about the exis-tence of exoplanets consisting of carbides and graphite insteadof Earth-like silicates (Bond et al. 2010). Alternative determi-nations of C/O in solar-type stars (Nissen 2013; Nissen et al.2014; Teske et al. 2014) show, however, only a small scatter inC/O and an increasing trend as a function of [Fe/H] reachingC/O ≃ 0.8 at [Fe/H] ≃ 0.4. The scatter of C/O for the solartwin stars is also small, i.e.,±0.035 only around a mean value of<C/O> = 0.52 (see Fig. 11). Furthermore, there is not much evo-lution of C/O as a function of time despite the fact that both C/Feand O/Fe evolve significantly. This agrees very well with the re-cent Galactic chemical evolution calculations of Gaidos (2015)as seen from Fig. 11. In his model, the dominant contributionofC and O comes from massive stars, and C/O has only a moderaterise during the first∼ 5 Gyr due to an increasing contribution ofcarbon from stars of lower mass.
As mentioned above, [Na/Fe] and [Ni/Fe] are not well cor-related with stellar age; according to Table 6 the linear fitshaveχ2
red > 10. Curiously, there is, however, a tight correlation be-tween [Na/Fe] and [Ni/Fe] as shown in Fig. 12. A maximumlikelihood linear fit with errors in both coordinates provides therelation
[Ni /Fe]= 0.002 (±0.002)+ 0.580 (±0.032) [Na/Fe] (3)
with a standard deviationσ[Ni /Fe] = 0.008, which is close tothat expected from the estimated errors of [Na/Fe] and [Ni/Fe],i. e.,±0.007 and±0.006dex, respectively.
Apparently, correlated variations of [Ni/Fe] and [Na/Fe]among solar-metallicity stars have not been noted before. This isunderstandable given that the amplitude is small, i.e.,∼0.07 dexin [Ni /Fe]; it requires very high abundance precision to seethe variations5. A Ni-Na relation has, however, been found forthick-disk and halo stars with−1.6 < [Fe/H] − 0.4 (Nissen &Schuster 1997, 2010, 2011) and for stars in dwarf spheroidalgalaxies in the same metallicity interval (Venn et al. 2004;Letarte 2010; Lemasle 2014). For these metal-poor stars, the am-plitude of the variations is larger (∼ 0.3 dex in [Ni/Fe]), but theslope of the [Ni/Fe] - [Na/Fe] relation is about the same as foundfor the solar-metallicity stars, i. e.∆[Ni /Fe]/∆[Na/Fe] ≃ 0.5.Furthermore, the lowest Ni/Fe and Na/Fe ratios are found among
5 For the solar twin stars studied, abundance ratios derived fromHARPS spectra by Neves et al. (2009) show in fact correlated varia-tions in [Ni/Fe] and [Na/Fe] similar to Fig. 12, but it was not noted inthat paper nor in subsequent papers based on HARPS spectra.
Fig. 12. [Ni /Fe] versus [Na/Fe] with the same symbols as usedin Fig. 7. The line corresponds to the linear fit of [Ni/Fe] as afunction of [Na/Fe] given in Eq. (2).
stars with the lowestα/Fe ratios, which agrees with the trendsseen for the solar twin stars.
As discussed by Venn et al. (2004), the Ni-Na correlationmay be due to the fact that the yields of Na and the domi-nant isotope of Ni (Ni58) produced in massive stars explodingas Type II SNe both depend on the neutron excess, which itselfdepends on metallicity and theα/Fe ratio. Neutrons are releasedby the22Ne(α,n)25Mg reaction, where22Ne comes from doubleα-capture on14N made from initial C and O in the CNO cycle.It is, however, difficult to understand why [Na/Fe] and [Ni/Fe]are not well correlated with stellar age like the other abundanceratios; it was argued above thatα-capture elements produced inType II SNe must be efficiently mixed in interstellar gas to ex-plain the small scatter of [Mg/Fe] at a given age, so why shouldthere be variations of the neutron excess?
5.2. [X /Fe]-TC correlations
As discussed in Sect. 1, sequestration of refractory elements interrestrial planets or on interstellar dust particles may introducestar-to-star differences of abundance ratios, which are correlatedwith elemental condensation temperatureTC (Lodders 2003). Inorder to see if this is the case, [X/Fe] has been plotted as a func-tion of TC for all stars and linear-least squares fits with [X/Fe]weighted by the inverse square of its error have been obtained.The coefficients and the reducedχ2 of the fits are given in Table7. Figure 13 shows some typical examples6.
As seen from Table 7, the reducedχ2 of the fits is larger thanone for all stars indicating that there is never a perfect correla-tion between [X/Fe] andTC. Nevertheless, for several stars theslope coefficient is more than three times larger than the errorof the slope. The first star, HD 134664, in Fig. 13 with a slope∆[X /Fe]/∆TC = 6.7±1.6 ×10⁻⁵dex K−1 represents such a case.It has a ratio between refractory elements withTC > 1200 K andthe volatile elements C and O about 0.08 dex higher than in theSun. Assuming that HD 134664 has a pristine composition, thismeans that the Sun has been depleted in refractory elements byas much as 20% as first advocated by Melendez et al. (2009)from abundance ratios in 11 solar twins.
The second star in Fig. 13, HD 146233 (18 Sco) represents anintermediate case with∆[X /Fe]/∆TC = 3.8±1.1 ×10⁻⁵dex K−1.This star has recently been studied in detail by Melendez etal.
6 Yttrium is not included in the [X/Fe]-TC fits, because for many stars[Y /Fe] has a large deviation.
10

P. E. Nissen: High-precision abundances of elements in solar twin stars
Table 7. Linear fits, [X/Fe]= a + b · TC.
Star a b χ2red
[dex] [10−5dex K−1]
HD 2071 −0.043 ± 0.019 3.1 ± 1.5 4.9HD 8406 −0.068 ± 0.030 4.4 ± 2.3 11.2HD 20782 −0.060 ± 0.034 3.7 ± 2.6 16.3HD 27063 −0.084 ± 0.023 5.5 ± 1.8 6.8HD 28471 −0.041 ± 0.023 4.3 ± 1.8 6.8HD 38277 −0.051 ± 0.034 2.9 ± 2.6 14.8HD 45184 −0.069 ± 0.013 4.6 ± 1.0 2.2HD 45289∗ +0.021 ± 0.052 1.9 ± 4.0 35.1HD 71334 −0.059 ± 0.026 5.5 ± 2.0 8.3HD 78429 −0.038 ± 0.024 2.8 ± 1.8 8.4HD 88084 −0.011 ± 0.019 1.9 ± 1.5 5.0HD 92719 −0.081 ± 0.027 5.4 ± 2.1 9.9HD 96116 −0.113 ± 0.042 6.1 ± 3.2 21.7HD 96423 −0.060 ± 0.015 5.5 ± 1.1 3.1HD 134664 −0.106 ± 0.020 6.7 ± 1.6 5.6HD 146233 −0.058 ± 0.014 3.8 ± 1.1 2.7HD 183658 +0.003 ± 0.012 0.4 ± 0.9 1.7HD 208704 −0.041 ± 0.029 2.7 ± 2.2 11.5HD 210918∗ +0.003 ± 0.056 1.4 ± 4.3 46.2HD 220507∗ +0.085 ± 0.053 −1.7± 4.1 43.9HD 222582 −0.002 ± 0.019 1.7 ± 1.5 5.4
Notes. (∗) α-enhanced star.
(2014a), who for 20 elements withZ ≤ 30 find aTC-slope of3.5 × 10−5dex K−1 in excellent agreement with the value foundis this paper7. Neutron capture elements were, however, foundto have higher abundances than expected from the [X/Fe]-TC re-lation. This is confirmed by deriving abundances of Y, Ba andEu from the HARPS spectrum of HD 146233.
The third star in Fig. 13, HD 183658, is the only one in thesample with a well-defined relation between [X/Fe] andTC and aslope close to zero. Thus, it is the only star for which the [X/Fe]distribution matches that of the Sun, confirming that the Sunisunusual among solar twin stars.
For the threeα-enhanced stars, there is no correlation be-tween [X/Fe] andTC as shown in the case of HD 210918 inthe last panel of Fig. 13. In addition, there are five stars withχ2
red > 10 for which the correlation is also poor, mainly because[Na/Fe] and [Ni/Fe] deviate strongly from the mean trend. Asshown in Fig. 13 for the case of HD 20782 very different slopesare derived depending on whether one includes all elements orfit only elements with a condensation temperatureTC > 900 K asin Ramırez et al. (2009). Another solar twin (HIP 102152) withdeviating [Na/Fe] and [Ni/Fe] values was analyzed by Monroeet al. (2013), who suggest that the low sodium (and nitrogen)abundance could be due to it’s high age (8 Gyr). However, starswith low Na and Ni abundances in this paper cover a broadrange in age. Instead, it should be noted that HIP 102152 with[Na/Fe] = −0.044 and [Ni/Fe] = −0.026 according to Monroeet al. fits the Ni-Na relation shown in Fig. 12 almost exactly.
Recently, Adibekyan et al. (2014) have found evidence fora dependence of the [X/Fe]-TC slope on stellar age using databased on HARPS spectra for 148 solar-like stars with 5600<Teff < 6375 K, 4.10 < logg < 4.65 and−0.3 < [Fe/H] < +0.4.For this sample, theTC-slope changes by about 6×10⁻⁵dex K−1
7 For 13 elements in common, the mean deviation and rms scatterfor HD 146233 are∆[X /H] (Melendez – this paper)= 0.003±0.007 dexconfirming the high precision estimated in the two papers.
Fig. 13. The relation between [X/Fe] and elemental condensa-tion temperature (Lodders 2003) for five representative stars.The lines show linear fits to the weighted values of [X/Fe]. Inthe case of HD 20782, the dashed line shows the fit for elementswith TC > 900 K.
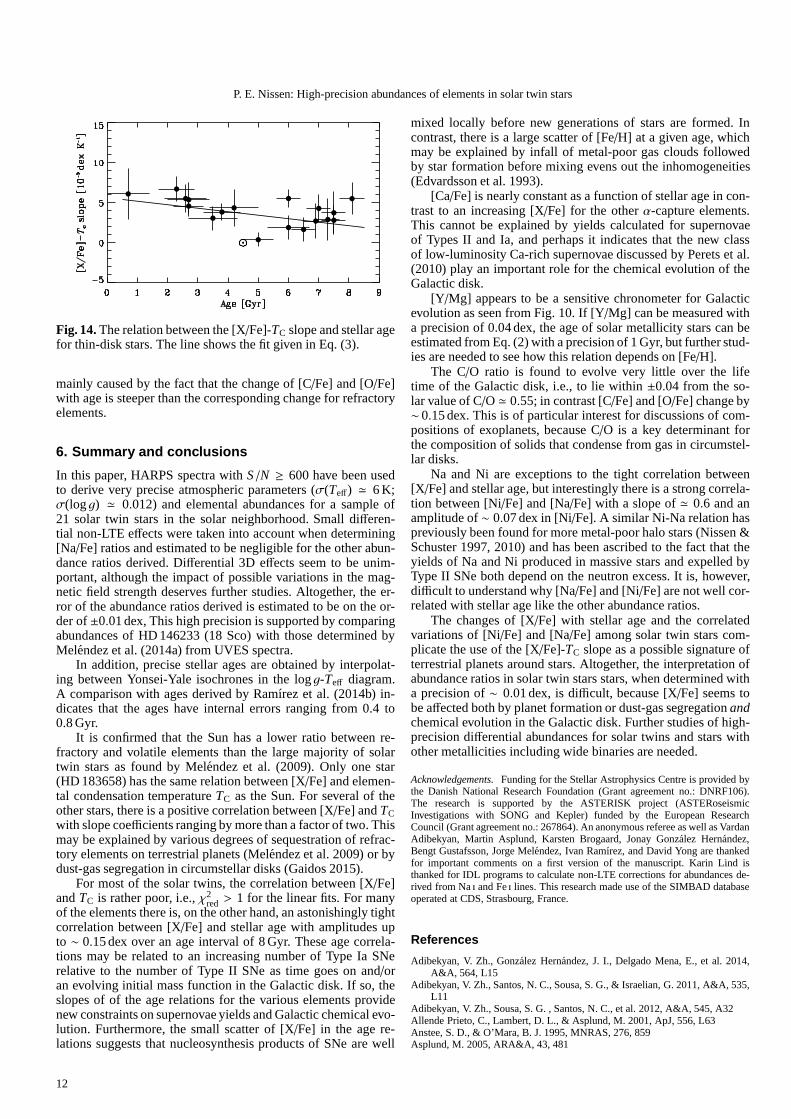
for an age change of 10 Gyr. A similar age dependence of the[X /Fe]-TC slope were found for a group of 59 metal-rich solar-analog stars by Ramırez et al. (2014a). As seen from Fig. 14,there is also evidence for an age dependence of the slopes de-rived in this paper. From a maximum likelihood fit to the datafor the thin-disk stars I get
b = 5.6 (±0.8)− 0.43 (±0.15) Age [Gyr], (4)
whereb is the [X/Fe] versusTC slope in units of 10−5dex K−1.The fit has a satisfactoryχ2
red = 1.5, but one star, HD 183658, andthe Sun have a 3-sigma deviation. Within the errors, the changeof the TC-slope with age agrees with the result of Adibekyanet al.8. Furthermore, it is noted that the change inTC-slope is
8 Note that Adibekyan et al. (2014) define theTC-slope with the op-posite sign of that used in the present paper.
11
P. E. Nissen: High-precision abundances of elements in solar twin stars
Fig. 14. The relation between the [X/Fe]-TC slope and stellar agefor thin-disk stars. The line shows the fit given in Eq. (3).
mainly caused by the fact that the change of [C/Fe] and [O/Fe]with age is steeper than the corresponding change for refractoryelements.
6. Summary and conclusions
In this paper, HARPS spectra withS/N ≥ 600 have been usedto derive very precise atmospheric parameters (σ(Teff) ≃ 6 K;σ(logg) ≃ 0.012) and elemental abundances for a sample of21 solar twin stars in the solar neighborhood. Small differen-tial non-LTE effects were taken into account when determining[Na/Fe] ratios and estimated to be negligible for the other abun-dance ratios derived. Differential 3D effects seem to be unim-portant, although the impact of possible variations in the mag-netic field strength deserves further studies. Altogether,the er-ror of the abundance ratios derived is estimated to be on the or-der of±0.01 dex, This high precision is supported by comparingabundances of HD 146233 (18 Sco) with those determined byMelendez et al. (2014a) from UVES spectra.
In addition, precise stellar ages are obtained by interpolat-ing between Yonsei-Yale isochrones in the logg-Teff diagram.A comparison with ages derived by Ramırez et al. (2014b) in-dicates that the ages have internal errors ranging from 0.4 to0.8 Gyr.
It is confirmed that the Sun has a lower ratio between re-fractory and volatile elements than the large majority of solartwin stars as found by Melendez et al. (2009). Only one star(HD 183658) has the same relation between [X/Fe] and elemen-tal condensation temperatureTC as the Sun. For several of theother stars, there is a positive correlation between [X/Fe] andTCwith slope coefficients ranging by more than a factor of two. Thismay be explained by various degrees of sequestration of refrac-tory elements on terrestrial planets (Melendez et al. 2009) or bydust-gas segregation in circumstellar disks (Gaidos 2015).
For most of the solar twins, the correlation between [X/Fe]andTC is rather poor, i.e.,χ2
red > 1 for the linear fits. For manyof the elements there is, on the other hand, an astonishinglytightcorrelation between [X/Fe] and stellar age with amplitudes upto ∼ 0.15 dex over an age interval of 8 Gyr. These age correla-tions may be related to an increasing number of Type Ia SNerelative to the number of Type II SNe as time goes on and/oran evolving initial mass function in the Galactic disk. If so, theslopes of of the age relations for the various elements providenew constraints on supernovae yields and Galactic chemicalevo-lution. Furthermore, the small scatter of [X/Fe] in the age re-lations suggests that nucleosynthesis products of SNe are well
mixed locally before new generations of stars are formed. Incontrast, there is a large scatter of [Fe/H] at a given age, whichmay be explained by infall of metal-poor gas clouds followedby star formation before mixing evens out the inhomogeneities(Edvardsson et al. 1993).
[Ca/Fe] is nearly constant as a function of stellar age in con-trast to an increasing [X/Fe] for the otherα-capture elements.This cannot be explained by yields calculated for supernovaeof Types II and Ia, and perhaps it indicates that the new classof low-luminosity Ca-rich supernovae discussed by Perets et al.(2010) play an important role for the chemical evolution of theGalactic disk.
[Y /Mg] appears to be a sensitive chronometer for Galacticevolution as seen from Fig. 10. If [Y/Mg] can be measured witha precision of 0.04 dex, the age of solar metallicity stars can beestimated from Eq. (2) with a precision of 1 Gyr, but further stud-ies are needed to see how this relation depends on [Fe/H].
The C/O ratio is found to evolve very little over the lifetime of the Galactic disk, i.e., to lie within±0.04 from the so-lar value of C/O≃ 0.55; in contrast [C/Fe] and [O/Fe] change by∼ 0.15 dex. This is of particular interest for discussions of com-positions of exoplanets, because C/O is a key determinant forthe composition of solids that condense from gas in circumstel-lar disks.
Na and Ni are exceptions to the tight correlation between[X /Fe] and stellar age, but interestingly there is a strong correla-tion between [Ni/Fe] and [Na/Fe] with a slope of≃ 0.6 and anamplitude of∼ 0.07 dex in [Ni/Fe]. A similar Ni-Na relation haspreviously been found for more metal-poor halo stars (Nissen &Schuster 1997, 2010) and has been ascribed to the fact that theyields of Na and Ni produced in massive stars and expelled byType II SNe both depend on the neutron excess. It is, however,difficult to understand why [Na/Fe] and [Ni/Fe] are not well cor-related with stellar age like the other abundance ratios.
The changes of [X/Fe] with stellar age and the correlatedvariations of [Ni/Fe] and [Na/Fe] among solar twin stars com-plicate the use of the [X/Fe]-TC slope as a possible signature ofterrestrial planets around stars. Altogether, the interpretation ofabundance ratios in solar twin stars stars, when determinedwitha precision of∼ 0.01 dex, is difficult, because [X/Fe] seems tobe affected both by planet formation or dust-gas segregationandchemical evolution in the Galactic disk. Further studies ofhigh-precision differential abundances for solar twins and stars withother metallicities including wide binaries are needed.
Acknowledgements. Funding for the Stellar Astrophysics Centre is provided bythe Danish National Research Foundation (Grant agreement no.: DNRF106).The research is supported by the ASTERISK project (ASTERoseismicInvestigations with SONG and Kepler) funded by the EuropeanResearchCouncil (Grant agreement no.: 267864). An anonymous referee as well as VardanAdibekyan, Martin Asplund, Karsten Brogaard, Jonay Gonzalez Hernandez,Bengt Gustafsson, Jorge Melendez, Ivan Ramırez, and David Yong are thankedfor important comments on a first version of the manuscript. Karin Lind isthanked for IDL programs to calculate non-LTE corrections for abundances de-rived from Nai and Fei lines. This research made use of the SIMBAD databaseoperated at CDS, Strasbourg, France.
References
Adibekyan, V. Zh., Gonzalez Hernandez, J. I., Delgado Mena, E., et al. 2014,A&A, 564, L15
Adibekyan, V. Zh., Santos, N. C., Sousa, S. G., & Israelian, G. 2011, A&A, 535,L11
Adibekyan, V. Zh., Sousa, S. G. , Santos, N. C., et al. 2012, A&A, 545, A32Allende Prieto, C., Lambert, D. L., & Asplund, M. 2001, ApJ, 556, L63Anstee, S. D., & O’Mara, B. J. 1995, MNRAS, 276, 859Asplund, M. 2005, ARA&A, 43, 481
12
P. E. Nissen: High-precision abundances of elements in solar twin stars
Asplund, M., Grevesse, N., Sauval, A. J., & Scott, P. 2009, ARA&A, 47, 481Barklem, P. S. & Aspelund-Johansson, J. 2005, A&A, 435, 373Barklem, P. S., & O’Mara, B. J. 1998, MNRAS, 300, 863Barklem, P. S., Piskunov, N., & O’Mara, B. J. 2000, A&AS, 142,467Baumuller, D., & Gehren, T. 1996, A&A, 307, 961Bedell, M., Melendez, J., Bean, J. L., et al. 2014, Ap, 795, 23Bensby, T., Feltzing, S., & Oey, M. S. 2014, A&A, 562, A71Bensby, T., Zenn, A. R., Oey, M. S., & Feltzing 2007, ApJ, 663,L13Bergemann, M. 2011, MNRAS, 413, 2184Bergemann, M., & Cescutti, G., 2010, A&A, 522, A9Bond, J. C., O’Brien, D. P., & Lauretta, D. S. 2010, ApJ, 715, 1050Butler, R. P., Wright, J. T., Marcy, G. W., et al. 2006, ApJ, 646, 505Caffau, E., Ludwig, H.-G., Steffen, M., Freytag, B., & Bonifacio, P. 2011, Solar
Phys., 268, 255Casagrande, L., Ramırez. I., Melendez, J., Bessell, M., &Asplund, M. 2010,
A&A, 512, A54Christensen-Dalsgaard, J., Dappen, W., Ajukov, S. V., et al. 1996 Science, 272,
1286Conroy, C., Graves, G. J., & van Dokkum, P. G. 2014, ApJ, 780, 33Damasso, M., Biazzo, K., Bonomo, A. S., et al. 2015, A&A, 575,A111Delgado Mena, E., Israelian, G., Gonzalez Hernandez, J. I., et al. 2010, ApJ, 725,
2349Edvardsson, B., Andersen, J., Gustafsson, B., et al. 1993, A&A, 275, 101Epstein, C. R., Johnson, J. A., Dong, S., et al. 2010, ApJ, 709, 447Fabbian, D, Khomenko, E., Moreno-Insertis, F., & Nordlund,Å. 2010, ApJ, 724,
1536Fabbian, D, & Moreno-Insertis, F. 2015, ApJ, 802, 96Fabbian, D, Moreno-Insertis, F., Khomenko, E., & Nordlund,Å. 2012, A&A,
548, A35Fortney, J. J. 2012, ApJ, 747, L27Gaidos, E. 2015, ApJ, in press (arXiv:1502.0699)Gonzalez, G., Carlson, M. K., & Tobin, R. W. 2010, MNRAS, 407,314Gonzalez Hernandez, J. I., Delgado-Mena, E., Sousa, S. G., et al. 2013, A&A,
552, A6Gonzalez Hernandez, J. I., Israelian, G., Santos, N. C., et al. 2010, ApJ, 720,
1592Gustafsson, B., Edvardsson, B., Eriksson, K., et al. 2008, A&A, 486, 951Haywood, M., Di Matteo, P., Lehnert, M. D., Katz, D., & Gomez, A 2013, A&A
560, A109Haywood, M., Di Matteo, P., Snaith, O., & Lehnert, M. D. 2015,A&A, in press
(arXiv:1504.02019)Johansson, S., Litzen, U., Lundberg, H., & Zhang, Z. 2003, ApJ, 584, L107Jones, H. R. A., Butler, R. P., Tinney, C. G., et al. 2006, MNRAS, 369, 249Karakas, A. I. 2010, MNRAS, 403, 1413Kim, Y.-C., Demarque, P., Yi, S. K., & Alexander, D. R. 2002, ApJS, 143, 499Kiselman, D. 1993, A&A, 275, 269Kobayashi, C., Umeda, H., Nomoto, K., Tominaga, N., & Ohkubo, T. 2006, ApJ,
653, 1145Kurucz, R. 1993, ATLAS9 Stellar Atmosphere Programs and 2 kms−1 grid.
Kurucz CD-ROM No. 13. Cambridge, Mass.: Smithsonian AstrophysicalObservatory, 1993, 13
Lemasle, B., de Boer, T. J. L., Hill, V., et al. 2014, A&A, 572,A88Letarte, B., Hill, V., Tolstoy, E., et al. 2010, A&A, 523, A17Lind, K., Asplund, M., Barklem, P. S., & Belyaev, A. K. 2011, A&A, 528, A103Lind, K., Bergemann, M., & Asplund, M. 2012, MNRAS, 427, 50Liu, F., Asplund, M., Ramırez, I., Yong, D., & Melendez, J.2014, MNRAS, 442,
L51Lodders, K. 2003, ApJ, 591, 1220Maldonado, J., Eiroa, C., Villaver, E., Montesinos, B., & Mora, A. 2015, A&A,
in press (arXiv:1502.07100)Mashonkina, L., Korn, A. J., & Przybilla, N. 2007, A&A, 461, 261Mayor, M., Marmier, M., Lovis, C., et al. 2011, (arXiv:1109.2497)Mayor, M., Pepe, F., Queloz, D., et al. 2003, The Messenger , 114, 20Melendez, J., Asplund, M., Gustafsson, B., & Yong, D. 2009,ApJ, 704, L66Melendez, J., Bergemann, M., Cohen, J. G., et al. 2012, A&A,543, A29Melendez, J., Ramırez, I, Karakas, A. I., et al. 2014a, ApJ, 791, 14Melendez, J., Schirbel, L., Monroe, T. W. R., et al. 2014b, A&A, 567, L3Monroe, T. W. R., Melendez, J., Ramırez, I, et al. 2013, ApJ, 774, L32Moore, C. S., Uitenbroek, H., Rempel, M., Criscuoli, S., & Rast, M. P. 2015,
ApJ, 799, 150Mulchaye, J. S., Kasliwal, M. M., & Kollmeier, J. A. 2014, ApJ, 780, L34Neves, V., Santos, N. C., Sousa, S. G., Correia, A. C. M., & Israelian, G. 2009,
A&A, 497, 563Nissen, P. E. 2013, A&A, 552, A73Nissen, P. E., Chen, Y. Q., Carigi, L., Schuster, W. J., & Zhao, G. 2014, A&A,
568, A25Nissen, P. E., Primas, F., Asplund, M., & Lambert, D. L. 2002,A&A, 390, 235Nissen, P. E., & Schuster, W. J. 1997, A&A, 326, 751
Nissen, P. E., & Schuster, W. J. 2010, A&A, 511, L10Nissen, P. E., & Schuster, W. J. 2011, A&A, 530, A15Nissen, P. E., & Schuster, W. J. 2012, A&A, 543, A28Olsen, E. H. 1983, A&AS, 54, 55Onehag, A., Gustafsson, B., & Korn, A. 2014, A&A, 562, A102Perets, H. B., Gal-Yam, A., & Mazzali, P. A. 2010, Nature, 465, 322Petigura, E. A., & Marcy, G. W. 2011, ApJ, 735, 41Ramırez, I., Melendez, J., & Asplund, M. 2009, A&A, 508, L17Ramırez, I., Melendez, J., & Asplund, M. 2014a, A&A, 561, A7Ramırez, I., Melendez, J., & Bean, J, et al. 2014b, A&A, 572, A48Ramırez, I., Melendez, J., Cornejo, D., Roederer, I. U., &Fish, J. R. 2011, ApJ,
740, 76Schuler, S. C., Flateau, D., Cunha, K., et al. 2011, ApJ, 732,55Scott, P., Asplund, M., Grevesse, N., Bergemann, M., & Sauval, A. J. 2015a,
A&A, 573, A26Scott, P., Asplund, M., Grevesse, N., & Sauval, J. 2009, ApJ,691, L119Scott, P., Grevesse, N., Asplund, M., et al. 2015a, A&A, 573,A25Shi, J. R., Gehren, T., Butler, K., Mashonkina, L. I., & Zhao,G. 2008, A&A,
486, 303Sousa, S. G., Santos, N. C., Mayor, M., et al. 2008, A&A, 487, 373Takeda, Y., Hashimoto, O., Taguchi, H., et al. 2005, PASJ, 57, 751Takeda, Y., & Honda, S. 2005, PASJ, 57, 65Teske, J. K., Ghezzi, L., Cunha, K., et al. 2015, ApJ, 801, L10Teske, J. K., Cunha, K., Smith, V. V., Schuler, S. C., & Griffith, C. A. 2014, ApJ,
788, 39Travaglio, C., Gallino, R., Arnone, E., et al. 2004, ApJ, 601, 864Trujillo Bueno, J., Shchukina, N., & Asensio Ramos, A. 2004,Nature, 430, 326Tucci Maia, M., Melendez, J., & Ramırez, I. 2014, ApJ, 790,L25Turcotte, S., & Wimmer-Schweingruber, R. F. 2002, J. Geophys. Res., 107(A12),
1442Unsold, A. 1955, Physik der Sternatmospharen, 2nd ed. (Berlin: Springer Verlag)van Leeuwen, F. 2007, Hipparcos, the New Reduction of the RawData,
(Astrophys. Space Sci. Library, vol. 350; Dordrecht, Springer)Venn, K. A., Irwin, M., Shetrone, M. D., et al. 2004, AJ, 128, 1177Yi, S., Demarque, P., Kim, Y. -C., et al. 2001, ApJS, 136, 417Yi, S. K., Kim, Y. -C., & Demarque, P. 2003, ApJS, 144, 259Zhao, G., & Gehren, T. 2000, A&A, 362, 1077
13

P. E. Nissen: High-precision abundances of elements in solar twin stars, Online Material p 1
Table 2. List of spectral lines.
Element Wavelength Exc. pot. EW⊙[Å] [eV] [mÅ]
C i 5052.15 7.685 36.0C i 5380.32 7.685 21.4
[O i] 6300.31 0.000 3.6Nai 6154.23 2.102 38.2Nai 6160.75 2.104 58.8Mg i 4730.04 4.340 71.5Mg i 5711.10 4.345 105.6Al i 6696.03 3.143 37.7Al i 6698.67 3.143 21.0Si i 5517.55 5.080 13.8Si i 5645.62 4.929 36.6Si i 5665.56 4.920 41.2Si i 5793.08 4.929 43.9Si i 6125.03 5.614 32.5Si i 6145.02 5.616 38.8Si i 6243.82 5.616 48.1Si i 6244.48 5.616 46.3Si i 6721.84 5.862 44.7Si i 6741.63 5.984 15.9Si 6045.98 7.868 18.3Si 6052.67 7.870 11.8Si 6743.58 7.866 8.6Si 6757.14 7.870 18.7
Cai 5260.39 2.521 32.8Cai 5512.99 2.933 88.3Cai 5581.98 2.523 96.5Cai 5590.13 2.521 92.6Cai 5867.57 2.933 25.0Cai 6166.44 2.521 71.1Cai 6455.60 2.523 57.4Ti i 4913.62 1.873 51.5Ti i 5113.45 1.443 27.9Ti i 5219.71 0.021 28.1Ti i 5295.78 1.067 12.7Ti i 5490.16 1.460 22.2Ti i 5739.48 2.249 8.0Ti i 5866.46 1.066 48.6Ti i 6091.18 2.267 15.2Ti i 6126.22 1.066 22.6Ti i 6258.11 1.443 52.2Ti i 6261.11 1.429 48.5Ti ii 5211.54 2.590 33.7Ti ii 5381.03 1.565 60.9Ti ii 5418.77 1.582 49.0Cr i 5214.13 3.369 17.0Cr i 5238.97 2.709 16.9Cr i 5247.57 0.960 83.4Cr i 5272.00 3.449 23.8Cr i 5287.18 3.438 11.3Cr i 5296.70 0.983 93.9Cr i 5348.33 1.004 100.2Cr i 5783.07 3.323 31.4Cr i 5783.87 3.322 44.6Cr i 6661.08 4.193 13.0Cr ii 5237.33 4.073 53.5Cr ii 5246.78 3.714 16.2Fei 5295.32 4.415 29.9Fei 5373.71 4.473 63.9Fei 5379.58 3.694 61.9

P. E. Nissen: High-precision abundances of elements in solar twin stars, Online Material p 2
Table 2. continued
Element Wavelength Exc. pot. EW⊙(Å) (eV) (mÅ)
Fei 5386.34 4.154 33.1Fei 5466.99 3.573 35.9Fei 5522.45 4.209 44.2Fei 5546.51 4.371 52.9Fei 5560.22 4.434 52.6Fei 5577.03 5.033 11.6Fei 5618.64 4.209 50.4Fei 5636.71 3.640 19.6Fei 5650.00 5.100 36.5Fei 5651.48 4.473 19.0Fei 5661.35 4.284 23.0Fei 5679.03 4.652 60.4Fei 5705.47 4.301 38.4Fei 5855.09 4.608 22.7Fei 6079.02 4.652 46.5Fei 6082.72 2.223 35.4Fei 6093.65 4.607 31.1Fei 6096.67 3.984 37.8Fei 6151.62 2.176 50.1Fei 6157.73 4.076 62.4Fei 6165.36 4.143 45.0Fei 6173.34 2.223 68.7Fei 6188.00 3.943 48.4Fei 6226.74 3.883 29.6Fei 6240.65 2.223 49.0Fei 6270.23 2.858 52.2Fei 6271.28 3.332 24.4Fei 6380.75 4.186 52.7Fei 6392.54 2.279 17.6Fei 6498.94 0.958 47.1Fei 6597.57 4.795 44.0Fei 6625.04 1.011 15.6Fei 6703.58 2.759 37.3Fei 6705.10 4.607 47.6Fei 6710.32 1.485 16.0Fei 6713.75 4.795 21.3Fei 6725.36 4.103 17.8Fei 6726.67 4.607 47.3Fei 6733.15 4.638 26.9Fei 6739.52 1.557 12.0Fei 6793.27 4.076 13.0Fei 6806.86 2.727 34.9Fei 6810.27 4.607 50.1Fei 6843.65 4.548 61.5Feii 5414.08 3.222 27.3Feii 5425.26 3.200 41.5Feii 6084.10 3.200 21.2Feii 6149.25 3.889 36.7Feii 6247.56 3.892 53.1Feii 6369.46 2.891 18.8Feii 6416.93 3.892 40.1Feii 6432.68 2.892 41.6Feii 6456.39 3.904 63.4Ni i 4953.21 3.740 56.2Ni i 5010.94 3.635 49.9Ni i 5643.09 4.164 15.9Ni i 5805.23 4.167 41.5Ni i 6086.29 4.266 44.2Ni i 6108.12 1.676 65.6

P. E. Nissen: High-precision abundances of elements in solar twin stars, Online Material p 3
Table 2. continued
Element Wavelength Exc. pot. EW⊙(Å) (eV) (mÅ)
Ni i 6130.14 4.266 22.3Ni i 6176.82 4.088 64.1Ni i 6177.25 1.826 14.8Ni i 6204.61 4.088 22.1Ni i 6378.26 4.154 32.8Ni i 6643.64 1.676 94.7Ni i 6767.78 1.826 79.7Ni i 6772.32 3.657 50.1Zn i 4722.16 4.030 71.6Zn i 4810.54 4.080 75.0Zn i 6362.35 5.790 20.4Y ii 4883.69 1.084 59.5Y ii 5087.43 1.084 48.7Y ii 5200.42 0.992 38.1
P. E. Nissen: High-precision abundances of elements in solar twin stars, Online Material p 4
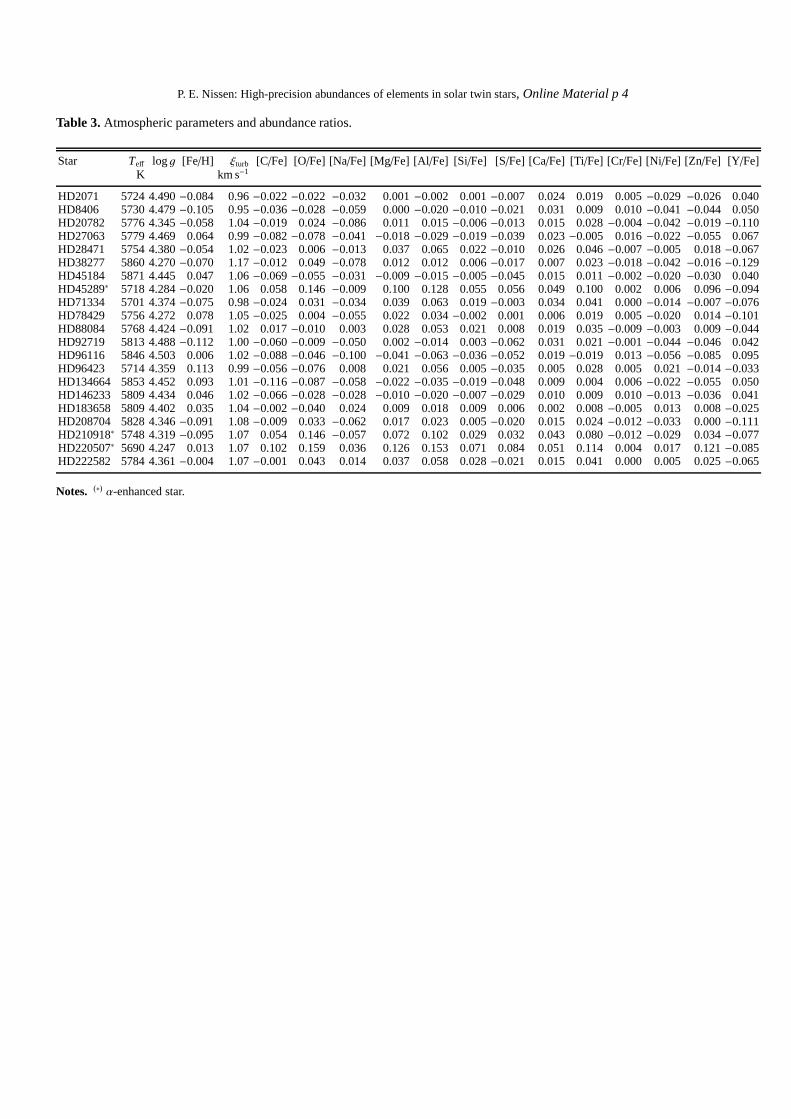
Table 3. Atmospheric parameters and abundance ratios.
Star Teff logg [Fe/H] ξturb [C/Fe] [O/Fe] [Na/Fe] [Mg/Fe] [Al/Fe] [Si/Fe] [S/Fe] [Ca/Fe] [Ti/Fe] [Cr/Fe] [Ni/Fe] [Zn/Fe] [Y/Fe]K km s−1
HD2071 5724 4.490−0.084 0.96−0.022−0.022 −0.032 0.001−0.002 0.001−0.007 0.024 0.019 0.005−0.029 −0.026 0.040HD8406 5730 4.479−0.105 0.95−0.036−0.028 −0.059 0.000−0.020−0.010−0.021 0.031 0.009 0.010−0.041 −0.044 0.050HD20782 5776 4.345−0.058 1.04−0.019 0.024−0.086 0.011 0.015−0.006−0.013 0.015 0.028−0.004−0.042 −0.019−0.110HD27063 5779 4.469 0.064 0.99−0.082−0.078 −0.041 −0.018−0.029−0.019−0.039 0.023−0.005 0.016−0.022 −0.055 0.067HD28471 5754 4.380−0.054 1.02−0.023 0.006−0.013 0.037 0.065 0.022−0.010 0.026 0.046−0.007−0.005 0.018−0.067HD38277 5860 4.270−0.070 1.17−0.012 0.049−0.078 0.012 0.012 0.006−0.017 0.007 0.023−0.018−0.042 −0.016−0.129HD45184 5871 4.445 0.047 1.06−0.069−0.055 −0.031 −0.009−0.015−0.005−0.045 0.015 0.011−0.002−0.020 −0.030 0.040HD45289∗ 5718 4.284−0.020 1.06 0.058 0.146−0.009 0.100 0.128 0.055 0.056 0.049 0.100 0.002 0.006 0.096−0.094HD71334 5701 4.374−0.075 0.98−0.024 0.031−0.034 0.039 0.063 0.019−0.003 0.034 0.041 0.000−0.014 −0.007−0.076HD78429 5756 4.272 0.078 1.05−0.025 0.004−0.055 0.022 0.034−0.002 0.001 0.006 0.019 0.005−0.020 0.014−0.101HD88084 5768 4.424−0.091 1.02 0.017−0.010 0.003 0.028 0.053 0.021 0.008 0.019 0.035−0.009−0.003 0.009−0.044HD92719 5813 4.488−0.112 1.00−0.060−0.009 −0.050 0.002−0.014 0.003−0.062 0.031 0.021−0.001−0.044 −0.046 0.042HD96116 5846 4.503 0.006 1.02−0.088−0.046 −0.100 −0.041−0.063−0.036−0.052 0.019−0.019 0.013−0.056 −0.085 0.095HD96423 5714 4.359 0.113 0.99−0.056−0.076 0.008 0.021 0.056 0.005−0.035 0.005 0.028 0.005 0.021−0.014−0.033HD134664 5853 4.452 0.093 1.01−0.116−0.087 −0.058 −0.022−0.035−0.019−0.048 0.009 0.004 0.006−0.022 −0.055 0.050HD146233 5809 4.434 0.046 1.02−0.066−0.028 −0.028 −0.010−0.020−0.007−0.029 0.010 0.009 0.010−0.013 −0.036 0.041HD183658 5809 4.402 0.035 1.04−0.002−0.040 0.024 0.009 0.018 0.009 0.006 0.002 0.008−0.005 0.013 0.008−0.025HD208704 5828 4.346−0.091 1.08−0.009 0.033−0.062 0.017 0.023 0.005−0.020 0.015 0.024−0.012−0.033 0.000−0.111HD210918∗ 5748 4.319−0.095 1.07 0.054 0.146−0.057 0.072 0.102 0.029 0.032 0.043 0.080−0.012−0.029 0.034−0.077HD220507∗ 5690 4.247 0.013 1.07 0.102 0.159 0.036 0.126 0.153 0.071 0.084 0.051 0.114 0.004 0.017 0.121−0.085HD222582 5784 4.361−0.004 1.07−0.001 0.043 0.014 0.037 0.058 0.028−0.021 0.015 0.041 0.000 0.005 0.025−0.065
Notes. (∗) α-enhanced star.