high performance json postgresql vs. mongodb · 1 server, two jails - one for postgres & one...
TRANSCRIPT

High Performance JSONPostgreSQL vs. MongoDB
FOSDEM PGDay 2018Dominic DwyerWei Shan Ang

VS

GlobalSign● GlobalSign identity & crypto services provider
● WebTrust certified Certificate Authority - 3rd in the world
● High volume services - IoT devices, cloud providers
● Cryptographic identities, timestamping, signing, etc

About Me● Database Engineer with 6 years of experience
● From Singapore but now based in London
● Originally worked on Oracle systems
● Switched to open-source databases in 2015
● Currently working in GlobalSign as a “Data Reliability Engineer”

Motivation
● Most benchmark results are biased - commercial interests
● We feel that benchmark results are measured “creatively”
● We use PostgreSQL and MongoDB a lot!
● We wanted to test the latest versions

PostgreSQL

PostgreSQL● Around for 21 years● JSON supported since 9.2● JSONB supported since 9.4● Does not have any statistics about the internals of document types like JSON
or JSONB ○ Can be overcome with default_statistics_target or ALTER TABLE TABLE_NAME ALTER int4
SET STATISTICS 2000;
● Many JSON/JSONB operator/functions released since 9.2 (jsonb_set, jsonb_insert)
● Many JSON/JSONB bug fixes too

PostgreSQL Ecosystem● “Build it yourself”
● Many High Availability solutions - all 3rd party○ repmgr, pacemaker/corosync, Slony, Patroni and many more
● Connection Pooling○ pgBouncer (single-threaded), pgpool-II
● Sharding○ CitusDB
● Live version upgrades - tricky!○ pg_upgrade, Slony, pg_dump and pg_logical

MongoDB

MongoDB● Relatively “young” database software
○ 8 years since first release
● Known as a /dev/null database in the early days (jepsen.io)
○ Tremendous stability improvements since then○ All known reliability issues has been fixed since 3.2.12
● Lots of WiredTiger bug fixes since 3.2○ Cache eviction○ Checkpoints○ Lost updates and dirty writes
Source: jepsen.io


● Everything comes as standard:
○ Built-in replication
○ Built-in sharding
○ Live cluster version upgrades (ish)
■ Shutdown slave, upgrade slave, startup slave, repeat
MongoDB

Server Hardware● 2x Intel(R) Xeon(R) CPU E5-2630 v4
○ 20 cores / 40 threads
● 32GB Memory
● FreeBSD 11
● ZFS file system
● 2 x 1.6TB (Intel SSD DC S3610, MLC)

Why do we use ZFS?● Highly tunable filesystem
○ Layered caching (ARC, L2ARC, ZIL)
○ Advanced cache algorithm
■ Most Recently Used (MRU)
■ Most Frequently Used (MFU)
● Free snapshots
● Block level checksums
● Fast compression
● Nexenta, Delphix, Datto, Joyent, Tegile, Oracle (obviously) and many more!

The Setup
● 1-3 Client machines (depending on the test)
● 1 Server, two jails - one for Postgres & one for Mongo
● PostgreSQL 9.6.5 with pgBouncer 1.7.2
● MongoDB 3.4.9 with WiredTiger
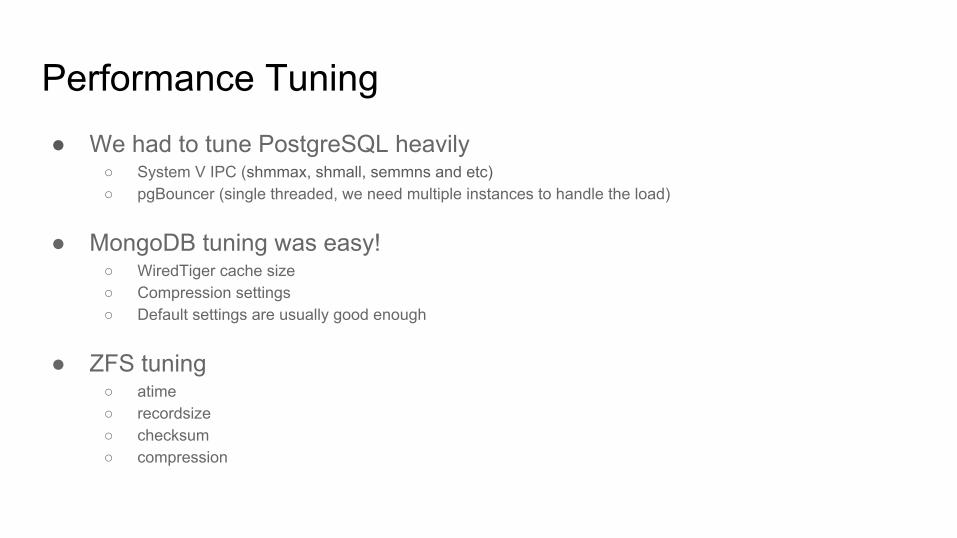
Performance Tuning● We had to tune PostgreSQL heavily
○ System V IPC (shmmax, shmall, semmns and etc)○ pgBouncer (single threaded, we need multiple instances to handle the load)
● MongoDB tuning was easy!○ WiredTiger cache size○ Compression settings○ Default settings are usually good enough
● ZFS tuning○ atime○ recordsize○ checksum○ compression

Sample JSON Document{ "_id" : NumberLong(2), "name" : "lPAyAYpUvUDGiCd", "addresses" : [ { "number" : 59, "line1" : "EPJKLhmEPrrdYqaFxxEVMF", "line2" : "Rvlgkmb" }, { "number" : 59, "line1" : "DdCBXEW", "line2" : "FEV" } ], "phone_number" : "xPOYCOfSpieIxbGxpYEpi", "dob" : ISODate("2017-09-05T00:03:28.956Z"), "age" : 442006075, "balance" : 0.807247519493103, "enabled" : false, "counter" : 442006075, "padding" : BinData(0,"")}
Sub-documents
Varying field types
Randomised binary blob

About Me● Engineer on the High Performance Platforms team
○ Our team builds a high volume CA platform & distributed systems○ Based in Old Street, London○ Greenfields project, all new stuff!
● Day job has me breaking all the things○ Simulating failures, network partitions, etc○ Assessing performance and durability
● Maintain performance fork of Go MongoDB driver ○ github.com/globalsign/mgo

MPJBT Benchmark Tool● MongoDB PostgreSQL JSONB Benchmarking Tool
○ Seriously, we’re open to better names…….
● Written in Golang
● Open source!
● Models typical workloads (but maybe not yours!)○ Inserts, selects, select-updates, range queries, etc.
● Lockless outside of the database drivers○ Low contention improves ability to push servers
Why Go?● Designed from the start for high concurrency
○ Thousands of concurrent workers is totally fine
● Co-operative scheduler can maximise I/O throughput○ When blocked, Go switches to another worker○ Blocked worker is woken up when it’s unblocked○ Much cheaper context switching - occurs in userland
● Familiarity - I use it every day!

Does it deliver?

Insert 10,000,000 records

Average isn’t very helpful● I have an average of 52.2ms

Average isn’t very helpful● I have an average of 52.2ms
120.08023136.23758425.90481144.05391666.61777859.71310074.6203291.68958990.64194027.202953
51.16233152.20239252.51174550.43969752.97560952.56794153.06760952.12289051.15918052.390616
OR

Inserts - Latency Histogram

Inserts - Latency Histogram1s 2s 3s

Inserts - Throughput
insert 30877op/s avg.0msinsert 27509op/s avg.0msinsert 29997op/s avg.0msinsert 31143op/s avg.0msinsert 22576op/s avg.0msinsert 0op/s avg.0msinsert 0op/s avg.0msinsert 1op/s avg.2561msinsert 0op/s avg.0msinsert 20703op/s avg.6msinsert 31154op/s avg.0msinsert 31298op/s avg.0msinsert 30359op/s avg.0ms
insert 26081op/s avg.0msinsert 25938op/s avg.0msinsert 26649op/s avg.0msinsert 26009op/s avg.0msinsert 26029op/s avg.0msinsert 25522op/s avg.0msinsert 25960op/s avg.0msinsert 26000op/s avg.0msinsert 25576op/s avg.0msinsert 26159op/s avg.0msinsert 25628op/s avg.0msinsert 26071op/s avg.0msinsert 25856op/s avg.0ms
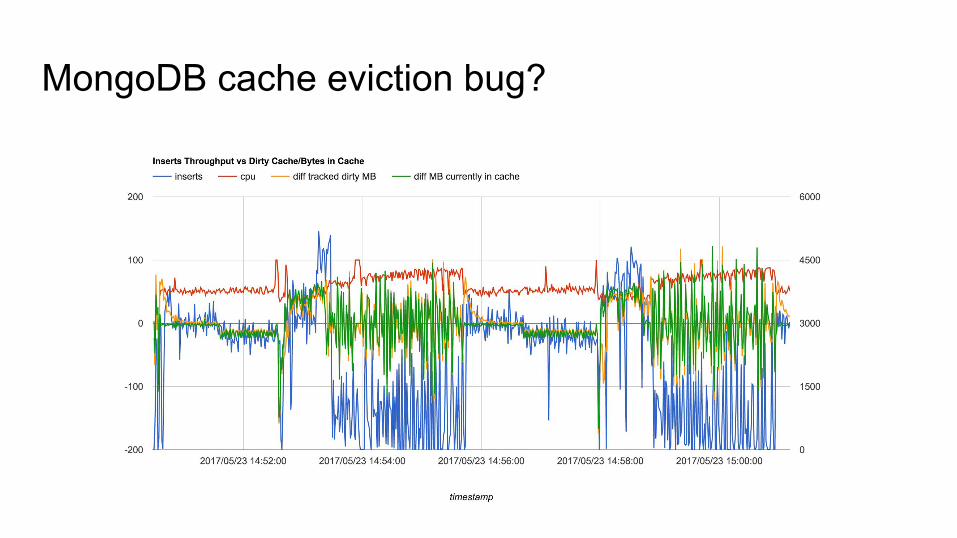
MongoDB cache eviction bug?● Show some cool graphs● https://jira.mongodb.org/browse/SERVER-29311●

MongoDB cache eviction bug - not a bug?● Reported to MongoDB
○ https://jira.mongodb.org/browse/SERVER-29311○ Offered to run any tests and analyse data
● Ran 36 different test combinations○ ZFS compression: lz4, zlib, off○ MongoDB compression: snappy, zlib, off○ Filesystem block sizes○ Disk configurations○ Tried running on Linux/XFS
● Always saw the same pauses○ Described as an I/O bottleneck
(twice!)

Profile with Dtrace!● Dynamic tracer built into FreeBSD (and others)
○ Originally created by Sun for Solaris○ Ported to FreeBSD○ Low profiling overhead
● Traces in both kernel and userspace○ Hook syscalls, libc, application functions, etc○ Access function arguments, kernel structures, etc
● Hooks expressed in D like DSL○ Conditionally trigger traces○ Really simple to use

Trace the Virtual File System● Measures application file system operations
○ Kernel level○ File system agnostic (XFS, ZFS, anything)
● Records data size & latency:○ Reads - vfs::vop_read○ Writes - vfs::vop_write
● Configured to output ASCII histograms○ Per second aggregations○ Broken down by type○ Timestamped for correlating with MPJBT logs

VFS Writes vs. Throughput - PostgreSQL

VFS Writes vs. Throughput - MongoDB
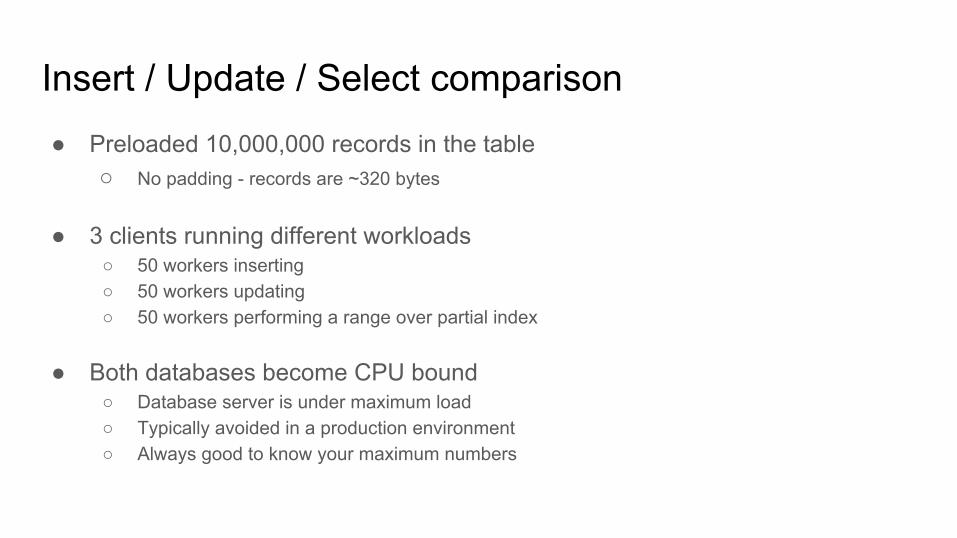
Insert / Update / Select comparison● Preloaded 10,000,000 records in the table
○ No padding - records are ~320 bytes
● 3 clients running different workloads○ 50 workers inserting○ 50 workers updating○ 50 workers performing a range over partial index
● Both databases become CPU bound○ Database server is under maximum load○ Typically avoided in a production environment○ Always good to know your maximum numbers

MongoDB
Insert
99th%
13ms
Average
18,070 op/s
Update
99th%
11ms
Average
22,304 op/s
Select
99th%
12ms
Average
18,960 op/s

MongoDB

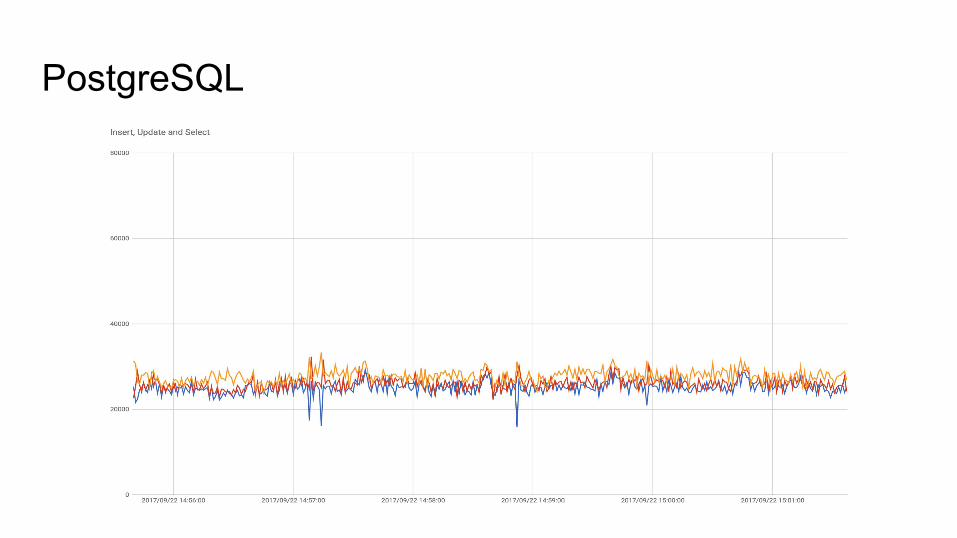
PostgreSQL

PostgreSQL
Insert
99th%
4ms
Average
25,244 op/s
Update
99th%
4ms
Average
26,085 op/s
Select
99th%
3ms
Average
27,778 op/s
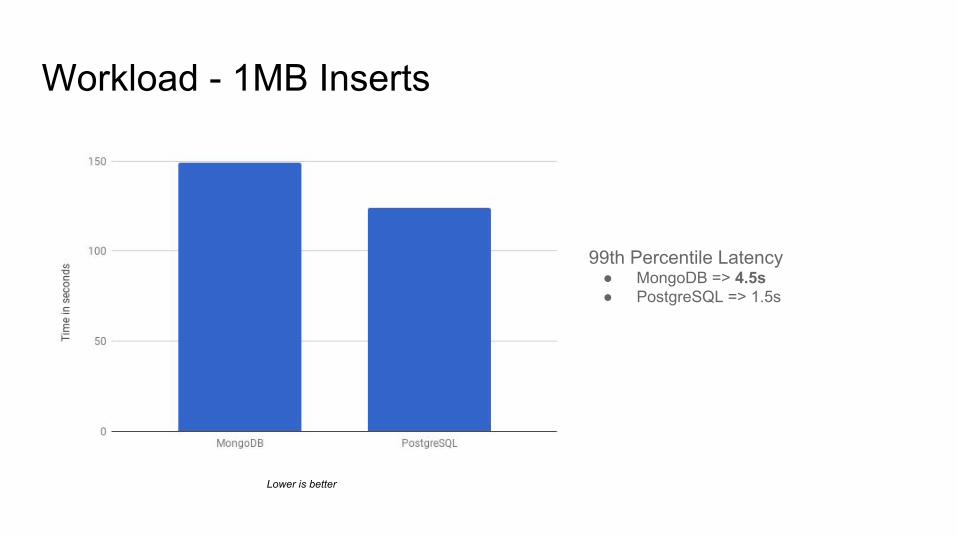
Workload - 1MB Inserts
Lower is better
99th Percentile Latency● MongoDB => 4.5s● PostgreSQL => 1.5s

Insert Performance
CPU 35%insert 65543op/s avg.0msinsert 65113op/s avg.0msinsert 69881op/s avg.0msinsert 55728op/s avg.0msinsert 57502op/s avg.0msinsert 64428op/s avg.0msinsert 64872op/s avg.6msinsert 68804op/s avg.0msinsert 63204op/s avg.0msinsert 63279op/s avg.0ms
insert 42011op/s avg.0msinsert 53330op/s avg.0msinsert 57815op/s avg.0msinsert 54331op/s avg.0msinsert 39616op/s avg.0msinsert 51919op/s avg.0msinsert 53366op/s avg.0msinsert 56678op/s avg.0msinsert 40283op/s avg.0msinsert 47300op/s avg.0ms
CPU 40%

Update Performance
CPU 85%update 2416 op/s avg.0msupdate 0 op/s avg.0msupdate 0 op/s avg.0msupdate 2856 op/s avg.33msupdate 21425op/s avg.0msupdate 0 op/s avg.0msupdate 0 op/s avg.0msupdate 12798op/s avg.5msupdate 11094op/s avg.0msupdate 21302op/s avg.0ms
update 31252op/s avg.0msupdate 32706op/s avg.0msupdate 33801op/s avg.0msupdate 28276op/s avg.0msupdate 34749op/s avg.0msupdate 29972op/s avg.0msupdate 28565op/s avg.0msupdate 32286op/s avg.0msupdate 30905op/s avg.0msupdate 32052op/s avg.0ms
CPU 65%

So...why are we even using MongoDB? PostgreSQL is awesome right?


Vacuum Performance - Insert Workload

Horizontally Scalable
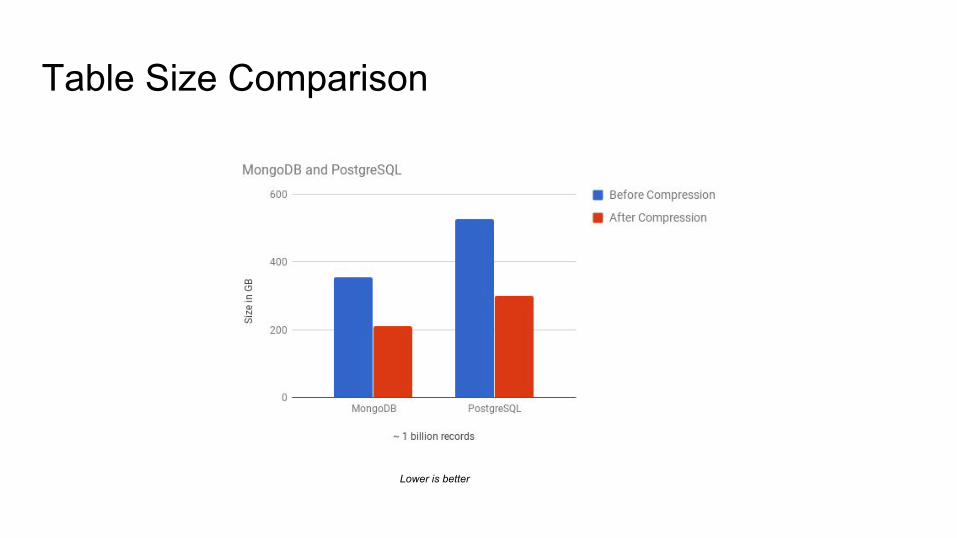
Table Size Comparison
Lower is better

Summary


Summary● There is no such thing as the best database in the world!
● Choosing the right database for your application is never easy○ How well does it scale?
○ How easy is it to perform upgrades?
○ How does it behave under stress?
● What is your application requirements?○ Do you really need ACID?
● Do your own research!

Summary - PostgreSQL● PostgreSQL has poor performance out of the box
○ Requires a decent amount of tuning to get good performance out of it
● Does not scale well with large number of connections○ pgBouncer is a must
● Combines ACID compliance with schemaless JSON
● Queries not really intuitive

Summary - MongoDB● MongoDB has decent performance out of the box.
● Unstable throughput and latency
● Scale well with large number of connections
● Strong horizontal scalability
● Throughput bug is annoying
● MongoDB rolling upgrades are ridiculously easy
● Developer friendly - easy to use!

TODO● Released MPJBT on Github
○ Open source for all
○ github.com/domodwyer/mpjbt
● Run similar tests against CitusDB○ You guys have inspired us to keep looking!
● Run performance test for MongoRocks (LSM)

Thank You!Like what you see?
We are hiring!Come and speak to us!
Questions?

References● https://people.freebsd.org/~seanc/postgresql/scale15x-2017-postgresql_zfs_b
est_practices.pdf● https://jepsen.io/analyses/mongodb-3-4-0-rc3● https://dba.stackexchange.com/questions/167525/inconsistent-statistics-on-js
onb-column-with-btree-index● https://github.com/domodwyer/mpjbt● https://jira.mongodb.org/browse/WT-3633

Previous Benchmark Results● http://tiborsimko.org/postgresql-mongodb-json-select-speed.html
● http://erthalion.info/2015/12/29/json-benchmarks/
● https://www.enterprisedb.com/postgres-plus-edb-blog/marc-linster/postgres-o
utperforms-mongodb-and-ushers-new-developer-reality
● https://pgconf.ru/media/2017/04/03/20170317H2_O.Bartunov_json-2017.pdf
● https://www.slideshare.net/toshiharada/ycsb-jsonb

Appendix

pgbouncer.ini● PostgreSQL does not support connection pooling
● PgBouncer is an extremely lightweight connection pooler
● Setting up and tearing down a new connection is expensive
● Each PostgreSQL connection forks a new process
● Configuration○ pool_mode = transaction○ max_client_conn = 300

postgresql.conf● shared_buffer = 16GB● max_connections = 400● fsync = on● synchronous_commit = on● full_page_writes = off● wal_compression = off● wal_buffers = 16MB● min_wal_size = 2GB● max_wal_size = 4GB● checkpoint_completion_target = 0.9● work_mem = 33554KB● maintenance_work_mem = 2GB● wal_level=replica

mongod.conf● wiredTiger.engineConfig.cacheSizeGB: 19
● wiredTiger.engineConfig.journalCompressor: snappy
● wiredTiger.collectionConfig.blockCompressor: snappy
● wiredTiger.indexConfig.prefixCompression: true
● net.maxIncomingConnections: 65536
● wiredTigerConcurrentReadTransactions: 256
● wiredTigerConcurrentWriteTransactions: 256

ZFS Tuning● No separate L2ARC● No separate ZIL● 1 dataset for O/S● 1 dataset for data directory
○ checksum=on○ atime=off○ recordsize=8K○ compression=lz4 (PostgreSQL) or off (MongoDB)

/boot/loader.conf● kern.maxusers=1024
● kern.ipc.semmns=2048
● kern.ipc.semmni=1024
● kern.ipc.semmnu=1024
● kern.ipc.shmall=34359738368
● kern.ipc.shmmax=34359738368
● kern.ipc.maxsockets=256000
● kern.ipc.maxsockbuf=2621440
● kern.ipc.shmseg=1024

/etc/sysctl.conf● net.inet.tcp.keepidle=3000000● net.inet.tcp.keepintvl=60000● net.inet.tcp.keepinit=60000● security.jail.sysvipc_allowed=1● kern.ipc.shmmax=34359738368● kern.ipc.shmall=16777216● kern.ipc.shm_use_phys=1● kern.maxfiles=2621440● kern.maxfilesperproc=2621440● kern.threads.max_threads_per_proc=65535● kern.ipc.somaxconn=65535● kern.eventtimer.timer=HPET● kern.timecounter.hardware=HPET● vfs.zfs.arc_max: 8589934592 for PostgreSQL or 1073741824 for MongoDB