high-peak-power fiber-laser technology for laser-produced
TRANSCRIPT

High-Peak-Power Fiber-Laser Technology for
Laser-Produced-Plasma Extreme-Ultraviolet
Lithography
by
Kai-Chung Hou
A dissertation submitted in partial fulfillmentof the requirements for the degree of
Doctor of Philosophy(Electrical Engineering)
in The University of Michigan2008
Doctoral Committee:
Associate Professor Almantas Galvanuaskas , ChairProfessor Karl M. KrushelnickProfessor Herbert G. WinfulAdjunct Associate Professor John A. Nees

c© Kai-Chung Hou 2008All Rights Reserved

Dedicated to my parents and my brother for their love, support andpatience, and in the memory of my grandmother.
ii

ACKNOWLEDGEMENTS
I never imagined that I could come so far without the generous and endless as-
sistance of many people. It is my privilege to express my gratitude to them for
helping me throughout the toughest years of my life. First, I would like to thank my
academic advisor Professor Almantas Galvanauskas for being a great mentor, guide
and supporter throughout my PhD studies. His passionate and persistent attitude
toward the research had inspired and motivated me in my work and also helped
me through many bottlenecks. His patience and understanding of my circumstances
help me through many challenges I encountered. Without his academic guidance
and assistance, it would have been impossible for me to complete my projects, goals,
and finally my degree.
I would also like to thank my committee members, Professor Herbert Windful
Professor Karl Krushelnick, and John Nees for taking time out from their busy
schedules to evaluate my research work and participate in my dissertation proposal
and final oral defense. Without their patience and efforts, it would not be possible
for me have a chance to complete my dissertation. Special thanks to Dr. Quoquing
Chang, who had been a great friend, mentor, teacher and master, assisting graciously
on my research in many aspects, career, and my attitude toward life.
Many collaborated work is done in this dissertation. I would also like thank thank
my many collaborators: Dr. Aghapi Mordovanakis, Dr. Bixue Hou, and John Nees
for their work on the EUV target chamber, EUV spectrometer, EUV photodiode,
iii

diagnostics on the emission and analysis on the EUV emission. I can’t over express
my gratitude to members in th Laser Plasma Lab at the University of Central Florida:
Dr. Simi George, Dr. Kazutoshi Takenoshita, and Dr. Martin Richardson for
providing droplet targets, vacuum chamber, flat-flied spectrometer and Flying Circus
II EUV photodiode and their work on the above mentioned apparatus, the calibration
on EUV spectrometer and the of the EUV conversion efficiency.
Special thanks to Dr. Bruno Lafontaine of AMD, who had been a great supporter
for all our EUV projects and provided me assistance and career guidance. None of the
EUV work could be realized without his generosity and belief in us. I would also like
to thank M. Craig Swan, Dr. Guoqing Chang, Matt Rever, and Shaw Lacy for their
rigorous efforts on helping me on the writing of this dissertation and proof-reading
the draft of this dissertation.
I was honored to work with so many talented and skilled group members: M.
Craig Swan, Dr. Kai-Hsiu Liao, Dr. Guoching Chang, Xiuquan Ma, Dr. Chi-Hung
Liu, Dr. Ming-Yuan Cheng, and Dr. Shenghong Huang. I would also like to thank
all my friends in Michigan: Gilda Kao, Kaai Liao, Chia-Fei Kao, Nei-Moe Hou, Shao-
Ning Yu, Yi-Hao Chen, Hsun-Yi Chen, Hsien-Kai Hsiao, Nai-Kuan Yang, Jamie Wu,
Andy Tsai and many many others. It’s hard to picture how I would have survived
all the cold winters without their warm friendships.
Finally, I want to express my deepest gratitude to my parents and brother. You
gave me the hope and support that took me through all the difficulties in my life.
None of my work could have been completed without your endless love and patience.
iv

TABLE OF CONTENTS
DEDICATION . . . . . . . . . . . . . . . . . . . . . . . . . . . . . . . . . . . . . . . . . . ii
ACKNOWLEDGEMENTS . . . . . . . . . . . . . . . . . . . . . . . . . . . . . . . . . . iii
LIST OF TABLES . . . . . . . . . . . . . . . . . . . . . . . . . . . . . . . . . . . . . . . vii
LIST OF FIGURES . . . . . . . . . . . . . . . . . . . . . . . . . . . . . . . . . . . . . . viii
CHAPTER
I. Introduction . . . . . . . . . . . . . . . . . . . . . . . . . . . . . . . . . . . . . . . 1
1.1 Lithography: the Driving Force for the Semiconductor Technology . . . . . . 11.2 Beyond 193-nm Lithography . . . . . . . . . . . . . . . . . . . . . . . . . . . 41.3 Extreme Ultraviolet as the Source for Next Generation Lithography . . . . . 5
1.3.1 Mo/Si Multilayer Mirrors: the Key Enabling Technology for EUVLithography . . . . . . . . . . . . . . . . . . . . . . . . . . . . . . . 6
1.3.2 Advantages of EUV Lithography . . . . . . . . . . . . . . . . . . . 61.3.3 Requirements and Development of EUV Light Source . . . . . . . . 8
1.4 Laser-Produced-Plasma Source: Current Status and Requirements on LaserPulse Parameters . . . . . . . . . . . . . . . . . . . . . . . . . . . . . . . . . 9
1.5 25-kW High-Power All-Fiber-Laser Architecture by Spectral and SpatialCombining . . . . . . . . . . . . . . . . . . . . . . . . . . . . . . . . . . . . . 12
1.5.1 Introduction to the Fiber Laser: A Compact, Robust, and EfficientLaser . . . . . . . . . . . . . . . . . . . . . . . . . . . . . . . . . . . 12
1.5.2 Power Scaling Strategy for the 25-kW Fiber Laser EUV Driver . . 141.6 Chapter Overview . . . . . . . . . . . . . . . . . . . . . . . . . . . . . . . . . 17
II. High-peak-power, high-average-power pulsed-fiber-laser EUV driver de-velopment . . . . . . . . . . . . . . . . . . . . . . . . . . . . . . . . . . . . . . . . . 20
2.1 EUV Fiber Laser Design Criteria . . . . . . . . . . . . . . . . . . . . . . . . 212.2 Fiber Core Size Selection . . . . . . . . . . . . . . . . . . . . . . . . . . . . . 222.3 Pulsed Fiber Laser System . . . . . . . . . . . . . . . . . . . . . . . . . . . . 242.4 Mode Quality Optimization . . . . . . . . . . . . . . . . . . . . . . . . . . . 282.5 Peak Power Extraction and Limitations due to Nonlinear Processes . . . . . 34
2.5.1 Self-focusing Limit on Peak Power Extraction . . . . . . . . . . . . 392.6 Energy Extraction and Pulse Temporal Shaping . . . . . . . . . . . . . . . . 45
2.6.1 Active Pulse Shaping and Generation of Prepulses by an ArbitraryWaveform Generator . . . . . . . . . . . . . . . . . . . . . . . . . . 49
2.6.2 Energy Extraction . . . . . . . . . . . . . . . . . . . . . . . . . . . 542.6.3 Energy and Peak Power Extraction Results from the 80-µm-core
fiber . . . . . . . . . . . . . . . . . . . . . . . . . . . . . . . . . . . 572.6.4 Air-breakdown Demonstration . . . . . . . . . . . . . . . . . . . . . 59
v

2.7 Power Scaling and Thermal Management . . . . . . . . . . . . . . . . . . . . 602.8 Conclusion . . . . . . . . . . . . . . . . . . . . . . . . . . . . . . . . . . . . . 67
III. Feasibility Study of High Power Fiber-laser-driven EUV Generation . . . 69
3.1 Introduction for laser-produced plasma EUV generation . . . . . . . . . . . . 693.2 First Demonstration of Fiber-laser-driven EUV Generation with Solid-Sn
Target . . . . . . . . . . . . . . . . . . . . . . . . . . . . . . . . . . . . . . . 723.2.1 Laser Parameters for Solid-tin Experiment . . . . . . . . . . . . . . 72
3.3 Experimental Setup for Solid-Sn EUV Generation . . . . . . . . . . . . . . . 723.3.1 EUV Diagnostics . . . . . . . . . . . . . . . . . . . . . . . . . . . . 74
3.4 Experiment result using solid Sn target . . . . . . . . . . . . . . . . . . . . . 773.5 Practical High-power FLPP EUV Source Development . . . . . . . . . . . . 80
3.5.1 UCF Sn-doped Water Droplet Targets . . . . . . . . . . . . . . . . 813.6 Experemental Setup - Sn-doped Droplet Target . . . . . . . . . . . . . . . . 82
3.6.1 Laser Parameters Used in the Experiment . . . . . . . . . . . . . . 843.6.2 EUV Diagnostics . . . . . . . . . . . . . . . . . . . . . . . . . . . . 853.6.3 Metrology of Conversion Efficiency Calculation . . . . . . . . . . . 87
3.7 Conversion efficiency optimization study . . . . . . . . . . . . . . . . . . . . 883.7.1 Water droplet target . . . . . . . . . . . . . . . . . . . . . . . . . . 883.7.2 Sn-doped droplet target . . . . . . . . . . . . . . . . . . . . . . . . 903.7.3 CE optimization with prepulses . . . . . . . . . . . . . . . . . . . . 92
3.8 Conclusion . . . . . . . . . . . . . . . . . . . . . . . . . . . . . . . . . . . . . 98
IV. Spatial Dispersion Free Spectral Beam Combining Using Multilayer Thin-Film Filters . . . . . . . . . . . . . . . . . . . . . . . . . . . . . . . . . . . . . . . . 100
4.1 Introduction of Laser Beam Combining . . . . . . . . . . . . . . . . . . . . . 1014.1.1 Coherent Beam Combining (CBC) . . . . . . . . . . . . . . . . . . 1014.1.2 Spectral Beam Combining(SBC) . . . . . . . . . . . . . . . . . . . 1024.1.3 Limitation on Spectral Beam Combining . . . . . . . . . . . . . . . 104
4.2 Spatial Dispersion Free Spectral Combining using Multilayer Film Filters . . 1084.2.1 Multilayer Thin Film Coating for High Power Application . . . . . 108
4.3 Spectral Combining Filter Characterization . . . . . . . . . . . . . . . . . . 1144.4 Experimental Setup for High Power SBC Demonstration . . . . . . . . . . . 1184.5 Results . . . . . . . . . . . . . . . . . . . . . . . . . . . . . . . . . . . . . . . 121
4.5.1 Power Scaling Demonstration . . . . . . . . . . . . . . . . . . . . . 1214.5.2 Spectrally Combined Energy Scaling . . . . . . . . . . . . . . . . . 126
4.6 Conclusion . . . . . . . . . . . . . . . . . . . . . . . . . . . . . . . . . . . . . 128
V. Conclusion and Future Work . . . . . . . . . . . . . . . . . . . . . . . . . . . . . 130
5.1 Contributions and Conclusions . . . . . . . . . . . . . . . . . . . . . . . . . . 1305.2 Future Outlook . . . . . . . . . . . . . . . . . . . . . . . . . . . . . . . . . . 134
5.2.1 Power Scaling of SEFIM and Limitations . . . . . . . . . . . . . . . 1345.2.2 Power Scaling of EUV Generation . . . . . . . . . . . . . . . . . . . 1355.2.3 Power Scaling of Combining System . . . . . . . . . . . . . . . . . 1365.2.4 Self-focusing Observation and Theoretical Work . . . . . . . . . . . 137
BIBLIOGRAPHY . . . . . . . . . . . . . . . . . . . . . . . . . . . . . . . . . . . . . . . . 139
vi
LIST OF TABLES
Table
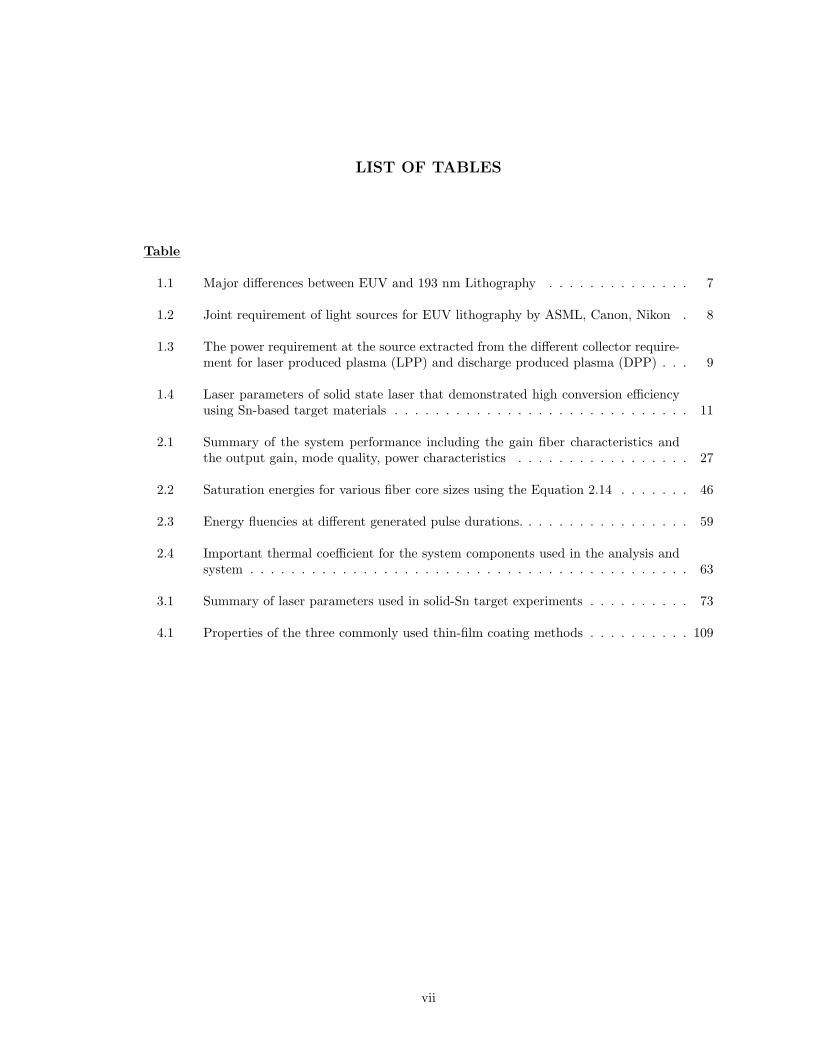
1.1 Major differences between EUV and 193 nm Lithography . . . . . . . . . . . . . . 7
1.2 Joint requirement of light sources for EUV lithography by ASML, Canon, Nikon . 8
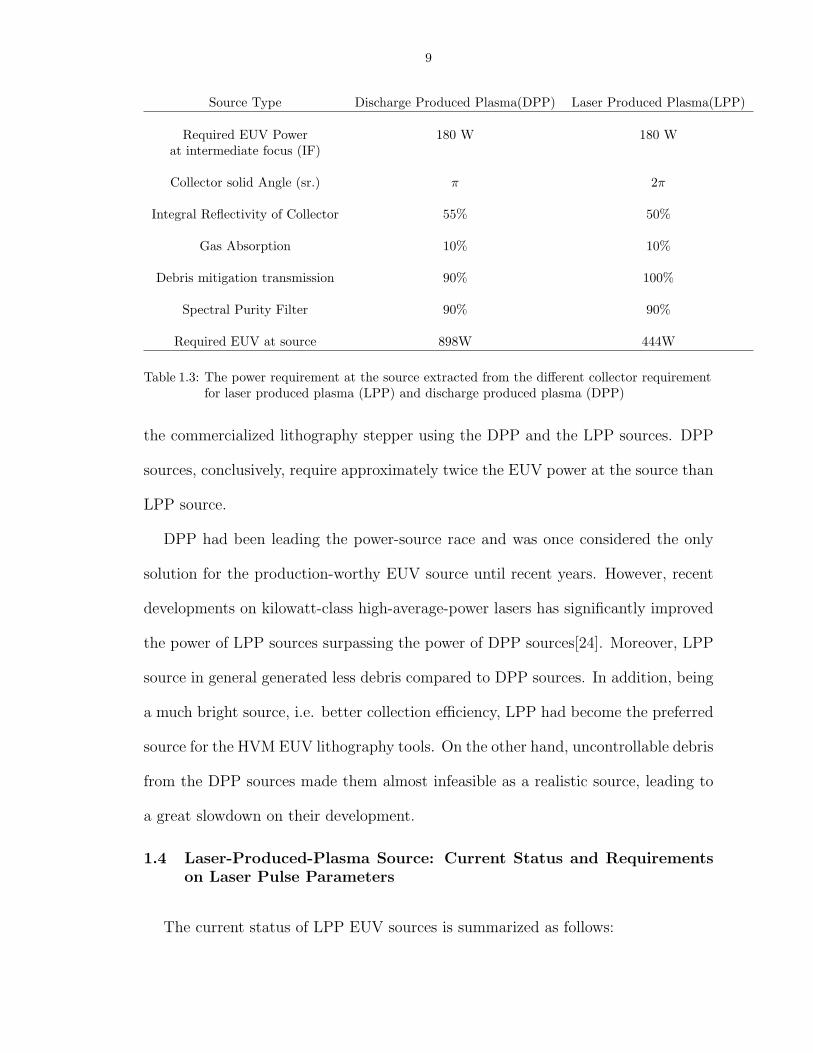
1.3 The power requirement at the source extracted from the different collector require-ment for laser produced plasma (LPP) and discharge produced plasma (DPP) . . . 9
1.4 Laser parameters of solid state laser that demonstrated high conversion efficiencyusing Sn-based target materials . . . . . . . . . . . . . . . . . . . . . . . . . . . . . 11
2.1 Summary of the system performance including the gain fiber characteristics andthe output gain, mode quality, power characteristics . . . . . . . . . . . . . . . . . 27
2.2 Saturation energies for various fiber core sizes using the Equation 2.14 . . . . . . . 46
2.3 Energy fluencies at different generated pulse durations. . . . . . . . . . . . . . . . . 59
2.4 Important thermal coefficient for the system components used in the analysis andsystem . . . . . . . . . . . . . . . . . . . . . . . . . . . . . . . . . . . . . . . . . . . 63
3.1 Summary of laser parameters used in solid-Sn target experiments . . . . . . . . . . 73
4.1 Properties of the three commonly used thin-film coating methods . . . . . . . . . . 109
vii
LIST OF FIGURES
Figure
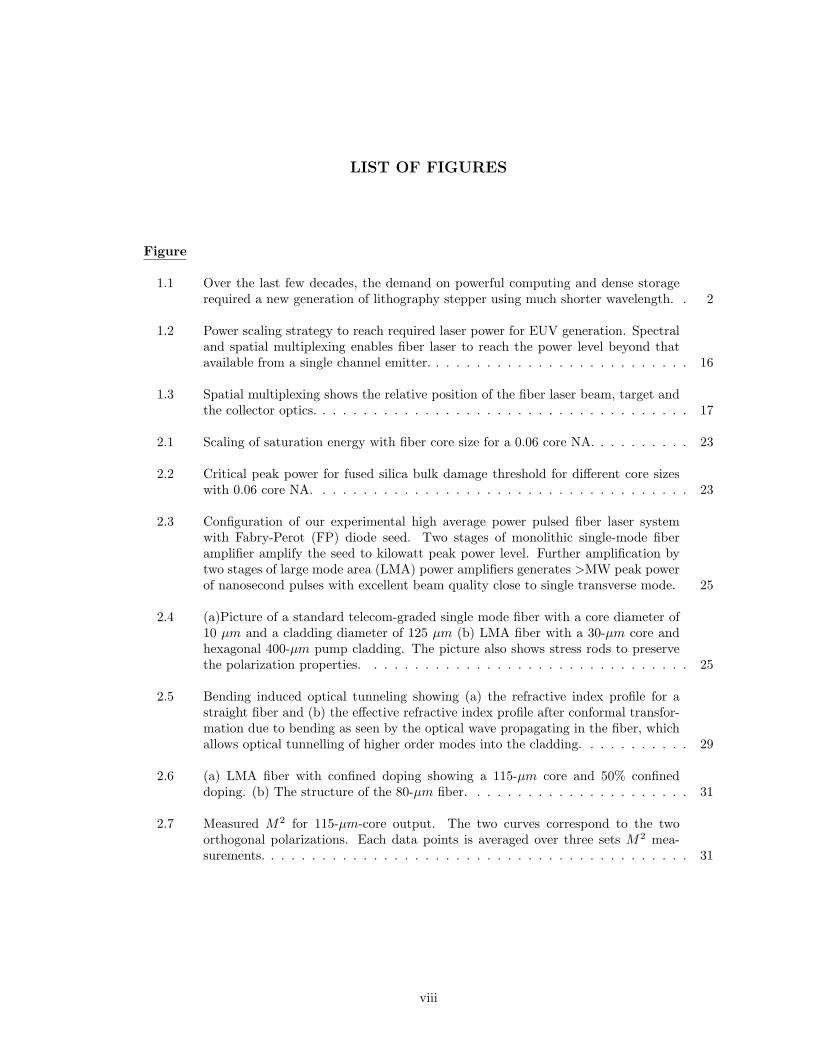
1.1 Over the last few decades, the demand on powerful computing and dense storagerequired a new generation of lithography stepper using much shorter wavelength. . 2
1.2 Power scaling strategy to reach required laser power for EUV generation. Spectraland spatial multiplexing enables fiber laser to reach the power level beyond thatavailable from a single channel emitter. . . . . . . . . . . . . . . . . . . . . . . . . . 16
1.3 Spatial multiplexing shows the relative position of the fiber laser beam, target andthe collector optics. . . . . . . . . . . . . . . . . . . . . . . . . . . . . . . . . . . . . 17
2.1 Scaling of saturation energy with fiber core size for a 0.06 core NA. . . . . . . . . . 23
2.2 Critical peak power for fused silica bulk damage threshold for different core sizeswith 0.06 core NA. . . . . . . . . . . . . . . . . . . . . . . . . . . . . . . . . . . . . 23
2.3 Configuration of our experimental high average power pulsed fiber laser systemwith Fabry-Perot (FP) diode seed. Two stages of monolithic single-mode fiberamplifier amplify the seed to kilowatt peak power level. Further amplification bytwo stages of large mode area (LMA) power amplifiers generates >MW peak powerof nanosecond pulses with excellent beam quality close to single transverse mode. 25
2.4 (a)Picture of a standard telecom-graded single mode fiber with a core diameter of10 µm and a cladding diameter of 125 µm (b) LMA fiber with a 30-µm core andhexagonal 400-µm pump cladding. The picture also shows stress rods to preservethe polarization properties. . . . . . . . . . . . . . . . . . . . . . . . . . . . . . . . 25
2.5 Bending induced optical tunneling showing (a) the refractive index profile for astraight fiber and (b) the effective refractive index profile after conformal transfor-mation due to bending as seen by the optical wave propagating in the fiber, whichallows optical tunnelling of higher order modes into the cladding. . . . . . . . . . . 29
2.6 (a) LMA fiber with confined doping showing a 115-µm core and 50% confineddoping. (b) The structure of the 80-µm fiber. . . . . . . . . . . . . . . . . . . . . . 31
2.7 Measured M2 for 115-µm-core output. The two curves correspond to the twoorthogonal polarizations. Each data points is averaged over three sets M2 mea-surements. . . . . . . . . . . . . . . . . . . . . . . . . . . . . . . . . . . . . . . . . . 31
viii

2.8 Comparison between experimental results and theoretical prediction of the coil-ing effect on transmission and mode quality for the 80-µm-core fiber. Theoreticalpredictions uses highest and the lowest mode scattering coefficient attained exper-imentally as plotted in the dotted curve (minimum scattering coefficient) and solidcurve (maximum scattering coefficient) . . . . . . . . . . . . . . . . . . . . . . . . . 33
2.9 Measured mode quality of the 80-µm-core fiber, coiled to radius around 5 cm. . . . 33
2.10 Scaling of the SRS as a function of the core diameter with a core NA of 0.06. Theexample shown here is for a 3-m fiber with 20-dB gain. Two curves plotted here areshown, with the solid one assuming a constant gain and the dashed curve assuminga linearly increasing gain, giving a higher SRS threshold. . . . . . . . . . . . . . . . 36
2.11 Spectrum of the amplifier output, showing the increase of the Stokes componentat 1115 nm with the increase of power. The amplifier shown here is a 30-µm-corefiber and 4.2-m long. Seed pulses are 2-ns squared pulse with 0.18-kW peak power. 38
2.12 Another evidence of SRS observed in the temporal profile. Temporal profiles shownhere are measured after the 30-µm-core fiber output with a peak power of 65 kW.The difference of the two profiles shown here is due to a 10-nm band-pass filter (forASE filtering). The profile measured with the ASE filter shows a missing peak,due to the shedding of the signal power into SRS Stokes waves, which has spectralcomponents out of the filter pass-band. . . . . . . . . . . . . . . . . . . . . . . . . . 39
2.13 Propagation in the bulk media with the consideration of Kerr nonlinearity with (a)no gain saturation and (b) gain saturation . . . . . . . . . . . . . . . . . . . . . . . 43
2.14 BPM simulation of the amplified signal in the waveguide with (a) no gain saturationand (b) gain saturation. . . . . . . . . . . . . . . . . . . . . . . . . . . . . . . . . . 44
2.15 Temporal shaping due to gain saturation at the output of two power amplifiers. Theinput pulse energy after the preamplifier is 0.48 µJ with a 10.2-ns pulse duration.After the 30 µm stage, the output energy is amplified to 92 µJ with a pulse durationof 7.5 ns. Slight pulse shaping is observed even though the output energy is lessthan 40% of the saturation energy for this fiber. The output energy of the 80-µm-core amplifier is 2.1 mJ with pulse duration of 1.9 ns. Pulse shortening andreshaping is more severe in this stage, since the output energy is higher than thesaturation energy of this fiber. . . . . . . . . . . . . . . . . . . . . . . . . . . . . . . 47
2.16 Output pulse shape with a squared-shaped and triangular-shaped input pulse, bothhaving a pulse energy of 200 µJ . The same temporal duration of 20 ns is used forall temporal shapes for comparison. It is seen that the output pulse shape is largelydeformed for a rectangular input pulse, compared to the output with a triangularinput-pulse shape. . . . . . . . . . . . . . . . . . . . . . . . . . . . . . . . . . . . . 48
2.17 Continuation of Figure 2.16 with a triangular shape, which resemble closely theinput pulse shape in the experiment. Another ideal exponential pulse shape isshown on the right. . . . . . . . . . . . . . . . . . . . . . . . . . . . . . . . . . . . . 49
2.18 A good agreement between the calculated and measured output pulse shape fromthe 80-µm-core fiber. The calculated output pulse is obtained by using the Equation2.15 and the measured energy and shape of the input pulse. . . . . . . . . . . . . . 50
ix

2.19 Example of numerically obtaining the input seed pulse including the effect of sat-urated gain from an output pulse of known shape and energy. Input pulse shapecan be determined by knowing the saturation energy and the small signal gain ofthe amplifier. The example shown here is for 5-mJ 1064-nm amplified output pulsefrom an 80-µm-core Yb-doped fiber. . . . . . . . . . . . . . . . . . . . . . . . . . . 52
2.20 (a) Temporal shaped of the amplified pulse after final stage of amplifier, showingreshaping due to gain saturation, (b) Pre-shaped pulse temporal profile from FPseed diode and predicted pulse shape considering cascaded shaping effect for eachstage of amplifier . . . . . . . . . . . . . . . . . . . . . . . . . . . . . . . . . . . . . 53
2.21 Examples of amplified pulse with pre-pulses of different contrast and delay: (a)pre-pulse to main pulse ratio 1:10 with 5.74 mJ in the main pulse, (b) pre-pulse tomain pulse ratio 1:1.27 with 5.58 mJ in the main pulse. . . . . . . . . . . . . . . . 54
2.22 Investigation of pulse shape and output energy with an triangular input pulsevarying input energy and the gain with the saturation energy 1.8 mJ. Obviously,high gain and high input energy are required for high energy extraction but at theexpense of severe pulse deformation and low overall gain. . . . . . . . . . . . . . . . 55
2.23 Frantz-Nodvick (dashed curve) showing a good fit to the experimental data (solidbullets) for various pulse energies. It is interesting to note that even though theinput pulse shape for each measured data point is not identical but the extractedenergy is only dependent on the input energy as modeled by Frantz-Nodvick. Theonly marginal difference at lower input pulse energy is due to squared seed pulses,being easier to amplify beyond the critical peak power of SRS. Therefore, furtherenergy extraction inside the 1064-nm signal is impeded due to the trigger of non-linear threshold. . . . . . . . . . . . . . . . . . . . . . . . . . . . . . . . . . . . . . . 56
2.24 Amplified peak power (round bullets) and energy (square bullets) at pulse durationsfrom 0.11 ns to 6.2 ns using the 80-µm-core fiber. A record high peak power closeto 6 MW is reached using 0.11 ns by gain-switching pulse. Longer pulse durationup to 6 ns extracted 6 mJ of energy from the fiber, an energy that is more thanthree time of the saturation energy. All the amplified pulses measure here is limitedby the trigger of Raman scattering. The laser is operated at a repetition rate of 50Hz for the energy and peak power scaling study . . . . . . . . . . . . . . . . . . . . 57
2.25 A photograph of the atmospheric breakdown initiated by a fiber laser. This indi-rectly verified the high peak power and the excellent mode quality from our LMAfiber, that allows it to reach record-high intensity levels, demonstrating the first airbreakdown by using a ns-pulsed fiber laser . . . . . . . . . . . . . . . . . . . . . . . 60
2.26 Thermal analysis showing the temperature distribution across the fiber for (a)passive air cooling with 60 W/m of heat density and (b) passive water cooling with60 and 100 W/m heat density. It is discernible that temperature gradient is thehighest in the jacket, where the thermal conductivity is the lowest, consequentlybecoming the highest thermal barrier across fiber. In addition, the passive aircooling will create a temperature discontinuity more than 760C from the jacketto the air, beyond the melting point of the polymer. . . . . . . . . . . . . . . . . . 64
x
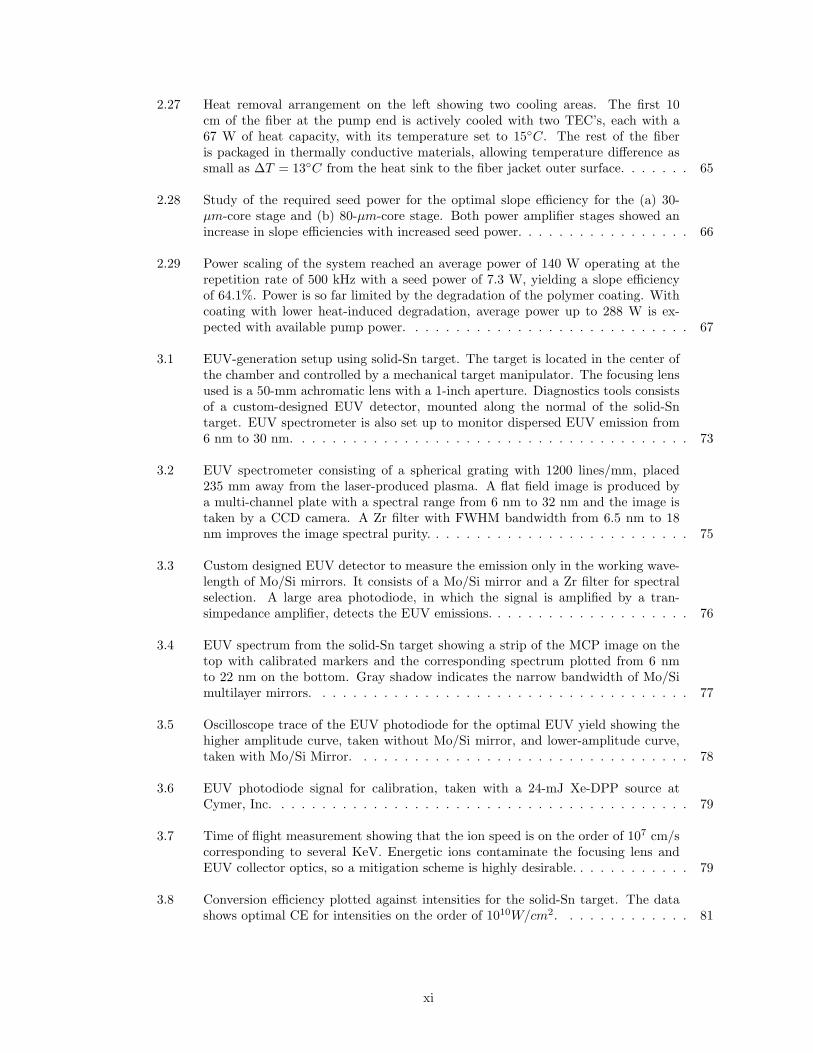
2.27 Heat removal arrangement on the left showing two cooling areas. The first 10cm of the fiber at the pump end is actively cooled with two TEC’s, each with a67 W of heat capacity, with its temperature set to 15C. The rest of the fiberis packaged in thermally conductive materials, allowing temperature difference assmall as ∆T = 13C from the heat sink to the fiber jacket outer surface. . . . . . . 65
2.28 Study of the required seed power for the optimal slope efficiency for the (a) 30-µm-core stage and (b) 80-µm-core stage. Both power amplifier stages showed anincrease in slope efficiencies with increased seed power. . . . . . . . . . . . . . . . . 66
2.29 Power scaling of the system reached an average power of 140 W operating at therepetition rate of 500 kHz with a seed power of 7.3 W, yielding a slope efficiencyof 64.1%. Power is so far limited by the degradation of the polymer coating. Withcoating with lower heat-induced degradation, average power up to 288 W is ex-pected with available pump power. . . . . . . . . . . . . . . . . . . . . . . . . . . . 67
3.1 EUV-generation setup using solid-Sn target. The target is located in the center ofthe chamber and controlled by a mechanical target manipulator. The focusing lensused is a 50-mm achromatic lens with a 1-inch aperture. Diagnostics tools consistsof a custom-designed EUV detector, mounted along the normal of the solid-Sntarget. EUV spectrometer is also set up to monitor dispersed EUV emission from6 nm to 30 nm. . . . . . . . . . . . . . . . . . . . . . . . . . . . . . . . . . . . . . . 73
3.2 EUV spectrometer consisting of a spherical grating with 1200 lines/mm, placed235 mm away from the laser-produced plasma. A flat field image is produced bya multi-channel plate with a spectral range from 6 nm to 32 nm and the image istaken by a CCD camera. A Zr filter with FWHM bandwidth from 6.5 nm to 18nm improves the image spectral purity. . . . . . . . . . . . . . . . . . . . . . . . . . 75
3.3 Custom designed EUV detector to measure the emission only in the working wave-length of Mo/Si mirrors. It consists of a Mo/Si mirror and a Zr filter for spectralselection. A large area photodiode, in which the signal is amplified by a tran-simpedance amplifier, detects the EUV emissions. . . . . . . . . . . . . . . . . . . . 76
3.4 EUV spectrum from the solid-Sn target showing a strip of the MCP image on thetop with calibrated markers and the corresponding spectrum plotted from 6 nmto 22 nm on the bottom. Gray shadow indicates the narrow bandwidth of Mo/Simultilayer mirrors. . . . . . . . . . . . . . . . . . . . . . . . . . . . . . . . . . . . . 77
3.5 Oscilloscope trace of the EUV photodiode for the optimal EUV yield showing thehigher amplitude curve, taken without Mo/Si mirror, and lower-amplitude curve,taken with Mo/Si Mirror. . . . . . . . . . . . . . . . . . . . . . . . . . . . . . . . . 78
3.6 EUV photodiode signal for calibration, taken with a 24-mJ Xe-DPP source atCymer, Inc. . . . . . . . . . . . . . . . . . . . . . . . . . . . . . . . . . . . . . . . . 79
3.7 Time of flight measurement showing that the ion speed is on the order of 107 cm/scorresponding to several KeV. Energetic ions contaminate the focusing lens andEUV collector optics, so a mitigation scheme is highly desirable. . . . . . . . . . . . 79
3.8 Conversion efficiency plotted against intensities for the solid-Sn target. The datashows optimal CE for intensities on the order of 1010W/cm2. . . . . . . . . . . . . 81
xi

3.9 Schematic of UCF Sn-doped droplet targets [1], compatible with tens to hundredsof KHz repetition rates and effectively debris-free. . . . . . . . . . . . . . . . . . . . 82
3.10 UCF experimental setup showing Sn-doped droplet source, EUV spectrometer andFlying Circus EUV spectrometer. Two pairs of telescope controlled the collimationand magnification of the laser output beam through the isolator and focusing lens.High power polarization insensitive polarizer impeded the feedback from plasmasource. . . . . . . . . . . . . . . . . . . . . . . . . . . . . . . . . . . . . . . . . . . . 83
3.11 Smallest focal spot size image of 18-µm 1/e2 diameter measured with a 10× mi-croscopic objective lens and an Ophir Beamstar CCD camera . . . . . . . . . . . . 84
3.12 Schematics of flat-field grating spectrometer, showing an 80-µm entrance slit, actingas the line source with the illumination from the LPP. A grating in the chamberdispersed the EUV emission on to the X-ray CCD camera, recording high resolutionimages from 11 to 19 nm. . . . . . . . . . . . . . . . . . . . . . . . . . . . . . . . . 86
3.13 Flying Circus II EUV energy meter for CE measurement including Mo/Si mirror(acting as the limiting aperture of the apparatus) and Zr filter for wavelength se-lection with the corresponding spectral properties plotted in the inset. Photodiodewas reverse-biased at 24 V ensure linearity. . . . . . . . . . . . . . . . . . . . . . . 87
3.14 Reading of EUV diode signal from Flying Circus II (FCII) , measuring an amplitude≈ 200 mV. FCII also has a very high sensitivity and fast response in the order offew nanoseconds . . . . . . . . . . . . . . . . . . . . . . . . . . . . . . . . . . . . . 87
3.15 Water spectrum at four intensity levels showing emissions from different oxygenspecies. Change in the plasma temperature can be indicated from the change inthe contrast predominately the two peaks around 15-nm. Note the emission fromO-VI dominates with increase of intensity, which implies an increase in plasmatemperature. Also note that each spectra is taken with the same exposure time,therefore, the photon counts directly reflect the emission strength. . . . . . . . . . 89
3.16 Pulse duration conversion efficiency scaling showing the spectra for pulse durationsof 1.7 ns and 6 ns. CE of ≈ 1% from 6-ns pulses is obtained at intensity level of1.19× 1011W/cm2 and CE of ≈ 0.3% is obtained for 1.7-ns pulses at the intensitylevel of 1.65 × 10¹¹W/cm2. Note that the difference in the spectra from 1.7-nsshows lower and broader Sn UTA indicating a lower plasma temperature even withhigher intensity on target. . . . . . . . . . . . . . . . . . . . . . . . . . . . . . . . . 91
3.17 (Left) CE dependence on the lens focal position and (Right) The dependenceof the laser intensity for 6-mJ and 6-ns pulses. The laser intensity is altered bytransversing the position of the focusing lens. . . . . . . . . . . . . . . . . . . . . . 91
3.18 Spectra with and without prepulses. In both testing conditions, the shape andenergy of the main pulse remain identical. . . . . . . . . . . . . . . . . . . . . . . . 93
3.19 Best spectrum with prepulse preheating showing emission from Sn-doped waterdroplet target. It shows the image of the X-ray CCD camera on the top. Spectrumfeatures the O5+ emission peaks at 11.58, 12.97, 15.01 and 17.3 nm, providing thereference points for spectral calibration. . . . . . . . . . . . . . . . . . . . . . . . . 94
xii

3.20 Study of spectral dependence on intensity showing a compelling increase in photoncounts as the intensity increased from low to high 1010W/cm2. Photo counts startsto decrease as the intensity increased further, indicating the optimum intensitylevel. The testing here utilizes prepulses of 45-ns delay and intensity includes theenergy in the prepulse. . . . . . . . . . . . . . . . . . . . . . . . . . . . . . . . . . . 95
3.21 CE dependence on laser intensity (on the left) and lens position (on the right).The plots shown here used prepulses with delay of 45-ns and contrast of 1:10.Highest CE is reached at the intensity level of 8.4 × 10¹⁰W/cm2 and CE is lowerwith intensities higher than optimum. Interesting to note from the lens positiondependence that CE is higher when the beam is diverging (+ 200 µm), which wasfirst observed in [2] . . . . . . . . . . . . . . . . . . . . . . . . . . . . . . . . . . . . 96
3.22 (Courtesy of Dr. Simi George) The image of scanning white light interferome-ter showing the debris coated on the focusing lens after ≈ 30 minutes of targetirradiation [3]. . . . . . . . . . . . . . . . . . . . . . . . . . . . . . . . . . . . . . . . 97
3.23 (Courtesy of Dr. Simi George) Comparison of the spectra from fiber laser andsolid-state laser shows that fiber laser created the same irradiation condition foroptimum efficiency extraction given very different pulse energy, pulse duration andfocal spot size. [3] . . . . . . . . . . . . . . . . . . . . . . . . . . . . . . . . . . . . . 98
4.1 Coherent combining with active feedback by detecting the output phase to controlthe phase of the beams to be combined. . . . . . . . . . . . . . . . . . . . . . . . . 103
4.2 Spectral combining setup using a diffraction grating to combine beams at differentwavelengths, which are incident at a slightly different angle. . . . . . . . . . . . . . 104
4.3 Design tradeoff for the laser spot size on a diffraction grating and linewidth of thelaser to maintain mode quality between M2=1.2 to 1.5. The example shown hereis plotted using 1740-lines/mm grating at a Littrow ( 66) incident angle. . . . . . 106
4.4 Average power densities on the combining grating (SBC) for combined powers of 5kW, 25 kW and 100 kW. . . . . . . . . . . . . . . . . . . . . . . . . . . . . . . . . . 106
4.5 Ion beam sputtering (IBS) offering a high degree of control on depositing the ma-terials on the substrate. . . . . . . . . . . . . . . . . . . . . . . . . . . . . . . . . . 109
4.6 Type I combiner, in which a combined beam (located on the long-wavelength sideof the LPF filter edge) is transmitted through the filter. Meanwhile, each newspectral channel (located on the short-wavelength side of the LPF filter edge) isadded to the combined beam by reflection from the filter. . . . . . . . . . . . . . . 111
4.7 Type II combiner showing the combined beam is reflected (and is located on theshort wavelength side) while each new spectral channel is added through transmis-sion (on the long wavelength side of the corresponding filter spectral edge). . . . . 112
4.8 Relative wavelengths of the laser lines and multilayer cutoff edge for the combiningconfiguration in Figure 4.6 and 4.7. . . . . . . . . . . . . . . . . . . . . . . . . . . . 112
4.9 Analysis showing the requirement on the filter transmittance of type I combiner/the filter reflectivity for type II to achieve overall combining efficiency > 90% for 5,10, 20 and 40 channels (N) with an assumption of R=0.95 for type I and T=0.95for type II. . . . . . . . . . . . . . . . . . . . . . . . . . . . . . . . . . . . . . . . . . 113
xiii

4.10 Transmission curve for 14 tuning angle showing a sharp transition of 0.8 nm from10%-90%-transmission points. . . . . . . . . . . . . . . . . . . . . . . . . . . . . . . 115
4.11 The angle tuning characteristics of the particular filter tested. Note that the curveis polarization sensitive, which means that the s and p polarization work at thenormal incident angle. As the angle of incident increases, the cutoff wavelengthsfor both polarizations begin to walk off and the splitting will become more dominantat larger incident angles. . . . . . . . . . . . . . . . . . . . . . . . . . . . . . . . . . 116
4.12 Measured filter transmission at three incident angles showing a spectral shift of 45nm with 28 of tuning for p-polarized light. The transmission is measured to be> 95% independent of incident angle. . . . . . . . . . . . . . . . . . . . . . . . . . . 116
4.13 Experimental setup for multi-pass reflectivity measurement. Two multi-layer mir-ror are placed in parallel to each other with separation of 35 cm. Collimated beamof narrow bandwidth single frequency laser is used to test at the wavelengths of 1050nm, 1055 nm, 1060 nm, 1065 nm and 1070 nm with small incident angle. Reflec-tivities are measured to be greater than 99.7% for the above mentioned wavelengths.117
4.14 The four-stage system consisting of the seed MOPA using a monolithic fiber lasersystem and single mode output. . . . . . . . . . . . . . . . . . . . . . . . . . . . . . 119
4.15 Spectral beam combining experimental setup shows splitting filters F1 and F3 whichare used to separate a broad spectrum of input beam center at 1059 nm into threespectral component seed. The edges of splitting filters are chosen to provide suffi-cient seed for the LMA 80/400 stage for efficient power/energy extraction. Clean-ing filters F2 and F4 are used to increase spectral spacing between seed channelsto avoid overlapping. Combining filters F5 and F6 are used at the output of theamplifier. Note that two combiner filters are only separated ≈ 3 cm. . . . . . . . . 120
4.16 Seed spectra for three channels and combined output spectrum. The structures inthe spectra are longitudinal modal structure of the Fabry-Parot seed diode. . . . . 123
4.17 Temporal profiles of the input and amplified pulses after combiner showing a goodtemporal overlapping on a nanosecond scale. Slight temporal shortening of theamplified pulse is due to the gain saturation of the amplifier. The detector usedhere has a 150-ps rise time, along with a 40-GHz-bandwidth oscilloscope. . . . . . . 123
4.18 Beam profiles after 80-µm fiber for the (a) blue channel (b) green channel (c) redchannel, and (d) combined beam profile. . . . . . . . . . . . . . . . . . . . . . . . . 124
4.19 Mode quality measurement for red channel output with measured M2 of 1.20 and1.30 for the horizontal and vertical axes. . . . . . . . . . . . . . . . . . . . . . . . . 125
4.20 Mode quality measurement for green channel with measured M2 of 1.26 and 1.42for the horizontal and vertical axes. . . . . . . . . . . . . . . . . . . . . . . . . . . . 125
4.21 Mode quality measurements for the blue channel with measured M2 of 2.63 and2.41 for the horizontal and vertical axes. . . . . . . . . . . . . . . . . . . . . . . . . 125
4.22 Mode quality measurement for the combined beam with measured M2 of 1.82 and1.85 for the horizontal and vertical axes. . . . . . . . . . . . . . . . . . . . . . . . . 126
xiv

4.23 Spectral broadening is observed after the 80-µm-core amplifier. . . . . . . . . . . . 127
4.24 Spectra for the three seed channels for energy scaling study. . . . . . . . . . . . . . 127
4.25 The output pulse shapes of individual channels and combined beam show reshapingby gain saturation since all the energy in each individual is higher than saturationenergy of the 80-µm-core fiber. Lower output energy after the combiner is due tothe polarization degradation. . . . . . . . . . . . . . . . . . . . . . . . . . . . . . . 128
xv

CHAPTER I
Introduction
Demands on light sources in the extreme-ultraviolet (EUV) and the soft-X-ray
region have been growing in recent years due to potential applications on element-
specific spectroscopy, high-resolution microscopy, and surface analysis [4]. The rela-
tive transparency of the “water window” in the soft-X-ray region enable solutions for
high-resolution imaging in biological and medical sciences[5]. Moreover, the search
for a high power light source at shorter wavelengths for the next-generation of lithog-
raphy steppers is the main driving force to the rapid development of a EUV light
source in recent years [6, 7, 8, 9, 10].
1.1 Lithography: the Driving Force for the Semiconductor Technology
Stimulated by increasing demands on computation power and dense storage, pro-
gressive development in the lithography steppers stimulated the manufacturing tech-
nology in the semiconductor industry. The Moore’s Law predicts that number of
devices on a chip doubles every 18 months. In other words, logarithmic growth oc-
curs in the process speed and memory size as shown in Figure 1.1. In order to keep
up this growth rate, the critical dimensions for use in high-volume manufacturing
are anticipated to decrease on a schedule of 0.71× reductions every three years [11].
1

2
Mem
ory Size
Year
Freq
uenc
y
1 Mhz
10 Mhz
100 Mhz
1 Ghz
10 Ghz
100 Ghz
1 Mbit
10 Mbit
100 Mbit
1 Gbit
10 Gbit
100 Gbit
1990 2000 2010
Hg Lamp = 365 nm
NA = 0.4LensesSize 700 nm
λ
Excimer Laser = 248 nm
NA = 0.7LensesSize 200 nm
λ
Laser Plasma = 13 nm
NA = 0.1MirrorsSize <50 nm
λ
Figure 1.1: Over the last few decades, the demand on powerful computing and dense storage re-quired a new generation of lithography stepper using much shorter wavelength.
Resolution (RES) of critical dimension can be related to the other parameters of
exposure tools by,
(1.1) RES = K1λ
N.A.
where the constant K1 is determined empirically by the resist and the etching process
during the manufacturing of integrated circuits [12], typically in the range from 0.4
to 0.8 [13], λ is the wavelength of the light source and NA is the numerical aperture
typically in the range from 0.2 to 0.8 [13]. Equation 1.1 predicts that one can improve
the resolution of critical dimension by choosing a shorter wavelength source (smaller
λ ), improvement in projection optics (higher NA), and control on process and better
contrast resist (lower K1 ).
However, higher NA precipitates more stringent requirements on the manufactur-
ing processes as another associate parameter, depth of focus (DOF), which is given

3
by,
(1.2) DOF =K2λ
(NA)2
where K2 is also empirically determined. DOF gives a longitudinal measure of the
distance over which the image is in proper focus and shows that an increase in NA will
decrease DOF. This will lead to decrease in the process window, requiring constant
monitoring. Finer adjustment of the final lens-to-wafer separation is also required in
order to maintain highest resolution.
One of the major advancements in the higher-resolution lithography was driven
by the decreasing wavelength in light source as shown in Figure 1.1 In the early
1980’s to mid 1990’s, the lithography tools utilized mercury (Hg) arc lamps, filtered
for different spectral lines (g-lines at 435 nm and i-line at 365 nm) [13]. In the early
1990’s, excimer laser sources with wavelength at 248-nm krypton fluoride (KrF)
and 193-nm argon fluoride (ArF) took over and remain the leading light sources
for high volume manufacturing (HVM) lithography stepper to date. In addition to
shorter wavelength, excimer laser sources also have much narrower line-widths than
the mercury emission band at 248nm, which is beneficial for controlling chromatic
aberrations in the largely refractive optics.
During the early days in lithography technologies, it was believed that the physical
limitation of the smallest feature size reachable by a certain light source is one half
of the wavelength [10], nonetheless, recent advancement on immersion lithography
(reduce the smallest feature by a large index fluid), high contrast resists and optical
proximity effect correction [14] had pushed the smallest feature size to a 45nm node
using a 193-nm ArF laser(less than one-fourth of the wavelength of the ArF excimer
laser)
However, for a process beyond 32-nm pitch, 193-nm water immersion process is

4
limited by NA to resolve this pitch, unless narrow pitches are split into larger ones by
double pattering or exposure, corresponding to a doubled manufacturing cost [11].
1.2 Beyond 193-nm Lithography
Alternative lithography technologies using different light sources that had been
developed over the years includes 157-nm ( F2 ) optical lithography [15, 8, 16, 17] X-
ray proximity printing (XPL) [18, 8, 19], electron beam projection techniques (EPL)
[18, 7], ion beam writing [18, 7, 8], nanoimprinting [20, 7, 21, 22], and extreme
ultraviolet lithography (EUVL) [7, 8, 9] based on multilayer coated reflective optics.
The issues of concern for 157-nm optical lithography are the availability of viable
resist and the absorption of SiO2. The optics has to be made from CaF2, which
projects the cost to be doubled in projection optics. However, the predominant
reason for the discontinuation of 157-nm optical-lithography program is the extension
of 193-nm optical-lithography with immersion and the fact that EUV lithography will
likely to be ready as the successor of 193-nm process.
X-ray proximity lithography (XPL) is a relatively mature technology compared
to optical lithography which utilizes nominal 0.7 nm to 1.2 nm wavelength radia-
tion (1.0 keV to 1.8 keV photon energy) from relatively broadband-bending-magnet
synchrotron-radiation with relatively simple beamline optics [19]. However, XPL
is an 1:1 imaging lithography (compared to 1:4 reduction optics used in optical
lithography, including EUV lithography) and the improvement in UV and DUV
optical-lithography had postponed the need for this type of post-optical advanced
lithography.
Electron projection lithography (EPL) suffers from mask heating and subsequent
overlay errors which prevents EPL from being widely used. Instead, it is now gener-

5
ally used to fabricate the mask for DUV or EUV lithography.
Nano-imprinting (NIP) replicates the pattern on the substrate from a master
pattern by molding or stamping, which is similar to the current process replicating
compact discs [20, 7, 21, 22]. A feature size smaller than 10 nm has been obtained
using nanoimprinting, however, the cost of such a method is much higher than using
EUV lithography, due to the expensive master pattern and high requirement of level-
to-level alignment accuracy (typically one-third of the minimum feature size)
By the year of 2003, work on proximity x-ray lithography, electron projection
lithography and ion projection lithography was either completely terminated or
greatly reduced. Development of EUV lithography is a relatively late-comer among
the possible candidates for next generation lithography, yet, EUV is the leading
technology promising the high throughput and cost effective solution as the next
generation of lithography steppers.
1.3 Extreme Ultraviolet as the Source for Next Generation Lithography
The efficient high-power EUV light source is presently considered a strong con-
tender for high-volume semiconductor manufacturing at the 32-nm node around
2010-2013. One important physical limitation on shorter wavelengths is that the
optical materials and approximate transmission limit of fused silica (pure SiO2) is
around 200 nm and transmission optics will no longer be efficient in the vacuum
ultraviolet (VUV) region where air and all materials become absorbing. Therefore,
reflective optics using multilayer mirrors become the optics-of-choice for wavelengths
shorter than 200 nm where a vacuum environment will be required for EUV lithog-
raphy.

6
1.3.1 Mo/Si Multilayer Mirrors: the Key Enabling Technology for EUV Lithography
EUV lithography will not be realized without the invention of Mo/Si multilayer
interference mirrors. A multilayer interference mirror, typically consists of two ma-
terials of high and low atomic number (Z) in order to maximize the difference in
electron density. Mo (molybdenum, Z=42) / Si (silicon, Z=14) and Mo/Be (beryl-
lium, Z=4) multilayer, first perfected by Barbee, achieve reflectivity of the order of
70 % . The coatings of these multilayer mirrors are largely amorphous typically on
a Si substrate and reflection conforms to Bragg’s law for a periodicity equal to the
thickness of one bilayer pair in the order of few nm (or tens of atomic mono layers).
Spectral bandpass is in the order of 1/N, where N is the number of layer pairs and
is typically between 30 and 50 for high reflectivity. For normal incidence reflection
filters, individual filters are each about λ/4 thick, or in the order of few nanome-
ters. Off-normal incidence can be made possible by changing the thickness of layers
according to Bragg’s Law,
(1.3) d = λ/2sinδ
One great advantage of multilayer coating is its adaptability to curved surfaces,
enabling their use on complex designs of collector optics.
1.3.2 Advantages of EUV Lithography
The solution using a EUV light source provides significant reduction in wavelength
(11-13nm for EUV versus 193-248nm for DUV), allowing for a small feature-size (
≈ tens of nm) with a relatively smaller numerical aperture and large depth-of-focus.
Additional advantages include:
1. EUVL is an optical lithography to which all the experiences learned by the
semiconductor industry on previous exposure tools can still be applied.
7
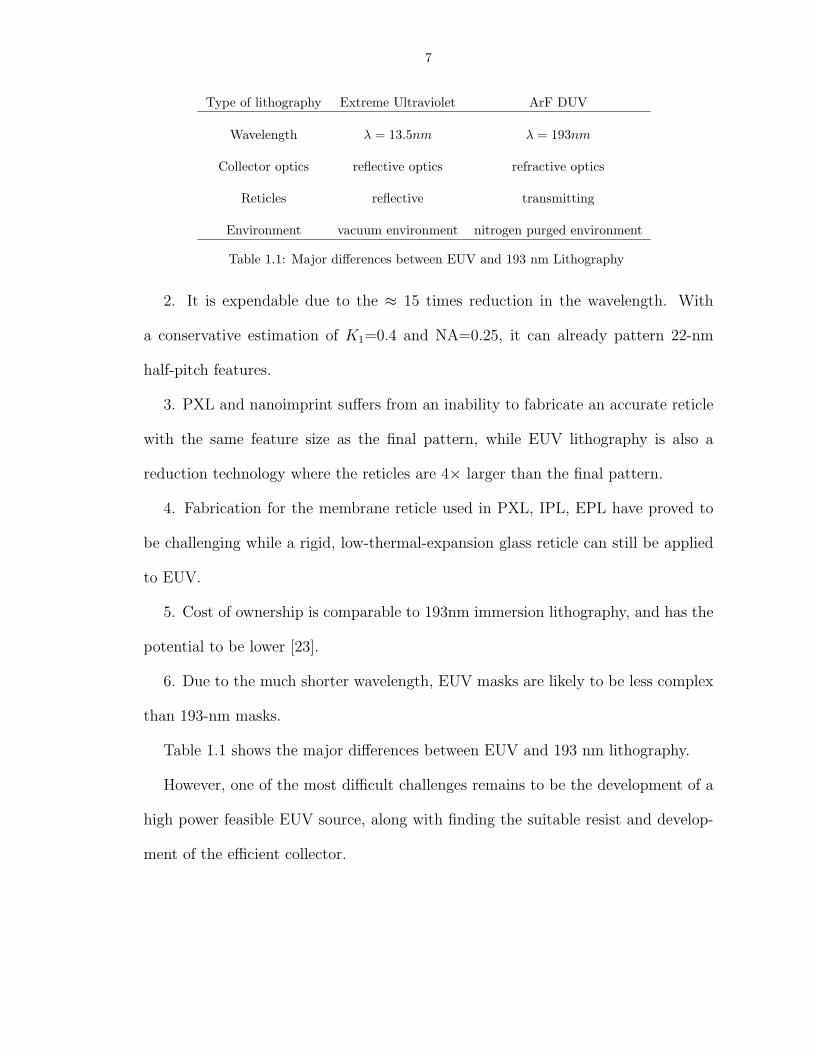
Type of lithography Extreme Ultraviolet ArF DUV
Wavelength λ = 13.5nm λ = 193nm
Collector optics reflective optics refractive optics
Reticles reflective transmitting
Environment vacuum environment nitrogen purged environment
Table 1.1: Major differences between EUV and 193 nm Lithography
2. It is expendable due to the ≈ 15 times reduction in the wavelength. With
a conservative estimation of K1=0.4 and NA=0.25, it can already pattern 22-nm
half-pitch features.
3. PXL and nanoimprint suffers from an inability to fabricate an accurate reticle
with the same feature size as the final pattern, while EUV lithography is also a
reduction technology where the reticles are 4× larger than the final pattern.
4. Fabrication for the membrane reticle used in PXL, IPL, EPL have proved to
be challenging while a rigid, low-thermal-expansion glass reticle can still be applied
to EUV.
5. Cost of ownership is comparable to 193nm immersion lithography, and has the
potential to be lower [23].
6. Due to the much shorter wavelength, EUV masks are likely to be less complex
than 193-nm masks.
Table 1.1 shows the major differences between EUV and 193 nm lithography.
However, one of the most difficult challenges remains to be the development of a
high power feasible EUV source, along with finding the suitable resist and develop-
ment of the efficient collector.

8
Wavelength 13.5 nm
In-band EUV Power at IF 180 W
Repetition Frequency >7 kHz
Integrated Energy Stability ±0.3%, 3σ over 50 pulses
Source cleanliness > 30,000 hours
Etendue of Source Output max 1-3.3 mm2sr
Spectral Purity
130-400[nm](DUV/UV) 6 7.5% (Design dependent)
> 400 nm (IR Vis) at Wafer 6 0.1% (Design dependent)
Table 1.2: Joint requirement of light sources for EUV lithography by ASML, Canon, Nikon
1.3.3 Requirements and Development of EUV Light Source
The initial production of semiconductor chips using EUV lithography is targeted
for the year 2009 at a 32-nm half-pitch resolution. In order to expose 100 wafers per
hour, the power required at the intermediate focus is 180 W for the first generation of
the production tool. The joint requirement by the semiconductor tool manufacturers
for the EUV source is summarized in Table 1.2
EUV radiation can be produced by an electromagnetic pinch (discharge produced
plasma source or DPP source) or by laser heating (laser-produced plasma source
or LPP source). However, due to the intrinsic differences between DPP and LPP
sources, the source power required for DPP and LPP differs significantly. DPP
generally has a larger source size, meaning a lower brightness that allows a smaller
collector angle. Moreover, the debris generated from a current DPP source is not
as controllable as that from an LPP source, therefore, a more sophisticated debris
mitigation scheme must be applied to DPP sources to maintain the collector lifetime
as stated in Table 1.2. Table 1.3 summarized the estimated required powers for
9
Source Type Discharge Produced Plasma(DPP) Laser Produced Plasma(LPP)
Required EUV Power 180 W 180 Wat intermediate focus (IF)
Collector solid Angle (sr.) π 2π
Integral Reflectivity of Collector 55% 50%
Gas Absorption 10% 10%
Debris mitigation transmission 90% 100%
Spectral Purity Filter 90% 90%
Required EUV at source 898W 444W
Table 1.3: The power requirement at the source extracted from the different collector requirementfor laser produced plasma (LPP) and discharge produced plasma (DPP)
the commercialized lithography stepper using the DPP and the LPP sources. DPP
sources, conclusively, require approximately twice the EUV power at the source than
LPP source.
DPP had been leading the power-source race and was once considered the only
solution for the production-worthy EUV source until recent years. However, recent
developments on kilowatt-class high-average-power lasers has significantly improved
the power of LPP sources surpassing the power of DPP sources[24]. Moreover, LPP
source in general generated less debris compared to DPP sources. In addition, being
a much bright source, i.e. better collection efficiency, LPP had become the preferred
source for the HVM EUV lithography tools. On the other hand, uncontrollable debris
from the DPP sources made them almost infeasible as a realistic source, leading to
a great slowdown on their development.
1.4 Laser-Produced-Plasma Source: Current Status and Requirementson Laser Pulse Parameters
The current status of LPP EUV sources is summarized as follows:

10
4W of in-band EUV power at the source was demonstrated using a Xe-jet target
and a 1-kW Nd-YAG laser with a 10-kHz pulse repetition rate, 100-mJ pulse energies
and 6-ns pulse duration. The conversion efficiency is 0.4% [25]. With Sn-droplet
targets, the state of the art CO2 laser with 12kW of laser power demonstrated 100
W of power in the burst mode (5% of duty cycle demonstrated so far) calculated
at IF (5W average at IF for an open-loop operation). Another 6-kW CO2 laser
also demonstrated 16 W of EUV power at IF with 1-sr collector using a rotating
Sn-plate [26]. Richardson etal. demonstrated 24 W of in-band EUV power at the
source, projecting 8W of power at the IF with a continuous operation using Sn-doped
water-droplet targets and a Nd:YAG solid-state laser. To summarize, a production-
worthy power level should not be unreasonable to imagine in the near future with
the progressive development of high-power lasers to the required power level.
In addition to the power requirement, the laser must provide the correct pulse
parameters to have efficient EUV generations. Several studies [2, 27, 28, 29, 30,
31, 32, 33] on conversion efficiency optimization using ns-pulsed solid-state lasers
reported that the highest conversion efficiencies can be achieved at the intensities
of 0.5 − 5 × 10¹¹W/cm2 using the 1064-nm lasers and Sn or Sn-composite target
materials. Several laser parameter sets for the Nd:YAG solid-state laser used to
achieve high EUV conversion efficiencies with Sn or Sn-composite targets [2, 27, 28,
29, 30, 31, 32, 33] are provided in Table 1.4.
Solid-state lasers capable of efficient EUV generation have pulse durations of
several nanoseconds and energies exceeding 100 mJ, corresponding to multi-megawatt
peak powers (Table 1.4). Such pulse energies, however, pose a significant problem for
fiber lasers, which have not achieved 100-mJ pulses at such pulse durations due to the
relatively small transverse mode size of fiber gain media. Consequently, a strategy of

11
Ref. Target Pulse Duration Highest Pulse Intensity for Best CEEnergy Available highest CE
[29] Liquid Sn-jet 5 ns 284 mJ 5× 10¹¹W/cm2 2.5%
[30] Solid Sn 8 ns 1 J 5× 10¹⁰W/cm2 2.0%
[31] Solid Sn 1.2, 2.3, 5.6, Not stated 5× 10¹⁰W/cm2to 2.2%and 8.5 ns 1× 10¹¹W/cm2
[32] Low density Sn 10 ns Not stated 5× 10¹⁰W/cm2 2.2%
[2] Tin-doped droplet 11.5 ns 1.6 J 1-1.5×10¹¹W/cm2 2.0%
[27] Solid Sn 10.5 ns 200 mJ 9.2× 10¹⁰W/cm2 4.9%
[33] Tin 7 ns 650 mJ 4× 10¹⁰W/cm2to 2.0%1× 10¹¹W/cm2
Table 1.4: Laser parameters of solid state laser that demonstrated high conversion efficiency usingSn-based target materials
utilizing a fiber laser for efficient EUV generation should be distinctly different than
using other types of lasers, since the operational-parameter space accessible with a
fiber laser is very different from that of the solid-state laser shown in Table 1.4. One
path toward achieving the required intensities with a fiber laser would be to exploit
the facts that : (i) fiber lasers can provide much shorter pulses and near-diffraction-
limited beam qualities and (ii) key parameters of the pulses (such as duration, shape
and repetition rate) can be electronically controlled [34] with the diode-seeded fiber-
amplifiers. Nonetheless, it is necessary to design a fiber laser providing the correct
laser parameter space and also have enough power for a production-worthy EUV
source. Using the required power at the source (Table 1.3) and the demonstrated
modal efficiency of ≈ 2% (Table 1.4), the required laser power is ≈ 25 kW.

12
1.5 25-kW High-Power All-Fiber-Laser Architecture by Spectral andSpatial Combining
The high-power pulsed-fiber-lasers have a significant potential as the cost-effective
multi-kW power-scalable laser drivers for high-power laser-produced-plasma EUV
lithography sources. However, two questions have not yet been investigated. (i)
Given that the pulse parameter space is very different from that of solid-state lasers,
can the pulsed fiber-lasers provide irradiation conditions suitable for efficient EUV
generation? (ii) Is current fiber laser technology suitable to provide enough power
required for high volume manufacturing?
1.5.1 Introduction to the Fiber Laser: A Compact, Robust, and Efficient Laser
Fiber lasers, first demonstrated by Snitzer [35], have significant technological ad-
vancements over the last few decades in several types of rare-earth doping materials
such as Nd [36], Sr [37], Pr [38], Er [36, 39, 40, 41], Yb [42], Tm [43]. While the
diode-pumped solid-states (DPSS) laser suffer from thermal-optical problems (ther-
mal lensing and thermally stress-induced birefringence), the fiber laser exhibits much
higher thermal management properties due to its larger surface-to-active-volume ra-
tio [44]. Therefore, the beam quality of the fiber-laser output is dominated by the
physical design of the fiber itself and the degradation due to thermal distortion as
seen in DPSS is negligible. Another attractive feature of the fiber laser is its very high
efficiency; up to 80% of optical-to-optical efficiencies can be achieved for Yb-doped
amplifiers due to its very small quantum defect (< 10%). Pumped with a highly
efficient diode laser, the wall-plug efficiency of the fiber laser system can generally
reach ≈ 40%, while gas lasers can only provide ≈ 10% of efficiency.
Fiber lasers can also emit a broad range of wavelengths from 1064nm to 2µm de-
13
pending on the dopant-of-choice and the typical operation wavelengths are 1064nm
(Yb), 1550 (Er), and 2000nm (Tm) Among the dopant, the inherently high quan-
tum efficiency of Y b3+ is also the reason that fiber-lasers with the highest power
are doped with Y b3+. Generally, the single-mode fiber lasers used in the telecoms
system, with very robust mode quality and well-developed technologies for making
it a compact system, have a core diameter of ≈ 10µm. However, two major trade
offs will accompany smaller core size. Core-pumped single mode diodes are limited
to a power level of several watts, which in turn limits the maximum power that can
be extracted from the fiber. Moreover, the small transverse core size also indicates
lower nonlinearity thresholds, which limits the maximum output power, especially
when operated in the pulsed mode.
The solution to this is the use of double-cladded LMA fibers [45]. The first
cladding has a lower refractive index than the core, therefore guiding the electro-
magnetic wave, based on total internal reflection. The second cladding, usually
made of polymer (for LMA fiber) or air-holes (for PCF fibers) [46, 47], surrounds
the first cladding (also referred as ”‘pump core”’) to guide the pump light. This
geometry will increase the signal core size and also increase the pump power that
can be coupled into the fiber with the diode lasers with same brightness.
The double-cladded design of the fiber has a very attractive performance of ef-
fective brightness improvement. This is the highly multimode pump light being
absorbed gradually and completely over the entire length of the amplifier and the
energy is transferred into high-brightness, high-power radiation guided by the core.
The relatively long interaction length (usually in the range of several meters depend-
ing on the doping level and pump-cladding to core-area ratio) and smaller transverse
core size makes the fiber laser more susceptible to nonlinear effects such as stim-
14
ulated Raman-scattering (SRS), self-phase modulation (SPM), stimulated Brillouin
scattering (SBS) and four-wave mixing (FWM). These nonlinear effects are beneficial
in some applications, (eg. super continuum generation, nonlinear spectral broadening
in fiber chirp pulse amplifier (FCPA) system, and in Raman amplifiers). However,
for high average-power and high peak-power extraction as well as some applications
requiring narrow linewidth (eg. laser ranging, LIDAR and spectral beam combining),
nonlinear effects are generally detrimental and it is necessary to take into account
these nonlinear effects while designing the fiber laser based system.
The powers from the CW fiber lasers with a diffraction-limited output beam
in the last 15 years increased nearly three orders of magnitude from 5W to 3kW
[48, 49, 50, 51, 52, 53, 54, 55, 56]. In addition, fiber core-size scaling is currently
being pursued through several innovative approaches [57, 58, 59], which are likely to
extend current capabilities of fiber laser technology much further. These approaches
effectively provide single-mode output from the fiber with core size and numerical
aperture beyond the waveguide criteria, by introducing additional structure around
the core to increase the loss of higher order mode, through coupling the HOM into
the side structures. Realization of these technologies,high power fiber lasers can
be packaged into monolithic systems, to provide a robust, alignment-free, compact
system for industrial, military, and medical applications.
1.5.2 Power Scaling Strategy for the 25-kW Fiber Laser EUV Driver
Although the single-beam continuous-wave fiber-laser has reached a power level
of several kWs, the fundamental limitation on the output powers are quite different
between continuous-wave (CW) and pulsed fiber lasers. For CW operation, the pri-
mary limitation was the nonlinearity of SBS (for narrow-linewidth output) and SRS

15
(for broader linewidth output). Other limitation includes the heat generation from
quantum defect and non-radiative recombination of the excited state of gain dopant.
The length of the CW fiber-lasers is usually a few tens-of-meters for complete ab-
sorption of the pump light and to maximize surface area required by an optimal heat
dissipation. However, for a high-peak-power pulsed-fiber-laser, the design strategy
is considerably different from that of the continuous-mode operation.
Since nonlinearity is the major limitation of peak power extraction, the length of
the gain fiber has to be as short as possible to minimize the nonlinear interaction
length. For the desired high energy and peak power extraction required for efficient
EUV generation the length of the active fiber is usually limited to 1-3 meters even
with the use of large-mode-area fibers.
Moreover, considering the the highest operational rate for a current target dis-
penser (∼ 100 kHz) and the energy per pulse from the fiber to several mJs, (due to
the limited extractable energy from a fiber laser and nonlinear effect), the highest
power that can be realized from a single fiber laser channel is of ≈ 500 W. Therefore,
a combining scheme is necessary to reach the laser power requirement of 25kW.
We proposed a high-power fiber-laser architecture utilizing two types of combin-
ing: spectral beam combining and spatial beam overlapping (Figure 1.2). The system
architecture can be divided into three layers:
1. The basic building block: a single-emitter fiber integrated module (SEFIM)
that can provide laser pulses with 1 to 10-ns durations, 6-mJ of energy and 500-W
of average power at a repetition rate of 83 kHz.
2. Spectrally combined modules (SCM) consist of ten SEFIM’s spectrally com-
bined modules (SCM) with wavelength-selective combining elements into one laser
beam with average power 5 kW.

16
Single-emitter fiber
integrated module (SEFIM)
0.48kW (80kHz, 6mJ, 6ns)
Spectrally combined
modules (SCM) 5kW
Spatially multiplexed
SCM blocks 25kW
λ1
λ2
λn
modules (SCM) 5kW
~500W
EUV
Figure 1.2: Power scaling strategy to reach required laser power for EUV generation. Spectral andspatial multiplexing enables fiber laser to reach the power level beyond that availablefrom a single channel emitter.
3. Spatial multiplexer: five SCM’s from different beam lines are focused on to
the same focal spot on either the same or the consequent targets. Up to 25 kW of
laser power will be available to the laser-produced plasma source. With ∼ 2% of
conversion efficiency, this laser power will give ∼ 500 W of in-band EUV power at
the plasma source.
Spectral combining multiplexes the laser beams of different wavelengths using
wavelength selective components such as diffraction gratings, volume Bragg grat-
ings, prisms, and multilayer dielectric thin-film filters. The challenge for spectral
combining is to provide a compact, robust and efficient scheme that can handle up
to hundreds mJ’s of nanosecond pulses and several kW of average power simultane-
ously on the combining elements.
For the spatial overlapping, it is a comparatively straight-forward type of multi-
plexing scheme (Figure 1.3). The major challenge on the spatial overlapping is to

17
maintain good control on the laser output pointing stability as well as the synchro-
nization of the laser focal spot and target both temporally and spatially. This type
of multiplexing in EUV generation was already demonstrated using two high-power
solid-state Nd:YAG lasers on the droplet targets by Richardson et al. [60].
5-kW fiber laser modules
Figure 1.3: Spatial multiplexing shows the relative position of the fiber laser beam, target and thecollector optics.
1.6 Chapter Overview
This dissertation is organized as follows: Chapter II is dedicated to the develop-
ment of SEFIM as the EUV driver as discussed in Section 1.5.2. The analysis on the
design requirements to reach the optimum intensity, given by the mode quality and
the peak power/energy of the laser, will be carried out in detail. The laser parame-
ters considering the limitations on nonlinearity and saturation will also be discussed.
The improvement of the system configuration including the implementation of the
arbitrary waveform generator (AWG) to control the pulse shape and arbitrary pre-
pulse can not only compensate the amplifier gain saturation, but also can provide
an instrumental tool for plasma the dynamics study. A record high peak power of 6
MW was achieved by seeding with a gain-switched 100-ps pulse from a Fabry-Perot
diode. A high energy of 6 mJ with a pulse duration of 6 ns, giving a peak power

18
of 1 MW, is generated with AWG preshaping. High average power up to 140W was
also achieved by actively cooling the fiber-end and packing the fiber in thermally
conductive materials.
Chapter III is devoted to two experiments of fiber-laser-produced-plasma (FLPP)
EUV generation. The first one is a proof-of-principle experimental demonstration
using a solid-Sn target. Prior to this experimental validation, EUV generation was
not believed to be possible using the fiber laser due to its relatively small extractable
energy. This demonstration is, to the best of our knowledge, the very first 13.5-
nm EUV generation using a fiber laser. We achieved ≈ 1% conversion efficiency
at a repetition rate of 50 Hz [61]. The conversion efficiency was limited by the
highest available on-target intensity of 1×10¹⁰W/cm2 at the time. Higher conversion
efficiencies can be expected with the improved laser intensity (Table 1.4). With
the improved mode quality and the peak power from the 80µm fiber amplifier, as
described in Chapter II, a higher intensity is achievable with a much smaller focusable
spot size. The use of solid-Sn target merely served the purpose for the validating
fiber laser as a suitable EUV driver. A realistic target with less debris generated and
compatibility of higher repetition rate is the only solution to a practical LPP source.
For this reason, the target-of-choice had changed to effectively-debris-free Sn-doped
water-droplet targets developed by the University of Central Florida, to demonstrate
a scalable and debris-free fiber-laser-driven EUV lithography source. With the help
of the pulse-shaping capability of the laser system, ≈ 2.1% of conversion efficiency is
demonstrated, resembling the CE demonstrated by the solid-state lasers with very
different laser parameters as detailed in Table 1.4. Conversion efficiency is also shown
to have a close dependence on the main pulse durations and prepulse parameters.
This successful demonstration of efficient EUV generation indicates that the fiber
19
laser is a feasible laser-driver-candidate for the next generation of lithography tools.
The concept of the SEFIM as described in Section 1.5.2 is also realized with the
successful demonstration of the efficient EUV generations.
Chapter IV of the dissertation describes a novel spectral combining scheme using
non-spatial dispersive combining elements. This proposed combining scheme uses
multilayer-dielectric filters as the beam-combining elements, giving no limitation on
the polarization state and the line width on the laser. This is beneficial for combining
fiber lasers with MW-level peak-powers, as required for efficient EUV generation.
An experimental demonstration with three fiber-laser channels showed an overall
combining efficiency > 92% at pulsed operation. 52 W of combined power is demon-
strated at a repetition rate of 100 kHz in the high average-power demonstration. 4mJ
of combined energies with a peak power ≈ 0.9 MW is achieved at a repetition rate of
1 kHz in the study of high-energy combining. This novel combining scheme enables
high-average-power spectral-combining and provides a feasible solution to a 25-kW
all-fiber-laser-based EUV source for the next generation of lithography steppers.

CHAPTER II
High-peak-power, high-average-power pulsed-fiber-laserEUV driver development
Aforementioned in Section 1.5.2, the basic building block of the fiber-laser-based
EUV source is the Single Emitter Fiber Integrated Module (SEFIM). In this chap-
ter, the design of the SEFIM for an efficient high power EUV generation will be
discussed, supplementing the experimental performances and also the numerical de-
sign parameters. We begin with the design requirement of the fiber laser system and
the selection of the core to reach the laser parameters for an efficient EUV generation
in the Section 2.1 and 2.2.
Section 2.3 to 2.7 will describe the details of the system design, system perfor-
mances, the nonlinear limitations on the peak power extraction, providing experi-
mental results and numerical simulations. A numerical analysis and the experimental
study on energy extraction, a thermal management design and the average power
optimization of the system will also be given. Using the record-high peak-power with
the diffraction-limited mode-quality, an experiment of atmospheric gas breakdown
will also be discussed briefly in Section 2.6.4.
20

21
2.1 EUV Fiber Laser Design Criteria
Over the years, Sn or Sn-composite targets have been demonstrated to be the
most efficient EUV target materials [2, 27, 28, 29, 30, 31, 32, 33]. Due to the dif-
ferences in laser parameters, target formation, focusing condition and experiment
apparatus, irradiation conditions (laser energy, pulse duration, intensity, focal spot
size on target) at which the highest conversion efficiencies are reached differ among
all experiments. However, for the optimal efficiency, a general trend exists for the
reported intensities to be in the range of 0.5 − 5 × 10¹¹W/cm2 and pulse durations
between 1.2 ns to 11.5 ns. Reported target spot sizes though have a much larger
range of variation from 17µm to 500µm.
Consequently, the first guideline of designing a fiber laser system for EUV genera-
tion study is to achieve these intensity with 1-10ns pulses. Since the energy available
from a nanosecond pulse fiber laser is limited, a sufficiently small focal spot size has
to be used. Furthermore, it is important to match the laser beam focus and the target
size to better utilize most of the target materials and to reduce the generated debris.
Due to the relatively smaller energy available from the fiber laser in the nanosecond
pulse duration, smaller focal spot size in the range of 20 - 30 µm become necessary
to reach the intensity. Therefore, simple calculation indicates that more than 1MW
peak power in 1-10ns pulses focused to 20 - 30 µm spot should produce the optimum
intensities. These spot size are compatible with existing Sn-droplet plasma sources.
Additionally, although efficient EUV generation is not much dependent on beam
quality, beams with M2 ≤ 2 are desirable in order to place the focusing optics at a
sufficient distance to mitigate laser-plasma debris contamination.
In addition to the requirement of the peak power and the mode quality of the laser

22
beam, finding an optimized condition for efficient EUV-generation within fiber-laser
parameter space requires controlling a wide range of pulse durations and energy
levels. A diode-seeded fiber laser amplifier provides the potential of the temporal
pulse-shape manipulation and the pre-pulses generation, providing a useful tool for
plasma dynamics study.
2.2 Fiber Core Size Selection
Choice of fiber core size is determinative to provide both sufficient mode quality
and peak power to reach the required intensity for efficient EUV generation. A larger-
core fiber in general provides more extractable energy due to its higher saturation
energy, however, at the expense of mode quality degradation. A good compromise
has to be balanced while choosing the core size in order to meet both peak power
and mode quality requirements. One way to increase peak power is to have higher
extractable energy which is limited by the saturation energy of the fiber. For Y b3+-
doped fiber, the saturation fluence is 0.66 µJ/µm2 at 1064 nm [62].
As shown in Figure 2.1, the saturation energy scales with the mode area and the
maximum extractable energy from an amplifier given by [63].
(2.1) Eavail = Esat × ln G0
where Esat is the saturation energy and G0 is the small signal gain. In order to
extract several mJs of energy, saturation energy should exceed 1-mJ, giving the
required mode field diameter larger than 44-µm (or a core diameter exceeding 58-
µm for step index fiber with 0.06-NA cores). It is also important to keep in mind
that amplifying beyond the saturation energy will come with a cost of pulse temporal
deformation and a significantly lower saturated gain due to the population inversion
draining in the gain medium (Section 2.6).

23
0
1
2
3
20 40 60 80 100
Core Diameter (μm)
Esa
t (mJ)
Saturation Energy Scaling
Figure 2.1: Scaling of saturation energy with fiber core size for a 0.06 core NA.
Another limitation of the peak power from a fiber laser is imposed by the bulk
damage threshold of fused silica, which for a given fluence scales as the inverse square
root of pulse duration. Taking the experimentally measured bulk damage threshold
of 800 J/cm2 for 6.2-ns pulses in the Y b3+-doped fiber [64], Figure 2.2 plots the
scaling of the peak-power-damage thresholds for three different pulse durations. The
core size sustainable of a 1-MW peak power at 5 ns has to be larger than 38-µm in
diameter. In practice, the fiber core size should be chosen to sustain at least twice
of the damage fluence in order to avoid catastrophic failure.
0
1
2
3
4
5
20 40 60 80 100
1 ns5 ns10 ns
Core Diameter (μm)
Pcr
it(MW
)
Bulk Damage Critical Peak Power using Fdamage=800 J/cm2 for 6.2-ns
Figure 2.2: Critical peak power for fused silica bulk damage threshold for different core sizes with0.06 core NA.

24
In addition to the peak power, the other requirement to reach the required inten-
sity is the mode quality of output laser beam. In large-core conventional fibers, the
achievable mode quality depends on the modal separation between the fundamental
mode and the next higher order mode supported in the fiber and is characterized
by the mode scattering coefficient. Detailed discussions will be given in Section 2.4.
Based on our experiences on different large-mode-area fibers with core diameters of
50 µm, 65 µm, 80 µm, 115 µm 140 µm and 200 µm [65, 66, 61, 34, 67], the core
diameters of the fiber that could be operating close to single transverse mode are in
between 50 and 80 µm, with proper care in preparation and operation. Considering
the above outlined analysis, the 80-µm core fiber appears to be the suitable choice
as the largest core with sufficient beam quality.
It is important to keep in mind that the above mode consideration only applies to
conventional step-index LMA fibers while development of novel fiber structure design
can provide effectively single-mode LMA output [59] and the mode quality will not
be limited by core size. The use of the conventional fiber is merely due to availability
and to explore the mode size required for such high peak power and energy.
2.3 Pulsed Fiber Laser System
This 80-µm-core fiber was used as the last stage amplifier in a four-stage Master
Oscillator Power Amplifier (MOPA) Yb-doped fiber experimental system (Figure
2.3). The system starts with an electric-pulse-driven Fabry-Perot semiconductor
laser diode emitting at 1064 nm. Such a scheme enables versatile selections of the
repetition rate, pulse duration and pulse shape.
The seed pulse is pre-amplified to peak power levels ≥ 1 kW by two stages of all
monolithic, single-mode, polarization maintaining fiber amplifiers, pumped with the

25
Computer-controlled AWG
RF Amp
AOM
50W Diode Laser @ 975nm
650W Diode Laser @ 915nm+975nm
BPFBPF
2.0-m 30-µm Yb PM-LMA DC fiber
Cooled 3.3-m 80-µm Yb LMA DC fiber
Output of Fiber-Laser EUV Driver
0.6W @974nm
0.6W @974nm
Pigtailed FP
Laser Diode
Figure 2.3: Configuration of our experimental high average power pulsed fiber laser system withFabry-Perot (FP) diode seed. Two stages of monolithic single-mode fiber amplifieramplify the seed to kilowatt peak power level. Further amplification by two stages oflarge mode area (LMA) power amplifiers generates >MW peak power of nanosecondpulses with excellent beam quality close to single transverse mode.
600-mW telecom-graded single-mode laser diodes at 974 nm. In order to amplify
the peak power beyond the level achievable by a standard single-mode fiber (Figure
2.4 (a)), it is necessary to use large-mode-area (LMA) fibers in the power amplifiers
(Figure 2.4(b)).
Comparison between standard and
LMA DC fibers
Figure 2.4: (a)Picture of a standard telecom-graded single mode fiber with a core diameter of 10µm and a cladding diameter of 125 µm (b) LMA fiber with a 30-µm core and hexagonal400-µm pump cladding. The picture also shows stress rods to preserve the polarizationproperties.
Two stages of free-space-coupled power amplifiers with the LMA fibers were used
for further amplification of he pulses to the MW peak powers. The first stage power

26
amplifier utilizes a fiber with 30-µm-diameter, 0.06-NA core and a pump cladding
with 250-µm diameter and 0.45 NA, with available pump power of 50 W. Single-mode
operation is achieved by coiling the fiber to a radius ∼ 4.25cm, giving a measured
mode quality of M2 ≈ 1.05.
The final amplifier stage is the 80-µm-diameter 0.06-NA-core fiber with a 400-µm
diameter, 0.46-NA inner pump cladding. The fiber is end-pumped by diode lasers
with a pump power of 650W by combining a 915-nm and a 974-nm laser diodes.
Regardless of a very large mode field area of 2749 µm2, the output beam quality
was optimized by fiber coiling and mode matching, permitting the best output beam
quality of M2 ≈ 1.3 [34].
In order to suppress CW ASE peaked at 1039 nm, the acoustic optic modulator
(AOM) with a minimum window size of 100ns was placed in between the preampli-
fiers, and two bandpass filters with 20-nm-FWHM bandwidth were implemented in
between the power amplifiers. The output ends of the power-amplifier fibers were
protected with short pieces of splice-on coreless fiber from peak-power surface dam-
age. The length of these protection pigtails is determined by the output beam quality
and the mode field diameter of the fundamental mode, giving the required length
≈ 4mm for the 30µm fiber and ≈ 6 mm for the 80µm fiber.
The second-stage power-amplifier fiber is packaged in a water-cooled heatsink
and a temperature-controlled end mount to ensure a good thermal dissipation and
pointing stability of the output beam, which will be discussed in Section 2.7.
The overall system performance is summarized in Table 2.1.

27
Stages 1 2 3 4
core Diameter (µm) 6 6 30 80
Cladding Diameter (µm) 125 125 250 400
length (m) 10 2 2 3.3
Polarization PM PM PM non-PM
Best Mode Quality SM SM M2 = 1.05 M2 = 1.3
Pump absoprtion 2 250 9 6(@975nm db/m)
Availabel Pump 0.6W 0.6W 50W 380 @975nm@976nm @976nm @ 976nm 220 @976nm
Energy Extraction using 2ns seed and 1.75kHz Repetition RateEnergy from FP diode = 0.6nJ per pulse
Energy @ 2ns 13.6nJ 422nJ 181 µJ 3.1 mJ
Corresponding Gain (dB) 13.5 dB 14.9 dB 26.3 dB 12.2 dB
Performance on Average Power with 100kHz Repetition Rate and 1-ns seedSeed power from FP diode = 61.6 µW
Average Power 1.377mW 28.9mW 6.30 W 140 W ∗
Corresponding Gain 13.5 dB 13.2 dB 23.4 dB 13.5 dB or 65% slope efficiency
∗Peak power here is limited by the degrading polymer coating.
Table 2.1: Summary of the system performance including the gain fiber characteristics and theoutput gain, mode quality, power characteristics

28
2.4 Mode Quality Optimization
Scaling the core sizes beyond single-mode fibers while maintaining close-to-diffraction-
limited mode qualities is of particular interest to many applications when both a high
peak power and a good beam quality are highly demanded. Peak power extraction
with a single-mode output are consummated by two distinct core-size-scaling strate-
gies.
The first one is to increase the core size beyond the single mode waveguide criteria
in the conventional index-guiding fibers governed by the normalized vector V< 2.405
where V = 2πλ×a×NA , a is the fiber core radius, and NA is the numerical aperture.
In this type of so called large-mode-area (LMA) fibers, single-mode operation can be
achieved by proper mode excitation condition [68] or by using fiber bending induced
higher-order-mode (HOM) suppression [69].
The other way to achieve single mode operation is to lower the NA in accordance
to the core size in order to meet the single mode criteria. Since fabrication process of
conventional modified chemical vapor deposition (MCVD) is limited to a ≈ 0.06NA,
the approach of a large-core low-NA structure can only be exclusively achieved by the
photonic crystal fiber (PCF) [70]. However, such an approach restricts the fiber from
bending for a core diameter greater than ≈ 40µm and also is fabricated in a stiff-rod
geometry. As a result, a large core PCF can only be operated in the laboratory
setup, greatly impeding its practical implementation to commercial products.
The practical advantage that conventional a step index LMA fiber has over PCF is
that it allows compact packaging by fiber coiling. Careful mode control can be done
to improve the mode quality to make the output beam close-to-diffraction-limited
even the normalized vector V does not meet the single mode criteria.

29
The change of the guided modes takes place in two main processes during guided-
wave propagation in a LMA fiber. The first process is the power exchange between
different modes caused by perturbations in a fiber core. The second and the more
important mechanism for modal control happens in a strongly bent fiber, in which
the leakage of the modes from a fiber core to the cladding through optical tunneling
(Figure 2.5).
Core
∆∆∆∆n
Cladding Cladding
R
∆∆∆∆n
CoreCladding Cladding
Straight fiber Bent fiber R
(a) (b)
Figure 2.5: Bending induced optical tunneling showing (a) the refractive index profile for a straightfiber and (b) the effective refractive index profile after conformal transformation dueto bending as seen by the optical wave propagating in the fiber, which allows opticaltunnelling of higher order modes into the cladding.
Optical tunneling happens at a curved interface between two dielectric media,
when the electromagnetic wave incident from the medium with higher refractive
index (n) at angles greater than the critical angle, it becomes only partially reflected.
This frustration of the total internal reflection is caused by the phase velocity of the
wave in the denser medium is lower than the phase velocity of the plane wave in
the less dense medium. Due to the curvature of the interface, these phase velocities
become equal at a tunneling distance from the interface
(2.2) γtunnel = ρ(sin αinc
sin αcrit
− 1)
where ρ is the radius of curvature of the interface, αinc is the incident angle from
the denser (larger n) medium, αcrit is the critical angle. Since optical wave can-
not propagate faster than the phase velocity in the medium, for all r > rtunnel, it
30
will acquire phase velocity component non parallel to the interface. As a result, for
0 < r < rtunnel, the wave in the second medium is evanescent and for r > rtunnel, is
propagating at the phase velocity of the light in the lower-index medium, i.e. the
wave will tunnel through the gap 0 < r < rtunnel. This optical tunneling process
through a curved interface in a bent waveguide can be equivalently described in
terms of tunneling through a dielectric barrier [71], which appears when representing
waveguide bend through conformal mapping as a refractive index slope as shown in
Figure 2.5. In other words, mode propagation in a bent fiber can be equivalently rep-
resented as mode propagation in a straight fiber, in which different path lengths seen
by light traveling around a bend of radius R at different transversal position x can be
accounted through the equivalent refractive index profile ηequivalent∼= ηstraight(1 + x
R)
An important result for a bent optical waveguide is that this curvature-induced
loss increases with the guided-mode order, thus providing with a convenient mode fil-
tering mechanism [69]. The mode quality improvement from coiling can be simulated
numerically by the model described in [72]. Modal scattering coefficient was assumed
to be the same for all modes and the magnitude of this coefficient is estimated from
experimental evidence. Mode control behavior was experimentally investigated in
the two fibers, an 115µm as shown in Figure 2.6 with 350µm octagonal cladding,
and a 80µm core fiber with 400µm octagonal cladding as shown in Figure 2.6.
In the case of 115µm fiber , the mode quality is improved from M2 ∼ 11 (loosely
coiled fiber with coiling diameter ≈ 14.5cm to M2 ∼ 5.5 with coiling radius ≈ 3.5cm
(Figure 2.7).
Hoverer, the mode quality improvement comes at the expense of the loss in the
transmitted power. In this case of 115-µm-core fiber , the transmission penalty is
≈ 50% at coiling radius of 3.5 cm. In the amplifier configuration, this transmission

31
115 μμμμm Core
0.07 NA
Cladding 350 μμμμm
0.46 NA
50 %
Doping
80 μμμμm Core
0.06 NA
Cladding 400 μμμμm
0.46 NA
(a) (b)
Figure 2.6: (a) LMA fiber with confined doping showing a 115-µm core and 50% confined doping.(b) The structure of the 80-µm fiber.
Figure 2.7: Measured M2 for 115-µm-core output. The two curves correspond to the two orthogonalpolarizations. Each data points is averaged over three sets M2 measurements.

32
penalty can be compensated by the gain. Nonetheless, in order to retain the amplifier
slope efficiency, only a limited loss can be tolerated. Hence, it is the transmission
loss penalty that determines the practical limit of the achievable beam quality from
a coiled large-core fiber.
In the 80-µm-core fiber, Figure 2.8 plots the two solid curves of the theoretical
predictions of mode quality with the highest and lowest scattering coefficient obtained
experimentally. It is also observed that there is a shift in the coiling radius in
experimental result compared to the theoretical prediction. This discrepancy of the
numerically prediction and experimental result was also observed in different core size
LMA fiber. One possible explanation for this mismatch is that in the experimental
setup, there is usually a certain length of the fiber at the input and output end that
is not coiled to the radius as the rest of the fiber. The inconsistency in the coiling
radius will effectively change the uniformity in the scattering process.
Indeed, all the efforts in the experiment were made to mode-match excitation
beam spot size to that of the fundamental mode at the fiber input and to minimize
excitation at the higher order modes. Experimentally, the mode quality for the 80-
µm-core fiber was improved from M2 ∼ 2.5 to M2 ∼ 1.3 from a loosely coiled fiber
to a coiling radius around 4.25 cm. The transmission of different coiling radius is
also plotted in bottom of Figure 2.8 which shows that transmission loss ≈ 50% at
the tighest coiling radius.
Again, one has to keep in mind that the all the rigorous efforts on mode quality
improvement in an LMA fiber will all become unnecessary with the introduction of
emerging fiber solution [59], in which technology an additional structure around the
core will serve as an effectively filters, causing additional loss to the higher order
modes.

33
1
2
3
4
0 0.05 0.10 0.15 0.20
M2
00.20.40.60.81.0
0 0.05 0.10 0.15 0.20
ExperimentMin. scattering (theory)Max scattering (theory)
coiling radius (m)
tran
smis
sion
Figure 2.8: Comparison between experimental results and theoretical prediction of the coiling effecton transmission and mode quality for the 80-µm-core fiber. Theoretical predictions useshighest and the lowest mode scattering coefficient attained experimentally as plotted inthe dotted curve (minimum scattering coefficient) and solid curve (maximum scatteringcoefficient)
0
100
200
300
400
500
600
700
800
-70 -60 -50 -40 -30 -20 -10 0 10
My
2=1.27
Position (mm)
1/e2 Radius (µm)
0
100
200
300
400
500
600
700
800
-70 -60 -50 -40 -30 -20 -10 0 10
Mx
2=1.25
Position (mm)
1/e2 Radius (µm)
Figure 2.9: Measured mode quality of the 80-µm-core fiber, coiled to radius around 5 cm.

34
2.5 Peak Power Extraction and Limitations due to Nonlinear Processes
Peak power and pulse energy extraction from the pulsed fiber laser systems had
been studied using both conventional LMA fibers [73, 74, 65, 66, 75, 34, 67, 76, 77]
and PCF fibers [78, 79, 80, 81, 82, 83]. With LMA fibers, Galvanauskas achieved
1MW with 1-ns pulses in a 50-µm-LMA fiber with a diffraction-limited output-beam,
and Cheng et al. [66] set a record high peak power of 2.4 MW using a multimode
200-µm core-fiber. With PCF large-mode fibers in a MOPA configuration, Teodoro
and Brooks demonstrated 1.5 MW at the pulse duration of 450 ps with a diffraction-
limited beam using a 1-m-long 40-µm-core PCF fiber, and 4.5 MW using a 140-µm-
core-LMA fiber with M2 ∼ 9 [80]. Their further work with 100-µm-core rod-like
PCF fiber ≈ 90 cm long improve the peak power to 4.5 MW, the highest peak power
to date from a PCF, using 1-ns pulses with near diffraction-limited beam of M2 ∼ 1.3
[82]. However, this rod-type PCF fiber can not be operated with any micro-bending
or macrobending, forsaking the most important advantages of the fiber lasers over
the solid-state lasers.
The main impeding factors on the peak power extraction from a fiber laser am-
plifier are the nonlinearities including stimulated Raman scattering (SRS), stimu-
lated Brillouin scattering (SBS), four-wave-mixing (FWM) and self-phase modula-
tion (SPM) and self-focusing [84]. Fiber lasers are comparatively more susceptible
to the nonlinear effects since the interaction length of the fiber laser is inherently
two orders of magnitude longer than that of ordinary solid-state lasers [85]. Un-
der different pulse parameters, i.e. pulse durations and bandwidth of the pulse, the
nonlinear process occurring first will be somehow different. For bandwidth-limited
pulses longer than 10 ns, SBS is the main limiting factor, and for pulses shorter

35
than 0.5 ns, SPM will more likely to induce large distortion of the spectrum [84]. For
brand-band pulses in ns-range, the major limiting factor is FWM, which will broaden
the spectrum by beating with the Raman noise [75, 86, 87]. In reality, STS is the
major limiting factor if FWM-spectral-broadening is acceptable in the application.
In addition, SRS is in strong effect in the same pulse-parameter region and strongly
transfers the energy from the signal to the Stokes wave, creating additional loss from
the signal wavelength. The Stokes components have a frequency down shifted by an
amount dictated by the vibrational modes of the medium. In the case of fused silica,
the Stokes wave is down shifted by ≈ 13.2THz (≈ 50.5nm) resulting a Stokes wave
centered ≈ 1115nm for a 1064-nm signal. This adverse nonlinear effect will shed the
energy from the amplified signal to the Raman Stokes, thus considerably loss the
power from the intended amplified wavelength.
Since the strength of the nonlinear effects are proportional to the peak power of
the signal and the interaction length, one important parameter characterizing the
magnitude of a nonlinear effect is the integration of the signal power over the length
of the fiber: the effective propagation distance, given by,
(2.3) Leff = [1− exp(−gL)]/g
where L is the fiber length, g is the amplifier gain, assumed to be constant along the
fiber. The SRS threshold is denoted as the power transferred to the Stokes equals
the power of remaining in the pump (Ps(L) = Pp(L)) and given by,
(2.4) P cr0 ≈ 16Aeff
LeffgR
where Aeff is the effective area, gR is the peak Raman gain, with a magnitude
≈ 1 × 10⁻¹³ at the pump wavelength of 1064 nm, and scales inversely at other
wavelength [84](note that the critical power is the input power of the amplifier).

36
Critical power for backward Raman scattering bears the same form as Equation 2.4
with the numerical factor 16 replaced by 20. However in practice, we had usually
experienced a SRS thresholds around two times higher than the peak power predicted
by Equation 2.4. We contributed this discrepancy to the approximation by Smith
[88] of a very long fiber, which become somehow invalid in our < 3 m long fiber
amplifiers.
It is obvious that one can increase the core size (with a possible trade off of
mode degradation) or decrease the length of the fiber (with a possible trade off of
less pump power absorption) to increase the Raman-limited peak power. Figure
2.10 plots the scaling of Raman threshold for a three meters long fiber with 20 dB
gain, it is shown that Raman threshold is ≈ 100kW for the 30µm and ≈ 0.7MW
for the 80-µm-core fiber. Note that the effective mode field areas for fibers with
step-index fiber of 0.06-NA cores used in the analysis is calculate by FiberCAD
Aeff = 0.375D2core + 3.95Dcore + 32.7 where Aeff is in µm2 and Dcore is the core
diameter in µm.
0
0.5
1.0
1.5
20 30 40 50 60 70 80 90 100
g(z)=g0× z
g(z)=g0
Core Diameter (µm)
Pcrit-Raman (MW)
Critical Peak power Scattering for G=20dB and 3 meters fiber
Figure 2.10: Scaling of the SRS as a function of the core diameter with a core NA of 0.06. Theexample shown here is for a 3-m fiber with 20-dB gain. Two curves plotted here areshown, with the solid one assuming a constant gain and the dashed curve assuming alinearly increasing gain, giving a higher SRS threshold.
37
In our fiber-laser EUV driver, the first two stages of preamplifier are telecom-
graded single mode amplifier with standard core size, it is important to choose the
fiber with length for adequate pump absorption but also minimized effective length
will be preferred for higher nonlinear threshold. This consideration was taken into
account when designing the EUV driver (Section 2.3), and a longer fiber of 10 m
was used in the first preamplifier, in which the amplified peak power is in the order
of 50W, to exploit the power gain (20dB in this stage). A shorter fiber of 2 meters
with a higher doping concentration is used in the second preamplifier to increase
the critical Raman power threshold. Also, counter-propagating pumping in the two
stages of the LMA power amplifiers is another effective way to shorten Leff , since the
gain increases while approaching the end of the fiber.when this pumping configuration
is used, yielding the integration of the signal power over the length of the gain fiber
smaller.
Another factor changes the Leff is the gain saturation. When the input fluence
is strong enough, the gain will saturate at the end the amplifier. Therefore, the
integration of the power over the length of the fiber in a saturated amplifier will be
larget than that in a unsaturated amplifier under that same condition, yielding a
longer Leff . It is important to keep this effect in mind when optimizing the peak
power extraction.
The evidence of SRS revealed in the output spectrum and also in the pulse tem-
poral measurement. Figure 2.11 shows the spectra of the output pulses at various
amplified peak powers. The example of SRS shown here is from the output of a
co-propagating-pumped, 4.2-m, 30-µm fiber, seeded with a 2-ns-squared pulse and
0.18-kW input peak power.
Due to the temporal deformation by saturated gain, the output peak power was
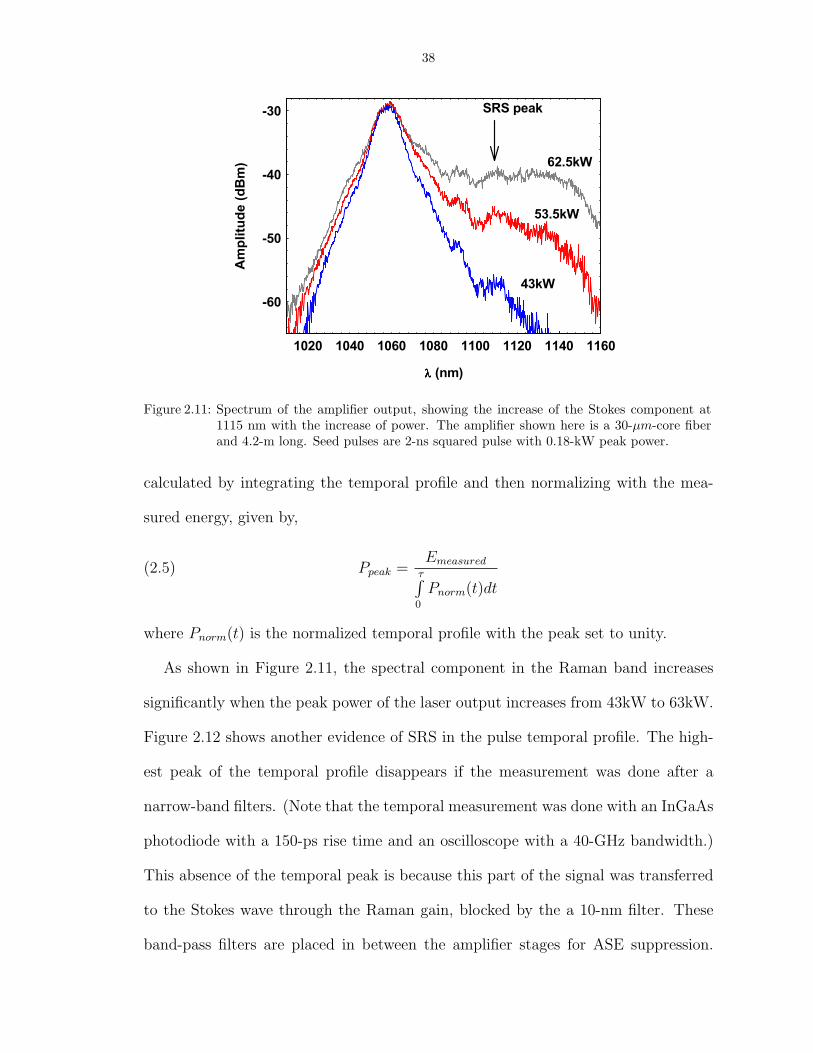
38
-60
-50
-40
-30
1020 1040 1060 1080 1100 1120 1140 1160
SRS peak
62.5kW
53.5kW
43kW
λλλλ (nm)
Amplitude (dBm)
Figure 2.11: Spectrum of the amplifier output, showing the increase of the Stokes component at1115 nm with the increase of power. The amplifier shown here is a 30-µm-core fiberand 4.2-m long. Seed pulses are 2-ns squared pulse with 0.18-kW peak power.
calculated by integrating the temporal profile and then normalizing with the mea-
sured energy, given by,
(2.5) Ppeak =Emeasured
τ∫0
Pnorm(t)dt
where Pnorm(t) is the normalized temporal profile with the peak set to unity.
As shown in Figure 2.11, the spectral component in the Raman band increases
significantly when the peak power of the laser output increases from 43kW to 63kW.
Figure 2.12 shows another evidence of SRS in the pulse temporal profile. The high-
est peak of the temporal profile disappears if the measurement was done after a
narrow-band filters. (Note that the temporal measurement was done with an InGaAs
photodiode with a 150-ps rise time and an oscilloscope with a 40-GHz bandwidth.)
This absence of the temporal peak is because this part of the signal was transferred
to the Stokes wave through the Raman gain, blocked by the a 10-nm filter. These
band-pass filters are placed in between the amplifier stages for ASE suppression.

39
This shedding of the power away from the signal will consequently impede the peak
power extraction.
0
0.1
0.2
6 7 8 9 10 11 12 13
Measures after 10nm bandpass filter
Measured directly after the amplifier output
ττττ (ns)
Normalized Amplitude (a.u.)
Figure 2.12: Another evidence of SRS observed in the temporal profile. Temporal profiles shownhere are measured after the 30-µm-core fiber output with a peak power of 65 kW. Thedifference of the two profiles shown here is due to a 10-nm band-pass filter (for ASEfiltering). The profile measured with the ASE filter shows a missing peak, due to theshedding of the signal power into SRS Stokes waves, which has spectral componentsout of the filter pass-band.
2.5.1 Self-focusing Limit on Peak Power Extraction
The ultimate limit of the peak power in a laser gain medium is imposed by self-
focusing damage. It is a Kerr nonlinear process with an intensity dependent refractive
index n = n0 + n2I [63] where n0 is the linear index (n0 = 1.45 for fused silica), n2
is the nonlinear refractive index and I is the intensity. The critical peak power for
self-focusing is expressed by,
(2.6) P sfcr = α
λ2
4πn0n2
where λ is the wavelength in free space, α is an constant independent of material
with a value of α = (1.22π2)/8 ≈ 1.8362.
40
In a bulk medium, when the peak power of the propagating pulse is greater than
P sfcr , refractive index distribution modified by the intensity profile (behaving as a
focusing lens) will overcome the beam diffraction and cause the beam to collapse, then
at some point, the peak intensity will exceed the material bulk-damage threshold,
resulting in catastrophic damage. However, the exact critical peak power in fiber laser
waveguide is mandated by the nonlinear refractive index in the fused silica, varying
from n2 = 1.0 ∼ 3.2 × 10⁻²⁰m2/W , depending on the experimental techniques to
extract the nonlinear n2 [89]. As a result, P sfcr can range from 3.5 MW to 11.3 MW
for 1064-nm pulses in fused silica. A thorough review on the measured n2 of silica
under different measurements for λ from 249 nm to 1550 nm can be found in [89].
Another factor that is associated with the value of n2 is its contributing effects:
Kerr and electrostrictive. The Kerr effect includes the electronic and Raman re-
sponse, giving n2(fast) = 2.1 ∼ 2.3 × 10⁻²⁰m2/W [90, 91]. The electrostrictive
contribution (n2(str)) is due to the change in the material density associated with
the presence of an intense electric field, and its value depends strongly on the dura-
tion and the intensity spectrum of the pump pulse. Several works [92, 93, 94, 90, 95]
investigated its magnitude and physical impact in an optical fiber. Buckland and
Boyd [92] introduced the fractional electrostrictive contribution, given by
(2.7) η ≡ n2(str)/n2(fast) = χ(str)/χ(3)
where χ(3) is the third order electrical susceptibility includes both electronic and
the Raman contributions. Their numerical analysis showed that the contribution
of n2(str) could be negligible for pulses shorter than 100ps, and η ∼ 0.2 for pulses
longer than 1 ns. We can see that the P sfcr is higher at short pulses (∼ 100ps) and
lower when the pulse duration is longer than 1 ns.
Several theoretical works studied the behavior of beam diameter change due to
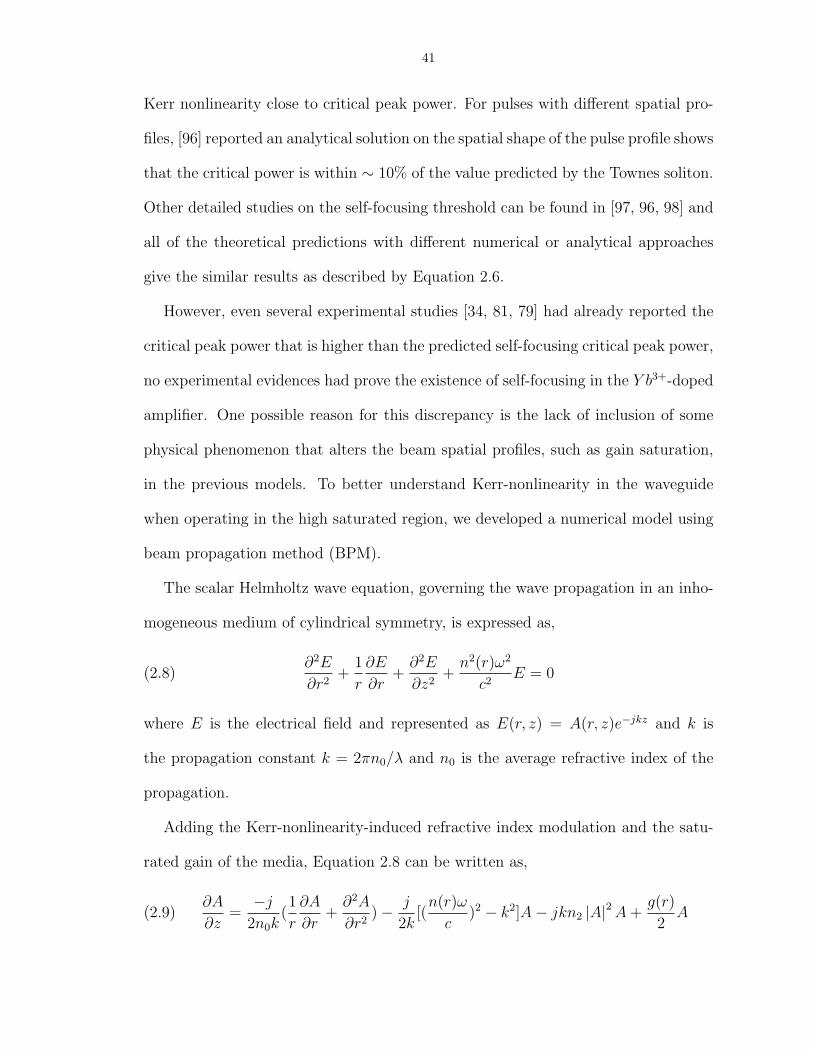
41
Kerr nonlinearity close to critical peak power. For pulses with different spatial pro-
files, [96] reported an analytical solution on the spatial shape of the pulse profile shows
that the critical power is within ∼ 10% of the value predicted by the Townes soliton.
Other detailed studies on the self-focusing threshold can be found in [97, 96, 98] and
all of the theoretical predictions with different numerical or analytical approaches
give the similar results as described by Equation 2.6.
However, even several experimental studies [34, 81, 79] had already reported the
critical peak power that is higher than the predicted self-focusing critical peak power,
no experimental evidences had prove the existence of self-focusing in the Y b3+-doped
amplifier. One possible reason for this discrepancy is the lack of inclusion of some
physical phenomenon that alters the beam spatial profiles, such as gain saturation,
in the previous models. To better understand Kerr-nonlinearity in the waveguide
when operating in the high saturated region, we developed a numerical model using
beam propagation method (BPM).
The scalar Helmholtz wave equation, governing the wave propagation in an inho-
mogeneous medium of cylindrical symmetry, is expressed as,
(2.8)∂2E
∂r2+
1
r
∂E
∂r+
∂2E
∂z2+
n2(r)ω2
c2E = 0
where E is the electrical field and represented as E(r, z) = A(r, z)e−jkz and k is
the propagation constant k = 2πn0/λ and n0 is the average refractive index of the
propagation.
Adding the Kerr-nonlinearity-induced refractive index modulation and the satu-
rated gain of the media, Equation 2.8 can be written as,
(2.9)∂A
∂z=
−j
2n0k(1
r
∂A
∂r+
∂2A
∂r2)− j
2k[(
n(r)ω
c)2 − k2]A− jkn2 |A|2 A +
g(r)
2A

42
where g(r) is the transversely dependent power gain, given by [63],
(2.10) g(r) =g0
1 + I(r)Isat
and Isat = ~ωστ
where Usat is the saturation fluence and τ is the pulse duration of the
signal.
By implementing the fast Fourier transform beam propagation method (FFT-
BPM), Equation can be treated as two actions of propagation over a very small ∆z
The first being the divergence of the beam in the medium is described as
(2.11)∂A
∂z=
−j
2n0k(1
r
∂A
∂r+
∂2A
∂r2)
the second being the modification of the phase front due to waveguide and Kerr
nonlinearity index modulation, as well as the saturated gain of the fiber,
(2.12)∂A
∂z= − j
2k[(
n(r)ω
c)2 − k2]A− jkn2 |A|2 A +
g(r)
2A
Following the nomalization detailed in [99], a numerical recipe implementing the
quasi-Hankel transform [100] and the end correction [101] provides a fast solution in
cylindrical coordinate to study the effect of saturated gain, and Kerr nonlinearity in
an cylindrical waveguide for the fundamental mode ( LP01 ).
First we simulate the propagation in a bulk medium (Figure 2.13). In order to
simulate the same spot size as in a fiber amplifier (60-µm mode field diameter beam),
we assumed a gain of 20dB over the Rayleigh range (3.85 mm for this beam size)
to prevent the beam from diverging due to diffraction. We assumed the input peak
power of 0.6 MW and the critical self-focusing power of 6 MW .
When the gain saturation is not included(Figure 2.13 (a)), the numerical result
showed that Kerr nonlinearity will overcome the diffraction and collapse the beam,
when the signal power amplified beyond the critical peak power. In a saturated-
gain medium, the beam waist starts to collapse at a remarkably higher peak power
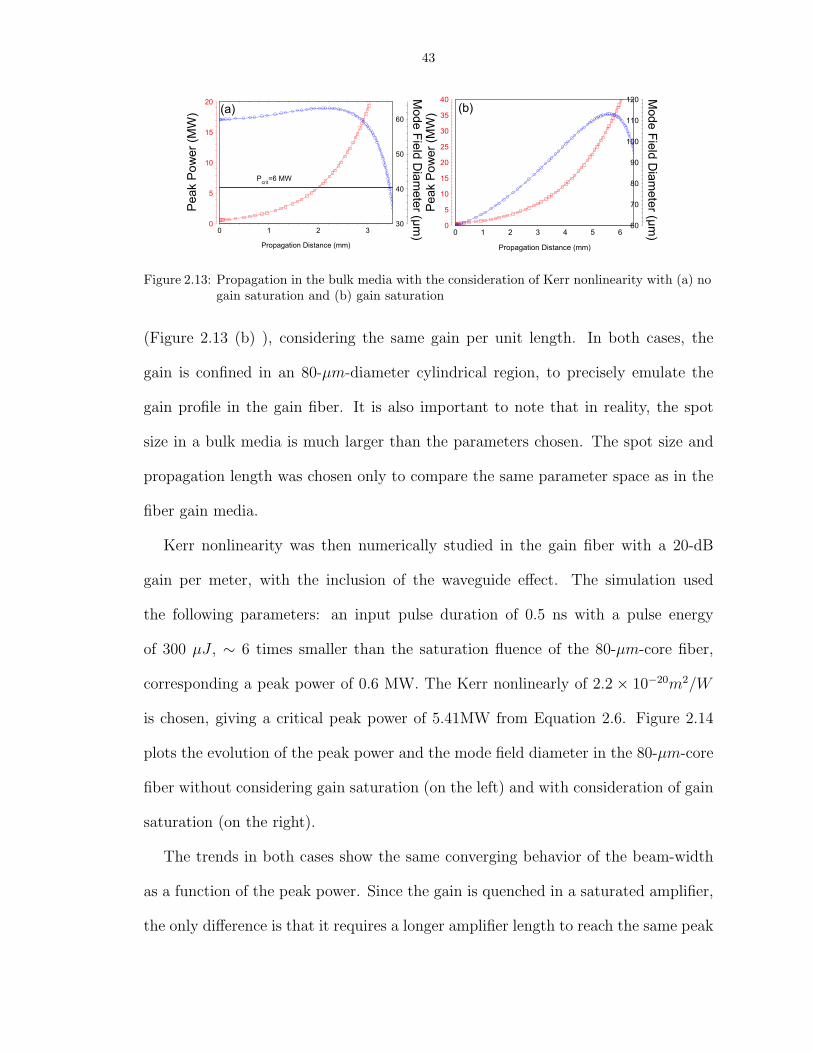
43
30
40
50
60
0 1 2 30
5
10
15
20
Pcrit=6 MW
Propagation Distance (mm)
60
70
80
90
100
110
120
0 1 2 3 4 5 60
5
10
15
20
25
30
35
40
Propagation Distance (mm)
(a) (b)
Peak Power (M
W)
Peak Power (M
W)
Mode Field Diameter (µ
m)
Mode Field Diameter (µ
m)
Figure 2.13: Propagation in the bulk media with the consideration of Kerr nonlinearity with (a) nogain saturation and (b) gain saturation
(Figure 2.13 (b) ), considering the same gain per unit length. In both cases, the
gain is confined in an 80-µm-diameter cylindrical region, to precisely emulate the
gain profile in the gain fiber. It is also important to note that in reality, the spot
size in a bulk media is much larger than the parameters chosen. The spot size and
propagation length was chosen only to compare the same parameter space as in the
fiber gain media.
Kerr nonlinearity was then numerically studied in the gain fiber with a 20-dB
gain per meter, with the inclusion of the waveguide effect. The simulation used
the following parameters: an input pulse duration of 0.5 ns with a pulse energy
of 300 µJ , ∼ 6 times smaller than the saturation fluence of the 80-µm-core fiber,
corresponding a peak power of 0.6 MW. The Kerr nonlinearly of 2.2 × 10⁻²⁰m2/W
is chosen, giving a critical peak power of 5.41MW from Equation 2.6. Figure 2.14
plots the evolution of the peak power and the mode field diameter in the 80-µm-core
fiber without considering gain saturation (on the left) and with consideration of gain
saturation (on the right).
The trends in both cases show the same converging behavior of the beam-width
as a function of the peak power. Since the gain is quenched in a saturated amplifier,
the only difference is that it requires a longer amplifier length to reach the same peak

44
50
55
60
65
3 0
3.5
4.0
4.5
5.0
er (M
W)
Mode Field 50
55
60
65
3 0
3.5
4.0
4.5
5.0
er (M
W)
Mode Field
25
30
35
40
45
0.5
1.0
1.5
2.0
2.5
3.0
Pea
k P
owe d D
iameter (μ
25
30
35
40
45
0 5
1.0
1.5
2.0
2.5
3.0
Pea
k P
owe d D
iameter (μ
200 50 100 150 200 250 300 350 400 450
0
0.5
Propagation Distance(mm)
μm) 20
25
0 100 200 300 400 500 600 700 8000
0.5
Propagation Distance (mm)
μm)
Figure 2.14: BPM simulation of the amplified signal in the waveguide with (a) no gain saturationand (b) gain saturation.
power in the saturated gain fiber as the energy is amplified close to the saturation
energy. One very important result followed from this numerical study is that the
beam-width of the fundamental mode start to decrease at the peak power of 1.5
MW, only 27 % of the critical peak power and the mode field diamter reduced to
half of the original when the peak power reaches 4.5MW, giving the same trend as
reported in Ref. [98] where FD-BPM was implemented.
In summary, from the FFT-BPM numerical analysis, it is clear that even with
the inclusion of gain-saturation-induced transversely-dependent-gain, i.e. a higher
gain on the wing of the Gaussian profile and a lower gain in the central peak, the
self-focusing effect due to Kerr-nonlinearity still presents when the beam is ampli-
fied toward the critical peak power in the waveguide configuration. However, no
experimental evidence on the change in the output beam divergence in the gain fiber
has been reported, even though the achieved peak power is very close [82], or even
beyond the critical self-focusing peak power [34]. The physical explanations for this
repeated discrepancy require further investigations.

45
2.6 Energy Extraction and Pulse Temporal Shaping
In a high energy pulse amplifier, one physical limitation on the pulse energy
extraction is the time varying gain saturation. In order to efficiently extract the
energy in the inverted gain medium during its passage through the amplifier, the
input pulse must be intense enough to cause significant saturation of the population
inversion. However, an efficient energy extraction of the amplifier will lead to a
sometimes undesirable result that the amplifier gain will be greatly reduced from its
initial value to a small residual gain during the passage of the pulse, referred as the
gain saturation.
Gain saturation can be visualized as the depletion of the excited states of the pop-
ulation inversion by the stimulated emission of the signal and one physical parameter
to characterize this mechanism in one amplifier is the saturation fluence,
(2.13) Jsat =hυs
(σes + σas)Γs
where hυs is the signal photon energy, σes, σas are the emission and absorption cross-
sections at the signal wavelength, and Γs is the signal overlap with the active dopant
[73].
Both the emission and absorption cross-sections of Y b3+ in SiO2 are wavelength
dependent and the spectroscopic properties were characterized by Paschotta and
coworkers [102]. One can also approximate the emission and absorption cross section
by approximating the Lorentzian line-shape for the absorption peak and emission
peak [103]. For Yb3+ in SiO2, the emission peak is centered at 1036 nm with the peak
emission cross section of σes(1036nm) = 0.55×10⁻²⁴m−3 and a spectral bandwidth of
∆υes = 50nm(FWHM). One absorption band is centered at 974 nm with the peak
absorption cross section of σas(974nm) = 3.5× 10⁻²⁴m−3 and a spectral bandwidth

46
of ∆υas = 8nm(FWHM). With the above parameters, the saturation fluence at
1064 nm is calculated to be ∼ 0.66µJ/µm2 using Equation 2.13. The saturation
energy is then given by,
(2.14) Esat = Jsat ×Adope
Γs
where Adope is the doped area, Γs is the signal overlap with the active dopant.
Table 2.2 listed the saturation energies for the LMA fibers of different core sizes
studied in the pulse energy extraction,
Core Size N.A. Doping Esat
6µm 0.11 Uniform 29.2 µJ
30µm 0.6 Uniform 322.5 µJ
50µm 0.6 Uniform 771 µJ
80µm 0.6 Uniform 1814 µJ
115µm 0.7 Confined (50%) 14.38 mJ
200µm 0.6 Confined (50%) 41.8 mJ
Table 2.2: Saturation energies for various fiber core sizes using the Equation 2.14
Two important physical limitations are associated with this amplifier saturation.
The first one is the deformation of the pulse temporal shape when an amplifier is
under the saturated-gain region and the second is the extractable energy. Temporal
pulse deformation, due to gain saturation, tends to provide more gain to the leading
edge of the pulse than to the rest of the pulse, according to the time-dependent
saturated-gain [63],
(2.15) G(t) = 1 + (G0 − 1) exp[−Jout(t)/Jsat]
where G0 is the small signal gain, Jsat is the saturation fluence, and Jout is accumu-
lated energy fluences from the starting time t0 in the passage of the pulse, defined

47
as
(2.16) Jout(t) ≡∫ t
t0
Iin(t)dt
where Iin(t) is the instantaneous intensity at the time t.
Figure 2.15 showed one example set of the pulse-shape deformation observed in the
two stages of the power amplifiers with a 10-ns squared-pulse input. The first power
0
0.2
0.4
0.6
0.8
1.0
0 5 10 15
80µm stage 30µm stage Pre-amplifier
τ (ns)
Norm
alized Peak Power (a.u.)
Figure 2.15: Temporal shaping due to gain saturation at the output of two power amplifiers. Theinput pulse energy after the preamplifier is 0.48 µJ with a 10.2-ns pulse duration.After the 30 µm stage, the output energy is amplified to 92 µJ with a pulse durationof 7.5 ns. Slight pulse shaping is observed even though the output energy is less than40% of the saturation energy for this fiber. The output energy of the 80-µm-coreamplifier is 2.1 mJ with pulse duration of 1.9 ns. Pulse shortening and reshaping ismore severe in this stage, since the output energy is higher than the saturation energyof this fiber.
amplifier (30-µm core) had an output energy of 92 µJ , approximately three times
lower than its saturation energy, and the output temporal profile already showed
moderate pulse reshaping. The second power amplifier (80-µm-core) has an output
energy of 2.1 mJ, slightly higher than the saturation energy(∼ 1.8mJ), inducing
a very strong deformation on the temporal shape (the solid curve in Figure 2.15).
Consequently, the FWHM pulse duration was shorten to ∼ 2 ns.
As a result, the implicit impediment of this pulse shortening is that once the lead-
ing edge of the pulse is amplified to the nonlinear critical peak power, the trigger of

48
the undesired nonlinear effect, as described in Section 2.5, will generate out-of-band
spectral components and deteriorate in-band energy extraction. However, many laser
applications require a specific temporal shape of the laser pulse, therefore, it is neces-
sary to preshape the seed pulse to compensate the gain-saturation-induced temporal-
shaping to provide a desirable temporal shape. In principle, with the Equation 2.15,
one can numerically predict the output pulse shape from an known input pulse with
a certain shape and energy, knowing the saturation energy (calculated from the mode
field diameter) and small signal gain (measured experimentally). Figures 2.16 and
2.17 show the predicted output shapes and energy with various input-pulse shapes,
using the parameters of the 80-µm-core fiber amplifier, i.e. a small signal gain of 20
dB and a saturation energy of 1.8 mJ.
Figure 2.16: Output pulse shape with a squared-shaped and triangular-shaped input pulse, bothhaving a pulse energy of 200 µJ . The same temporal duration of 20 ns is used forall temporal shapes for comparison. It is seen that the output pulse shape is largelydeformed for a rectangular input pulse, compared to the output with a triangularinput-pulse shape.
In order to compared the effect of the input-pulse shape on the output, the input
pulse energies are chosen to be 200 µJ and the temporal durations are fixed to
be 20 ns for all pulses. It is interesting to observe that the overall output energy
are the same (≈ 4.6 mJ) for all four input pulses even with very different input

49
Figure 2.17: Continuation of Figure 2.16 with a triangular shape, which resemble closely the inputpulse shape in the experiment. Another ideal exponential pulse shape is shown on theright.
shapes. Indeed, very different extent of deformations on the output pulse shapes is
resulted from different types of leading edge. The peak power varied as much as ≈7
times between the triangular-shaped input pulse and the pulse with an exponential
shape (Figure 2.17). These discrepancies in the peak powers certainly have different
strength of nonlinear effects, regardless of the same extracted energy. This numerical
analysis justified the need for active pulse to provide a slow rising edge to optimize
the extracted energy, with the peak power below the limit of nonlinearities.
The validation of this analysis is also confirmed by applying Equation 2.15 to
one set of experimental measurement. The numerically predicted and the measured
output pulse shape shows a very good agreement (Figure 2.18).
2.6.1 Active Pulse Shaping and Generation of Prepulses by an Arbitrary WaveformGenerator
One key parameter, other than the intensity, to optimize plasma generation is
the temporal shape of the pulse. It is believed that the plasma condition, which
is closely related to the overall EUV yield, is highly dependent on the temporal
shape of the laser pulse, however, no direct evidence can be found in previous works

50
0
0.2
0.4
0.6
0.8
1.0
0 5 10 15 20
Measured output Numerically symthesized output
τ (ns)
Norm
alized Amplitude (a.u.)
Figure 2.18: A good agreement between the calculated and measured output pulse shape from the80-µm-core fiber. The calculated output pulse is obtained by using the Equation 2.15and the measured energy and shape of the input pulse.
because of the absence of a temporal-shaping capability from solid-state lasers. In
order to explore the dependence of plasma dynamics on the laser temporal shape and
duration, we adapted a high-speed computer-interfaced digital arbitrary waveform
generator (AWG) to drive the seed diode. This AWG has a risetime of 200 ps and
a temporal resolution of 1 ns, providing a programmable seed pulse with a temporal
duration up to 4 ms. Its 12-bit vertical resolution provides an ample dynamic range,
enabling synthesis of high-contrast pulses.
In combination with a high-power large-bandwidth radio frequency (RF) ampli-
fier, spanning from 0.5 MHz to 1 GHz, and a current-doubling transformer, this
combination of driving circuitries generates electrical current ≥ 36 times the diode
threshold current, providing high-quality optical pulses with a good power dynamic
range. All the electrical driving circuitries were carefully designed to ensure a 3dB-
bandwidth larger than 1GHz, eliminating possible capacitive oscillations on the elec-
trical driving signal, as reported in Ref. [104]
51
Because of gain saturation in the power amplifiers, it is imperative to provide
a temporally-preshaped seed pulse to the amplifier system for the extraction of
temporal-shape-controlled high energy pulses. Adaptive-pulse-shape control was pre-
viously demonstrated to iteratively determine the shape of the input pulse required
for a specific output-pulse shape [104], using a feedback loop and an algorithm to
adjust the input seed pulse, in accordance to the measured output pulse shape.
We found that such adaptive control is elective. Indeed, if the small signal gain
and the saturation energy of an amplifier stage is accurately known, one can closely
relate every output pulse shape and energy to the corresponding pulse shape and
energy at the amplifier input, using the following formula [63],
(2.17) Iin(t) =Iout(t)
1 + (G0 − 1)exp[−∫ t
t0Iout(t)dt
Usat]
where Iin(t) is the input pulse power, Iout(t) is the output pulse power, G0 is the
small signal gain of the amplifier, t0 is the beginning of the pulse and Usat is the
saturation energy of the amplifier. Experimental verification of its accuracy is pre-
sented in 2.19, where a measured 5-mJ amplified pulse profile (dashed line) is shown
together with the corresponding measured input pulse profile (solid line), and the
reconstructed input pulse profile (marked line) calculated from the measured output
shape by using Equation 2.17. Good agreement between the measured and numer-
ically reconstructed input pulse shapes verifies this relatively simple but effective
means of predicting required input pulse shape for achieving a desired amplified
pulse shape. Note that in this example, the amplified pulse energy is ≈ 2.8 times
larger than the saturation energy of the amplifier, i.e. the amplifier is operated under
a strongly saturated-gain condition.
Furthermore, this approach for a single stage amplifier can be extended to enu-

52
0
0.5
1.0
1.5
0 5 10 15
Measure output temporal profileMeasure input temporal profileNumerically predicted input temporal profile
Time (ns)
Pow
er (a
.u.)
Figure 2.19: Example of numerically obtaining the input seed pulse including the effect of saturatedgain from an output pulse of known shape and energy. Input pulse shape can bedetermined by knowing the saturation energy and the small signal gain of the amplifier.The example shown here is for 5-mJ 1064-nm amplified output pulse from an 80-µm-core Yb-doped fiber.
merate the required seed pulse at the input of a multiple-stage fiber amplifier in
which all the saturation energies and the small signal gains are known for each stage
(together with the accurate knowledge of all the losses in various fiber-optic com-
ponents between the stages.) Figure 2.20(a) shows an example of the amplified
pulse shape at the output of the four-stage amplifier under consideration and Figure
2.20(b) shows the corresponding measured (solid line) and predicted (marked line)
seed pulses. Again, the good agreement on the measured and numerically predicted
seed-pulse shape validates the direct approach based on the Equation 2.17.
Another propitious property resulting from using an AWG is the ability to intro-
duce pre-pulses with programmable delays, controllable contrast and pulse durations.
Pre-pulses were reported to improve the EUV conversion efficiency by creating pre-
plasma, which is more effectively heated by the main irradiating laser pulse [32].
However, most of the previous works with pre-pulses use lasers of two different wave-
lengths for the pre-pulse and the main-pulse, typically spectrally combining lasers

53
0
0.05
0.10
0.15
0 2 4 6 8 10 12
(a) Amplified pulse after 80-μm fiber with 6-mJ and 6.2-ns FWHM
Time (ns)
Pow
er (a
.u.)
0
0.2
0.4
0.6
0.8
1.0
0 2 4 6 8 10 12 14
Input - numerically predictedInput - measured
(b)
Time (ns)
Nor
mal
ized
Pow
er (a
.u.)
Figure 2.20: (a) Temporal shaped of the amplified pulse after final stage of amplifier, showingreshaping due to gain saturation, (b) Pre-shaped pulse temporal profile from FP seeddiode and predicted pulse shape considering cascaded shaping effect for each stage ofamplifier
of 532nm and 1064nm at a low repetition rate [32, 105], or employing polarization
beam combining, along with variable optical delay lines [106]. Such approaches,
nonetheless, will increase the complexity and the cost of the system if pre-pulses
were necessary to achieve optimum conversion efficiency. Also, the control of the
delay and the contrast can only be mechanically adjusted and the amount of delay
is limited by the distance of the delay line.
Pre-pulses and main-pulse can be derived from a single laser emitter with our seed
driving scheme while having precise control on temporal parameters of both pulses.
Two examples of the temporal profiles of pre-pulses, with different delays and peak
power contrasts, are shown in Figure 2.21. The contrast ranged from 1:1.27 in (b)
to 1:11 in (a), and the delay between the pulses can be freely programmed. More
importantly, in the contempt of pre-pulses generation, energies in the main pulses still
remain close to ∼ 6mJ , the same as the highest energy obtained without prepulses.
The improvement of the EUV yield with the use of pre-pulses will be discussed later
in Section 3.7.2.

54
0
0.01
0.02
0 10 20 30 40 50 60
(b) 47-ns delay
Time (ns)
Pow
er (a
.u.)
0.02
0.06
0.10
0 20 40 60 80 100 120
(b) with 110ns delay
Time (ns)
Pow
er (a
.u.)
(a) 110-ns delay
Figure 2.21: Examples of amplified pulse with pre-pulses of different contrast and delay: (a) pre-pulse to main pulse ratio 1:10 with 5.74 mJ in the main pulse, (b) pre-pulse to mainpulse ratio 1:1.27 with 5.58 mJ in the main pulse.
2.6.2 Energy Extraction
In addition to saturate gain, another physical implication of the saturation energy
is associated with the maximum available energy from an amplifier. Assuming an
input pulse strong enough to completely saturate the initial inversion, the available
energy from an amplifier is given by [63],
(2.18) Eavailable = Esat × ln G0
This equation gives extractable energy from the 80-µm-core fiber is ≈ 8.29 mJ
with the measured G0 of 20 dB. To increase the energy extraction, one can optimize
the small signal gain of the amplifier or increase the saturation energy by increasing
the core size, or decrease the core-signal overlap. Another possible approach is to
engineer the doping profile of the core by, for example, confined doping (Figure 2.6),
or ring-doping [73].
To better understand the energy extraction, we applied Equation 2.17 to a trian-
gular pulse with varying small-signal-gain and saturation energy to study the differ-
ences in output energy and shape (Figure 2.22). The numerical analysis indicates

55
Figure 2.22: Investigation of pulse shape and output energy with an triangular input pulse varyinginput energy and the gain with the saturation energy 1.8 mJ. Obviously, high gain andhigh input energy are required for high energy extraction but at the expense of severepulse deformation and low overall gain.

56
that the energy extraction is independent of the pulse shape but only dependent
on the input energy and the small signal gain G0 for the same Esat assuming no
trigger of nonlinearity. In fact the energy extraction can be characterized by the
Frantz-Nodvick model [107]:
(2.19) Jout = Jsat logG0[exp(Jin/Jsat)− 1] + 1
where Jout and Jin are the output and input energy fluences.
We plotted the measured input and output energies at various pulse durations and
with various waveforms in Figure 2.23, comparing the Frantz-Nodvick predictions.
0
1
2
3
4
5
6
0 0.05 0.10 0.15 0.20 0.25 0.30 0.35 0.40 0.45
Frantz-Nodvick Model
Measured
Input Pulse Energy (mJ)
Output Pulse Energy (mJ)
Figure 2.23: Frantz-Nodvick (dashed curve) showing a good fit to the experimental data (solidbullets) for various pulse energies. It is interesting to note that even though the inputpulse shape for each measured data point is not identical but the extracted energy isonly dependent on the input energy as modeled by Frantz-Nodvick. The only marginaldifference at lower input pulse energy is due to squared seed pulses, being easier toamplify beyond the critical peak power of SRS. Therefore, further energy extractioninside the 1064-nm signal is impeded due to the trigger of nonlinear threshold.
The general trend for measured energy extraction as a function of input energies
showed good agreement with the trend predicted by the Frantz-Nodvick model. A
minor discrepancy occurs for input energies smaller than 0.2 mJ, where the amplifier
is seeded with squared input pulses. All the energies recorded are SRS limited
and Figure 2.23 clearly shows that the energies extracted using square-pulse input

57
0
1
2
3
4
5
6
0 1 2 3 4 5 60
1
2
3
4
5
6
7
Pulse Duration (ns)
Pea
k P
ower
(MW
)
Ene
rgy
(mJ)
Figure 2.24: Amplified peak power (round bullets) and energy (square bullets) at pulse durationsfrom 0.11 ns to 6.2 ns using the 80-µm-core fiber. A record high peak power close to6 MW is reached using 0.11 ns by gain-switching pulse. Longer pulse duration up to 6ns extracted 6 mJ of energy from the fiber, an energy that is more than three time ofthe saturation energy. All the amplified pulses measure here is limited by the triggerof Raman scattering. The laser is operated at a repetition rate of 50 Hz for the energyand peak power scaling study
are marginally lower than predicted by the Frantz-Nodvick model since the leading
edge of the pulse reaches SRS threshold quickly and transfers energy into Stokes
wavelengths. With the pulses generated by AWG, as shown in the last five measured
data points in Figure 2.23, the amplified energies coincides better with the prediction
from the model.
2.6.3 Energy and Peak Power Extraction Results from the 80-µm-core fiber
To summarize the peak power and the energy extraction results of the 80-µm-core
fiber from Section 2.5 to Section 2.6.2, Figure 2.24 plots the experimental results
of peak powers (round bullets) and energies (squared bullets) for pulse durations
between 110ps and 6ns.
Maximum peak powers were limited in this configuration by the onset of the stim-
ulated Raman scattering. Peak power close to 6 MW was obtained at the shortest
pulse duration of 110 ps by gain-switching the FP diode. This peak power, in fact, is

58
the highest peak power achieved from a pulsed-fiber amplifier to date. Peak powers
were all accurately determined using measured pulse shape and measured pulse en-
ergy. Some apparent discrepancy between peak powers and energies is simply relate
to the shape (different amount of energy in the pulse “tail”) of the different-duration
pulses. Despite very high peak powers for pulse durations under 1 ns, we have not
yet observed any core damage or change in the beam output divergence due to the
nonlinear Kerr effect as described in Section 2.5.1.
Pulse energy generally increases with pulse duration. Square pulses were used
for amplified pulse durations up to 1.7 ns, and pulse shaping by multiplexing two
squared-pulse drivers, or by an AWG were used to generated longer amplified pulses.
Arbitrary waveform generation can optimize energy extraction by tailoring output
pulses to alleviate nonlinear effects. Pulse shortening was observed for energies ex-
ceeding the saturation energy of ∼ 1.8 mJ for this fiber. Seeded with the slow-rising
leading edge shown in Figure 2.20(b), we can compensate the gain saturation effect
and produce a triangular pulse shape (Figure 2.20(a)) with energy up to 6 mJ per
pulse, more than three times of the saturation energy while maintaining ≈ MW peak
power. Although operated under saturated region, we are still able to retain a 13-dB
gain while extracting 72% of the available energy from the last stage amplifier.
Measured peak powers and pulse energies are consistently below the experimen-
tally measured fused silica bulk damage threshold data as reported in [108]. Table
2.3 compares measured energy fluences at different generated pulse durations from
the 80-µm-core LMA fiber amplifier and the corresponding estimated bulk damage
thresholds deduced from the data reported in [108]. Recorded energies are three to
five time below the bulk damage threshold of fused silica. Note also that potential
detrimental effects of modal-area reduction in bent LMA fibers [109] in the critical

59
high-peak power path sections were avoided by using counter-propagation between
the pump and signal beams in the high energy amplification stage and by leaving
sufficiently long leads at the amplifier output that is only loosely coiled (typically 20
to 40 cm long).
Pulse Peak Energy Fluence Bulk DamageDuration Power (MFD=60µm) threhold [108]
1ns 2.12 MW 97 J/cm2 330 J/cm2
0.7 ns 3.4 MW 84 J/cm2 273 J/cm2
0.48 ns 4 MW 68 J/cm2 226 J/cm2
0.11 ns 6 MW 23 J/cm2 108 J/cm2
Table 2.3: Energy fluencies at different generated pulse durations.
2.6.4 Air-breakdown Demonstration
As an additional, although an approximate experimental verification of achieved
peak powers, we produced laser-pulse induced atmospheric breakdown with focused
high peak power pulses. A particular interest of laser induced gaseous sparking is
motivated by laser ignition of engines of special types in which an electrical igniter is
a limitation, for example, large stationary gas engines used for power generation and
natural gas compression [110]. A focused intensity in the range ≈ 200GW/cm2 is
required to initiate the atmospheric breakdown, using ns-pulses [111]. This intensity
level is easily achievable by a solid-state laser, yet, none of the ns-pulsed fiber laser
to date had the capability to induce breakdown in the ambient air, since the output
beam are not able to focus down to such a high intensity.
Enabled by the record-high peak power and near-diffraction-limited beam quality
from the 80-µm-core amplifier, we conducted the air-breakdown experiments, for the
first time using a fiber laser to the best of our knowledge. The output beam of the

60
laser was first collimated by a set telescope and a focusing lens was ≈ 1 m from the
output of the laser, far enough to prevent any possible feedback from the plasma
which might possibly lead to the damage of the fiber core. An aspherical lens was
used to focus the collimated beam to a small focal spot size ∼17 µm, as measured by
the knife-edge technique with ±0.5 µm precision. Two pulse durations of 0.7 ns and
110 ps were tested for the pulse duration dependence on the breakdown threshold.
Both durations successfully initiated visible and audible breakdown (Figure 2.25).
Figure 2.25: A photograph of the atmospheric breakdown initiated by a fiber laser. This indirectlyverified the high peak power and the excellent mode quality from our LMA fiber, thatallows it to reach record-high intensity levels, demonstrating the first air breakdownby using a ns-pulsed fiber laser
The breakdown threshold, defined as the intensity level at which 50% of the laser
pulses induced air breakdown, was measured to be 510 GW/cm2 for 0.7-ns pulses
and 2.5 TW/cm2 for 0.11-ns pulses. The laser was operating at a repetition rate of
50 Hz, allowing us to manually, and precisely, determine the level of the breakdown
threshold.
2.7 Power Scaling and Thermal Management
Intrinsic quantum defect and non-radiative decay are two main contributing sources
of heat from a fiber laser [45]. Intrinsic quantum defect is the energy difference be-

61
tween the pump and the signal photons. Taking an example of a 1064-nm signal and a
915-nm pump, the quantum efficiency is 86%, meaing 14% of the energy will become
heat lost into the host medium through the nonradiative process. Also, in practice,
the quantum efficiency is less than λpump/λsignal, due to non-zero non-radiative decay
rate WNR, contributed from multi-phonon decay, ion-ion energy transfer, concentra-
tion quenching, diffusion, and cross-relaxation.
To have a high-average-power fiber laser with a short fiber length operating at
high thermal load per unit length, careful analysis and design must be considered to
remove the excess heat and to prevent thermal effects including the laser efficiency
degradation, thermal lensing, and the damage of the fiber. The rule of thumb for
the heat management is to keep fiber core temperature ∼ 162C, the temperature
corresponding to a 6% drop in the quantum efficiency, due to increase of multiphonon
relaxation [45]. Additionally, the polymer entire jacket must be kept below 50 C to
minimize the material degradation of the pump cladding.
To get a general idea how temperature is distributed transversely in the fiber, one
can think of the heat source as being located at the center of the core and the heat
being transferred from the core to the ambient environment through the mechanisms
of conduction (from the core to the cladding, and to the jacket) and convection
(from the jacket to the surroundings). Conduction happens in two contacting solid
materials, governed by
(2.20) Qcond = κA/L∆T
where κ is the thermal conductivity in W/mC, A is the contact area , L is the
material thickness, and ∆T is the temperature difference. The exchange of heat in

62
outer cladding and the ambiance is through convection,
(2.21) Qconv = hA(Tair − Tc)
where h is the heat convection coefficient
The radial dependence of the temperature in the fiber can be found by solving
the Fourier Equation in cylindrical coordinates over the fiber volume [45]:
(2.22) κT (r) +1
r
∂T (r)
∂r+ Q = 0
where Q is the heat dissipated per unit volume (in Watt/m3) and κ is the thermal
conductivity in W/m.
The boundary condition of the outer surface in contact with the external thermal
reservoir (water or atmospheric air) can be written as,
(2.23) κ∂T (r)
∂r s+ h(Ts − T0) = 0
where h is the convection heat transfer coefficient and Ts and T0 is the surface and
reservoir (water or air) temperature.
The solutions of for Equation 2.22 and 2.23 for the core, signal cladding and pump
cladding are [45]:
(2.24) T (r < Rc) = T0 +QRc
4κ1
(1− (r
Rc
)2) +QRc
2[1
κ1
ln(R1
Rc
) +1
κ2
ln(R2
R1
) +1
hR2
]
(2.25) T (Rc < r < R1) = T0 +QRc
2[1
κ1
ln(R1
r) +
1
κ2
ln(R2
R1
) +1
hR2
]
(2.26) T (R1 < r < R2) = T0 +QRc
2[1
κ2
ln(R2
r) +
1
hR2
]
where Rc, R1, and R2 are the radii, and κc, κ1, and κ1 are the thermal conductivities
and the subscripts of c, 1, 2 denotes to core, signal cladding (cladding) and pump

63
Radius (µm)
core 41
first cladding 200
Jacket 256
Thermal conductivity (W/mC)
Glass ( κ1, κ2 ) 1.38
Polymer ( κ3 ) 0.2
Copper 401
Aluminum 237
Thermal convection coefficient (W/m2 × C)
air @ 1 atm 1.38
water 105
Table 2.4: Important thermal coefficient for the system components used in the analysis and system
cladding (jacket) respectively. Table 2.4 summarizes the constant used in the thermal
analysis.
One can estimate thermal load per meter using the available pump power, the
pump coupling efficiency and the expected slope efficiency. Taking an example of
a 630-W available pump power with 74% pump coupling efficiency and 60% slope
efficiency, with a 3-m gain fiber, the average heat per unit length is ≈60 W/m,
assuming the heat is distributed equally over the entire length of the fiber.
In order to emphasize the importance of cooling arrangement in high-average-
power operation, Figure 2.26 plots the transverse temperature distribution under
the conditions when (a) the fiber is passively cooled in the air and (b) the fiber is
passively cooled in the water, both with an ambient temperature of 25 C. Without
any cooling, the jacket of the fiber can reach a temperature more than 790 C at
this heat density and cooling with water will lower that temperature to ∼ 40C.

64
Therefore, one has to implement force cooling in order to operate the fiber below the
temperature that will not cause degradation in efficiency.
790
795
800
805
810
815
820
0 50 100 150 200 250 300
Q=60 W/m
AirJacketCladdingCore
Transversal position (µm)
Temperature (°C
)
40
50
60
70
80
90
100
110
0 50 100 150 200 250 300
Q=60 W/m
Q=100 W/m
Water20°C
JacketCladdingCore
Transveral Position (µm)
Temperature (°C
)
(a) (b)
Figure 2.26: Thermal analysis showing the temperature distribution across the fiber for (a) passiveair cooling with 60 W/m of heat density and (b) passive water cooling with 60 and100 W/m heat density. It is discernible that temperature gradient is the highest inthe jacket, where the thermal conductivity is the lowest, consequently becoming thehighest thermal barrier across fiber. In addition, the passive air cooling will createa temperature discontinuity more than 760C from the jacket to the air, beyond themelting point of the polymer.
In reality while pumping from a single end, the heat load will be more intense at
the pump end than at the signal end. Moreover, another heat source comes from the
pump light that is not coupled into the fiber end, given the typical pump coupling
efficiency is ∼72% to 75%. The uncoupled pump light illuminating at the fiber
mount will increase the heat load on the end mount, unless it is ameliorated in two
ways. One is to introduce an aperture in between the lenses of the pump-coupling
telescope to block the outer ring of the pump light, the part not being coupled into
the fiber. The end mount surface facing the pump is also polished to increase the
surface scattering of the uncoupled pump light, otherwise contributing to the heat.
Heat dissipated along the uncoiled fiber is removed by a two-component TEC
cooler (Figure 2.27).
In the first 10 cm near the pump end of the fiber, where the highest heat removal
is required, forced cooling is implemented, using two solid-state heat-pumps (ther-

65
(a)
(a)(d)
(b)(c)
(a) Water-cooled tubed plate
(R=0.05 ºC/W)
(b) Thermal pad w/ К=1 W/mºC
(R=0.08 ºC/W)
(c) Fiber with Q~200W
(d) Copper base plate
(R=0.000415 ºC/W)
Signal
Input
Force-cooled pump
end ~12 cm using 2
TEC’s w/ heat capacity
of 67W /ea
Side
View
610W Pump Power
To heat exchanger
Figure 2.27: Heat removal arrangement on the left showing two cooling areas. The first 10 cm ofthe fiber at the pump end is actively cooled with two TEC’s, each with a 67 W ofheat capacity, with its temperature set to 15C. The rest of the fiber is packagedin thermally conductive materials, allowing temperature difference as small as ∆T =13C from the heat sink to the fiber jacket outer surface.
moelectric coolers or TECs), with a total of 134 W of cooling capacity. The TECs
are controlled with an active feedback-controlled current source, with the tempera-
ture set at ∼ 15C, higher than the dew point temperature to avoid condensation of
water vapor on the fiber.
Even water-cooling the fiber could provide sufficient cooling, there are technical
difficulties for implementation. Therefore, the remaining part of the fiber is carefully
packaged in tubed-plates as shown on the right of Figure 2.27. The tubed-plates
serve as a heat exchanger for the active fiber which was cooled by an external liquid
coolant exchanger. An analysis, using the thermal conductivities of each layer and
Equation 2.20, predicted that a thermal difference as small as ∆T = 13C across the
fiber jacket to water temperature can be achieve with this arrangement, assuming a
total of 200 W of heat is generated from the fiber. Compared to water cooling as
shown in Figure 2.26, where the temperature difference from jacket to the reservoir
is 26C, the arrangement shown in Figure 2.27 has a better thermal performance
presuming no air gaps are allowed during packaging.

66
The extraction of the average power is strongly related to the seed power. The
slope efficiencies of the amplifier as a function of seed power are plotted in Figure
2.28.
1.0
1.5
2.0
2.5
3.0
3.5
4.0
10 15 20 25 30
(a) 30 µm stage η=18 % (Pseed
=40.2 mW)
η=13 % (Pseed
=27.5 mW)
η=10.2 % (Pseed
=18.4mW)
Coupled Pump Power (W)
Output Power (W
)
0
10
20
30
40
50
60
70
80
0 50 100 150
(b) 80 µm stage
η=42% (Ps=2W)
η=50% (Ps=3.5W)
η=60% (Ps=4.9W)
Coupled Pump Power (W)
Output Power (W
)
Figure 2.28: Study of the required seed power for the optimal slope efficiency for the (a) 30-µm-corestage and (b) 80-µm-core stage. Both power amplifier stages showed an increase inslope efficiencies with increased seed power.
The slope efficiencies of the 30-µm-core stage are lower, in the range of 10 ∼ 18%,
due to seed powers limits on the order of tens of mW’s, which a much more efficient
extration can be achieved in the 80-µm-core stage, provided with a few Watts of seed
powers. Based on the above observations, it is essential to provide a sufficient seed
power to compensate the power lost due to coiling, as described in Section 2.4, and
also to have good extraction of the stored energies. The highest average power we
achieved is 140 W, operating at a repetition rate of 500 kHz, with 9W of seed power
(Figure 2.29). The output is limited due to the degradation of the polymer coating,
available from the fiber manufacturer.
With 630 W of available pump power, 72% coupling efficiency and 65% demon-
strated slope efficiency (Figure 2.29), average power ∼288 W can be expected with
improved polymer coating applied during the manufacturing process.

67
0
50
100
150
0 50 100 150 200 250
y = +0.641x1 -12.1, r2=0.996
Coupled Pump Power (W)
Pow
er O
ut (W
)
Figure 2.29: Power scaling of the system reached an average power of 140 W operating at therepetition rate of 500 kHz with a seed power of 7.3 W, yielding a slope efficiencyof 64.1%. Power is so far limited by the degradation of the polymer coating. Withcoating with lower heat-induced degradation, average power up to 288 W is expectedwith available pump power.
2.8 Conclusion
A pulsed fiber-laser driver producing high peak powers, high energies, high beam
quality, and controllable pulse parameters is developed to the study EUV generation.
Careful selection of the core enables megawatt-level peak powers in nanosecond-pulse-
duration region while maintaining a mode quality close to that of a single-transverse-
mode. A record-high peak power close to 6 MW using 110-ps gain-switched pulses
is reported and > 6 mJ pulse energies with 6-ns durations, giving > 1 MW peak
power, is also achieved. Regardless of the large mode area of 2750 µm2, scrupulous
mode-matching and tight fiber-coiling provide an excellent mode quality of M2 ≈ 1.3.
A numerical simulation adapting the FFT-BPM technique to study of the Kerr-
nonlinear-effect implies that a change in the divergence of the beam will occur even
at peak powers a few times lower than the critical peak power for self-focusing.
However, no experimental evidence is reported to date though peak powers close
to the self-focusing limit with diffraction-limited beams have already been reported

68
by several groups. Adapting an arbitrary-waveform-generator seeder enables active
pulse temporal-shaping including the generation of pre-pulses under the saturated
gain region of the cascaded fiber amplifiers. This instrumental tool allows us to
study the pulse shaping that occurs during the passage of the pulse in a saturated
amplifier. The experimental results coincided well the numerical results predicted
from the Frantz-Nodvick model.
High average-power extraction while maintaining MW peak powers at the same
time requires very high thermal-dissipation per unit length, since the fiber length has
to be kept short to avoid nonlinearity. Forced-cooling, implementing both the solid-
state heat pumps and the water-cooled heat exchangers, is designed and analyzed
numerically. An average power up to 140 W is measured at the laser output with this
cooling arrangement and further power scaling is possible to hundreds of watts by
increasing the repetition rate of the system and the pump power. Conclusively, the
SEFIM can provide a peak power and a mode quality to reach the required intensity,
along with the average power, providing the parameters needed for a high-power
EUV source. Still, experimental verifications on the targets need to be investigated,
as will be described in the chapter III.

CHAPTER III
Feasibility Study of High Power Fiber-laser-driven EUVGeneration
This chapter describes two feasibility experiments for fiber-laser driven EUV gen-
eration. Section 3.1 provides background information on laser EUV generation. The
subsequent sections 3.2 to 3.4 describes experiments in which the fiber laser system
irradiates a bulk solid-Sn target operating and this experiment demonstrates the first
EUV generation by a fiber laser.
Sections 3.5 to 3.7.3 describes the second experiment, performed in collaboration
with the University of Central Florida. In this experiment, a droplet target capable
of high-repetition rate operation is fired at a rate of 1.75 kHz. The purpose of
this experiment was to demonstrate high-efficiency EUV generation using a power-
scalable and low-debris target, required for a production-worthy EUV source.
3.1 Introduction for laser-produced plasma EUV generation
For years, researchers have been searching for a suitable source for next-generation
lithography. Due to the limited working wavelength of multilayer reflective optics
in the EUV region (13.5 nm for Mo/Si mirrors), it is necessary to find an efficient
light source producing strong emission in the reflection bandwidth of available optics.
Nd:YAG lasers at Joule-level energies have been the preferred lasers for generating
69

70
13.5-nm EUV [2, 27, 28, 29, 30, 31, 32, 33]. Studies of efficiency versus pulse duration
for these lasers have been conducted [112, 113, 31], generally finding that nanosecond
range pulses yield the best results of a ∼ 2% conversion efficiency (Table 1.4). Pulsed
CO2 lasers have also received much attention lately due to their relatively high
efficiencies of approximately 4.5% [30, 114]. With average powers around ≈ 5 kW
[24, 114, 115], CO2 lasers show much promise for EUV generation. However, they
suffer from a low wall-plug efficiency (a few percent), resulting in higher operational
costs. In addition, there are thermal dissipation issues that need to be resolved.
Various targets have been researched for EUV generation. These include high-
density solid targets (tin or frozen xenon), liquid jets (tin or xenon) [116, 117], and
droplets (tin, tin-doped water, or pure water) [114, 113, 118], quasi-mass limited
(thin layer) [119, 120, 32], laser punch-out [121, 122]. Water targets were studied
as one of the earliest target source in the form of liquid jet, liquid droplet, and
solid [1] and attracted many attentions in the early years due to it low cost and low
contaminaiton on collector optics. However, lack of strong emission line in the Mo-Si
reflection band (Section 1.3.1) limits its applicability as an efficient source material
[123]. Only up to 0.4% of conversion efficiency can be realized even after shifting the
central wavelength of Mo-Si mirrors from 13.5 nm to 13 nm.
Lithium has a very sharp emission line at 13.5 nm and is regarded as one of the
most efficient EUV sources [124, 116, 27]. Conversion efficiencies of up to 2.2% from
a planar solid lithium target has been demonstrated by George et al. [27] with a laser
intensity of 6.6×10¹⁰W/cm2. However, its demonstrated efficiency is still lower than
that of solid-tin (≈ 4.5%) and debris issue from a solid lithium target still prevents
it from being used for the lithography light source.
Xenon (Z=54), usually in liquid jet form, is one of the most commonly used EUV

71
source materials due to its being a clean LPP source [125, 117, 126, 25]. The main
drawback of Xe is the lack of efficiency, limited to about 0.8% at present [25]. This
is because Xe has a much stronger unresolved transition arrays (UTA) located at 11
nm (with emissions from states Xe+6 to Xe+14) with a less efficient emission band
at 13.5 nm (Xe+10).
Tin (Z=50), another very commonly used source for EUV generation, has nearly
all species from Sn+7 to Sn+14 contributing to the in-band emission at the optimum
plasma temperature (∼ 30eV ). Efficiencies of up to 5% have been reported using
solid tin targets [2, 27].
UTA in tin arise primarily due to the transitions of 4p64dN → 4p54dN+1 +
4p64dN−14f from Sn8+ to Sn11+ overlapping in energy [127]. The mechanism cou-
pling the laser energy to the plasma is inverse Bremsstrahlung absorption [5], in which
the electrons oscillate in the presence of the laser’s electric field and collide with the
ions to which the photon energy is transferred. The atomic processes in a hot plasma
are quite complex, and in the simplest terms, radiation emitted from the relaxation
of these highly ionized materials comes from two processes: free-electron-ion interac-
tion and bound-bound transition of the ions. Bremsstrahlung from free-electron-ion
interaction occurs when the passing electron is accelerated by an ion, causing it to
radiate a broad continuum, with the spectrum closely related to the electron veloc-
ity. The process of bound-bound transitions of the ions in different ionization states
yields very narrow emission lines.
The critical parameters for the radiation, which are the electron temperature
and density, are determined by the target material and laser parameters. Rigorous
simulations with hydrodynamics codes show that the highest electron temperature
is in the region where the electron density is below the critical density at which the
72
driving laser light resonates with the plasma [2].
3.2 First Demonstration of Fiber-laser-driven EUV Generation with Solid-Sn Target
Even though EUV had been generated for few decades with synchrotron source,
electrical-pinched plasma and laser-produced plasma, EUV generation from a fiber-
laser produced plasma (FLPP) was not thought possible due to its lower achiev-
able pulse energy and intensity in the ns-pulse duration. Therefore the principle
motivation of this study is to demonstrate the generation of EUV exploiting the
state-of-the-art ns-fiber laser system.
3.2.1 Laser Parameters for Solid-tin Experiment
In this set of experiments, the output from a fiber laser, with either a 115 µm
or 200 µm core power amplifier, is focused onto a solid-Sn target. The complete
set of parameters are shown in Table 3.1. Since no seed pulse pre-shaping was
implemented at the time, the square pulse exhibited strong deformation. Therefore,
the peak power must be calculated using Equation 2.5.
3.3 Experimental Setup for Solid-Sn EUV Generation
The output beam of the fiber laser is delivered to the target chamber through
two sets of telescopes to control the beam divergence. 70% of the laser energy is
transported from the output onto the target due to clipping losses in beam delievery
and the uncoated chamber window and focusing lens. The EUV target chamber is
shown in Figure 3.1.
The laser beam was expanded and collimated by a telescope before the entrance
port of the vacuum chamber with a 1/e2 beam diameter of ≈ 17mm on the focusing
lens. The focusing lens was a 50 mm (f/2) achromatic lens which gives an effective

73
Fiber type 115/350 µm 200/600 µmcore/cladding diameter
Amplified Energy 3.5 mJ 6 mJ@fiber output
Seed pulse duration 12.5 ns 100 ns
Amplified pulse duration 5 ns 6 ns(FWHM)
Peak power 700 kW 514 kW(by integration)
M2 10.5 17
Smallest Spot size on target 48 µm× 75 µm 61 µm× 77 µm1/e2 in diameter
Highest intensity on target 1.2× 10¹⁰W/cm2 6.5× 10⁹W/cm2
(accounting to 30% loss in delivery)
Repetition rate 50 Hz 50 Hz
Table 3.1: Summary of laser parameters used in solid-Sn target experiments
f/2 lens
Bulk Sn target
Target
manipulator150nm
Zr filter
Grating
MCPCamera
6nm
30nm
EUV
photodiode
Figure 3.1: EUV-generation setup using solid-Sn target. The target is located in the center of thechamber and controlled by a mechanical target manipulator. The focusing lens usedis a 50-mm achromatic lens with a 1-inch aperture. Diagnostics tools consists of acustom-designed EUV detector, mounted along the normal of the solid-Sn target. EUVspectrometer is also set up to monitor dispersed EUV emission from 6 nm to 30 nm.
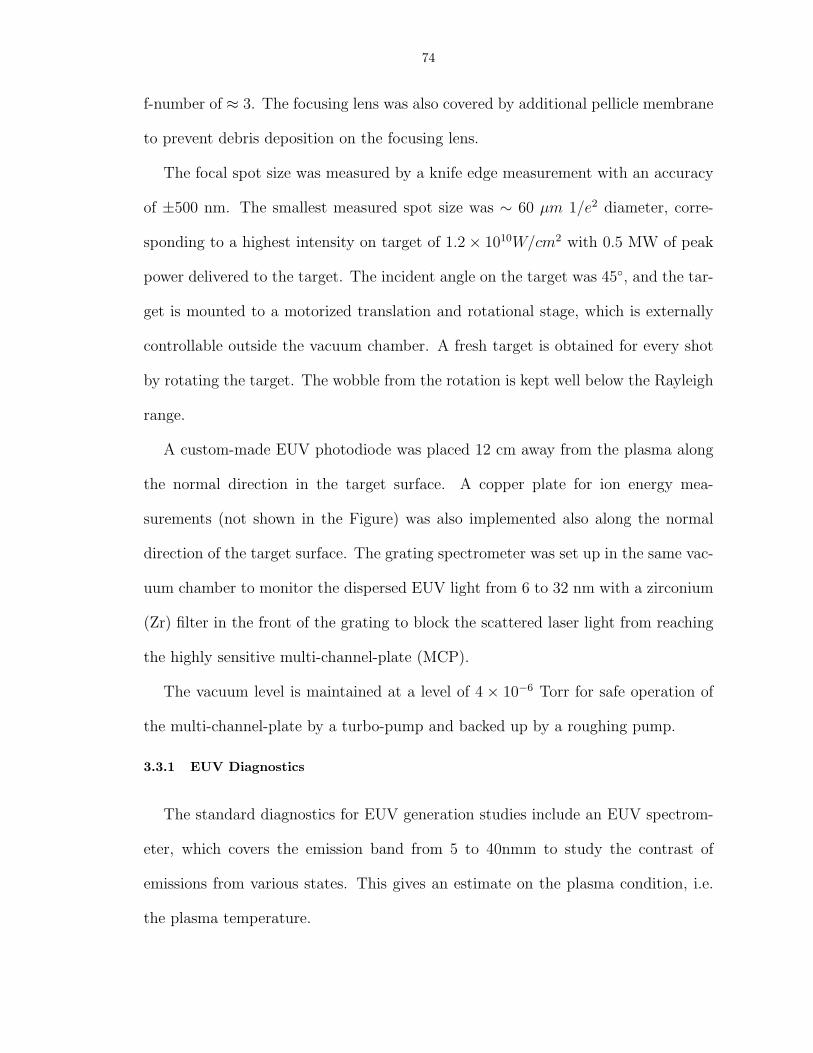
74
f-number of ≈ 3. The focusing lens was also covered by additional pellicle membrane
to prevent debris deposition on the focusing lens.
The focal spot size was measured by a knife edge measurement with an accuracy
of ±500 nm. The smallest measured spot size was ∼ 60 µm 1/e2 diameter, corre-
sponding to a highest intensity on target of 1.2× 10¹⁰W/cm2 with 0.5 MW of peak
power delivered to the target. The incident angle on the target was 45, and the tar-
get is mounted to a motorized translation and rotational stage, which is externally
controllable outside the vacuum chamber. A fresh target is obtained for every shot
by rotating the target. The wobble from the rotation is kept well below the Rayleigh
range.
A custom-made EUV photodiode was placed 12 cm away from the plasma along
the normal direction in the target surface. A copper plate for ion energy mea-
surements (not shown in the Figure) was also implemented also along the normal
direction of the target surface. The grating spectrometer was set up in the same vac-
uum chamber to monitor the dispersed EUV light from 6 to 32 nm with a zirconium
(Zr) filter in the front of the grating to block the scattered laser light from reaching
the highly sensitive multi-channel-plate (MCP).
The vacuum level is maintained at a level of 4 × 10⁻⁶ Torr for safe operation of
the multi-channel-plate by a turbo-pump and backed up by a roughing pump.
3.3.1 EUV Diagnostics
The standard diagnostics for EUV generation studies include an EUV spectrom-
eter, which covers the emission band from 5 to 40nmm to study the contrast of
emissions from various states. This gives an estimate on the plasma condition, i.e.
the plasma temperature.
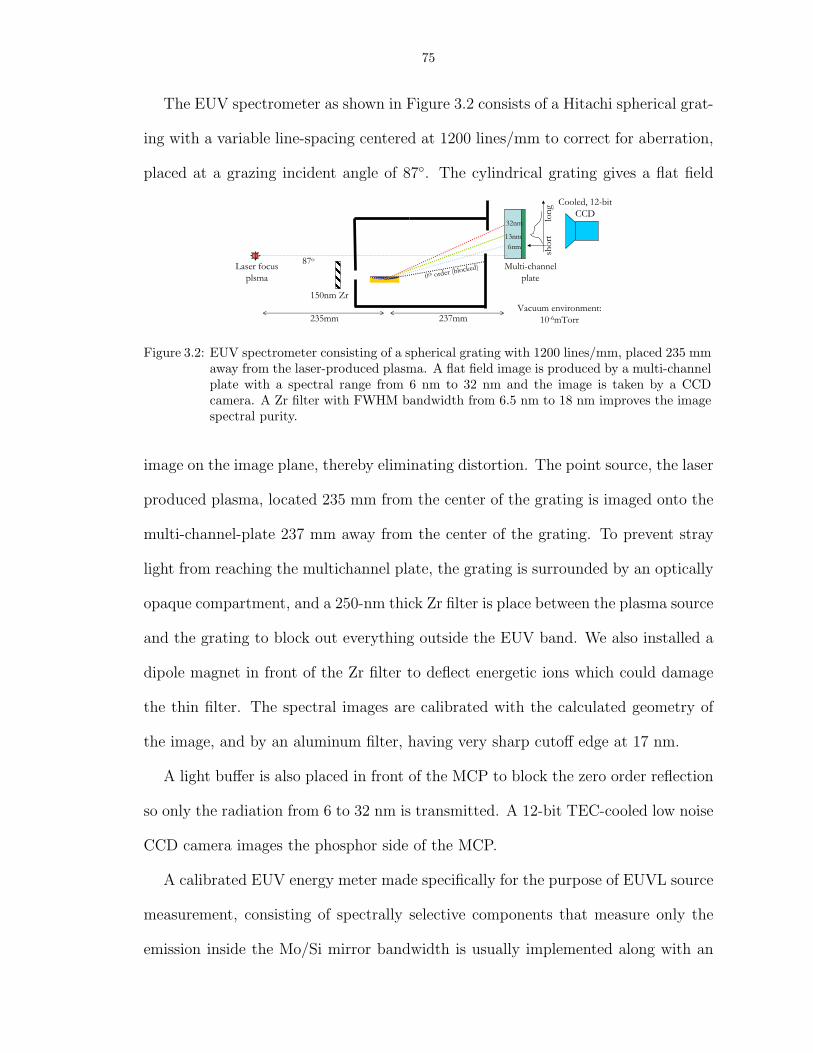
75
The EUV spectrometer as shown in Figure 3.2 consists of a Hitachi spherical grat-
ing with a variable line-spacing centered at 1200 lines/mm to correct for aberration,
placed at a grazing incident angle of 87. The cylindrical grating gives a flat field
Laser focus
plsma
Cooled, 12-bit
CCD
150nm Zr
235mm 237mm
Multi-channel
plate
short
long
87o
0th order (block
ed)
6nm
13nm
32nm
Vacuum environment:
10-6mTorr
Figure 3.2: EUV spectrometer consisting of a spherical grating with 1200 lines/mm, placed 235 mmaway from the laser-produced plasma. A flat field image is produced by a multi-channelplate with a spectral range from 6 nm to 32 nm and the image is taken by a CCDcamera. A Zr filter with FWHM bandwidth from 6.5 nm to 18 nm improves the imagespectral purity.
image on the image plane, thereby eliminating distortion. The point source, the laser
produced plasma, located 235 mm from the center of the grating is imaged onto the
multi-channel-plate 237 mm away from the center of the grating. To prevent stray
light from reaching the multichannel plate, the grating is surrounded by an optically
opaque compartment, and a 250-nm thick Zr filter is place between the plasma source
and the grating to block out everything outside the EUV band. We also installed a
dipole magnet in front of the Zr filter to deflect energetic ions which could damage
the thin filter. The spectral images are calibrated with the calculated geometry of
the image, and by an aluminum filter, having very sharp cutoff edge at 17 nm.
A light buffer is also placed in front of the MCP to block the zero order reflection
so only the radiation from 6 to 32 nm is transmitted. A 12-bit TEC-cooled low noise
CCD camera images the phosphor side of the MCP.
A calibrated EUV energy meter made specifically for the purpose of EUVL source
measurement, consisting of spectrally selective components that measure only the
emission inside the Mo/Si mirror bandwidth is usually implemented along with an

76
EUV spectrometer to measure the efficiency. Details the setup of both diagnostics
will be discussed. The custom-made EUV detector sit in an aluminum housing is
shown in Figure 3.3.
Hamamatsu
G1127-02
photodiode
21mm2
Mo/Si 45o
Mirror
Zr filter
Amplifier
EUV light
Figure 3.3: Custom designed EUV detector to measure the emission only in the working wavelengthof Mo/Si mirrors. It consists of a Mo/Si mirror and a Zr filter for spectral selection. Alarge area photodiode, in which the signal is amplified by a transimpedance amplifier,detects the EUV emissions.
A 45 Mo-Si multilayer mirror with a 4% bandwidth is used to reflect the EUV
emission from the plasma. Since the Mo-Si mirror is highly reflective for UV/VIS/IR,
another 150 nm thick Zr filter is used to block the radiation outside the EUV band.
The 4% inband emission centered at 13.5 nm is then detected by a Hamamatsu
G1127-02 photodiode.
This Schottky diode originally intended for blue-UV detection possesses high
quantum efficiency (about 10 electrons per photon) in the EUV wavelength. To
improve the diode sensitivity, a transimpedance amplifier is mounted inside the cas-
ing. The diode has an area of detection of 21 mm2 and has a long rise time of 300
ns.

77
3.4 Experiment result using solid Sn target
The image of the MCP and the corresponding spectrum for the best EUV yield
are shown in Figure 3.4. The top image is the MCP, with the arrows indicating
Mo/Si reflection
band
34nm22nm13.5nm10nm
Figure 3.4: EUV spectrum from the solid-Sn target showing a strip of the MCP image on the topwith calibrated markers and the corresponding spectrum plotted from 6 nm to 22 nm onthe bottom. Gray shadow indicates the narrow bandwidth of Mo/Si multilayer mirrors.
the calibrated spectral markers. The corresponding spectrum is shown below. The
emitted spectrum has a broad peak around 13.5 nm. The Mo/Si reflection band is
shown in the shaded area.
Compared to the published literature [27], our spectrum shows similar spectral
features with a lower contrast of the 13.5-nm peak to the background due to the avail-
able intensity of 1× 10¹⁰W/cm2. Better contrast can be anticipated with improved
laser intensity as discussed in Section 2.6.4.
For the measurement with the EUV photodiode, the optimal in-band EUV signal
is plotted in Figure 3.5. Two curves shown in the plot are measured with different
detector conditions. The curve with higher amplitude was measured with the 45
Mo/Si mirror removed from the housing and the detector directly facing the LPP

78
Without Mo/Si mirror
With Mo/Si mirror
Time (µs)
EUV Signal (V)
Figure 3.5: Oscilloscope trace of the EUV photodiode for the optimal EUV yield showing the higheramplitude curve, taken without Mo/Si mirror, and lower-amplitude curve, taken withMo/Si Mirror.
EUV source. This curve shows all of the radiation inside the transmission band of
the Zr filter (FWHM 6.5 nm to 18 nm). The lower-amplitude curve is taken with
the Mo/Si mirror in place, meaning only light inside the 4% of the Mo/Si bandwidth
reaches the photodiode.
After the experiment, the photodiode was calibrated with a EUV source with
known energy with the help of Cymer Inc. The well-characterized source is a xenon
discharge plasma with an energy of 24 mJ in a 2% bandwidth in 2π sr. The photo-
diode signal for the Xe source is shown in Figure 3.6.
By comparing the distance from the source and the integration of the detector
signal for Figure 3.5 and Figure 3.6, we find our EUV energy to be ≈ 3 µJ per pulse,
assuming isotropic emission into 2π sr. This implies a conversion efficiency of 0.9%.
Also, the isotropy of the radiation is also verified from 5 to 85 off of the target’s
normal. The EUV signal shows a standard deviation of σ = 7.5% of the mean value.
Concerns of energy of debris from the bulk Sn target are also addressed by a time
of flight experiment. The Faraday cup detector with a 2 cm diameter copper plate is
placed 9 cm from the plasma on the normal of the target plane. The signal is shown

79
Figure 3.6: EUV photodiode signal for calibration, taken with a 24-mJ Xe-DPP source at Cymer,Inc.
in Figure 3.7.
0 0.2 0.4 0.6 0.8 1 1.2
-0.4
0
0.4
0.8
Ion time of arrival (µsec)
Ion current (arb. units)
Photo-electron signal
I=~1010 W/cm
2
~1.2x10
7 cm/sec
Figure 3.7: Time of flight measurement showing that the ion speed is on the order of 107 cm/scorresponding to several KeV. Energetic ions contaminate the focusing lens and EUVcollector optics, so a mitigation scheme is highly desirable.
The ions speed is extracted from the distance and time delay between the pho-
toelectrons signal and the peak of the ion signal (around 0.8 µs), as shown in the
plot. The energetic ion speed is calculated to be around 107 cm/s, corresponding
to several keV of energy. Such high energy ions present a enormous threat for the
collector optics as well as the focusing lens.
We had demonstrated, to the best of our knowledge, the very first EUV generation

80
from a fiber-laser-produced plasma using a solid-Sn target. Conversion efficiency of
1% is reported, limited by the highest intensity available from the fiber-laser at the
time. Further improvement on the laser intensity and choice of a practical source is
necessary for an high-power efficient long-life-time EUV source.
3.5 Practical High-power FLPP EUV Source Development
Previous successful demonstration with a solid-Sn target opens up the pathway for
fiber-laser drivers as candidates for laser-produced-plasma EUV generation. As pre-
viously explained, solid-Sn targets become impractical for high power EUV sources
for two reasons: their generation of excessive debris and their lack of high repetition
capability.
It is observed from the previous experiment that Sn debris from high speed Sn-
particles coated the focusing over thousands of shots, and these undesirable byprod-
ucts coat the multilayer mirrors and reduce the collector lifetime. Cleaning or replac-
ing the optics results in a huge penalty on the cost of operation. Moreover, solid Sn
targets are controlled by motorized target manipulators, which limits their highest
repetition rate to hundreds of Hz. In order to meet the power requirements for high
volume manufacturing (Section 1.3.3) with pulse energies of a few mJ (limited by the
small transverse core size of fiber gain media), it is necessary to operate at repetition
rates in excess of 100 kHz. Both issues mentioned above can be effectively addressed
with the development of mass-limited droplet target dispensers.
The previous experiment with a solid-Sn target yielded a lower conversion effi-
ciency compared to published results with the same target [27, 28, 29, 30, 31, 32, 33]
due to the peak intensity on the target on the order of low 1010W/cm2. Figure 3.8
plots the intensity dependence of the conversion efficiency with Sn-doped droplet

81
targets versus intensity.
Previous result using
solid tin target
Figure 3.8: Conversion efficiency plotted against intensities for the solid-Sn target. The data showsoptimal CE for intensities on the order of 1010W/cm2.
With the development of high energy laser systems with nearly diffraction-limited
output beams from 80-µm core fiber (Section 2.3), the intensity required for efficient
EUV generation can be reached. However, since the efficiency of in-band EUV
generation of laser-produced plasma is highly dependent on the plasma conditions
[2], which in general are complex functions of laser parameters such as intensity,
duration, pulse temporal shape, energy, spot size and wavelength, the suitability of
fiber lasers for achieving efficient EUV generation with realistic droplet targets was
an open question.
3.5.1 UCF Sn-doped Water Droplet Targets
Many different types of targets are being developed for high repetition rate oper-
ation and most of them use jet-like nozzles that dispense a liquid target [29]. Among
them, a patented source design (U.S. patent 6,862,339) [128], shown in Figure 3.9, by
Dr. Richardson’s group at the University of Central Florida is a low-debris, high rep-
etition rate compatible candidate. Debris is mitigated with the use of mass-limited
targets, which contain just enough Sn ions to efficiently extract all the laser energy.

82
Droplet targets are formed through capillary dispenser with a piezo-electric module
Droplets
Dispenser
Focusing
Lens
Figure 3.9: Schematic of UCF Sn-doped droplet targets [1], compatible with tens to hundreds ofKHz repetition rates and effectively debris-free.
for repetition rate and synchronization control, which can be adjusted in− situ dur-
ing experiments. The spherical droplets are ≈ 35µm in diameter forming ≈ 10 mm
from the exit of the nozzle with speeds of 2 × 104cm/s and stabilities of 3 µm at a
repetition rates from 20-200 kHz. The concentration of the Sn-solution for this set of
experiments is set at ≈ 30% in mass, which amounts to ≈ 1013 Sn ions per droplet.
Composition and target size can also be tailored accordingly to the laser energy per
pulse, which as a result, minimizes debris that is mostly in the form of unionized Sn
particles. The LPP source-size of droplet targets is also within the entendue limits
of 1-3.3 mm2 sr required for high brightness as stated in Table 1.2.
3.6 Experemental Setup - Sn-doped Droplet Target
Efficiency optimization of the droplet target and a high-peak-power fiber laser
using a 80-µm-core fiber is studied in the experimental setup shown in Figure 3.10.
A telescope pair collimated the output of fiber laser beam to a 1/e2 diameter
of 2 mm to 3 mm, in order to maximize transmission through the isolator, and to
minimize thermal lensing inside the high-power polarization-insensitive isolator. The

83
Flying Circus EUV
Detector
EUV Spectrometer
High Power Isolator
Beam Expander Collimator
Figure 3.10: UCF experimental setup showing Sn-doped droplet source, EUV spectrometer andFlying Circus EUV spectrometer. Two pairs of telescope controlled the collimation andmagnification of the laser output beam through the isolator and focusing lens. Highpower polarization insensitive polarizer impeded the feedback from plasma source.
isolator prevented feedback from the laser-produce-plasma. The feedback from the
plasma was observed by using a pellicle sampler placed between the two stages of
power amplifiers. A Si-photodiode monitored the reflection from the pellicle and
showed that a spurious signal follows the signal reflected from the output beam with
a temporal delay of ≈ 20ns: the round trip time from the output end to the target
(≈ 3m apart). This additional feedback only presented when the laser pulse hit the
droplet target (which can be controlled by synchronizing the laser to the target or
blocking the laser beam between the target). An optical isolator at the output end
of the fiber laser provided additional protection.
Another telescope at the output of the isolator expanded the beam before the
focusing lens, a 60mm gradient lens located in the vacuum chamber with a diameter
of 45 cm with 12 vacuum ports at 30 separation. A vacuum level below 10−3 Torr

84
was maintained by a turbo pump backed up by a roughing pump for a low absorption
of atmospheric air on EUV.
Meanwhile, two sets of telescopes were used to adjust the beam size on the focusing
lens from 9 mm to 18 mm, allowing in − situ control of the focal spot size on the
target. With a 10× microscopic objective lens and an Ophir Beamstar CCD camera,
the smallest spot size on the target is measured ≈ 18µm 1/e2 diameter. The image
of the focal spot is shown in Figure 3.11.
Figure 3.11: Smallest focal spot size image of 18-µm 1/e2 diameter measured with a 10× micro-scopic objective lens and an Ophir Beamstar CCD camera
A liquid-nitrogen-cooled collector cup, specially designed for this type of target,
was placed underneath the target dispenser to help maintain the vacuum level by
freezing the Sn-doped solution to avoid increase in particle inside chamber from
evaporation. Temporal synchronization between the droplet target and the fiber-
laser pulse is controlled with an external delay generator with an RMS timing jitter
of less than 60 ps (Stanford delay generator). Emission from the fiber-laser-produced
plasma was analyzed by two EUV diagnostic tools, an EUV flat-field spectrometer
and Flying Circus EUV detector, placed 30 on the either side of the laser beam axis.
3.6.1 Laser Parameters Used in the Experiment
In the first round of experiments, an optimization study was conducted at a lower
repetition rate of 1.72 kHz, providing an average output power of more than 10

85
W from the laser, with the droplet operating at 31 kHz (one irradiation every 18
targets). Further scaling of the average power can be achieved by increasing the
repetition rate of the laser and the pump power of the last stage amplifier with
preservation the output pulse parameters.
Laser parameters used are: For higher energy, 6 mJ and 6.2-ns duration pulses
generated by an arbitrary waveform generator (AWG) were used where the pulse
temporal profile is shown in Figure 2.20 (a). For higher peak power, shorter pulses
with 1.7 ns and 2.9 mJ were used, providing a higher peak power up to 1.7 MW,
yielding available intensity of 6.7 × 10¹¹W/cm2 on the target. This intensity is six
times higher than that which yielded the optimum conversion efficiency (Table 1.4).
Facilitated with the pulse-shaping capability of AWG, we also evaluated the effects
of the prepulses on conversion efficiency. By changing the program for the arbitrary
waveform generator seeder, a prepulse contrast ranging from 1:1 to 1:30 and the
delay ranging from 19 ns to 100 ns were scanned to optimize EUV generation.
3.6.2 EUV Diagnostics
Two diagnostics tools were used to monitor the EUV emission from fiber-laser-
produced plasma: an EUV spectrometer and a Flying Circus II EUV detector.
Figure 3.12 depicted the setup of a flat-field grazing-incidence spectrometer. An
80-µm entrance slit, 395 mm away from the FLPP source, collimated the radiation
and governed the working spectral resolution. The grating is a 1200 lines/mm gold
coated, variable-line-spaced (from 690 nm to 990 nm) diffraction grating with a radius
of curvature of 5.649 m in the grating chamber with its center 237 mm away from the
entrance slit. Aligned with an 87 grazing incident angle, the image-plane resided
235 mm away from center of grating. The geometry of the setup allowed recording

86
of a dispersed spectrum from 11 nm to 19 nm and a sharp resolution of 0.01 nm
with a 16-bit X-ray CCD camera (PI-SX, Roper Scientific) cooled by a TEC to a
temperature -40C for low thermal quantum noise, where images are recorded and
processed by a personal computer.
19 nm
11 nm87º
X-ray CCD
Camera
Grating Chamber
Hitachi Grating
1200 lines/mm
237mm235mm
80µm
entrance slit
Figure 3.12: Schematics of flat-field grating spectrometer, showing an 80-µm entrance slit, acting asthe line source with the illumination from the LPP. A grating in the chamber dispersedthe EUV emission on to the X-ray CCD camera, recording high resolution images from11 to 19 nm.
Broadband radiation is emitted by the fiber-laser-produced-plasma, yet only the
radiation in the 2% bandwidth centered at 13.5 nm of the Mo-Si reflection band
can be delivered to an intermediate focus by collector optics. The second diagnostic
tool, named Flying Circus II EUV energy meter and developed by FOM-Institute of
Plasma Physics Rijnhuizen was delineated in Figure 3.13. It measured the emission
band of interest for EUV lithography and provided the conversion efficiency.
It consisted of a 1-inch spherical Mo-Si mirror with 69% peak reflectivity for a
fresh mirror. The mirror acted as the limiting aperture for the apparatus. Since
Mo-Si multilayer mirrors were also highly reflective in the VUV/VIS/IR range [3], a
0.5-µm-thick Zr filter with ≈ 18% transmission at 13.5 nm blocks radiation outside
the EUV region. Reverse-biased at 24V to ensure linearity, an IRD AXUX-100
photodiode with a spectral responsivity of 0.24 A/W at 13.5 nm monitored in-band
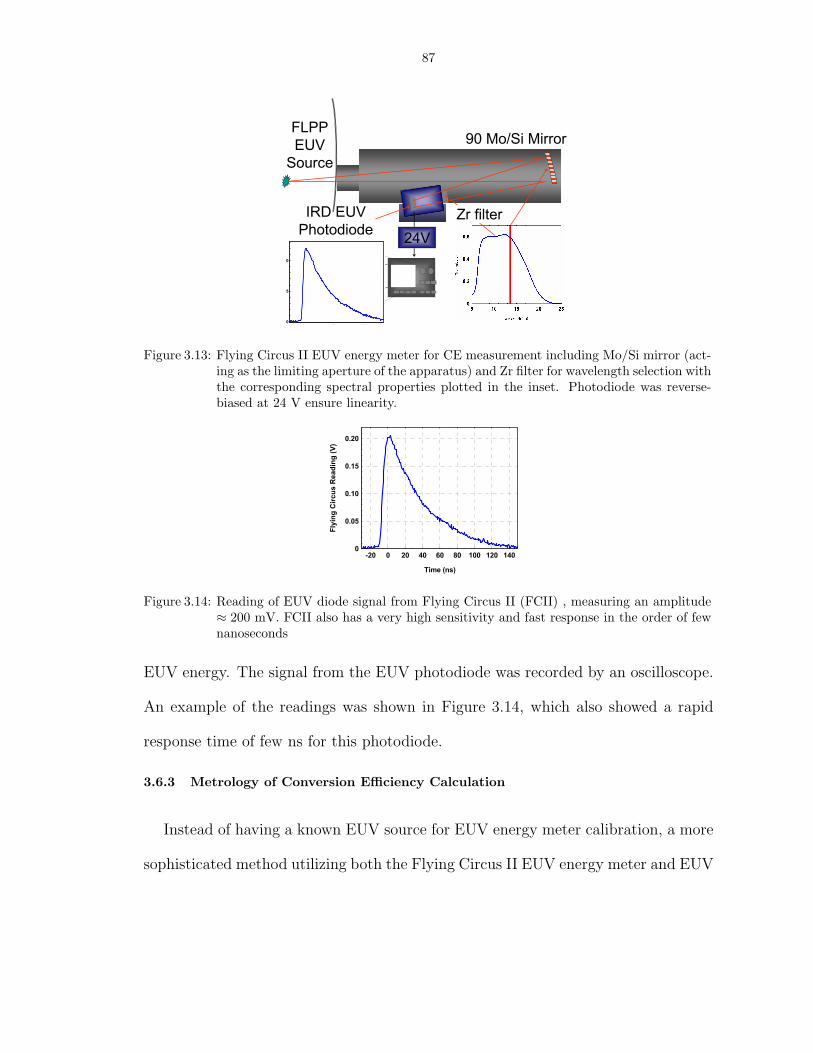
87
FLPP
EUV
Source
90 Mo/Si Mirror
IRD EUV
PhotodiodeZr filter
0
05
10
0 50 100
24V
Figure 3.13: Flying Circus II EUV energy meter for CE measurement including Mo/Si mirror (act-ing as the limiting aperture of the apparatus) and Zr filter for wavelength selection withthe corresponding spectral properties plotted in the inset. Photodiode was reverse-biased at 24 V ensure linearity.
0
0.05
0.10
0.15
0.20
-20 0 20 40 60 80 100 120 140
Time (ns)
Flyi
ng C
ircus
Rea
ding
(V)
Figure 3.14: Reading of EUV diode signal from Flying Circus II (FCII) , measuring an amplitude≈ 200 mV. FCII also has a very high sensitivity and fast response in the order of fewnanoseconds
EUV energy. The signal from the EUV photodiode was recorded by an oscilloscope.
An example of the readings was shown in Figure 3.14, which also showed a rapid
response time of few ns for this photodiode.
3.6.3 Metrology of Conversion Efficiency Calculation
Instead of having a known EUV source for EUV energy meter calibration, a more
sophisticated method utilizing both the Flying Circus II EUV energy meter and EUV

88
spectrometer was used to calculate the in-band EUV energy, given by
(3.1) EBW =Ascope
Rscopeηdiode
∫
BW
Is(λ)dλ∫all
Is(λ)Tg(λ)Rmir(λ)Tf (λ)dλ
2π
Ω
The in-band EUV energy was calculated with Equation 3.1 by first obtaining the
energy using the integrated diode signal(Ascope), oscilloscope resistance(Rscope) and
diode reponsivity (ηdiode). Since the multilayer mirror in the FCII had a broader
bandwidth than 2% and also the Zr-filter transmission had a spectral dependence, it
is necessary to spectrally calibrate the measured energy to include the energy only in
the 2% BW by taking into account the gas transmission in vacuum chamber(Tg(λ)
), mirror reflectivity(Rmir(λ)), the Zr filter transmission Tf (λ), and the measured
spectrum Is(λ) . Isotropic radiation was assumed over the 2π solid angle and the
conversion efficiency was then scaled with the solid angle of the limiting aperture Ω,
which is the Mo-Si mirror in this case. BW here referred to the 2% bandwidth from
13.365 nm to 13.635 nm.
3.7 Conversion efficiency optimization study
Conversion efficiency studies on both water droplet target and Sn-doped water
droplet target with various irradiation conditions (pulse duration, spot size, laser en-
ergy, intensity) was rigorously investigated in this experiment to provide a thorough
and insightful understanding on the feasibility of high-peak-power fiber laser as an
efficient EUV driver.
3.7.1 Water droplet target
Water droplets were considered as an EUV source since they are debris-free, low
cost and high repetition rate compatible[1]. Earlier experiments studied the water
droplets used as target for EUV source, as well as the pulse duration dependence.

89
During the experiment, water droplets were used as the targets for the spectrom-
eter and EUV energy meter alignment. Also, distinct wavelength emissions from low
Z materials such as oxygen were used for spectral calibration. Figure 3.15 showed
spectra from water-droplet targets at various laser intensity levels. In this figure,
2 0 0 0
4 0 0 0
6 0 0 0
1 2 1 3 1 4 1 5 1 6 1 7 1 8
1 .6 3 x 1 0 1 1 W /c m 2
2 .0 1 x 1 0 1 1 W /c m 2
1 .2 6 x 1 0 1 1 W /c m 2
7 x 1 0 1 0 W /c m 2
W a v e le n g th λ (n m )
Cou
nt (a
.u.)
O-VI(17.3)
O-VI (11.06)
O-VI (12.98)
O-V (15.15)
O-VI (15.01)
Figure 3.15: Water spectrum at four intensity levels showing emissions from different oxygenspecies. Change in the plasma temperature can be indicated from the change in thecontrast predominately the two peaks around 15-nm. Note the emission from O-VIdominates with increase of intensity, which implies an increase in plasma tempera-ture. Also note that each spectra is taken with the same exposure time, therefore, thephoton counts directly reflect the emission strength.
the differences in the plasma temperature is realized from the change in the contrast
in the spectral features. The first and more prominent indication of higher plasma
temperature is the spectral photon count. In Figure 3.15, higher spectral count is
recorded when a higher intensity is focused on the target, indicating that more EUV
photons are emitted from the laser-produced plasma.
Another significant change in the spectral features for higher plasma temperatures
can be realized from the two spectral peaks located around 15nm, which are generated
from different ionization states. The emission lines from O5+ (the higher ionization
state) is peaked at 15.01 nm and the emission line from O4+ is at 15.15 nm.
An increase in the population of higher ionization states generally corresponds
to an increase in the plasma temperature. In Figure 3.15, the strengths of the two

90
emission peaks were close at an intensity of 7× 10¹⁰W/cm2, while the emission peak
from O5+ to the emission peak from O4+ increased to 2:1 when the intensity was
increased to 1.63× 10¹¹W/cm2.
One important piece of information gathered from water-droplet spectrum is the
actual plasma temperature. The actual plasma temperature from the experiment can
be estimated by the comparing experimental spectra and the synthesized spectra at
which the plasma temperature is known.
3.7.2 Sn-doped droplet target
The Sn-doped target was implemented, followed by the characterization of a
water target. Two different pulse durations were selected to test the effect on
EUV conversion efficiency. Shown in Figure 3.16, the best spectra for two differ-
ent pulse durations were obtained at highest recorded conversion efficiencies. For
1.7-ns pulses, the highest attainable conversion efficiency was 0.33% with the inten-
sity of 1.65 × 10¹¹W/cm2. For 6-ns pulses, the conversion efficiency of 0.9% was
recorded at intensity of 1.19× 10¹¹W/cm2.
Photo counts of the spectra shown in Figure 3.16 also manifested the difference
in the plasma temperature showing that Sn UTA from the emission by 6-ns pulses
has narrower width and higher peak than those from 1.7-ns pulses. It is noteworthy
that even higher intensity was achieved at shorter pulse durations, the conversion effi-
ciency is three times lower than CE from longer pulses, exhibiting that CE has a very
strong dependence on temporal duration even within few nanosecond range. Other
experimental condition for efficiency dependence of two pulse durations remained the
same including the type of lens used (60-mm Gradium lens), focal spot size (30 µm
1/e2) and the size of the target to have a plausible pulse-duration dependence study.

91
12 13 14 15 16 17 1812 13 14 15 16 17 18
Wavelength λ(nm) Wavelength λ(nm)
(a) (b)CE~0.33% (1.7ns)
@1.65x10¹¹ W/cm2CE~1% (6.2ns)
@1.19x10¹¹W/cm2
Figure 3.16: Pulse duration conversion efficiency scaling showing the spectra for pulse durationsof 1.7 ns and 6 ns. CE of ≈ 1% from 6-ns pulses is obtained at intensity level of1.19 × 1011W/cm2 and CE of ≈ 0.3% is obtained for 1.7-ns pulses at the intensitylevel of 1.65× 10¹¹W/cm2. Note that the difference in the spectra from 1.7-ns showslower and broader Sn UTA indicating a lower plasma temperature even with higherintensity on target.
Figure 3.17 showed CE dependence on the lens position and laser intensity for
6ns pulses(laser intensity was adjusted by changing the focal spot size while keeping
the same energy of the laser) and it showed that the highest efficiency was obtained
at the focus where the spot was the smallest, corresponding to highest intensity at
1.19× 10¹¹W/cm2.
0
0.2
0.4
0.6
0.8
1.0
1.2
-400 -200 0 200 400
Lens Position from focus (μm)
Con
vers
ion
Effi
cien
cy (2
%B
W, 2
πSr)
0
0.2
0.4
0.6
0.8
1.0
2 4 6 8 10 12 14
Laser Intensity ( x1010W/cm2)
CE
(2%
BE
, 2πS
r)
CE for no pre-pulse dependence on laser intensity and lens position
Figure 3.17: (Left) CE dependence on the lens focal position and (Right) The dependence of thelaser intensity for 6-mJ and 6-ns pulses. The laser intensity is altered by transversingthe position of the focusing lens.
Increase in pulse duration effectively optimized the CE by three times, yet, 1%
CE did not provide enough yield for the EUV lithography application as it doubled

92
the laser power requirement (Section 1.5) and more importantly, it was noticed that
this conversion efficiency was only half of what was achieved by a solid-state laser at
the same intensity. One possible explanation for not being able to reach the same CE
at the optimal intensity was attributed to the temporal shape of the laser pulse. A
Q-switched ns-solid-state laser in general generates a output pulse with a Gaussian
temporal profile. The extracted output energy of a solid-state laser is much lower
than its saturation energy, even at hundred-mJ energy levels. Temporal reshaping
due to gain saturation will not be in effect under this condition in the YAG laser.
In the fiber-laser system with semiconductor diode seed, the amplified pulse had a
much steeper rising edge compared to that of a Nd:YAD laser (Figure 2.20(a)). The
rising edge of the temporal profile measurement was actually limited by the rise time
of the detector (Si photodiode with rise time of 450ps). The difference in the leading
edge of the pulse is speculated to be the reason for the lower conversion efficiency
given the target plasma temperature is still low while most of the laser photons were
incident on the target. Therefore, the absorption of the laser energy is not optimal.
Later experiments that introduces prepulses to preheat will verify this assumption.
3.7.3 CE optimization with prepulses
Many previous EUV efficiency studies indicated that the introduction of a pre-
pulse under the right conditions enhances the conversion efficiency [32, 105, 106]. As
described earlier in Section 2.6, seeding using an AWG can conveniently generate
pre-pulses with a programmable contrast and delay. In our prepulse optimization
study, four different delays were tested: 27ns, 45ns, 75ns and 100ns. Contrast can
also be arbitrary adjusted during the experiment while the laser is still in operation
from ratio of 1:1 to 1:30. It was found that the best yield can be found at delay of

93
45ns and the spectrum was shown in Figure 3.18 with comparison to the condition
without the prepulse, note that the temporal shape of the main pulses resembled the
one without the prepulse.
10000
20000
30000
12 13 14 15 16 17 18
with Prepulsewithout prepulse
Wavelength λ (nm)
Phot
on C
ount
(a.u
.)
Figure 3.18: Spectra with and without prepulses. In both testing conditions, the shape and energyof the main pulse remain identical.
The photon counts in the figure of the Sn UTA showed two-fold improvement
when prepulses were used to preheat the target and the contrast between the peak
of the UTA to the 17 nm oxygen line is also enhanced (larger increase in Sn UTA)
with pre-pulse, another indication more optimum irradiation condition attainable
with prepulses preheating.
Figure 3.19 showed the optimal spectrum from the fiber-laser-produced-plasma
with Sn-doped water-droplet targets as well as the image from the X-ray CCD cam-
era. The spectrum had four sharp emissions from O5+ at 11.58 nm (2s− 4p), 12.97
nm (2p− 4d), 15.01 nm (2s− 3p) and 17.3 nm (2p− 3d), used for spectrum calibra-
tion [1]. Centered around 13.5 nm, the Sn unresolved transition array (UTA) has a
spectral width of 1 nm FWHM.
CE dependence versus intensity was realized by adjusting the pump power of
last stage amplifier to and by varying the focal spot size by transversing the focal

94
10000
20000
12 13 14 15 16 17 18Wavelength λ (nm)
Photo Counts (a.u.)
Figure 3.19: Best spectrum with prepulse preheating showing emission from Sn-doped water droplettarget. It shows the image of the X-ray CCD camera on the top. Spectrum featuresthe O5+ emission peaks at 11.58, 12.97, 15.01 and 17.3 nm, providing the referencepoints for spectral calibration.
lens position. The focal lens, mounted on a piezo-electric controlled translation
stage, allowed changing the relative position outside the vacuum chamber in three
directions: the z-direction to change the target focal spot size and the x- and y-
directions to optimize the overlapping between focal spot position and the spherical
target.
Figure 3.20 plotted the spectral dependence at different intensity levels, and
showed that photon counts increased significantly when the laser intensity was in-
creased from 2 × 10¹⁰W/cm2 to 9 × 10¹⁰W/cm2. Also, the spectral peak of the Sn
UTA shifted from a longer wavelength to a shorter wavelength. The photon counts
start dropping once the intensity is higher than 8× 10¹⁰W/cm2, indicating that the
optimum intensity for highest conversion efficiency is at this level. All the spectra
shown were averaged over five spectral images, each with one second of exposure
time, corresponding to an average of more than 8500 laser shots for each spectrum.

95
5000
10000
15000
20000
11 12 13 14 15 16 17 18
2 .0x1010W /cm
2
6 .9x1010W /cm
2
9 .3 x 1010 W /cm
2
1 .2 x 10 11 W /cm
2
Waveleng th λλλλ (nm )
Photon Counts (a.u.)
Figure 3.20: Study of spectral dependence on intensity showing a compelling increase in photoncounts as the intensity increased from low to high 1010W/cm2. Photo counts startsto decrease as the intensity increased further, indicating the optimum intensity level.The testing here utilizes prepulses of 45-ns delay and intensity includes the energy inthe prepulse.
To ensure the same calibration for the Mo-Si multilayer mirror in which the re-
flectivity degrades by plasma debris coating, the conversion efficiency was estimated
by calibrating the spectrum with the Flying Circus energy meter [2]. EUV energies
measured using Flying Circus II (FC II) were taken along with several spectra for
reference. EUV energy at other irradiation conditions was then calculated using
measured spectrum and comparing photon counts, and spectral shape in the Mo/Si
reflection band to those of the reference spectra. After the completion of all ex-
periments, the Mo-Si multilayer mirrors in the FC II and Zr filter was calibrated
at the National Institute of Standards and Technology to ensure correct conversion
efficiency measurement.
Figure 3.21 plotted CE as a function of lens position and laser intensity on target
and the highest conversion efficiency achieved was 2.07% at the intensity of 8.4 ×
1010W/cm2. Beyond this intensity level, conversion efficiency declined. The drop in
the conversion efficiency indicates that the optimal conditions for EUV generation
were reached within the fiber-laser parameter space.

96
0
0.5
1.0
1.5
2.0
0 2 4 6 8 10 12 14
Laser Intensity ( x1010W/cm2)
CE
(2%
BE,
2πS
r)
0
0.5
1.0
1.5
2.0
-400 -200 0 200 400
Lens Position from focus (μm)
Con
vers
ion
Effi
cien
cy (2
%B
W, 2
πSr)
CE for 45ns-delay prepulse dependence on laser intensity and lens position
Figure 3.21: CE dependence on laser intensity (on the left) and lens position (on the right). Theplots shown here used prepulses with delay of 45-ns and contrast of 1:10. Highest CEis reached at the intensity level of 8.4 × 10¹⁰W/cm2 and CE is lower with intensitieshigher than optimum. Interesting to note from the lens position dependence that CEis higher when the beam is diverging (+ 200 µm), which was first observed in [2]
Even with the use of lower-density Sn doped water droplet targets, there still
existed a problem with Sn particle deposition on the focusing lens. After the ex-
periment, energy transmission of the focusing lens is measured accounting for the
conversion efficiency calculation. Averaged change in the transmission is ≈ 60%
for ablation time ≈ 30 minutes. One possible explanation is that the overlapping
between the focal spot and the target were not optimized at the beginning of the
experiment. When the target was ablated off-centered, most target materials were
sputtered rather than ionized, hence, creating a tremendous amount of neutral ions
or high energy particles. The debris created under these unfavorable conditions will
scatter in all directions and coat the focusing lens. Also, the overlap between the
target and the focus had to be constantly and manually adjusted, therefore, making
it difficult to ensure favorable irradiation throughout the experiment. The debris
coated on the lens after the experiment, obtained by a scanning white light interfer-
ometer [3], is shown in Figure 3.22.
Another reason is that with the use of lower energies from the fiber laser, the pulses
failed to ionize every Sn particles in the target completely, as a result, the “unused

97
(a) Highest spectral results obtained for different laser pulsewidths
(b) Normalized with 13 nm oxygen line
Fig. 4. Comparing the effect of pulse duration on plasma temperature
Fig. 5. Particulate deposited on the lens during an experiment with tin droplets
5. Discussion
To produce efficient EUV emission from a source material, it is necessary to ensure conditionsfor maximum laser energy absorption. Not only that, almost all of the absorbed laser energyneeds to be converted into thermal energy capable of producing the required excited states foremission into a given wavelength region. One way to maximize laser absorption is to keeplaser irradiance intensities below threshold conditions for creating parametric instabilities inthe plasma.
With the tin-doped droplets and fiber laser, this experimental study demonstrates two resultsthat will impact the EUV source development. First, it can be seen that efficient, high-power,and high repetition rate source operation is possible with fiber lasers. Second, high CE for 13.5nm can be obtained with low laser energy per pulse as long the plasma scale length is optimizedfor the required emission. Figure 6 compares the best spectral measurement obtained with the1 Hz laser at 100 mJ and 35 μm beam diameter to one of the best spectrum generated with thefiber laser. Both spectra are normalized to the oxygen peak at 12.98 nm. The wavelength scalein the solid-state laser generated spectral measurement is slightly offset to better illustrate thedifferences in the spectra.
#87897 - $15.00 USD Received 28 Sep 2007; revised 15 Nov 2007; accepted 17 Nov 2007; published 26 Nov 2007
(C) 2007 OSA 10 December 2007 / Vol. 15, No. 25 / OPTICS EXPRESS 16355
Figure 3.22: (Courtesy of Dr. Simi George) The image of scanning white light interferometer show-ing the debris coated on the focusing lens after ≈ 30 minutes of target irradiation[3].
targets” became source of contamination. In the experiment using a solid-state laser
with 100-mJ energy per pulse and a 35-µm focal spot size [2], coating due to debris
generation is minimized. This coating of debris can be cleaned immediately after
the experiment with a minimal loss in the transmission (≈ 1%) after each cleaning.
However, the lens AR coating will be eventually etched and introduce excess loss on
the transmission, making it unfeasible for further use.
The comparison between the best spectra from a 1-Hz, 100-mJ laser with a 35-
µm spot and the best spectra from the fiber laser is shown in Figure 3.23. Both
spectra are normalized to the O5+ at 13 nm and the wavelength scale for the solid-
state laser is slightly offset to better reveal the spectral difference. The targets and
the experimental conditions are the same for both spectra and it is obvious that
emissions of fiber laser resembled the spectral properties of that from a solid-state
laser, as well as providing the equivalent efficiency of solid-state laser.
Furthermore, better debris mitigation is expected with higher pulse energies, made
possible with beam combining, and larger focal spots or by reducing the size of the
target for bettering matching the droplet diameter and focal spot size.
98
Fig. 6. Comparison of fiber laser spectral measurement to the highest Nd:YAG lasermeasurement for the same target
The target conditions are identical and it can be seen from Fig. 6 that the fiber laser has suc-cessfully emulated solid-state laser results, and gives identical CE results near 2.0 %. Higherconversion efficiency from the fiber laser is expected with the installation of the target stabi-lization system and smaller droplets. Matching the droplet diameter to the laser beam diameterat focus may reduce the debris produced during plasma generation.
Acknowledgements
The funding for this study was provided by SRC, Cymer, AMD, and the state of Florida. Theauthors greatly appreciate the technical assistance and discussions with Robert Bernath, JiyeonChoi, Tobias Schmid, Jose Cunado, and Dr. Bruno LaFontaine at AMD. We would like tothank Dr. Steven Grantham for providing calibrations of the multilayer mirrors being used forthe experiments.
#87897 - $15.00 USD Received 28 Sep 2007; revised 15 Nov 2007; accepted 17 Nov 2007; published 26 Nov 2007
(C) 2007 OSA 10 December 2007 / Vol. 15, No. 25 / OPTICS EXPRESS 16356
Figure 3.23: (Courtesy of Dr. Simi George) Comparison of the spectra from fiber laser and solid-state laser shows that fiber laser created the same irradiation condition for optimumefficiency extraction given very different pulse energy, pulse duration and focal spotsize. [3]
3.8 Conclusion
The feasibility of EUV generation by a fiber laser were realized in two experiments.
The first experiment using a solid-Sn target yielded 1% of conversion efficiency at
a intensity of 1.2× 10¹⁰W/cm2, the highest extractable from the 115-µm-core fiber.
Experiences from this experiment further revealed the needs for a laser with higher
intensities laser and a low-debris target compatible with a higher repetition rate. This
demonstration, being the first EUV generation of fiber laser, extended the choice of
feasible laser candidate for high efficiency high power EUV source.
Second experiment with realistic Sn-doped water-droplet targets verified fiber-
laser EUV driver as an efficient choice of laser. A conversion efficiency of 2.1% is
obtained while operating at 1.75 kHz with a laser power more than 10W in this opti-
mization study. A decrease of conversion efficiency with a laser intensity higher than
optimum point also indicates that fiber-lasers are capable of generating irradiation
condition which are optimum for efficient 13.5-nm EUV generation. The achieved

99
conversion efficiency was essentially same as that obtained using a Q-switched solid-
state laser, despite the fact that the energy and peak power of a solid-state laser are
higher than those of fiber lasers.
Successful demonstration of the same conversion efficiency with less energy per
pulse opens up a pathway for fiber lasers to suitable drivers for high power EUV
lithography with their programmable temporal parameters. The high beam qual-
ity of new LMA fiber systems and the ample gain bandwidth of Yb-doped fibers
also indicate an unrivaled potential for power scalability to tens of kW by spectral
combining and spatial overlapping.
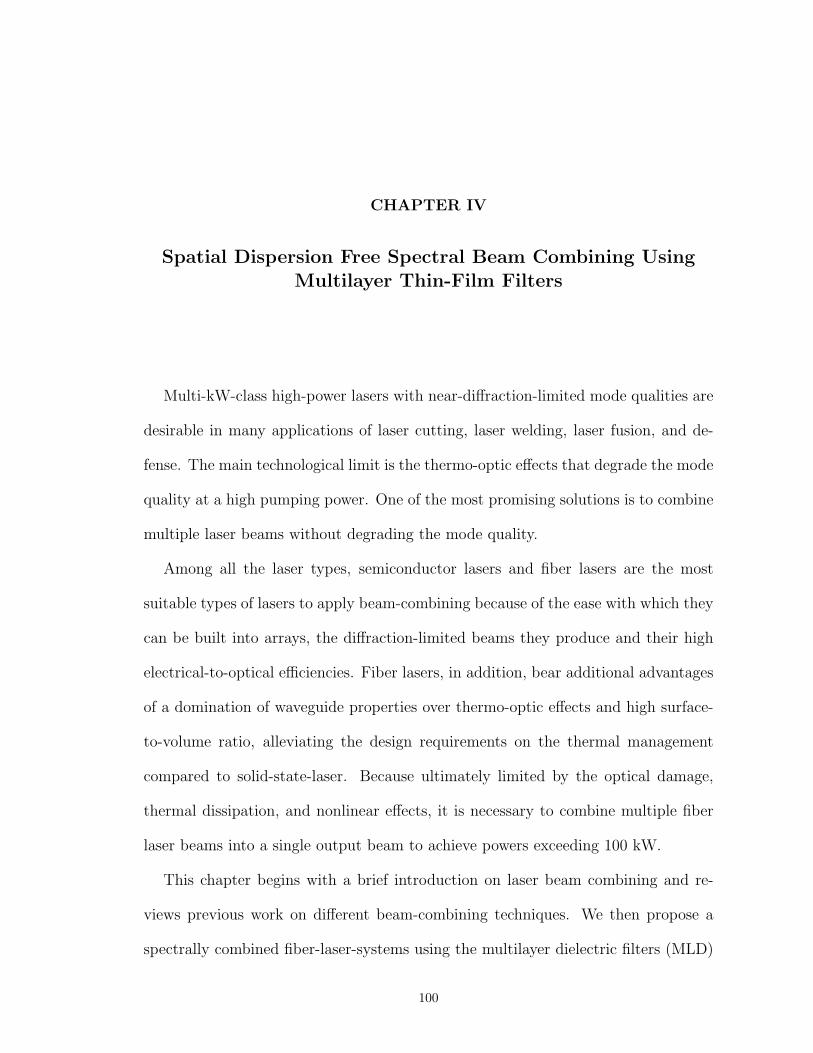
CHAPTER IV
Spatial Dispersion Free Spectral Beam Combining UsingMultilayer Thin-Film Filters
Multi-kW-class high-power lasers with near-diffraction-limited mode qualities are
desirable in many applications of laser cutting, laser welding, laser fusion, and de-
fense. The main technological limit is the thermo-optic effects that degrade the mode
quality at a high pumping power. One of the most promising solutions is to combine
multiple laser beams without degrading the mode quality.
Among all the laser types, semiconductor lasers and fiber lasers are the most
suitable types of lasers to apply beam-combining because of the ease with which they
can be built into arrays, the diffraction-limited beams they produce and their high
electrical-to-optical efficiencies. Fiber lasers, in addition, bear additional advantages
of a domination of waveguide properties over thermo-optic effects and high surface-
to-volume ratio, alleviating the design requirements on the thermal management
compared to solid-state-laser. Because ultimately limited by the optical damage,
thermal dissipation, and nonlinear effects, it is necessary to combine multiple fiber
laser beams into a single output beam to achieve powers exceeding 100 kW.
This chapter begins with a brief introduction on laser beam combining and re-
views previous work on different beam-combining techniques. We then propose a
spectrally combined fiber-laser-systems using the multilayer dielectric filters (MLD)
100

101
filters as the spectrally combining elements, which are not based on spatial dis-
persion and, consequently, eliminate the principal limitations of the conventional
spectral combining schemes based on the dispersive-grating components. We stud-
ied the performance of this novel scheme by a combination of spectrally broadened
fiber lasers into a single spatially-overlapping high-quality beam with M2 ≈ 1.86,
> 91% of combining efficiency, 52-W of average power and 4.0-mJ of pulse energies.
4.1 Introduction of Laser Beam Combining
The first and the simplest type of laser beam combining is incoherent spatial
combining, without imposing any spectral or phase control. The conventional diode-
laser arrays and the fiber bundles are two such examples. In spite of increasing the
total power, the incoherent spatial combining does not improve the radiance and
consequently, can not provide a near-diffraction-limited output.
Other types of laser beam combining were pursued greatly over the past few years
[129, 130] in techniques using both spectral beam combining (SBC) [131, 132, 133,
134, 135] and coherent beam combining (CBC) [136, 137, 138, 139, 140, 141, 142].
Both types of combining schemes can improve the radiance from a single laser output,
however, only CBC can improve the spectral radiance. Current state-of-the-art SBC
system achieved a combined power of 522W [133, 132]. 470W using CBC [138] was
also obtained recently. In both CBC and SBC, the radiance scales with the number of
the channels times the combining efficiency. Previous work and the general properties
of CBC and SBC will be briefly discussed in the next two sections.
4.1.1 Coherent Beam Combining (CBC)
Historically, coherent beam combining (CBC) is the type of the combining scheme
that had been studied the most extensively, in the application of semiconductor,

102
solid-state, gas and fiber lasers. However, due to its fundamental challenges on precise
phase-locking, not much success was accomplished until recently. In principle, CBC
implements phase-locking of the individual laser elements to a common frequency and
vectorially summing the output amplitudes into a spatial array, and consequently,
providing an increase in brightness compared to individual beams.
However, the major and the most demanding requirement is the phase-locking
between the laser elements, only allowing an error to a small fraction of the wave-
length. Additionally, since the electric field must be constructively added, the output
polarization of each laser elements must be precisely controlled at every instant of
time. Most of the developments in CBC, as a result, has been focused on finding
the sophisticated locking techniques. Even with the best phase-locking mechanism,
the combined beam still generate far-field side-lobes, contributing 30% of the total
power, even under the ideal phase condition.
The phase-locking techniques developed over the years include: common res-
onator, evanescent-wave, self-organizing, active feedback, and nonlinear optical. Cur-
rently, the state-of-the-art coherent by the active feedback phase-locking (Figure 4.1)
demonstrated a four-channel combining with a total output power of 470 W. How-
ever, only 70% of the power resided in the central fringe of the multiple-lobe far-field
combined beam.
4.1.2 Spectral Beam Combining(SBC)
SBC schemes implement dispersive beam combining elements, i.e. diffraction
gratings and volume Bragg gratings, to combine laser elements at distinctive central
frequencies. Therefore, it trades the brightness enhancement with the loss of the
spectral purity. However, in most high power applications, spectral properties are
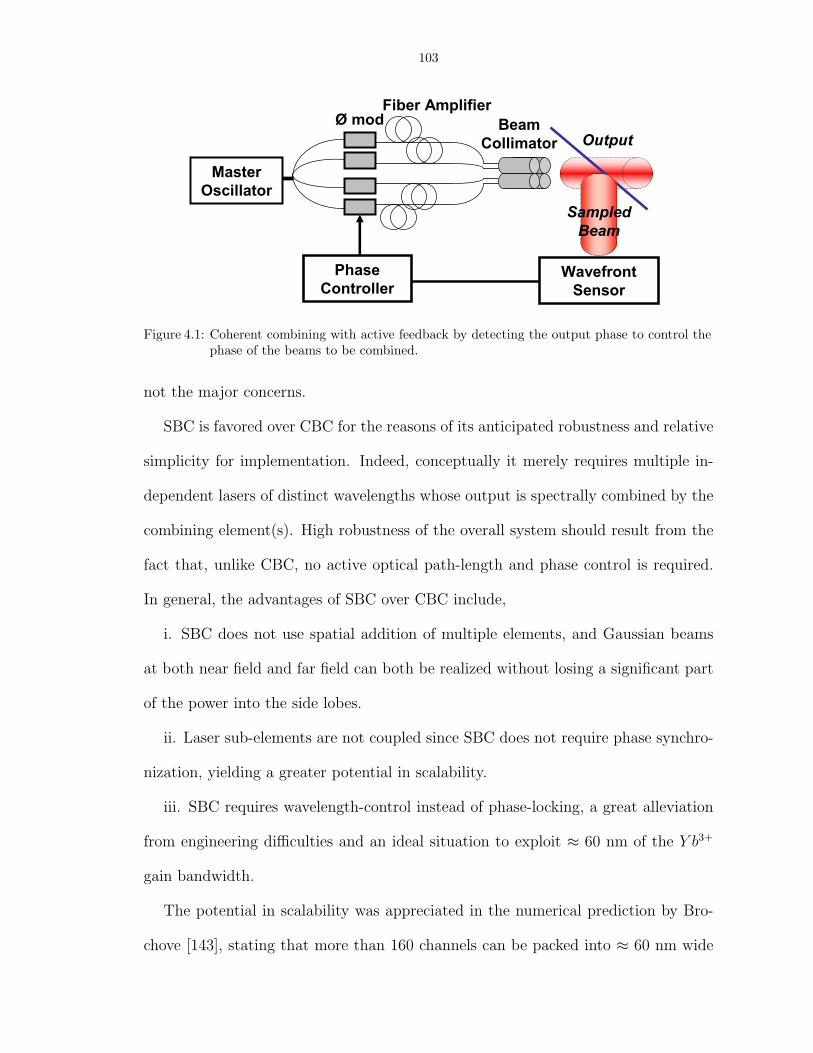
103
Master
Oscillator
Wavefront
Sensor
Phase
Controller
Output
Sampled
Beam
Fiber Amplifier
Beam
Collimator
Ø mod
Figure 4.1: Coherent combining with active feedback by detecting the output phase to control thephase of the beams to be combined.
not the major concerns.
SBC is favored over CBC for the reasons of its anticipated robustness and relative
simplicity for implementation. Indeed, conceptually it merely requires multiple in-
dependent lasers of distinct wavelengths whose output is spectrally combined by the
combining element(s). High robustness of the overall system should result from the
fact that, unlike CBC, no active optical path-length and phase control is required.
In general, the advantages of SBC over CBC include,
i. SBC does not use spatial addition of multiple elements, and Gaussian beams
at both near field and far field can both be realized without losing a significant part
of the power into the side lobes.
ii. Laser sub-elements are not coupled since SBC does not require phase synchro-
nization, yielding a greater potential in scalability.
iii. SBC requires wavelength-control instead of phase-locking, a great alleviation
from engineering difficulties and an ideal situation to exploit ≈ 60 nm of the Y b3+
gain bandwidth.
The potential in scalability was appreciated in the numerical prediction by Bro-
chove [143], stating that more than 160 channels can be packed into ≈ 60 nm wide

104
Y b3+ gain bandwidth with an M2 < 1.5 combined output, using a geometric channel
spacing < 1 mm, a transform optical length < 50 cm, 1-kW fiber lasers operating
< 3 GHz, and a grating groove density of 1740 lines/mm.
Many successful work using the dispersive spectral elements have validated both
the scalability and the robustness of SBC. Augst reported one of the earliest work
in spectral-combining Yb-doped fibers with a combined power of 6W (five-channels-
combining) and excellent mode-quality of M2 ≈ 1.14.
Loftus combined three channels of Yb-MOPA lasers (Figure 4.2), with ≈ 522 W
of combined power, ≈ 93% of combing efficiency and a mode quality of ≈ 1.2 [132].
Using volume Bragg gratings, two channels of high average power fiber lasers with
180 W were combined with 92% combining efficiency by Ciapurin [135]. However,
optical path difference was a problem, creating an issue when focusing the combined
beam to measure the mode quality.
λ1λ2
λn
f f
Combined Beam
Fiber Laser Channels
Transform Lens
Output Mirror
Figure 4.2: Spectral combining setup using a diffraction grating to combine beams at differentwavelengths, which are incident at a slightly different angle.
4.1.3 Limitation on Spectral Beam Combining
Careful investigation, yet, reveals significant technological limitation in spectral
combining approach constituted by the spectral combining element itself. Current

105
spectral combining methods are based on spatial spectral dispersion such as diffrac-
tion gratings [130, 131, 132, 133, 134] or volume Bragg gratings [135] to superimpose
beams of different optical wavelengths. Limitation on the linewidth and the beam
size to retain the mode quality for spatial dispersive combining elements bears poten-
tial problem for combining fiber laser with MW peak powers. For spectral combining
using diffraction grating, spatial dispersion will result in additional angular diver-
gence proportional to g∆λ where g is the grating grooving density and ∆λ is the
laser linewidth [133]. The spatial dispersion effect is also dependent on the spot size
on grating.
For a desired combined beam quality (M2), there exist a limitation on both the
spot size on the grating and the linewidth beam governed by,
(4.1) ∆λ =2√
(M2)2 − 1× c× cos(α0)
g × λ× π× 1
ω0
where ∆λ is the linewidth in Hz, M2 is the mode quality, c is the speed of light, α0 is
the incident angle of the grating ( which usually equals to Littrow ), g is the groove-
density in lines/mm of grating ω0 is the beam width in mm. Figure 4.3 plots the
requirement on the linewidth and the beam-width requirement for a near-diffraction
limited output beam ( M2 = 1.2 to 1.5) from the diffraction grating combiner with an
1064 nm wavelength, 1740 lines/mm grating and Littrow ≈ 66, the same parameters
as used in [133, 130].
Note that Equation 4.1 applies to combining diffraction limited beam, for beams
with M2 > 1, the combined mode quality becomes worse. Analysis shows for
linewidth in the order of tens of GHz, beam radius <1 mm is required, which will
lead to very high power density on the grating as shown in Figure 4.4 with targeted

106
0.1
1
10
100
1000
0.1 1 10 100
M2=1.5
M2=1.2
Beamwidth 1/e2 radius (mm)
Linewidth (GHz)
Figure 4.3: Design tradeoff for the laser spot size on a diffraction grating and linewidth of the laserto maintain mode quality between M2=1.2 to 1.5. The example shown here is plottedusing 1740-lines/mm grating at a Littrow ( 66) incident angle.
combining power 5 kW, 25 kW and 100 kW.
(4.2) Ipeak = 2P/(πω2
0
cos(α0))
10-2
100
102
104
106
0.1 1 10 100
25 kW
100 kW
5 kW
Beam 1/e2 Radius (mm)
Power Density on grating (kW/cm
2)
Figure 4.4: Average power densities on the combining grating (SBC) for combined powers of 5 kW,25 kW and 100 kW.
One way to mitigate the power density on the grating is to use a larger spot size
on the grating with narrower linewidth to maintain the combined beam quality. Yet,
smallest linewidth from an multi-stage MW-peak-power Yb-doped-fiber-amplifiers is
limited by spectral broadening of nonlinear effect, i.e. self-phase-modulation (SPM).
Assuming an unchirped Gaussian input pulse, the change in the pulse spectrum

107
due to SPM is given by δωmax = 0.86∆ωϕmax where ∆ω is the initial spectral width
and unchirped Gaussian pulse ∆ω = T−10 where T0 is the pulse duration. ϕmax is the
maximum phase shift defined by ϕmax = γP0zeff where γ is related to nonlinear index
coefficient n2 by γ = (n2ω0)/(cAeff ) Aeff is the effective core area and c is the speed
of light and ω0 is the angular frequency. zeff is the effective length of the amplifier
and related gain of the fiber g and length of the fiber L by zeff = [1− exp(gL)]/g
For n cascaded stages of amplifiers where each stage has different gain, core size
and length, the increase in spectral width δωmax for the overall system can be given
by,
(4.3) δωmax =n∑
i=1
0.86T−10
2πn2
λAeff(i)
Pi1− exp(giLi)
gi
where n is the number of amplifier stages, T0 is the initial pulse duration, n2 is the
nonlinear refractive index ( 3.2 × 10⁻²⁰m2/W for fused silica), λ is the wavelength
of the signal,Aeff(i), Pi, gi and Li the effective core area, input peak power, gain and
length of amplifier of ith stage respectively.
With parameters provided in [82] with assumption of equal gain per stage and
3dB interstage loss due to optical isolator, filter and coupling, Equation 4.3 gives the
increase in spectral width of ≈ 18 GHz, similar to empirical observation reported
in [82]. Hence, the spectral broadening of MW peak power pulses in a cascaded
multi-stage amplifier will induce tens of GHz spectral broadening even seeding with
unchirped transform-limited Gaussian pulses. This bandwidth leads to requirement
of < 1mm beam width on the grating to maintain mode quality with M2 < 1.2. With
this beam diameter, only up to ≈ 25 mJ of nanosecond pulses can be combined in by
gold coated grating with reported damage threshold at ≈ 0.8 J/cm2 for 1-ns pulses
[144].
Although all dielectric diffraction has a higher damage threshold up to 4.4 J/cm2

108
for 5 ns pulses [145] (which gives maximum combined energy ≈ 138 mJ), the spectral
bandwidth of such gratings are typically in the range of 15 nm to 20 nm [146],
which is too narrow to exploit the large gain bandwidth (≈ 60 nm) of Yb-dope fiber
amplifier [133]. Consequently, an alternative spectral combining scheme free from
spatial spectral dispersion will be desirable for combining fiber laser with MW peak
power output.
4.2 Spatial Dispersion Free Spectral Combining using Multilayer FilmFilters
4.2.1 Multilayer Thin Film Coating for High Power Application
Development of dielectric thin-film technology was driven in late 1990s by the de-
mand of wavelength-division-multiplexed optical communication-system during tele-
com boom. Current technologies for thin-film coating including electron-beam de-
position (e-beam), ion-assisted e-beam (IAD) and ion-beam sputtering (IBS) and all
the processes are conducted in a vacuum chamber.
In e-beam technology, materials heated by an e-beam, generated by hot filaments,
evaporate and condense on the substrate in the direct line of sight. IAD deposition
is similar to the e-beam deposition with an additional ion gun bombarding on the
substrate which help the vapor from the e-beam deposition to form a denser film.
In IBS (Figure 4.5), a metal or metal oxide target is irradiated by a high-energy
ion-beam from an ion source and a given molecule with ≈10 eV of energy is sputtered
from the surface of the target and deposited on the substrate. Due to the high thermal
energy, the molecules form a covalent bond upon deposition and result in a uniform,
dense and non-porous coating with superior adhesion.
The key parameters of the three deposition techniques are listed in Table 4.1. In
the IBS deposition, although the atom-by-atom removal is slower and the process is

109
Ion Source
Target
Sputtered Material
Substrate
Figure 4.5: Ion beam sputtering (IBS) offering a high degree of control on depositing the materialson the substrate.
E-beam IAS IBS
Cost least expensive in between most expensive
Density low medium high
Damage fluence 20-40 J/cm2 slight lower than E-beam 40J/cm2
(for ns-pulses)
Surface roughness 1 A 4 A rms < 1A for 50 layers
Advantages cost and versatility, higher packing density, near theoreticaleasily scalable processes can be used on plastic reflectance
Disadvantages porous film, low contamination not slower and expensive,packing density easily controlled can not be used
for UV coating
Table 4.1: Properties of the three commonly used thin-film coating methods
more expensive than e-beam or IAS, its higher damage thresholds, near theoretical
limits reflectance, low absorption, superior optical quality, excellent stress and envi-
ronmental sensitivity properties make IBS the ultimate choice for the production of
high power and high quality optical coatings.
Multilayer dielectric (MLD) filters had been widely used to multiplex high-power
semiconductor laser-diodes with different wavelengths to pump high-power fiber
lasers. However, due to its limited wavelength selectivity (sharpness), it has not

110
received much attention as a solution to high spectral-density beam combining. The
recent developments on the ion-beam-sputtering MLD filters have greatly improved
their efficiency (reflectivity/transmission), wavelength selectivity (sharpness) and en-
ergy/power damage threshold and make them a viable combining elements for high-
power efficient beam combining [147]. To study the feasibility of these combining
elements, we use a combining scheme relying on MLD filters rather than elements
using spatial-spectral dispersion.
Consequently, this approach offers the following principal advantages:
(i) It allows broad-bandwidth signals thus eliminating SBS-induced limitations
on individual-laser output power. Since each individual beam does not experience
any spatial dispersion in multilayer-film combining components, no beam divergence
in addition to diffraction is produced for a signal of any arbitrary spectral width.
This also eliminates the constrain on the beam size since beam size does not affect
combined-beam quality.
(ii) In principle, the MLD deposition on a flat glass substrate are much more
suitable for multi-kW power scaling compared to any grating structure. Existing ion-
beam-sputtered MLD filters fabricated on high quality flat glass substrates already
can withstand multi-kW powers without any observable thermal effects. Further
power scaling should be relatively straightforward and can be further facilitated by
the absence of principal constraints on the beam size.
(iii) These filters can be designed to be polarization insensitive for a certain inci-
dent angle up to 45. This significantly simplifies the requirements for a fiber laser
design, eliminating need for using the polarization-preserving fibers.
Based on MLD filters, a combining scheme (type I combiner), is illustrated in Fig-
ure 4.6, where the beam is multiplexed through reflection in the combining element
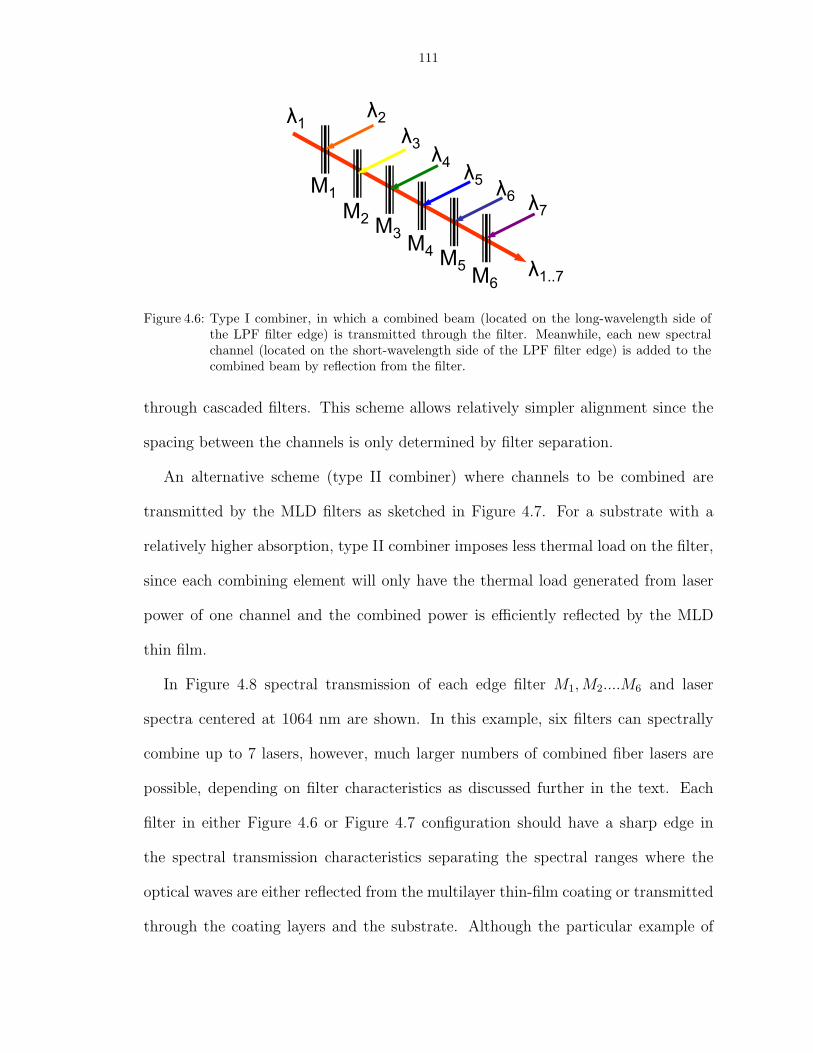
111
λ2
λ3λ4
λ5λ6
λ7
λ1
λ1..7
M2M3
M4M5M6
M1
Figure 4.6: Type I combiner, in which a combined beam (located on the long-wavelength side ofthe LPF filter edge) is transmitted through the filter. Meanwhile, each new spectralchannel (located on the short-wavelength side of the LPF filter edge) is added to thecombined beam by reflection from the filter.
through cascaded filters. This scheme allows relatively simpler alignment since the
spacing between the channels is only determined by filter separation.
An alternative scheme (type II combiner) where channels to be combined are
transmitted by the MLD filters as sketched in Figure 4.7. For a substrate with a
relatively higher absorption, type II combiner imposes less thermal load on the filter,
since each combining element will only have the thermal load generated from laser
power of one channel and the combined power is efficiently reflected by the MLD
thin film.
In Figure 4.8 spectral transmission of each edge filter M1, M2....M6 and laser
spectra centered at 1064 nm are shown. In this example, six filters can spectrally
combine up to 7 lasers, however, much larger numbers of combined fiber lasers are
possible, depending on filter characteristics as discussed further in the text. Each
filter in either Figure 4.6 or Figure 4.7 configuration should have a sharp edge in
the spectral transmission characteristics separating the spectral ranges where the
optical waves are either reflected from the multilayer thin-film coating or transmitted
through the coating layers and the substrate. Although the particular example of
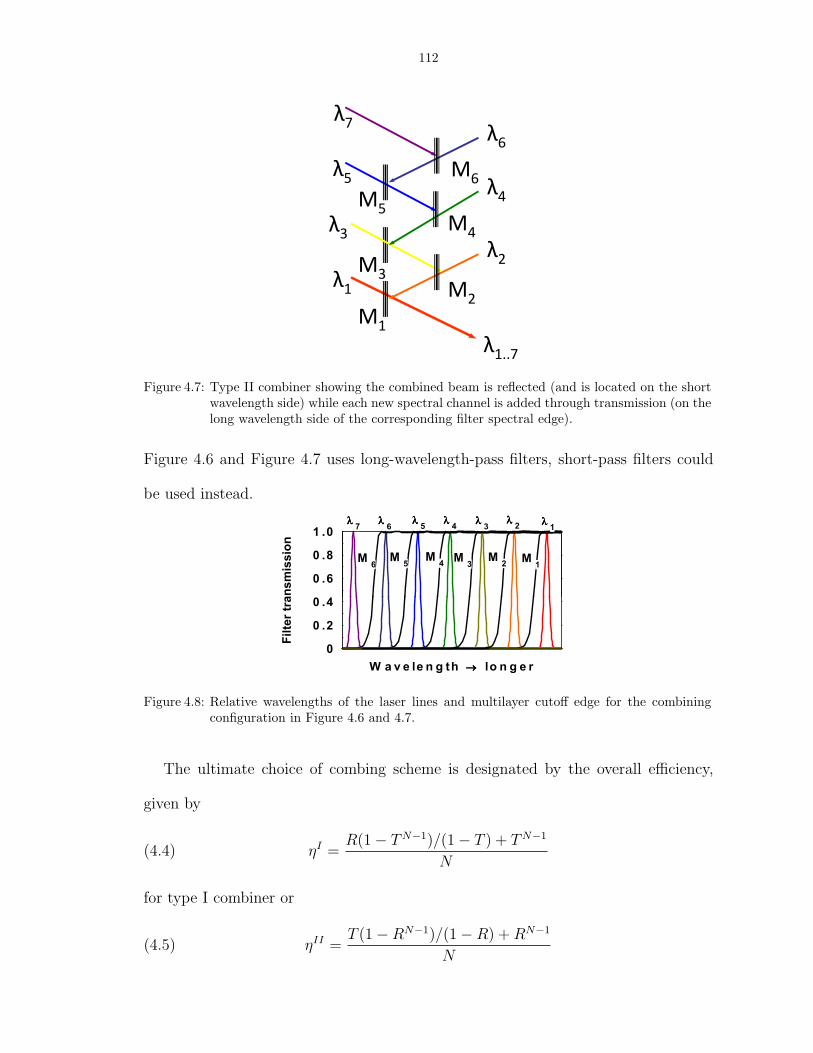
112
λ
λ4
λ5
λ6
λ7
M
M5
M6
λ1..7
λ2
λ3
λ1 M
2
M3
M4
M1
Figure 4.7: Type II combiner showing the combined beam is reflected (and is located on the shortwavelength side) while each new spectral channel is added through transmission (on thelong wavelength side of the corresponding filter spectral edge).
Figure 4.6 and Figure 4.7 uses long-wavelength-pass filters, short-pass filters could
be used instead.
0 .4
0 .6
0 .8
1 .0
M6
M5
M4M
3M
2M
1
λλλλ1
λλλλ7
λλλλ6
λλλλ5
λλλλ4
λλλλ3
λλλλ2
ansmission
0
0 .2
0 .4
W a v e le n g th →→→→ lo n g e r
Filter tra
Figure 4.8: Relative wavelengths of the laser lines and multilayer cutoff edge for the combiningconfiguration in Figure 4.6 and 4.7.
The ultimate choice of combing scheme is designated by the overall efficiency,
given by
(4.4) ηI =R(1− TN−1)/(1− T ) + TN−1
N
for type I combiner or
(4.5) ηII =T (1−RN−1)/(1−R) + RN−1
N

113
for type II combiner and where N is number of channels, T is the transmission,
and R is the reflectivity. Applying Equation 4.4 and 4.5, Figure 4.9 predicts the
channel-number scaling as a function of filter efficiencies (T and R) for both types
of combiners. In order to combined 40 channels with 90% of total efficiency, each
0.80
0.82
0.84
0.86
0.88
0.90
0.92
0.94
0.96
0.95 0.96 0.97 0.98 0.99 1.00
Assuming R=0.95 for Type I or T=0.95 for Type II
98.6%99.4%
99.7%
96.8%
N=40N=20
N=10
N=5
Transmission (for Type I) or Reflectivity (for Type II)
Overa
ll C
om
bin
ing E
ffic
iency (ηη ηη)
Figure 4.9: Analysis showing the requirement on the filter transmittance of type I combiner/ thefilter reflectivity for type II to achieve overall combining efficiency > 90% for 5, 10, 20and 40 channels (N) with an assumption of R=0.95 for type I and T=0.95 for type II.
is required to have 99.7% of reflectivity/tranmission. If the filter has lass than 97%
of reflectivity/tranmission, only 5 channels can be combined with > 90% efficiency.
Therefore, a slight increase in the reflectivity/tranmission will yield a much higher
channel density to reach the > 90% overall efficiency.
The other limitation on the channel density is imposed by the maximum numbers
of channels:
(4.6) Nmax = ∆λGain/(∆λF + ∆λL)
where ∆λGain is the gain-bandwidth of the Yb fiber (≈ 60nm), ∆λF is the transition
width of the filter (sharpness) and ∆λL is the linewidth of the laser. Therefore, it is
obvious that both filter sharpness and linewidth are critical to the channel density. In
order to pack 30 channels into the gain-bandwidth of the Yb fiber, it merely requires

114
a 1-nm sharpness for the filter and 1-nm spectral width for the laser output, both
requirements are relatively easy to achieve for the filter and for the laser, even with
very high output peak power.
The thermal load depends greatly on the filter efficiency and
(4.7) H = Ptot(1− ζ)/(πω20)
gives the highest thermal load imposing on the last combining element where H is
the thermal load (W/cm2) and is ζ replaced by T for type I combiner and by R for
type II combiner. We can see that one can effectively reduce the thermal load by
increasing the reflectivity/transmission on the last filter or increase the beam width
on the combining element, both are relatively easier to achieve by using multilayer
dielectric filter as combining elements.
Other key characteristics of this combining scheme are determined by the following
main spectral filter characteristics:
(i) Sharpness of the spectral edge determines the ultimate spectral density of the
combined laser channels.
(ii) Long-wavelength transmission for the configuration Figure 4.6 or, alterna-
tively, short-wavelength reflectivity for the configuration Figure 4.7 will critically
determine the achievable maximum combining efficiency and its scalability with the
increasing number of combined channels.
(iii) The optical damage level and residual absorption in the combining filters
determines the power handling capability of this scheme.
4.3 Spectral Combining Filter Characterization
An off-the-shelf ultra-steep long pass filter (LPF) was characterized using a diffraction-
grating base wavelength single-polarization tunable fiber laser. The transmission

115
characteristics with a 14 incident angle is plotted in Figure 4.10, which shows the
transmission > 95% in the pass band and a sharp transition of 0.8 nm from 10% to
90% transmission point. The cut-off wavelength can be precisely tuned by the inci-
dent angle of the laser beam and the same multilayer coating covers a wide range of
spectrum, which will be ideal to utilize the large bandwidth of Yb-doped amplifiers.
00.10.20.30.40.50.60.70.80.91.0
1058.5 1059.0 1059.5 1060.0 1060.5 1061.0 1061.5
~0.8nm
Wavelength (nm)
Tran
smis
sion
Figure 4.10: Transmission curve for 14 tuning angle showing a sharp transition of 0.8 nm from10%-90%-transmission points.
The 50% and 90% transmission curve for s- and p- polarizations can be plotted as
shown in Figure 4.11 using the parameters provided by the filter manufacturer using
the following equation.
(4.8) λ(θ) = λ0
√1− (
sin θ
neff
)2
using neff 2.0815 for Ts=90% 2.860 for Ts=50% 1.6191 for Tp=90% 1.6199 for
Tp=50% Figure 4.11 plots the dependence of cutoff wavelength on the incident angle.
A 45-nm shift in the cutoff wavelength can be achieved by a moderate tuning
angle of 28 as shown in Figure 4.12 and filter transmission and sharpness remain
the same despite of the wide wavelength tuning, which is a critical characteristics for

116
1035
1040
1045
1050
1055
1060
1065
1070
0 5 10 15 20 25
P(50%)P(90%)S (50%)S (90%)
Angle of Incident (degree)
Wav
elen
gth
(nm
)
Figure 4.11: The angle tuning characteristics of the particular filter tested. Note that the curve ispolarization sensitive, which means that the s and p polarization work at the normalincident angle. As the angle of incident increases, the cutoff wavelengths for bothpolarizations begin to walk off and the splitting will become more dominant at largerincident angles.
0
0.1
0.2
0.3
0.4
0.5
0.6
0.7
0.8
0.9
1.0
1000 1010 1020 1030 1040 1050 1060 1070 1080
0º 14º 28º
Wavelength (nm)
Tran
smis
sion
Figure 4.12: Measured filter transmission at three incident angles showing a spectral shift of 45 nmwith 28 of tuning for p-polarized light. The transmission is measured to be > 95%independent of incident angle.

117
the combining density over a broad range of spectrum. Using an experimental setup
with 8 reflections at wavelengths of 1050 nm, 1055nm, 1060 nm, 1065 nm (Figure
4.13), and 1070 nm, reflectivity was measured to be > 99.7% for wavelengths shorter
than the cutoff wavelengths. Conclusively, the high reflectivity makes this filter ideal
for the combining configuration as shown in Figure 4.7 in which each individual
channel will transmit through one filter and reflect through the rest of the combiner.
Using the measured transmission of 95% and reflectivity of 99.7%, Equation 4.5 that
up to 37 channels can be combined with overall efficiency > 90% assuming equal
power in each channel.
Figure 4.13: Experimental setup for multi-pass reflectivity measurement. Two multi-layer mirrorare placed in parallel to each other with separation of 35 cm. Collimated beam ofnarrow bandwidth single frequency laser is used to test at the wavelengths of 1050nm, 1055 nm, 1060 nm, 1065 nm and 1070 nm with small incident angle. Reflectivitiesare measured to be greater than 99.7% for the above mentioned wavelengths.
The filter is manufactured by ion-beam-sputtered dielectric-thin-film-coating [147]
and therefore is capable of sustaining high damage fluence greater than 1 J/cm2 (for
10-ns pulses and the quoted number specified by manufacturer was tested by laser
with wavelength of 532 nm, for 1064 nm the expected damage fluence is twice this
number, which is 2 J/cm2)and > 10 − 100kW/cm2 average power density (note:
as a rough rule of thumb provided by the filter manufacturer, the damage power
density is 10-100 times in the unit of kW/cm2 of the damage fluence in the unit of

118
J/cm2). Such high damage thresholds offer superior energy and power scalability
for combining both pulsed and CW lasers. In general, multilayer film filters are
polarization sensitive, given that the cut-off wavelengths for s- and p- polarization
state are only the same at the designed working incident angle and the difference
between cutoff wavelengths for the two polarization states becomes larger as the
angle of incidence increases. The walk off in cutoff wavelengths will be detrimental
for combining efficiency and should be taken into consideration as will be discussed
later in the text.
4.4 Experimental Setup for High Power SBC Demonstration
Previous work in SBC combined individual laser channels with a well-defined
wavelength and bandwidth, hence, yielding the overall system cost proportional to
the channel numbers. One path to a more compact and cost-effective spectral com-
bining system can be realized from the Master Oscillator Power Amplifier (MOPA)
configuration as in most of high energy pulsed amplifiers [79, 80, 79, 66, 72, 75, 148].
Here we propose a compact high-power SBC laser architecture with only one LMA
power amplification stage for each spectral channel-amplifier. All channel-amplifiers
are seeded from a common seed source. The output of the seed source is distributed
spectrally by the MLD filters, (the same kind as those used in the combiner), to
seed the channel-amplifiers. This arrangement effectively reduced the overall system
complexity since the duplication is only needed at the channel-amplifiers instead of
having a whole multi-stage MOPA system for each individual channel.
The seed source is a four-stage MOPA with the same architecture described in [77]
comprising an electric-pulse-driven Fabry-Perot semiconductor laser diode emitting
at the wavelength centered at 1057 nm. The seed pulse from the laser diode is

119
AO
M
SM 974-nm pump diodesArbitrary
Waveform Generator
MM 974-nm pump diodes
4.3m 30 µm Yb PM-LMA
1.8 m 65-µm Yb LMA
70W Pump diode
Seed MOPA Output
FP Seed Diode
Figure 4.14: The four-stage system consisting of the seed MOPA using a monolithic fiber lasersystem and single mode output.
pre-amplified by three stages of all monolithic, single-mode operating, polarization
maintaining fiber amplifiers (two stages with telecom-graded components and one
30-µm LMA stage). The fourth stage is a free-space-coupled power amplifier with
large-mode-area (LMA) fibers, amplifying the pulse to MW peak-powers by a 65-µm-
diameter 0.06-NA core. Single-mode operation is achieved by careful mode-excitation
and fiber-coiling, giving a measured M2 ∼ 1.05.
Figure 4.15 illustrates the SBC setup consisting of the seed splitter, the channel-
amplifiers and the output combiner. Seed splitter with MLD filters F1 and F3,
spectrally divide the beam from seed source into three components, namely blue (the
channel with the shortest wavelength), green, and red channels (the channel with the
longest wavelength), for the ease of description throughout this paper. The angle of
incident for each filter is chosen to optimize the performance of channel-amplifier in
accordance to the wavelength-dependent gain of Y b3+. Average power and energy
scaling were done with different filter angles to adapt the spectral difference in the

120
seed source at different operating conditions.
LMA 80/400
F5
Pump1
Pump2
Pump3
InputOutput
F6
F1 F2 F3 F4
Figure 4.15: Spectral beam combining experimental setup shows splitting filters F1 and F3 which areused to separate a broad spectrum of input beam center at 1059 nm into three spectralcomponent seed. The edges of splitting filters are chosen to provide sufficient seed forthe LMA 80/400 stage for efficient power/energy extraction. Cleaning filters F2 andF4 are used to increase spectral spacing between seed channels to avoid overlapping.Combining filters F5 and F6 are used at the output of the amplifier. Note that twocombiner filters are only separated ≈ 3 cm.
Since the seeds for the three channels are generated by splitting an output of
a broad band spectrum, the intrinsic transition width of MLD filters Figure 4.10
will result in an overlapping of two adjacent seed channels, which will deteriorate
the combining efficiency of the combiner. The overlapping can be truncated by
introducing additional spectral cleaning filters F2 and F4 as shown in Figure 4.15
to improve the combining efficiency while maintaining a small channel separation.
Given that the seed source provides a sufficient seed power/energy, this marginal
loss in the seed power will not cause any degeneracy on power/energy extraction
efficiency.
We use a fiber core with an 80-µm-diameter and 0.06-NA core for the channel-
amplifiers based on the consideration of low nonlinearity. The fiber is not polarization-
preserving and is not ideal to use with the polarization-sensitive sample filters avail-
able to us. However, it is chosen merely for the study the feasibility of high power
and high energy scaling of this spectral combining scheme.

121
Each amplified spectral components are separately collimated to an 1/e2 diameter
∼ 2 mm and spectrally multiplexed with combiner, (step edge dielectric filters F5 and
F6). Edges of the spectral components in the combiner are aligned for an optimum
combining efficiency. To align the beams coaxially, a charge-coupled device (CCD)
camera was used to overlap the beams in the far field and at the focus of a 200
mm plano-convex lens. The optical delay lines at the input of the three channels as
shown in Figure 4.15 are used to align the optical path of each channel for the pulse
temporal overlapping.
4.5 Results
High average power combining and high energy combining are studied under dif-
ferent seeding conditions. In the study of high average power scaling, the squared-
seed-pulses with a higher repetition rate were used to operate below the onset of
nonlinearity, while longer pre-shaped pulses with a slow-rising edge were used to
optimize the energy extraction at a lower repetition rate.
4.5.1 Power Scaling Demonstration
The pulses with a repetition rate of 100 kHz and durations of 2 ns are chosen
to explore power scalability. In order to better characterize the potential of this
combining scheme, we defined the combining efficiencies by dividing the output power
for each channel after the spectral combiner by the power in single polarization at
the output of the channel-amplifier. Since the purpose of this experiment is to study
the feasibility of this combing scheme, this decision was justified by two reasons.
First is there exists no principal limitation on the mode area for PM fiber and
recent development had already advanced PM-LMA fiber to MFA to 2300 µm2.
Secondly, MLD filters can be made polarization-insensitive by custom-design for a
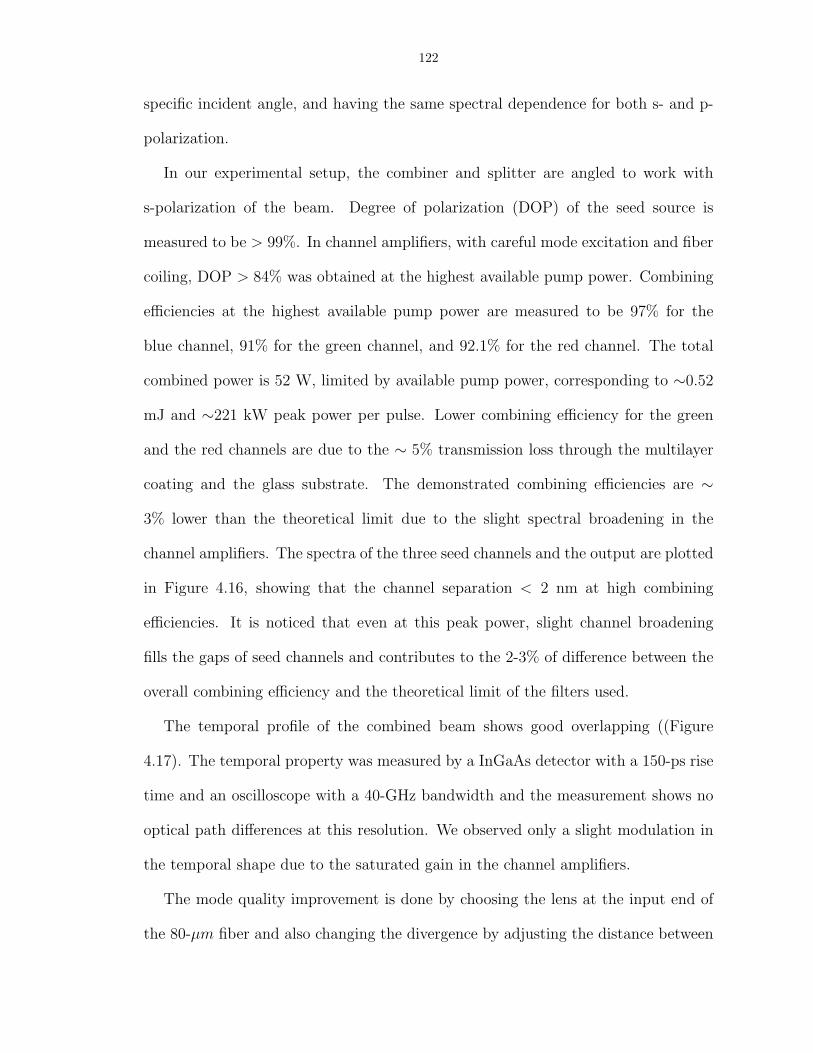
122
specific incident angle, and having the same spectral dependence for both s- and p-
polarization.
In our experimental setup, the combiner and splitter are angled to work with
s-polarization of the beam. Degree of polarization (DOP) of the seed source is
measured to be > 99%. In channel amplifiers, with careful mode excitation and fiber
coiling, DOP > 84% was obtained at the highest available pump power. Combining
efficiencies at the highest available pump power are measured to be 97% for the
blue channel, 91% for the green channel, and 92.1% for the red channel. The total
combined power is 52 W, limited by available pump power, corresponding to ∼0.52
mJ and ∼221 kW peak power per pulse. Lower combining efficiency for the green
and the red channels are due to the ∼ 5% transmission loss through the multilayer
coating and the glass substrate. The demonstrated combining efficiencies are ∼
3% lower than the theoretical limit due to the slight spectral broadening in the
channel amplifiers. The spectra of the three seed channels and the output are plotted
in Figure 4.16, showing that the channel separation < 2 nm at high combining
efficiencies. It is noticed that even at this peak power, slight channel broadening
fills the gaps of seed channels and contributes to the 2-3% of difference between the
overall combining efficiency and the theoretical limit of the filters used.
The temporal profile of the combined beam shows good overlapping ((Figure
4.17). The temporal property was measured by a InGaAs detector with a 150-ps rise
time and an oscilloscope with a 40-GHz bandwidth and the measurement shows no
optical path differences at this resolution. We observed only a slight modulation in
the temporal shape due to the saturated gain in the channel amplifiers.
The mode quality improvement is done by choosing the lens at the input end of
the 80-µm fiber and also changing the divergence by adjusting the distance between

123
0
0.02
0.04
0.06
0.08
1045 1050 1055 1060 1065
red seedgreen seedblue seedcombined output
∆λ~0.5nm∆λ~2nm
λ (nm)
Pow
er (a
.u.)
Figure 4.16: Seed spectra for three channels and combined output spectrum. The structures in thespectra are longitudinal modal structure of the Fabry-Parot seed diode.
0
0.025
0.050
0.075
0.100
-4 -3 -2 -1 0 1 2 3 4 5 6 7 8
Amplified pulses @52W after combinerSeed pulses
τ (ns)
Nor
mal
ized
Am
plitu
de (a
.u.)
Figure 4.17: Temporal profiles of the input and amplified pulses after combiner showing a goodtemporal overlapping on a nanosecond scale. Slight temporal shortening of the ampli-fied pulse is due to the gain saturation of the amplifier. The detector used here has a150-ps rise time, along with a 40-GHz-bandwidth oscilloscope.

124
the collimating telescope after the 65-µm fiber. A CCD camera was used to optimize
the modal distribution to ensure maximum energy distributed in the center-lobe of
the core, resulting in an optimized distribution in the fundamental mode (LP01).
Figure 4.18 shows the far-field output beam profiles for each individual channel after
the combiner and the combined-beam. The combined-beam intensity distribution
shows that beam qualities of individual laser channel were preserved after the MLD
filters in spite of significantly broad spectral width.
a
dc
b
Figure 4.18: Beam profiles after 80-µm fiber for the (a) blue channel (b) green channel (c) redchannel, and (d) combined beam profile.
Characterized by M2, the mode quality of the individual channels after the com-
biner the combined beam are measured. An Ophir CCD camera was used to measure
the full-width half maximum (FWHM) of the beam profiles over a range more than
four times Rayleigh range.
For the individual channels, near diffraction limited beams was obtained for red
and green channel with the M2 ≈ 1.20 and ≈ 1.30 for red channel as shown in Figure
4.19, the M2 ≈ 1.26 and ≈ 1.42 for green channel as shown in Figure 4.20.
Since the distance from the output of 65 µm fiber to the input end 80 µm fiber

125
0
500
1000
1500
2000
0 100 200 300
M2~1.20(a)
Position (mm)
FWH
M B
eam
Dia
met
er (µ
m)
0
500
1000
1500
2000
0 50 100 150 200 250 300
M2~1.30(b)
Position (mm)
FWH
M B
eam
Dia
met
er (µ
m)
Mode quality red channel
Figure 4.19: Mode quality measurement for red channel output with measured M2 of 1.20 and 1.30for the horizontal and vertical axes.
0
200
400
600
800
1000
0 50 100 150 200 250 300 350 400
M2~1.26
Position (mm)
FWH
M B
eam
Dia
met
er (µ
m)
Green Channel Horizontal
0
250
500
750
1000
0 50 100 150 200 250 300 350 400
M2~1.42
Position (mm)
FWH
M B
eam
Dia
met
er (µ
m)
Green Channel Vertical
Figure 4.20: Mode quality measurement for green channel with measured M2 of 1.26 and 1.42 forthe horizontal and vertical axes.
is different for each individual channels, the convergence of the beam can not be
optimized for all inputs of three channels. Also, due to a tighter coiling radius and
less optimized mode excitation condition in the blue channel gain fiber, larger M2
of ≈ 2.63 and ≈ 2.41 are measured.
0
500
1000
1500
-400 -300 -200 -100 0 100
M2~2.63
Position (mm)
FWH
M B
eam
Dia
met
er (µ
m)
Blue Channel Horizontal
0
500
1000
1500
2000
2500
-400 -300 -200 -100 0 100
M2~2.41
Position (mm)
FWH
M B
eam
Dia
met
er (µ
m)
Blue Channel Vertical
Figure 4.21: Mode quality measurements for the blue channel with measured M2 of 2.63 and 2.41for the horizontal and vertical axes.
The degraded mode quality in the blue channel contributed to the degradation
of the overall mode quality and M2 of the combined beam, measured to be ≈ 1.85
(Figure 4.22) for both axes.

126
0
200
400
600
800
1000
0 50 100 150 200 250 300 350
M2~1.82(c)
Position (mm)FW
HM
Bea
m D
iam
eter
(µm
)
0
200
400
600
800
1000
1200
0 100 200 300 400
M2 ~ 1.85(d)
Position (mm)
FWH
M B
eam
Dia
met
er (µ
m)
Mode quality combined beam
Figure 4.22: Mode quality measurement for the combined beam with measured M2 of 1.82 and 1.85for the horizontal and vertical axes.
4.5.2 Spectrally Combined Energy Scaling
In a separate experiment, longer preshaped pulses with a slow rising edge and
FWHM duration ∼ 6 ns at a repetition rate of 1 kHz were used to study the energy
scalability. In the high pulse energy region, spectral broadening becomes detrimental
for the combining efficiency since it will result in channel overlapping, therefore, the
channel separation was increased to ∼ 4 nm to minimize the channel overlapping due
to spectral broadening. In the last stage amplifier seeded with ∼ 4 nm spectral-width
input, we observed 38% of broadening on the FWHM spectral width due to four-
wave-mixing [87] when amplified to a peak power of 130 kW (1.11 mJ), and 76%
of spectral broadening when amplified to 1.16 MW (5.09 mJ)(Figure 4.23). (The
discrepancies between the peak power and the energy are due to the saturated-gain-
induced temporal deformation.)
We also noticed that the degree of polarization decreases from 82.5% at 1 mJ
to 58% when amplified to 3.6 mJ. We attribute the DOP degradation to the gain
saturation of the fundamental mode (with saturation energy ∼ 1.8mJ for this fiber).
As a result, the higher order modes, possessing different polarization state than the
LP01 mode, are amplified more beyond the saturation of the fundamental mode.
Observed by a CCD camera, the degradation of the modal distribution is confirmed
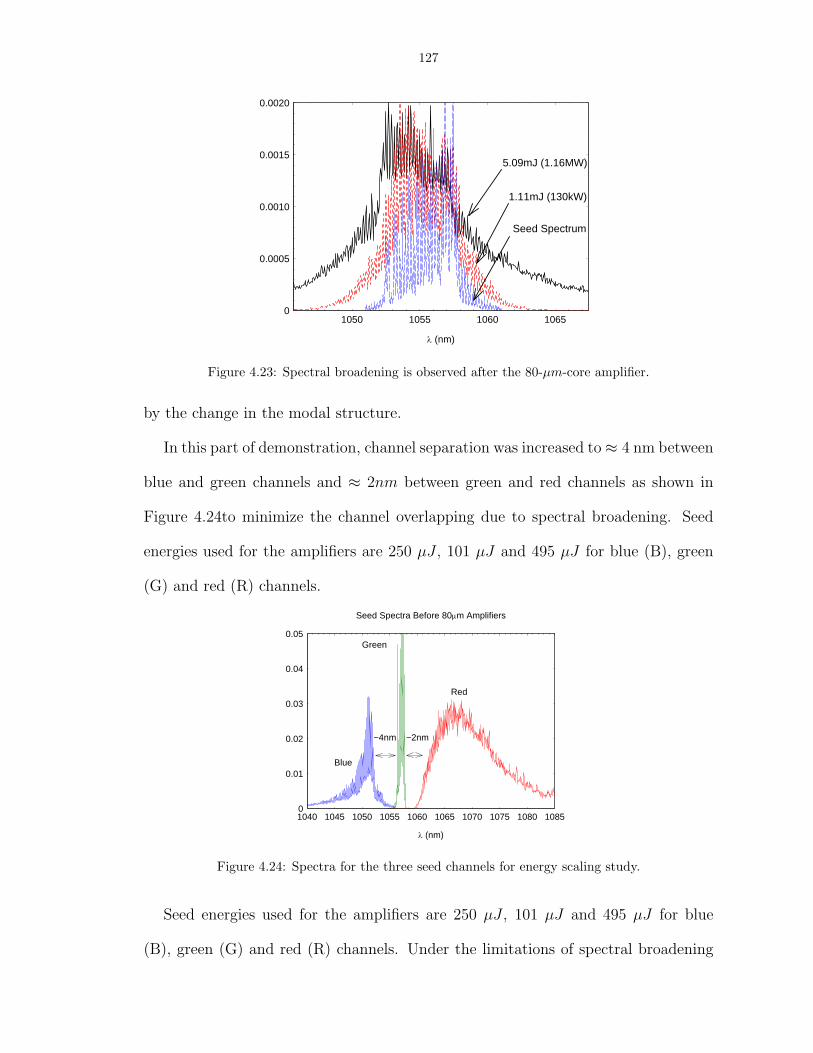
127
0
0.0005
0.0010
0.0015
0.0020
1050 1055 1060 1065
5.09mJ (1.16MW)
1.11mJ (130kW)
Seed Spectrum
λ (nm)
Figure 4.23: Spectral broadening is observed after the 80-µm-core amplifier.
by the change in the modal structure.
In this part of demonstration, channel separation was increased to≈ 4 nm between
blue and green channels and ≈ 2nm between green and red channels as shown in
Figure 4.24to minimize the channel overlapping due to spectral broadening. Seed
energies used for the amplifiers are 250 µJ , 101 µJ and 495 µJ for blue (B), green
(G) and red (R) channels.
0
0.01
0.02
0.03
0.04
0.05
1040 1045 1050 1055 1060 1065 1070 1075 1080 1085
Blue
Green
Red
~2nm~4nm
λ (nm)
Seed Spectra Before 80µm Amplifiers
Figure 4.24: Spectra for the three seed channels for energy scaling study.
Seed energies used for the amplifiers are 250 µJ , 101 µJ and 495 µJ for blue
(B), green (G) and red (R) channels. Under the limitations of spectral broadening

128
and degradation in DOP, we only report the highest combined energy before the
combining efficiencies degenerated. Amplified output energies of individual channels
after the combiner are 1.25 mJ (B), 1.02 mJ (G) and 1.76 mJ (R) with combining
efficiencies of 92% (B), 87% (G) and 92% (R) respectively, and the combined energy
of 4.03 mJ with peak power of 0.714 MW.
0
0.1
0.2
0.3
0.4
0.5
0.6
0.7
0 5 10 15 20 25
Amplified Red 1.76mJAmplified Green 1.25mJAmplified Blue 1.02mJAll 4.03mJ
τ (ns)
Pea
k P
ower
(a.u
.)
Figure 4.25: The output pulse shapes of individual channels and combined beam show reshapingby gain saturation since all the energy in each individual is higher than saturationenergy of the 80-µm-core fiber. Lower output energy after the combiner is due to thepolarization degradation.
4.6 Conclusion
In this chapter, we proposed a spectral-beam-combing scheme using non-spatial-
dispersive multilayer-dielectric filters. This combining scheme imposes no constraint
on the laser line-width and the beam-width to maintain the combined-beam mode-
quality. Analysis showed that up to 37 channels can be combined with the measured
characteristics of a commercially available filter, and further channel scaling is pos-
sible with improved filter sharpness and efficiency. This combining scheme is ideal
to work with laser with simultaneous MW peak- power and multi-kW average-power
since there exists no trade-off on the laser line-width and the beam-size. Experi-
mental results also verified this effective combining scheme using three channels of

129
spectrally-broad lasers. We achieved > 91% of combining efficiency, > 52 W of com-
bined power and M2 ∼ 1.8 for the combined beam in the study of average-power
combining. 4.03 mJ with peak of 0.714 MW is also reported in the study of high-
energy combining capability. The combined energy is limited by channel overlapping
due to nonlinear spectral. Higher combined peak power and energy is possible using
lasers of distinct wavelengths.
In conclusion, this SBC method using MLD filters offer a solution for combining
high-peak-power fiber laser with broad spectral bandwidth. Concurrently, high aver-
age power can be realized using large beam-width on the combining element without
thermal damage or wavefront distortion. It is not unreasonable to picture 25-kW
combined-power from a spectrally-combined all-fiber-laser-based system for a EUV
lithography light source.

CHAPTER V
Conclusion and Future Work
In this last chapter, the key results demonstrated in the work of dissertation
and their significance will be summarized. The future outlook associated with the
research topics in this dissertation will also be discussed.
5.1 Contributions and Conclusions
Motivated by the urgent need for the production-worthy lithography steppers of
the next-generation, the work in this dissertation focused on the development of the
fiber-laser technologies for a high-power EUV-lithography light source. The research
in this dissertation covered the design and the study of a pulsed-fiber-laser EUV
driver; efficient EUV demonstrations using Sn targets; and the concept and the
validation of a non-spatial-dispersive spectral-combining scheme to combine lasers
with a concurrent MW peak power and a kW average power.
In Chapter II, using Yb-doped large-mode-area fibers, we developed a single-
emitter-fiber integrated module (SEFIM), constituting the basic building block for a
25-kW fiber-laser system. Given the pulse parameters of the solid-state lasers used
in a previous efficient-EUV demonstration, the 80-µm-core LMA fiber used in this
study can provide the required intensity level with its MW peak power and its close-
to-diffraction-limited beam quality, and therefore is the fiber-of-choice for SEFIM.
130
131
In spite of its very large mode-field area of 2750 µm2, the output beam of the 80-
µm-core fiber has a beam quality of M2 ≈ 1.3, achieved by careful mode-matching
and tight fiber-coiling. A large mode-field-area provides higher nonlinear thresholds,
allowing the output peak powers at the multi-MW level. We demonstrated a record
high peak-power of 6 MW with 110-ps pulses from a gain-switched Fabry-Perot laser
diode. MW peak-powers were also obtained at longer pulse durations of up to 6 ns.
We found that the limitation of the peak power extraction for this fiber length is the
nonlinearity of stimulated Raman scattering.
The ultimate limit of the peak power extractable from a fiber-laser amplifier is
caused by catastrophic self-focusing. Our numerical analysis using the Fast-Fourier-
Transform Beam-Propagation-Method showed that the beam diameter will gradually
decrease as the peak power is approaching its self-focusing critical peak power in a
cylindrical waveguide.
We also investigated the energy extraction and the temporal pulse deformation
due to the gain-saturation from the LMA fiber experimentally and numerically using
an arbitrary waveform generator. We found that the behavior of pulse-shaping in a
saturated-gain amplifier can be accurately predicted with a simple numerical model
based on saturation fluence. The same model can also synthesize the required input-
pulse shape for a specific output-pulse shape in a multi-state cascaded-amplifier. We
also found that the energy extraction, independent of the input-pulse shape, agreed
well with the Frantz-Nodvick Model.
The implementation of the arbitrary waveform generator as the seed driver en-
abled the pulse-shaping capability. This capability can not only allow us to provide a
preshaped input pulse to compensate gain saturation, it can also generate pre-pulses
that will help optimize the plasma condition in the EUV-generation study. An av-

132
erage power of 140W is obtained from the system with a special design of forced
cooling. The first atmospheric breakdown by a fiber laser is also reported using the
high peak-power and the high focusability of the fiber-laser output.
In Chapter III, we verified the SEFIM we developed as being an efficient EUV
driver by two experimental demonstrations. We first achieved a conversion efficiency
(CE) of ∼ 1% using a planar soild-Sn target at an intensity of ∼ 1.2× 10¹⁰W/cm2.
This result, to the best of our knowledge, is the first EUV-generation using a fiber
laser. However, the debris generated from a solid-Sn target contaminated the optics
quickly and make it unfeasible for long-term operation.
In a second demonstration to investigate a realistic target solution, we used the Sn-
doped water-droplet targets developed by UCF in the next set of experiments. These
water-droplet targets are suitable to use in a production-worthy EUV system due
to their compatibility of a high-repetition-rate operation and their intrinsic debris-
free characteristics. We demonstrated a conversion efficiency of ∼ 2.1% at a pulse
duration of 6 ns, proving that the fiber lasers are equally efficient as the solid-
state lasers in EUV genration, regardless of a very different laser parameter space
between the two types of lasers. The highest conversion efficiency was achieved at
the intensity of 8.8× 10¹⁰W/cm2, and CE declined beyond this intensity, indicating
this as optimum condition for efficient EUV generation.
This study using other pulse durations revealed that conversion efficiency is highly
dependent on the pulse duration; the 6-ns laser pulses generated a conversion effi-
ciency three times higher than the CE generated by the 1.7-ns pulses, even though
a higher intensity was achievable by the shorter pulses. Conversion efficiencies can
also be scaled by preheating the plasma using prepulses. We found that using the
45-ns-delay and a 1-to-10-ratio prepulse will improve the conversion efficiency by a
133
factor of two. This finding is consistent with the reported studies using the prepulses
from the solid-state lasers.
The important difference of generating prepulses from the two types of lasers
is that the prepulses can be generated from the same output of the fiber laser,
while a wavelength- /or polarization-combining is required to generate prepulses in
solid-state lasers. This successful demonstration of high conversion efficiency with
relatively low energy pulses constitutes the first step on a technological path toward
fiber-laser-driven high-power EUV sources for high-throughput lithography steppers.
In Chapter IV, we proposed a new high-power spectral-beam-combining scheme
based on sharp-spectral-edge multilayer dielectric filters. This scheme does not
use spectral spatial dispersion, and therefore, is free from constraints on the laser
linewidth and the beam size inherent in conventional diffraction-grating-based beam-
combining approaches. Consequently, it enables multi-kW combined powers using
already-existing fiber and coating technologies with a ∼ 2nm spectral inter-channel
separation.
We proposed two combining arrangements based on this approach, both suitable
for long-pass filters or short-pass filters. The choice of the arrangement depends
on the filter efficiencies. The filter sample has a measured reflectivity > 99.7%,
a transmission > 95% and a sharp spectral-transtion width of 1 nm, giving a po-
tential of combining 37 equal-power-channels with a overall efficiency > 90%. An
experimental study of this combining scheme shows a > 91% efficient combination
of three nanosecond-pulse fiber laser beams with 52-W combined power and 4.0-
mJ combined energy. This scheme is particularly well-suited for high-energy-pulse
power-combining due to the inherently broad bandwidth, providing an unrivaled
solution to reach the power level required by an all-fiber-laser-based EUV driver.

134
5.2 Future Outlook
A great deal of experimental and theoretical work remains to achieve a fully inte-
grated system for the EUV lithography source. We only listed the critical challenges
foreseen during our research work in the following sections.
5.2.1 Power Scaling of SEFIM and Limitations
In Chapter II, the highest average power achieved was 140 W, and we attributed
the limitation to the fiber polymer coating. This conclusion was drawn from the
fact that each successive fiber damage occurred at a lower pump power level during
the fiber-damage test. With improved coating process, we should be able to extract
the power from the amplifier with the only limitation of the highest available pump
power.
As mentioned before, with the available pump power and the demonstrated slope
efficiency, we should be able to reach an average power output at 280 W. Further
power scaling is also possible by having a higher pump power. However, the ultimate
limitation will then be on the thermal-dissipation capability of the current thermal
design. Also, one can implement dual-end pumping to have a more distributed
thermal density along the fiber, alleviating the thermal design requirement imposed
by single-end pumping. Free-space-coupling of the pump power was used in the
power amplifications stages in the current SEFIM, which was only temporary for
this experimental study.
For an industry-applicable system, it must be made monolithic to achieve the
anticipated robustness. Current monolithic pump-combiner technologies allow the
combination of the pump power from numbers of diode lasers to a multi-kW level.
However, these combiners have only been applied to CW fiber lasers. For the pulsed
135
fiber laser, the splice-point for this combiner will become a potential problem for
very high peak power pulses, especially at the output of the final stage amplifier
with MW-peak powers. One can also reduce the power through a combiner by
reversing the pump direction, (i.e. co-propagating pumping), with the trade off of a
longer effective length and a lower nonlinear threshold.
The use of a conventional step-index fiber merely served the purpose of the feasi-
bility study. For a practical monolithic system, effectively single-mode LMA fibers,
such as CCC fibers [59], should be implemented for a truly robust system. More-
over, a good control on the spectral properties is sought-after to reduce the channel
overlapping and increase the combining efficiency as mentioned in Chapter IV. We
attributed the nonlinear broadening in our system to the multiple longitudinal modes
of the Fabry-Perot seed diode. Implementation of other seed sources, such as DFB or
DBR diodes with very fast rise times, should provide a better spectral-width control.
5.2.2 Power Scaling of EUV Generation
In Chapter III, we achieved efficient EUV generation at a repetition rate of 1.7
kHz and an average laser power of 10 W. Higher power can be reached at a higher
repetition rate and high pump power, and with the improvement of the fiber coating.
Vacuum condition remains an uncertain issue for the existing experimental chamber,
as a higher droplet repetition rate (∼ 50 kHz required for 300 W average power)
will create more vapors in the chamber and imposes the limitation on the highest
repetition rate.
The debris issue at the current repetition rate limited the experiment run time
to ∼ 30 minutes before the focusing lens was coated with debris. Running at a
higher repetition rate will linearly expedite the degradation of the lens transmission.

136
This problem can be addressed by using a longer-focal-length lens, providing higher
energy per pulse by spectral combining, or using smaller droplet targets (∼20 µm to
provide a better laser-to-target overlapping).
5.2.3 Power Scaling of Combining System
The novel spectral-beam-combining consisting of MLD filters in Chapter IV pro-
vided a viable solution for high-peak-power beam-combining. Further power scaling
to a multi-kW-class pulsed-fiber laser should be pursued by exploiting this combining
scheme.
The combining efficiency can be optimized toward the theoretical limit by hav-
ing the laser channels with distinct and controlled spectral properties. This would
eliminate the loss of the combining efficiency caused by the overlapping between the
channels. Further improvement of efficiency can also be realized using polarization-
maintaining fibers to avoid the walk off in the cutoff wavelengths of the two polar-
ization states.
Another approach can be done by custom-making each combining filter with a
design cutoff wavelength, removing the necessity on PM fibers. It is important to keep
in mind that the filter used in the testing is an off-the-shelf product and was originally
designed for Raman Spectroscopy. In this sense, custom filters become beneficial
since their spectral characteristics can be tailored for this particular application.
Sharper transition widths can be reached by having just enough bandwidth for Y b3+,
one order of magnitude narrower than the current filter provides. In fact, a 0.3-nm
spectral-transition width is already achieved by the same filter manufacturer. A
higher transmission can also be realized by having a custom anti-reflection coating
for the designed wavelength range, which will greatly improve the overall efficiency

137
and the maximum combinable channels.
For a system with a few tens of combined channels, manual alignment will become
impractical and automation on the output of the individual channels and filters has to
be implemented. From our experimental experiences, free-spaced end-pumping would
not be ideal for this type of combining scheme, and a monolithic fiber-laser system
is sought-after to be compatible with this combining system. With this proposed
approach, a robust multi-kW fiber laser system with MW peak power pulses shall
be accessible in the near future.
5.2.4 Self-focusing Observation and Theoretical Work
Another intriguing physical aspect that had been observed in current fiber am-
plifiers is the absence of self-focusing at the expected power level. One possible
explanation is due to the composition and the dopant of the active fiber: the non-
linear refractive index is slightly different from that of a fused silica, yielding an
increase in the self-focusing threshold. However, one should be able to observe the
change in the divergence of the output beam at a peak power a few times below the
self-focusing threshold, according to several theoretical works.
Using a CCD camera to observe this change in the divergence is indeed insufficient
since the pulse duration is in the order of nanoseconds, which is too short for a CCD
camera to resolve. One should implement a time-resolved high-resolution imaging
system, e.g. a streak camera, to be able to have a time-resolved image with sub-ns
resolution Otherwise, the change in the divergence will be averaged out with the
background ASE.
While all previous work in self-focusing is done assuming continuous wave, it is
desirable to have more sophisticated theoretical or numerical models to accurately
138
visualize the change in the beam radius temporally. Moreover, most of the reported
peak powers approaching the self-focusing limit are from the amplifiers operating in
their saturated region. A dramatic change in the temporal region and possibly in the
transverse shape of the pulse (since the wing of the spatial profile has a lower energy
fluence, giving a less-saturated gain), one should include the temporal domain into
the nonlinear Schrodiger equation. The Finite-Difference-Time-Domain method will
be needed to numerically solve the problem.
Theoretical work should also consider the inclusion of the population-induced
change in the refractive index. Several works in the high-speed optical switches uti-
lizing the pump-induced refractive index change shows that the nonlinear-index is
related to the population inversion. For amplifier in a saturated region, the popula-
tion inversion become a function of input pulse fluence. This effect will potentially
alter the transversal distribution of the nonlinear refraction index due to population
inversion, hence, enhance or impede the phase modulation due to the Kerr nonlinear-
effect. However, the literature has not reached a consensus on the sign of the phase
change, or on the physical origins of this effect. More theoretical and experimental
work will also be needed for a better understanding of the ultimate peak power limit
of pulsed-fiber lasers.

BIBLIOGRAPHY
139

140
BIBLIOGRAPHY
[1] F. Jin and M. Richardson. New laser plasma source for extreme-ultraviolet lithography. Appl.Opt., 34(25):5750+, 1995.
[2] Chiew-Seng Koay, Simi George, Kazutoshi Takenoshita, Robert Bernath, Etsuo Fujiwara,Martin Richardson, and Vivek Bakshi. High conversion efficiency microscopic tin-dopeddroplet target laser-plasma source for EUVL. volume 5751, pages 279–292. SPIE, 2005.
[3] Simi A. George, Kai-Chung Hou, Kazutoshi Takenoshita, Almantas Galvanauskas, and Mar-tin C. Richardson. 13.5 nm EUV generation from tin-doped droplets using a fiber laser. Opt.Express, 15(25):16348–16356, December 2007.
[4] Emily A. Gibson, Ariel Paul, Nick Wagner, Ra’anan Tobey, David Gaudiosi, Sterling Backus,Ivan P. Christov, Andy Aquila, Eric M. Gullikson, David T. Attwood, Margaret M. Murnane,and Henry C. Kapteyn. Coherent soft x-ray generation in the water window with quasi-phasematching. Science, 302(5642):95–98, October 2003.
[5] David Attwood. Soft X-Rays and Extreme Ultraviolet Radiation: Principles and Applications.Cambridge University Press, March 2007.
[6] R. H. Stulen. 13-nm extreme ultraviolet lithography. IEEE J. Sel. Top. Quantum Electron.,1(3):970–975, 1995.
[7] Alec N. Broers. Fabrication limits of electron beam lithography and of UV, X-Ray andion-beam lithographies. Philosophical Transactions: Physical Sciences and Engineering,353(1703):291–311, 1995.
[8] Takashi Ito and Shinji Okazaki. Pushing the limits of lithography. Nature, 406(6799):1027–1031, 2000.
[9] Banqiu Wu and Ajay Kumar. Extreme ultraviolet lithography: A review. Journal of VacuumScience & Technology B: Microelectronics and Nanometer Structures, 25(6):1743–1761, 2007.
[10] C. W. Gwyn, R. Stulen, D. Sweeney, and D. Attwood. Extreme ultraviolet lithography.volume 16, pages 3142–3149. AVS, 1998.
[11] International technology roadmap for semiconductors. available online, 23(Makuhari Messe,Chiba, Japan):2007 ITRS Winter Public Conference, Dec 2007.
[12] R. H. Stulen. 13-nm extreme ultraviolet lithography. IEEE J. Sel. Top. Quantum Electron.,1(3):970–975, 1995.
[13] Bernard Fay. Advanced optical lithography development, from UV to EUV. MicroelectronicEngineering, 61-62:11–24, July 2002.
[14] T. Hanawa K.Moriizumi A. Nakae, K. Kamon and H. Tanabe. Improvement in optical prox-imity correction by optimizing second illumination source. Jpn. J. Appl. Phys., 35(35):6396,January 1996.
141
[15] T. M. Bloomstein, M. Rothschild, R. R. Kunz, D. E. Hardy, R. B. Goodman, and S. T.Palmacci. Critical issues in 157 nm lithography. volume 16, pages 3154–3157. AVS, 1998.
[16] Toshiro Itani and Wataru Wakamiya. Progress in 157-nm lithography development for 70-nmnode. Microelectronic Engineering, 61-62:49–55, July 2002.
[17] Walter J. Trybula. Status of 157-nm optical lithography. Journal of Microlithography, Mi-crofabrication, and Microsystems, 4(1), 2005.
[18] D. Brambley, B. Martin, and P. D. Prewett. Microlithography: An overview. AdvancedMaterials for Optics and Electronics, 4(2):55–74, 1994.
[19] Mumit Khan, Geng Han, Gene Tsvid, Toyoki Kitayama, Juan Maldonado, and Franco Cer-rina. Can proximity X-ray lithography print 35 nm features? yes, 2001.
[20] Stephen Y. Chou, Peter R. Krauss, and Preston J. Renstrom. Imprint of sub-25 nm vias andtrenches in polymers. Appl. Phys. Lett., 67(21):3114–3116, 1995.
[21] Michael D. Austin, Haixiong Ge, Wei Wu, Mingtao Li, Zhaoning Yu, D. Wasserman, S. A.Lyon, and Stephen Y. Chou. Fabrication of 5 nm linewidth and 14 nm pitch features bynanoimprint lithography. Appl. Phys. Lett., 84(26):5299–5301, 2004.
[22] L. . J. Guo. Nanoimprint lithography: Methods and material requirements. Advanced Mate-rials, 19(4):495–513, 2007.
[23] Peter J. Silverman. Extreme ultraviolet lithography: overview and development status. Jour-nal of Microlithography, Microfabrication, and Microsystems, 4(1), 2005.
[24] Igor V. Fomenkov, David C. Brandt, Alexander N. Bykanov, Alexander I. Ershov, William N.Partlo, David W. Myers, Norbert R. Bowering, Georgiy O. Vaschenko, Oleh V. Khodykin,Jerzy R. Hoffman, Ernesto, Rodney D. Simmons, Juan A. Chavez, and Christopher P.Chrobak. Laser-produced plasma source system development. volume 6517. SPIE, 2007.
[25] A. Endo. High-average power EUV light source for the next-generation lithography by laser-produced plasma. IEEE J. Sel. Top. Quantum Electron., 10(6):1298–1306, 2004.
[26] Takashi Suganuma Krzysztof Nowak Tatsuya Yanagida Takayuki Yabu Takeshi AsayamaYoshifumi Ueno Masato Moriya Masaki Nakano Hiroshi Someya Toshihiro Nishisaka Ta-motsu Abe Georg Soumagne Hiroshi Komori Hakaru Mizoguchi Akira Sumitani Akira Endo,Hideo Hoshino and Koichi Toyoda. Laser produced plasma light source for HVM-EUVL.Number 6. Sematech, 2007.
[27] Simi A. George, William T. Silfvast, Kazutoshi Takenoshita, Robert T. Bernath, Chiew-Seng Koay, Gregory Shimkaveg, and Martin C. Richardson. Comparative extreme ultravioletemission measurements for lithium and tin laser plasmas. Opt. Lett., 32(8):997–999, 2007.
[28] R. C. Spitzer, T. J. Orzechowski, D. W. Phillion, R. L. Kauffman, and C. Cerjan. Conversionefficiencies from laser-produced plasmas in the extreme ultraviolet regime. J. Appl. Phys.,79(5):2251–2258, 1996.
[29] P. A. C. Jansson, B. A. M. Hansson, O. Hemberg, M. Otendal, A. Holmberg, J. de Groot, andH. M. Hertz. Liquid-tin-jet laser-plasma extreme ultraviolet generation. Appl. Phys. Lett.,84(13):2256–2258, 2004.
[30] Hiroki Tanaka, Atsushi Matsumoto, Kouzi Akinaga, Akihiko Takahashi, and Tatsuo Okada.Comparative study on emission characteristics of extreme ultraviolet radiation from CO2 andNd:YAG laser-produced tin plasmas. Appl. Phys. Lett., 87(4):041503, 2005.

142
[31] Tsuyoshi Ando, Shinsuke Fujioka, Hiroaki Nishimura, Nobuyoshi Ueda, Yuzuri Yasuda, KeijiNagai, Takayoshi Norimatsu, Masakatsu Murakami, Katsunobu Nishihara, Noriaki Miyanaga,Yasukazu Izawa, Kunioki Mima, and Atsushi Sunahara. Optimum laser pulse duration forefficient extreme ultraviolet light generation from laser-produced tin plasmas. Appl. Phys.Lett., 89(15):151501, 2006.
[32] Tomoharu Okuno, Shinsuke Fujioka, Hiroaki Nishimura, Yezheng Tao, Keiji Nagai, QincuiGu, Nobuyoshi Ueda, Tsuyoshi Ando, Katsunobu Nishihara, Takayoshi Norimatsu, NoriakiMiyanaga, Yasukazu Izawa, Kunioki Mima, Atsushi Sunahara, Hiroyuki Furukawa, and AkiraSasaki. Low-density tin targets for efficient extreme ultraviolet light emission from laser-produced plasmas. Appl. Phys. Lett., 88(16):161501, 2006.
[33] Y. Tao, S. S. Harilal, M. S. Tillack, K. L. Sequoia, B. O’Shay, and F. Najmabadi. Effectof focal spot size on in-band 13.5 nm extreme ultraviolet emission from laser-produced Snplasma. Opt. Lett., 31(16):2492–2494, 2006.
[34] Kai-Chung Hou, Ming-Yuan Cheng, Almantas Galvanauskas, Doruk Engin, RupakChangkakoti, and Pri Mamidipudi. Multi-MW peak power scaling of single-transverse modepulses using 80-µm core Yb-doped LMA fibers. In Advanced Solid-State Photonics, pageMF5. Optical Society of America, 2006.
[35] Charles J. Koester and Elias Snitzer. Amplification in a fiber laser. Appl. Opt., 3(10):1182+,October 1964.
[36] L. Reekie, R. Mears, S. Poole, and D. Payne. Tunable single-mode fiber lasers. J. LightwaveTechnology, 4(7):956–960, 1986.
[37] M. C. Farries, P. R. Morkel, and J. E. Townsend. Samarium3+-doped glass laser operatingat 651 nm. Electron. Lett., 24(11):709–711, 1988.
[38] Makoto Yamada, Makoto Shimizu, Yasutake Ohishi, Terutoki Kanamori, Shouichi Sudo, andJiro Temmyo. Gain characteristics of Pr3+-doped fluoride fiber amplifier. Electronics andCommunications in Japan (Part II: Electronics), 77(4):75–87, 1994.
[39] E. Desurvire and J. R. Simpson. Amplification of spontaneous emission in erbium-dopedsingle-mode fibers. J. Lightwave Technology, 7(5):835–845, 1989.
[40] M. J. F. Digonnet. Closed-form expressions for the gain in three- and four-level laser fibers.IEEE J. Quantum Electron., 26(10):1788–1796, 1990.
[41] B. J. Ainslie and B. J. Ainslie. A review of the fabrication and properties of erbium-dopedfibers for optical amplifiers. J. Lightwave Technology, 9(2):220–227, 1991.
[42] H. M. Pask, R. J. Carman, D. C. Hanna, A. C. Tropper, C. J. Mackechnie, P. R. Barber, andJ. M. Dawes. Ytterbium-doped silica fiber lasers: versatile sources for the 1-1.2 µm region.IEEE J. Sel. Top. Quantum Electron., 1(1):2–13, 1995.
[43] C. Ghisler, W. Luthy, and H. P. Weber. Tuning of a Tm3+ : Ho3+: silica fiber laser at 2 µm.IEEE J. Quantum Electron., 31(11):1877–1879, 1995.
[44] Andreas Tunnermann. High-power CW fiber lasers - present and future. Laser TechnikJournal, 2(2):54–56, 2005.
[45] L. Zenteno. High-power double-clad fiber lasers. J. Lightwave Technology, 11(9):1435–1446,1993.
[46] Philip Russell. Photonic crystal fibers. Science, 299(5605):358–362, January 2003.
[47] Jonathan C. Knight. Photonic crystal fibres. Nature, 424(6950):847–851, 2003.

143
[48] V. Dominic, S. MacCormack, R. Waarts, S. Sanders, S. Bicknese, R. Dohle, E. Wolak, P.S.Yeh, and E. Zucker. 110 W fibre laser. Electron. Lett., 35(14):1158–1160, 1999.
[49] I. Zawischa, K. Plamann, C. Fallnich, H. Welling, H. Zellmer, and A. Tunnermann. All-solid-state neodymium-based single-frequency master-oscillator fiber power-amplifier systememitting 5.5 W of radiation at 1064 nm. Opt. Lett., 24(7):469–471, April 1999.
[50] S. Hofer, A. Liem, J. Limpert, H. Zellmer, A. Tunnermann, S. Unger, S. Jetschke, H. R.Muller, and I. Freitag. Single-frequency master-oscillator fiber power amplifier system emit-ting 20 W of power. Opt. Lett., 26(17):1326–1328, 2001.
[51] Y. Jeong, J.K. Sahu, R.B. Williams, D.J. Richardson, K. Furusawa, and J. Nilsson.Ytterbium-doped large-core fibre laser with 272-W output power. Electron. Lett., 39(13):977–978, 2003.
[52] J. Limpert, A. Liem, H. Zellmer, and A. Tunnermann. 500 W continuous-wave fibre laserwith excellent beam quality. Electron. Lett., 39(8):645–647, 2003.
[53] Y. Jeong, J. Sahu, D. Payne, and J. Nilsson. Ytterbium-doped large-core fiber laser with 1.36kW continuous-wave output power. Opt. Express, 12(25):6088–6092, December 2004.
[54] Y. Jeong, J.K. Sahu, D.N. Payne, and J. Nilsson. Ytterbium-doped large-core fibre laser with1-kW of continuous-wave output power. Electron. Lett., 40(8):470–472, 2004.
[55] Y. Jeong, J. K. Sahu, S. Baek, C. Alegria, D. B. S. Soh, C. Codemard, and J. Nilsson.Cladding-pumped ytterbium-doped large-core fiber laser with 610 W of output power. Opt.Commun., 234(1-6):315–319, April 2004.
[56] C.-H. Liu, B. Doerfel, F. Heinemann, S. Carter, A. Tankala, J. K. Farroni, and A. Gal-vanauskas. 810 W continuous-wave and single-transverse-mode fibre laser using 20-µm coreYb-doped double-clad fibre. Electron. Lett., 40(23):1471–1472, 11 Nov. 2004.
[57] S. Ramachandran, J. W. Nicholson, S. Ghalmi, M. F. Yan, P. Wisk, E. Monberg, and F. V.Dimarcello. Light propagation with ultra large modal areas in optical fibers. Opt. Lett.,31(12):1797–1799, June 2006.
[58] Liang Dong, Jun Li, and Xiang Peng. Bend-resistant fundamental mode operation inytterbium-doped leakage channel fibers with effective areas up to 3160 µm2. Opt. Express,14(24):11512–11519, November 2006.
[59] Chi-Hung Liu, Guoqing Chang, Natasha Litchinitser, Almantas Galvanauskas, Doug Guertin,Nick Jabobson, and Kanishka and Tankala. Effectively single-mode chirally-coupled core fiber.OSA Technical Digest Series (CD), pages ME2+. Optical Society of America, January 2007.
[60] T. Schmid, S. A. George, J. Cunado, S. Teerawattanasook, R. Bernath, C. Brown,K. Takenoshita, C. S. Koay, and M. Richardson. High repetition rate LPP source facilityfor EUVL. volume 6517. SPIE, 2007.
[61] Aghapi G. Mordovanakis, Kai-Chung Hou, Yu-Chung Chang, Ming-Yuan Cheng, John Nees,Bixue Hou, Anatoly Maksimchuk, Gerard Mourou, Almantas Galvanauskas, and Bruno La-fontaine. Demonstration of fiber-laser-produced plasma source and application to efficientextreme UV light generation. Opt. Lett., 31(17):2517–2519, 2006.
[62] C. C. Ranaud, H. L. Offerhaus, J. A. Alvarez-Chavez, C. J. Nilsson, W. A. Clarkson, P. W.Turner, D. J. Richardson, and A. B. Grudinin. Characteristics of Q-switched cladding-pumped ytterbium-doped fiber lasers with different high-energy fiber designs. IEEE J. Quan-tum Electron., 37(2):199–206, 2001.
[63] A. E. Siegman. Lasers. University Science Books, October 1990.
144
[64] S. Webster, F.C. McDonald, A. Villanger, M.J. Soileau, E.W. Van Stryland, D.J. Hagan,B. McIntosh, W. Torruellas, J. Farroni, and K. Tankala. Optical damage measurements forhigh peak power ytterbium doped fiber amplifiers. volume 5991, page 599115. SPIE, 2005.
[65] A. Galvanauskas. Mode-scalable fiber-based chirped pulse amplification systems. IEEE J.Sel. Top. Quantum Electron., 7(4):504–517, 2001.
[66] Ming-Yuan Cheng, Yu-Chung Chang, Almantas Galvanauskas, Pri Mamidipudi, RupakChangkakoti, and Peter Gatchell. High-energy and high-peak-power nanosecond pulsegen-eration with beam quality control in 200-µm core highly multimode yb-doped fiberamplifiers.Opt. Lett., 30(4):358–360, February 2005.
[67] A. Galvanauskas, M. Y. Cheng, K. C. Hou, and K. H. Liao. High peak power pulse am-plification in large-core Yb-doped fiber amplifiers. IEEE J. Sel. Top. Quantum Electron.,13(3):559–566, 2007.
[68] Martin E. Fermann. Single-mode excitation of multimode fibers with ultrashort pulses. Opt.Lett., 23(1):52–54, January 1998.
[69] Jeffrey P. Koplow, Dahv A. Kliner, and Lew Goldberg. Single-mode operation of a coiledmultimode fiber amplifier. Opt. Lett., 25(7):442–444, April 2000.
[70] J. Limpert, O. Schmidt, J. Rothhardt, F. Roser, T. Schreiber, A. Tunnermann, S. Ermeneux,P. Yvernault, and F. Salin. Extended single-mode photonic crystal fiber lasers. Opt. Express,14(7):2715–2720, April 2006.
[71] A. W. Snyder and J. D. Love. Reflection at a curved dielectric interface— electromagnetictunneling. IEEE Trans. Microwave Theory Tech., 23(1):134–141, 1975.
[72] A. Galvanauskas, M. Y. Cheng, K. C. Hou, and K. H. Liao. High peak power pulse am-plification in large-core Yb-doped fiber amplifiers. IEEE J. Sel. Top. Quantum Electron.,13(3):559–566, 2007.
[73] C. C. Ranaud, H. L. Offerhaus, J. A. Alvarez-Chavez, C. J. Nilsson, W. A. Clarkson, P. W.Turner, D. J. Richardson, and A. B. Grudinin. Characteristics of Q-switched cladding-pumped ytterbium-doped fiber lasers with different high-energy fiber designs. IEEE J. Quan-tum Electron., 37(2):199–206, 2001.
[74] J. Nilsson, R. Paschotta, J. E. Caplen, and D. C. Hanna. Yb3+-ring-doped fiber for high-energy pulse amplification. Opt. Lett., 22(14):1092–1094, July 1997.
[75] Paul E. Schrader, Roger L. Farrow, Dahv A. Kliner, Jean-Philippe Feve, and Nicolas Landru.High-power fiber amplifier with widely tunable repetition rate, fixed pulse duration, andmultiple output wavelengths. Opt. Express, 14(24):11528–11538, November 2006.
[76] Kai-Hsiu Liao, Aghapi G. Mordovanakis, Bixue Hou, Guoqing Chang, Matthew Rever, Ger-ard A. Mourou, John Nees, and Almantas Galvanauskas. Generation of hard X-rays using anultrafast fiber laser system. Opt. Express, 15(21):13942–13948, 2007.
[77] Kai-Chung Hou, Simi George, Aghapi G. Mordovanakis, Kazutoshi Takenoshita, John Nees,Bruno Lafontaine, Martin Richardson, and Almantas Galvanauskas. High power fiber laserdriver for efficient EUV lithography source with tin-doped water droplet targets. Opt. Express,16(2):965–974, January 2008.
[78] Fabio D. Teodoro, Jeffrey P. Koplow, Sean W. Moore, and Dahv A. Kliner. Diffraction-limited, 300-kW peak-power pulses from a coiled multimode fiber amplifier. Opt. Lett.,27(7):518–520, April 2002.

145
[79] Christopher Brooks and Fabio Di Teodoro. 1-mJ energy, 1-MW peak-power, 10-W average-power, spectrally narrow, diffraction-limited pulses from a photonic-crystal fiber amplifier.Opt. Express, 13(22):8999–9002, October 2005.
[80] Fabio Di Teodoro and Christopher D. Brooks. 1.1 mw peak-power, 7 w average-power, high-spectral-brightness, diffraction-limited pulses from a photonic crystal fiber amplifier. Opt.Lett., 30(20):2694–2696, October 2005.
[81] Fabio Di Teodoro and Christopher D. Brooks. Multistage Yb-doped fiber amplifier generatingmegawatt peak-power, subnanosecond pulses. Opt. Lett., 30(24):3299–3301, December 2005.
[82] Christopher D. Brooks and Fabio Di Teodoro. Multimegawatt peak-power, single-transverse-mode operation of a 100-µm core diameter, Yb-doped rodlike photonic crystal fiber amplifier.Appl. Phys. Lett., 89(11), 2006.
[83] O. Schmidt, J. Rothhardt, F. Roser, S. Linke, T. Schreiber, K. Rademaker, J. Limpert,S. Ermeneux, P. Yvernault, F. Salin, and A. Tunnermann. Millijoule pulse energy Q-switchedshort-length fiber laser. Opt. Lett., 32(11):1551–1553, June 2007.
[84] Govind Agrawal. Nonlinear Fiber Optics, Fourth Edition. Academic Press, October 2006.
[85] Martin E. Fermann, Almantas Galvanauskas, and Gregg Sucha. Ultrafast Lasers: Technologyand Applications (Optical Engineering). CRC, October 2002.
[86] Jean-Philippe Feve. Phase-matching and mitigation of four-wave mixing in fibers with posi-tive gain. Opt. Express, 15(2):577–582, January 2007.
[87] Jean-Philippe Feve, Paul E. Schrader, Roger L. Farrow, and Dahv A. Kliner. Four-wavemixing in nanosecond pulsed fiber amplifiers. Opt. Express, 15(8):4647–4662, April 2007.
[88] R. G. Smith. Optical power handling capacity of low loss optical fibers as determined bystimulated Raman and Brillouin scattering. Appl. Opt., 11(11):2489+, November 1972.
[89] David Milam. Review and assessment of measured values of the nonlinear refractive-indexcoefficient of fused silica. Appl. Opt., 37(3):546–550, January 1998.
[90] A. Melloni, M. Frasca, A. Garavaglia, A. Tonini, and M. Martinelli. Direct measurement ofelectrostriction in optical fibers. Opt. Lett., 23(9):691–693, May 1998.
[91] Jesus Subıas, Javier Pelayo, Rafael Alonso, Francisco Villuendas, and Carlos Heras.Electrostriction-free n2 measurement in single-mode optical fibers based on nonlinear-polarization evolution. J. Opt. Soc. Am. B, 19(3):390–394, March 2002.
[92] Eric L. Buckland and Robert W. Boyd. Electrostrictive contribution to the intensity-dependent refractive index of optical fibers. Opt. Lett., 21(15):1117+, 1996.
[93] Eric L. Buckland. Mode-profile dependence of the electrostrictive response in fibers. Opt.Lett., 24(13):872–874, July 1999.
[94] Andrea Fellegara and Stefan Wabnitz. Electrostrictive cross-phase modulation of periodicpulse trains in optical fibers. Opt. Lett., 23(17):1357–1359, 1998.
[95] Paul D. Townsend, Alistair J. Poustie, P. J. Hardman, and K. J. Blow. Measurement of therefractive-index modulation generated by electrostriction-induced acoustic waves in opticalfibers. Opt. Lett., 21(5):333+, March 1996.
[96] Gadi Fibich and Alexander L. Gaeta. Critical power for self-focusing in bulk media and inhollow waveguides. Opt. Lett., 25(5):335–337, March 2000.
[97] Yaron Silberberg. Collapse of optical pulses. Opt. Lett., 15(22):1282+, November 1990.

146
[98] Roger L. Farrow, Dahv A. Kliner, Ronald G. Hadley, and Arlee V. Smith. Peak-power limitson fiber amplifiers imposed by self-focusing. Opt. Lett., 31(23):3423–3425, December 2006.
[99] Guoqing Chang, Herbert G. Winful, Almantas Galvanauskas, and Theodore B. Norris. Self-similar parabolic beam generation and propagation. Phys. Rev. E: Stat. Phys., Plasmas,Fluids,, 72(1), 2005.
[100] A. E. Siegman. Quasi fast Hankel transform. Opt. Lett., 1(1):13+, July 1977.
[101] G. P. Agrawal and M. Lax. End correction in the quasi-fast hankel transform for optical-propagation problems. Opt. Lett., 6(4):171+, April 1981.
[102] R. Paschotta, R. Paschotta, J. Nilsson, J. Nilsson, and A. C. Tropper. Ytterbium-doped fiberamplifiers. IEEE J. Quantum Electron., 33(7):1049–1056, 1997.
[103] H. Coıc. Analytic modelling of high-gain ytterbium-doped fibre amplifiers. J. Opt. A: PureAppl. Opt., 4:120–129, March 2002.
[104] K. T. Vu, A. Malinowski, D. J. Richardson, F. Ghiringhelli, L. M. B. Hickey, and M. N.Zervas. Adaptive pulse shape control in a diode-seeded nanosecond fiber MOPA system.Opt. Express, 14(23):10996–11001, 2006.
[105] S. Usterer, H. Schwoerer, W. Ziegler, D. Salzmann, and R. Sauerbrey. Effects of a prepulseon laser-induced EUV radiation conversion efficiency. Appl. Phys. B, 76(1):17–21, January2003.
[106] P. Dunne, G. O’Sullivan, and D. O’Reilly. Prepulse-enhanced narrow bandwidth soft x-rayemission from a low debris, subnanosecond, laser plasma source. Appl. Phys. Lett., 76(1):34–36, 2000.
[107] Lee M. Frantz and John S. Nodvik. Theory of pulse propagation in a laser amplifier. J. Appl.Phys., 34(8):2346–2349, 1963.
[108] W. Torruellas, Y. Chen, B. Mcintosh, J. Farroni, K. Tankala, S. Webster, D. Hagan, M. J.Soileau, M. Messerly, and J. Dawson. High peak power ytterbium-doped fiber amplifiers.volume 6102. SPIE, 2006.
[109] John M. Fini. Bend-resistant design of conventional and microstructure fibers with very largemode area. Opt. Express, 14(1):69–81, January 2006.
[110] Sachin Joshi, Azer P. Yalin, and Almantas Galvanauskas. Use of hollow core fibers, fiberlasers, and photonic crystal fibers for spark delivery and laser ignition in gases. Appl. Opt.,46(19):4057–4064, July 2007.
[111] Tran X. Phuoc. Laser spark ignition: experimental determination of laser-induced breakdownthresholds of combustion gases. Opt. Commun., 175(4-6):419–423, March 2000.
[112] S. Dusterer, H. Schwoerer, W. Ziegler, C. Ziener, and R. Sauerbrey. Optimization of EUVradiation yield from laser-produced plasma. Appl. Phys. B, 73(7):693–698, November 2001.
[113] Takeshi Higashiguchi, Chirag Rajyaguru, Shoichi Kubodera, Wataru Sasaki, Noboru Yugami,Takashi Kikuchi, Shigeo Kawata, and Alex Andreev. Efficient soft x-ray emission source at13.5 nm by use of a femtosecond-laser-produced Li-based microplasma. Appl. Phys. Lett.,86(23), 2005.
[114] David C. Brandt, Igor V. Fomenkov, Alex I. Ershov, William N. Partlo, David W. Myers, Nor-bert R. Bowering, Alexander N. Bykanov, Georgiy O. Vaschenko, Oleh V. Khodykin, Jerzy R.Hoffman, Ernesto, Rodney D. Simmons, Juan A. Chavez, and Christopher P. Chrobak. LPPEUV source development for HVM. volume 6517. SPIE, 2007.
147
[115] Tatsuya Ariga, Hideo Hoshino, and Akira Endo. High average power CO2 laser MOPA systemfor tin target LPP EUV light source. volume 6454. SPIE, 2007.
[116] C. Rajyaguru, T. Higashiguchi, M. Koga, K. Kawasaki, M. Hamada, N. Dojyo, W. Sasaki, andS. Kubodera. Parametric optimization of a narrow-band 13.5-nm emission from a Li-basedliquid-jet target using dual nano-second laser pulses. Appl. Phys. B, 80(4):409–412, April2005.
[117] B. A. M. Hansson, L. Rymell, M. Berglund, and H. M. Hertz. A liquid-xenon-jet laser-plasmax-ray and EUV source. Microelectron. Eng., 53(1-4):667–670, June 2000.
[118] Takeshi Higashiguchi, Naoto Dojyo, Masaya Hamada, Wataru Sasaki, and Shoichi Kubodera.Low-debris, efficient laser-produced plasma extreme ultraviolet source by use of a regenerativeliquid microjet target containing tin dioxide (SnO2) nanoparticles. Appl. Phys. Lett., 88(20),2006.
[119] Yoshinori Shimada, Hiroaki Nishimura, Kazuhisa Hashimoto, Michiteru Yamaura, KeisukeShigemori, Mitsuo Nakai, Shinsuke Fujioka, Shigeaki Uchida, Tomoharu Okuno, TakahiroHibino, Nobuyoshi Ueda, Ryoji Matsui, Yezheng Tao, Keiji Nagai, Takayoshi Norimatsu, ToruKawamura, Atsushi Sunahara, Katsunobu Nishihara, Noriaki Miyanaga, Masahiro Nakatsuka,Yasukazu Izawa, and Chihiro Yamanaka. Properties of EUV emissions from laser-producedtin plasmas. volume 5374, pages 912–917. SPIE, 2004.
[120] Y. Shimada, H. Nishimura, M. Nakai, K. Hashimoto, M. Yamaura, Y. Tao, K. Shigemori,T. Okuno, K. Nishihara, T. Kawamura, A. Sunahara, T. Nishikawa, A. Sasaki, K. Nagai,T. Norimatsu, S. Fujioka, S. Uchida, N. Miyanaga, Y. Izawa, and C. Yamanaka. Charac-terization of extreme ultraviolet emission from laser-produced spherical tin plasma generatedwith multiple laser beams. Appl. Phys. Lett., 86(5), 2005.
[121] T. Tomie, T. Aota, Y. Kurashima, N. Kandaka, H. Yashiro, K. Nishigori, I. Matsushima,and M. Komuro. Study of a cavity-confined plasma as a debris-less and high conversionefficiency source for EUV lithography. In Microprocesses and Nanotechnology Conference,2000 International, pages 284–285, 2000.
[122] Toshihisa Tomie, Tatsuya Aota, Jing Q. Lin, Yoshifumi Ueno, Hidehiko Yashiro, NoriakiKandaka, Hiroki Moriwaki, Gohta Niimi, Isao Matsushima, and Kentaro Nishigori. Particle-cluster tin target for a high conversion efficiency LPP source for EUVL. volume 5374, pages383–393. SPIE, 2004.
[123] C. Rajyaguru, T. Higashiguchi, M. Koga, W. Sasaki, and S. Kubodera. Systematic optimiza-tion of the extreme ultraviolet yield from a quasi-mass-limited water-jet target. Appl. Phys.B, 79(6):669–672, October 2004.
[124] G. Schriever, S. Mager, A. Naweed, A. Engel, K. Bergmann, and R. Lebert. Laser-producedlithium plasma as a narrow-band extended ultraviolet radiation source for photoelectron spec-troscopy. Appl. Opt., 37(7):1243–1248, March 1998.
[125] Henryk Fiedorowicz, Andrzej Bartnik, Miroslaw Szczurek, Hiroyuki Daido, Noriyuki Sakaya,Viliam Kmetik, Yoshiaki Kato, Masayuki Suzuki, Masai Matsumura, Junichi Tajima,Takeyoshi Nakayama, and Thomas Wilhein. Investigation of soft x-ray emission from a gaspuff target irradiated with a Nd:YAG laser. Opt. Commun., 163(1-3):103–114, May 1999.
[126] Harry Shields, Steven W. Fornaca, Michael B. Petach, Mark Michaelian, Daniel R. Mcgregor,Richard H. Moyer, and Randall J. St. Pierre. Xenon target performance characteristics forlaser-produced plasma EUV sources. volume 4688, pages 94–101. SPIE, 2002.
[127] Gerard D. O’Sullivan and Ronan Faulkner. Tunable narrowband soft x-ray source for projec-tion lithography. Optical Engineering, 33(12):3978–3983, 1994.

148
[128] Feng Jin, Kai Gabel, Martin C. Richardson, Masataka Kado, Andrew F. Vasil’ev, and DanielSalzmann. Mass-limited laser-plasma cryogenic target for 13-nm point X-ray sources forlithography. volume 2015, pages 151–159. SPIE, 1994.
[129] T. Y. Fan. Laser beam combining for high-power, high-radiance sources. IEEE J. Sel. Top.Quantum Electron., 11(3):567–577, 2005.
[130] Steven J. Augst, Jinendra K. Ranka, T. Y. Fan, and Antonio Sanchez. Beam combining ofytterbium fiber amplifiers (invited). J. Opt. Soc. Am. B, 24(8):1707–1715, 2007.
[131] S. J. Augst, A. K. Goyal, R. L. Aggarwal, T. Y. Fan, and A. Sanchez. Wavelength beamcombining of ytterbium fiber lasers. Opt. Lett., 28(5):331–333, March 2003.
[132] T. H. Loftus, A. M. Thomas, P. R. Hoffman, M. Norsen, R. Royse, Anping Liu, and E. C.Honea. Spectrally beam-combined fiber lasers for high-average-power applications. IEEE J.Sel. Top. Quantum Electron., 13(3):487–497, 2007.
[133] Thomas H. Loftus, Anping Liu, Paul R. Hoffman, Alison M. Thomas, Marc Norsen, RobRoyse, and Eric Honea. 522 W average power, spectrally beam-combined fiber laser withnear-diffraction-limited beam quality. Opt. Lett., 32(4):349–351, February 2007.
[134] Sandro Klingebiel, Fabian Roser, Bulend Orta, Jens Limpert, and Andreas Tunnermann.Spectral beam combining of Yb-doped fiber lasers with high efficiency. J. Opt. Soc. Am. B,24(8):1716–1720, 2007.
[135] Igor V. Ciapurin, Leonid B. Glebov, and Vadim I. Smirnov. Spectral combining of high-powerfiber laser beams using bragg grating in PTR glass. volume 5335, pages 116–124. SPIE, 2004.
[136] Steven J. Augst, T. Y. Fan, and Antonio Sanchez. Coherent beam combining and phase noisemeasurements of ytterbium fiber amplifiers. Opt. Lett., 29(5):474–476, March 2004.
[137] Amiel Ishaaya, Liran Shimshi, Nir Davidson, and Asher Friesem. Coherent addition of spa-tially incoherent light beams. Opt. Express, 12(20):4929–4934, October 2004.
[138] Jesse Anderegg, Stephen Brosnan, Eric Cheung, Paul Epp, Dennis Hammons, HiroshiKomine, Mark Weber, and Michael Wickham. Coherently coupled high-power fiber arrays.volume 6102. SPIE, 2006.
[139] L. Michaille, C. R. Bennett, D. M. Taylor, T. J. Shepherd, J. Broeng, H. R. Simonsen, andA. Petersson. Phase locking and supermode selection in multicore photonic crystal fiber laserswith a large doped area. Opt. Lett., 30(13):1668–1670, July 2005.
[140] L. Li, A. Schulzgen, S. Chen, V. L. Temyanko, J. V. Moloney, and N. Peyghambarian. Phaselocking and in-phase supermode selection in monolithic multicore fiber lasers. Opt. Lett.,31(17):2577–2579, 2006.
[141] Yanming Huo, Peter Cheo, and George King. Fundamental mode operation of a 19-corephase-locked Yb-doped fiber amplifier. Opt. Express, 12(25):6230–6239, December 2004.
[142] Arash Mafi and Jerome V. Moloney. Phase locking in a passive multicore photonic crystalfiber. J. Opt. Soc. Am. B, 21(5):897–902, May 2004.
[143] E. J. Bochove. Theory of spectral beam combining of fiber lasers. IEEE J. Quantum Electron.,38(5):432–445, 2002.
[144] B. C. Stuart, M. D. Feit, S. Herman, A. M. Rubenchik, B. W. Shore, and M. D. Perry.Nanosecond-to-femtosecond laser-induced breakdown in dielectrics. Physical Review B,53(4):1749+, January 1996.

149
[145] Karl Hehl, Joerg Bischoff, Ullrich Mohaupt, Martin Palme, Bernd Schnabel, Lutz Wenke,Ragnar Bodefeld, Wolfgang Theobald, Eberhard Welsch, Roland Sauerbrey, and HartmutHeyer. High-efficiency dielectric reflection gratings: Design, fabrication, and analysis. Appl.Opt., 38(30):6257–6271, October 1999.
[146] Frederico Canova, Raphael Clady, Jean-Paul Chambaret, Manuel Flury, Svtelen Tonchev,Renate Fechner, and Olivier Parriaux. High-efficiency, broad band, high-damage thresholdhigh-index gratings for femtosecond pulse compression. Opt. Express, 15(23):15324–15334,November 2007.
[147] A. F. Stewart, Samuel M. Lu, Mohammad M. Tehrani, and C. Volk. Ion beam sputtering ofoptical coatings. volume 2114, pages 662–677. SPIE, 1994.
[148] F. He, J. H. Price, K. T. Vu, A. Malinowski, J. K. Sahu, and D. J. Richardson. Optimisationof cascaded Yb fiber amplifier chains using numerical-modelling. Opt. Express, 14(26):12846–12858, December 2006.