high paracellular nutrient absorption in intact bats is associated with high paracellular...
TRANSCRIPT

© 2013. Published by The Company of Biologists Ltd
The
Jour
nal o
f Exp
erim
enta
l Bio
logy
– A
CC
EPTE
D A
UTH
OR
MA
NU
SCR
IPT
Title: High paracellular nutrient absorption in intact bats is associated with high 1"
paracellular permeability in perfused intestinal segments 2"
3"
Antonio Brun1, Edwin R. Price2, Manuel N. Gontero-Fourcade1, Guido Fernandez-4"
Marinone1,4, Ariovaldo P. Cruz-Neto3, William H. Karasov2, E. Caviedes-Vidal1,4,* 5"
6"1Laboratorio de Biología Integrativa, Instituto Multidisciplinario de Investigaciones 7"
Biológicas de San Luis, Consejo de Investigaciones Científicas y Técnicas, San Luis 5700, 8"
Argentina 9"
10"2Department of Forest and Wildlife Ecology, University of Wisconsin-Madison, Madison, WI 11"
53706, U.S.A. 12"
13"3Departamento de Zoologia, Instituto de Biociências, Universidade Estadual Paulista “Julio 14"
de Mesquita Filho” Rio Claro, São Paulo, Brazil 15"
16"4Departamento de Bioquímica y Ciencias Biológicas, Universidad Nacional de San Luis, San 17"
Luis 5700, Argentina 18"
19"
* Corresponding author: 20"
Enrique Caviedes-Vidal 21"
Laboratorio de Biología Integrativa 22"
Instituto Multidisciplinario de Investigaciones Biológicas de San Luis (IMIBIO-SL) 23"
CONICET – Universidad Nacional de San Luis 24"
Chacabuco 917. San Luis 5700, Argentina 25"
Ph: +54 (266) 4520300 ext. 6611 26"
e-mail: [email protected] 27"
28"
Summary 29"
Water-soluble nutrients are absorbed by the small intestine via transcellular and paracellular 30"
mechanisms. Based on a few previous studies, the capacity for paracellular nutrient 31"
absorption seems greater in flying mammals than in nonflying mammals, but there has been 32"
little investigation of the mechanisms driving this difference. Therefore, we studied three 33"
species each of bats (Artibeus lituratus, Sturnira lilium, Carollia perspicillata) and nonflying 34"
http://jeb.biologists.org/lookup/doi/10.1242/jeb.104927Access the most recent version at J Exp Biol Advance Online Articles. First posted online on 7 August 2014 as doi:10.1242/jeb.104927

The
Jour
nal o
f Exp
erim
enta
l Bio
logy
– A
CC
EPTE
D A
UTH
OR
MA
NU
SCR
IPT
mammals (Akodon montensis, Mus musculus, Rattus norvegicus). Using standard 35"
pharmacokinetic techniques in intact animals, we confirmed the greater paracellular nutrient 36"
absorption in the fliers, comparing one species in each group. Then we conducted in situ 37"
intestinal perfusions on individuals of all species. In both approaches, we measured the 38"
absorption of 3OMD-glucose, a nonmetabolizable glucose analog absorbed both 39"
paracellularly and transcellularly, as well as L-arabinose that has no mediated transport. 40"
Fractional absorption (f) of L-arabinose was three times higher in the bat (S. lilium: 1.2±0.24) 41"
than in the rodent (A. montensis: 0.35±0.04), whereas f3OMD-glucose was complete in both 42"
species (1.46±0.4 vs. 0.97±0.12, respectively). In agreement, bats exhibited 2-12 times higher 43"
L-arabinose clearance per cm2 nominal surface area than rodents in intestinal perfusions. 44"
Using L-arabinose, we estimated that the contribution of the paracellular pathway to total 45"
glucose absorption was higher in all 3 bats (109-137%) than the rodents (13-39%). These 46"
findings contribute to an emerging picture that reliance on the paracellular pathway for 47"
nutrient absorption is much greater in bats relative to nonflying mammals and that this 48"
difference is driven by differences in intestinal permeability to nutrient-sized molecules. 49"
50"
Keywords 51"
Intestine; mediated absorption; paracellular absorption: arabinose; flight; bats; intestinal 52"
perfusion; Akodon montensis; Sturnira lilium; Artibeus lituratus; Carollia perspicillata; Mus 53"
musculus; Rattus norvegicus 54"
55"
Running head: Intestinal perfusions in bats and rodents 56"
57"
Introduction 58"
59"
Water-soluble nutrients are absorbed at the small intestine via the transcellular and 60"
paracellular pathways. The transcellular pathway is mediated by membrane transporters in 61"
the apical side of enterocytes that translocate nutrients from the intestinal lumen into the 62"
cytosol, and then export of nutrients to the bloodstream is achieved by mediated transport by 63"
transporter(s) in the basolateral membrane. In contrast, the paracellular pathway is not 64"
transporter mediated; water-soluble compounds reach the basolateral space by traversing tight 65"
junctions (formed by adjacent enterocytes) by diffusion or solvent drag (Pappenheimer and 66"
Reiss, 1987). 67"

The
Jour
nal o
f Exp
erim
enta
l Bio
logy
– A
CC
EPTE
D A
UTH
OR
MA
NU
SCR
IPT
Recent studies suggest that the paracellular pathway may be quantitatively important to 68"
nutrient absorption in some vertebrates (He et al., 1998; Karasov et al., 2012; McWhorter, 69"
2005). In particular, paracellular absorption accounts for 60-90% of the glucose absorption in 70"
all small birds and bats studied to date (Caviedes-Vidal et al., 2008; Caviedes-Vidal et al., 71"
2007; Chediack et al., 2003; Tracy et al., 2007). In contrast, transporter-mediated absorption 72"
is much more important in terrestrial mammals (Lavin and Karasov, 2008; Lavin et al., 73"
2007). Caviedes-Vidal et al. (2007) hypothesized that this heavy reliance on paracellular 74"
nutrient absorption evolved independently in flying mammals and birds, which have similar 75"
daily energy needs compared to nonfliers, probably to compensate for fliers’ lower absorptive 76"
surface area in smaller and lighter intestines than in nonfliers. Absent the special need for the 77"
complementary paracellular absorption pathway, natural selection may favor absorption of 78"
water soluble nutrients by specific apical transporters in order to maintain a better selective 79"
barrier against hydrosoluble toxins (Karasov et al., 2012). 80"
Although the capacity for paracellular nutrient absorption has been assessed in a small 81"
number of bats and rodents (Caviedes-Vidal et al., 2008; Fasulo et al., 2013a; Fasulo et al., 82"
2013b; Karasov et al., 2012; Pappenheimer, 1990; Price et al., 2013b; Tracy et al., 2007), the 83"
mechanistic underpinnings of the differences among taxa have received less attention. 84"
Paracellular absorption is measured using nonmetabolized hydrophilic carbohydrate probes 85"
that lack affinity for intestinal mediated uptake mechanisms (e.g., L-arabinose; Lavin et al., 86"
2007). Greater absorption of paracellular probes by bats could be due to longer retention time 87"
in the intestine, or differences in gastric evacuation (Shilton et al., 1999). Alternatively, bats 88"
might have intestines with greater paracellular permeability per unit intestinal area than those 89"
of rodents, a feature that could arise from a greater number of tight junctions per unit area or 90"
higher permeability of the tight junctions. One approach for assessing these alternatives is to 91"
use in situ intestinal luminal perfusions, which obviate any effects of differential retention 92"
time or gastric emptying. Price et al. (2013a) assessed L-arabinose absorption using intestinal 93"
luminal perfusions in an insectivorous bat (Tadarida brasiliensis); they concluded that the 94"
majority of glucose absorption was paracellular in that species. However, to date, no 95"
perfusion studies have directly compared bats to nonflying mammals using uniform 96"
methodology. 97"
To that end, we conducted in situ intestinal luminal perfusions on three bats and three 98"
rodents, all of which feed primarily on carbohydrate-rich diets. We selected three 99"
frugivorous bats and an omnivorous rodent from southeastern Brazil, and we also performed 100"
intestinal perfusions on laboratory mice and rats. Together, these species represent a range of 101"

The
Jour
nal o
f Exp
erim
enta
l Bio
logy
– A
CC
EPTE
D A
UTH
OR
MA
NU
SCR
IPT
body masses with overlap between the bats and rodents, and thus help to control for any 102"
effect of body mass (Caviedes-Vidal et al., 2007; Pappenheimer, 1990). In addition, we 103"
measured the whole-animal fractional absorption of L-arabinose in the wild rodent and one 104"
bat species to expand our survey of measurements in intact animals and to demonstrate 105"
connections between tissue-level characteristics and an organismal-level phenomenon 106"
[measurements in intact animals were previously made for most of the other species of this 107"
study; (Caviedes-Vidal et al., 2008; Fasulo et al., 2013b; Lavin et al., 2007)]. In both 108"
approaches we used the carbohydrate L-arabinose (Mr = 150.1), a neutral nonmetabolized 109"
paracellular probe that does not interact with intestinal nutrient transporters, and 3-O-methyl-110"
D-glucose (3OMD-glucose; Mr = 194.2), a nonmetabolized analog of D-glucose (Mr = 180.2) 111"
that is passively absorbed through the paracellular space but also transported across the 112"
enterocyte membrane by glucose transporter SLGT1. Based on the hypothesis stated above, 113"
we predicted that intact bats would absorb more L-arabinose than intact rodents. We also 114"
hypothesized that this difference among taxa derives mechanistically from differences in 115"
intestinal permeability characteristics. We therefore predicted that in our intestinal perfusion 116"
experiments: absorption of 3OMD-glucose would be similarly fast and extensive in all the 117"
animals, the bats would absorb more L-arabinose than the rodents per cm2 nominal intestine, 118"
and that paracellular absorption would account for a higher percentage of glucose absorption 119"
in bats compared to rodents. 120"
121"
Results 122"
Intestinal perfusions 123"
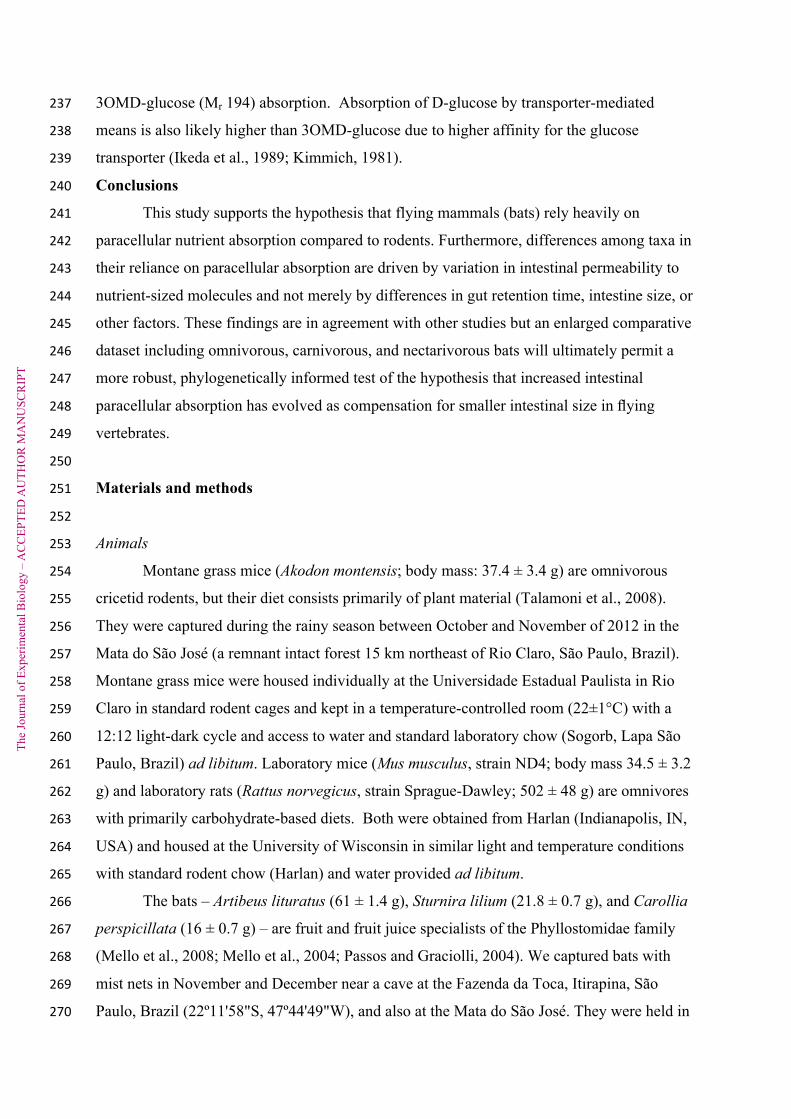
L-arabinose clearance varied significantly among species (F5,29 = 28.9, P<0.001; Fig. 124"
1), and the bats exhibited 2-12 times higher L-arabinose clearance per cm2 nominal surface 125"
area than the rodents. In pair-wise statistical comparisons, A. lituratus and S. lilium had 126"
significantly higher L-arabinose clearance than the three rodents (P<0.05). L-arabinose 127"
clearance in C. perspicillata was significantly higher than R. norvegicus and M. musculus 128"
(P< 0.05) but was not significantly different from A. montensis (P = 0.072), despite having 129"
nearly double the L-arabinose clearance. Among rodents we found no significant differences 130"
in L-arabinose clearance (P>0.05). 131"
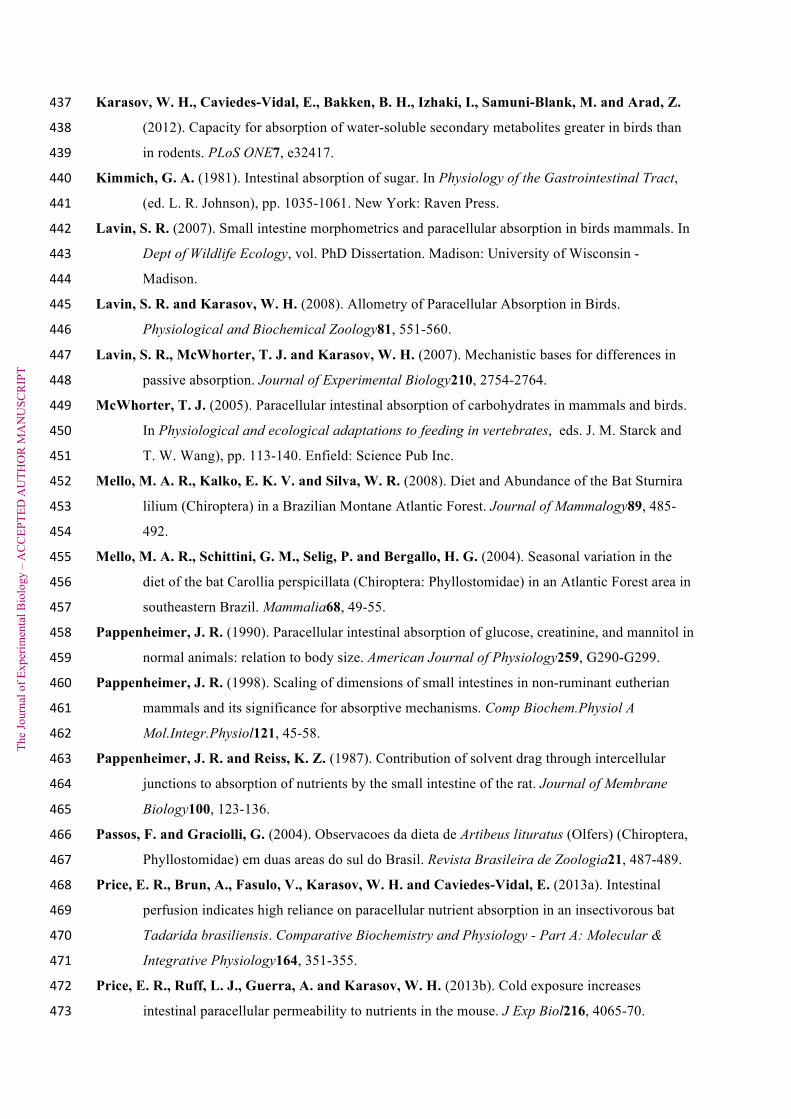
D-glucose absorption did not differ significantly among the species (F5,30= 2.31, P= 132"
0.069; Fig. 2). Similarly, there were no significant differences among species in 3OMD-133"
glucose absorption (F4,25 = 0.726, P= 0.583; Fig. 2). Across all measurements in all species, 134"

The
Jour
nal o
f Exp
erim
enta
l Bio
logy
– A
CC
EPTE
D A
UTH
OR
MA
NU
SCR
IPT
D-glucose and 3OMD-glucose absorption were correlated (F1,28=11.77; r2=0.29; P=0.002; 135"
data not shown). 136"
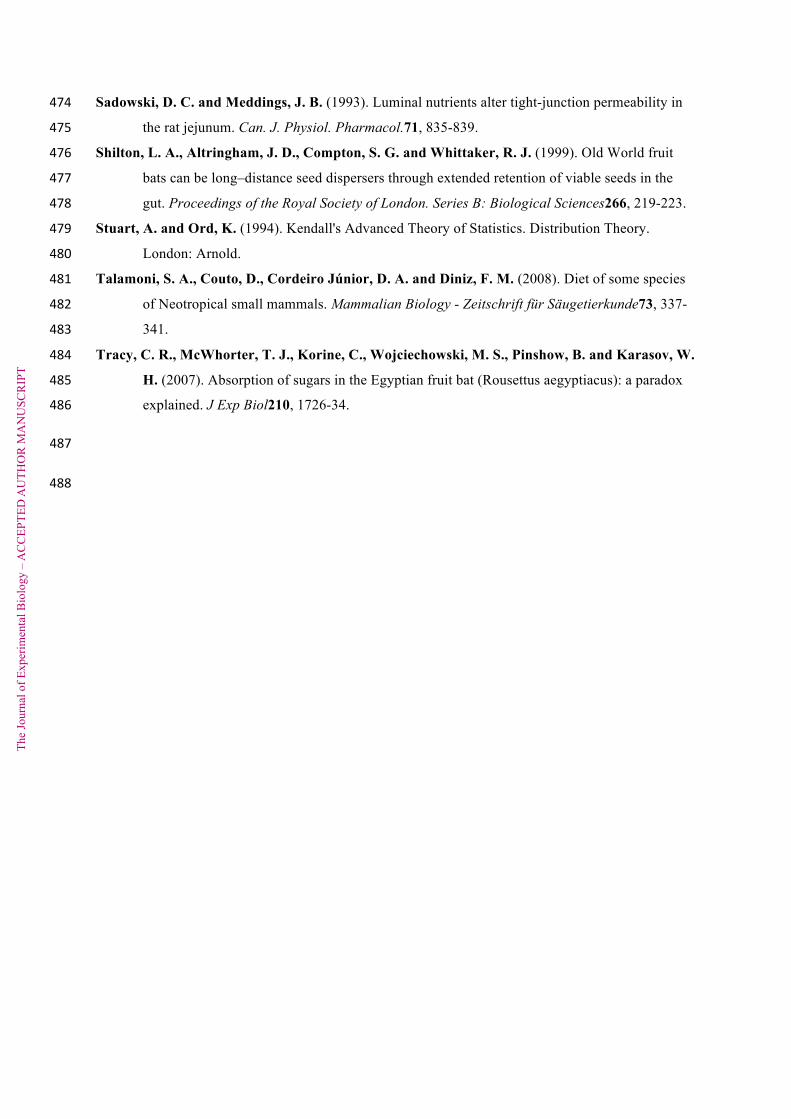
The proportions of D-glucose and 3OMD-glucose absorption that were estimated to 137"
be paracellular differed significantly among species (D-glucose: F5,29= 36.41, P< 0.001; 138"
3OMD-glucose: F4,25 = 77.9 , P<0.001; Fig. 3). All bat species had significantly higher 139"
paracellular proportions than rodents for both D-glucose and 3OMD-glucose (P<0.05 for all 140"
comparisons). Values significantly exceeded 100% in bats in some cases (S. lilium 3OMD-141"
glucose proportion, p=0.004, and A. lituratus glucose proportion, p=0.0046) likely because of 142"
molecular size differences between probes used to estimate the paracellular contribution to 143"
absorption (see Discussion). 144"
145"
Fractional absorption of probes in intact animals 146"
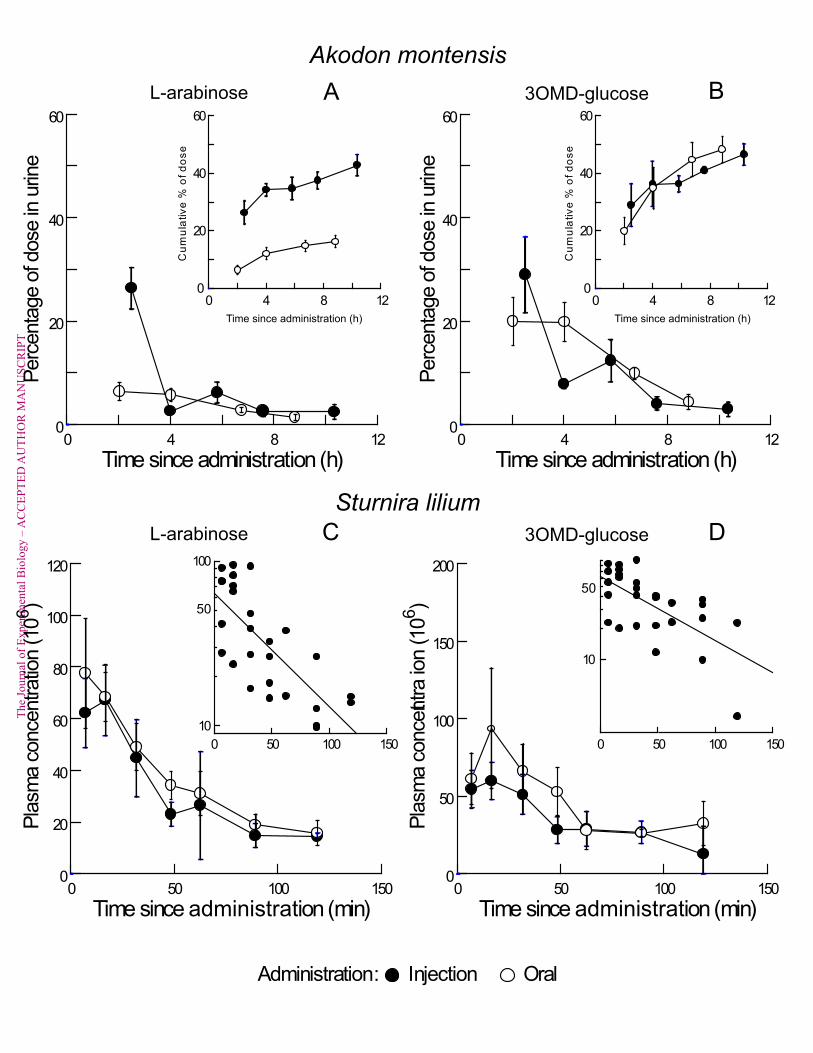
Fractional absorption (f) of 3OMD-glucose in A. montensis was 0.97±0.04 (N=6; not 147"
significantly different from unity), and fractional absorption of L-arabinose was significantly 148"
lower (0.35±0.05, N=6, p=0.0001; Fig 4). For S. lilium the fractional absorption of 3OMD-149"
glucose was also complete (1.46 ± 0.48, N=5, not significantly different from unity) as was 150"
fractional absorption of L-arabinose (1.2 ± 0.27, N=5; Fig 4), which was significantly higher 151"
than that of the rodent (P<0.001). 152"
153"
Discussion 154"
Fractional absorption of probes in intact animals 155"
As we predicted, the fractional absorption of the paracellularly-absorbed probe L-156"
arabinose was significantly higher in the bat (S. lilium) than in the rodent (A. montensis). In 157"
both species, 3OMD-glucose was completely absorbed. Fractional absorption of both probes 158"
was complete in bats. Values above 1 are likely due to our experimental design, because 159"
different animals were used for gavage and injection trials, instead of measuring both 160"
treatments in the same individuals. The difference in L-arabinose absorption between the bat 161"
and the rodent is in accordance with the pattern of absorption of nutrient-sized paracellular 162"
probes in other small bats, birds, and nonflying mammals (Table 1), giving additional support 163"
to the hypothesis that high paracellular nutrient absorption is an adaptation for flight 164"
(Caviedes-Vidal et al., 2007). 165"
In the bat, we provided animals with oral solutions that lacked Na+ so that that they 166"
would not reject the dose. Although sodium is required for Na+-coupled D-glucose 167"
absorption, it is not required for a whole-animal experiment such as this, because Na+ is 168"

The
Jour
nal o
f Exp
erim
enta
l Bio
logy
– A
CC
EPTE
D A
UTH
OR
MA
NU
SCR
IPT
secreted into the intestinal lumen with bicarbonate and also diffuses from the blood (Brody, 169"
1999). Animals absorb nearly all the glucose in their diets even if those diets are low in Na+ 170"
(Brody, 1999), and in fact, we observed complete absorption of 3OMD-glucose by the bats in 171"
this study. 172"
High paracellular nutrient absorption may have consequences in animals that 173"
primarily consume fruit, especially fruits rich in secondary metabolites that are potentially 174"
toxic like those from the families Solanaceae and Piperaceae, which are known to be the main 175"
food of S. lilium (Mello et al., 2008). The toxin problem may be mitigated by various aspects 176"
of bats’ behavior and physiology, such as geophagia (Ghanem et al., 2013), having efficient 177"
tissue-specific detoxification systems, higher rates of toxin biotransformation and higher 178"
kidney glomerular filtration rates (Karasov et al., 2012). Karasov et al. (2012) demonstrated a 179"
high reliance on paracellular nutrient absorption in small birds, and proposed the following 180"
trade off: the energy that birds gain by absorbing nutrients passively at low energetic cost 181"
may be offset, at least partially, by the metabolic demands placed on them to biotransform 182"
and eliminate concomitantly absorbed secondary metabolites. Our data suggest that the issue 183"
of increased toxic burden due to high paracellular permeability of the intestine may be 184"
important for frugivorous bats as well. The need for further research on the mechanisms and 185"
implications of the absorption of toxicants, especially water-soluble compounds, is apparent. 186"
Intestinal perfusion experiments 187"
In agreement with our prediction, the three frugivorous bats showed 2-12 fold higher 188"
L-arabinose clearance than the rodents in our intestinal perfusion experiments. This finding 189"
demonstrates that previously described differences in L-arabinose absorption between intact 190"
bats and rodents (Caviedes-Vidal et al., 2008; Fasulo et al., 2013a; Fasulo et al., 2013b; 191"
Karasov et al., 2012; Lavin, 2007 and current study) may be explained by differences in 192"
intestinal permeability, and not merely by differences in gut retention time, intestine size, or 193"
other factors. Although our data indicate a functional difference between bats and rodents at 194"
the level of the intestine, the mechanisms driving this difference are uncertain. Our clearance 195"
data were calculated per nominal surface area. High L-arabinose clearance in bats could arise 196"
from having more tight junctions per nominal surface area (e.g., via longer villi) and/or from 197"
having more permeable tight junctions (e.g., via differential expression of particular proteins 198"
that form the tight junctions). 199"
Previous studies have suggested that whole-animal paracellular absorption of glucose 200"
correlates positively (Pappenheimer, 1990; Pappenheimer, 1998) or negatively (Caviedes-201"
Vidal et al., 2007) with body size. Within bats, our perfusion results might suggest a positive 202"

The
Jour
nal o
f Exp
erim
enta
l Bio
logy
– A
CC
EPTE
D A
UTH
OR
MA
NU
SCR
IPT
relationship (based on very few data points) between L-arabinose clearance and body size, in 203"
that the largest bat (A. lituratus) had the greatest L-arabinose clearance while the smallest (C. 204"
perspicillata) had the least. In contrast, the largest rodent (laboratory rat) had the lowest L-205"
arabinose clearance among rodents. Our results are therefore somewhat equivocal as to the 206"
effect of body mass on intestinal paracellular permeability to nutrient-sized molecules. We 207"
selected bat and rodent species with significant overlap in body mass, such that most of the 208"
rodents were bracketed in size by the bats, all of which had much higher L-arabinose 209"
clearance than the rodents. Thus, if body mass does have some general effect on L-arabinose 210"
clearance, that effect appears small relative to the effect of taxon. 211"
Additionally, it is unknown whether diet is associated with any difference in 212"
paracellular permeability of the intestinal epithelium. We tried to minimize any effect of diet 213"
by choosing species that all specialize on carbohydrate-based diets. Further diet matching 214"
would have been difficult: for example, finding non-flying fruit specialist mammals of the 215"
same size range as our bats would have been difficult if not impossible. Thus, it is possible 216"
that the high paracellular nutrient absorption we observed in bats relative to rodents is not 217"
associated with flight, per se, but rather a combination of flight and diet differences between 218"
the taxa we tested. Our more immediate concern, however, was demonstration of a link 219"
between high paracellular nutrient absorption at the whole-animal level and paracellular 220"
permeability characteristics of the intestine. Regardless of any putative dietary association, 221"
our results show that the differences among taxa in paracellular nutrient absorption that we 222"
have observed in intact animals can be demonstrated at the level of the intestine as well. 223"
Molecule size has an important effect on paracellular absorption, and previous studies 224"
in both intact animals and isolated preparations have demonstrated decreasing paracellular 225"
probe absorption with increasing probe size (Anderson and Van Itallie, 2009; Chediack et al., 226"
2003; Delahunty and Hollander, 1987; Elia et al., 1987; Lavin et al., 2007; Price et al., 227"
2013a). This size sieving effect makes it difficult to accurately estimate glucose absorption 228"
using L-arabinose. Because of its smaller size (Mr 150 vs. 180), L-arabinose can more freely 229"
traverse the tight junction, and therefore, our calculations of glucose absorption via the 230"
paracellular route are overestimated. This explains why we calculate percent paracellular 231"
absorption higher than 100% in some cases (in bats); the higher mobility of L-arabinose in 232"
crossing tight junctions more than offsets the effect of transporter-mediated absorption of 233"
glucose. Higher absorption of L-arabinose than D-glucose has been observed previously in 234"
both intestinal perfusions and intact animals (Karasov et al., 2012; Price et al., 2013a). The 235"
size sieving effect also explains, in part, why D-glucose (Mr 180) absorption was higher than 236"
The
Jour
nal o
f Exp
erim
enta
l Bio
logy
– A
CC
EPTE
D A
UTH
OR
MA
NU
SCR
IPT
3OMD-glucose (Mr 194) absorption. Absorption of D-glucose by transporter-mediated 237"
means is also likely higher than 3OMD-glucose due to higher affinity for the glucose 238"
transporter (Ikeda et al., 1989; Kimmich, 1981). 239"
Conclusions 240"
This study supports the hypothesis that flying mammals (bats) rely heavily on 241"
paracellular nutrient absorption compared to rodents. Furthermore, differences among taxa in 242"
their reliance on paracellular absorption are driven by variation in intestinal permeability to 243"
nutrient-sized molecules and not merely by differences in gut retention time, intestine size, or 244"
other factors. These findings are in agreement with other studies but an enlarged comparative 245"
dataset including omnivorous, carnivorous, and nectarivorous bats will ultimately permit a 246"
more robust, phylogenetically informed test of the hypothesis that increased intestinal 247"
paracellular absorption has evolved as compensation for smaller intestinal size in flying 248"
vertebrates. 249"
250"
Materials and methods 251"
252"
Animals 253"
Montane grass mice (Akodon montensis; body mass: 37.4 ± 3.4 g) are omnivorous 254"
cricetid rodents, but their diet consists primarily of plant material (Talamoni et al., 2008). 255"
They were captured during the rainy season between October and November of 2012 in the 256"
Mata do São José (a remnant intact forest 15 km northeast of Rio Claro, São Paulo, Brazil). 257"
Montane grass mice were housed individually at the Universidade Estadual Paulista in Rio 258"
Claro in standard rodent cages and kept in a temperature-controlled room (22±1°C) with a 259"
12:12 light-dark cycle and access to water and standard laboratory chow (Sogorb, Lapa São 260"
Paulo, Brazil) ad libitum. Laboratory mice (Mus musculus, strain ND4; body mass 34.5 ± 3.2 261"
g) and laboratory rats (Rattus norvegicus, strain Sprague-Dawley; 502 ± 48 g) are omnivores 262"
with primarily carbohydrate-based diets. Both were obtained from Harlan (Indianapolis, IN, 263"
USA) and housed at the University of Wisconsin in similar light and temperature conditions 264"
with standard rodent chow (Harlan) and water provided ad libitum. 265"
The bats – Artibeus lituratus (61 ± 1.4 g), Sturnira lilium (21.8 ± 0.7 g), and Carollia 266"
perspicillata (16 ± 0.7 g) – are fruit and fruit juice specialists of the Phyllostomidae family 267"
(Mello et al., 2008; Mello et al., 2004; Passos and Graciolli, 2004). We captured bats with 268"
mist nets in November and December near a cave at the Fazenda da Toca, Itirapina, São 269"
Paulo, Brazil (22º11'58"S, 47º44'49"W), and also at the Mata do São José. They were held in 270"

The
Jour
nal o
f Exp
erim
enta
l Bio
logy
– A
CC
EPTE
D A
UTH
OR
MA
NU
SCR
IPT
large outdoor flight cages in Rio Claro. Bats were provided with fruits (bananas, apples, and 271"
papayas) and water ad libitum. 272"
All experiments were performed during the primary active period of the animals, i.e., 273"
nocturnally for all species. Experiments on bats and Akodon montensis were performed at the 274"
Universidade Estadual Paulista in Rio Claro, while those on laboratory mice and rats were 275"
performed at the University of Wisconsin-Madison with overlapping personnel and using 276"
identical protocols except as noted. All animal procedures adhered to institutional animal use 277"
regulations and approved animal use protocols (Universidade Estadual Paulista: protocol 278"
A1-2013; University of Wisconsin: protocol A01441). 279"
Recirculating intestinal perfusions 280"
The procedure for intestinal perfusions largely followed the protocol of Price et al. 281"
(2013a). Animals were anesthetized using isoflurane throughout the experimental procedure 282"
(0.8 L/min oxygen flow, 3.5–4% isoflurane during surgical preparation, 1–2% isoflurane 283"
during perfusion). Anesthetized animals were taped to a heating pad (Deltaphase Isothermal 284"
Pad, Braintree Scientific Inc., Braintree, MA, USA) that maintained a constant 37°C. A 285"
peritoneal incision was made and the intestine was cannulated ~1 cm from the stomach using 286"
a rat gavage needle as the cannula, which was secured with suture. An exit cannula was 287"
placed as far as possible from the entrance cannula distally, attempting to perfuse as much 288"
intestine as possible. The incision site was periodically moistened with physiological saline. 289"
Prewarmed saline solution was first flushed through the cannulated segment for 5 min to 290"
remove residual digesta. Then, a prewarmed buffer containing the experimental probes (10 291"
mM D-glucose, tracer amounts of [methyl-3H]-3-O-methyl-D-glucose (3OMD-glucose), 10 292"
mM L-arabinose, tracer amounts of [1-14C]-L-arabinose, 10 mM L-proline, 10 mM lactulose, 293"
100 mM NaCl, 1.2 mM NaHPO4, 20 mM NaHCO3, 5mM KCl, 1mM MgSO4, and 2 mM 294"
CaCl2, pH 7.4) was passed through the intestinal loop and recirculated using a peristaltic 295"
pump for ~ 2 h (flow rate=1 ml/min). The perfusion reservoir was kept in a water bath at 296"
37°C and sealed to avoid evaporative water loss. Once the perfusion ended, the perfusate was 297"
collected, the perfused section of intestine was removed from the abdomen and the animal 298"
was euthanized. The perfused segment of the intestine was measured for length using a 299"
caliper and then cut longitudinally and laid flat to measure circumference. The average of 3 300"
measurements taken along the length of the perfused section was used for further 301"
calculations. We calculated the “nominal surface area perfused” (smooth bore tube) as the 302"
product of the length × circumference, and calculated absorption of probes as the decrease in 303"
probe amount in the reservoir during the experiment (nmol) divided by the experiment 304"

The
Jour
nal o
f Exp
erim
enta
l Bio
logy
– A
CC
EPTE
D A
UTH
OR
MA
NU
SCR
IPT
duration (contact time on the intestine; min) and nominal surface area perfused (cm2). To 305"
calculate clearance, we divided absorption rate by [(Cinitial-Cfinal)/(Cinitial/Cfinal)], where C is 306"
probe concentration (Sadowski and Meddings, 1993), to correct for changes in concentration 307"
over the course of the experiment. Using L-arabinose absorption as a proxy for the portion of 308"
glucose absorption that is paracellular, we calculated a “percent paracellular absorption” as 309"
100 × (arabinose absorption) / (glucose absorption). This likely overestimates that proportion 310"
of glucose that is paracellular, a point we consider in our discussion. 311"
The initial perfusion volume was ~12 ml and aliquots were taken at the beginning and 312"
end of the perfusion to measure the concentration of probes. The perfusate was weighed pre- 313"
and post-perfusion with an analytical scale to determine the change in volume. Radionuclide 314"
activity in the samples was measured by scintillation counting (Brazil: Plate Chameleon™V 315"
Scintillation Microplate Reader, and Plate Chameleon V Liquid, Hidex, Turku, Finland; USA: 316"
Wallac 1414 LSC, PerkinElmer, Waltham MA and Ecolume scintillation cocktail, MP 317"
Biomedicals, Solon OH). When using the Plate Chameleon reader, counts were corrected for 318"14C spill and variable quenching by adding internal standards to replicate samples. 319"
Glucose concentration was measured with commercial kits (Laborlab, Guarulhos São 320"
Paulo, Brazil and Sigma, St. Louis, MO, USA); assays were conducted according to 321"
manufacturers’ instructions. 322"
Fractional absorption of probes measured in vivo 323"
Fractional absorption by intact animals was determined using standard 324"
pharmacokinetic procedures. Probes were administered to animals either by intraperitoneal 325"
injection or orally (in both cases, S. lilium n = 5; A. montensis n = 6). Oral doses were given 326"
in a solution (S. lilium 59.6 ± 3.6 µl; A. montensis 82.1 ± 22.5 µl) that contained 125 mM 327"
NaCl (A. montensis only), 50 mM D-glucose, and tracer amounts of [3H]3OMD-glucose 328"
(~0.15 µCi/g body mass and [14C] L-arabinose (~0.015 µCi/g body mass). The dose was 329"
administered by oral gavage to the stomach in the grass mice. In the bat, access to the 330"
stomach is made difficult by the narrow pharyngeal anatomy of this species. For that reason, 331"
we delivered the dose to the mouth in bats, and did not use salt in the gavage solution so that 332"
the bats would not reject the dose due to taste. This lack of sodium should not have affected 333"
our results, because Na+ is secreted into the gut with bicarbonate and can diffuse from the 334"
blood (Brody, 1999). Injected (i.p.) doses with the same tracers were delivered in 335"
physiological saline (S. lilium 26.5 ± 2.7 µl; A. montensis 24.1 ± 3.0 µl). 336"
For bats, a series of small blood samples (≤ 20 µl) was taken from the superficial 337"
veins of the wings and legs at approximately 8, 18, 30, 50, 80 and 120 min post-338"

The
Jour
nal o
f Exp
erim
enta
l Bio
logy
– A
CC
EPTE
D A
UTH
OR
MA
NU
SCR
IPT
administration. Plasma was separated using standard heparinized hemo-capillary tubes 339"
(Fisher Scientific, Pittsburg, PA, USA) and a microhematocrit centrifuge (SIGMA 1-14 340"
Microfuge with microhematocrit rotor 11026). Plasma mass was weighed with an analytical 341"
scale and tracer concentration was measured by scintillation counting. 342"
Montane grass mice, after administration of radiolabeled probes, were transferred to 343"
metabolic cages with wire bottoms and a funnel underneath to collect urine samples. While in 344"
the metabolic chambers, the grass mice were provided sucrose solution (10% w/v) ad libitum 345"
in order to supply calories and cause them to urinate more (Pappenheimer, 1990). Urine was 346"
collected every 1-2 hours, and a 10 µl subsample was taken for scintillation counting. 347"
Pharmacokinetic calculations 348"
The procedure for pharmacokinetic calculations followed the protocol of Karasov et 349"
al. (2012). In plasma sampling, fractional absorption (f) was calculated as 350"
(AUCtotaloral)/(AUCtotalinj), where AUC = dose-corrected area under the curve of plasma probe 351"
concentration vs. time. For each compound, the concentration (Ct; dpm g-1 plasma) in each 352"
plasma sample at time t was normalized to the weight of each sample and to the administered 353"
dose (dpm), and plotted against time since administration (either orally or by injection). The 354"
integration of the area under this curve (AUCt) represents the amount of compound that has 355"
been absorbed from time 0 up to time t, whereas AUCtotal denotes the total amount of 356"
compound absorbed from time 0 out to infinity (∞). Following typical procedures in 357"
pharmacokinetics, the area from t = 0 to t = x, (the time of the final blood sample) was 358"
calculated using the trapezoidal rule. The area from the final sample time to t = ∞ was 359"
calculated as AUCx→∞ = Ct (at t = x)/k, where k is a rate constant that was determined based 360"
on the terminal portion of the absorption curve of all bats sampled. The total AUCx→∞ was 361"
obtained by summing the two areas. 362"
This method of calculating f makes no major assumptions about compartments or 363"
kinetics and is an estimate of how much of the ingested probe was absorbed into the animal’s 364"
system. We could not calculate apparent fractional absorption for each individual bat because 365"
individuals were not administered probes both by injection and orally. However, the mean 366"
and variance of f for the population of bats was estimated based on the population of data 367"
from each route of administration as described in Stuart and Ord (1994). 368"
For each probe in the urine collection trials, the amount of the probe collected at each 369"
sampling time t was normalized to dose and multiplied by 100. Fractional absorption of each 370"
probe was determined by dividing the (cumulative % recovery of each probe following oral 371"
gavage) by the (cumulative % recovery following i.p. injection). 372"

The
Jour
nal o
f Exp
erim
enta
l Bio
logy
– A
CC
EPTE
D A
UTH
OR
MA
NU
SCR
IPT
Statistical analyses 373"
Statistical analyses were conducted with SYSTAT and results are expressed as means 374"
± 1 standard error (s.e.m.). In intestinal perfusions, differences among species in absorption, 375"
clearance, and paracellular proportion were determined using ANOVA with Tukey’s post-376"
hoc tests. We analyzed the correlation between D-glucose and 3OMD-glucose absorption 377"
using least-squares regression analysis. Percentages were divided by 10 and then arcsine 378"
square root transformed prior to statistical comparisons. Fractional absorption (f) values for 379"
probes were arcsine-square root transformed prior to statistical comparisons. Differences 380"
between species in fractional absorption in intact animals were determined using 2-sample T-381"
tests. Fractional absorption values differing from the theoretical value of 1 were detected 382"
using 1-sample T-tests. Significance was determined at α< 0.05. 383"
384"
385"
Acknowledgements 386"
We thank Guilherme Ambar for assistance in the field. Ted Taylor, Paul François, and 387"
Kimberly Kelly kindly assisted us with laboratory and logistic details. We thank Alexandre 388"
Castellar for catching the rodents. 389"
390"
Funding 391"
Funding was provided by FAPESP (2012/04610-5 to APC-N), the National Science 392"
Foundation (IOS-1025886 to WHK and ECV), Agencia Nacional de Promoción Científica y 393"
Tecnológica (FONCYT PICT2007 01320 to ECV), The Company of Biologists (JEB 394"
Travelling Fellowship to ERP), Universidad Nacional de San Luis (CyT 9502), and the 395"
Department of Forest and Wildlife Ecology at the University of Wisconsin-Madison. Funding 396"
agencies had no role in study design, analysis or interpretation of the data, or writing and 397"
submitting the article. 398"
399"

The
Jour
nal o
f Exp
erim
enta
l Bio
logy
– A
CC
EPTE
D A
UTH
OR
MA
NU
SCR
IPT
References 400"
401"
Anderson, J. and Van Itallie, C. (2009). Physiology and function of the tight junction. Cold Spring 402"
Harbor Perspect Biol1, a002584. 403"
Brody, T. (1999). Nutritional biochemistry. San Diego: Academic Press. 404"
Caviedes-Vidal, E., Karasov, W. H., Chediack, J. G., Fasulo, V., Cruz-Neto, A. P. and Otani, L. 405"
(2008). Paracellular absorption: a bat breaks the mammal paradigm. PLoS ONE3, e1425. 406"
Caviedes-Vidal, E., McWhorter, T. J., Lavin, S. R., Chediack, J. G., Tracy, C. R. and Karasov, 407"
W. H. (2007). The digestive adaptation of flying vertebrates: high intestinal paracellular 408"
absorption compensates for smaller guts. Proc Natl Acad Sci U S A104, 19132-7. 409"
Chediack, J. G., Caviedes-Vidal, E., Fasulo, V., Yamin, L. J. and Karasov, W. H. (2003). 410"
Intestinal passive absorption of water-soluble compounds by sparrows: Effect of molecular 411"
size and luminal nutrients. Journal of Comparative Physiology B Biochemical Systemic and 412"
Environmental Physiology173, 187-197. 413"
Delahunty, T. and Hollander, D. (1987). A comparison of intestinal permeability between humans 414"
and three common laboratory animals. Comparative Biochemistry and Physiology Part A: 415"
Physiology86, 565-567. 416"
Elia, M., Behrens, R., Northrop, C., Wraight, P. and Neale, G. (1987). Evaluation of mannitol, 417"
lactulose and 51Cr-labelled ethylenediaminetetra-acetate as markers of intestinal permeability 418"
in man. Clin Sci (Lond)73, 197-204. 419"
Fasulo, V., Zhang, Z., Chediack, J. G., Cid, F. D., Karasov, W. H. and Caviedes-Vidal, E. 420"
(2013a). The capacity for paracellular absorption in the insectivorous bat Tadarida 421"
brasiliensis. J Comp Physiol B183, 289-296. 422"
Fasulo, V., Zhang, Z., Price, E. R., Chediack, J. G., Karasov, W. H. and Caviedes-Vidal, E. 423"
(2013b). Paracellular absorption in laboratory mice: Molecule size-dependent but low 424"
capacity. Comparative Biochemistry and Physiology Part A: Molecular & Integrative 425"
Physiology164, 71-76. 426"
Ghanem, S. J., Ruppert, H., Kunz, T. H. and Voigt, C. C. (2013). Frugivorous bats drink nutrient- 427"
and clay-enriched water in the Amazon rain forest: support for a dual function of mineral-lick 428"
visits. Journal of Tropical Ecology29, 1-10. 429"
He, Y. L., Murby, S., Warhurst, G., Gifford, L., Walker, D., Ayrton, J., Eastmond, R. and 430"
Rowland, M. (1998). Species differences in size discrimination in the paracellular pathway 431"
reflected by oral bioavailability of poly(ethylene glycol) and D-peptides. J Pharm Sci87, 626-432"
33. 433"
Ikeda, T. S., Hwang, E. S., Coady, M. J., Hirayama, B. A., Hediger, M. A. and Wright, E. M. 434"
(1989). Characterization of a Na+/glucose cotransporter cloned from rabbit small intestine. J 435"
Membr Biol110, 87-95. 436"
The
Jour
nal o
f Exp
erim
enta
l Bio
logy
– A
CC
EPTE
D A
UTH
OR
MA
NU
SCR
IPT
Karasov, W. H., Caviedes-Vidal, E., Bakken, B. H., Izhaki, I., Samuni-Blank, M. and Arad, Z. 437"
(2012). Capacity for absorption of water-soluble secondary metabolites greater in birds than 438"
in rodents. PLoS ONE7, e32417. 439"
Kimmich, G. A. (1981). Intestinal absorption of sugar. In Physiology of the Gastrointestinal Tract, 440"
(ed. L. R. Johnson), pp. 1035-1061. New York: Raven Press. 441"
Lavin, S. R. (2007). Small intestine morphometrics and paracellular absorption in birds mammals. In 442"
Dept of Wildlife Ecology, vol. PhD Dissertation. Madison: University of Wisconsin - 443"
Madison. 444"
Lavin, S. R. and Karasov, W. H. (2008). Allometry of Paracellular Absorption in Birds. 445"
Physiological and Biochemical Zoology81, 551-560. 446"
Lavin, S. R., McWhorter, T. J. and Karasov, W. H. (2007). Mechanistic bases for differences in 447"
passive absorption. Journal of Experimental Biology210, 2754-2764. 448"
McWhorter, T. J. (2005). Paracellular intestinal absorption of carbohydrates in mammals and birds. 449"
In Physiological and ecological adaptations to feeding in vertebrates, eds. J. M. Starck and 450"
T. W. Wang), pp. 113-140. Enfield: Science Pub Inc. 451"
Mello, M. A. R., Kalko, E. K. V. and Silva, W. R. (2008). Diet and Abundance of the Bat Sturnira 452"
lilium (Chiroptera) in a Brazilian Montane Atlantic Forest. Journal of Mammalogy89, 485-453"
492. 454"
Mello, M. A. R., Schittini, G. M., Selig, P. and Bergallo, H. G. (2004). Seasonal variation in the 455"
diet of the bat Carollia perspicillata (Chiroptera: Phyllostomidae) in an Atlantic Forest area in 456"
southeastern Brazil. Mammalia68, 49-55. 457"
Pappenheimer, J. R. (1990). Paracellular intestinal absorption of glucose, creatinine, and mannitol in 458"
normal animals: relation to body size. American Journal of Physiology259, G290-G299. 459"
Pappenheimer, J. R. (1998). Scaling of dimensions of small intestines in non-ruminant eutherian 460"
mammals and its significance for absorptive mechanisms. Comp Biochem.Physiol A 461"
Mol.Integr.Physiol121, 45-58. 462"
Pappenheimer, J. R. and Reiss, K. Z. (1987). Contribution of solvent drag through intercellular 463"
junctions to absorption of nutrients by the small intestine of the rat. Journal of Membrane 464"
Biology100, 123-136. 465"
Passos, F. and Graciolli, G. (2004). Observacoes da dieta de Artibeus lituratus (Olfers) (Chiroptera, 466"
Phyllostomidae) em duas areas do sul do Brasil. Revista Brasileira de Zoologia21, 487-489. 467"
Price, E. R., Brun, A., Fasulo, V., Karasov, W. H. and Caviedes-Vidal, E. (2013a). Intestinal 468"
perfusion indicates high reliance on paracellular nutrient absorption in an insectivorous bat 469"
Tadarida brasiliensis. Comparative Biochemistry and Physiology - Part A: Molecular & 470"
Integrative Physiology164, 351-355. 471"
Price, E. R., Ruff, L. J., Guerra, A. and Karasov, W. H. (2013b). Cold exposure increases 472"
intestinal paracellular permeability to nutrients in the mouse. J Exp Biol216, 4065-70. 473"
The
Jour
nal o
f Exp
erim
enta
l Bio
logy
– A
CC
EPTE
D A
UTH
OR
MA
NU
SCR
IPT
Sadowski, D. C. and Meddings, J. B. (1993). Luminal nutrients alter tight-junction permeability in 474"
the rat jejunum. Can. J. Physiol. Pharmacol.71, 835-839. 475"
Shilton, L. A., Altringham, J. D., Compton, S. G. and Whittaker, R. J. (1999). Old World fruit 476"
bats can be long–distance seed dispersers through extended retention of viable seeds in the 477"
gut. Proceedings of the Royal Society of London. Series B: Biological Sciences266, 219-223. 478"
Stuart, A. and Ord, K. (1994). Kendall's Advanced Theory of Statistics. Distribution Theory. 479"
London: Arnold. 480"
Talamoni, S. A., Couto, D., Cordeiro Júnior, D. A. and Diniz, F. M. (2008). Diet of some species 481"
of Neotropical small mammals. Mammalian Biology - Zeitschrift für Säugetierkunde73, 337-482"
341. 483"
Tracy, C. R., McWhorter, T. J., Korine, C., Wojciechowski, M. S., Pinshow, B. and Karasov, W. 484"
H. (2007). Absorption of sugars in the Egyptian fruit bat (Rousettus aegyptiacus): a paradox 485"
explained. J Exp Biol210, 1726-34. 486"
487"
488"

The
Jour
nal o
f Exp
erim
enta
l Bio
logy
– A
CC
EPTE
D A
UTH
OR
MA
NU
SCR
IPT
L- arabinose
C. pers
picilla
ta
A. litur
atus
S. liliu
m
A. mon
tensis
R. norv
egicu
s
M. mus
culus
0
5
10
15
20 a,b
a
c,d
d
b,c
d
Cle
anra
nce
µl m
in-1
cm
-2

The
Jour
nal o
f Exp
erim
enta
l Bio
logy
– A
CC
EPTE
D A
UTH
OR
MA
NU
SCR
IPT
C. pers
picilla
ta
A. litur
atus
S. liliu
m
A. mon
tensis
R. norv
egicu
s
M. mus
culus
0
20
40
60
80
100
120
140
160D-glucose3OMD-glucose
Ab
sorp
tion
nmol
min
-1 c
m-2

The
Jour
nal o
f Exp
erim
enta
l Bio
logy
– A
CC
EPTE
D A
UTH
OR
MA
NU
SCR
IPT
C. pers
picilla
ta
A. litur
atus
S. liliu
m
A. mon
tensis
R. norv
egicu
s
M. mus
culus
0
20
40
60
80
100
120
140
160
180
200
D-glucose3OMD-glucose
a
a
a
b
b
b
a
a
b
g g
Per
cent
par
acel
lula
r abs
orpt
ion
The
Jour
nal o
f Exp
erim
enta
l Bio
logy
– A
CC
EPTE
D A
UTH
OR
MA
NU
SCR
IPT
OralInjectionAdministration:
Akodon montensis
Sturnira lilium
L-arabinose
L-arabinose
3OMD-glucose
3OMD-glucose
A B
C D
0 4 8 12
Time since administration (h)
0
20
40
60
Perc
enta
ge o
f dose in u
rine
0 4 8 120
20
40
60
Cu
mu
lativ
e %
of
do
se
Time since administration (h) Time since administration (h)
0 4 8 12
Time since administration (h)
0
20
40
60
Perc
enta
ge o
f dose in u
rine
0 4 8 120
20
40
60
Cu
mu
lativ
e %
of
do
se
0 50 100 150
Time since administration (min)
0
20
40
60
80
100
120
Pla
sm
a
concentration
(
10
6)
0 50 100 150
10
100
50
0 50 100 150
10
50
0 50 100 150
Time since administration (min)
0
50
100
150
200
Pla
sm
a
concentra
tio
n
(
10
6)
The
Jour
nal o
f Exp
erim
enta
l Bio
logy
– A
CC
EPTE
D A
UTH
OR
MA
NU
SCR
IPT
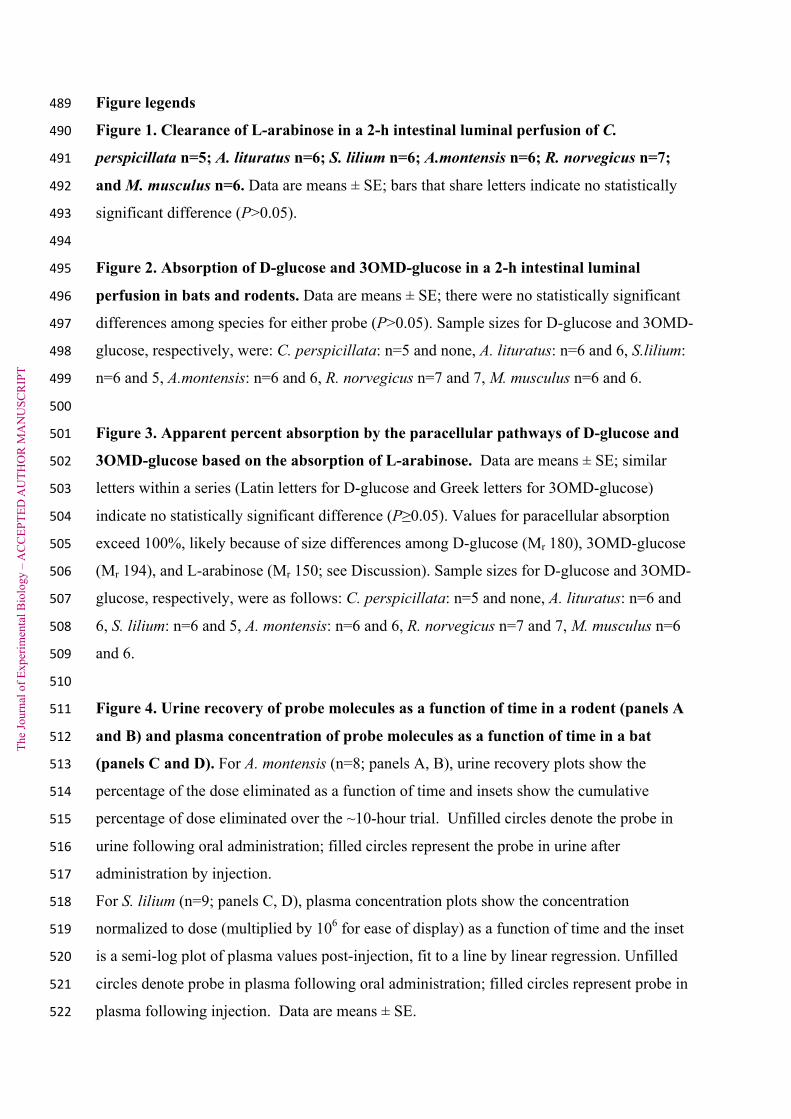
Figure legends 489"
Figure 1. Clearance of L-arabinose in a 2-h intestinal luminal perfusion of C. 490"
perspicillata n=5; A. lituratus n=6; S. lilium n=6; A.montensis n=6; R. norvegicus n=7; 491"
and M. musculus n=6. Data are means ± SE; bars that share letters indicate no statistically 492"
significant difference (P>0.05). 493"
494"
Figure 2. Absorption of D-glucose and 3OMD-glucose in a 2-h intestinal luminal 495"
perfusion in bats and rodents. Data are means ± SE; there were no statistically significant 496"
differences among species for either probe (P>0.05). Sample sizes for D-glucose and 3OMD-497"
glucose, respectively, were: C. perspicillata: n=5 and none, A. lituratus: n=6 and 6, S.lilium: 498"
n=6 and 5, A.montensis: n=6 and 6, R. norvegicus n=7 and 7, M. musculus n=6 and 6. 499"
500"
Figure 3. Apparent percent absorption by the paracellular pathways of D-glucose and 501"
3OMD-glucose based on the absorption of L-arabinose. Data are means ± SE; similar 502"
letters within a series (Latin letters for D-glucose and Greek letters for 3OMD-glucose) 503"
indicate no statistically significant difference (P≥0.05). Values for paracellular absorption 504"
exceed 100%, likely because of size differences among D-glucose (Mr 180), 3OMD-glucose 505"
(Mr 194), and L-arabinose (Mr 150; see Discussion). Sample sizes for D-glucose and 3OMD-506"
glucose, respectively, were as follows: C. perspicillata: n=5 and none, A. lituratus: n=6 and 507"
6, S. lilium: n=6 and 5, A. montensis: n=6 and 6, R. norvegicus n=7 and 7, M. musculus n=6 508"
and 6. 509"
510"
Figure 4. Urine recovery of probe molecules as a function of time in a rodent (panels A 511"
and B) and plasma concentration of probe molecules as a function of time in a bat 512"
(panels C and D). For A. montensis (n=8; panels A, B), urine recovery plots show the 513"
percentage of the dose eliminated as a function of time and insets show the cumulative 514"
percentage of dose eliminated over the ~10-hour trial. Unfilled circles denote the probe in 515"
urine following oral administration; filled circles represent the probe in urine after 516"
administration by injection. 517"
For S. lilium (n=9; panels C, D), plasma concentration plots show the concentration 518"
normalized to dose (multiplied by 106 for ease of display) as a function of time and the inset 519"
is a semi-log plot of plasma values post-injection, fit to a line by linear regression. Unfilled 520"
circles denote probe in plasma following oral administration; filled circles represent probe in 521"
plasma following injection. Data are means ± SE. 522"

The
Jour
nal o
f Exp
erim
enta
l Bio
logy
– A
CC
EPTE
D A
UTH
OR
MA
NU
SCR
IPT
Tables
Table 1. Fractional absorption of orally dosed carbohydrates in intact small mammals (<100 g).
Common name Scientific name
Body
mass (g)
Fractional absorption measured for various
carbohydrate probes
References
L-arabinose
(Mr 150)
L-rhamnose
(Mr 164)
3-O-methyl-D-glucose
(Mr 194)
Brazilian Free-
tailed Bat Tadarida brasiliensis 11 1.09 - 1.03 Fasulo et al. (2013a)
Little Yellow-
shouldered Bat Sturnira lilium 22 1.2 - 1.46 This study
Great Fruit-
eating Bat Artibeus lituratus 70 - 0.9 0.96 Caviedes-Vidal et al. (2008)
Laboratory
Mouse Mus musculus 28 0.14 – 0.21 - 0.95
Fasulo et al. (2013b); Price et al.
(2013b)
Montane Grass
Mouse Akodon montensis 37 0.35 - 0.97 This study
Common Spiny
Mouse Acomys achirinus 55 0.42 - 0.95 Karasov et al. (2012)
Golden Spiny
Mouse Acomys russatus 58 0.37 - 0.95 Karasov et al. (2012)