high-enthalpy reservoir indications in mbeya area (sw ... · main phases of surface exploration •...
TRANSCRIPT

High-enthalpy reservoir indications in Mbeya area (SW Tanzania) revealed by
magnetotelluric measurementsby
Ulrich Kalberkamp & Paul NdondeBGR, Hannover (Germany)GST, Dodoma (Tanzania)
November 2008
Federal Institute forGeosciences and Natural ResourcesGeological Survey of Tanzania

OutlineA Introduction
B The MT method
C MT results from Mbeya

Goal: Partner countries
use their geothermal
potential
Training
Policy advice and awareness raisingNetworking and international cooperation
0 10 20 30 40 50-15-10
-50
0 10 20 30 40 50-15-10
-50
Pilot projects reducing investment risks (feasibility studies, application of geoscientific methods for site evaluation)
A Introduction

Projects

Main phases of surface exploration• Literature survey (desk top study)
• Regional review (with prioritizing sites)
• Site selection (apply for concession of most promising site)
• Remote sensing (satellite images, aerial photographs, IR, InSAR)
• Geologic survey (rock units, tectonic setting, active faulting, age of youngest volcanic activity, surface manifestations, alteration zones)
• Hydrologic survey (meteorological data, discharge rates of springs, water table, hydraulic gradient, mean residence time)
• Geochemical survey (chemical and isotopic composition of fluids and gases, geo-thermometry, soil gas survey)
• Interim conceptual model (for geophysical survey planning)
• Geophysical survey (temperature gradient, resistivity methods, gravity, magnetics, micro-seismicity)
• Synthesis (final conceptual model with suggestion of sites for exploratory drilling)
A Introduction
A Introduction
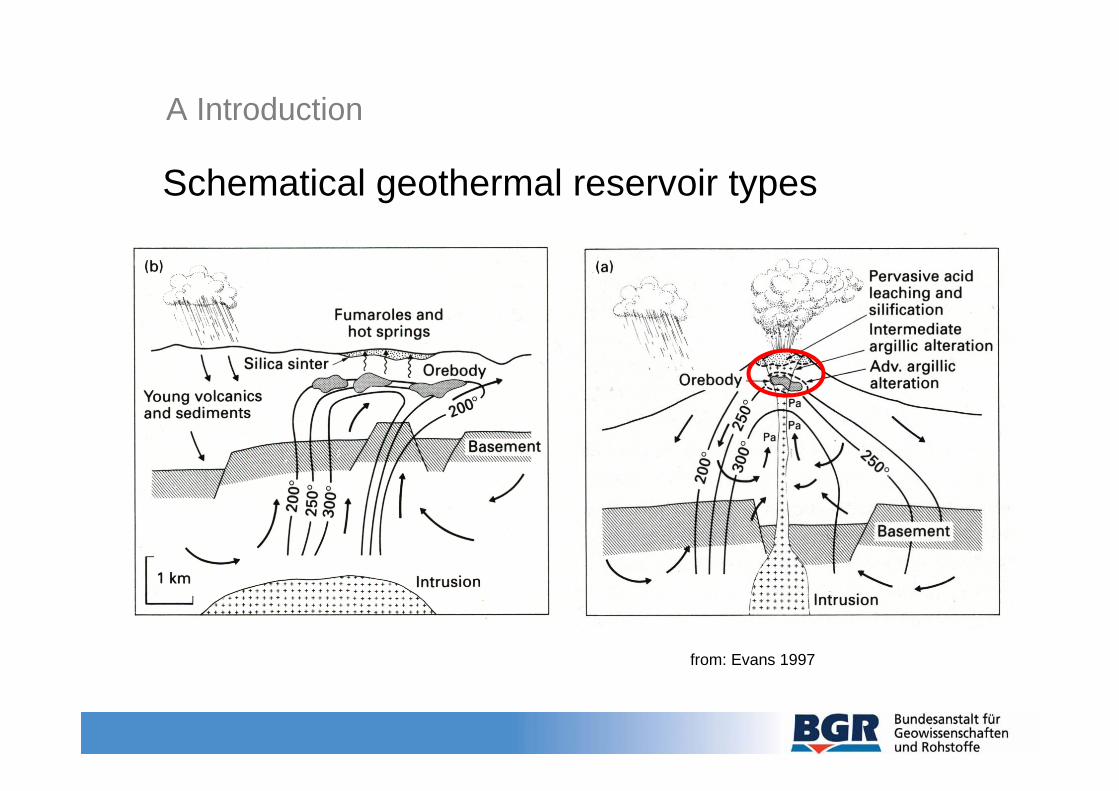
Schematical geothermal reservoir types
from: Evans 1997
A Introduction
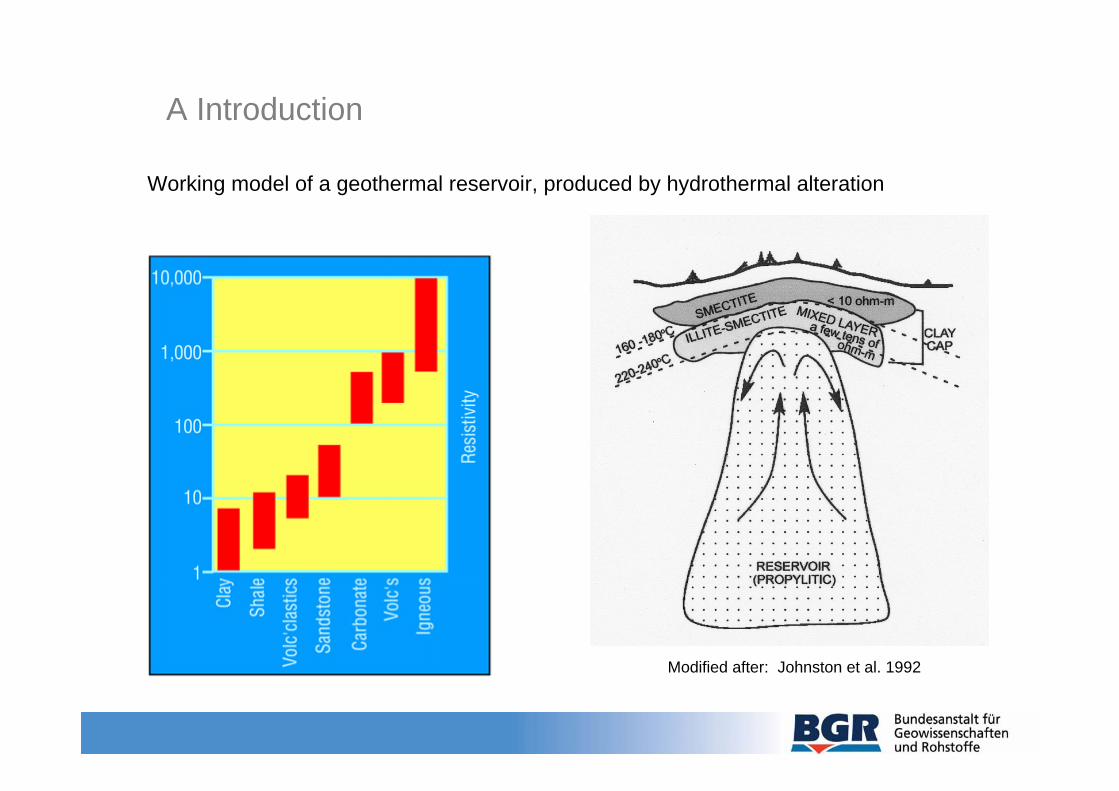
Working model of a geothermal reservoir, produced by hydrothermal alteration
Modified after: Johnston et al. 1992

B The MT method
North
East
Two 5-channel stations (Ex, Ey, Bx, By, Bz)Time synchronised recordingFrequency range: 10 kHz to 0.01 Hz (100 s)Sensors: Induction coil magnetometersPb-PbCl electrodes, dipole length 100 m
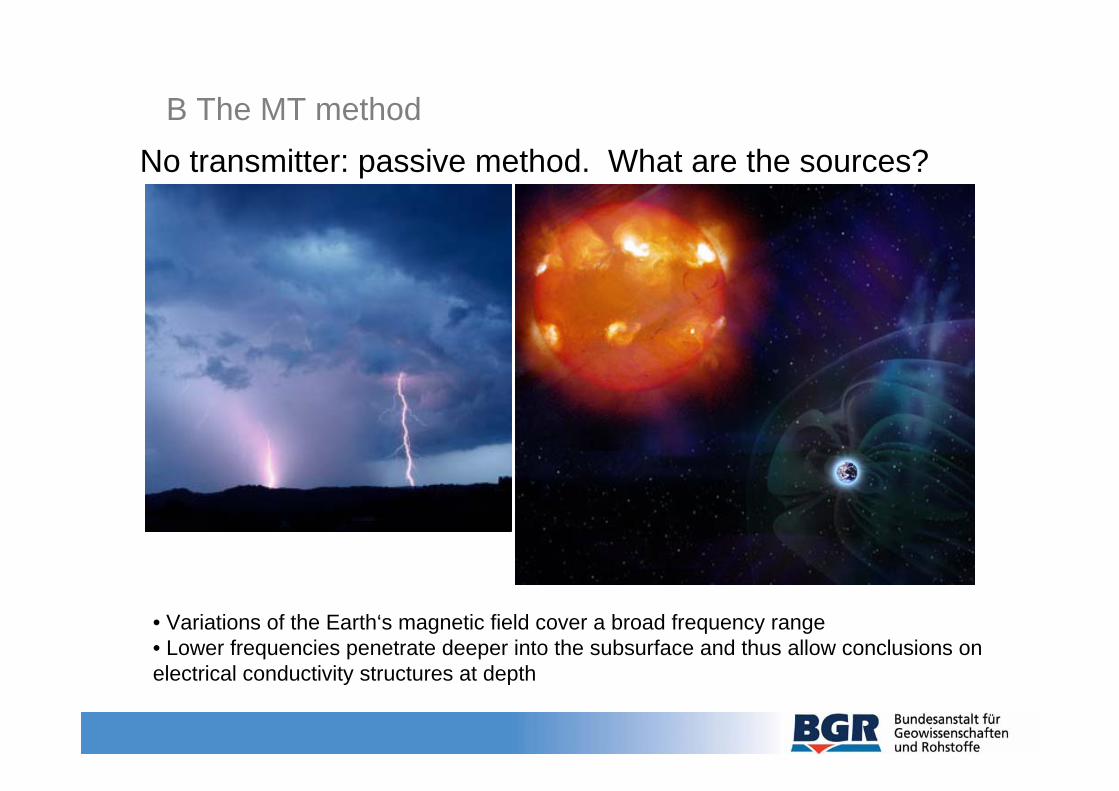
B The MT methodNo transmitter: passive method. What are the sources?
• Variations of the Earth‘s magnetic field cover a broad frequency range• Lower frequencies penetrate deeper into the subsurface and thus allow conclusions on electrical conductivity structures at depth

The ratio of E- to H- field variations is used to calculate apparent
resistivities for selected frequencies.
The phase shift between E- and H-fields is also indicative for changes in
subsurface resistivity
B The MT methodExploration depth depends on frequency and conductivity of subsurface:
e.g.: 10 Ohm*m / 0.1 Hz5 km depth of exploration

C MT results from Mbeya
Major structural elements,Tanzania and surroundings
Rungwe Volcanic ProvinceMbeya Triple Junction

C MT results from Mbeya
Rungwe Volcanic ProvinceNgozi volcano in the North
Survey area

C MT results from Mbeya
1
100
1k 1 0,01
App. Resistivity[Ohm*m]
Phase [deg.]
0
90
Frequency [Hz]

C MT results from Mbeya
20 km
Altitude masl
Ngozi crater
1300
2100

Line 1: Resistivity section
C MT results from Mbeya
20 km
5 km
NESW
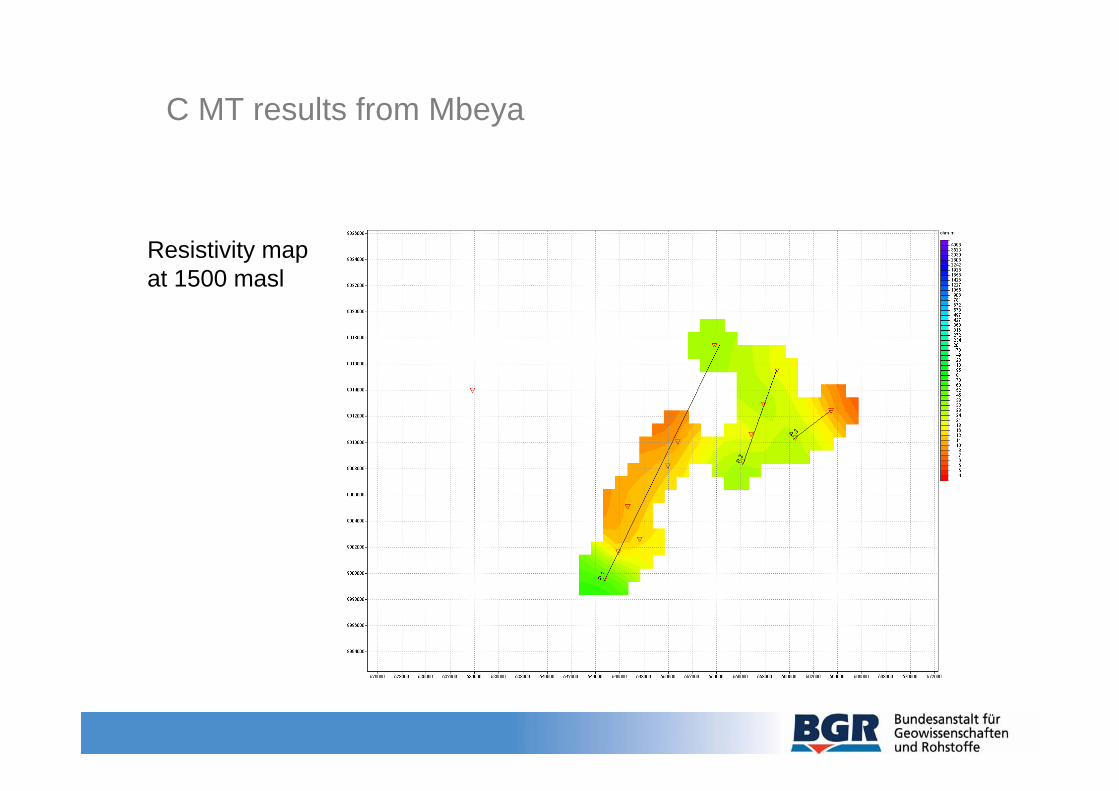
Resistivity mapat 1500 masl
C MT results from Mbeya
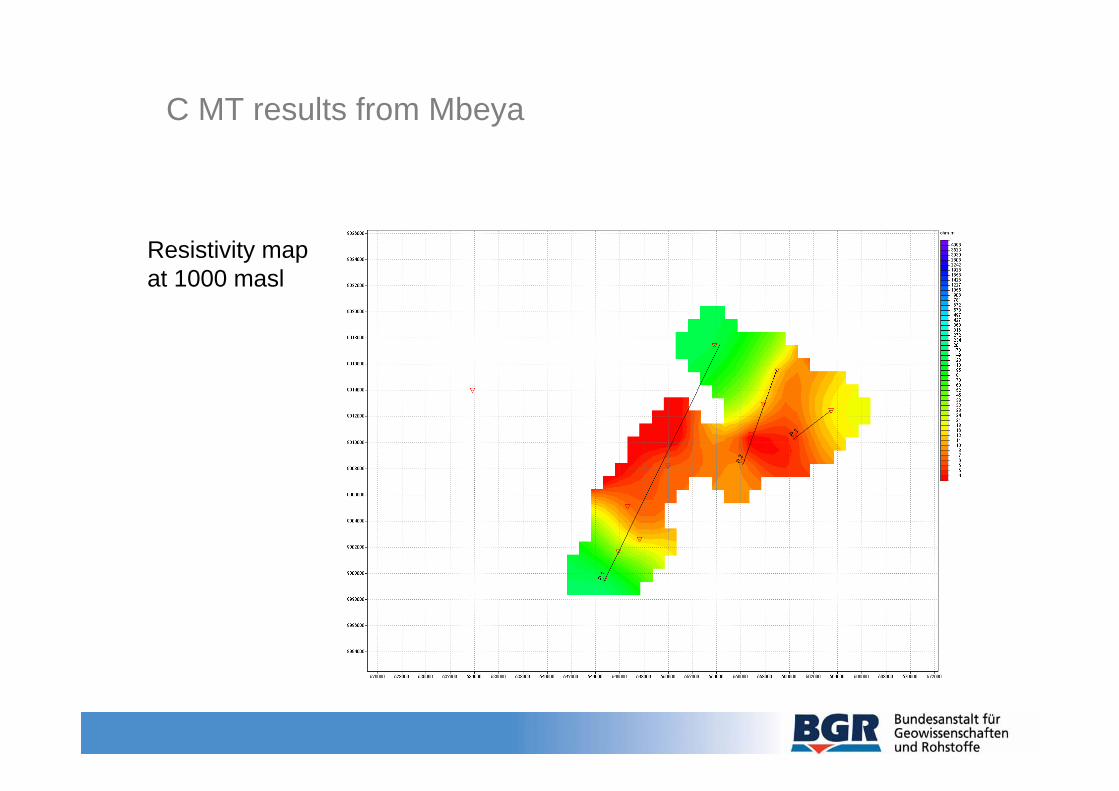
Resistivity mapat 1000 masl
C MT results from Mbeya

Resistivity mapat 500 masl
C MT results from Mbeya
1400 m depth
Increased conductivity in flowdirection of hydrothermal waters

Resistivity mapat sea level
C MT results from Mbeya

Resistivity mapat 125 mbsl
C MT results from Mbeya

Resistivity mapat 250 mbsl
C MT results from Mbeya
Assumed reservoirlocation,Depth approx. 2200m

Resistivity mapat 375 mbsl
C MT results from Mbeya

Resistivity mapat 500 mbsl
C MT results from Mbeya

Resistivity mapat 1000 mbsl
C MT results from Mbeya

Resistivity mapat 2000 mbsl
C MT results from Mbeya
Rukwa Rift?
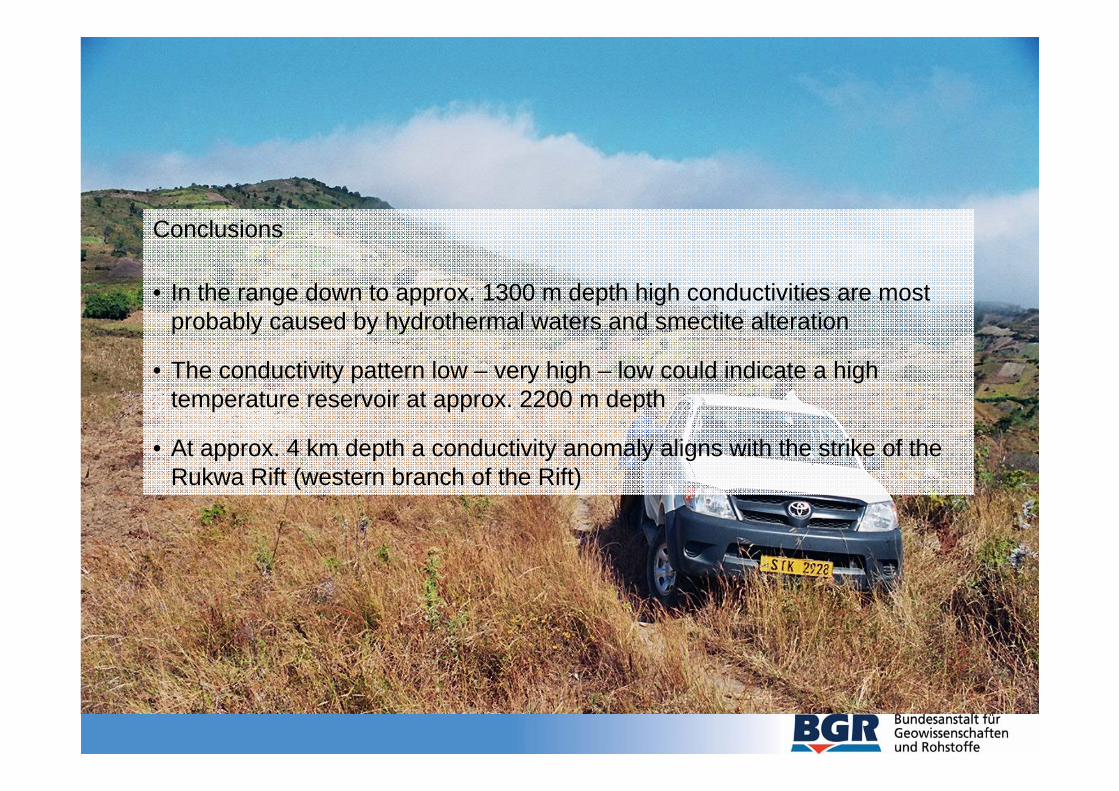
Conclusions
• In the range down to approx. 1300 m depth high conductivities are most probably caused by hydrothermal waters and smectite alteration
• The conductivity pattern low – very high – low could indicate a high temperature reservoir at approx. 2200 m depth
• At approx. 4 km depth a conductivity anomaly aligns with the strike of the Rukwa Rift (western branch of the Rift)

Thank you for your attention!