high efficiency room air conditioner - info - home · high efficiency room air conditioner pradeep...
TRANSCRIPT
ORNL/TM-2015/10 CRADA/NFE-12-03996
High Efficiency Room Air Conditioner
Pradeep Bansal, PhD
1/31/2015
Approved for public release;
distribution is unlimited.

DOCUMENT AVAILABILITY
Reports produced after January 1, 1996, are generally available free via US Department of Energy (DOE) SciTech Connect. Website http://www.osti.gov/scitech/ Reports produced before January 1, 1996, may be purchased by members of the public from the following source: National Technical Information Service 5285 Port Royal Road Springfield, VA 22161 Telephone 703-605-6000 (1-800-553-6847) TDD 703-487-4639 Fax 703-605-6900 E-mail [email protected] Website http://www.ntis.gov/help/ordermethods.aspx Reports are available to DOE employees, DOE contractors, Energy Technology Data Exchange representatives, and International Nuclear Information System representatives from the following source: Office of Scientific and Technical Information PO Box 62 Oak Ridge, TN 37831 Telephone 865-576-8401 Fax 865-576-5728 E-mail [email protected] Website http://www.osti.gov/contact.html
This report was prepared as an account of work sponsored by an agency of the United States Government. Neither the United States Government nor any agency thereof, nor any of their employees, makes any warranty, express or implied, or assumes any legal liability or responsibility for the accuracy, completeness, or usefulness of any information, apparatus, product, or process disclosed, or represents that its use would not infringe privately owned rights. Reference herein to any specific commercial product, process, or service by trade name, trademark, manufacturer, or otherwise, does not necessarily constitute or imply its endorsement, recommendation, or favoring by the United States Government or any agency thereof. The views and opinions of authors expressed herein do not necessarily state or reflect those of the United States Government or any agency thereof.

1
ORNL/TM-2015/10
CRADA/NFE-12-03996
Energy Transportation and Science Division
High Efficiency Room Air Conditioner
Pradeep Bansal, PhD
Date Published: 1/31/2015
Prepared by
OAK RIDGE NATIONAL LABORATORY
Oak Ridge, Tennessee 37831-6283
managed by
UT-BATTELLE, LLC
for the
US DEPARTMENT OF ENERGY
under contract DE-AC05-00OR22725

2

3
TABLE OF CONTENTS
Page Nos.
1. Executive Summary 4-5
2. Statement of Objectives 6
3. Benefits to the Funding DOE Office’s Mission 6
4. Introduction 7-8
5. Preliminary modelling of baseline unit: description of modelling tools 9-13
6. Testing of laboratory breadboard unit 14-27
7. Validation of HPDM with test data of base window air conditioner 28-35
8. Efficiency enhancement options and testing of the prototype 36-42
9. Assessment of alternative refrigerant options using HPDM-Flex-7.9.1 43-47
10. Design of production ready high efficiency window prototype 48-53
11. Commercialization plans 54
12. Plans for future collaboration 54
13. Conclusions 54
14. Acknowledgements 55
15. References 55-56
16. Appendices (A and B) 57-77

4
EXECUTIVE SUMMARY
This report documents the design and development of the next generation high efficiency window air-conditioner
(WAC). There are currently nearly 47 million WACs operating in the United States which account for approximately 1.5%
of the total US residential energy use or about 0.21 quads per year. Assuming a 20% penetration rate, higher efficiency
models could result in energy savings of 0.985 quads over next 20 years.
A state-of-the-art WAC unit having an EER of 10.8 with 10,000 BTU/hr capacity was chosen for the development and
experimentation. The project involved both simulation and the experimental analysis of the new prototype. The CRADA
partner, GE supplied two of their standard 10,000 BTU/hr capacity models (AEM10AP) for evaluation and testing. This
unit was fully instrumented for the following measurements-
(1) refrigerant mass flow rate (2) 3 in-line refrigerant temperatures (at suction, discharge and liquid line) (3) 4 refrigerant side pressures (4) 11 refrigerant side, tube wall temperatures to aid modeling of heat exchangers (5) 24 air-side temperatures (6) 4 air side %RH measurements (7) fan, compressor, and total power (8) barometric pressure for ideal gas calculations
A dedicated measurement/data acquisition (DAS) system was developed using the Campbell Scientific CR3000 data
logger. The system included integrated refrigerant lookup tables as well as a graphical user interface (GUI) to provide
real-time feedback during testing. In addition, a MathCAD based analysis tool was developed to perform a zero order
uncertainty analysis in both the base measurements and the corresponding calculated quantities. The program tracks
the propagation of uncertainties in the base measurements through to the final calculated quantities. (Capacity, COP,
EER etc.)
The WAC was tested in the environmental chambers at ORNL as per the design rating conditions of AHAM/ASHRAE
(Outdoor- 95F and 40%RH, Indoor- 80F, 51.5%RH). In general, the experimental results were found to correlate well with
the published numbers, with differences of -3% and +2.6% for the experimental values of EER and capacity respectively.
In order to achieve higher EER, one of the major modifications was made by downgrading the unit capacity from 10,000
BTU/hr to 8,000 BTU/hr by replacing the original compressor with a lower capacity (8,000 BTU/hr) but more efficient
compressor. However, all heat exchangers from the original unit were retained to provide higher EER. The other
subsequent major modifications included- (i) the AC fan motor was replaced by a brushless high efficiency ECM motor
along with its fan housing, (ii) the capillary tube was replaced with a needle valve to better control the refrigerant flow
and refrigerant set points, and (iii) the unit was tested with a ‘drop-in’ environmentally friendly binary mixture of R32
(90% molar concentration)/R125 (10% molar concentration).
The use of the blended mixture of R32/R125 lowers the Global Warming Potential (GWP) of the refrigerant by about
40% since the refrigerant mixture has a GWP of 1,251 while the original R-410A refrigerant has a 2,079 GWP. In
addition, these modifications resulted in a number of added advantages including the reduction in its operating cost,
electrical demand, and the environmental impact.

5
The modelling of the new WAC prototype suggest an EER of 13.0; several tuning and testing were conducted to verify
and validate the model.
The WAC prototype (with 8,000 BTU/HR capacity) was shipped to Intertek for independent testing at the DOE test
condition in early October 2014. Due to the heavy usage of the climatic chambers at Intertek, there was a long waiting
time for any unit to be tested at Intertek, and hence our WAC could only be tested in late January 2015. By that time,
our WAC unit unfortunately lost charge of the R32/R125 (90%/10%) blend and could not perform at the expected level.
Intertek were not willing to charge the unit with the refrigerant blend of R32/R125 (90%/10%) due to slightly higher
flammability of R32 and hence this testing had to be abandoned. The WAC unit was, however, evacuated, recharged
with R410A and tested at DOE conditions. Although the WAC prototype was optimized for R32/R125 blend and not for
R410A, an EER of 12.1 was achieved for the unoptimized WAC prototype.
In the meantime, GE had advised that they have already designed a high efficiency WAC unit (with 8,000 BTU/HR
capacity) using R410A refrigerant with an EER of 12.1. GE will be commercializing this new unit during 2015. This new
unit, however, neither uses ECM fan motor nor the refrigerant blend. This suggests that our WAC should yield much
higher EER than the GE’s new WAC due to these two important parameters. Although the final EER of the unit could not
be verified through an independent testing, both the modelling and the experimental evaluations suggest that this WAC
offers 12-20% energy savings in comparison to the state-of-the-art basine unit.

6
STATEMENT OF OBJECTIVES
The purpose of this Cooperative Research and Development Agreement (CRADA) between UT–Battelle, LLC (the
“Contractor”) and General Electric (herein “Participant”), is to conduct research and development to evaluate the
technical and commercial viability of a high efficiency room air conditioner with an energy efficiency ratio (EER) of 13.0.
The Participant has commercialized a series of Energy Star rated room air conditioners. In order to further improve the
performance of such units and facilitate larger annual energy savings, the proposed project will evaluate multiple
technical solutions, such as high efficiency compressors, improved heat exchangers (micro-channel condensers), and
brushless dc fan motors, from the perspectives of energy efficiency and manufacturing cost. The Participant is a leading
U.S. manufacturer of room window air conditioners.
BENEFITS TO THE FUNDING DOE OFFICE’S MISSION
The Department of Energy’s (DOE) Building Technologies Program (DOE-BT) has as its long term goal to create
marketable technologies and design approaches that address energy consumption in existing and new buildings. The
current vision that DOE-BT has for achieving this goal involves reducing the energy and carbon emissions used by the
energy service equipment (equipment providing space heating and cooling, water heating, etc.) by 50% compared to
today’s best common practice BY 2030. The installed base of window air conditioners in the U.S is approximately 46.7
million. Existing window air conditioners consume approximately 1.5% of total U.S annual residential energy
consumption or 0.33 Quads. Window units are popular because they are inexpensive, provide zonal control, and are
easy to install. The most popular product classes are cooling-only units equipped with louvered sides and ranging in
capacity from 5,000 to 16,000 Btu/hr. Prices range from $100 to $500, making it challenging to cost effectively reduce
energy consumption. However, improving the efficiency of window units is essential to enhancing overall residential
building energy performance. The new design offers the technical potential of 0.1 quads of energy savings per year.

7
1.0 INTRODUCTION
Window air conditioners (WAC) are inexpensive and sold in large numbers internationally as alternatives to central air-
conditioning systems for space cooling, supplemental cooling and for retrofitting air conditioning homes to improve
comfort. They are particularly attractive in older buildings that lack ducted systems and in cases where a central system
upgrade is first-cost prohibitive [Shen and Bansal (2014), Nogueira (2013), Winkler et al. (2013)]. According to the US
Energy Information Administration (EIA) there were nearly 46.7 million WACs operating within the United States in 2009
[EIA (2009)], accounting for approximately 1.5% of the total US residential energy use or about 0.33 quads (0.35 EJ).
WACs are available in sizes typically between 5,000 and16,000 Btu/h (0.4-1.3 tons, or 1460–4700 W of cooling). A WAC
is generally installed either in a window or in a framed wall opening depending on the design of the condenser side
vents. When the project was initiated in 2011, the minimum efficiency levels for window air conditioners were set at 9.7
(for capacity less than 10,000 BTU/h) to 9.8 (for 10,000 BTU/h or higher capacity) for most product classes. These levels
have since been subsequently raised to 10.7 and 10.8 respectively in 2014 [e-CFR (2014)]. The average lifetime of
window air conditioners, which is 10 to 13 years, coupled with the potential for rapid replacement of older, less efficient
units, some of which have EERs of 5, makes them a primary target for reduction in annual U.S. energy consumption.
Such an initiative would not only bring energy savings to the end user but would also assist in protecting the
environment as a result of reduced greenhouse gas emissions. In addition, it will assist in meeting the DOE/BTO goals
across all HVAC technologies to reduce energy use by 50% by 2030 compared to a 2010 baseline that requires the
development and implementation of advanced equipment options.
The technology will be used in residential buildings, both single family and small, low-rise multifamily types, and certain
types of small commercial buildings. With over 8 million units shipped each year, high efficiency units could make a
significant impact on sector energy use in a short amount of time based on the replacement rate. Based on business
case analyses conducted by ORNL, the new design offers the technical potential of 0.1 quads of energy savings per year.
Although vapor compression refrigeration is a highly researched topic, surprisingly very little research has been devoted
to the energy efficiency improvement of WACs in the open literature [Goswami et al (1993), Hajidavalloo (2007),
Naphon (2010), Sawant et al (2011)], while a few studies were devoted to investigating alternative refrigerants for WACs
[Bansal and Shen (2014), Bolaji (2011), Devotta et al. (2005), Jabaraj et al. (2006). One of the efficiency enhancement
option used in the literature [Goswami et al (1993), Hajidavalloo (2007)] included evaporative wet cooling media pads
on the condenser of window-air-conditioner that resulted in the reduction of power consumption of the WAC by about
up to 20%. However, this system had practical limitations of clogging up of media pads and issues of keeping them wet.
Sawant et al (2011) applied slightly different approach by spraying dehumidified water on to the media pads placed on
both sides of the air conditioner that led to 13% energy savings of the WAC. They also studied an alternative approach of
using wicks of porous cloth where one end of the wick was immersed in the dehumidified water tank and the other end
was wrapped on the air flow enter side of the condenser. Naphon (2010) found that the use of a 3-rows heat pipe with
refrigerant R134a as the working fluid to cool the air entering the condenser of a window air conditioner improved the
EER of the WAC by 17.5%.
One of the challenges to improve energy efficiency is that traditional design improvement features that are generally
used to improve the energy efficiency of central HVAC systems, such as variable-speed compressors and advanced
control systems, somehow do not result in the EER improvement of window air conditioners due to performance testing
limited to single test point. It should, however, be noted here that the novelty of the ‘single point’ test is that it captures
the energy consumption of the unit during peak load, which is a major consideration when conserving energy for the US.
Thus, improvements are limited to efficiency gains in the heat exchangers, compressor, and fan motors. In addition,

8
because of the low first cost of window air conditioners, typically in the $100 to $500 range, added costs for design
improvements are limited. However, one important point to note here is that the modern WACs use a ‘slinger’
(explained later) to provide evaporative cooling of condenser that leads to significant efficiency improvement of a WAC.
This report, therefore, discusses the novel elements that have been applied to improve the energy efficiency of a state-
of-the-art WAC with base capacity of 10,000 BTU/h, including a ECM fan motor, a reduced capacity but high efficiency
compressor (with reduced refrigeration capacity of 8,000 BTU/h) and a new ‘drop-in’ refrigerant mixture of R32/R125
(with 90%/10% molar concentration). The novel use of this blended mixture of R32/R125 lowers the Global Warming
Potential (GWP) of the refrigerant by about 40% since the refrigerant mixture has a GWP of 1,251 while the original
R410A refrigerant has a 2,079 GWP. This results in a number of advantages including the reduction in its operating cost,
electrical demand, and the environmental impact.These features led to the development of a high efficiency WAC (with
capacity of 8,000 BTU/h) that resulted in 12-20% annual energy savings as compared with the-state-of-the-art baseline
unit.

9
2.0 PRELIMINARY MODELLING OF BASELINE UNIT: DESCRIPTION OF MODELING
TOOLS
Two different versions of ORNL’s Heat Pump Design Model (HPDM) were used to simulate the window units being
analyzed for this study. The first of these is a version modified by the consulting firm “Navigant” for the 2011 DOE
rulemaking for room air conditioners [DOE (2011)], and is based on the Mark III version of HPDM and is specified as
“Mark N”. This modified HPDM included additional features specific to window units such as condensate sub cooler,
condensate spray slinger, as well as heat transfer between the indoor and outdoor sections of the unit. Other features of
the Navigant code “MarkN” included adjustment factors to account for enhanced tubes, short circuiting of indoor air,
and compressor power and refrigerant mass flow rate.
The second modeling tool used for this study was a modified Beta version of HPDM Mark 7 [Rice et al. (1981)]. This
version featured a MS Excel interface for generation of the input files which greatly expedited the parameter input
process. Also included in this version was a discretized heat exchanger model. This feature allowed the heat exchanger
refrigerant flow paths to be represented in the simulation exactly as they were on the actual unit. Additionally, the
discretization of the coils allowed for the various stages of 2 phase flow in the evaporation/condensation processes to
be modeled more accurately. This simulation tool lacked some of the window-unit-specific features of the Mark N code.
PARAMETRIC STUDY
As a starting point, both models were calibrated to match the design specs of the GE window units being used as the
baseline. Compressor data was received from GE and this was then converted into the standard 10 coefficient maps for
power, mass flow, and capacity as functions of the discharge and suction saturation temperatures. The heat exchangers
were measured and the refrigerant flow paths determined. Fan power for the baseline unit was estimated to be the
motor rated power and is specified as 95W. The published specifications for the baseline unit are shown in Table 1.
Table 1: GE AEM10AP Window Air-Conditioner Unit Specifications
GE AEM10AP
EER 10.8 BTU/W-hr
Capacity 10,000 BTU/hr
Dehumidification 2.3 pint/hr
SHR .767
Indoor Airflow 290 cfm
Outdoor Airflow 500 cfm
Fan Rated Power 95W
Evaporator Length 12.75 in
Evaporator Height 9.75 in
Evaporator Thickness 2 in
Evaporator Number of Rows 4
Evaporator Tubes per Row 13
Evaporator Fin Pitch 20/in
Condenser Length 16.25 in
Condenser Height 13 in
Condenser Thickness 1.3125 in

10
Condenser Number of Rows 3
Condenser Tubes per Row 17
Condenser Fin Pitch 24/in
Due to the different capabilities of the two models, the following separate procedures were used for the parametric
studies using each tool.
Mark 7 Beta Analysis
To establish the baseline model using the Mark 7 Beta code, the following procedure was used.
(1) The known inputs were fed into the model. These included HX geometry and circuitry, fan power, compressor
map, indoor and outdoor airflow rate. Additionally, an evaporator superheat degree of 10 F was specified. For
the Beta Mark 7, there was currently not a model for the expansion device, so a condenser sub-cooling value
was also specified. For this simulation the condenser sub-cooling degree was held constant at 12 F.
(2) The compressor shell loss was assumed to be 20%.
(3) The window units being used for the baseline incorporate both a condensate sling fan as well as a condensate
condenser sub-cooler to enhance the performance of the unit. Since this version of Beta Mark 7 does not
currently have modules for these two components, for modeling purposes these two effects were combined and
were treated as a refrigerant line heat loss. The magnitude of this line loss was used as a calibration factor.
(4) An air side heat transfer multiplier was used to quantify the misdistributions in the condenser air flow. This
value was used as a second calibration factor.
(5) The model was run and the calibration factors adjusted until good correlation is achieved for the predicted
values of EER, capacity, and SHR and the values specified by the manufacturer. Values of line loss=7.65 BTU/lb,
and air_side_mult=0.4008 were found to give good correlation between the model and the published
performance data.
With the baseline established, a preliminary parametric study was conducted to explore possible options for upgrading
the units to EER 13.0. Based upon the 2011 DOE study [2011], this initial parametric analysis was limited to changes to
the components which were found to have the greatest impact on the unit efficiency. Additional consideration was
given to limit changes to those which would not require major changes in the chassis, fan geometry, or airflow routing of
the stock unit. The selected parameters were as follows;
(1) Compressor efficiency
(2) Fan motor efficiency
(3) Additional condenser tube row
(4) Condenser Airflow
The level of change to the compressor and fan were selected based upon the estimates of the technology currently
available. For the compressor, this limit was estimated to be EER=10.8 at the standard ASHRAE conditions of Te=45F,
Tc=130F. Since maps for the commercially available high efficiency rotaries were not currently available, the power
consumption for the stock unit was scaled to deliver an EER of 10.8 at the standard conditions. This correlated to a
reduction of the stock input power by 5.6% over the entire operating range.
Heat exchanger geometry changes were limited to the addition of one additional tube row to the condenser. This
constraint was selected for the preliminary study because, unlike changes to the frontal surface area of the heat

11
exchangers, the addition of a tube row would require minimal alteration to the existing chassis and fan. Condenser
airflow was varied between the stock value and stock +20%. This analysis assumed that it was possible to vary the
condenser airflow without changing the flow through the evaporator. In the actual units, both fans were driven by a
single motor so unless the two were decoupled, actual implementation of this would require some changes to the
evaporator fan geometry to maintain the airflow at the stock level.
A full factorial set (16 runs) of simulations was conducted using the Mark 7 Beta model. The results are shown in Tables
2 and 3.
Table 2: Predicted AEM10AP Performance at Stock Condenser Airflow (ORNL Mark 7 Beta Model)
Parameter Run #1 Settings (stock)
Run #2 Settings
Run #3 Settings
Run #4 Settings
Run #5 Settings
Run #6 Settings
Run #7 Settings
Run #8 Settings
Compressor EER
9.9 10.8 9.9 10.8 9.9 10.8 9.9 10.8
Fan Efficiency low low hi hi low low hi hi
Condenser Rows
3 3 3 3 4 4 4 4
Mark 7 Beta Results
EER=10.80 Cap=10003 SHR=.771
EER=11.40 Cap=10012 SHR=.770
EER=11.35 Cap=10003 SHR=.771
EER=12.01 Cap=10012 SHR=.770
EER=11.55 Cap=10247 SHR=.761
EER=12.18 Cap=10253 SHR=.761
EER=12.16 Cap=10247 SHR=.761
EER=12.86 Cap=10252 SHR=.761
Table 3: Predicted AEM10AP Performance at +20% Condenser Airflow (ORNL Mark 7 Beta Model)
Parameter Run #9 Settings (stock)
Run #10 Settings
Run #11 Settings
Run #12 Settings
Run #13 Settings
Run #14 Settings
Run #15 Settings
Run #16 Settings
Compressor EER
9.9 10.8 9.9 10.8 9.9 10.8 9.9 10.8
Fan Efficiency low low hi hi low low hi hi
Condenser Rows
3 3 3 3 4 4 4 4
Mark 7 Beta Results
EER=11.40 Cap=10259 SHR=.761
EER=12.00 Cap=10266 SHR=.760
EER=12.08 Cap=10259 SHR=.761
EER=12.77 Cap=10266 SHR=.760
EER=12.19 Cap=10511 SHR=.752
EER=12.84 Cap=10516 SHR=.751
EER=12.96 Cap=10511 SHR=.752
EER=13.70 Cap=10516 SHR=.751
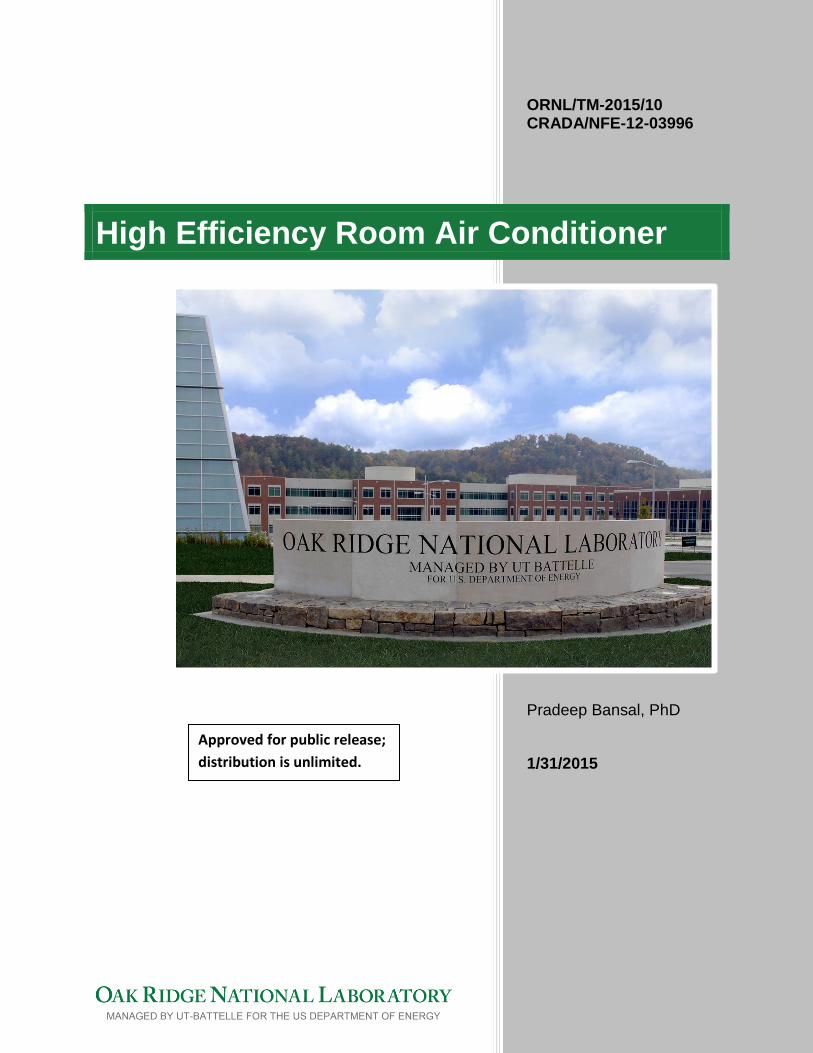
The results suggested that the combination of the high efficiency compressor, ECM fan motor, increased condenser
airflow, and wider condenser (Run #16) would achieve the stated goal of EER=13.0 or greater. The predicted incremental
increase in EER for each change is shown in Figure 2.
12
Figure 2: Predicted Incremental EER Variation for GE AEM10AP (ORNL Mark 7 Beta Model)
Mark N Analysis
A similar analysis was performed using the Mark N code for the baseline GE AEM10AP. As was done for the Mark 7 Beta
analysis, an input file was created using the measured heat exchanger geometry and the compressor map for the GE
unit. The model seemed to over predict the air-side condenser heat transfer coefficients and unit capacity. The model
was calibrated to the published design point performance by adjusting the capillary tube diameter, mass flow correction
factor as well as the multiplier for the condenser air-side heat transfer. The parameters which were studied are as
follows.
(1) Compressor efficiency
(2) Fan motor efficiency
(3) Heat Transfer Between Indoor and Outdoor Sides
(4) Heat Exchanger Frontal Area
As in the Mark 7 Beta analysis, the higher efficiency compressor was simulated by reducing the input power by the same
factor as before to yield an EER of 10.8. Fan power was varied from 95W to 50W and heat transfer between the indoor
and outdoor sides of the unit were given high and low values of 100 BTU/hr and 10 BTU/hr respectively. Heat exchanger
frontal area was allowed to vary between the stock values to 10% larger for both evaporator and condenser. The
volumetric airflow rate and subsequent fan power were scaled up for cases using the larger heat exchangers to maintain
air velocity across the coil at the stock level. The capacity was fixed at 10000 BTU/hr. The results of the Mark N
parametric study are shown in Table 4.
10.80
11.40
12.02
12.77
13.69
10.80
11.30
11.80
12.30
12.80
13.30
13.80
14.30
EER

13
Table 4: Predicted AEM10AP Performance (Mark N Model)
Parameter Baseline Settings (stock)
Case I: High EER Compressor
Case II: Divider Wall Heat Loss
Case III: High efficiency fan motor
Case IV: 10% Large Condenser Frontal Area
Compressor EER 9.9 10.8 10.8 10.8 10.8
Divider Wall Heat Loss (BTU/H)
100 100 10 10 10
Fan Power (W) 95 95 95 50 55
Heat Exchanger Areas (ft2)
0.8633 (Evap) 1.467 (Cond)
0.8633 (Evap) 1.467 (Cond)
0.8633 (Evap) 1.467 (Cond)
0.8633 (Evap) 1.467 (Cond)
0.9496 (Evap) 1.614 (Cond)
MarkN Results
EER=10.80 Cap=10006 SHR=0.7
EER=11.7 Cap=10011 SHR=0.7
EER=11.8 Cap=10101 SHR=0.7
EER=12.5 Cap=10112 SHR=0.7
EER=13.04 Cap=9999 SHR=0.72
The results suggested that the combination of the high efficiency compressor, fan motor, and 10% larger heat
exchangers would achieve the stated goal of EER=13.0 or greater. The predicted incremental increase in EER for each
change is shown in Figure 3.
Figure 3: Predicted Incremental EER Variation for GE AEM10AP (Mark N Model)
10.8
11.7 11.97
12.77 13.01
10.5
11
11.5
12
12.5
13
GE Unit EER

14
3.0 TESTING OF LABORATORY BREADBOARD UNIT
The CRADA partner, GE, supplied two Window Units (Model AEM10AP). The research started with the instrumentation
of the units, development of the data acquisition system and its programming, and finally the baseline testing of the
units. Figure 4 shows the partially disassembled AEM10AP window air conditioner prior to sensor installation.
Figure 4 Disassembled AEM10AP window air conditioner prior to instrumentation
The WAC has a single-speed rotary compressor, a fin-&-tube evaporator and condenser, a capillary tube and a motor
mounted on a single axis shaft to drive both the evaporator blower and the condenser fan. In addition to these basic
components, the WAC has a fin-&-tube sub-cooler, submerged in a water collection pan, which gathers water
condensate from the evaporator. The submerged sub-cooler is downstream of the air-to-refrigerant condenser to
further subcool the liquid refrigerant. The schematic diagram of the WAC and its P-h diagram are shown in Figures 5 and
6 respectively. The condenser fan blade is specially configured to pick up water from the water collection pan and to
spray it in the air stream flowing over the condenser coil surface. The water droplets evaporate and enhance the
condenser heat transfer. This feature is called the “sling” effect [LBNL (1997)]. Figures 6, 7 and 8 respectively show the
single axis fan, the “slinger” and instrumented WAC.

15
Figure 5: Schematics of Window Air Conditioner Figure 6: P-h diagram of Window Air Conditioner
Figure 7: Single axis blower/fan Figure 8: Slinger on condenser fan Figure 9: Instrumented WAC
INSTRUMENTATION AND DATA ACQUISITION
Instrumentation
In order to quantify the performance of the unit, a measurement/DAS system was developed based upon the Campbell
Scientific, CR3000 data logger. The setup consisted of the logger, as well as an AM16/32B multiplexer and PS100 power
supply mounted in a Campbell Scientific enclosure. The selection of the measurement points as well as the
instrumentation was based upon the requirement that everything needed to fit into the existing chassis with as little
modification to the unit as possible. Additionally, because the values of air flow, refrigerant mass flow, and unit capacity
were smaller for window air conditioners than they would be for larger units, the management of measurement
uncertainty became more critical.
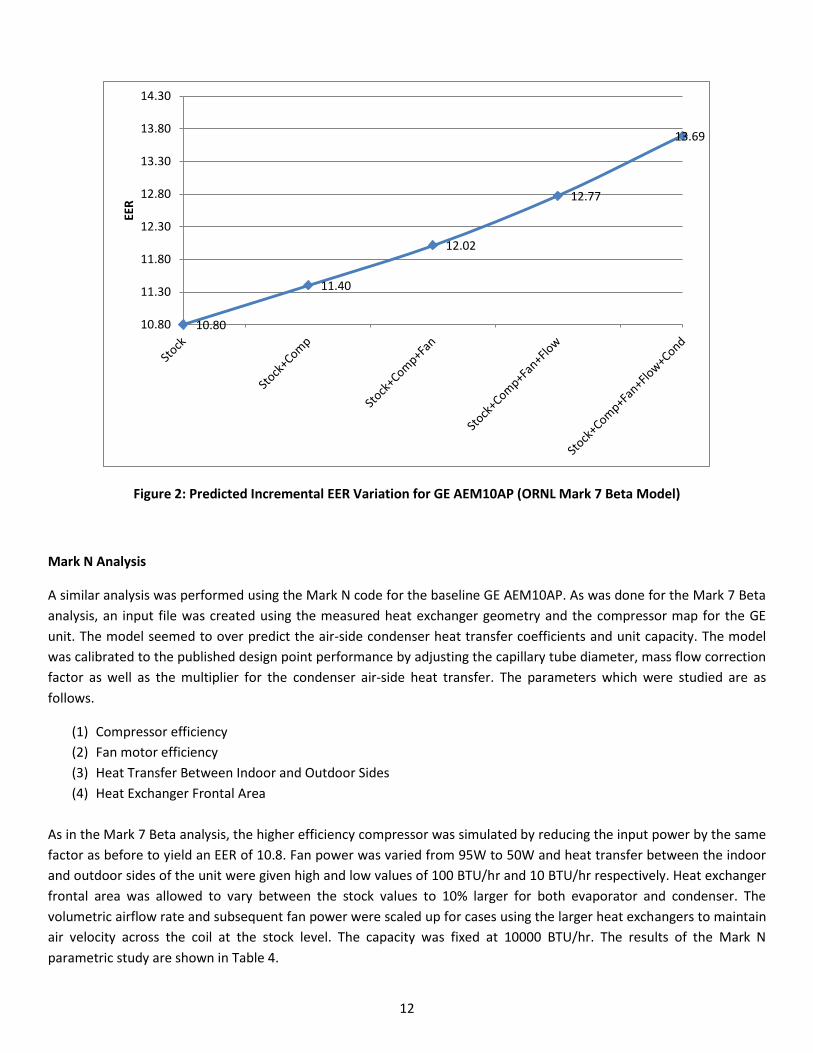
Figure 10 shows a schematic of the basic vapor compression refrigeration cycle along with the locations of the various
measurement points.
4 3 2
5 1
Enthalpy
Pre
ssu
re
Slinger ring around the
condenser fan to spray water
16
Figure 10 Measurement types, locations, and quantities
As shown, temperature and pressure measurements were made at the four refrigerant state points. The temperature
measurements at states 1, 2 and 4 are all made by pipe-plug type, thermistor immersion probes. Due to space
limitations, the refrigerant temperature at state 3 was measured with a sensor mounted outside of the line rather than
the immersion probes used at the other 3 states. Since state 3 was a two-phase flow, the pressure measurement alone
was sufficient for the efficiency calculations. Although they are not shown in the diagram, nine additional external line
temperatures were added as an aid to future modeling work.
Electrical power usage was measured for both the compressor and fan, as well as for the entire unit, with the difference
between the measured total and the sum of the fan and compressor providing an estimate of the controller/display
usage. The measurements were made using split-core, current transformers coupled to a pulse-output, power
transducer which was mounted inside the data acquisition box. The AC power to the DAS box provided both the
charging power to the logger as well as the measurement of the AC voltage used for the power calculations. For this
reason, all tests were conducted with the DAS box and the air-conditioner plugged into the same electrical outlet to
minimize any local differences in the measured and actual line voltages. The power transducer mounted in the
completed DAS enclosure is shown in Figure 11.

17
Figure 11: Completed DAS Cabinet
Refrigerant mass flow rate was measured using a Coriolis mass flow sensor, coupled to a pulse output transmitter. Due
to the size of these units (even the smaller ones), it was impractical to try to fit the device inside of the air conditioner
chassis. Instead, the refrigeration piping was modified such that the unit would hang on the outside of the chassis,
suspended from a unistrut bracket. To allow the sensor to vibrate freely, the connections to the unit were made using
rubber isolators. The installed mass flow sensor is shown in Figure 12.
Figure 12: MicroMotion CMF025 Coriolis mass flow sensor
Logger
Multiplexer
Power
Tranducer
Power
Supply
Barometer AC Power

18
As also shown in Figure 10, air side temperature and %RH measurements were made at the inlets and outlets of both
the compressor and evaporator. Each of the calculated average temperatures at each of the four air-side measurement
points was an average of 6 individual measurements spaced evenly over the face of the heat exchanger. The
measurements at each point were made by 5 thermistors (of the same temperature/resistance curves as those used on
the refrigerant side) and one additional, platinum RTD measurement which was integrated in the capacitance type %RH
probes. One additional temp/RH probe was used to control the ambient conditions of the outdoor side test chamber.
The air side measurement points are shown in Figures 13 and 14.
Figure 13: Evaporator air side measurements
Figure 14: Condenser outlet air side measurements
(Inlet measurements are on fan shroud inside of the unit)
Outlet
Inlet (Inlet measurements used for chamber control)
Outlet
Mixing Duct
Inlets
Temp/RH probe for chamber control

19
DAS Programming and User Interface
To perform the measurement sequence as well as post-measurement calculations, a CRBasic program was developed.
The routine was designed to generate high resolution data (10s scan interval) while minimizing the measurement
uncertainties as well amount of data post-processing required. To achieve this, refrigerant and water saturation tables
were generated using REFPROP and these tables imported directly to the CR3000’s memory. Three linear-interpolation
subroutines were called from the main program to calculate thermodynamic properties of the refrigerant (either general
or saturated) as well for saturated water vapor, based upon the measured temperatures and pressures. The step sizes
for the pressure and temperature interpolation were 1 psi and 1F respectively. The linear fit of the data over this small
step, in general, was found to be quite good and any uncertainties introduced into the calculated values due to the
interpolation are assumed to be negligible in the subsequent analysis.
In addition to the measurement program, a graphical user interface was created to provide real-time feedback during
testing. The GUI was created using the Campbell Scientific “Real Time Monitoring and Control” (RTMC) software and
provides a display of pertinent measured and calculated quantities updated every 10s. Figure 15 shows the interface
developed for this project.
Figure 15: Screenshot of graphical interface
Refrigerant Side Calculated Values
Some of the pertinent values calculated by the program are presented here;

20
Evaporator and condenser heat transfer rates are given by;
𝑞𝑐 = ��[ℎ(𝑇1, 𝑃1) − ℎ(𝑇2, 𝑃2)] (1)
𝑞𝑒 = ��[ℎ(𝑃3, 𝑋3) − ℎ4(𝑇4, 𝑃4)] (2)
where T and P are the measured temperature and pressure at the various refrigerant state points, h is the interpolated
specific enthalpy for R410A and m is the measured refrigerant mass flow rate. It is worthwhile to note here that the
expansion from state 2 to 3 is assumed isenthalpic, or;
ℎ3 = ℎ2(𝑇2, 𝑃2) (3)
With the quality at state 3 calculated as;
𝑋3 =ℎ𝑓(𝑃3) − ℎ3
ℎ𝑓(𝑃3) − ℎ𝑔(𝑃3) (4)
where hf and hg are the interpolated specific enthalpies for the fluid and gas phases respectively.
The evaporator superheat and condenser subcooling are given by
𝑇𝑆𝐻 = 𝑇4 − 𝑇𝑠𝑎𝑡(𝑃4) (5)
𝑇𝑆𝐶 = 𝑇𝑠𝑎𝑡(𝑃2) − 𝑇2 (6)
where Tsat is the interpolated saturation temperature at pressure P.
The overall efficiency of the unit is given by
𝐸𝐸𝑅 =−𝑞𝑒
𝐸𝑡 (7)
Where qe is the system capacity in BTU/hr and Et is the total electrical power usage in watts.
Air Side Calculated Values
Although the initial baseline efficiency tests require only refrigerant side measurements, the eventual modification of
the fan motors, and heat exchangers will require the ability to reliably measure and adjust the air side flow rates as
design parameters. Due to the relatively low air velocities, (especially on the condenser side) airflow measurements
using the traditional pitot arrays were not practical without significant alterations to the flow geometry. For this reason,
it was decided to explore the feasibility of using airflows calculated from the refrigerant side measurements and the
heat exchanger energy balances. The air side mass flow rates for the evaporator and condenser can be expressed as;
��𝑒 =−𝑞𝑒
𝐶𝑝 (𝑇3 − 𝑇4) + [𝜔(𝑇3, 𝑅𝐻3) − 𝜔(𝑇4, 𝑅𝐻4)][ℎ𝑔(𝑇3) − ℎ𝑓(𝑇4)] + 𝜔4[ℎ𝑔(𝑇3) − ℎ𝑔(𝑇4)] (8)
��𝑐 =𝑞𝑐
𝐶𝑝 (𝑇2 − 𝑇1) + [𝜔(𝑇2, 𝑅𝐻2) − 𝜔(𝑇1, 𝑅𝐻1)][ℎ𝑔(𝑇2) − ℎ𝑓(𝑇1)] + 𝜔1[ℎ𝑔(𝑇2) − ℎ𝑔(𝑇1)] (9)
where, q is (as before) the refrigerant side heat transfer rates, ω is the humidity ratio calculated at the measured bulk air
temp and %RH for air states 1-4, Cp is the constant pressure specific heat for dry air, and hf and hg are the specific
enthalpies of the saturated water (fluid and gas respectively) interpolated at the bulk temperature of the mix for air

21
states 1-4. It is worthwhile to mention here that, while the inclusion of the water vapor terms in the evaporator energy
balance is relatively standard, these terms are generally omitted for the condenser analysis. In this case however, the
condenser fan is fitted with a condensate slinger ring which mixes evaporator condensate into the condenser inlet
airstream where some of it is evaporated. Due to this, both the latent and sensible change in the water vapor are
included in the energy balance.
The validity of equations 8 and 9 is dependent upon the validity of two basic assumptions about the energy transfer.
(1) All of the energy lost or gained by the refrigerant, enters or leaves via the air stream. Losses from natural
convection and radiation from the sides of the evaporator or condenser are negligible.
(2) The air entering and leaving the heat exchanger is well mixed.
Overall, assumption 1 is believed to be reasonable for both the evaporator and condenser, as the areas of the sides are
small compared to the total fin surface areas. Due to the construction of the unit, however, assumption 2 is more valid
at the evaporator than at the condenser.
The inlet air for the evaporator was pulled directly from the indoor test chamber which was typically well mixed. The air
is not required to pass over any components which could induce temperature/RH gradients before the measurement
was made. Additionally, since the fan was not an axial type, there was no dead spot at the hub, and the Styrofoam fan
shroud helped to insulate the flow from the hot side of the unit. After passing over the evaporator coils, the air went
through the blower and was then turned 180 degrees where it exited through a much smaller area at the front of the
unit at much higher velocity than the inlet. The turbulence induced by the blower, coupled with the velocity and
direction change ensured that the exit air was also well mixed. For these reasons, the measured average air temperature
and RH were believed to be a good representation of the bulk properties at both the inlet and outlet of the evaporator.
The condenser airflow by comparison was less suited to the simplifying assumptions. The inlet air entered from louvers
in the top and side of the unit before passing through the fan shroud inlet where the temperature and RH
measurements were made. Inside the unit, some of the inlet air passeed over the internal components of the unit
(compressor, fan motor, etc.) potentially causing flow, temperature, and %RH gradients. At the condenser outlet, there
was noticeable temperature stratification in the flow from top to bottom as well as an area of low flow around the fan
hub. To promote mixing at the condenser outlet, a 24” section of insulated duct (shown in Figure 9) was added upstream
of the measurement point. This improved the results to a certain extent but the condenser airflow rate was still found to
be sensitive to the somewhat arbitrary location of the sensors.
The calculated numbers for the evaporator side were found to correlate quite well with the published numbers for the
unit and were found to relatively independent of the sensor placement. Condenser airflow rates were not typically
published for window units but with some adjustment of the sensor placement, reasonable numbers were produced.
UNCERTAINTY ANALYSIS
To quantify the level of uncertainty in both the base measurements as well as the calculated quantities, a zero order
analysis was performed – detailed are given in Appendix A. The study establishes overall uncertainties for the various
sensors when used in combination with the CR3000 data logger at the standard test conditions. The analysis then tracks
how these base uncertainties propagate through to the final calculated quantities (EER, COP, SHR etc.). The analysis
used the following assumptions.

22
(1) Uncertainties due to transient conditions were not considered. Since the tests focus on steady state analysis,
this was considered a valid assumption.
(2) Uncertainties introduced from linear interpolation of the refrigerant and saturated water vapor tables were
considered negligible. As was mentioned previously, analysis of the data shows the linear approximation to be
quite good over the small temperature/pressure increments used for the interpolation subroutines.
(3) The analysis did not take into account deviations in the actual physics from the simplifying assumptions made.
This is to say that the accuracy of any calculated value will be a function of both the ability to accurately
measure the parameters used to calculate it as well as how accurately the equation models the actual physics of
the process. The values presented in this study did not account for the latter.
(4) The results of the analysis presented here are for a single instantaneous measurement. Since many of the final
results are based upon the average of N multiple measurements, the uncertainty in the average will decrease
approximately by the factor of N-1/2, assuming that the sensor error is random in nature. Because of this, even in
cases where the uncertainty for a single measurement is high (as is the case for the calculated condenser
airflow) the average of 30 minutes of data is still a fair estimate.
The results of the uncertainty analysis are presented in Table 5.
Table 5 Results of design point uncertainty analysis
Base Measurements
Measurement Estimated Combined Logger and Sensor Uncertainty
Temperature ±.25 F
Refrigerant Pressure (low) ±.2 psi
Refrigerant Pressure (high) ±.6 psi
Mass Flow Rate ±.7 lbm/hr
Electrical Power (fan) ±2 W
Electrical Power (compressor and system total) ±10 W
Atmospheric Pressure ±.009 psi
Relative Humidity ±1.4 %RH
Calculated Values
Parameter Estimated Uncertainty
EER ±.12 BTU/Whr
System Capacity ±57 BTU/hr
Condenser Heat Transfer Rate ±62 BTU/hr
State 3 Quality ±.002
State 4 Superheat ±.3 F
State 2 Subcool ±.3 F
Refrigerant Evaporator Pressure Drop ±.3 psi
Refrigerant Condenser Pressure Drop ±.8 psi
Average Air Temperatures ±.1 F
Evaporator Volumetric Flow Rate ±15 CFM
Condenser Volumetric Flow Rate ±98 CFM
Dehumidification Rate ±.5 pint/hr
SHR ±.05

23
BASELINE TESTING
Test Procedure
Before efficiency modifications could be made to the test unit, it was first necessary to establish the baseline
performance. To facilitate this, the instrumented unit was first mounted in a plywood partition between the indoor and
outdoor test chambers. Care was taken to ensure that none of the intake louvers on the sides and top were obstructed.
The temperature and relative humidity of the indoor chamber were adjusted based upon the measurements at the
evaporator air inlet (air state 3). The outdoor chamber was adjusted based upon a single temperature/RH probe
mounted a few feet from the intake louvers on the top of the unit. This is shown in Figure 14.
Before actual testing could begin, the refrigerant charge in the unit first needed to be adjusted to compensate for the
additional volume of the system due to the installed sensors. To do this, the unit was first charged to 24 oz., which is
slightly more than the amount which was recovered from the unit prior to the instrumentation. The test chambers were
brought up to the standard rating conditions and the level of evaporator superheat observed. Per instructions from
ORNL’s contacts with GE, charge was added in 1/3 oz. increments to achieve a superheat of around 10 F, at the standard
rating conditions. The final charge used for the test was 25.13oz of R410A. This produced a superheat of between, 11
and 12 F. While this was considered a good initial estimate, it was felt that some additional performance could be
coaxed from the unit if this level was brought down to 9-10 F.
With the unit installed in the chamber and charged, a test procedure was developed. The procedure used to generate
the data presented here is as follows;
(1) With the unit running, bring both chambers to near the desired setpoints.
(2) Fine tune the chamber setpoints to achieve the desired inlet conditions as measured at the evaporator inlet
sensors for the indoor chamber and the single temp/RH probe near the intake louvers on the outdoor chamber.
(3) When steady temp/RH readings are achieved, allow at least ½ hour for the window unit to achieve equilibrium.
This allows time for the condensate level in the pan to reach a steady value. Per instructions from GE, the
capacity and total electrical power measurements should be steady within ±2% of the mean value before testing
begins. Allowing ½ hour after any changes was found to achieve this condition.
(4) Once steady state is achieved, data is collected for an additional ½ hour period.
Although the rated EER is calculated at a single test condition, for modeling purposes, a series of 9 tests were run for the
three sets of outdoor conditions specified by AHAM at three different fan speeds. The test matrix is shown in Table 6.
Table 6: Test matrix
Outdoor Fan Speed
90 F, 45 %RH High Med Low
95 F, 40.1 %RH High Med Low
110 F, 24.4 %RH High Med Low
Results
Figures 16-21 show the results of the tests at the rated indoor/outdoor test conditions (outdoor=95F, 40.1%RH
indoor=80F, 51.5%RH) for the three fan speeds.

24
Figure 16: EER for standard indoor/outdoor conditions at 3 fan speeds
Figure 17: Capacity for standard indoor/outdoor conditions at 3 fan speeds

25
Figure 18: Total electrical power for standard indoor/outdoor conditions at 3 fan speeds
Figure 19: Evaporator airflow for standard indoor/outdoor conditions at 3 fan speeds

26
Figure 20: Condenser airflow for standard indoor/outdoor conditions at 3 fan speeds
Figure 21: Dehumidification rate for standard indoor/outdoor conditions at 3 fan speeds

27
The results at the rated condition are summarized in Table 7.
Table 7 Comparison of experimental values to rated performance
Outdoor= 95F, 41% RH Indoor= 80F, 52% RH Fan Speed= High
EER (BTU/Whr)
Capacity (BTU/hr)
Evap Airflow (CFMa)
Cond Airflow (CFMa)
Dehumidification (pint/hr)
Rated 10.80 10000 300 500 2.5
Experimental (30 min avg)
10.48 10261 296 497 2.8
Difference -3.0% +2.6% -1.4% -0.6% +10.7%
DISCUSSION
As shown in Table 7, the experimental EER and capacity values are in relatively close agreement with the published
numbers for the unit. The unit efficiency was measured to be within 3% of the rated value but was for all test cases on
the lower side of the mark. Based upon the superheat values observed, it is felt that for these initial baseline tests, the
unit could have been slightly undercharged.
The calculated airflow rates and dehumidification rates are also in relatively good agreement with the published values.
As was discussed in the previous section, in general it is felt that the estimate of the evaporator airflow is more valid
than that for the condenser. Not only is the measurement uncertainty much lower, the simplifying assumptions are a far
better fit to the indoor side than to the outdoor. Methods of achieving better mixing of the condenser outlet air are
currently being explored and could possibly be implemented in future tests.
Over the course of the instrumentation and initial testing of the unit, some observations were made regarding achieving
the eventual goal of 13 EER. The first of these relates to the fan motor efficiency. The tests show that the motor
consumed a relatively steady 185W at the highest fan speed setting. The rated mechanical output of the motor is 95W,
for an efficiency of only around 50%. In the case of window air conditioners, the benefits of increased motor efficiency
are essentially twofold. Not only is less energy used to produce the same airflow, but there is less heat is being
dissipated in the chassis to increase the temperature of the condenser inlet air. For these reasons, improving fan
efficiency expected to be one of the first modifications made to the baseline unit. In addition to the inefficiency of the
current fan motor, the airflow through the condenser was found to be highly non-uniform, with a major dead spot at the
center caused by the fan hub.

28
4.0 VALIDATION OF HPDM WITH TEST DATA OF BASE WINDOW AIR
CONDITIONER
Test Procedure
Determination of Optimum Charge: A study was conducted to determine the optimal refrigerant charge for the test unit
due to the increased volume of the system after the sensors were installed. The system was initially filled with the
factory charge of 24 oz and the charge was then added in 1 oz. increments to achieve the maximum EER and a superheat
of around 10F at the standard rating conditions.
As can be seen from Figure 22 that initially, the level of superheat (left axis) and subcooling (right axis) would
respectively decrease and increase substantially with the incremental charge but would eventually become asymptotic
with subsequent additions at refrigerant charge of about 790 gm. The corresponding EER and the system capacity are
ploted in Figure 23, where it may be noted that although efficiency continued to increase beyond this point, the system
parameters would never fully stabilize indicating wet compression. This exercise was repeated a few times but with
similar results. Hence, the charge level prior to this asymptotic behavior was considered optimum for future
modifications. Therefore, the optimim charge was found to be 790 gm of R410A. At this point, the system EER was
experimentally found to be 10.8. This number correlates well with both the manufacturers published value of 10.8 as
well as earlier tests at similar charge levels.
Figure 22: Variation of superheat and subcooling with refrigerant charge

29
Figure 23: Variation of EER and evaporator capacity with refrigerant charge
Performance at Design and off-design Test conditions: Upon determining the optimum charge level, the baseline and
off design tests were run one final time. Although the rated EER is calculated at a single set of conditions, a series of 6
tests were run, for modeling purposes, for the two sets of outdoor conditions specified by AHAM at two different fan
speeds. The test matrix is shown in Table 8.
Table 8 Test matrix
Indoor Outdoor Fan Speed
80 F, 51.5 %RH 90 F, 45 %RH High Low
80 F, 51.5 %RH 95 F, 40.1 %RH High Low
80 F, 51.5 %RH 110 F, 24.4 %RH High Low
The comparison of the corresponding EER and the system capacity at high (H) and low (L) flow rates is shown in Figure
24. Although the EER shows a slight increasing trend by about 0.8%, the capacity reduces by about 3%, mainly due to fan
power that reduces by over 21% at low flow rates.

30
Figure 24: Comparison of EER and system capacity at high (H) and low (L) air flow rates and off-design conditions
Insulating the exposed suction line: To investigate the effect of the increased surface area of the liquid line caused by
the addition of the mass flow sensor, the refrigerant flow meter was insulated and the unit was re-tested at the
standard conditions. However, no appreciable change in either the EER or the system capacity was noted over the un-
insulated case, and hence this exercise was discontinued in future tests.
Elineating the “sling” effect: In order to assess the effect of “slinger” on the performance of the window air-conditioner
(WAC), a hole was drilled at the bottom of the WAC in the condenser pan that allowed the condensed water to be
collected in a bucket and the fan blowing the air over the condenser without water. The system was run at the standard
test conditions and was allowed to reach steady state. The system efficiency was found to decrease by approximately
8% from the baseline data. No noticeable change was observed in the fan power. The condensate production rate was
measured to be about 1 liter/hr.
EXTENSION OF ORNL HPDM TO INCLUDE SPECIFIC FEATURES OF WINDOW AIR CONDITIONER AND ITS VALIDATION
FEATURES OF ORNL Heat Pump Design Model (HPDM)
The ORNL’s HPDM is a steady-state simulation model that covers most categories of residential and light commercial
space cooling, space heating and water heating components, like compressors, heat exchangers, pumps, fans, etc. It is a
component-based model that uses Newton-Raphson method to solve simultaneous system equations. The heat
exchanger (HX) models are based on fundamentally principles and can simulate detailed geometry and circuitry, and

31
accept real air-side (or water side) and refrigerant-side boundary conditions. The component HX models have different
levels of complexity, which fall into three categories, i.e. bulk models, phase-to-phase models, and discretized
models. The bulk models are usually based on Effectiveness-NTU or UA-LMTD approach, to simulate the component as
a whole. The phase-to-phase models separate the refrigerant into vapor, two-phase and liquid regions, with each region
having individual air side and refrigerant side entering states. The discretized models use segment-to-segment
approach, which divides a heat exchanger into numerous mini-segments with each segment having individual refrigerant
and air entering parameters. Such a model may consider possible phase separation; with mini segments being basic
building blocks. These are used to build a heat exchanger having arbitrary circuitry, geometry, and represent any
boundary conditions. All phase-to-phase and segment-to-segment heat exchanger models are capaable to calculate
refrigerant charge inventory. For the system modeling, a component-based modeling framework has been developed
that allows connecting steady-state component models in any manner, e.g. simulating a vapor compression system with
coupled desiccant wheel and indoor coil; simulating a parallel air-to-refrigerant condenser and water heater, etc. Details
of some of the component models are given below.
Compressors:
Single-speed Compressor: The model uses AHRI’s 10-coefficient compressor map to calculate mass flow rate and
power consumption. It simulates energy balance from inlet to outlet using the calculated power and given heat loss
ratio; and it also considers the actual suction state to correct the map mass flow and power predictions.
Heat Exchangers:
Segment-to-segment fin-and-tube heat exchanger: In a segment-to-segment modeling approach, each tube segment
has individual air side and refrigerant side entering states, and may have possible phase transition. Within each
segement, an -NTU approach is used for heat transfer calculations and air-side fin is simplified as an equivalent
annular fin. Both refrigerant and air-side heat transfer and pressure drops are considered. The coil model can
simulate arbitrary tube and fin geometries and circuitries and any entering and exit states of refrigerant,
misdistribution, two-dimensional air side temperature, and local inputs of humidity and velocity. The tube circuitry
and
2-D boundary conditions are provided by an input file. The segment-to-segment modeling approach is also capable
of simulating the dehumidification process of water condensing on an HX coil (i.e. evaporator) by following Braun et
al. (1989) methodology, where the driving potential for heat and mass transfer is the enthalpy difference between
the inlet air and the saturated air at the refrigerant temperature.
Segment-to-segment micro-channel HX: In the segment-to-segment modeling approach of a micro-channel HX, each
micro-channel port segment has individual air-side and refrigerant-side entering states, and may have possible
phase transition. The coil model can simulate arbitrary port (round, triangle, etc.), fin geometries and circuitries
(serpentine, slab, etc.), any refrigerant side entering and exit states, misdistribution, and can accept inputs of two-
dimensional air side temperature, humidity and local air velocity. In addition, the model is also capable of simulating
the dehumidification process.
Expansion Devices:
Idealized TXV: The degree of superheat at the compressor suction as well as the degree of subcooling at condenser
outlet is explicitly specified.

32
Fans and Blowers:
Single-speed fan: For a given airflow rate, the model uses the fan curve to simulate static head, power consumption,
and calculate air-side temperature increment from inlet to outlet.
Variable-speed fan: The model accepts multiple sets of fan curves, and does linear interpolation between speed
levels.
Extension of HPDM to include specific feartures of Window Air Conditioner- HPDM-Flex
The original ORNL’s HPDM was modified to include the two specific features that are unique to window air conditioner.
The water condensed at the evaporator is collected in a water pan at the bottom of the window air conditioner. Due to
its low temperature, the condensed water firstly provides subcooling to the submerged subcooler tubing inside this pan,
and secondly, this water is sprayed through a ‘slinger’ over the condenser surface to enhance the condenser air side
heat transfer [LBNL (1997)]. The first effect is called the ‘enhanced subcooling’ and the second is called the ‘sling’ effect.
The new model was named as HPDM-Flex-7.a.1.
ORNL Model HMDP-Flex.7.a.1 Validation
The HPDM-Flex-7.a.1 was caliberated against the experimental data of the window air conditioner at both the design
and the off-design conditions i.e. different ambient conditions.
Multipliers or correction factors
One of the factors that need to be correlated is the ratio of the measured power to the map power of the compressor.
This is shown in Figure 25, where the ‘solid line’ represents the correction factor for the compressor-map predicted
power that would need to be added into the model in order to predict the correct compressor power at different
ambient conditions.
Figure 25: Variation of ‘ratio of measured compressor power’ to ‘map power’ at different ambient temperatures
33
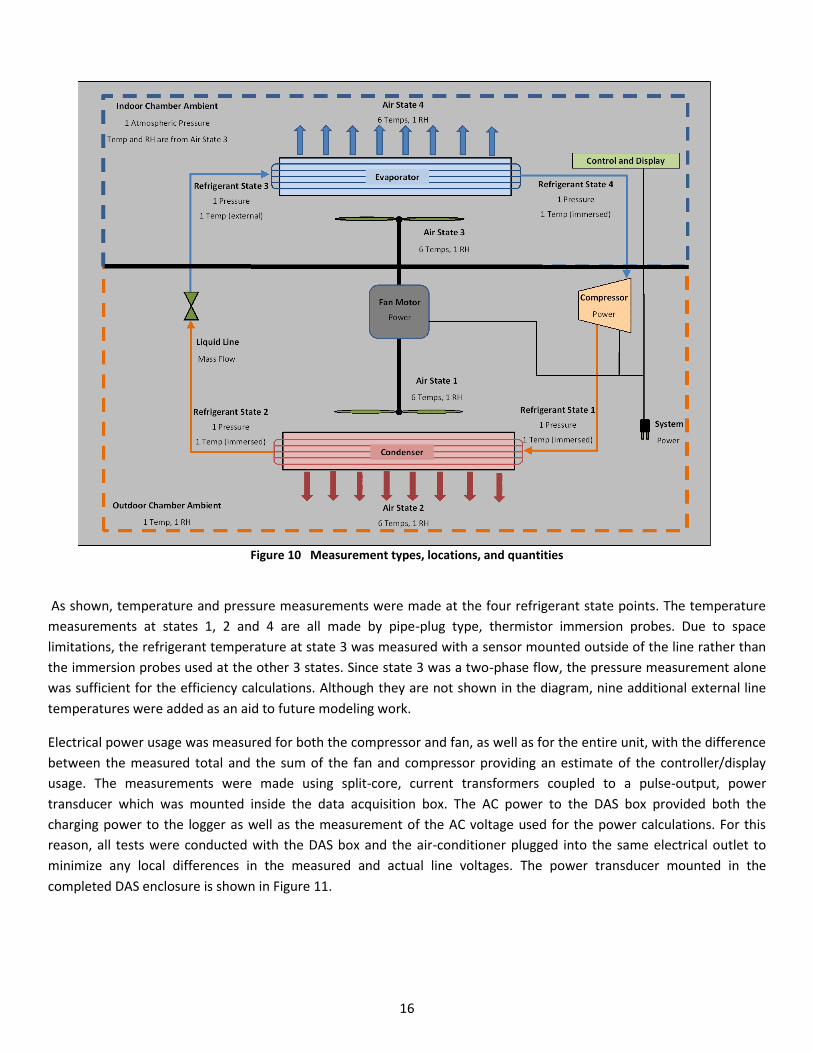
The condenser heat transfer enhancement ratio due to the sling effect at different ambient temperatures is shown in
Figure 26. It may be noted here that the condenser heat transfer is enhanced by a factor between 1.5 and 2.5 due to the
sling effect, which is rather high.
Figure 26: Variation of ‘Heat transfer enhancement ratio’ to ‘sling effect’ at different ambient temperatures
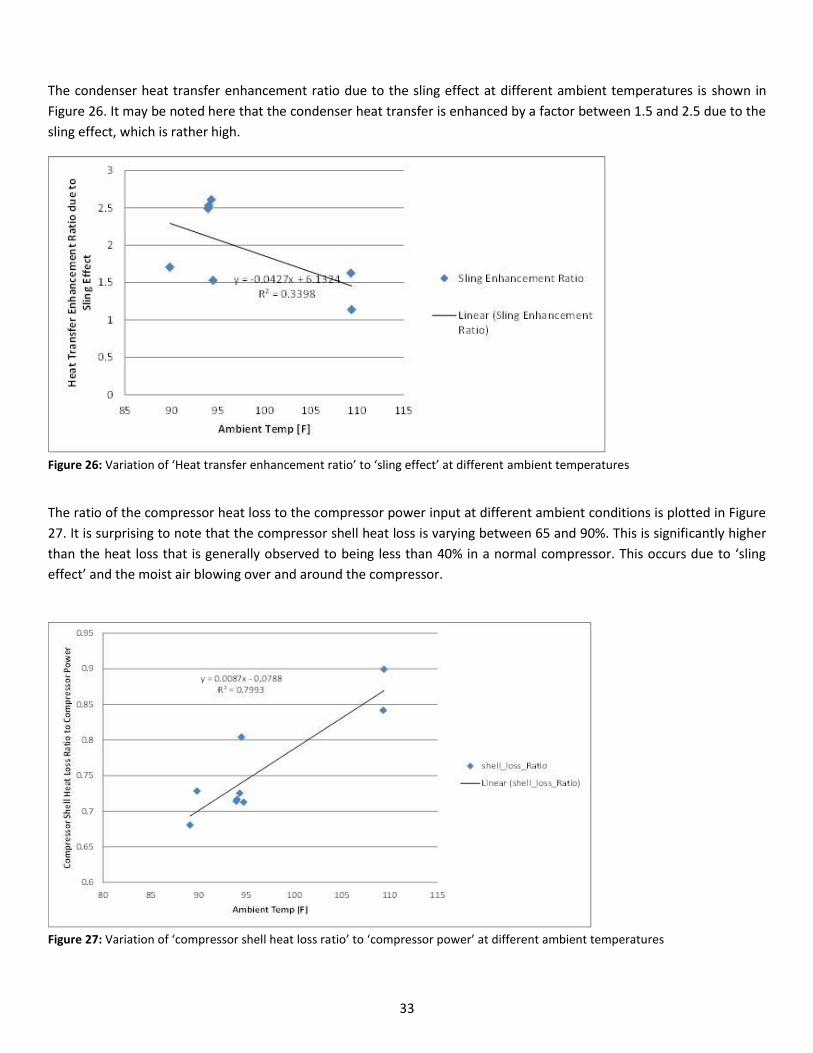
The ratio of the compressor heat loss to the compressor power input at different ambient conditions is plotted in Figure
27. It is surprising to note that the compressor shell heat loss is varying between 65 and 90%. This is significantly higher
than the heat loss that is generally observed to being less than 40% in a normal compressor. This occurs due to ‘sling
effect’ and the moist air blowing over and around the compressor.
Figure 27: Variation of ‘compressor shell heat loss ratio’ to ‘compressor power’ at different ambient temperatures

34
Comparison of ORNL Model HMDP-Flex.7.a.1 With the Test Data
After the model had been validated with some of the experimental data, the model predictions were compared with all
test data. The measured EER is plotted against simulated EER in Figure 28. The model predictions agree to within -0.5%
to +6.5% with a standard deviation being limited to 2.7%. This result is quite encouraging.
Figure 28: Variation of ‘measured EER’ with ‘simulated EER’ at different ambient temperatures
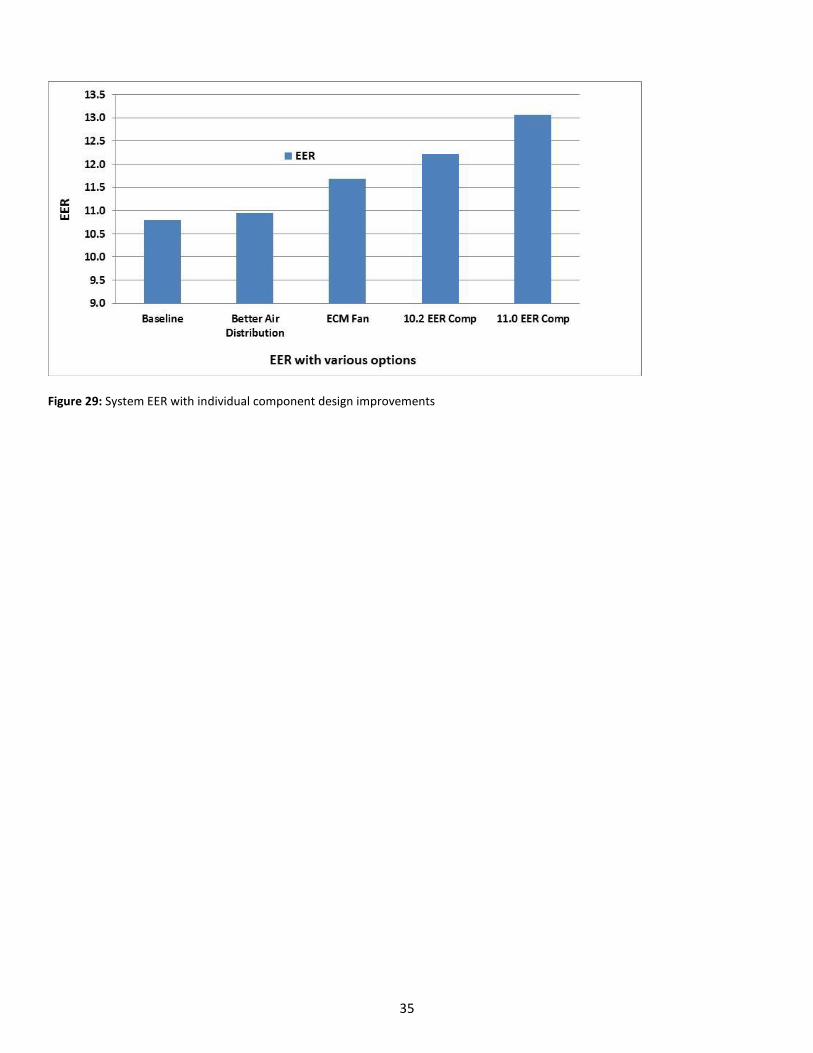
The validated model was used to predict the system performance with different system features in order to achieve the
targeted EER of 13. This variation is shown in a bar chart in Figure 29. The first bar shows the baseline EER (=10.8) of the
current design that has been tested and simulated. The next bar shows that the system EER may be improved (to 10.95)
but only slightly if the air flow distributions were improved in the two heat exchangers. This is because the indoor HX
was already oversized and the better heat transfer strategy may not enhance the efficiency noticably. The next bar
shows the enhancement in EER (to 11.7) if the current fan motor was replaced with an ECM motor that is currently
available in the open market with 55% less power input. The fourth bar shows the system EER (=12.2) if the current
compressor (with EER=9.7) is replaced with an higher EER (=10.2) compressor that is also available in the open market.
Finally the last bar shows that the target EER (of 13) may be achieved by replacing the 10.2 EER compressor with an 11
EER compressor.
35
Figure 29: System EER with individual component design improvements
36
5.0 EFFICIENCY ENHANCEMENT OPTIONS AND TESTING OF THE PROTOTYPE
In order to develop high efficiency WAC, several primary design strategies were considered, including the following-
(1) Use of micro-channel heat exchangers (MCHXs)
(2) Reducing thermal bridging and internal air leakage through the divider wall
(3) Use of high EER compressor
(4) Use of brushless DC fan motor in place of AC induction fan motor
(5) Reduce unit capacity from 10,000BTU/hr to 8000BTU/hr by downsizing its compressor
(6) Increase the molar concentration of R32 (from 70% to 85%) in R410A
MCHX: Since the current designs of micro-channel heat exchangers (MCHXs) use lower fin density (e.g. 16 fins per inch
on evaporator) and the chaises of the WAC has fixed dimensions, it is difficult to match the face area of the round tube
plate fin coils with that of the micro-channel. Therefore, despite having higher expectations from MCHXs for most
HVAC&R applications, MCHXs are not as deep as the copper tube heat exchangers and therefore, offer lower
performance (i.e. less capacity and less EER) than the round tube plate fin coils heat exchanger. Additionally, MCHXs
result in higher pressure drops, lower refrigeration capacity and hence lower EER. Therefore, this feature was found to
be impractical to improve the efficiency of a WAC.
Reducing thermal bridging and internal air leakage: Although some of the low efficiency units may suffer from thermal
bridging and internal air leakage through the divider wall, the unit under investigation was well engineered and had
hardly any room for reducing either the thermal bridging or the internal air leakage through the divider wall.
With a solid baseline established, the focus of work was shifted to the development of the high efficiency prototype. To
this end, the following modifications were made to the unit and the performance increase of various combinations of
these evaluated.
(7) Replace AC induction motor with brushless DC motor
(8) Reduce unit capacity from 10000BTU/hr to 8000BTU/hr
(9) Increase the molar concentration of R32 (from 70% to 85%) in R410A
TESTING AND RESULTS
ECM Fan Motor
The first modification which was tested is the replacement of the stock AC induction motor with a permanent magnet
ECM. The factory motor is a permanent split capacitor type, which has a rated output of 95W. During the baseline tests,
the motor was found to consume 177W, 158W and 137W at the high (1343 RPM), medium (1256 RPM), and low (1150
RPM) fan speeds respectively. The motor which was used to replace this, is a sensorless ECM and is rated at 100W
mechanical output. To drive the ECM, a Texas Instruments TMS320C2000, high voltage motor development kit was
used. The hardware supplied with the kit uses a flux integration method to control commutation of the motor and the
software is set up to automatically measure the physical characteristics of a specific motor (resistance, inductance, etc.)
such that the commutation algorithm is tuned to the ECM being used. The motor drive box has two power inputs which

37
are plugged into a two socket extension cord. A current transformer on the extension cord is used to measure the total
AC power used by the ECM motor and the drive box. It is worthwhile to note here that all power use for any of the ECM
motors presented in this study include the inverter box parasitic power. Additionally, due to the importance of accurate
power measurements to this study, the readings given by the power tranducers which are integrated with the DAQ
system are periodically validated during each test using a separate handheld meter. The ECM driver used for the fan
motor is shown in Figure 30.
Figure 30: Driver for Brushless DC motor
The initial tests using the ECM fan motor keep the rest of the components stock. The system was charged to the same
level as the baseline case and the test chambers were run at the AHAM/ASHRAE condition (95F 40.1%RH outdoor, 80F
50.5%RH indoor). The ECM fan motor was then run at the same RPM as the high and low settings of the stock fan. Data
was collected at 5s intervals for 30 minutes at each speed and 30 minutes was allocated for the system to stabilize after
the RPM is changed. Figure 31 shows the results of this initial test.
Figure 31: Variation of EER with Fan Speed for Stock System and System with ECM Fan
As shown, a significant increase in system efficiency was possible through this change alone. One observation which was
made during the analysis was the apparent dual nature of the improvement. The immediate effect of the swap was the
decrease in the power consumed by the fan. In addition to this savings, the fact that the ECM is more efficient than the
38
stock induction motor means that significantly less heat is generated inside of the condenser section of the unit for a
given fan RPM. This effect manifested itself in a lower condenser air inlet temp and a subsequently lower condensing
pressure with the ECM installed.
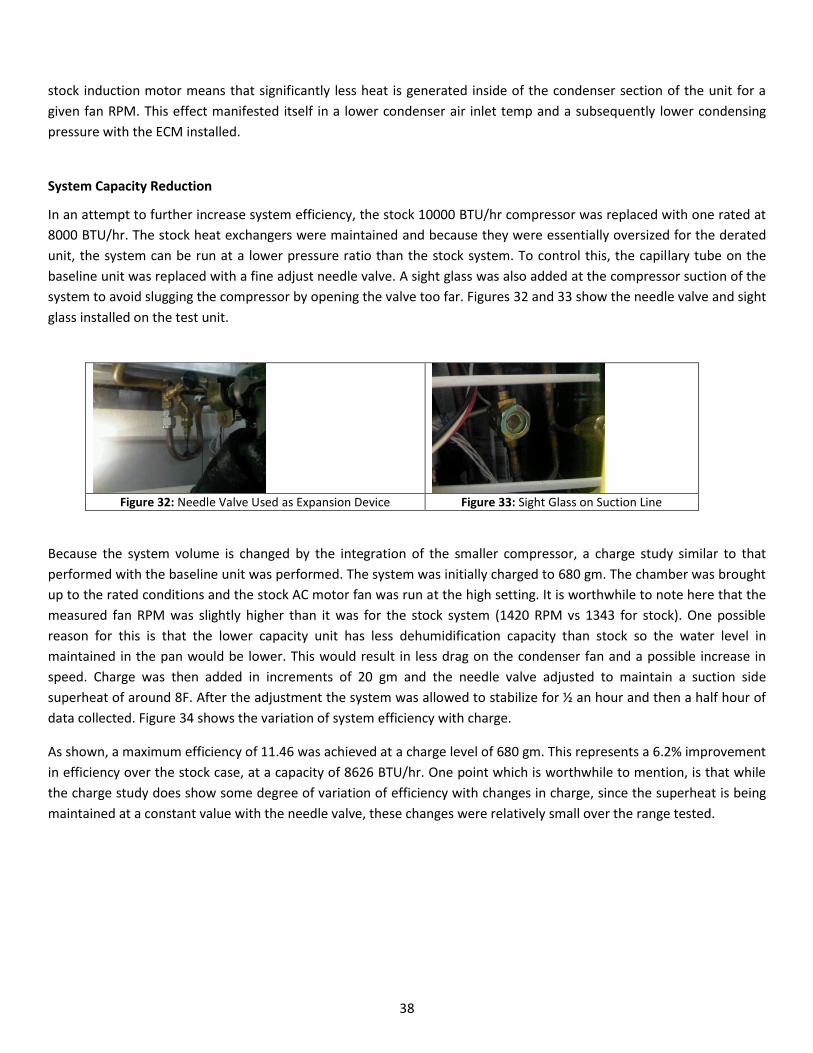
System Capacity Reduction
In an attempt to further increase system efficiency, the stock 10000 BTU/hr compressor was replaced with one rated at
8000 BTU/hr. The stock heat exchangers were maintained and because they were essentially oversized for the derated
unit, the system can be run at a lower pressure ratio than the stock system. To control this, the capillary tube on the
baseline unit was replaced with a fine adjust needle valve. A sight glass was also added at the compressor suction of the
system to avoid slugging the compressor by opening the valve too far. Figures 32 and 33 show the needle valve and sight
glass installed on the test unit.
Figure 32: Needle Valve Used as Expansion Device Figure 33: Sight Glass on Suction Line
Because the system volume is changed by the integration of the smaller compressor, a charge study similar to that
performed with the baseline unit was performed. The system was initially charged to 680 gm. The chamber was brought
up to the rated conditions and the stock AC motor fan was run at the high setting. It is worthwhile to note here that the
measured fan RPM was slightly higher than it was for the stock system (1420 RPM vs 1343 for stock). One possible
reason for this is that the lower capacity unit has less dehumidification capacity than stock so the water level in
maintained in the pan would be lower. This would result in less drag on the condenser fan and a possible increase in
speed. Charge was then added in increments of 20 gm and the needle valve adjusted to maintain a suction side
superheat of around 8F. After the adjustment the system was allowed to stabilize for ½ an hour and then a half hour of
data collected. Figure 34 shows the variation of system efficiency with charge.
As shown, a maximum efficiency of 11.46 was achieved at a charge level of 680 gm. This represents a 6.2% improvement
in efficiency over the stock case, at a capacity of 8626 BTU/hr. One point which is worthwhile to mention, is that while
the charge study does show some degree of variation of efficiency with changes in charge, since the superheat is being
maintained at a constant value with the needle valve, these changes were relatively small over the range tested.

39
Figure 34: Variation of Efficiency with Charge for the Reduced Capacity System
System Capacity Reduction and ECM Fan Motor
With the incremental improvement from the smaller compressor quantified, the same reduced capacity system is tested
with the ECM fan motor. The unit was charged to 690 gm and the airflow was varied between 1050 and 1400 RPM,
again with time allocated for the unit to stabilize between changes. The needle valve was adjusted at each airflow rate
to maintain between 7.5F and 8.0F suction superheat. Figure 35 shows the variation of system efficiency with fan RPM.
Figure 35: Variation of Efficiency with Fan RPM for the Reduced Capacity System with ECM Fan
The test data is fit with a 2nd order polynomial which predicts a maximum efficiency of 12.76 at a fan speed of 1230
RPM. The corresponding capacity is 8350 BTU/hr. This represents a 18.1% improvement in efficiency over the stock case.

40
System Capacity Reduction, ECM Fan Motor, and 85% R32
The refrigerant R410A is a binary 70/30 (by mole) mixture of the two pure substances R32 and R125. An increase in the
concentration of R32 has the potential to increase system capacity for a given mass flow rate at the expense of the
mixture becoming more flammable. To explore the effects of the higher R32 concentration, the unit was evacuated and
charged with a an 85/15 molar mix of the two refrigerants. Due to time constraints, this test was run with the 8000
BTU/hr compressor and ECM fan instead of starting with the stock compressor and AC fan motor. As before, a charge
study was conducted with the optimum charge being found to be 620 gm. Tests were run at two airflow rates with
varying degrees of suction superheat. Figures 36 and 37 show the results of these tests.
Figure 36: EER vs. Superheat for Reduced Capacity System with 85/15 Mix at Low ECM Fan Speed
Figure 37: EER vs. Superheat for Reduced Capacity System with 85/15 Mix at High ECM Fan Speed
As shown, a maximum EER of 13.11 was measured at the lower airflow and a superheat of around 8.6 F. This represents
an 21.4% improvement over the stock case. It is important to note here that, while the target EER of 13 was exceeded in
this test, the EER may be lower for the official air side ‘energy balance’ test and also higher superheat being desirable
when using a mixture with higher R32 concentration.

41
With the performance of the stock system established, several performance enhancing strategies were identified and
tested over the course of the past several months. Table 9 summarizes the tests conducted and the percent
improvement of each over the baseline performance., while Figure 38 displays the increamental EER enhancements and
the corresponding system capacity for each option from stock (base unit) to the mixture of R32 (85% by mole) and R125
(15% by mole).
Table 9: Summary of test results of the prototype
Test ECM Fan Reduced Cap R32 Max EER Tested
% Increase over stock
Baseline no no no 10.80 0%
Test 1 yes no no 11.54 6.9%
Test 2 no yes no 11.46 6.2%
Test 3 yes yes no 12.77 18.1%
Test 4 yes yes yes 13.11 21.4%
Figure 38: Increamental enhancement in EER with corresponding system capacity with different options

42
Discussion and the way forward
Each of the modifications tested here under laboratory conditions, comes with its own incremental cost and engineering
challenges with regards to the eventual goal of producing a marketable, high-efficiency window air conditioner. The
most straightforward approach, would be to simply run the unit at the reduced capacity as in test 2. This strategy would
only involve changing the compressor to the smaller unit and resizing the capillary tubes to obtain a unit which would
run near 8626 BTU/hr at an EER of around 11.47. Although this case was not tested, this number could most likely be
further improved by running the stock AC induction fan motor at either the low or medium settings such that the airflow
of the unit is scaled back along with the capacity. A unit like this could most likely be produced for at or near the same
cost as the stock 10K system although its efficiency would not meet the target EER of 13.
The ECM fan motor was found to be a major improvement over the AC induction motor both for its main effect of using
less power as well as the secondary effect of not dumping as much heat into the condenser section of the unit. From an
engineering perspective, the integration of the ECM was straightforward as the dimensions of the motor used were well
matched to the existing shroud assembly. For the tests, the motor was driven using an external inverter. The
development of a marketable window unit would require the development of an inverter which would fit in the existing
controls section of the stock chassis. This is not deemed an insurmountable obstacle both in terms of available space in
the unit or the development of a suitable motor commutation algorithm. Additionally, although it is recognized that the
ECM fan and its controller would be more expensive than the motor and controller in the stock system, it is felt that this
incremental increase in the unit production cost does not put this solution out of the realm of feasibility.
For the cases tested, the increase in the R32 concentration of the refrigerant was found to give an incremental
improvement over the standard R410a mixture. While this approach requires very little in the way of hardware changes
and would not significantly add to the cost of the unit, the increased flammability of the mix and the fact that it is
different than that which everything else uses could be detrimental to its widespread acceptance.
The tests conducted show that an efficiency of 11.54 EER can be achieved through the integration of an ECM fan motor,
maintaining essentially the same capacity and airflow as the stock unit. This represents an increase of 6.9% over the
baseline performance.
For the case where the capacity was reduced (by incorporating an 8000BTU/hr compressor and running with the stock
fan motor and airflow rate), the best measured efficiency was found to be 11.47 EER at a capacity of 8626 BTU/hr. This
represents an increase of 6.2% over the baseline. When the ECM fan was incorporated into the reduced capacity unit
and the airflow scaled down to match the lower output, a maximum efficiency of 12.76 EER was measured at a capacity
of 8350 BTU/hr for an increase of 18.1% over stock. A final test of the reduced capacity unit was performed using the
higher concentration of R32 (85% by mole) than the standard R410A mix. This change in conjunction with the ECM fan at
reduced RPM yielded a maximum efficiency of 13.11 EER at a capacity of 8428 BTU/hr for an efficiency improvement of
21.4%. It is worthwhile to mention that all efficiencies and capacities presented here are based upon the refrigerant side
energy balance, which may lower on the air-side energy balance.
The tests suggest that achieving an EER of 13 or greater in a window air conditioner is feasible using currently available
technology. With the potential efficiency increase of each proposed modification quantified, the feasibility (both
engineering and economic) of incorporating each into a marketable product would now be further explored.
43
6.0 ASSESSMENT OF ALTERNATIVE REFRIGERANT OPTIONS USING HPDM-Flex-
7.a.1
Due to the efficiency improvement measured using the 85% molar R32 mixture, some thought was given to other
alternative refrigerant possibilities which could potentially improve performance or reduce GWP. Although a number of
alternative refrigerant options were available to replace R410A [such as R134a, mixture of R32(85% by mole) and R125
(15% by mole), R32, R600a, R290, R1234yf, R1234ze], these, except R134a, are all slightly flammable and there is no
rotary compressor currently available in the open market at this stage that could run at 115V and 60Hz. Due to the
compact size configuration and small refrigerant charge in a WAC, however, the flammability of the refrigerant is less of
a concern than it would be for larger systems. Because of this, these refrigerants were evaluated as a potential
alternative to R410A using modified ORNL heat pump design model with WAC features. The model was calibrated based
on the test data, and was used to perform the parametric study to assess the performance of the WAC for the base
capacity of 10,000 BTU/HR with above mentioned alternative refrigerants. The associated effects of each refrigerant
were investigated on the system efficiency, component sizing, compressor discharge temperature etc.
Alternative Refrigerants- R134a, R32, Mixture of R32(85% by mole) and R125 (15% by mole), Natural Refrigerants
(R600a, R290), and HFOs (R1234yf and R1234ze). The GWPs of these refrigerants are given in Table 10. All refrigerant
properties were calculated using REFPROP 9.1 [NIST 2014]. The comparisons are presented in terms of efficiency,
compressor displacement volume, heat exchanger saturation temperature changes, and compressor discharge
temperature.
Table 10: Global Warming Potential (GWP) of the Alternative Refrigerants
R410A R32 R134a R600a R290 R1234yf R1234ze R32-90%/R125-10%
GWP 2079 675 1430 20 20 4 6 1251
Assumptions: In order to perform the modelling, following assumptions were made for consistent comparison of each
refrigerant for the same operating conditions-
1. Both the isentropic and the volumetric efficiencies of the compressor were assumed to be the same as that of R410A compressor, and
2. The compressor volume was adjusted to match the same cooling capacity of 10,000 BTU/HR
The “slinger” Effect: The slinger sprays water droplets into the air stream flowing over the condenser coil surface.
Instead of modeling the heat and mass transfer process, a simple approach was adopted here to treat the slinger effect
as an air side heat transfer enhancement factor from the experimental data. Figure 39 compares the model predicted air
side heat transfer enhancement multipliers due to the sling effect to laboratory data deduced heat transfer multipliers,
as a function of the ambient temperature. The laboratory data deduced heat transfer multipliers were obtained by
adjusting air side heat transfer coefficient of the condenser model to match the measured performance, assuming no
sling effect. Since there is a large dispersion in the laboratory measurements, deviations between the laboratory
deduced and model predicted heat transfer multipliers can be up to 30%. However, the average multipliers are close;
with laboratory data deduced multiplier being 1.33, and the model predicted average multiplier being 1.24.

44
Figure 39: Heat transfer enhancement ratio due to ‘sling effect’ vs. outdoor temperature
OPTIMIZATION OF HEAT EXCHANGER CIRCUITRY In order to identify the best potential replacement for R410A in WACs, simulations were performed at the standard
outdoor and indoor dry bulb/wet bulb temperature conditions specified earlier. The compressor displacement volume
was automatically adjusted to facilitate the same cooling capacity of 10,000 Btu/h (2.93 kW), for various refrigerants,
while assuming the same isentropic efficiency of 66% and volumetric efficiency of 86% as determined for the WAC with
R410A. The degrees of condenser sub-cooling and the evaporator superheat are held at 10ºR (5.6ºK). All the simulations
were run with the submerged sub-cooler and slinger. The relationship between the pressure loss and the drop in
saturation temperature drop is unique for any refrigerant. To have a fair comparison among various refrigerants and to
achieve the best efficiency of the WAC, the heat exchanger surface area and tube numbers were fixed both for the
evaporator and condenser and parametric simulations were performed to optimize the number of circuits of the
condenser and evaporator for each alternative refrigerant. Both the evaporator and condenser circuitries were
optimized to maximize the system cooling EER while maintaining a constant cooling capacity. Figure 40 shows the
optimized evaporator and condenser circuit numbers of all the refrigerant types.
Figure 40: Optimized number of circuits in condenser and evaporator for various refrigerants
Comparison of Required Compressor Displacement Volumes: Figure 41 illustrates the required compressor
0.8
0.9
1.0
1.1
1.2
1.3
1.4
1.5
1.6
1.7
1.8
30 32 34 36 38 40 42 44
He
at T
ran
sfe
r M
ult
iplie
r
Outdoor Temperature [C]Lab Data Deduced HT Multiplier Model Predicted HT Multiplier
0
1
2
3
4
5
6
7
Evaporator Circs
Condenser Circs
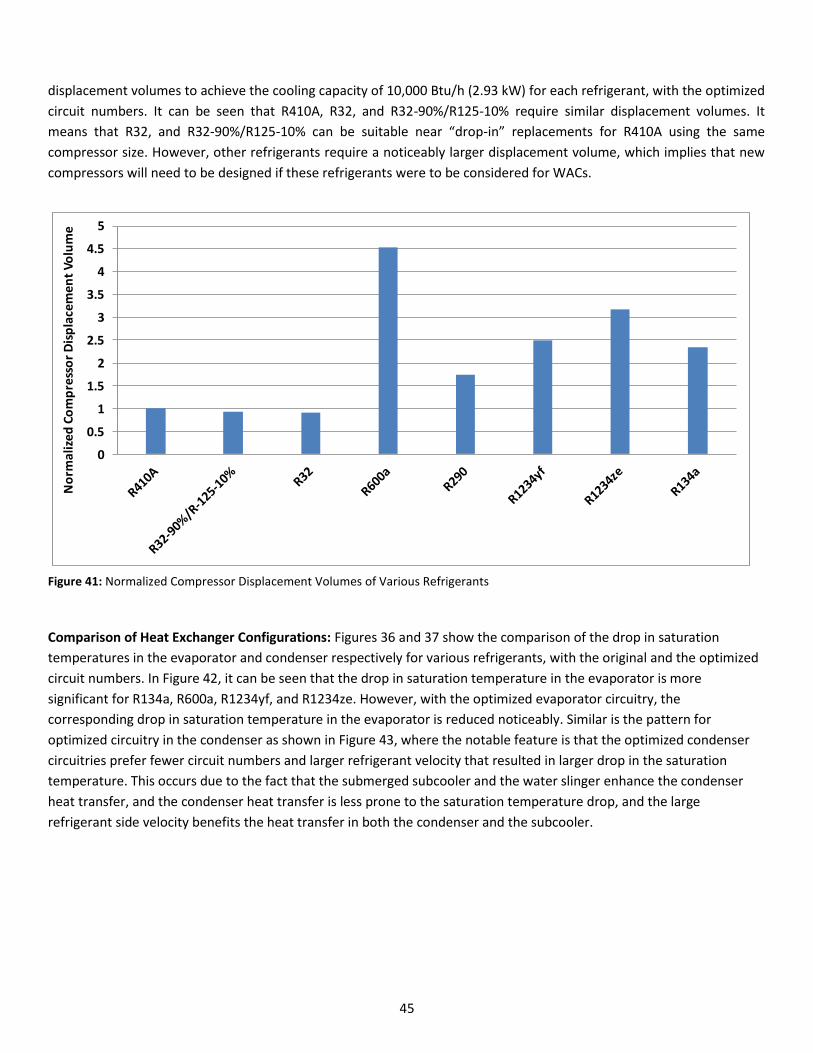
45
displacement volumes to achieve the cooling capacity of 10,000 Btu/h (2.93 kW) for each refrigerant, with the optimized
circuit numbers. It can be seen that R410A, R32, and R32-90%/R125-10% require similar displacement volumes. It
means that R32, and R32-90%/R125-10% can be suitable near “drop-in” replacements for R410A using the same
compressor size. However, other refrigerants require a noticeably larger displacement volume, which implies that new
compressors will need to be designed if these refrigerants were to be considered for WACs.
0
0.5
1
1.5
2
2.5
3
3.5
4
4.5
5
No
rma
lize
d C
om
pre
sso
r D
isp
lace
me
nt
Vo
lum
e
Figure 41: Normalized Compressor Displacement Volumes of Various Refrigerants
Comparison of Heat Exchanger Configurations: Figures 36 and 37 show the comparison of the drop in saturation
temperatures in the evaporator and condenser respectively for various refrigerants, with the original and the optimized
circuit numbers. In Figure 42, it can be seen that the drop in saturation temperature in the evaporator is more
significant for R134a, R600a, R1234yf, and R1234ze. However, with the optimized evaporator circuitry, the
corresponding drop in saturation temperature in the evaporator is reduced noticeably. Similar is the pattern for
optimized circuitry in the condenser as shown in Figure 43, where the notable feature is that the optimized condenser
circuitries prefer fewer circuit numbers and larger refrigerant velocity that resulted in larger drop in the saturation
temperature. This occurs due to the fact that the submerged subcooler and the water slinger enhance the condenser
heat transfer, and the condenser heat transfer is less prone to the saturation temperature drop, and the large
refrigerant side velocity benefits the heat transfer in both the condenser and the subcooler.

46
Figure 42: Drop in evaporator saturation temperature between optimized and original circuits for various refrigerants.
Figure 43: Drop in condenser saturation temperature between optimized and original circuits for various refrigerants
0
1
2
3
4
5
6
7
Evap
ora
tor
Satu
rati
on
Te
mp
era
ture
Dro
p [
K]
Original Circuits
Optimized Circuits
0
0.2
0.4
0.6
0.8
1
1.2
1.4
1.6
1.8
2
Co
nd
ense
r Sa
tura
tio
n T
emp
erat
ure
Dro
p [
K]
Original Circuits
Optimized Circuits

47
Comparison of Compressor Discharge Temperatures: The variation of discharge temperatures of various refrigerants
has been exhibited in Figure 44, where R32 shows the highest discharge temperature, which is about 30ºR (16.7ºK)
higher than R410A. It should be noted here that the “slinger” is effective in a number of ways, including reducing the
condenser saturation temperature, and the discharge temperature by about 7ºR (3.9ºK).
Figure 44: Compressor Discharge Temperatures of Various Refrigerants
Comparison of Energy Efficiency Ratio (EER): Figure 45 illustrates the normalized EERs of alternative refrigerants at the
outdoor temperature of 95ºF (35ºC) - normalized to the EER of the R410A unit with the original WAC circuitry using
R410A). It can be seen that R32 results in the highest EER with the same heat exchangers’ surface area as that of the
base unit. This is followed by the mixture of R32(90%)/R125(10%), R290, while all other refrigerants perform worse than
R410A. The study revealed that R32 offers the best efficiency improvement with a 67.5% lower GWP.
Figure 45: Normalized EERs of various refrigerants at 95ºF (35 ºC) ambient temperature with respect R410A EER= 1.00
0
10
20
30
40
50
60
70
80
90
100
Dis
char
ge T
em
pe
ratu
re [
C]
Optimized Circuits
Original Circuits
0.9
0.92
0.94
0.96
0.98
1
1.02
1.04
1.06
No
rmal
ize
d E
ER
Optimized Circuits
Original Circuits

48
7.0 DESIGN PRODUCTION READY HIGH EFFICIENCY WINDOW PROTOTYPE Based upon ORNL’s laboratory test results and the discussions with the CRADA partner, the design of the production
ready prototype was finalized. The prototype was fabricated by modifying the original 10,000 BTU/Hr window unit with
the following modifications-
(1) Reduce the unit capacity from 10,000 BTU/hr to 8,000 BTU/hr by replacing the original compressor with a high
efficiency (EER=9.7) compressor having 8,000 BTU/hr capacity
(2) Replace the AC induction fan motor with a brushless DC (ECM) fan motor
(3) Replace the capillary tube with a needle valve to better control refrigerant flow and set points.
Both the chassis and the heat exchangers of the original 10,000 BTU/Hr unit were retained and the unit was charged
with a “drop-in” mixture of R32 (90% molar con.) and R125 (10% molar conc.). All design details are given in Table B1.
Procedure for fabrication of new prototype: During the modification process, the electrical control panel from the
original unit was removed and replaced with digital controls for fan speed and compressor power. The original AC fan
motor was replaced with an ECM brushless and sensor-less motor by removing the old fan housing, attaching the fan
and blower to the new motor, and remounting the fan assembly to the housing. The fan housing was replaced by a
computer designed 3D printed housing to accommodate the larger ECM fan motor. This was followed by replacing the
original 10,000 BTU/H compressor with an 8,000 BTU/HR compressor. The capillary tube expansion device was replaced
by an adjustable needle expansion valve. A digital mass flow meter was installed after the sub-cooler and before the
needle vale to measure refrigerant flow. This flow device was then bolted onto the frame with copper tube connecting
to the condenser and evaporator. Finally, pressure transducers, thermocouples, relative humidity (RH) and rpm sensors
were placed around the system to monitor the state of the unit. On the refrigerant side, thermocouples and pressure
transducers were placed between each of the refrigeration cycle components: evaporator, compressor, condenser, and
expansion device. These sensors allowed for refrigerant property estimation of the state during the cycle. Additional
thermocouples were placed in the middle of the condenser and evaporator for midpoint readings. The design was
intended to provide readings throughout the entire process and allow for an in depth determination of the efficiency on
a component and entire unit basis. Also installed were thermocouple arrays and RH sensors on both air-sides of the
evaporator and the condenser to measure the refrigeration capacity. A thermocouple array was installed after the fan,
but before the condenser to verify a temperature drop from the slinging.
Testing with the New Prototype: The unit was evacuated and tested for leaks and was charged with a 590 gm of the
blend of R32/R125 refrigerant. The fan was operated at 1200 rpm that corresponded to air flow rates to match 8,000
BTU/hr capacity. The tests were conducted following DOE test conditions (Indoor- 80°F, 51.5% RH; Outdoor- 95°F, 41.1%
RH). The unit was allowed to reach steady state before collecting useful data.
This unit was expected to achieve high EER but during initial testing, it struggled to achieve 8,000 BTU/HR capacity
(refrigerant-side) and yielded only 12.1 EER (on average). These experiments were performed over a large span of time
with different charges and conditions, however, the unit performed unsatisfactorily with most tests being unrepeatable.
Upon investigation, it was revealed that the needle valve was choking in the morning which reduced the refrigerant flow
rate. This possibly caused a reduction in the flow rate when test was repeated the next morning and required
adjustment to achieve the prior conditions. Therefore, this valve was replaced with a new needle valve with a larger
adjustment range; which interestingly performed well at least during its initial testing. Initial tests with this needle valve

49
on three consecutive days (09/16/2014 to 09/18/2014) consistently exhibited the refrigeration-side capacity of up to
8700 BTU/hr, refrigerant flow rate of 89 lbm/hr and the maximum EER of 13.38 (see Figure 46).
Figure 46: Averaged EER of the window unit during 09/17/2014 – 09/18/2014 (good days)
Following this, before the unit could be shipped for independent testing, it was charged one last time on 09/26/2014
with 590gm of the refrigerant mixture (90% mole conc. of R32 and 10% mole conc. of R125) for final testing during
09/26/2014 to 09/29/2014 to ensure that it was still working as expected. However, as experienced before, the unit
again performed poorly. The unit suffered from the same problem of flow choking (flow rate reducing to between 79
and 87 lb/hr as opposed to 89lb/hr in previous tests) and achieving much less capacity and hence low EER (ranging
between 11.6 and 12.3). The EER for tests on 09/26/2014 to 09/29/2014 (bad days) at different time intervals is
displayed in Figure 47.
Figure 47: Averaged EER of the final prototype experimented on 09/26/2014 - 09/29/2014 (bad days)

50
Data Analysis and Performance Insights of Window Air Conditioner After Changing Needle Valve
Due to the discrepancies in results, an extensive data analysis was performed on the unit over the 30 minute intervals
during 09/16/2014 to 09/18/2014 (good days) and on 09/26/2014 to 09/29/2014 (bad days). Some of the performance
variables are given below-
1. Refrigerant side capacity 2. EER 3. Air temperature drop across the evaporator 4. Pressure drop from the evaporator to condenser 5. Mass flow rate
Refrigerant Capacity: The refrigerant capacity is a measure of the heat extracted from the indoor room. Following the
RSS method for the experiment on 09/16/2014 to 09/18/2014 (good days), the uncertainty and the standard deviation
of the refrigeration capacity was calculated to be ± 69.83 BTU/hr and 132.49 BTU/hr respectively. For the experiment
on 09/26/2014 to 09/29/2014 (bad days), the corresponding uncertainty and the standard deviation of the refrigeration
capacity was calculated to be ± 70.61 BTU/hr and 202.90 BTU/hr respectively. These uncertainties are based on the
random errors of the sensors based the specified dates.
The air flowing through the evaporator experiences a drop in its temperature (see Figure 48) as it transfers heat to the
refrigerant. Therefore, the temperature drop of air increases as the refrigerant capacity increases. However the lower
refrigerant capacity for experiment on 09/26/2014 to 09/29/2014 (bad days) still result in the same temperature drop
range compared to the experiment on 09/16/2014 to 09/18/2014 (good days) for a vast majority of data points. This is
displayed in Figure 42 against the refrigerant capacity for both 09/16 – 9/18 (good days) and 09/26 – 9/29 (bad days)
intervals. This suggests the possibility of an erroneous measurement in refrigerant capacity.
Refrigerant Mass Flow Rate: The refrigerant mass flow rate (see Figure 49) is a direct multiplier in the calculation of the
refrigerant capacity that differed significantly between the experiments. In the experiments on 09/26/2014 –
09/29/2014 (bad days), the evaporator superheat became unstable at 89 lbm/hr that led to the adjustment of the
refrigerant mass flow rate to a lower value. The same pressure changes from the evaporator to the condenser on the
bad days corresponded to a much lower mass flow rate compared to the good days for a majority of data points. This
supports the possibility of a flaw in the refrigerant mass flow rate measurements, or a system related flow restriction.
Either would propagate to a distorted refrigerant capacity. These discrepancies are displayed in Figure 49 for both
09/16/2014 – 09/18/2014 (good days) and 09/26/2014 – 09/29/2014 (bad days) intervals.
Energy Efficiency Ratio (EER): For the experiments on 09/16/2014 to 09/18/2014 (good days), the uncertainty and the
average standard deviation in the EER (capacity based on refrigerant side) was determined to be ± 0.22 BTU/Whr and
0.34 BTU/Whr respectively. For the experiments on 09/26/2014 to 09/29/2014 (bad days), the uncertainty and the
standard deviation in the EER (capacity based on refrigerant side) was determined to be ± 0.19 BTU/Whr and 0.62
BTU/Whr respectively. These uncertainties are based on the random errors of the sensors. There is also data available to
calculate the EER based on the airside capacity, however, the airside capacity has been calculated by estimating the
volumetric flow rate. This volumetric flow rate must remain constant because the RPM of the ECM fan was fixed at
1200.
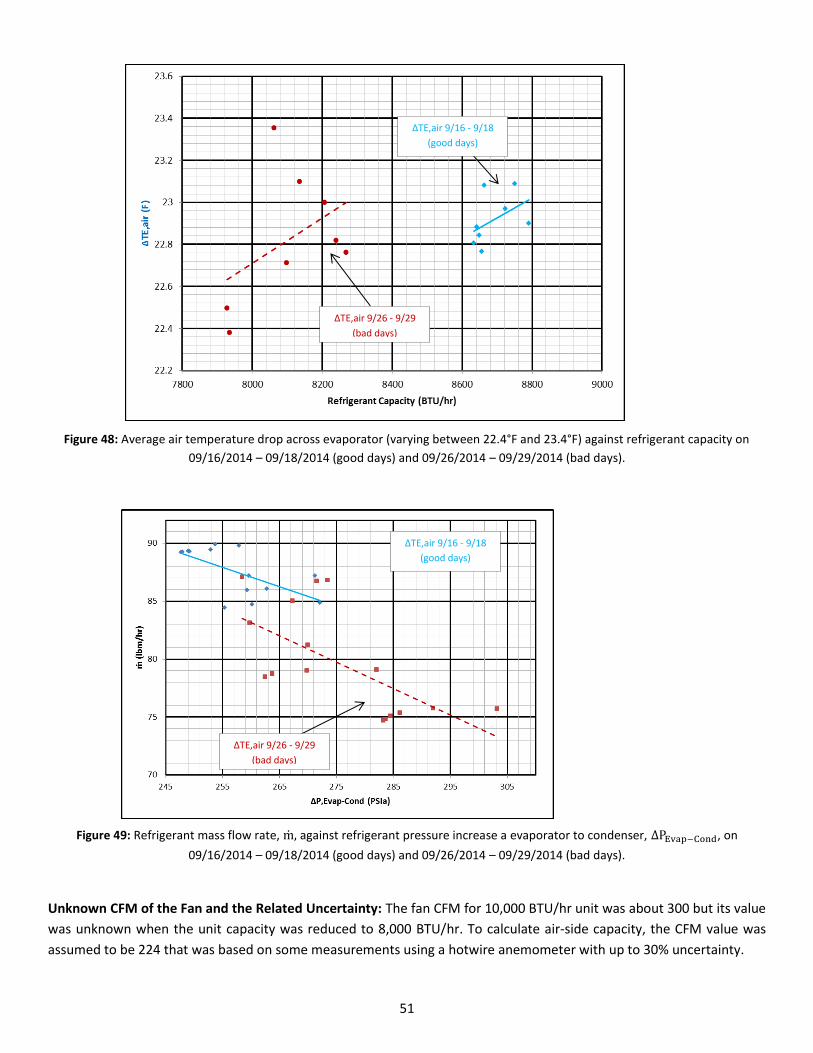
51
Figure 48: Average air temperature drop across evaporator (varying between 22.4°F and 23.4°F) against refrigerant capacity on
09/16/2014 – 09/18/2014 (good days) and 09/26/2014 – 09/29/2014 (bad days).
Figure 49: Refrigerant mass flow rate, m, against refrigerant pressure increase a evaporator to condenser, ∆PEvap−Cond, on
09/16/2014 – 09/18/2014 (good days) and 09/26/2014 – 09/29/2014 (bad days).
Unknown CFM of the Fan and the Related Uncertainty: The fan CFM for 10,000 BTU/hr unit was about 300 but its value
was unknown when the unit capacity was reduced to 8,000 BTU/hr. To calculate air-side capacity, the CFM value was
assumed to be 224 that was based on some measurements using a hotwire anemometer with up to 30% uncertainty.
ΔTE,air 9/26 - 9/29
(bad days)
ΔTE,air 9/16 - 9/18
(good days)
ΔTE,air 9/16 - 9/18
(good days)
ΔTE,air 9/26 - 9/29
(bad days)
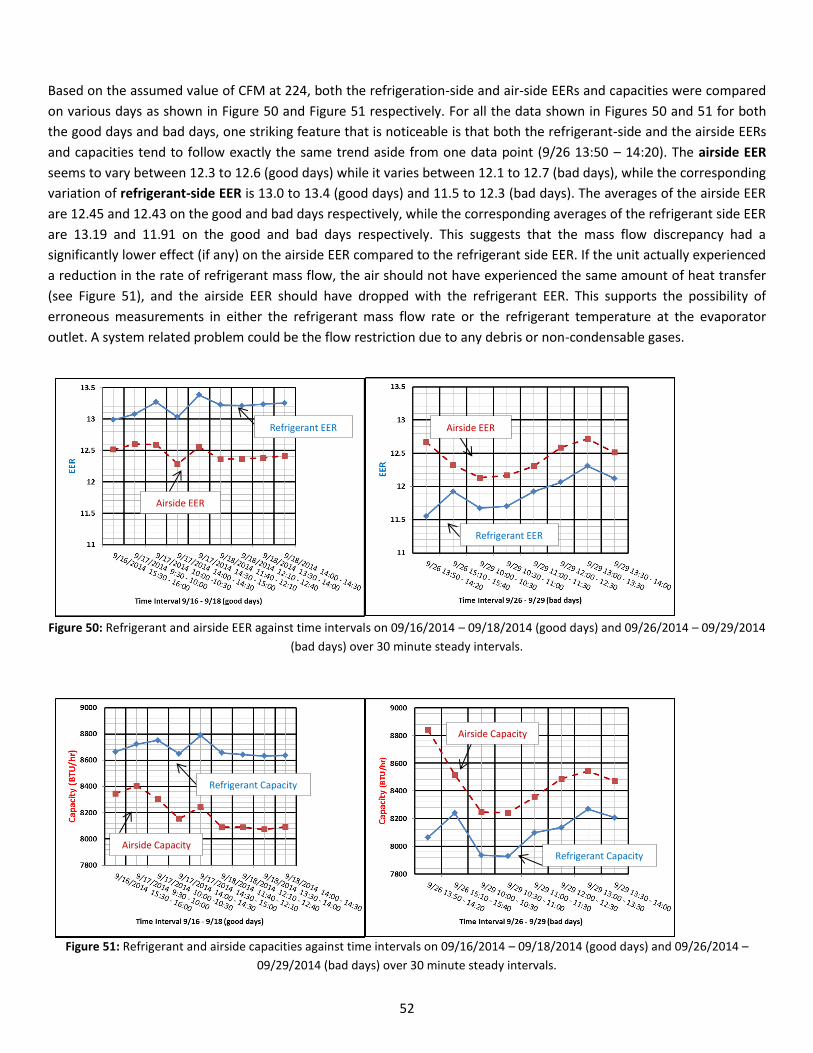
52
Based on the assumed value of CFM at 224, both the refrigeration-side and air-side EERs and capacities were compared
on various days as shown in Figure 50 and Figure 51 respectively. For all the data shown in Figures 50 and 51 for both
the good days and bad days, one striking feature that is noticeable is that both the refrigerant-side and the airside EERs
and capacities tend to follow exactly the same trend aside from one data point (9/26 13:50 – 14:20). The airside EER
seems to vary between 12.3 to 12.6 (good days) while it varies between 12.1 to 12.7 (bad days), while the corresponding
variation of refrigerant-side EER is 13.0 to 13.4 (good days) and 11.5 to 12.3 (bad days). The averages of the airside EER
are 12.45 and 12.43 on the good and bad days respectively, while the corresponding averages of the refrigerant side EER
are 13.19 and 11.91 on the good and bad days respectively. This suggests that the mass flow discrepancy had a
significantly lower effect (if any) on the airside EER compared to the refrigerant side EER. If the unit actually experienced
a reduction in the rate of refrigerant mass flow, the air should not have experienced the same amount of heat transfer
(see Figure 51), and the airside EER should have dropped with the refrigerant EER. This supports the possibility of
erroneous measurements in either the refrigerant mass flow rate or the refrigerant temperature at the evaporator
outlet. A system related problem could be the flow restriction due to any debris or non-condensable gases.
Figure 50: Refrigerant and airside EER against time intervals on 09/16/2014 – 09/18/2014 (good days) and 09/26/2014 – 09/29/2014
(bad days) over 30 minute steady intervals.
Figure 51: Refrigerant and airside capacities against time intervals on 09/16/2014 – 09/18/2014 (good days) and 09/26/2014 –
09/29/2014 (bad days) over 30 minute steady intervals.
Airside EER
Refrigerant EER
Refrigerant EER
Airside EER
Airside Capacity
Refrigerant Capacity
Airside Capacity
Refrigerant Capacity
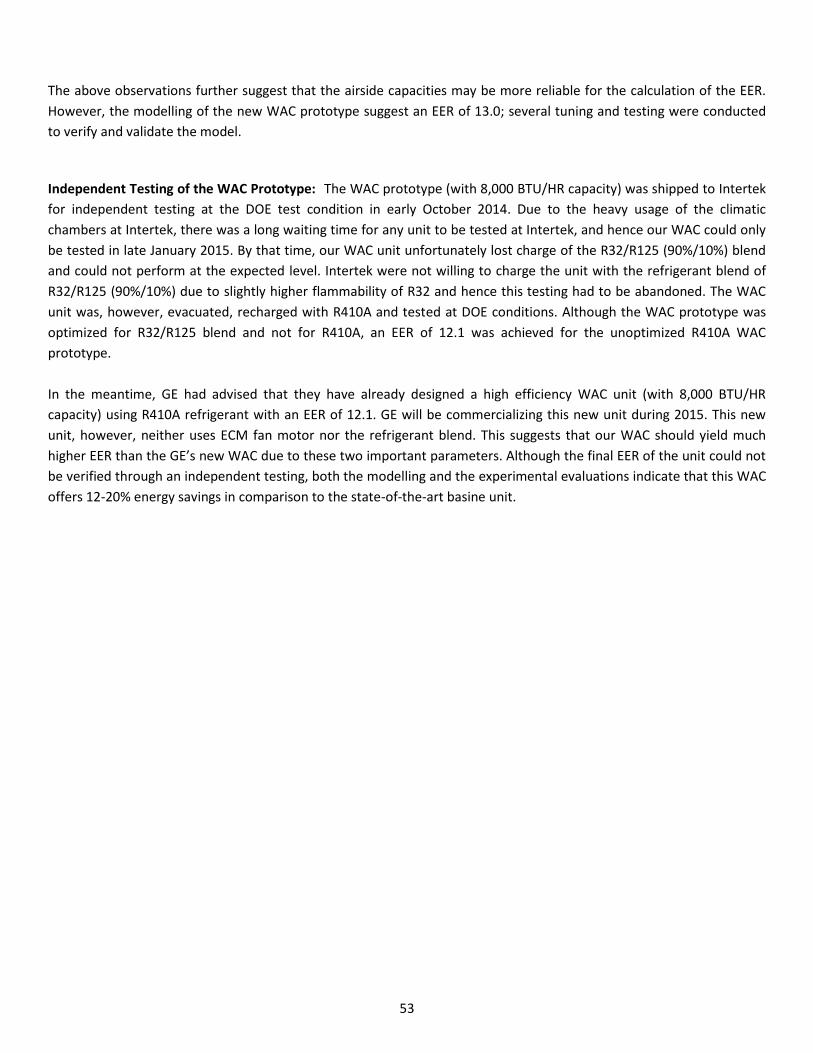
53
The above observations further suggest that the airside capacities may be more reliable for the calculation of the EER.
However, the modelling of the new WAC prototype suggest an EER of 13.0; several tuning and testing were conducted
to verify and validate the model.
Independent Testing of the WAC Prototype: The WAC prototype (with 8,000 BTU/HR capacity) was shipped to Intertek
for independent testing at the DOE test condition in early October 2014. Due to the heavy usage of the climatic
chambers at Intertek, there was a long waiting time for any unit to be tested at Intertek, and hence our WAC could only
be tested in late January 2015. By that time, our WAC unit unfortunately lost charge of the R32/R125 (90%/10%) blend
and could not perform at the expected level. Intertek were not willing to charge the unit with the refrigerant blend of
R32/R125 (90%/10%) due to slightly higher flammability of R32 and hence this testing had to be abandoned. The WAC
unit was, however, evacuated, recharged with R410A and tested at DOE conditions. Although the WAC prototype was
optimized for R32/R125 blend and not for R410A, an EER of 12.1 was achieved for the unoptimized R410A WAC
prototype.
In the meantime, GE had advised that they have already designed a high efficiency WAC unit (with 8,000 BTU/HR
capacity) using R410A refrigerant with an EER of 12.1. GE will be commercializing this new unit during 2015. This new
unit, however, neither uses ECM fan motor nor the refrigerant blend. This suggests that our WAC should yield much
higher EER than the GE’s new WAC due to these two important parameters. Although the final EER of the unit could not
be verified through an independent testing, both the modelling and the experimental evaluations indicate that this WAC
offers 12-20% energy savings in comparison to the state-of-the-art basine unit.
54
8.0 COMMERCIALIZATION POSSIBILITIES
The research investigation in this project has revealed that the efficiency of a room window air conditioner can be
improved significantly, resulting in 12-20% energy savings per annum. One of the novel elements responsible for this
enhanced energy efficiency was the use of a “drop-in” refrigerant blend of R32/R125 (90%/10% molar concentration) in
place of R140A as a refrigerant. The modelling results have indicated that R32 would enhance the nergy efficiency even
further, however, due to the limited flammability issues with R32, it was not experimentally investigated in the project.
Although R32 is a popular refrigerant and is frequently used in air conditioners in other parts of the world (e.g. Asia,
Europe, …), the US regulating agencies, such as the Environmental Protection Agency and UL Underwriters, are working
to address the fllamability issues and there is a strong possibility that R32 may be allowed to be used in small systems
such as a window air conditioner in the near future.
The CRADA partner is interested in further development and commercialization of A2L refrigerants in smaller units with
limited refrigerant charges. This may allow them to commercialize a real world product by advancing the results from
this CRADA project in the future.
9.0 PLANS FOR FUTURE COLLABORATION The CRADA partner GE is investigating the technical as well as economic potential of the high efficiency room window air
conditioner. The results of this projects would be highly relevant and useful to DOE standard body to raise the minimum
energy efficiency levels for room air conditioners. This would encourage manufacturers to implement the research
developed as a part of this project.
The CRADA partner GE will be keen to work with ORNL to extend this collaboration. There may be a possibility to
perform a field study of the new high efficiency prototype as a part of the Residential Building Integration program,
where future collaboration with GE may be warranted.
10.0 CONCLUSIONS
This project was undertaken as a CRADA project between UT-Battelle and General Electric Company and was funded by
Department of Energy to design and develop of a high efficiency room air conditioner. A number of novel elements were
investigated to improve the energy efficiency of a state-of-the-art WAC with base capacity of 10,000 BTU/h. One of the
major modifications was made by downgrading its capacity from 10,000 BTU/hr to 8,000 BTU/hr by replacing the
original compressor with a lower capacity (8,000 BTU/hr) but high efficiency compressor having an EER of 9.7 as
compared with 9.3 of the original compressor. However, all heat exchangers from the original unit were retained to
provide higher EER. The other subsequent major modifications included- (i) the AC fan motor was replaced by a
brushless high efficiency ECM motor along with its fan housing, (ii) the capillary tube was replaced with a needle valve to
better control the refrigerant flow and refrigerant set points, and (iii) the unit was tested with a ‘drop-in’
environmentally friendly binary mixture of R32 (90% molar concentration)/R125 (10% molar concentration). The WAC
was tested in the environmental chambers at ORNL as per the design rating conditions of AHAM/ASHRAE (Outdoor- 95F
and 40%RH, Indoor- 80F, 51.5%RH). Both the modelling and the experimental evaluations suggest that this WAC offers
12-20% energy savings in comparison to the state-of-the-art baseline unit.

55
ACKNOWLEGEMENTS
Special thanks are due to a number of contributors for their invaluable contributions and support during this project,
including Mr. Edward Vineyard, Dr. Chris Halford, Dr. Bo Shen, Mr. Brice Bowley, Mr. Charles Smith, Mr. Jiancheng Zong,
Mr. Tim Ao, Dr. Detlef Westphalen, Mr. Paul Lin, Mr. Mark Hoehne, Dr. Keith Rice, Mr. Van Baxter, Mr. Randall Linkous,
Mr. Neal Durfee, Mr. Jeff Ormston, Mr. Brian Goins, Mr. Randall Witherington, Mr. Philip Boudreaux, Mr. Edwin
Figueroa, Mr. Chase Davani and Mr. Amar Mohabir. Support from General Electric (our CRADA partner) is also gratefully
acknowledged.
REFERENCES
Bansal, P. K. and Shen, B., 2014, “Analysis of environmentally friendly refrigerant options for window air conditioners,
Science and Technology for the Built Environment (under review).
Bolaji, B. O., 2011, Performance investigation of ozone-friendly R404A and R507 refrigerants as alternatives to R22 in a window air-conditioner, Energy and Buildings, 43, pp 3139-3143.
Braun. J.E., Klein. S.A, and Mitchell, J.W., 1989, “Effectiveness models for cooling towers and cooling coils”, ASHRAE
Transactions, 95(2), pp. 164-174.
Devotta, S., Padalkar, A. S., and Sane, N. K., 2005, Performance assessment of HC-290 as a drop-in substitute to HCFC-22
in a window air conditioner, International J Refrigeration, 28, pp 594-604.
DOE, 2011, “Residential Clothes Dryers and Room Air Conditioners Direct Final Rule Technical Support Document”,
4/18/2011; updated on 03/02/2012,
http://www1.eere.energy.gov/buildings/appliance_standards/residential/residential_clothes_dryers_room_ac_dire
ct_final_rule_tsd.html
e-CFR Title 10: “Energy, Part 430- Energy conservation program for consumer products”, 2014, http://www.ecfr.gov/cgi-
bin/text-idx?SID=19211021fb068617aba13063da4e959a&node=10:3.0.1.4.18.3.9.2&rgn=div8
EIA (2009); Residential Energy Consumption Survey, US DOE Energy Information Administration,
http://www.eia.gov/consumption/residential/data/2009/
Goswami, D.Y., Mathur, G. D., Kulkarni, S. M., 1993, Experimental investigation of performance of a residential air conditioning system with an evaporatively cooled condenser, Journal of Solar Energy Engineering 115, 206–211.
Hajidavalloo, E., 2007, Application of evaporative cooling on the condenser of window-air-conditioner, Applied Thermal Engineering, 27, pp 1937-1943.
Jabaraj, D.B., Avinash, P., Mohan Lal, D. and Renganarayan, S., 2006, Experimental investigation of HFC407C/HC290/HC600a mixture in a window air conditioner, Energy Conversion and Management, 47, pp 2578–2590
Naphon, P. 2010, On the performance of air conditioner with heat pipe for cooling air in the condenser, Energy Conversion and Management, 51, pp 2362–2366.
Lawrence Livermore National Laboratory (LBNL), 1997, “Technical support document for energy conservation standards
for room air conditioners: Volume 2 - Detailed analysis of efficiency levels”, Docket Numbers EE-RM-90-201 & EE-
RM-93-801-RAC, September.

56
Nogueira, L A H, 2013, “Package of measures to promote efficient air conditioning”, ADEME, World Energy Council
Study, http://www.wec-policies.enerdata.eu/Documents/cases-
studies/Measures_to_promote_efficient_air_conditioning.pdf
NIST, 2014, National Institute of Science and Technology Standard Reference Database 23, REFPROP 9.1, Gaithersburg,
USA,, http://www.nist.gov/srd/nist23.cfm
Rice, C. K., Jackson, W. L. , Fischer, S. K. and Ellison, R. D. , 1981, Design optimization and the limits of steady-state
heating efficiency for conventional single speed air-source heat pumps, Contract No. W-7405-eng-26, ORNL/CON-63,
Department of Energy.
Sawant, A. P., Agrawal, N. and Nanda, P, 2012, Performance assessment of an evaporative cooling-assisted window air conditioner, International J low-carbon technologies, 7, pp 128-136.
Shen, B. and P. K. Bansal, 2014, Assessment of environmentally friendly refrigerants for window air conditioners, ID2275,
Proc. 15th International Refrigeration and Air Conditioning Conference, Purdue University, West Lafayette, July 14-
17.
Winkler, J., C. Booten, D. Christensen and J. Tomerlin, 2013, “Laboratory performance testing of residential window air
conditioners”, NREL/TP-5500, 57617, July.
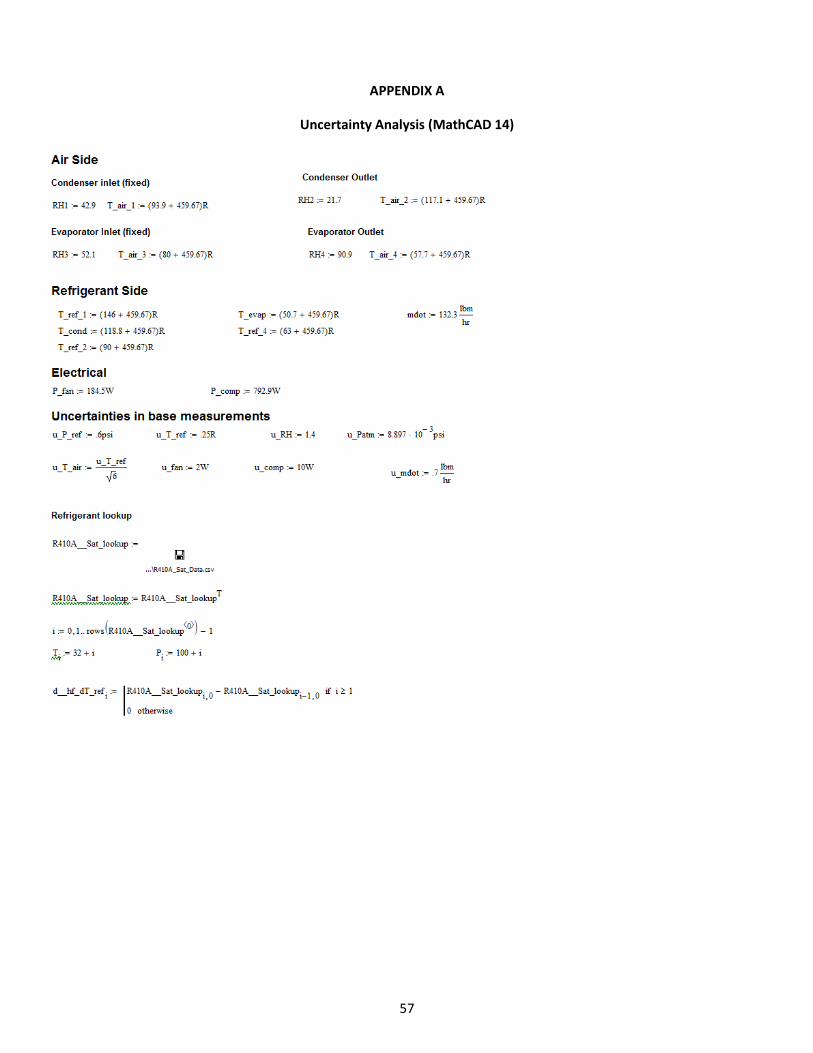
57
APPENDIX A
Uncertainty Analysis (MathCAD 14)
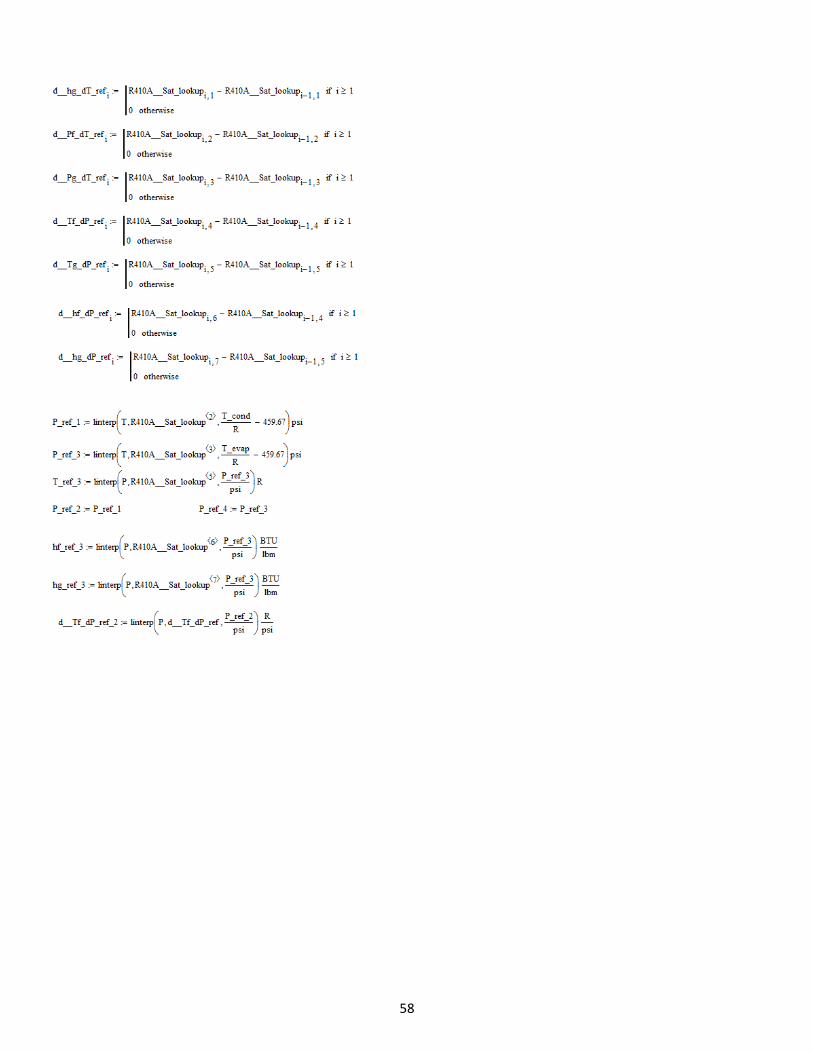
58

59

60

61

62

63

64

65

66
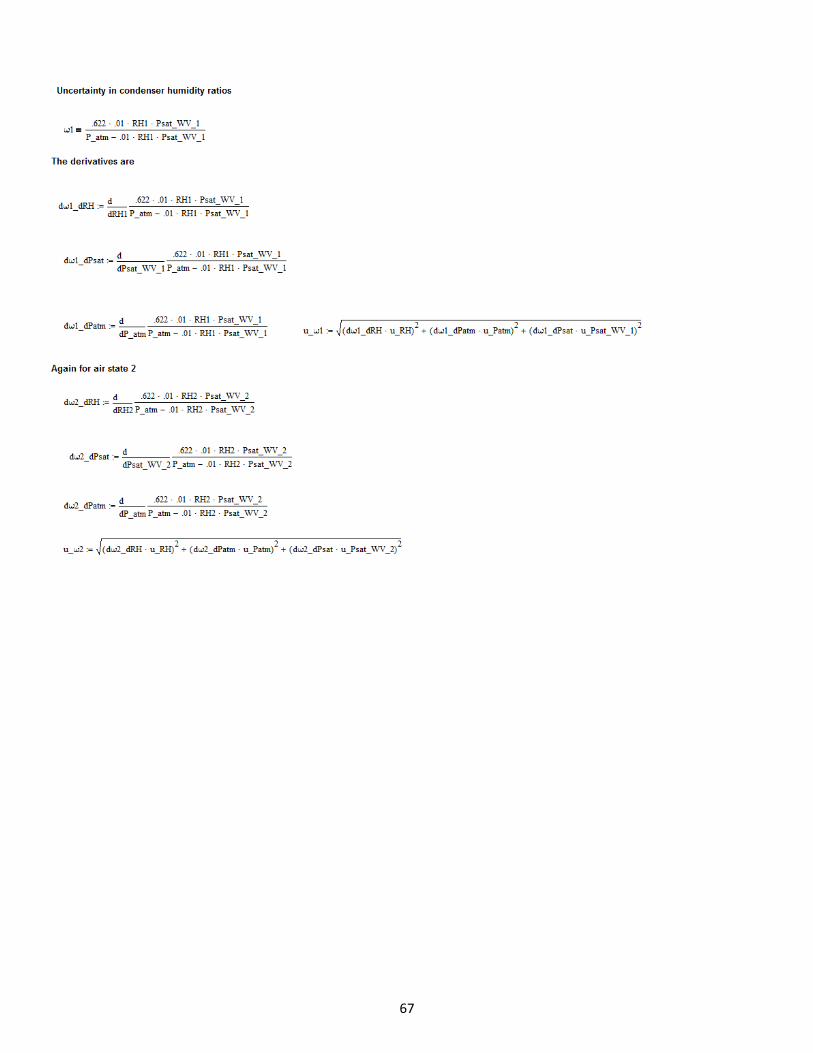
67

68
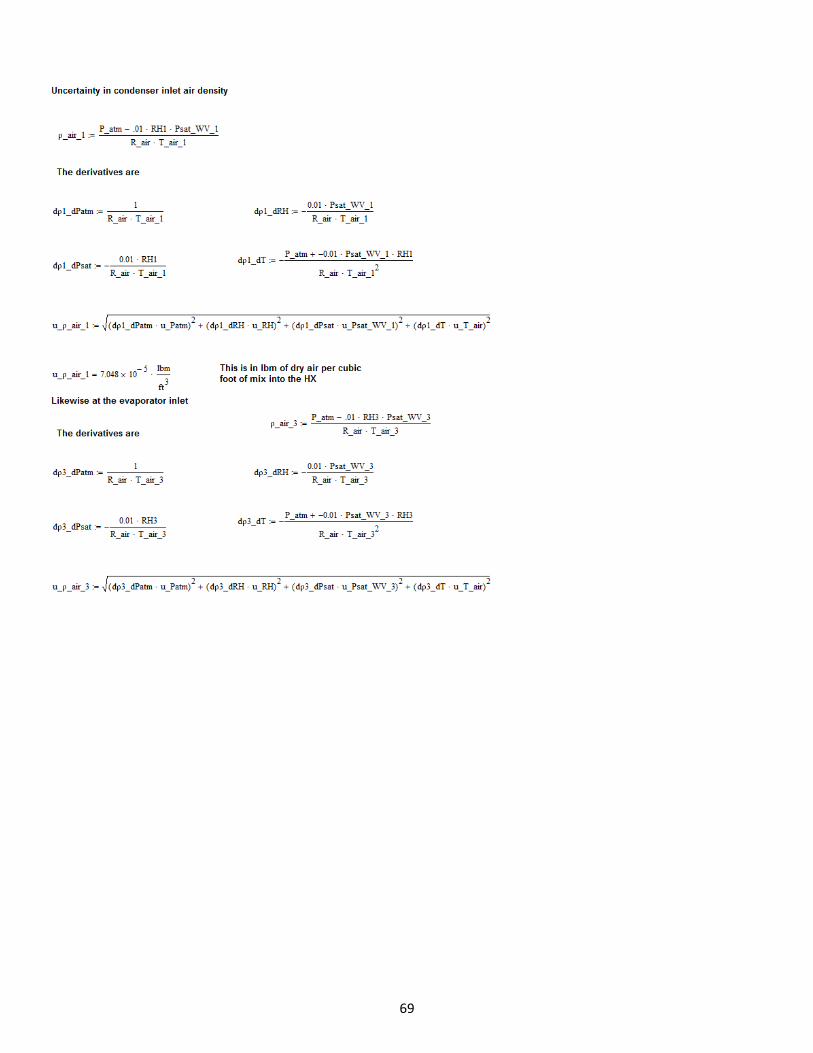
69

70

71
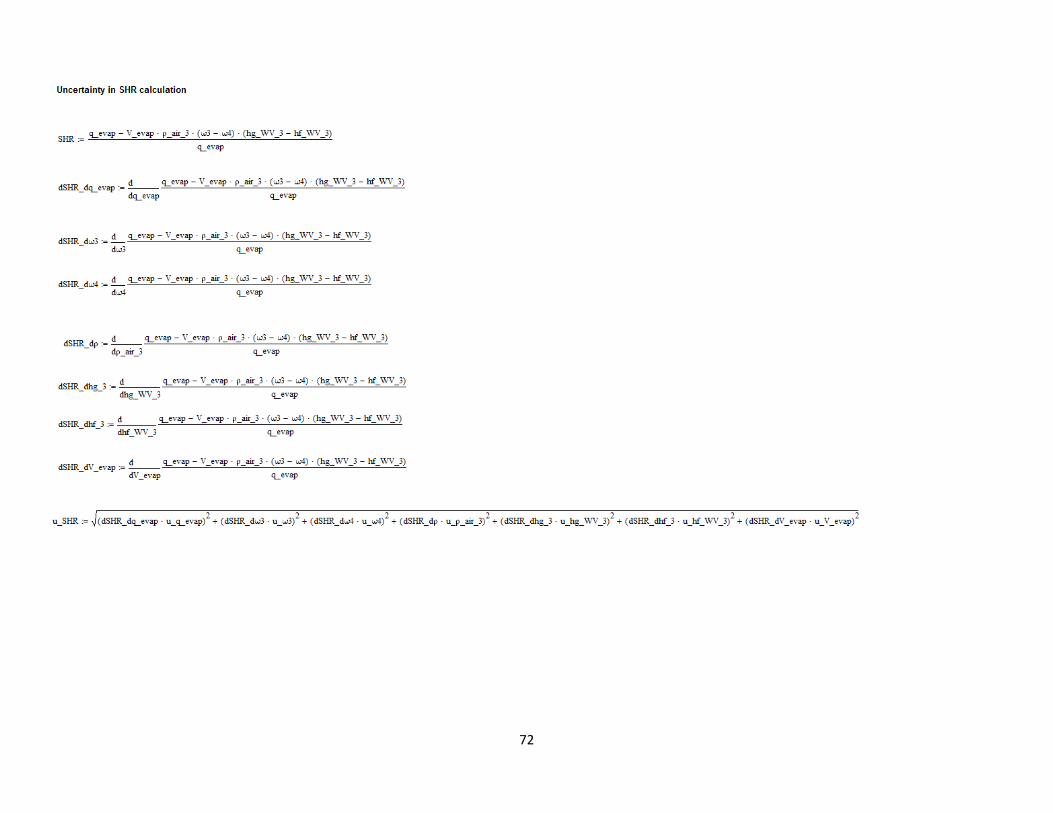
72

73

74

75
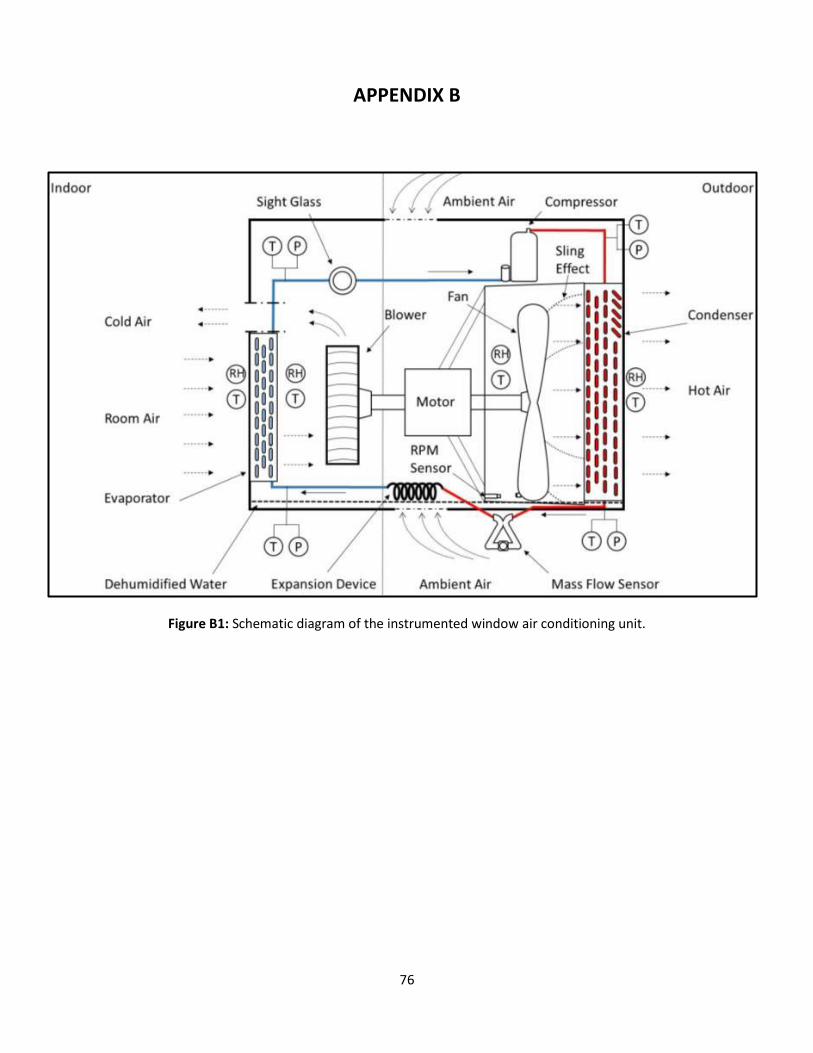
76
APPENDIX B
Figure B1: Schematic diagram of the instrumented window air conditioning unit.

77
Table B1: Details of Design Production Ready Window Air-Conditioner Prototype
GE AEM10AP
Capacity 8,000 BTU/hr
SHR ~ 0.7
Indoor Airflow ~ 290 cfm
Outdoor Airflow ~ 500 cfm
Evaporator
Evaporator Length 12.75 in
Evaporator Height 9.75 in
Evaporator Thickness 2 in
Evaporator Number of Rows 4
Evaporator Tubes per Row 13
Evaporator Fin Pitch 20/in
Condenser
Condenser Length 16.25 in
Condenser Height 13 in
Condenser Thickness 1.3125 in
Condenser Number of Rows 3
Condenser Tubes per Row 17
Condenser Fin Pitch 24/in
Compressor – GREE compressor with capacity 8,000 Btu/hr, EER = 9.7
ECM Fan Motor- 100W output, 1400 rpm
Heat Exchangers – detailed given above Top view of the window unit
Needle Valve