high-dimensional analysis of the murine myeloid …. myeloid cells can be classified by cell...
TRANSCRIPT
nature immunology VOLUME 15 NUMBER 12 DECEMBER 2014 1181
r e s o u r c e
Myeloid cells in mammals are crucial in the formation and execu-tion of immune responses. They are able to recognize damage- and pathogen-associated molecular patterns through germline-encoded receptors and not only initiate but also amplify adaptive immune response through antigen presentation and cytokine production. In hematopoiesis, a myeloid cell is any white blood cell that is not a lymphocyte. By this definition, monocytes and granulocytes are the most common myeloid cell populations in the blood. But dendritic cells (DCs) and various populations of macrophages, monocytes and polymorphonucleated cells can be found in solid tissues1. Myeloid cells can be classified by cell surface–marker expression, ontogeny or differential dependence on lineage-defining transcription factors and growth factor signaling, which sharply distinguishes specific popula-tions2–5. However, recent studies have further highlighted the com-plex ontogeny of macrophages and DCs5,6. These advances highlight the unexpected complexity of the myeloid system and the limited capacity to identify the numerous cell types of myeloid origin with highly specialized functions and tissue distribution.
Analysis of myeloid cells relies predominantly on historical nomen-clature and the use of traditional markers to define cell populations, but these do not encompass the full complexity of the myeloid sys-tem. For example, macrophages branded solely by the expression of the common myeloid marker CD11b and the macrophage marker F4/80 in adult mice are likely to be contaminated by eosinophils, monocytes or both7. CD11b is not expressed by alveolar macrophages,
and many macrophage subpopulations do not express F4/80 (ref. 8). Monocyte-derived cells that have phenotypic and functional proper-ties shared by both DCs and macrophages are difficult to objectively distinguish9–12. Inflammation further complicates the picture when myeloid cells undergo phenotypic changes or other cell types not present in the steady state emerge. Such inflammatory DCs have been termed monocyte-derived DCs (moDCs) or tumor necrosis factor (TNF)- and iNOS-producing DCs (TIP-DCs)13. In addition, a number of subsets of myeloid-derived suppressor cells have been defined by association of functional and phenotypic properties in preclinical can-cer models, but their definitions often overlap with other described myeloid subsets, which leads to confusing nomenclature14,15. A series of reports identified additional cell surface markers on specific subsets within the myeloid compartment, which sharpened the distinction between DCs and macrophages while further increasing the number and complexity of myeloid subpopulation definitions16–18. Multiple populations of granulocytes, monocytes, monocyte-derived cells, resi-dent macrophages and DCs coexist in tissues, but their unambiguous identification is becoming increasingly difficult.
Analysis of cellular lineages relies chiefly on fluorescence flow cytom-etry and informed biased gating strategies. Such technology, although far progressed, is bound by the number of independent parameters and spectral overlap. Fluorescence-based analysis of phagocytic myeloid cells is further complicated by their (often strong) autofluorescence at wave-lengths in the range of 500–600 nm, which contributes to potentially
1Agency for Science, Technology and Research (A*STAR), Singapore Immunology Network (SIgN), Singapore. 2Institute of Experimental Immunology, University of Zurich, Zurich, Switzerland. 3School of Biological Sciences, Nanyang Technological University, Singapore. 4Present address: Institute of Experimental Immunology, University of Zurich, Zurich, Switzerland. 5These authors contributed equally to this work. Correspondence should be addressed to E.W.N. ([email protected]) or B.B. ([email protected]).
Received 12 June; accepted 9 September; published online 12 October 2014; doi:10.1038/ni.3006.
High-dimensional analysis of the murine myeloid cell systemBurkhard Becher1,4,5, Andreas Schlitzer1,5, Jinmiao Chen1,5, Florian Mair2, Hermi R Sumatoh1, Karen Wei Weng Teng1, Donovan Low1, Christiane Ruedl3, Paola Riccardi-Castagnoli1, Michael Poidinger1, Melanie Greter2, Florent Ginhoux1 & Evan W Newell1
Advances in cell-fate mapping have revealed the complexity in phenotype, ontogeny and tissue distribution of the mammalian myeloid system. To capture this phenotypic diversity, we developed a 38-antibody panel for mass cytometry and used dimensionality reduction with machine learning–aided cluster analysis to build a composite of murine (mouse) myeloid cells in the steady state across lymphoid and nonlymphoid tissues. In addition to identifying all previously described myeloid populations, higher-order analysis allowed objective delineation of otherwise ambiguous subsets, including monocyte-macrophage intermediates and an array of granulocyte variants. Using mice that cannot sense granulocyte macrophage–colony stimulating factor GM-CSF (Csf2rb−/−), which have discrete alterations in myeloid development, we confirmed differences in barrier tissue dendritic cells, lung macrophages and eosinophils. The methodology further identified variations in the monocyte and innate lymphoid cell compartment that were unexpected, which confirmed that this approach is a powerful tool for unambiguous and unbiased characterization of the myeloid system.
npg
© 2
014
Nat
ure
Am
eric
a, In
c. A
ll rig
hts
rese
rved
.
1182 VOLUME 15 NUMBER 12 DECEMBER 2014 nature immunology
r e s o u r c e
erroneous interpretations of data. In contrast, mass cytometry, which uses heavy metal isotopes instead of fluorophores as tags, is not affected by cellular autofluorescence, and there are many more isotopic tags available than fluorophores, with greatly reduced crosstalk between detector channels19. This approach, therefore, allows accurate measure-ment of an unprecedented number of parameters at the single-cell level and a much deeper assessment of cellular diversity20,21. Accordingly, mass cytometry data are amenable to high-dimensional analysis, which allows objective segregation of cells on the basis of visually verifiable patterns of global expression22–24.
Here we analyze the mammalian myeloid cellular landscape in an unbiased manner and define cell populations through a component breakdown of high-dimensional, 38-parameter mass cytometry data. To do this, we used high-performance nonlinear dimensionality reduc-tion in conjunction with a machine learning–aided clustering algo-rithm to display and objectively delineate the phenotypic heterogeneity of myeloid populations in specific tissues. We used this methodology to analyze eight lymphoid and nonlymphoid tissues from up to six mice in parallel. Focusing first on the analysis of wild-type C57BL/6 mice, we built a comprehensive map of steady-state myeloid cellular diversity across different tissues. Then, to validate the ability of this approach to detect differences between mouse mutants, we performed a compara-tive analysis of tissue-resident myeloid cells derived from wild-type and Csf2rb−/− mice. Using standard flow cytometry and morphological analysis of sorted cells, we subsequently validated ambiguous cellular subsets and the observed compositional changes in Csf2rb−/− mice.
RESULTSMass cytometry panel design and validationWe first assembled a comprehensive panel of tagged monoclonal anti-bodies to define cell surface markers of leukocytes and to include most of the myeloid cell markers described to date. We verified the antibodies for the panel independently for binding to myeloid cells on the basis of previous reports (Supplementary Table 1). We opti-mized the panel through an iterative process by which the isotopic labels were paired with antibodies on the basis of their respective signal intensities and channel sensitivities. We minimized crosstalk between channels during this process and took it into consideration during interpretation of all results. We validated antibody staining by flow cytometry (Supplementary Fig. 1).
We obtained single-cell suspensions from various tissues including lung, spleen, mesenteric lymph nodes, liver, thymus, brain, kidney and bone marrow from C57BL/6 mice and stained each with the same premixed antibody cocktail (Supplementary Table 1). To reduce technical variation and facilitate comparison of cells derived from multiple tissues and mice, we used mass-tag barcoding25 to simultane-ously acquire cells derived from all tissues (Online Methods).
We extracted cells for each tissue, and for thymus and spleen, we enriched cells for myeloid populations by negatively selecting against the B and T cell markers CD19 and CD90. We then performed gat-ing of traditionally defined myeloid subsets as described17,26 (Supplementary Tables 1 and 2). We applied an example analysis of the lung and the identification of various myeloid cell populations on the basis of traditional flow cytometry–based gating strategies (Fig. 1a). We identified plasmacytoid DCs (pDCs) (BST2+B220+), neutrophils (Ly6G+CD11b+), monocytes (Ly6C+CD11b+), DCs (MHCII+CD11c+) subdivided into CD103+ and CD11b+ DCs, inter-stitial macrophages (CD11b+CD11c+MHCII+CD24−) and alveolar macrophages (MHCIIloCD11c+). Median expression of all parameters used was calculated and represented as a heat plot summary for each of these subsets (Fig. 1b). The relative frequencies of these populations
were similar to frequencies obtained by traditional fluorescence flow cytometry (Fig. 1c and Supplementary Table 2). These data show that mass cytometry can be used to identify expected lung myeloid cell populations with frequencies comparable to that observed using fluorescence flow cytometry.
Manual versus automated cell population identificationTo capture and allow visualization of all myeloid cell subsets in a single plot, we used nonlinear dimensionality reduction in conjunction with an updated clustering algorithm. As it is particularly powerful in its ability to reduce dimensionality of mass cytometry data while main-taining the overall data structure, we used t-distributed stochastic lin-ear embedding (tSNE)22,24. Incorporating all relevant parameters for each cell, this method plots cells with more similar properties closer together, which creates a two-dimensional map that can be interpreted on the basis of the locations of each type of cell being studied. Density peak–detection algorithms can be used in conjunction to identify the density center of distinct subsets on the basis of the map created by tSNE23. Extending this approach, we incorporated machine learning– aided clustering into a method called ‘density-based clustering aided by support vector machine’ (DensVM), which automatically assigns each cell to a cluster to objectively delineate and quantify popula-tions (Online Methods and Supplementary Fig. 2). We used biased gating such as that for lung (Fig. 1) to superimpose known cellular entities over the tSNE plots (Fig. 2). Alternatively, we used automatic DensVM-based subset definitions to objectively delineate populations of cells. Notably, whereas traditional biased gating strategies allowed for identification of only 54.7 ± 2.6% (mean ± s.e.m., n = 3 mice) of lung myeloid cells (different DC subsets, macrophages, monocytes, neutrophils), the automatic, computational approach identified nearly 100% of the cells (96.6 ± 1.0% (mean ± s.e.m., n = 3 mice) accounted for by 14 predominant clusters). Traditional gating schemes accounted for a higher relative fraction of cells in other tissues, such as bone mar-row, than in the lung (Fig. 2c). However, it was also clear from these analyses that neutrophils and monocytes in particular were phenotypi-cally highly heterogeneous, as indicated by their broad distributions on the tSNE plots (Fig. 2), which was less apparent by manual gating.
Because tSNE maps cellular phenotypes from a stochastic starting point, and because it works by representing the data optimally for the specific input, we ran the same analysis on four independently collected data sets (and many more if pilot experiments done dur-ing panel optimization are included). As we expected, the maps of these alternative data sets could not be easily compared using cur-rently available tools. However, the approach maintained the overall relationships of cell subsets and gross identities of the delineated cell populations. For example, in an alternative data set including four mice and six of the eight tissues analyzed for the main set (excluding kidney and thymus), we observed an alternative mapping. However, the same subsets of cells were delineated as expected (Supplementary Fig. 3). Taken together, these data show that high-dimensional tSNE analysis coupled with automated cell-cluster detection can effectively delineate expected myeloid populations and rapidly identify popula-tions missed during analysis with biased gating strategies.
tSNE-guided cell subset identification and validationA major portion of the unidentified cells fell into three distinct clus-ters (Fig. 2a,b). We also found similar patterns of the same three populations in lung, spleen, bone marrow and liver (Supplementary Fig. 4). To characterize these three unknown populations, we used tSNE and DensVM to determine the cells’ phenotypes and then used stand-ard biaxial plots to interrogate marker expression and identify each
npg
© 2
014
Nat
ure
Am
eric
a, In
c. A
ll rig
hts
rese
rved
.

nature immunology VOLUME 15 NUMBER 12 DECEMBER 2014 1183
r e s o u r c e
population’s defining features (Supplementary Table 3). On this basis, we developed a gating strategy that allowed us to identify these popula-tions through both mass cytometry (Fig. 3a) and fluorescence-based flow cytometry (Fig. 3b). To validate that these manual gating strate-gies, based on a small number of markers, were accurate and specific in identifying populations delineated by the tSNE and DensVM auto-mated gating approach (based on all markers probed), we calculated the purity (the percentage of automatically delineated cells present within the final manual gate) and yield (percentage of automatically deline-ated cells accounted for by the manual gating strategy) of manually gated cells on the basis of mass cytometric analysis using the tSNE and DensVM approach for three mice. For the purposes of validating the identities of ambiguous clusters of cells, we optimized purity at the expense of yield (cell clusters were isolated with >85% purity). For the lung, we used additional specific surface markers to verify unam-biguously the identity of cluster 6 as Siglec-Fhi and SSChi eosinophils, cluster 8 as Ly6CloCD43+ monocytes and cluster 28 as a CD11blo stage of NKp46+NK1.1+ natural killer (NK) cells. We further confirmed the identities of these populations on the basis of their morphologies through sorting and Giemsa staining (Fig. 3b,c and Supplementary Fig. 5a). Although they fall outside of our working definition of myeloid cells, we were not surprised to find that innate lymphocytes such as NK cells were included in this analysis, as they do not express signal- transduction receptor CD19 or the glycoprotein CD90. However, even without the use of optimal markers to specifically identify innate lymphocytes, this higher-order analysis was able to recognize innate lymphoid cells, as confirmed by flow cytometry (Fig. 3b), underlin-ing the power of this approach. Taken together, these results indicate that unbiased automatic gating is able to identify cell clusters, even if subtype-specific markers are not included in the analysis.
Comparison of granulocytic subsets across tissuesWe observed notable phenotypic variations in tSNE mapping of neu-trophil and eosinophil subsets, most strikingly in the bone marrow.
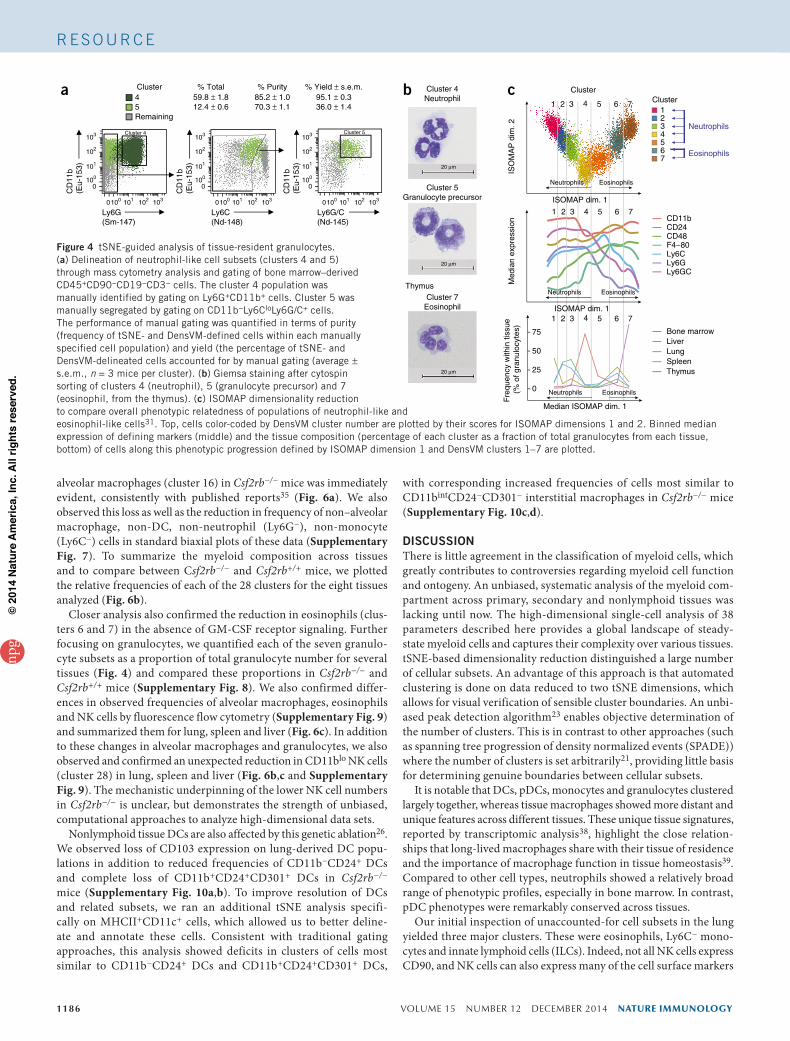
In particular, cells in cluster 5 had an ambiguous phenotype, with tSNE coordinates falling in a region located between neutrophil, eosi-nophil and monocyte clusters (Fig. 2c). We used mass cytometry data and tSNE analysis (Fig. 3a) to devise a gating strategy to distin-guish clusters 4 and 5 (we also calculated purity and yield to validate the ability to specifically isolate automatically delineated clusters of cells by this manual approach; Fig. 4a) that was used to flow-sort and Giemsa stain representative cells from clusters 4 and 5, as well as Ly6C+ monocytes (clusters 11 and 12) as a control (Fig. 4b and Supplementary Fig. 5b). The nuclear morphologies of cells in cluster 5 were uniformly doughnut shaped, consistent with those of granulo-cyte precursors27–29. Cells from cluster 4 (Ly6G+, Ly6C−, Ly6C/G+, see Supplementary Table 2 for marker descriptions) showed more diverse polymorphonuclear morphologies, consistent with more differentiated neutrophils27–29.
We did a similar analysis for cells in cluster 7, which were most phenotypically similar to cluster 6 (Fig. 3) and most prevalent in the thymus (CD11c+, CD11b+, Ly6C+, Ly6G− and Ly6G/Clo). Giemsa staining of representative cells of bone marrow and thymus showed polymorphonuclear morphology (Fig. 4b and Supplementary Fig. 5c) and additional fluorescent flow cytometry analysis showed that this thymus-derived cluster of cells also expresses Siglec-F, a hallmark of eosinophils (Supplementary Fig. 5d). These thymic eosinophils were the most abundant resident granulocytes in the thymus (Fig. 4b) and matched the distinct morphology and pheno-typic profile reported for thymus-resident eosinophils30.
To assess the relationships among the granulocyte subsets, we did additional analysis using an alternative dimensionality-reduction method called isometric mapping (ISOMAP)31, which is similar to linear principal component analysis (PCA) in its ability to compare overall relatedness of cells but better able to explain variation by tak-ing into account nonlinear geodesic distances between pairs of cells (instead of Euclidean distance, used in standard PCA). tSNE, by con-trast, initially places cells in random locations of low-dimensional
0
2
4
6
BS
T2
(Gd-
156)
B220(Nd-143)
MH
CII
(Nd-
142)
CD11c(Dy-163)
CD
24(Y
b-17
4)
CD11b(Eu-153)
CD24(Yb-174)
Ly6C
(Nd-
148)
Ly6G(Sm-147)
CD45+CD90–CD19–
CD3– live gate MHCII+CD11c+ CD11b+BST2–B220–
MHCII–CD11c–
0.5
99.5
3.8
86.1 9.5
16.3
67 43 53
99.5
20
32 32
a b
0 1 2 3
Median expression
Neutrophils
Monocytes
pDCs
Alveolarmacrophages
CD103+ DCs
Interstitialmacrophages
CD11b+ DCs
BS
T2
Sig
lecH
B22
0Ly
6CC
D11
cM
HC
2C
D11
bC
D10
3E
SA
MC
D4
CD
8S
IRP
aC
D24
CD
301
CD
64M
erT
KF
480
CC
R2
Fce
RC
D11
5C
D86
PD
L1P
DL2
CD
54Ly
6GLy
6GC
Cd6
2LC
D11
aC
D25
CD
38C
D44
CD
48T
err1
19
0
0
100
100
101
101
102
102
103
1030100 101
101
102
102
103
103
CD24–CD11b+
CD24+CD11b+
CD24+
CD103(Dy-164)0
0
100
100
101
101
102
102
103
103
0100 101 102 1030100 101 102 103
0100
0100
0100
101
102
103
101
102
103
c
0
Alveola
r
mac
roph
ages
Inte
rstiti
al
mac
roph
ages
CD103+ D
Cs
CD11b+ D
CspD
Cs
Neutro
phils
Ly6C
+ mon
ocyte
s
1
2
10
20
30
CyTOFFlow cytometry
Fre
quen
cy (
%)
Figure 1 Mass cytometry analysis of mouse lung myeloid cell subsets defined by traditional criteria. (a) Sequential gating strategy to identify lung myeloid cell subsets defined in published reports. pDCs (BST2+ B220+) were first identified from a CD45+CD90−CD19−CD3− non-T non-B gate. Remaining cells were separated using CD11c and MHCII. Alveolar macrophages were identified as MHCII−CD11chi DCs as MHCII+CD11c+. MHCII−CD11c− cells were further stratified to identify Ly6C+Ly6G−monocytes and Ly6C−Ly6G+ neutrophils. Three populations of DCs were identified on the basis of CD24 and CD11b expression: CD24+CD103+CD11b−, CD24−CD103−CD11b+ interstitial macrophages and CD24+CD103−CD11b+ DCs. Bottom right, histogram of CD103 expression in DC and macrophage subsets. (b) Heat-plot summary of median expression of all cellular markers measured for traditionally defined subsets. (c) Mean frequencies of each subset obtained by mass cytometry (CyTOF) or through a similar gating strategy by fluorescence flow cytometry (mean and s.e.m., n = 3 mice).
npg
© 2
014
Nat
ure
Am
eric
a, In
c. A
ll rig
hts
rese
rved
.

1184 VOLUME 15 NUMBER 12 DECEMBER 2014 nature immunology
r e s o u r c e
space and then adjusts the locations iteratively, which preserves local geometry and gives rise to stochastic global geometry. This seems to make tSNE less useful for deriving meaningful information about the relatedness between distant cell subsets (J.C., M. Wong, S. Narayanan, W. Lin, R. Anicete, H.T.K Kiaang et al., unpublished data). By ISOMAP analysis, we observed several markers that change during differentia-tion and correspond with apparent granulocyte maturation, including a V-shape branched relationship between eosinophils and neutrophils
bifurcating from bone marrow–resident cells with precursor- like phenotypes and morphologies (Fig. 4c). Along this phenotypic progression, thymic eosinophils were distinct and less similar to granu-locytic precursors (more distant on ISOMAP coordinates 1 and 2) than eosinophils derived from other tissues. We observed a similar branched relatedness among granulocyte precursors, neutrophils and eosi-nophils in the tSNE representation (Fig. 5). Taken together, the results of the high-dimensional analysis described here provide a snapshot
6
258
Cluster % ± s.e.m.
Rem.
25
22
18
12
11
8
6
5
4
3
2
1
t-S
NE
dim
. 2
t-SNE dim. 1
1.4 ± 0.1
2.1 ± 0.6
2.7 ± 0.3
59.8 ± 1.8
12.4 ± 0.6
2.9 ± 0.4
1.3 ± 0.1
2.9 ± 0.2
9.31 ± 0.2
0.5 ± 0.0
2.0 ± 0.5
1.9 ± 0.2
0.8 ± 0.2
5
Automatic annotationc
Manual gate % ± s.e.m.
Remaining
pDCs
CD24+CD8+ DCs
CD11b+ DCs
Ly6C+ monocytes
Ly6C– monocytes
Neutrophils
t-S
NE
dim
. 2
t-SNE dim. 1
70.5 ± 1.6
1.0 ± 0.1
10.6 ± 0.4
0.3 ± 0.1
0.02 ± 0.0
1.5 ± 0.4
15.9 ± 1.0
Biased annotation
Cluster
Rem.2825222120191815141211865321
6 28
8 25
14
15
t-S
NE
dim
. 2
t-SNE dim. 1
% ± s.e.m.
1.9 ± 0.57.3 ± 1.96.2 ± 0.91.2 ± 0.44.5 ± 0.55.9 ± 0.813.2 ± 1.03.5 ± 0.75.6 ± 0.81.5 ± 0.52.2 ± 0.317.0 ± 2.81.2 ± 0.25.6 ± 0.43.3 ± 0.61.6 ± 0.214.8 ± 1.13.6 ± 0.3
Automatic annotation
t-S
NE
dim
. 2t-SNE dim. 1
6 28
8
16
Cluster
Rem.
28
22
21
20
18
16
12
11
8
6
4
3
2
1
% ± s.e.m.
2.3 ± 0.9
11.2 ± 3.5
12.5 ± 0.7
1.4 ± 0.5
3.6 ± 0.4
12.2 ± 0.8
21.4 ± 0.7
2.2 ± 0.04
11.7 ± 1.0
3.5 ± 0.3
0.66 ± 0.14
0.77 ± 0.1
1.2 ± 0.5
12.0 ± 0.6
3.40 ± 1.0
Automatic annotationa
Manual gate % ± s.e.m.
Remaining
pDCsCD103+ DCs
CD11b+ DCs
Inter. macrophages
Alv. macrophages
Monocytes
Neutrophils
t-S
NE
dim
. 2
t-SNE dim. 1
21.3 ± 3.7
18.5 ± 0.9
11 ± 0.9
1.0 ± 0.1
1.1 ± 0.2
0.8 ± 0.1
1 ± 0.5
45.3 ± 2.6
Biased annotation
b
Manual gate % ± s.e.m.
Remaining
pDCs
CD8a+ DCs
CD4+CD11b+ DCs
CD4–CD11b+ DCs
Red pulp macrophages
Ly6C+ monocytes
Neutrophils
t-S
NE
dim
. 2
t-SNE dim. 1
15.4 ± 2
14.6 ± 1.5
5.4 ± 0.7
6.5 ± 1.1
10.2 ± 1.5
4.04 ± 0.3
2.8 ± 0.6
41 ± 0.8
Biased annotation
Figure 2 tSNE analysis objectively delineates myeloid cell subsets of lung, spleen and bone marrow. (a–c) tSNE composite dimensions (dim.) 1 and 2 for cells derived from lung (a), spleen (b) and bone marrow (c). Left, cells grouped according to biased (traditional) definitions with gating strategies similar to that described in Figure 1. Remaining cells (gray) are those unaccounted for by these definitions; predominant unidentified clusters are indicated with arrows. Right, cells are grouped according to automatic (unbiased) cluster designation. Predominant clusters (frequencies >1%) including those that correspond to subsets not accounted for by traditional gating are labeled with cluster numbers. Average frequencies (± s.e.m., n = 3 mice) as percentage of total CD45+CD90−CD19−CD3− population are shown for each subset. Alv., alveolar; inter., interstitial; rem., remaining.
npg
© 2
014
Nat
ure
Am
eric
a, In
c. A
ll rig
hts
rese
rved
.

nature immunology VOLUME 15 NUMBER 12 DECEMBER 2014 1185
r e s o u r c e
of progressive phenotypic changes that occur between tissues and seem to be associated with granulocyte maturation and differentia-tion. However, because this is only a snapshot, granulocyte maturation and differentiation do not necessarily follow this particular phenotypic progression, and alternatives cannot be formally excluded.
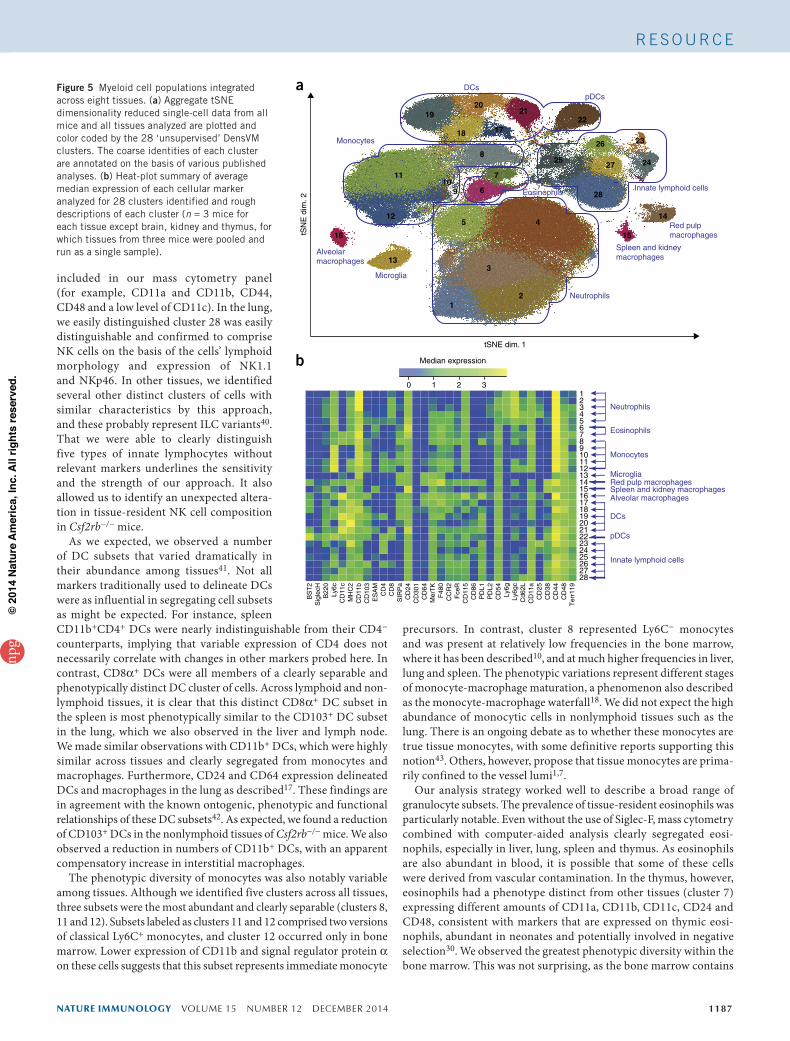
Profile of myeloid cell heterogeneity across tissuesAfter applying tSNE-based dimensionality reduction together with DensVM eight tissues (lung, spleen, mesenteric lymph nodes, liver, thymus, brain, kidney and bone marrow), we assembled a composite data set into a comprehensive display of cellular phenotypes spanning all tissues (Fig. 5a). Within this aggregate, derived from eight tissues from six mice analyzed in this study, we identified a total of 28 clus-ters. For this plot (Fig. 5a), we ignored the tissue origin and treated cells from each tissue equally, which provides a comprehensive view of myeloid cell phenotypes across all tissues analyzed. Although some clusters represented cells derived from a single tissue, such as brain microglia and lung alveolar macrophages, most other clusters were composed of cells derived from several tissues with overlapping tSNE coordinates. Individual cells within each of these clusters could then be quantified on a mouse-by-mouse and/or tissue-by-tissue basis. We quantified the median intensities of each marker probed and com-pared them for each cluster using heat-plot visualization (Fig. 5b). Notably, some cell subsets, such as pDCs, had highly consistent phenotypes across tissues, whereas other cell types, such as
neutrophils, showed a remarkable phenotypic diversity among tissues. It is also notable that particular tissue-resident macrophage subsets, such as alveolar macrophages, microglia and red-pulp macrophages, were well separated from each other. This demonstrates that this higher-order analysis clearly distinguishes these subsets without the use of markers normally used to define them.
Analysis of Csf2rb-dependent myeloid cells across tissuesTo test the utility of this method for ‘unsupervised’ comparative analy-sis, we used mice that lack the Csf2rb gene and thus the ability to form the heterodimeric granulocyte macrophage (GM)–colony stimulat-ing factor (GM-CSF) receptor. In contrast to granulocyte (G)-CSF (encoded by Csf3) and macrophage colony (M)-CSF (encoded by Csf1), the lack of which causes major developmental malformations in mice, GM-CSF (encoded by Csf2) is primarily a proinflammatory cytokine produced by effector lymphocytes32,33. In the steady state, Csf2 is expressed at low levels and in discrete populations of stromal cells34. The absence of Csf2 during development affects the genesis and perhaps maturation of alveolar macrophages in the lung35 and the development of some nonlymphoid tissue DCs26,36. And as Csf2rb is a component of the interleukin 5 (IL-5) receptor, Csf2rb−/− mice also have fewer eosinophils37. Here we compared the myeloid pop-ulations from Csf2rb−/− and Csf2rb+/+ mice for the eight tissues as described above. Plots for individual mice are shown for lung (Fig. 6a), bone marrow, spleen and liver (Supplementary Fig. 6). The loss of
CD11c+ (cluster 8)CD24+ (cluster 6)
CD11bint (cluster 28)F4/80+CD11b+
Cluster 28Ly6C
Ly6G
F4/
80
CD11b
CD
11c
CD24
% o
f max
NK1.1
c
20 µm 20 µm 20 µm
Cluster 6Eosinophil
Cluster 8Ly6Clo monocyte
Cluster 28NK cell
% o
f max
NKp46
% o
f max
CD43
% o
f max
Siglec-F
Cluster 8
Cluster 6
0
20
40
60
80
100
0
20
40
60
80
100
0
20
40
60
80
100
0
20
40
60
80
100
105
104
103
0
105
104
103
0
105
104
103
0
bCD45+ live singlets
MH
CII
CD11c
105
104
103
0
1051041030 1051041030 1051041030 1051041030
aM
HC
II (N
d-14
2)
CD45+ CD90–
CD19– live singlets
CD11c (Dy-163)
103
102
101
100
0
1031021011000
1051041031020 1051041031020 105104103 1051041031020 0
Ly6C
(N
d-14
8)
Ly6G (Sm-147)
103
102
101
100
0
1031021011000
28
F4/
80 (
Tb-
159)
CD11b (Eu-153)
103
102
101
100
0
1031021011000
6
8
CD
11c
(Dy-
163)
CD24 (Yb-174)
103
102
101
100
0
1031021011000
Cluster
Remaining
28
8
6
% Total
12.0 ± 0.6
12.2 ± 0.8
3.6 ± 0.4
% Purity
88.9 ± 1.1
89.3 ± 0.7
96.5 ± 1.3
% Yield ± s.e.m.
80.8 ± 2.5
69.8 ± 1.7
86.8 ± 2.2
Flow cytometry
CyTOF
Figure 3 tSNE-guided analysis of ambiguous lung cell populations. (a) Three major subsets of ambiguous lung-derived cells were identified by tSNE and automated clustering. Clusters 6, 8 and 28 are shown in orange, blue and black, respectively; ungrouped cells (remaining) are shown in gray. MHCII−CD11clo−neg cells were gated, and Ly6C+ monocytes and Ly6G+ neutrophils were excluded. CD11bint cells were almost exclusively composed of cluster 28 cells. Clusters 6 and 8 were excluded by differential expression of CD11c and CD24. Average frequencies (± s.e.m., n = 3 mice) as a percentage of all CD45+CD90−CD19−CD3− cells are shown for each subset. Purity was defined for each cluster by the frequency of tSNE-defined cells in each manually specified cell cluster. Yield was defined by the percentage of tSNE-delineated cells accounted for by the manual gating scheme (average ± s.e.m., n = 3 mice). (b) Isolation and further interrogation of cell subsets by fluorescence flow cytometry using a similar gating strategy as in a. Cluster 28 was identified as CD11bint and found to express mostly NK1.1 and NKp46. F4/80+CD11b+ cells were further segregated by CD11c and CD24 expression to isolate clusters 8 and 6, respectively. Most of the cells in cluster 6 were found to express high amounts of Siglec-F. Cells in cluster 8 expressed CD43. (c) Giemsa staining after cytospin sorting of clusters 6, 8 and 28.
npg
© 2
014
Nat
ure
Am
eric
a, In
c. A
ll rig
hts
rese
rved
.
1186 VOLUME 15 NUMBER 12 DECEMBER 2014 nature immunology
r e s o u r c e
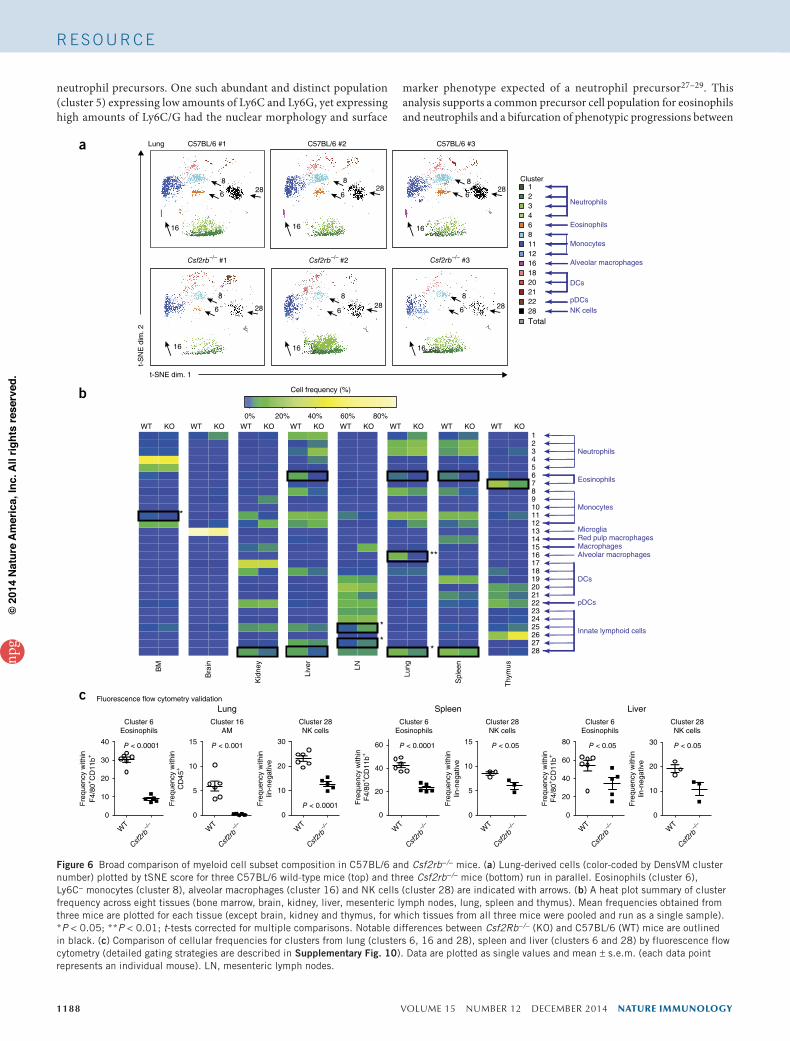
alveolar macrophages (cluster 16) in Csf2rb−/− mice was immediately evident, consistently with published reports35 (Fig. 6a). We also observed this loss as well as the reduction in frequency of non–alveolar macrophage, non-DC, non-neutrophil (Ly6G−), non-monocyte (Ly6C−) cells in standard biaxial plots of these data (Supplementary Fig. 7). To summarize the myeloid composition across tissues and to compare between Csf2rb−/− and Csf2rb+/+ mice, we plotted the relative frequencies of each of the 28 clusters for the eight tissues analyzed (Fig. 6b).
Closer analysis also confirmed the reduction in eosinophils (clus-ters 6 and 7) in the absence of GM-CSF receptor signaling. Further focusing on granulocytes, we quantified each of the seven granulo-cyte subsets as a proportion of total granulocyte number for several tissues (Fig. 4) and compared these proportions in Csf2rb−/− and Csf2rb+/+ mice (Supplementary Fig. 8). We also confirmed differ-ences in observed frequencies of alveolar macrophages, eosinophils and NK cells by fluorescence flow cytometry (Supplementary Fig. 9) and summarized them for lung, spleen and liver (Fig. 6c). In addition to these changes in alveolar macrophages and granulocytes, we also observed and confirmed an unexpected reduction in CD11blo NK cells (cluster 28) in lung, spleen and liver (Fig. 6b,c and Supplementary Fig. 9). The mechanistic underpinning of the lower NK cell numbers in Csf2rb−/− is unclear, but demonstrates the strength of unbiased, computational approaches to analyze high-dimensional data sets.
Nonlymphoid tissue DCs are also affected by this genetic ablation26. We observed loss of CD103 expression on lung-derived DC popu-lations in addition to reduced frequencies of CD11b−CD24+ DCs and complete loss of CD11b+CD24+CD301+ DCs in Csf2rb−/− mice (Supplementary Fig. 10a,b). To improve resolution of DCs and related subsets, we ran an additional tSNE analysis specifi-cally on MHCII+CD11c+ cells, which allowed us to better deline-ate and annotate these cells. Consistent with traditional gating approaches, this analysis showed deficits in clusters of cells most similar to CD11b−CD24+ DCs and CD11b+CD24+CD301+ DCs,
with corresponding increased frequencies of cells most similar to CD11bintCD24−CD301− interstitial macrophages in Csf2rb−/− mice (Supplementary Fig. 10c,d).
DISCUSSIONThere is little agreement in the classification of myeloid cells, which greatly contributes to controversies regarding myeloid cell function and ontogeny. An unbiased, systematic analysis of the myeloid com-partment across primary, secondary and nonlymphoid tissues was lacking until now. The high-dimensional single-cell analysis of 38 parameters described here provides a global landscape of steady-state myeloid cells and captures their complexity over various tissues. tSNE-based dimensionality reduction distinguished a large number of cellular subsets. An advantage of this approach is that automated clustering is done on data reduced to two tSNE dimensions, which allows for visual verification of sensible cluster boundaries. An unbi-ased peak detection algorithm23 enables objective determination of the number of clusters. This is in contrast to other approaches (such as spanning tree progression of density normalized events (SPADE)) where the number of clusters is set arbitrarily21, providing little basis for determining genuine boundaries between cellular subsets.
It is notable that DCs, pDCs, monocytes and granulocytes clustered largely together, whereas tissue macrophages showed more distant and unique features across different tissues. These unique tissue signatures, reported by transcriptomic analysis38, highlight the close relation-ships that long-lived macrophages share with their tissue of residence and the importance of macrophage function in tissue homeostasis39. Compared to other cell types, neutrophils showed a relatively broad range of phenotypic profiles, especially in bone marrow. In contrast, pDC phenotypes were remarkably conserved across tissues.
Our initial inspection of unaccounted-for cell subsets in the lung yielded three major clusters. These were eosinophils, Ly6C− mono-cytes and innate lymphoid cells (ILCs). Indeed, not all NK cells express CD90, and NK cells can also express many of the cell surface markers
Figure 4 tSNE-guided analysis of tissue-resident granulocytes. (a) Delineation of neutrophil-like cell subsets (clusters 4 and 5) through mass cytometry analysis and gating of bone marrow–derived CD45+CD90−CD19−CD3− cells. The cluster 4 population was manually identified by gating on Ly6G+CD11b+ cells. Cluster 5 was manually segregated by gating on CD11b−Ly6CloLy6G/C+ cells. The performance of manual gating was quantified in terms of purity (frequency of tSNE- and DensVM-defined cells within each manually specified cell population) and yield (the percentage of tSNE- and DensVM-delineated cells accounted for by manual gating (average ± s.e.m., n = 3 mice per cluster). (b) Giemsa staining after cytospin sorting of clusters 4 (neutrophil), 5 (granulocyte precursor) and 7 (eosinophil, from the thymus). (c) ISOMAP dimensionality reduction to compare overall phenotypic relatedness of populations of neutrophil-like and eosinophil-like cells31. Top, cells color-coded by DensVM cluster number are plotted by their scores for ISOMAP dimensions 1 and 2. Binned median expression of defining markers (middle) and the tissue composition (percentage of each cluster as a fraction of total granulocytes from each tissue, bottom) of cells along this phenotypic progression defined by ISOMAP dimension 1 and DensVM clusters 1–7 are plotted.
npg
© 2
014
Nat
ure
Am
eric
a, In
c. A
ll rig
hts
rese
rved
.
nature immunology VOLUME 15 NUMBER 12 DECEMBER 2014 1187
r e s o u r c e
included in our mass cytometry panel (for example, CD11a and CD11b, CD44, CD48 and a low level of CD11c). In the lung, we easily distinguished cluster 28 was easily distinguishable and confirmed to comprise NK cells on the basis of the cells’ lymphoid morphology and expression of NK1.1 and NKp46. In other tissues, we identified several other distinct clusters of cells with similar characteristics by this approach, and these probably represent ILC variants40. That we were able to clearly distinguish five types of innate lymphocytes without relevant markers underlines the sensitivity and the strength of our approach. It also allowed us to identify an unexpected altera-tion in tissue-resident NK cell composition in Csf2rb−/− mice.
As we expected, we observed a number of DC subsets that varied dramatically in their abundance among tissues41. Not all markers traditionally used to delineate DCs were as influential in segregating cell subsets as might be expected. For instance, spleen CD11b+CD4+ DCs were nearly indistinguishable from their CD4− counterparts, implying that variable expression of CD4 does not necessarily correlate with changes in other markers probed here. In contrast, CD8α+ DCs were all members of a clearly separable and phenotypically distinct DC cluster of cells. Across lymphoid and non-lymphoid tissues, it is clear that this distinct CD8α+ DC subset in the spleen is most phenotypically similar to the CD103+ DC subset in the lung, which we also observed in the liver and lymph node. We made similar observations with CD11b+ DCs, which were highly similar across tissues and clearly segregated from monocytes and macrophages. Furthermore, CD24 and CD64 expression delineated DCs and macrophages in the lung as described17. These findings are in agreement with the known ontogenic, phenotypic and functional relationships of these DC subsets42. As expected, we found a reduction of CD103+ DCs in the nonlymphoid tissues of Csf2rb−/− mice. We also observed a reduction in numbers of CD11b+ DCs, with an apparent compensatory increase in interstitial macrophages.
The phenotypic diversity of monocytes was also notably variable among tissues. Although we identified five clusters across all tissues, three subsets were the most abundant and clearly separable (clusters 8, 11 and 12). Subsets labeled as clusters 11 and 12 comprised two versions of classical Ly6C+ monocytes, and cluster 12 occurred only in bone marrow. Lower expression of CD11b and signal regulator protein α on these cells suggests that this subset represents immediate monocyte
precursors. In contrast, cluster 8 represented Ly6C− monocytes and was present at relatively low frequencies in the bone marrow, where it has been described10, and at much higher frequencies in liver, lung and spleen. The phenotypic variations represent different stages of monocyte-macrophage maturation, a phenomenon also described as the monocyte-macrophage waterfall18. We did not expect the high abundance of monocytic cells in nonlymphoid tissues such as the lung. There is an ongoing debate as to whether these monocytes are true tissue monocytes, with some definitive reports supporting this notion43. Others, however, propose that tissue monocytes are prima-rily confined to the vessel lumi1,7.
Our analysis strategy worked well to describe a broad range of granulocyte subsets. The prevalence of tissue-resident eosinophils was particularly notable. Even without the use of Siglec-F, mass cytometry combined with computer-aided analysis clearly segregated eosi-nophils, especially in liver, lung, spleen and thymus. As eosinophils are also abundant in blood, it is possible that some of these cells were derived from vascular contamination. In the thymus, however, eosinophils had a phenotype distinct from other tissues (cluster 7) expressing different amounts of CD11a, CD11b, CD11c, CD24 and CD48, consistent with markers that are expressed on thymic eosi-nophils, abundant in neonates and potentially involved in negative selection30. We observed the greatest phenotypic diversity within the bone marrow. This was not surprising, as the bone marrow contains
b
BS
T2
Sig
lecH
B22
0Ly
6cC
D11
cM
HC
2C
D11
bC
D10
3E
SA
MC
D4
CD
8S
IRP
aC
D24
CD
301
CD
64M
erT
KF
480
CC
R2
Fce
RC
D11
5C
D86
PD
L1P
DL2
CD
54Ly
6gLy
6gc
Cd6
2LC
D11
aC
D25
CD
38C
D44
CD
48T
err1
192827262524232221201918171615141312111098
54321
Median expression
76
0 1 2 3
pDCs
Neutrophils
Monocytes
Innate lymphoid cells
DCs
Microglia
Alveolar macrophages
Red pulp macrophagesSpleen and kidney macrophages
Eosinophils
16
1011
12
13
19
18
1
9
5
20
22
258
17
7
6
21
3
28
27
26
2
4
23
15
24
14
a
Microglia
Alveolar macrophages
Neutrophils
pDCs
Monocytes
Eosinophils
DCs
Innate lymphoid cells
Red pulpmacrophages
Spleen and kidneymacrophages
tSNE dim. 1
tSN
E d
im. 2
Figure 5 Myeloid cell populations integrated across eight tissues. (a) Aggregate tSNE dimensionality reduced single-cell data from all mice and all tissues analyzed are plotted and color coded by the 28 ‘unsupervised’ DensVM clusters. The coarse identities of each cluster are annotated on the basis of various published analyses. (b) Heat-plot summary of average median expression of each cellular marker analyzed for 28 clusters identified and rough descriptions of each cluster (n = 3 mice for each tissue except brain, kidney and thymus, for which tissues from three mice were pooled and run as a single sample).
npg
© 2
014
Nat
ure
Am
eric
a, In
c. A
ll rig
hts
rese
rved
.
1188 VOLUME 15 NUMBER 12 DECEMBER 2014 nature immunology
r e s o u r c e
neutrophil precursors. One such abundant and distinct population (cluster 5) expressing low amounts of Ly6C and Ly6G, yet expressing high amounts of Ly6C/G had the nuclear morphology and surface
marker phenotype expected of a neutrophil precursor27–29. This analysis supports a common precursor cell population for eosinophils and neutrophils and a bifurcation of phenotypic progressions between
b
a
t-SNE dim. 1
t-S
NE
dim
. 2C57BL/6 #1 C57BL/6 #2 C57BL/6 #3
Csf2rb–/– #1 Csf2rb–/– #2 Csf2rb–/– #3
16
8
628
16
8
628
16
8
628
16
8
6 28
16
8
628
16
8
6 28
Cluster
pDCs
Alveolar macrophages
Neutrophils
Monocytes
NK cells
DCs
Eosinophils
Total2822212018161211864321
Lung
BM
Bra
in
Kid
ney
Live
r
LN
Lung
Spl
een
Thy
mus
0% 20% 40% 60% 80%WT KO WT KO WT KO WT KO WT KO WT KO WT KO WT KO
28272625242322212019181716151413121110987654321
**
*
*
*
*
Cell frequency (%)
Microglia
pDCs
Alveolar macrophages
Neutrophils
Monocytes
Innate lymphoid cells
Red pulp macrophages
DCs
Macrophages
Eosinophils
c Fluorescence flow cytometry validationLung
0
10
20
30
40
Cluster 6Eosinophils
Fre
quen
cy w
ithin
F4/
80+C
D11
b+
P < 0.0001
Csf2rb–/
–W
T0
5
10
15
Cluster 16AM
Fre
quen
cy w
ithin
CD
45+
P < 0.001
Csf2rb–/
–W
T
Cluster 28NK cells
Fre
quen
cy w
ithin
lin-n
egat
ive
P < 0.00010
10
20
30
Csf2rb–/
–W
T
Spleen
0
20
40
60
Cluster 6Eosinophils
P < 0.0001
Fre
quen
cy w
ithin
F4/
80+C
D11
b+
Csf2rb–/
–W
T
Cluster 28NK cells
Fre
quen
cy w
ithin
lin-n
egat
ive
P < 0.05
0
5
10
15
Csf2rb–/
–W
T
Liver
Cluster 6Eosinophils
Fre
quen
cy w
ithin
F4/
80+C
D11
b+
P < 0.05
0
20
40
60
80
Csf2rb–/
–W
T
Cluster 28NK cells
Fre
quen
cy w
ithin
lin-n
egat
ive
P < 0.05
0
10
20
30
Csf2rb–/
–W
T
Figure 6 Broad comparison of myeloid cell subset composition in C57BL/6 and Csf2rb−/− mice. (a) Lung-derived cells (color-coded by DensVM cluster number) plotted by tSNE score for three C57BL/6 wild-type mice (top) and three Csf2rb−/− mice (bottom) run in parallel. Eosinophils (cluster 6), Ly6C− monocytes (cluster 8), alveolar macrophages (cluster 16) and NK cells (cluster 28) are indicated with arrows. (b) A heat plot summary of cluster frequency across eight tissues (bone marrow, brain, kidney, liver, mesenteric lymph nodes, lung, spleen and thymus). Mean frequencies obtained from three mice are plotted for each tissue (except brain, kidney and thymus, for which tissues from all three mice were pooled and run as a single sample). *P < 0.05; **P < 0.01; t-tests corrected for multiple comparisons. Notable differences between Csf2Rb−/− (KO) and C57BL/6 (WT) mice are outlined in black. (c) Comparison of cellular frequencies for clusters from lung (clusters 6, 16 and 28), spleen and liver (clusters 6 and 28) by fluorescence flow cytometry (detailed gating strategies are described in Supplementary Fig. 10). Data are plotted as single values and mean ± s.e.m. (each data point represents an individual mouse). LN, mesenteric lymph nodes.
npg
© 2
014
Nat
ure
Am
eric
a, In
c. A
ll rig
hts
rese
rved
.
nature immunology VOLUME 15 NUMBER 12 DECEMBER 2014 1189
r e s o u r c e
subsets of these cells. In addition, ablation of GM-CSF receptor signal-ing resulted in reduction specifically in the eosinophil branch.
Here we show that the use of 38 cellular markers and an unbiased computational approach allows resolution and objective comparison of all established mouse myeloid cell subsets in the steady state across eight different tissues, including populations whose defining mark-ers were not included in the panel. Thus, we propose that increasing the number of parameters beyond what we have done here may not uncover previously unknown additional specialized populations, but rather better describe already known populations and their specific functions. These data might serve as a map of the entire steady-state myeloid landscape and form the basis for a unified approach to studying the development, relationships and the precise function of each population.
METHODSMethods and any associated references are available in the online version of the paper.
Note: Any Supplementary Information and Source Data files are available in the online version of the paper.
ACKNoWLEDGMENTSThe authors thank the SIgN community, the SIgN Flow Cytometry Facility and members of E.W.N.’s, F.G.’s and B.B.’s labs, and L.G. Ng for helpful discussion. Some antibodies used for generating the mass cytometry panels were provided by R. Balderas and A. Tiong (Becton Dickinson). The antibodies generated by BioXcell were provided for this analysis free of charge. B.B. performed this work while on sabbatical at A*STAR/SIgN. Supported by A*STAR/SIgN (P.R.-C., F.G., M.P., E.W.N.) and the Swiss National Science Foundation (PP03P3_144781 (M.G.), 316030_150768, 310030_146130 and CRSII3_136203 (B.B.)), European Union FP7 project TargetBraIn, NeuroKine, Advanced T-cell Engineered for Cancer Therapy (ATECT) and the University Research Priority Project ‘Translational Cancer Research’ (B.B.).
AUTHoR CoNTRIBUTIoNSE.W.N. and B.B. designed the experiments and directed the study jointly. B.B., A.S., F.M., H.S., K.T., and D.L. performed the experiments. B.B., A.S., J.C., F.M., H.S., K.T., M.G., F.G. and E.W.N. analyzed the data and generated the figures. C.R., P.R.-C., M.P. and M.G. provided reagents and/or critical analysis support. B.B., F.G., A.S., J.C. and E.W.N. wrote the manuscript.
CoMPETING FINANCIAL INTERESTSThe authors declare no competing financial interests.
reprints and permissions information is available online at http://www.nature.com/reprints/index.html.
1. Geissmann, F. et al. Development of monocytes, macrophages, and dendritic cells. Science 327, 656–661 (2010).
2. Hildner, K. et al. Batf3 deficiency reveals a critical role for CD8α+ dendritic cells in cytotoxic T cell immunity. Science 322, 1097–1100 (2008).
3. Edelson, B.T. et al. Peripheral CD103+ dendritic cells form a unified subset developmentally related to CD8α+ conventional dendritic cells. J. Exp. Med. 207, 823–836 (2010).
4. Chitu, V. & Stanley, E.R. Colony-stimulating factor-1 in immunity and inflammation. Curr. Opin. Immunol. 18, 39–48 (2006).
5. Ginhoux, F. & Jung, S. Monocytes and macrophages: developmental pathways and tissue homeostasis. Nat. Rev. Immunol. 14, 392–404 (2014).
6. Merad, M., Sathe, P., Helft, J., Miller, J. & Mortha, A. The dendritic cell lineage: ontogeny and function of dendritic cells and their subsets in the steady state and the inflamed setting. Annu. Rev. Immunol. 31, 563–604 (2013).
7. Schulz, C. et al. A lineage of myeloid cells independent of Myb and hematopoietic stem cells. Science 336, 86–90 (2012).
8. Hashimoto, D., Miller, J. & Merad, M. Dendritic cell and macrophage heterogeneity in vivo. Immunity 35, 323–335 (2011).
9. Bogunovic, M. et al. Origin of the lamina propria dendritic cell network. Immunity 31, 513–525 (2009).
10. Yona, S. et al. Fate mapping reveals origins and dynamics of monocytes and tissue macrophages under homeostasis. Immunity 38, 79–91 (2013).
11. Zigmond, E. et al. Ly6Chi monocytes in the inflamed colon give rise to proinflammatory effector cells and migratory antigen-presenting cells. Immunity 37, 1076–1090 (2012).
12. Varol, C. et al. Intestinal lamina propria dendritic cell subsets have different origin and functions. Immunity 31, 502–512 (2009).
13. Serbina, N.V., Salazar-Mather, T.P., Biron, C.A., Kuziel, W.A. & Pamer, E.G. TNF/iNOS-producing dendritic cells mediate innate immune defense against bacterial infection. Immunity 19, 59–70 (2003).
14. Filipazzi, P., Huber, V. & Rivoltini, L. Phenotype, function and clinical implications of myeloid-derived suppressor cells in cancer patients. Cancer Immunol. Immunother. 61, 255–263 (2012).
15. Gabrilovich, D.I. & Nagaraj, S. Myeloid-derived suppressor cells as regulators of the immune system. Nat. Rev. Immunol. 9, 162–174 (2009).
16. Plantinga, M. et al. Conventional and monocyte-derived CD11b+ dendritic cells initiate and maintain T helper 2 cell-mediated immunity to house dust mite allergen. Immunity 38, 322–335 (2013).
17. Schlitzer, A. et al. IRF4 transcription factor-dependent CD11b+ dendritic cells in human and mouse control mucosal IL-17 cytokine responses. Immunity 38, 970–983 (2013).
18. Tamoutounour, S. et al. Origins and functional specialization of macrophages and of conventional and monocyte-derived dendritic cells in mouse skin. Immunity 39, 925–938 (2013).
19. Ornatsky, O., Baranov, V.I., Bandura, D.R., Tanner, S.D. & Dick, J. Multiple cellular antigen detection by ICP-MS. J. Immunol. Methods 308, 68–76 (2006).
20. Newell, E.W., Sigal, N., Bendall, S.C., Nolan, G.P. & Davis, M.M. Cytometry by time-of-flight shows combinatorial cytokine expression and virus-specific cell niches within a continuum of CD8+ T cell phenotypes. Immunity 36, 142–152 (2012).
21. Bendall, S.C. et al. Single-cell mass cytometry of differential immune and drug responses across a human hematopoietic continuum. Science 332, 687–696 (2011).
22. Amir, E.A. et al. viSNE enables visualization of high dimensional single-cell data and reveals phenotypic heterogeneity of leukemia. Nat. Biotechnol. 31, 545–552 (2013).
23. Shekhar, K., Brodin, P., Davis, M.M. & Chakraborty, A.K. Automatic classification of cellular expression by nonlinear stochastic embedding (ACCENSE). Proc. Natl. Acad. Sci. USA 111, 202–207 (2014).
24. Van der Maaten, L. & Hinton, G. Visualizing high-dimensional data using t-SNE. J. Mach. Learn. Res. 9, 2579–2605 (2008).
25. Bodenmiller, B. et al. Multiplexed mass cytometry profiling of cellular states perturbed by small-molecule regulators. Nat. Biotechnol. 30, 856–867 (2012).
26. Greter, M. et al. GM-CSF controls nonlymphoid tissue dendritic cell homeostasis but is dispensable for the differentiation of inflammatory dendritic cells. Immunity 36, 1031–1046 (2012).
27. Satake, S. et al. C/EBPβ is involved in the amplification of early granulocyte precursors during candidemia-induced “emergency” granulopoiesis. J. Immunol. 189, 4546–4555 (2012).
28. Fiedler, K. & Brunner, C. The role of transcription factors in the guidance of granulopoiesis. American journal of blood research 2, 57–65 (2012).
29. Theilgaard-Mönch, K. et al. The transcriptional program of terminal granulocytic differentiation. Blood 105, 1785–1796 (2005).
30. Throsby, M., Herbelin, A., Pleau, J.M. & Dardenne, M. CD11c+ eosinophils in the murine thymus: developmental regulation and recruitment upon MHC class I-restricted thymocyte deletion. J. Immunol. 165, 1965–1975 (2000).
31. Tenenbaum, J.B., de Silva, V. & Langford, J.C. A global geometric framework for nonlinear dimensionality reduction. Science 290, 2319–2323 (2000).
32. Codarri, L. et al. RORγt drives production of the cytokine GM-CSF in helper T cells, which is essential for the effector phase of autoimmune neuroinflammation. Nat. Immunol. 12, 560–567 (2011).
33. Codarri, L., Greter, M. & Becher, B. Communication between pathogenic T cells and myeloid cells in neuroinflammatory disease. Trends Immunol. 34, 114–119 (2013).
34. Hamilton, J.A. Colony-stimulating factors in inflammation and autoimmunity. Nat. Rev. Immunol. 8, 533–544 (2008).
35. Guilliams, M. et al. Alveolar macrophages develop from fetal monocytes that differentiate into long-lived cells in the first week of life via GM-CSF. J. Exp. Med. 210, 1977–1992 (2013).
36. King, I.L., Kroenke, M.A. & Segal, B.M. GM-CSF-dependent, CD103+ dermal dendritic cells play a critical role in Th effector cell differentiation after subcutaneous immunization. J. Exp. Med. 207, 953–961 (2010).
37. Nishinakamura, R. et al. Mice deficient for the IL-3/GM-CSF/IL-5 βc receptor exhibit lung pathology and impaired immune response, while βIL3 receptor-deficient mice are normal. Immunity 2, 211–222 (1995).
38. Gautier, E.L. et al. Gene-expression profiles and transcriptional regulatory pathways that underlie the identity and diversity of mouse tissue macrophages. Nat. Immunol. 13, 1118–1128 (2012).
39. Wynn, T.A., Chawla, A. & Pollard, J.W. Macrophage biology in development, homeostasis and disease. Nature 496, 445–455 (2013).
40. Spits, H. et al. Innate lymphoid cells—a proposal for uniform nomenclature. Nat. Rev. Immunol. 13, 145–149 (2013).
41. Ginhoux, F. et al. The origin and development of nonlymphoid tissue CD103+ DCs. J. Exp. Med. 206, 3115–3130 (2009).
42. Schlitzer, A. & Ginhoux, F. Organization of the mouse and human DC network. Curr. Opin. Immunol. 26, 90–99 (2014).
43. Jakubzick, C. et al. Minimal differentiation of classical monocytes as they survey steady-state tissues and transport antigen to lymph nodes. Immunity 39, 599–610 (2013).
npg
© 2
014
Nat
ure
Am
eric
a, In
c. A
ll rig
hts
rese
rved
.
nature immunology doi:10.1038/ni.3006
ONLINE METHODSMice. For mass cytometry experiments done in Singapore, C57BL/6 mice were purchased from the Biological Resource Center (BRC), Agency for Science, Technology and Research (A*STAR), Singapore or Janvier labs, France. Heterozygous B6.129S1-CSF2rbtm1 Cgb/J (Csf2rb−/−) mice were purchased from The Jackson Laboratory (Bar Harbor, Maine, USA) and backcrossed to homozygosity. Homozygous CSF-2Rb−/− mice were bred at the animal facili-ties of Nanyang Technological University (IACUC-ARF-SBS/NIE 0097). Male mice aged 6–10 weeks were used for mass cytometry experiments. For fluores-cence flow cytometry comparison experiments done in Zurich, Switzerland, male mice aged 11–12 weeks were used. All experiments and procedures were approved by the Institutional Animal Care and Use Committee (IACUC) of A*STAR (Biopolis, Singapore) in accordance with the guidelines of the Agri-Food and Veterinary Authority (AVA), the National Advisory Committee for Laboratory Animal Research (NACLAR) of Singapore and the cantonal veterinary office of Zurich, Switzerland.
Preparation of cellular suspensions. Mouse organs were digested 0.5–1 h in RPMI containing 10% FBS and Collagenase type IV (0.2 mg/ml, working activity of 770 U/mg) (Sigma, Saint Louis, USA) as described17. Red-blood-cell lysis of lung and spleen preparations was performed by hypotonic lysis. Liver mononuclear cells were enriched using a Percoll gradient and kidney mono-nuclear cell fraction was purified using a NycoPrep gradient centrifugation. For mass cytometry experiments, spleen, LNs and thymus were depleted of CD19- and CD90-expressing cells before staining using biotin-conjugated antibodies to the respective antigens and anti-biotin beads (Miltenyi).
Antibodies. For mass cytometry analysis, purified antibodies were obtained from Beckton Dickinson, BioLegend, eBioscience, BioXcell, R&D Biosystems and AbD Serotec using clones listed in Supplementary Table 1. For some markers fluorophore- (phycoerythrin or allophycocyanin) or biotin-conjugated antibodies were used as primary antibodies followed by secondary staining with anti-fluorophore metal-conjugated antibodies (anti-APC, (Clone APC003, BioLegend cat. no. 408002, 5 µg/mL), anti-PE, (Clone PE001, BioLegend cat. no. 408102, 5 µg/mL)) or metal-conjugated streptavidin pro-duced as described44.
Mass cytometry staining, barcoding, acquisition and data preprocessing. Cells were plated and stained in a U-bottom 96-well plate (BD Falcon, cat. no. 3077). First, cells were washed once with 200 µL flow cytometry buffer (4% FBS, 2 mM EDTA, 0.05% Azide in 1× PBS) and then stained with 100 µL of 200 µM cisplatin (Sigma-Aldrich, cat. no. 479306-1G) for 5 min on ice to exclude dead cells45. Cells were then stained with anti-Mertk-biotin, anti-CCR2-APC and anti-CD301-PE primary antibodies in 50 µL reaction volume for 30 min on ice. Cells were washed twice with flow cytometry buffer and stained with 50 µL heavy-metal isotope–labeled secondary mAb cocktail for 30 min on ice. Cells were washed twice with flow cytometry buffer then once with PBS before fixing with 200 µL 2% PFA (Electron Microscopy Sciences, cat. no. 15710) in PBS overnight or longer. After fixation, cells were pelleted and resuspended in 200 µL 1× perm buffer (BioLegend, cat. no. 421002). Cells were washed once with perm buffer and then PBS before barcoding.
Bromoacetamidobenzyl-EDTA (BABE)-linked metal barcodes were pre-pared by dissolving BABE (Dojindo, cat. no. B437) in 100 mM HEPES buffer (Gibco, cat. no. 15630) to a final concentration of 2 mM. Then, isotopically purified PdCl2 (Trace Sciences, Inc.) was added to BABE solution to 0.5 mM. Similarly, DOTA-maleimide (DM)-linked metal barcodes were prepared by dissolving DM (Macrocyclics, cat. no. B-272) in L buffer (MAXPAR, cat. no. PN00008) to a final concentration of 1 mM. Then, 50 mM of RhCl3 (Sigma) and isotopically purified LnCl3 (Trace Sciences, Inc.) was added to DM solu-tion to 0.5 mM. Six metal barcodes were used: DM-Rh-103, BABE-Pd-104, BABE-Pd-106, BABE-Pd-108, BABE-Pd-110 and DM-Ln-113. All BABE and DM-metal solution mixtures were immediately snap frozen in liquid nitrogen and stored at −80 °C. A unique, dual combination of barcodes was chosen to stain each tissue sample.
To accommodate the required numbers of samples, three barcoded batches were prepared, each having equal total tissue composition (each a mixture of samples for each of the eight tissues, some samples split when necessary).
Owing to concern about possible differences in background signal derived from differential amounts of cellular debris between tissues (observed in trial experiments; data not shown), mass-tag barcoding was used to allow simulta-neous acquisition of samples derived from all tissues simultaneously. Blinding was not used because we were initially concerned about the possibility of batch effects and included tissue samples from wild-type and Csf2rb−/− mice in pairs for each batch. A uniquely barcoded sample of cells from a single additional spleen sample was also included in batch as an internal control. Subsequent tSNE-based analysis of this internal control as well as consistency in results between mice (Fig. 6a and Supplementary Fig. 5) showed good correspond-ence between batches, proving that batch effects were irrelevant for these runs. Barcode Rh-103 was used at 1:150 dilution; Pd-104 at 1:2,000; Pd-106 and Pd-108 at 1:1,000; Pd-110 at 1:250 and Ln-113 at 1:500. Cells were stained in 100 µL barcodes in PBS for 30 min on ice. Cells were then washed in perm buffer and incubated in flow cytometry buffer for 10 min on ice. Cells were then pelleted and resuspended in 100 µL of nucleic acid Ir-Intercalator (MAXPAR, cat. no. 201192B) in 2% PFA/PBS (1:2,000), at room temperature. After 20 min, cells were washed twice with flow cytometry buffer and twice with water before final resuspension in water. In each set, cells were pooled from all tissue types, enumerated and diluted to a final concentration of 0.5 × 10⁶ cells/mL for acquisition. Cells were acquired by sets and analyzed using a CyTOF mass cytometer as described20. The data were exported in flow-cytometry file (FCS) format, and cells for each barcode were deconvolved by Boolean gating using FlowJo software (Tree Star, Ashland, USA).
Fluorescence flow cytometry, flow sorting and cytospin. Multiparameter analyses and sorting of stained cell suspensions were done on an LSR II, Fortessa or ARIA II instrument (Becton Dickinson, San Jose, USA) and analyzed by FlowJo (Tree Star, Ashland, USA). Fluorochrome- or biotin- conjugated monoclonal antibodies (mAbs) specific to mouse IA/IE (M5/114.15.2), CD11b (M1/70), CD11c (N418), CD45 (30F11), Gr-1 (RB6-8C5), F4/80 (A3-1), CD172a (P84), CD11a (M17/4), CD43 (ebioR2/60), Ly6C (HK1.4), B220 (RA3-6B2), CD19 (1D3), NK1.1 (PK136), Ter119 (TER-119), CD90 (53-2.1), Ly6G (1A8), the corresponding isotype controls and the secondary reagents were purchased either from BD Biosciences (San Jose, USA), eBiosciences (San Diego, USA) or BioLegend (San Diego, USA). In flow cytometric sorting experiments lineage (lin) cocktail contained CD90, CD19, NK1.1, Ter119; in thymic cell suspension, Ly6g (1A8) was added.
For cytospin, purified cells were spun onto glass slides, dried overnight, stained in Field stain A and B (Sigma) and rinsed in distilled water. Images were analyzed using an Olympus BX43 microscope (Tokyo, Japan) at ×100 magnification. For each representative image, we collected >20 cell images and chose representative examples.
Mass cytometry data analysis. A single composite map representing the phenotypic diversity of all myeloid-enriched cells derived from all tis-sues and mice analyzed was created, which allows comparison of cellular composition between tissues and between mice analyzed. FCS files of live CD45+CD19−CD90− myeloid cell events were converted to intensity values using R package flowCore. The intensity values were logicle-transformed46 (using parameters w = 0.1, t = 4000, m = 4.5, a = 0), and markers (Fig. 5b) were selected for downstream analysis. Because the number of myeloid cell events varied dramatically between mice and tissue, the contribution of each mouse and tissue was partially normalized by using up to 10,000 CD45+CD19−CD90− myeloid cell events per tissue per mouse. More than 10,000 myeloid events were obtained for all spleen, bone marrow, and some lung and liver samples. Fewer cells were obtained from the other tissues (the lowest number recovered was 974 myeloid events, from a kidney sample), in which case all tissue-derived myeloid events were used for the analysis. For the main experiment this included a total of 36 samples derived from three wild-type C57BL/6 mice and three Csfrb−/− mice. For brain tissue, thymus tissue and kidney tis-sue, cells from C57BL/6 and Csfrb−/− mice were each pooled. After separately gating and exporting myeloid-enriched cells from each mouse and tissue (up to 10,000 cells each), the aggregate population of cells was subjected to tSNE dimension reduction24. tSNE was carried out using bh_tsne, an efficient implementation of t-SNE for large data sets implementation (obtained from L.J.P. van der Maaten). The 2D coordinates of the tSNE map were then fed
npg
© 2
014
Nat
ure
Am
eric
a, In
c. A
ll rig
hts
rese
rved
.
nature immunologydoi:10.1038/ni.3006
to ACCENSE’s density-based clustering algorithm (Supplementary Fig. 2). The clustering algorithm searched for the optimal bandwidth that was used to estimate kernel density. Subsequently, a 2D peak-finding algorithm was used to detect density peaks on the 2D t-SNE map. Each peak k represents the center of cluster k. Cells whose distance to peak k is less than half of the distance between peak k and its nearest neighbor peak are assigned to cluster k. On the basis of ACCENSE’s cluster analysis, DensVM grouped cells into training set and testing set. The training set contained cells that received clus-ter assignment from ACCENSE; cells that ACCENSE failed to classify com-prised the testing set. DensVM used support vector machine (SVM) to train a classifier that learns the mapping from marker expression profile to cluster assignment. Under the assumption that cells with similar marker expression originated from the same cluster, the trained classifier took as input marker expression values of cells in the testing set and generated cluster predictions for these cells. DensVM obtained the final cluster delineation by combing the cluster assignment given by ACCENSE with the cluster prediction made by support vector machine. By this method, cells sharing similar patterns of marker expression are classified into the same cluster (or subpopulations). By incorporating machine learning–aided clustering, DensVM is able to precisely detect the boundaries of cell populations and hence allows their frequencies to be objectively compared. A scatter plot of cells on the 2D tSNE dimensions was generated with each cell color-coded by DensVM clusters using SpotFire, R or FlowJo. Cells were grouped by DensVM clusters and median intensity values of markers were calculated for each cluster and visualized via plotting heat maps. The heat maps were used to identify defining markers for these clusters and annotate each of them as one of previously defined or unknown cellular populations. For each tissue of each mouse, number of cells in different DensVM clusters was counted and percentage frequency of each cluster was calculated. Heat map and hierarchical clustering dendrogram were produced to compare the frequencies of DensVM clusters in different tissues and mice. t-test followed by Benjamini-Hochberg (BH) multiple test correction were
performed on cluster frequencies to identify clusters that showed significantly different frequencies in wild-type (WT) and knockout (KO) mice. DensVM cluster delineation was coded into a two-dimensional coordinate system that was then inverse-logicle transformed. Similarly, the coordinates of the 2D t-SNE map were also inverse-logicle transformed. The transformed cluster coordinates and t-SNE coordinates were added to the FCS files as additional parameters. Subsequently, we gated on the new FCS files and overlaid the gated subsets on the 2D t-SNE plot using the FlowJo software.
Isometric mapping (ISOMAP) dimensionality reduction was implemented using R package Vegan and was used to elucidate the phenotypic progression between eosinophil, neutrophil and their progenitors. Equal numbers of cell events were sampled from each of the five neutrophil clusters (cluster 1–5) and the two eosinophil clusters (cluster 6–7). The sampled cell events were pooled and subjected to ISOMAP dimensionality reduction. Scatter plot of cells was generated on the first two ISOMAP dimensions with cells color-coded according to clusters. Along the first and second ISOMAP dimensions, 100 bins of equal interval were generated from the minimum to maximum of the coordinate coefficient. For selected markers, median expression value within each bin was calculated and smoothed curves were generated using R package lowess. The above-mentioned ISOMAP analysis was done on pooled cells from all tissues and all mice.
44. Newell, E.W. et al. Combinatorial tetramer staining and mass cytometry analysis facilitate T-cell epitope mapping and characterization. Nat. Biotechnol. 31, 623–629 (2013).
45. Fienberg, H.G., Simonds, E.F., Fantl, W.J., Nolan, G.P. & Bodenmiller, B. A platinum-based covalent viability reagent for single-cell mass cytometry. Cytometry A 81, 467–475 (2012).
46. Parks, D.R., Roederer, M. & Moore, W.A. A new “Logicle” display method avoids deceptive effects of logarithmic scaling for low signals and compensated data. Cytometry A 69A, 541–551 (2006).
npg
© 2
014
Nat
ure
Am
eric
a, In
c. A
ll rig
hts
rese
rved
.