high altitude wind generation - polito.it...high altitude wind generation: renewable energy cheaper...
TRANSCRIPT
High High AltitudeAltitude Wind Generation:Wind Generation:RenewableRenewable Energy Energy cheapercheaper thanthan oil oil
HAWP HAWP ConferenceConferenceChicoChico--OrovilleOroville (CA), (CA), NovemeberNovemeber 55--6, 2009 6, 2009
Mario MilaneseMario MilanesePolitecnico di TorinoPolitecnico di Torino
The needThe need
• At present, about 80% of the world electric energy is produced from thermal plants making use of fossil sources (oil, gas, coal).
• The economical, geopolitical and environmental problems related to such sources are becoming everyday more and more evident.
• Is it possible to invert the percentage splitbetween non-renewable and renewable sources with the present renewable technologies ?

Limits of present renewable technologiesLimits of present renewable technologies
• High production costs incentives are required for their installations
• Large occupation of land
• Without significant breakthroughs, even reaching the objectives posed by many countries (e.g. 20% for 2020 in EU) is a difficult challenge
KitenergyKitenergy projectproject
• A radical innovation in wind technology,
aimed to generate renewable energy at cost
lower than from oil
• Exploiting a renewable energy source , the
altitude wind, altitude wind, available anywhere
• Channelled through arrays of automatically
controlled tethered airfoils (kites)kites).
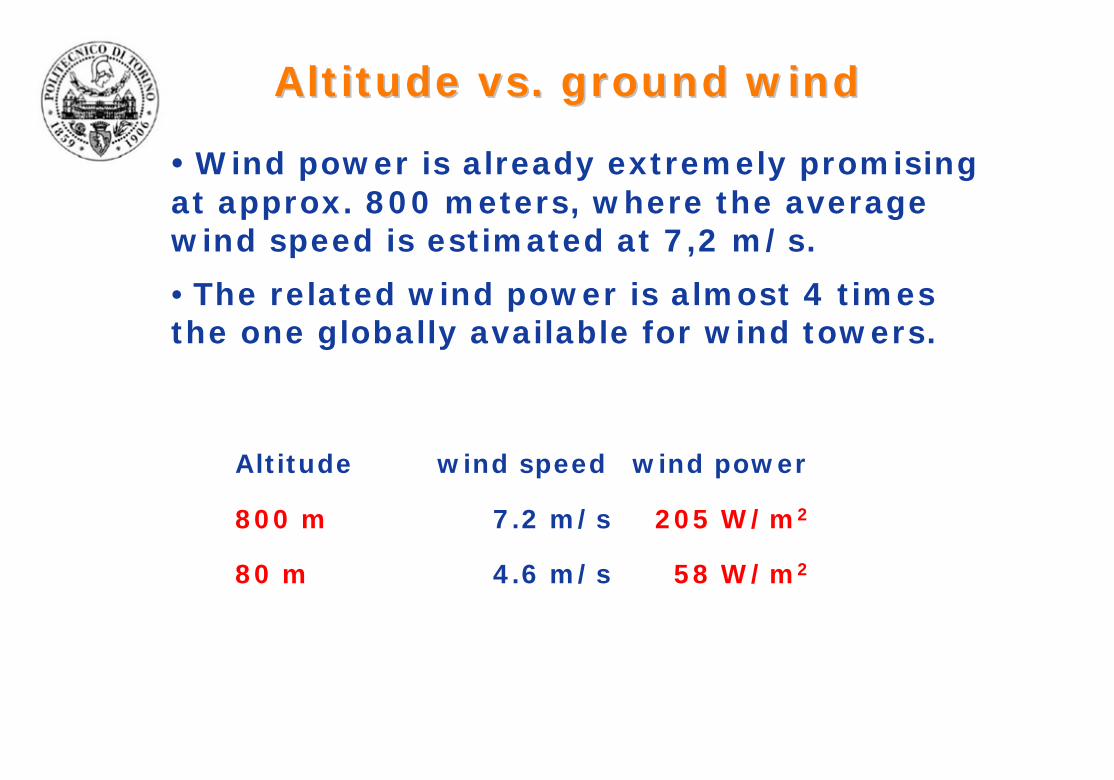
Altitude vs. ground windAltitude vs. ground wind
• Wind power is already extremely promising at approx. 800 meters, where the average wind speed is estimated at 7,2 m/s.
• The related wind power is almost 4 times the one globally available for wind towers.
Altitude wind speed wind power
800 m 7.2 m/s 205 W/m2
80 m 4.6 m/s 58 W/m2

The The problemproblem
• Wind at 800 m is out of the reach of current and future aerogenerating towers, already struggling at 100 m.
• The structure holding up the rotors becomes exponentially heavier, more unstable and expensive

The The KitenergyKitenergy solutionsolution
• A radical shift of perspective:
no longer heavy and static structures,
but a light, dynamic and intelligent machine.
KitenergyKitenergy key key technologytechnology
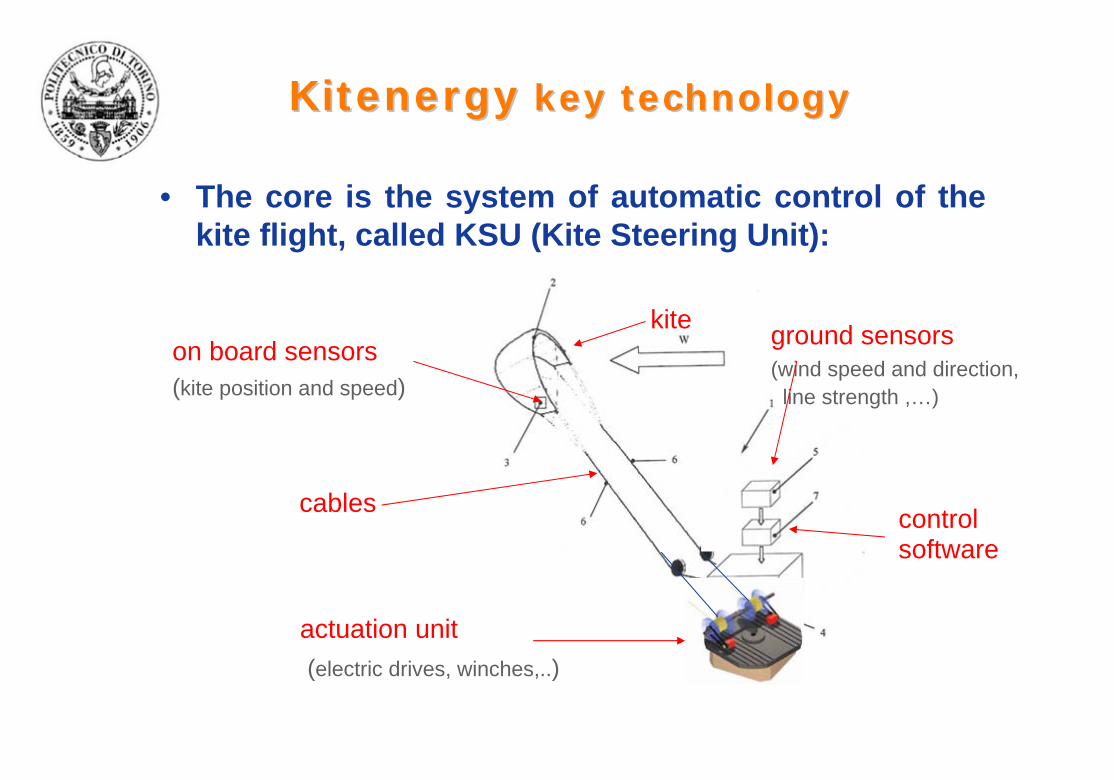
• The core is the system of automatic control of the kite flight, called KSU (Kite Steering Unit):
on board sensors(kite position and speed)
ground sensors (wind speed and direction,
line strength ,…)
kite
controlsoftware
actuation unit(electric drives, winches,..)
cables

KitenergyKitenergy key key technologytechnology
Torre eolica
Wind tower Kitenergy
• In wind towers, the outermost 20% of the blades contributes for 80% of the power.
• The kite acts as the outermost part of the blades without requiring the heavy tower
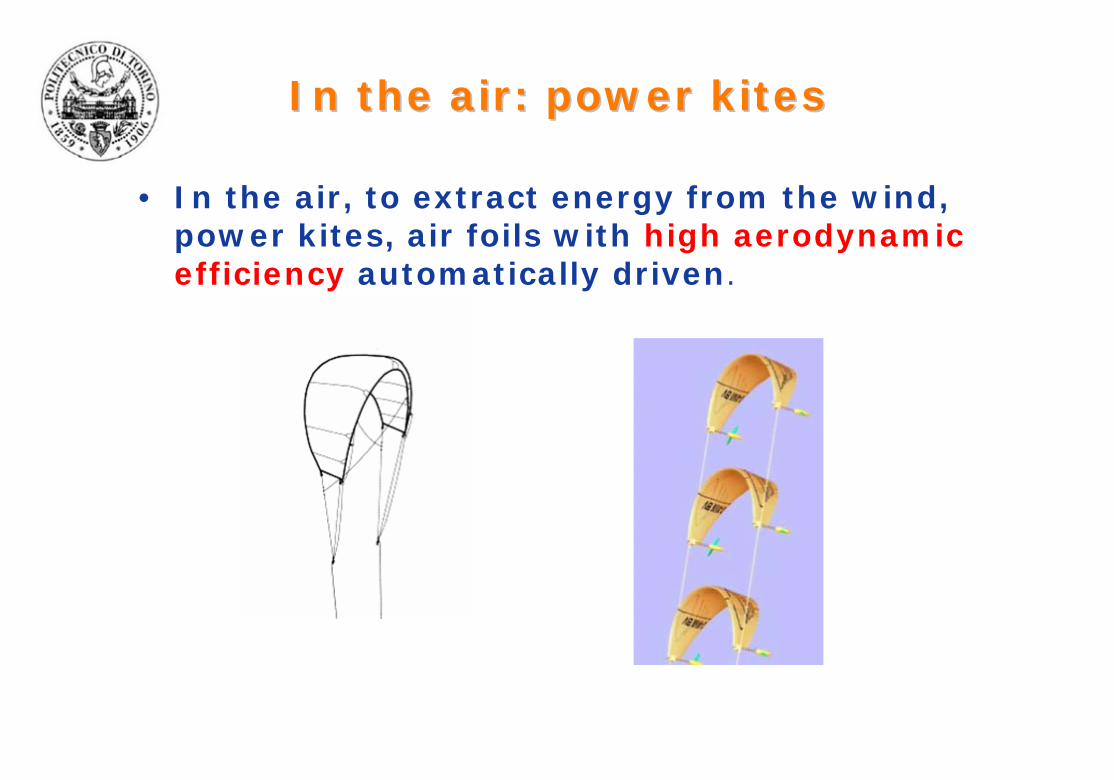
In the air: power In the air: power kiteskites
• In the air, to extract energy from the wind, power kites, air foils with high aerodynamic efficiency automatically driven.
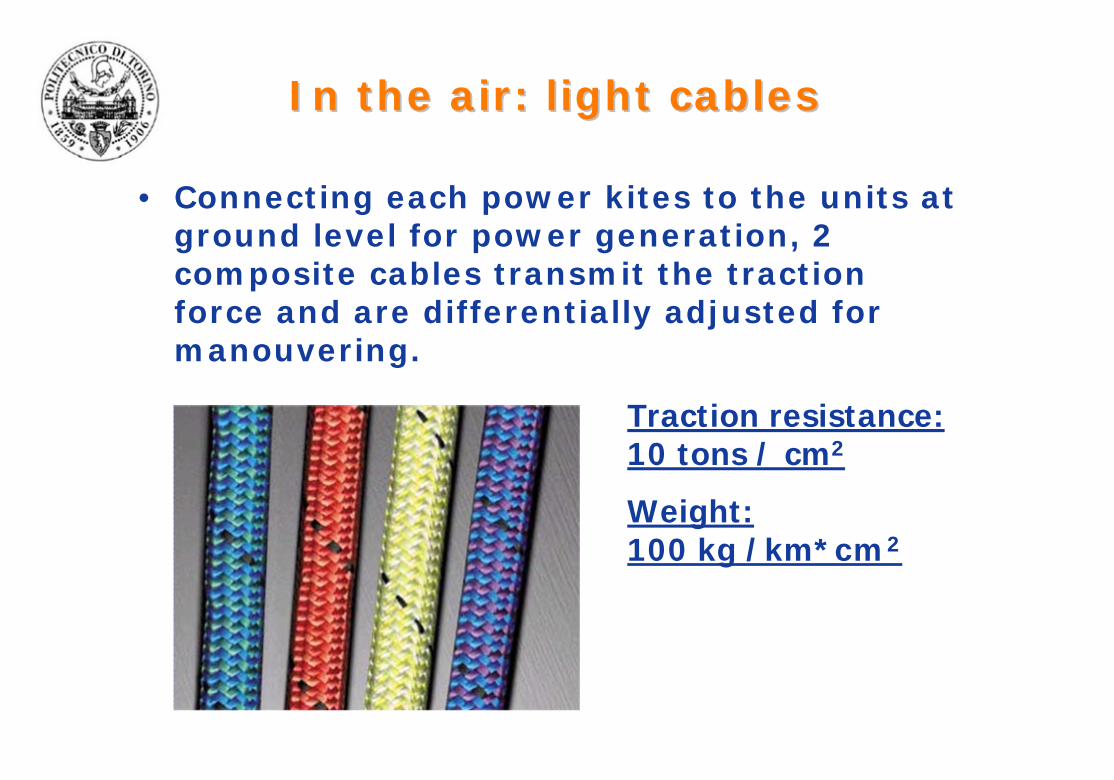
In the air: light In the air: light cablescables
• Connecting each power kites to the units at ground level for power generation, 2 composite cables transmit the tractionforce and are differentially adjusted formanouvering.
Traction resistance: 10 tons / cm2
Weight: 100 kg /km*cm2
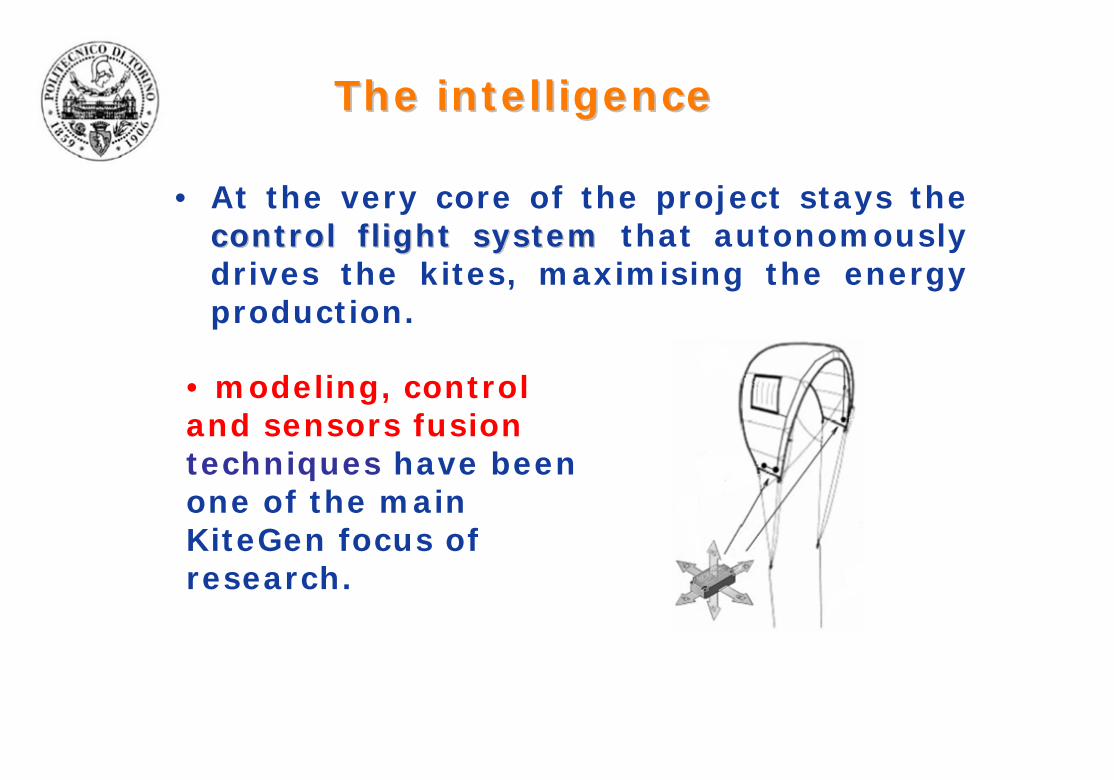
The intelligenceThe intelligence
• At the very core of the project stays the control flight systemcontrol flight system that autonomously drives the kites, maximising the energy production.
• modeling, control and sensors fusion techniques have been one of the main KiteGen focus of research.
KiteKite modelingmodeling and and controlcontrol
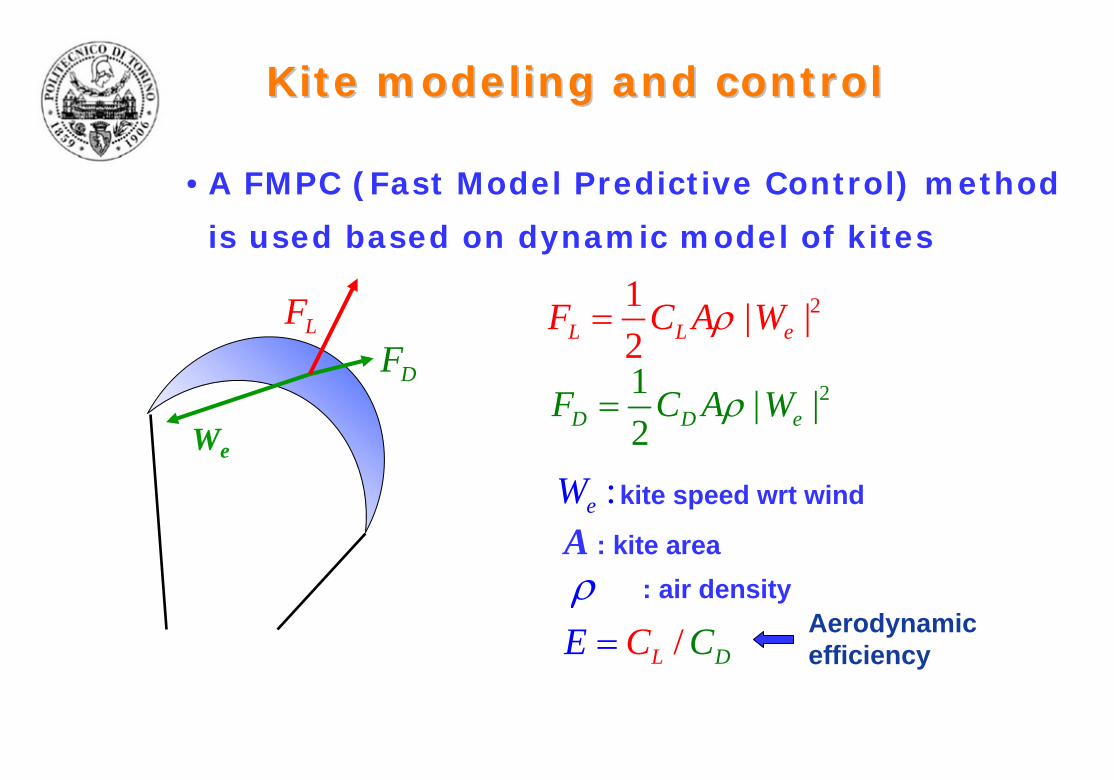
• A FMPC (Fast Model Predictive Control) method
is used based on dynamic model of kites
LFDF
21 | |2L L eF C A Wρ=
21 | |2D D eF C A Wρ=
:eW kite speed wrt wind
ρA : kite area
/L DE C C= Aerodynamicefficiency
We
: air density
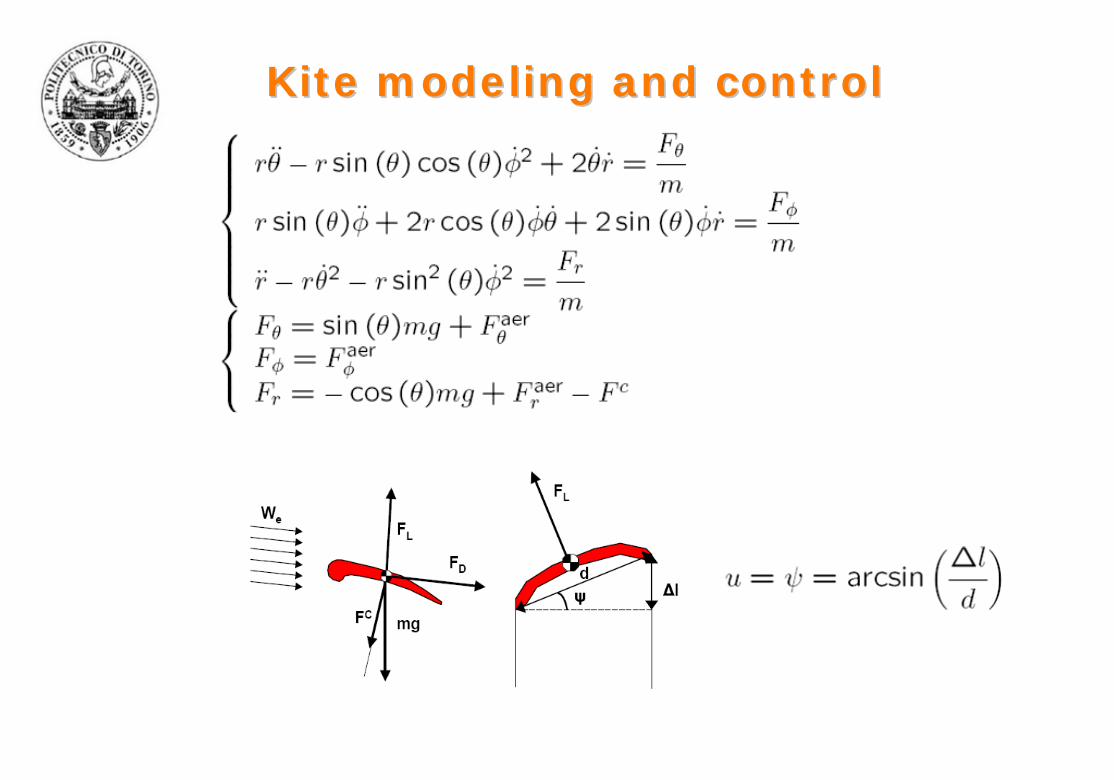
KiteKite modelingmodeling and and controlcontrol
KiteKite modelingmodeling and and controlcontrol
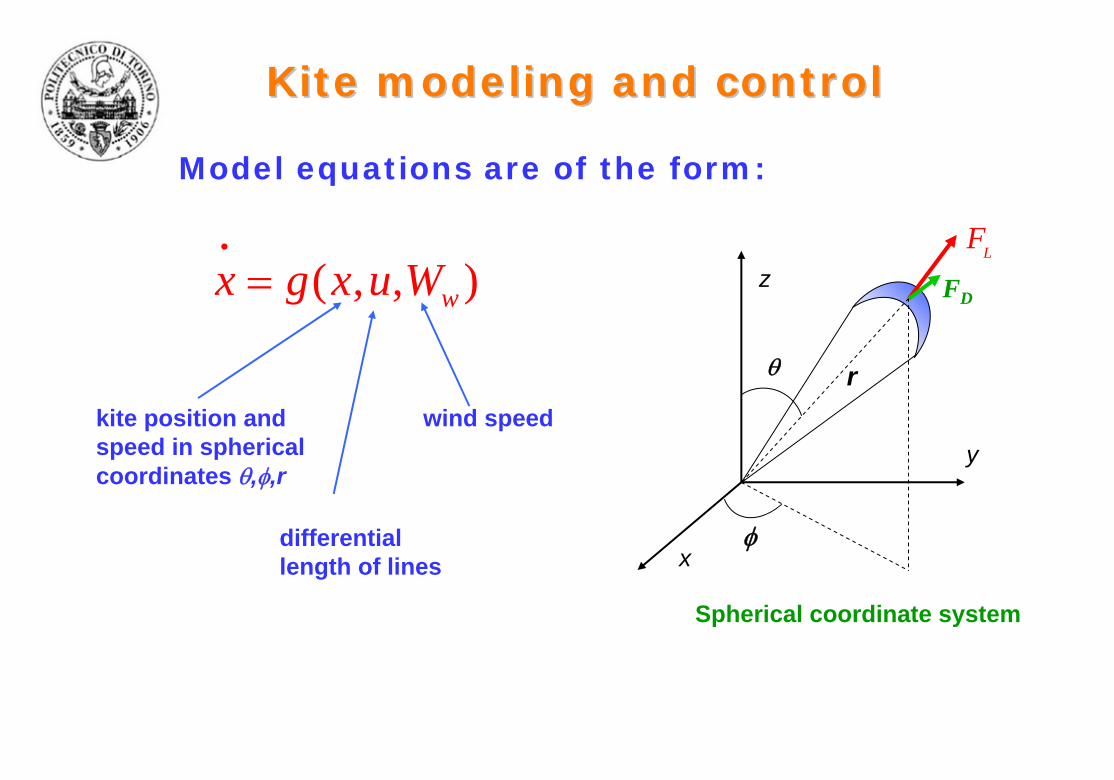
Model equations are of the form:
( , , )wx g x u W=i
wind speedkite position and speed in sphericalcoordinates θ,φ,r
differentiallength of lines
z
x
θ
φ
r
y
Spherical coordinate system
LFFD

KiteKite modelingmodeling and and controlcontrol
KEKE--yoyoyoyo configurationconfiguration
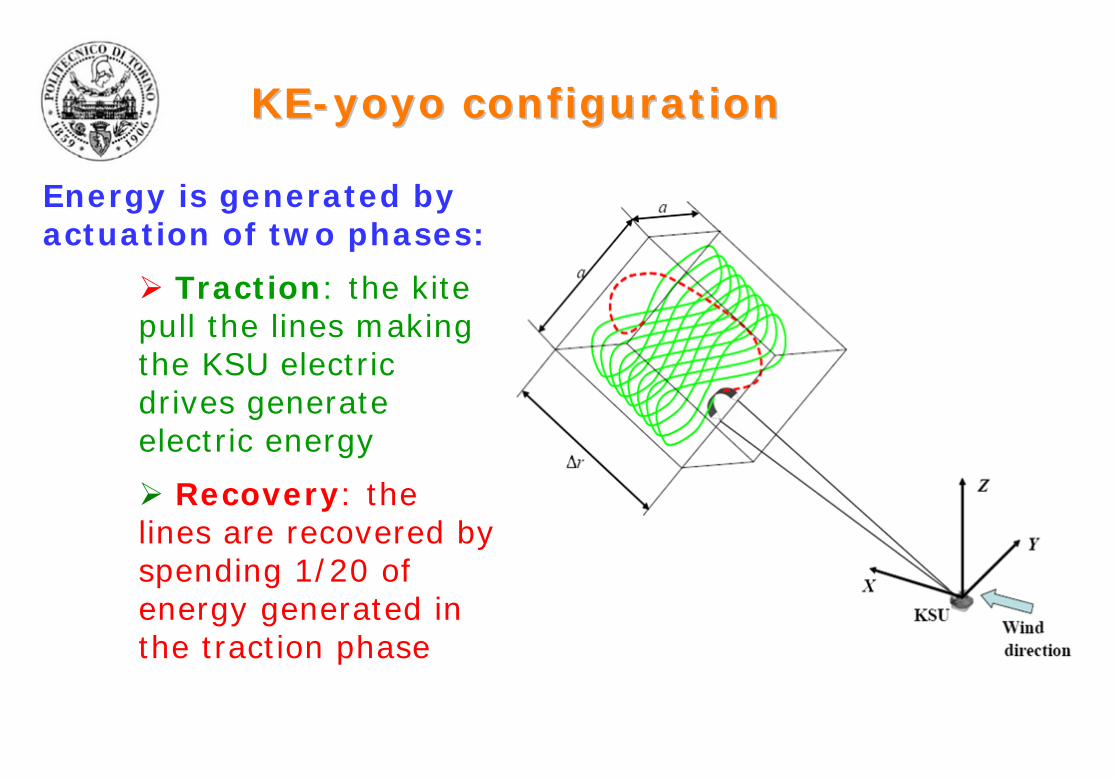
Energy is generated by actuation of two phases:
Traction: the kite pull the lines making the KSU electric drives generate electric energy
Recovery: the lines are recovered by spending 1/20 of energy generated in the traction phase

HowHow muchmuch energyenergy isis generatedgenerated ??
• A single KE-yoyo with:»kite area A= 500 m2
»kite efficiency E= 12
»wind speed We= 15 m/s
» a= 300 m; Δr= 50 m
10 MW power
• A KE-farm can be realized by suitably displacing several KE-yoyo’s in order to avoid kite collision and aerodynamic interferences
KEKE--farmfarm
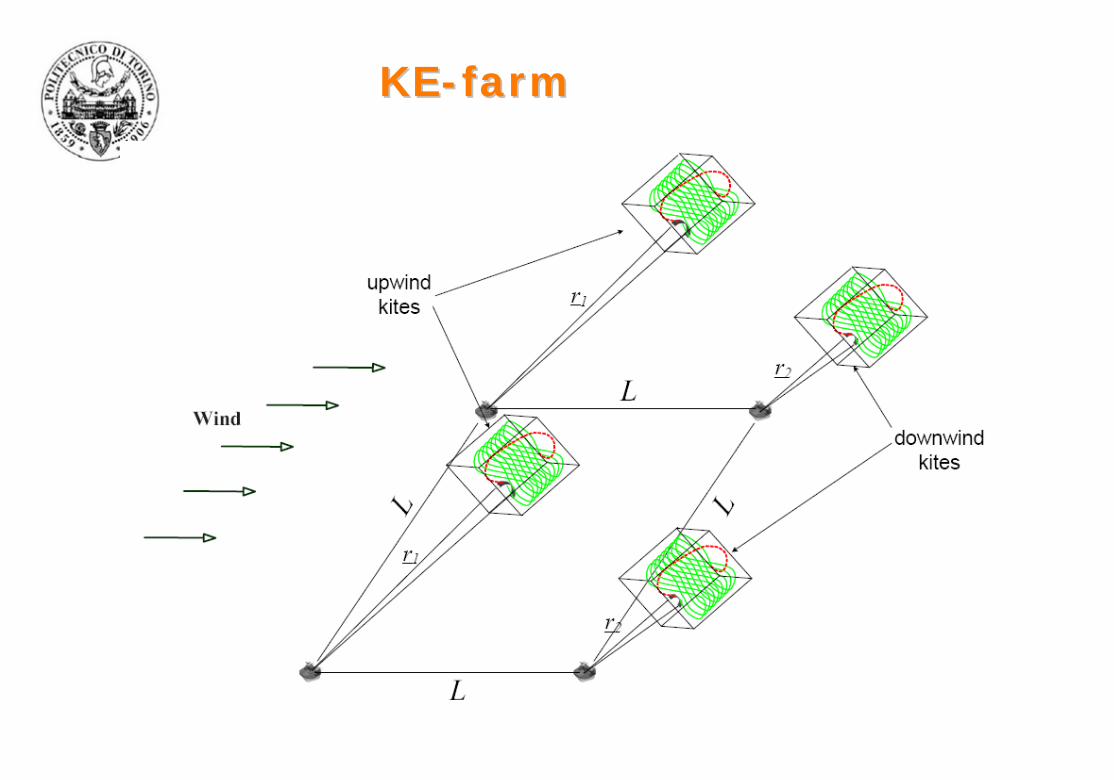
KEKE--farmfarm
KEKE--farmfarm
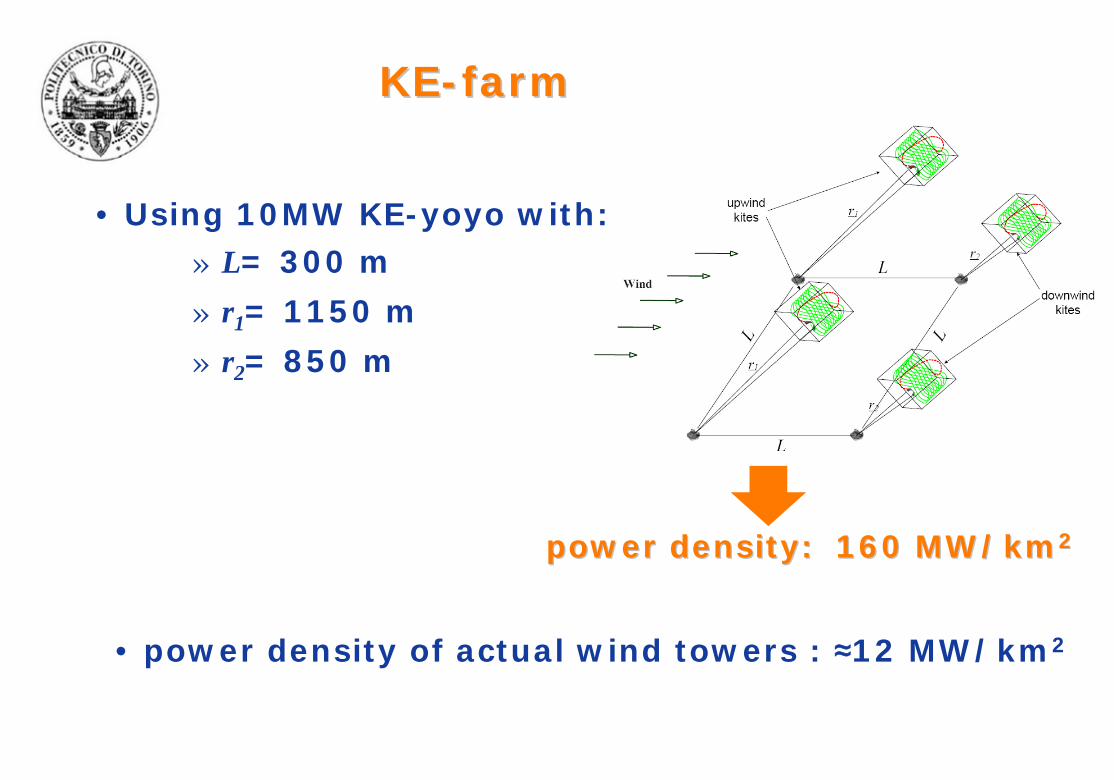
• Using 10MW KE-yoyo with:» L= 300 m
» r1= 1150 m
» r2= 850 m
powerpower density: 160 MW/kmdensity: 160 MW/km22
• power density of actual wind towers : ≈12 MW/km2

Energy Energy availabilityavailability anywhereanywhere
• Exploiting altitude wind simplifies the issue of where to localize the plants: on average every point on the planet’s surface 800 meters on its vertical has enough power available (≈200 W/m2).
• Existing wind towers has lower operative range and needs a more accurate and severe selection of the possible favourable sites.

CapacityCapacity FactorFactor
Power curves of 2 MW rated power generators
Due to wind variability, a wind generator is able toproduce in average only a fraction of its rated power, called “Capacity Factor”:
av maxP P CF= ⋅
*
•Wind tower power curve takenfrom http://www.vestas.com
KE-yoyo

CapacityCapacity FactorFactor examplesexamples
Linate (IT) Buenos Aires (AR) Misawa (JP) Leba (PO) Brindisi (IT) De Bilt (NL)
0.006 0.18 0.11 0.32 0.31 0.36
0.33 0.63 0.50 0.68 0.60 0.71
De Bilt (NL) Linate (IT)
200-800 m
50-150 m
200-800 m
50-150 m
Capacity factors of wind tower (black) and of KE-yoyo (orange) in some locationsWind data taken from the NOAA/ESRL Radiosonde Database: http://raob.fsl.noaa.gov/

ScalabilityScalability and and energyenergy costcost
1027
60
10 MW 100 MW 1.000 MW
Production cost of energyvs. Kitenergy plant size
Current wind turbines
Fossil fuels
€/MWh
40
80
60
20
100
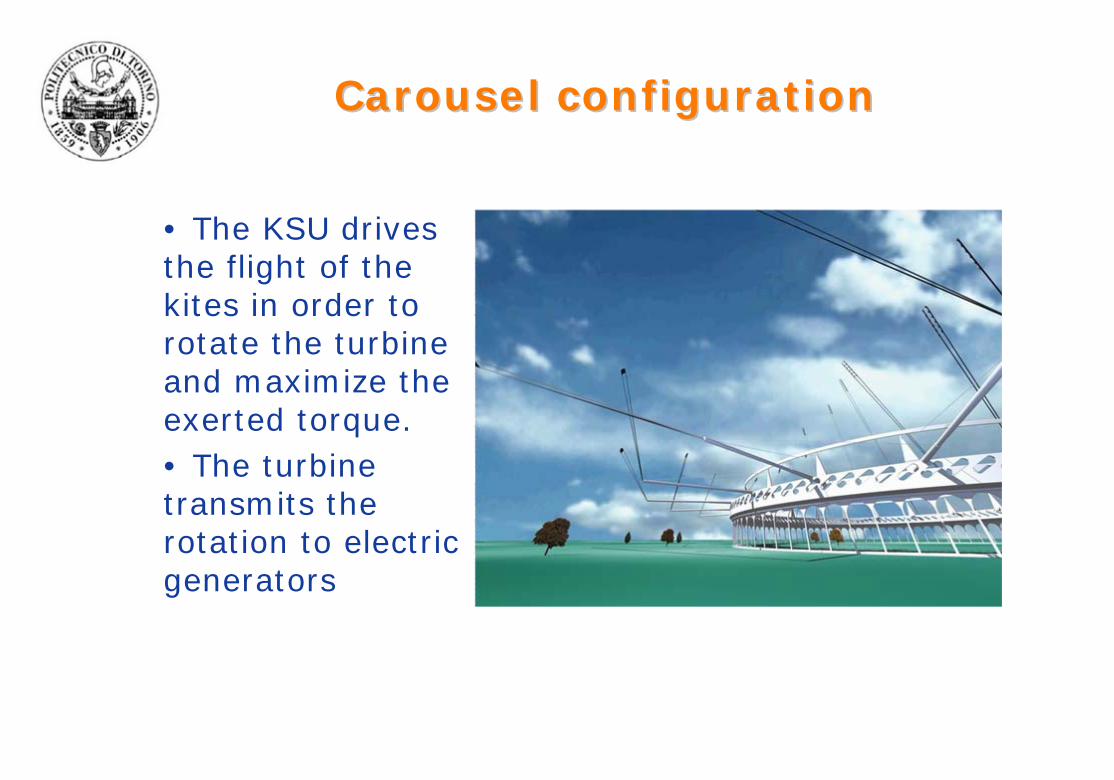
CarouselCarousel configurationconfiguration
• The KSU drives the flight of the kites in order to rotate the turbine and maximize the exerted torque.• The turbine transmits the rotation to electric generators

CarouselCarousel configurationconfiguration
• The turbine rotates with tangential speed of 20-50 km/h, depending on wind speed• The kite flies “lying eight” at high speed (200-250 km/h), exploiting the aerodynamical lift force: “lift machine”

Flight Flight pathspaths
Prototipo mobile KSU1 mentre controlla un normale profilo alare sportivo
kite speed: 200-300 km/h
kite speed: 50-100 km/h

CurrentCurrent statusstatus
• Extensive computer design and simulations have been performed using sophisticated aerodynamical models of kites and control strategies.
• A a first operating prototype in yo-yo configuration, codename KSU1, has been realized by Politecnico di Torino and partial support of Regione Piemonte.
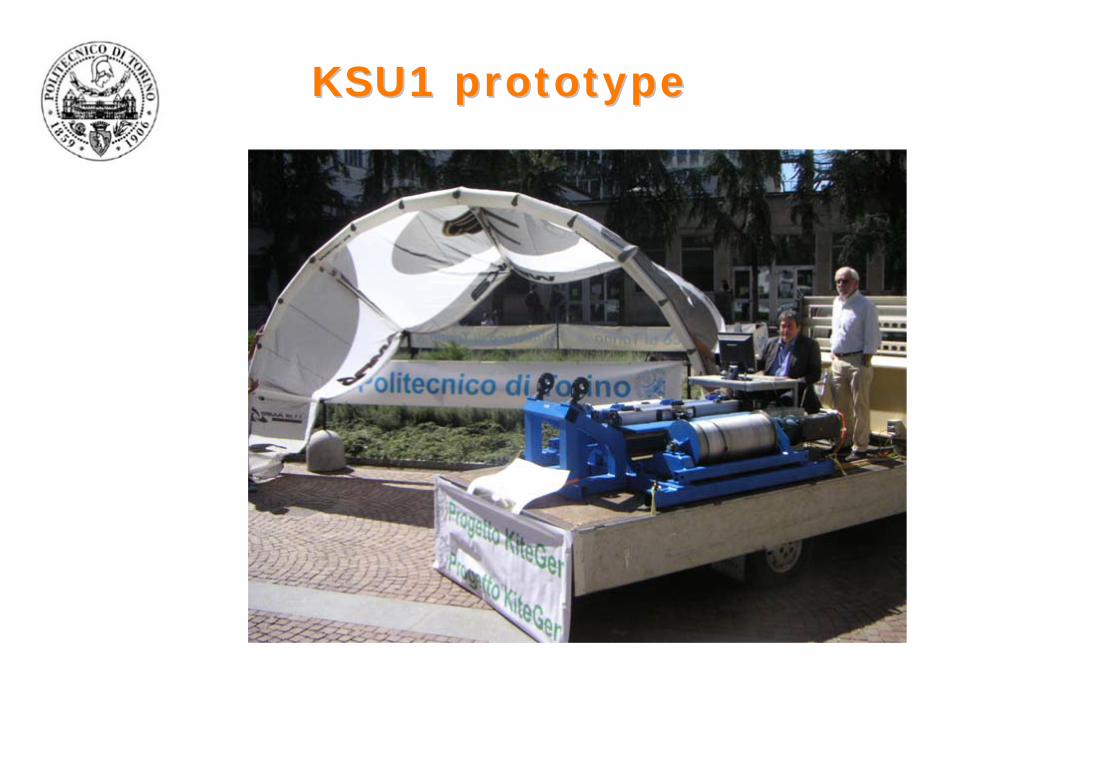
KSU1 KSU1 prototypeprototype
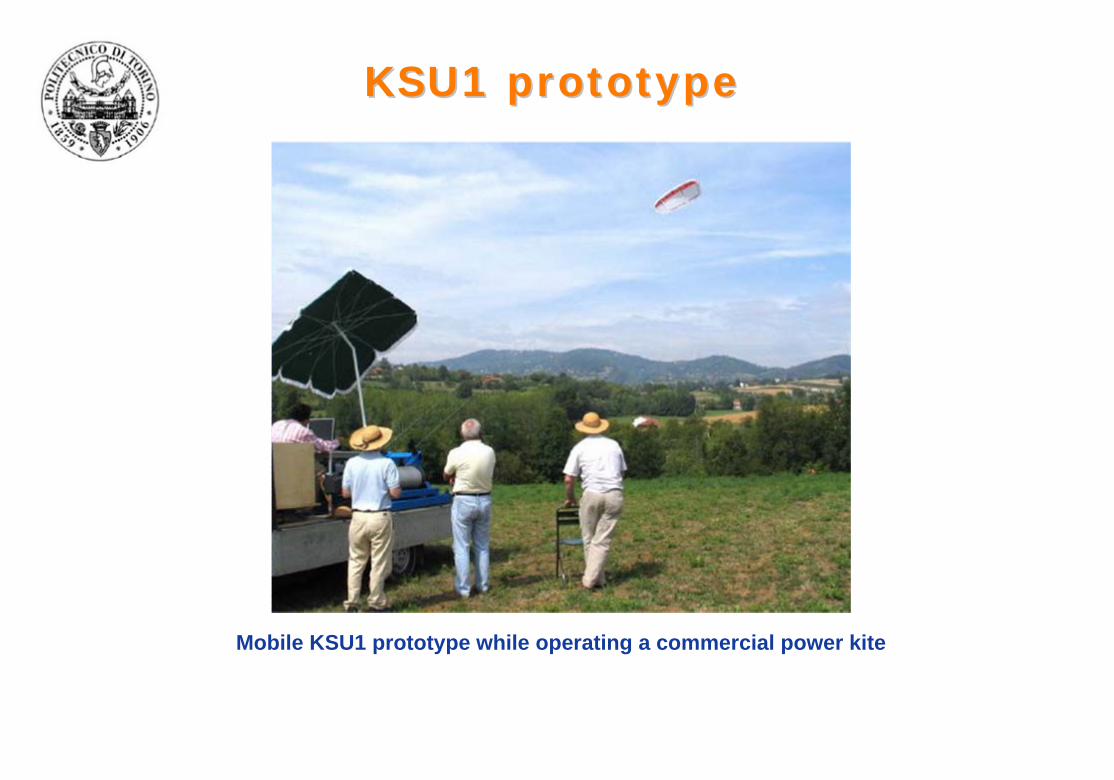
KSU1 KSU1 prototypeprototype
Mobile KSU1 prototype while operating a commercial power kite
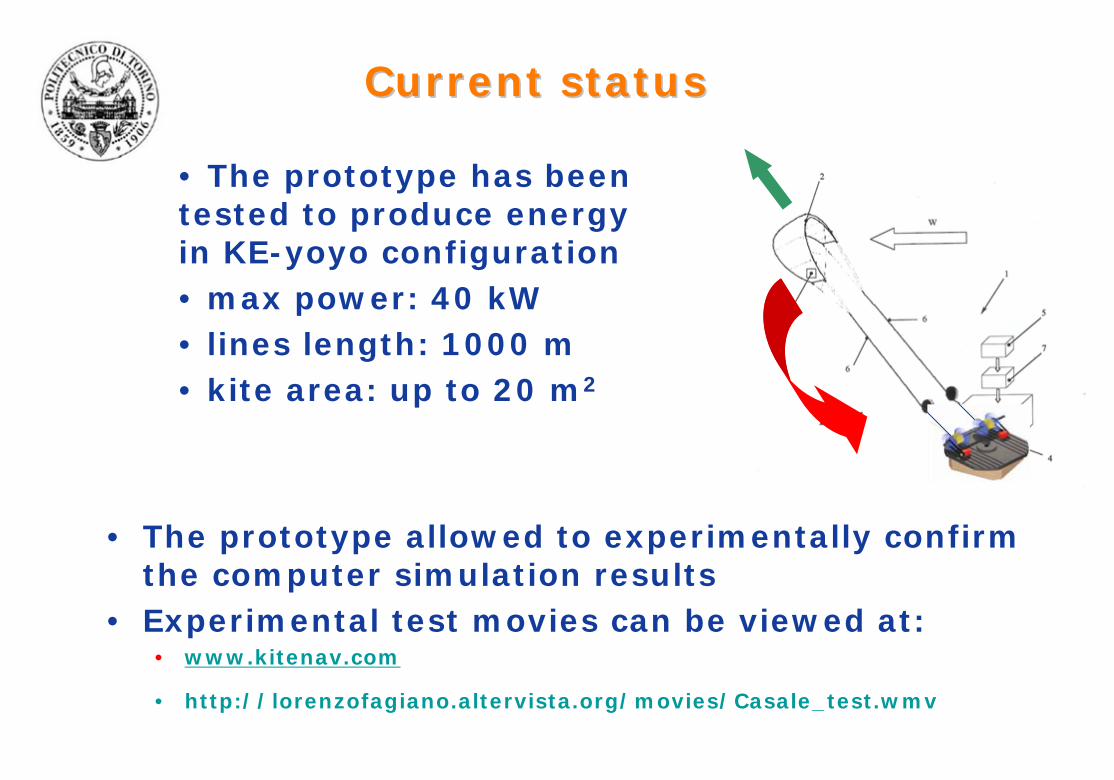
CurrentCurrent statusstatus
• The prototype allowed to experimentally confirm the computer simulation results
• Experimental test movies can be viewed at:• www.kitenav.com
• http://lorenzofagiano.altervista.org/movies/Casale_test.wmv
• The prototype has been tested to produce energy in KE-yoyo configuration • max power: 40 kW• lines length: 1000 m• kite area: up to 20 m2
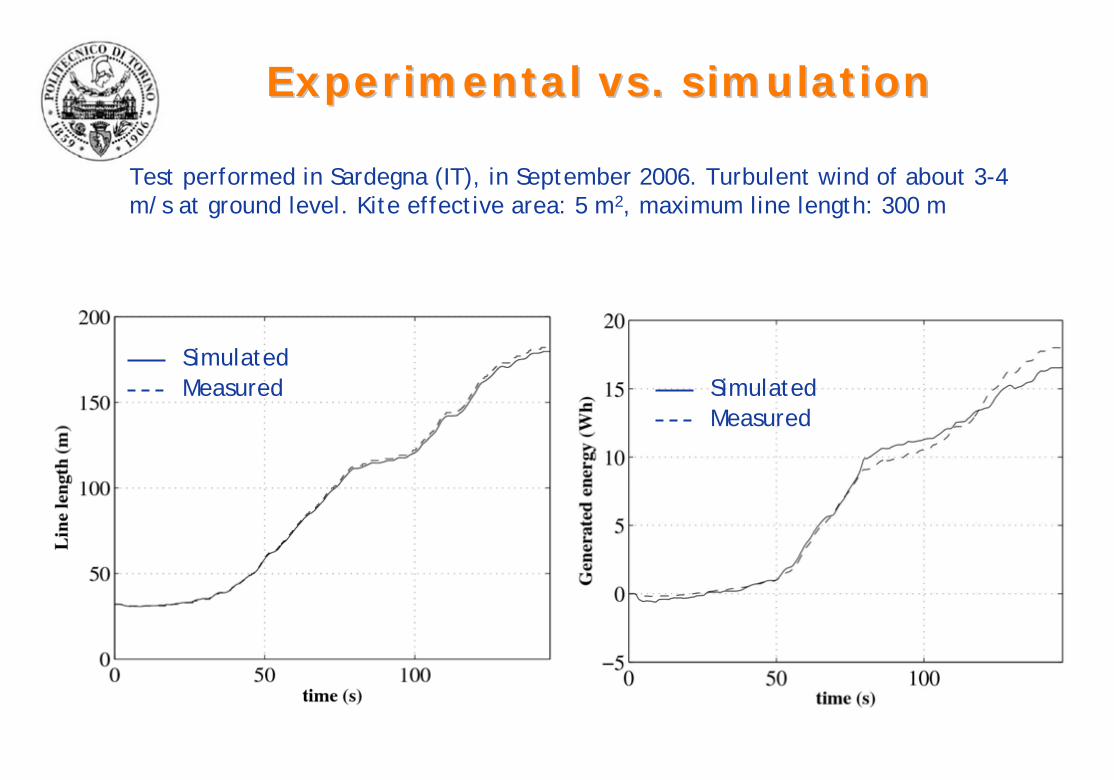
ExperimentalExperimental vs. vs. simulationsimulation
Test performed in Sardegna (IT), in September 2006. Turbulent wind of about 3-4 m/s at ground level. Kite effective area: 5 m2, maximum line length: 300 m
SimulatedMeasured Simulated
Measured
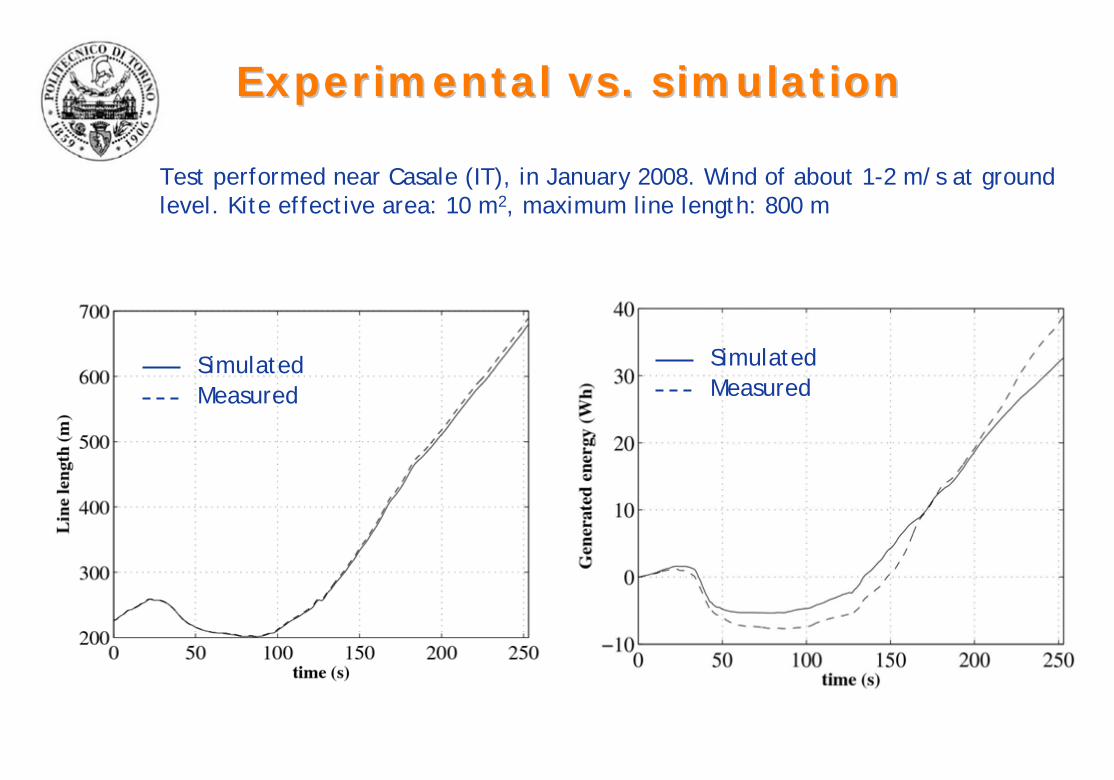
Test performed near Casale (IT), in January 2008. Wind of about 1-2 m/s at ground level. Kite effective area: 10 m2, maximum line length: 800 m
SimulatedMeasured
SimulatedMeasured
ExperimentalExperimental vs. vs. simulationsimulation
Future Future plansplans
• To build in 18 months a new yo-yo prototype with a power of 1-2 MW.
• This prototype will demonstrate the feasibilty of building in further 18 months a wind farm with a power of 10 MW with energy production costs lowerthan from oil.
M. L. Loyd, Crosswind kite power, Journal of Energy 4-3, pp. 106-111 (1980).
M. Canale, L. Fagiano, M. Milanese and M. Ippolito, Control of tethered airfoils for a newclass of wind energy generator, in Proc. 45th IEEE CDC, San Diego, CA, 2006
M. Canale, L. Fagiano, M. Milanese, Power Kites for Wind Energy Generation, IEEE Control Systems Magazine 27-6, pp. 25-38, December 2007
A. Ilzhöfer, B. Houska, and M. Diehl, Nonlinear mpc of kites under varying wind conditions for a new class of large-scalewind power generators, International Journal of Robust and Nonlinear Control, vol. 17, pp. 1590–1599, 2007
B. Lansdorp, R. Ruiterkamp, and W. Ockels, Towards flight testing of remotely controlled surfkites for wind energy generation, AIAA Atmospheric Flight Mechanics Conference and Exhibit, Hilton Head, CA, August 2007.
M. Canale, L. Fagiano and M. Milanese, “High Altitude Wind Energy Generation Using Controlled Power Kites”, IEEE Trans. on Control Systems Technology, doi: 10.1109/TCST.2009.2017933
L. Fagiano, M. Milanese, and D. Piga, “High altitude wind power generation,” IEEE Transactions on Energy Conversion, in press.
ReferencesReferences