hierarchical organization of personality and prediction of...
TRANSCRIPT

Journal of Personality and Social Psychology Copyright 1998 by the American Psychological Association, Inc. 1998, Vol. 74, No. 2, 538-556 0022-3514/98/$3.00
Hierarchical Organization of Personality and Prediction of Behavior
Sampo V. Paunonen University of Exeter
Two studies evaluated personality trait measures and Big Five factor measures for their accuracy in predicting important behavior criteria. The results of both studies showed that the narrower traits and the broader factors, thought to define 2 levels of a hierarchy of personality variables, separately predicted most criterion variables. However, the incremental validity of the personality txait measures (the degree to which the traits increased the criterion prediction achieved by the factors) was generally much larger than the incremental validity of the Big Five factor measures. It was concluded that aggregating personality traits into their underlying personality factors could result in decreased predictive accuracy due to the loss of trait-specific but criterion-valid variance.
There is some intuitive appeal to the conceptualization that variables of personality are organized hierarchically, arranged according to the breadth of the behavior domains represented. One such model of personality is illustrated in Figure 1, first published by Eysenck (1947) and since cited by many others (e.g., Digman, 1990; Goldberg, 1993; Hampson, John, & Gold- berg, 1986; Paunonen, 1993). That model shows that, starting from the lowest level of the hierarchy, several specific responses or narrow behaviors of a person define a habitual response pattern, or a characteristic mode of behavior. Several such habit- ual response tendencies combine to form what is commonly called a personality trait. And it is a combination of these lower level traits that constitutes what is typically considered a broad factor of personality, residing at the top of the hierarchy.
The example of Figure 1 is a simplification, of course, be- cause it illustrates the partial structure of only one personality factor, namely, Conscientiousness. Several such factors, each independent of the others, are generally thought necessary to describe the whole domain of human behavior. The example is also a simplification because it represents a nested model of personality, in which each component at each level of the hierar- chy is connected to one and only one component above it. This exclusivity is undoubtedly unrealistic as a general rule; a personality trait, for example, could have theoretical and empiri- cal associations with more than one personality factor.
A hierarchical model of personality, as exemplified in Figure 1, raises a number of important questions. For example, what is the correct number of levels to the hierarchy? Four are shown in Figure 1, but a fifth level could easily be accommodated
Sampo V. Paunonen, Department of Psychology, Washington Singer Laboratories, University of Exeter, Exeter, England.
This research was supported by Social Sciences and Humanities Re- search Council of Canada Research Grants 410-91-1282 and 410-95- 1445. Some of the results of Study 1 were presented at the 101st Annual Convention of the American Psychological Association, August 1993, Toronto, Ontario, Canada.
Correspondence concerning this article should be addressed to Sampo V. Paunonen, who is now at Department of Psychology, University of Western Ontario, London, Ontario N6A 5C2, Canada.
by, say, postulating that the higher level factors themselves are structured into a smaller number of superordinate dimensions. There has been some debate recently related to the number of levels of the hierarchy presumed to underlie human personality (e.g., see Cattell & Krug, 1986; Costa & McCrae, 1992a, 1992b; Eysenck, 1992a, 1992b; Hampson et al., 1986), but the issue seems far from being resolved. Much more empirical research in this area is needed.
A second question raised by the model of personality shown in Figure 1 is what is the exact organization of the hierarchy? This issue concerns the evaluation of so-called vertical and hori- zontal aspects of the hierarchy (Goldberg, 1993). There is the problem of identifying the number of factors that define the top level of the hierarchy, for instance, and identifying the specific traits that define each of those factors. Studies of this question have not been lacking. In fact, a substantial volume of recent empirical and theoretical work in the area of personality struc- ture has pertained, in particular, to the evaluation of the organi- zation of the upper two levels of the hierarchy represented in Figure 1. A consensus seems to have arisen among researchers, although it is hardly complete (e.g., see Block, 1995), that there are exactly five higher level factors of personality and, furthermore, that these factors are composed of traits and behav- iors pertaining to (a) Extraversion, (b) Agreeableness, (c) Con- scientiousness, (d) Neuroticism, and (e) Openness to Experi- ence, respectively. (There is still some debate about the label to be applied to the last-named factor, with some researchers label- ing it as Culture and others as Intellect.) These dimensions of behavior have come to be known collectively as the Big Five factors of personality (see reviews by Digman, 1990; John, 1990; McCrae & John, 1992).
Yet another question raised by the model of Figure 1 asks, what are the relative empirical utilities of the different compo- nents of the hierarchy? This issue pertains largely to the mea- surement of individual differences on variables within the hierar- chy and to the subsequent comparison of their ability to explain and to predict human behavior. Unfortunately, not much research has been devoted to answering this question directly. The present studies, however, were designed to address this shortcoming.
538"

PERSONALITY HIERARCHY 539
FACTOR Conscientiousness I LEVEL
Methodicalness TRAIT LEVEL Res~nsibili ty Orderliness Endurance
A RESPONSE LEVEL
SPECIFIC RESPONSE LEVEL
Figure 1. A hierarchical model of personality organization. From Dimensions of Personality by H.J. Eysenck, 1947, London: Routledge & Kegan Paul.
Relative Predictive Utility
There are countless published studies demonstrating the crite- rion predictiveness of measures of lower level traits. There are also many studies showing the criterion predictiveness of mea- sures of higher level factors of personality, such as the Big Five factors. Such evaluations are important for theoretical as well as practical reasons because they provide evidence of the mea- sures' construct validities. Construct validity, however, refers to more than just a property of a psychometric instrument. As implied by the name, construct validation is intended not only to validate the measure of the construct but, pari passu, to verify the existence of the construct itself (Cronbach & Meehl, 1955). Thus, failure to find theoretically expected evidence for the criterion predictiveness of one of the personality factors of the model illustrated in Figure 1, for instance, would be noteworthy; such a result could mean that the measure of the factor is un- sound or that the construct itself is poorly conceptualized. In the latter case, serious misgivings would necessarily arise about the viability of the very model of personality on which the measure is based.
Although it is important to verify the criterion predictiveness of the separate components of any postulated personality hierar- chy, there is also some value to determining the relative predict- ability of those components (Hampson et al., 1986). In terms of relative criterion predictiveness, it has been maintained that there is potentially some utility to measures of both narrow, lower level personality traits and broad, global personality di- mensions. The former preserve variance specific to each individ- ual measure, variance that might be predictive of specific criteria and that might be lost when the measures are combined into a higher level factor (e.g., Ashton, Jackson, Paunonen, Helmes, & Rothstein, 1995; Costa & McCrae, 1995; McCrae & Costa, 1992; Paunonen, Jackson, Trzebinski, & Forsterling, 1992; Pau- nonen, Rothstein, & Jackson, in press). Measures of personality factors, on the other hand, are broader measures and contain
variance that might better predict less specific, more multifac- eted criteria, criteria that share variance with more than one of the lower level traits that constitute the factor (e.g., Costa & McCrae, 1992c, 1995; McCrae & Costa, 1992; Ones & Vis- wesvaran, 1996). Direct empirical tests of these assumptions about relative predictiveness, however, have been scarce (cf. Ashton et al., 1995; Mershon & Gorsuch, 1988; Ones, Schmidt, & Viswesvaran, 1994).
The relative predictive superiority of the lower level traits and the higher level factors in the personality hierarchy is an issue that is of more than theoretical interest. If the broader personality dimensions have predictive advantages over their constituent narrower traits, one might rightly question the value of even measuring the latter, which are much greater in number. Perhaps the relatively few superordinate factors contain all the informa- tion about personality necessary to explain and predict human behavior adequately. Such a position has, it appears, a growing number of adherents in current personality theory.
Much of the literature on the Big Five factors of personality can be interpreted as suggesting that those five factors are the only variables necessary in describing, explaining, and assessing personality. Even a cursory glance at any contemporary person- ality journal will reveal numerous studies evaluating the person- ality correlates of various criteria, in which the only personality variables assessed are the Big Five factors. In the area of indus- trial-organizational psychology, for example, it has been claimed that the Conscientiousness factor of the Big Five ac- counts for most of the variation in worker performance due to personality, in almost all jobs (Barrick & Mount, 1991; cf. Tett, Jackson, & Rothstein, 1992). 1 If that is the case, then
In fact, Ones et al. (1994) have taken that conclusion one step further, claiming that a very broad factor, derived as a linear combination of three of the Big Five factors and representing a construct they call integrity, is the personality dimension most responsible for overall job performance. Their analyses have led them to the observation that "in-

540 PAUNONEN
measurement of the facets of Conscientiousness, such as orderli- ness, responsibility, and ambition, serves little more purpose than providing the raw building blocks out of which the higher level composite is constructed (e.g., Ones & Viswesvaran, 1996).
Overv iew of the Present Studies
It has been argued that there are substantial benefits to be derived from the measurement of components at all levels of the personality hierarchy, beyond simply the top level. These benefits pertain to both the understanding and the prediction of behavior (e.g., Costa & McCrae, 1995; Paunonen, 1993). The purpose of the two studies reported in this article was to verify this claim, in part, by comparing narrower, lower level trait measures with broader, higher level factor measures - -Big Five measures in this c a s e - - i n terms of their relative abilities at predicting a diverse set of criteria. If the factor-based personality measures predict criterion variables at least as well as do their trait-based constituents, then this would be consistent with the view that the variance common to the lower level measures, rather than the variance specific to those measures, is of para- mount importance for behavior prediction (see Ones et al., 1994; Ones & Viswesvaran, 1996). On the other hand, if the trait-based measures predict best, then this would support the argument that predictive losses can accrue when specific vari- ance is discarded as traits are aggregated into their underlying broad factors (e.g., see Ashton et al., 1995; McCrae & Costa, 1992).
Criterion Selection
In any study of the relative predictive merits of different classes of personality variables, the criteria used must be care- fully considered. It might not be surprising to find a broad factor-based predictor outperforming a narrower trait-based pre- dictor in estimating a broad factor-based criterion in which the factors underlying the predictor and criterion are the same. For example, a Big Five measure of Conscientiousness would proba- bly predict peer ratings of overall conscientiousness better than would a relatively narrow trait measure of orderliness. By the same token, it might not be surprising to find the narrow orderli- ness trait measure outperforming the Conscientiousness factor measure in predicting a narrow trait-based criterion, such as ratings of bedroom neatness.
In deciding on the criteria to be used in the present studies, it was thought important to avoid those variables that are simply variants of the personality predictors used. Omitted were Big Five factor measures as the criteria for other measures of the same Big Five factors, or peer ratings on lower level traits as the criteria for self-ratings on the same traits. Instead, a clue was taken from some prediction studies done in the 1960s and 1970s by Goldberg and his associates (e.g., see Goldberg, 1972;
Hase & Goldberg, 1967) and, more recently, by Mershon and Gorsuch (1988). Analogous to those studies, the criteria se- lected for the present research were ones that arguably have some social significance, such as smoking behavior, grade point average (GPA), and ratings of physical attractiveness. Such cri- teria are clearly not just variations of common personality traits or factors, such as those dimensions shown in Figure 1; instead, they are probably multifaceted, multidetermined variables shar- ing their variance with more than one domain of personality.
Spurious Predictions
Two studies are reported in this article, in which participants completed (a) several measures of lower level personality traits, (b) measures of the Big Five factors of personality, and (c) a Behavior Report Form, which contained the criterion measures. Analyses were designed to evaluate the relative utilities of the personality trait measures and the personality factor measures in predicting the criterion variables.
A statistical problem exists with empirical comparisons of the type described above, and it concerns the substantial imbal- ance in the number of predictors that belong to the different strata of the personality hierarchy. The fact that there are, by definition, more lower level traits than higher level factors means that there is a proportionally greater chance of finding personal- ity predictors of the former kind that correlate significantly, but because of Type I error, with any criterion. One way around this problem is to cross-validate all prediction equations (see Goldberg, 1993). Another way is to select equal numbers of each type of predictor to study empirically (e.g., Ashton et al., 1995). Yet a third way is So use statistical procedures to ensure that the Type I error rate is the same for evaluations of predictor sets of different sizes. It was this latter approach to the problem of spurious predictions that was adopted in the two studies reported here.
S tudy 1
Method
Participants and Procedure
A total of 96 undergraduate residents at a university dormitory (36 men and 60 women) volunteered for a study of personality in return for a cash stipend. Participants were 48 same-sex roommate pairs who had been living together for approximately 7 months. Their ages ranged from 18 to 21 years, with a mean of 19.2.
Participants were tested in two sessions separated by 1 week. In the first session they completed a battery of self-report measures. In the second session the same measures were completed in a peer rating format, in which each participant was asked to describe the characteris- tics of his or her roommate. A small amount of missing data was handled using pairwise deletions in computing correlation and regression results. For example, one of the criteria pertained to number of traffic violations received, but 12 participants were nondrivers. Also, 3 participants did not complete a criterion measure pertaining to interest in fraternity mem- bership, and 2 omitted a measure of dating variety.
tegrity tests combine splinter factors of personality into a more meaning- ful superordinate grouping, achieving parsimony and superior predic- tion" (p. 33).
Personality Measures
All of the participants completed measures of lower level personality traits and higher level personality factors, in both self-report and peer

PERSONALITY HIERARCHY 541
rating formats. However, only the self-ratings on the personality mea- sures were used as predictors in this study.
The lower level trait measures of this study were those contained in Jackson's (1984) Personality Research Form-E (PRF). The PRF con- sists of 22 scales of 16 items each, which are responded to using true- false endorsements. The scales used as predictors in the present study were Abasement, Achievement, Affiliation, Aggression, Autonomy, Change, Cognitive Structure, Defendence, Dominance, Endurance, Exhi- bition, Harmavoidance, lmpulsivity, Nurturance, Order, Play, Sentience, Social Recognition, Succorance, Understanding, and Desirability. Omit- ted in the analyses was the Infrequency scale, which measures care- lessness in responding to the items of the PRF.
The higher level personality factor measures used in this study were those of Costa and McCrae's (1992c) NEO Five Factor Inventory (NEO- FFI). The NEO-FFI measures the Big Five factors of Extraversion, Agreeableness, Conscientiousness, Neuroticism, and Openness to Expe- rience. Each scale has 12 items that are responded to on 5-point rating scales.
Criterion Measures
As mentioned earlier, the criteria for this study were chosen to repre- sent variables of some social significance and variables that were not simply variants of the personality predictors used. These criterion mea- sures were contained in the Behavior Report Form (see Figures 2 and 3), which each participant completed in both a self-report and a room- mate-rating format. The two pages of the self-rating version of the Be- havior Report Form are shown in Figures 2 and 3, respectively; the peer rating version differed only in the referent of the rating mentioned in each item (i.e., self or roommate).
Not all criterion variables measured were included in the analyses reported below. Although most of the items on the Behavior Report Form were fairly innocuous and straightforward ratings or objective statements of fact, a few items demanded a degree of impartiality on the part of a person rating him- or herself. Thus, because of possible impression management elicited by some of the more subjective judg- ments, it was decided to use peer ratings as the criterion data for the following variables: attractiveness, intelligence, popularity, and honesty. For the remaining variables, it was thought that self-reports would be the more accurate indices of behavior. A few of the self-report variables, however, had to be eliminated or transformed. First, the present sample's overall lack of participation in fraternities or sororities (only one partici- pant belonged to a fraternity) meant that that variable had to be omitted from the criterion pool, and only the variable assessing interest in such membership was evaluated. Second, the masculinity-femininity self- ratings and peer ratings correlated so highly with subject sex (r = .68 and :73, respectively) that those ratings were also omitted from the criterion pool (sex was used as a covariate in the analyses that follow). Finally, the three frequency counts of different types of traffic violations were combined into one variable representing the mean number of all such violations per year of driving experience.
The final criterion pool was a total of 13 variables, of which 4 were based on peer ratings. These variables are listed below, along with their abbreviations (in parentheses) as used in the tables that follow: (a) grade point average (GPA); (b) number of dates per month (Datel); (c) number of different people dated per month (Date2); (d) smoking behavior rating (Smokl); (e) number of cigarettes smoked (Smok2); ( f ) choice of liberal arts or non liberal arts program of study ( Arts ), (g) interest in fraternity or sorority membership (Frat); (h) mean number of traffic violations per year (Viol); (i) self-rated religiosity (Relg); (j) roommate rating of physical attractiveness (Attr); (k) roommate rating of intelligence (Intl); (1) roommate rating of popularity (Popl); and (m) roommate rating of honesty (Hons). Sex of subject (Sex) was also used as a criterion in some analyses.
Results and Discussion
Reliability of Measures
The coefficient alpha reliabilities of the participants' re- sponses to the 16-item PRF scales ranged from .59 (Desirabil- ity) to .91 (Order) , with a mean of .77. These values, shown in the last column of Table 1, are in line with those published in the PRF manual (Jackson, 1984). The reliabilities of the participants' ratings on the 12-item N E O - F F I scales, shown in the last row of Table 1, ranged from .75 (Openness to Experi- ence) to .88 (Neuroticism), with a mean of .82. The somewhat higher mean internal consistency for the N E O - F F I scales versus the longer PRF scales is probably due to the fact that the latter use t rue-fa lse item endorsements, whereas the former use multi- ple category (5-point) ratings as responses (see Velicer, Govia, Cherico, & Corriveau, 1985; Velicer & Stevenson, 1978).
Unfortunately, the criterion measures could not be assessed for internal consistency reliability because each was a 1-item scale. Because of their short length, some of the criterion mea- sures, especially those reflecting peer judgments, might be somewhat unreliable. On the other hand, despite their short length, other more objective criteria, such as the reports of GPA and number of cigarettes smoked per day, might be quite reliable.
Predictor-Criterion Correlations
The participants' lower level PRF trait scale scores and higher level N E O - F F I factor scale scores were first correlated with each other. Because of possible gender differences on some of the variables, however, it was necessary to partial participant gender out of those correlations. Otherwise, simple mean differ- ences between the sexes in predictor variables could cause those variables to correlate in the mixed-sex sample, whereas they might not correlate in either single-sex sample. The resultant partial correlations are shown in Table 1. The pattern of values closely resembles that of other P R F - N E O correlations reported by Costa and McCrae (1988). (Those authors used the longer NEO-PI form in that study.)
The next analysis was to correlate the PRF and NEO-FFI scale scores with the criterion variables. As mentioned earlier, however, the universe of lower level personality traits outnum- bers the universe of higher level personality factors. Even in this study, the former are represented by 21 PRF measures, whereas the latter by only 5 NEO-FFI measures. This means that there was a 4.2 times greater probability for the PRF scales of finding significant criterion predictions, by chance alone, than for the NEO-FFI scales. The solution to this problem used in this study was to evaluate the correlations for the lower level scales using a level of alpha, which sets the Type I error rate for each correla- tion, at about one fourth the level used for the higher level scales. Therefore, whereas the criterion correlations for the NEO-FFI predictors were assessed in terms of the usual p = .05 level of significance, the PRF predictors were evaluated in terms of a p = .0119 level.
Lower level PRFpredictors. The partial correlations (with participant gender removed) between the criteria and the PRF personality scale scores are shown in Table 2. Perusing those

542 PAUNONEN
Your Name: Student Number: Sex:
Behavior Report Form
I N S T R U C T I O N S . Please answer all of the questions below about you. Be as accurate
as possible and do not omit any item.
1. How would you rate your level ofphysical attractiveness compared to the average student? Circle a number on the following scale:
UNATI'RACTIVE AVERAGE ATTRACTIVE 1 2 3 4 5 6 7 8 9
Extremely Very Moderately Somewhat Somewhat Moderately V e r y Extremely
2. How would you rate your level of general intelligence compared to the average student? Circle a number on the following scale:
UNINTELLIGENT AVERAGE INTELLIGENT 1 2 3 4 5 6 7 8 9
Extremely Very Moderately Somewhat Somewhat Moderately V e r y Extremely
3. In relation to people you know, how would you describe your popularity among your peers?
UNPOPULAR AVERAGE POPULAR 1 2 3 4 5_. 6 7 8 9
Extremely Very Moderately Somewhat Somewhat Moderately V e r y Extremely
4. In relation to other people of your sex, how masculine~feminine are you? AVERAGE
MASCULINE FOR MY SEX FEMININE 1 2 3 4 5 6 7 8 9
Extremely Vet'/ Moderately Somewhat Smuewhat Moderately V e r y Extremely
5. Would you consider yourself a religious person who, for example, might be interested in attend- ing (or already does attend) formal religious services?
NONRELIGIOUS AVERAGE RELIGIOUS 1 2 3 4 5_. 6 7
Extremely Very Moderately Somewhat Somewhat Moderately
6. How would you describe your honesty compared to that of your friends?
DISHONEST AVERAGE 1 2 3 4 5 6 7
Extremely Very Moderately Somewhat Somewhat Moderately
8 9 Very Extremely
HONEST 8 9
Very Extremely
Continued over. . .
Figure 2. Page 1 of the Behavior Report Form, containing measures of the criterion variables.
correlations, one can see that the lower level traits were able to predict (at p < .0119) 10 of the 14 criteria (including partici- pant gender). Criteria not predicted by any PRF scale were dating frequency, dating variety, and number of traffic violations. Also, the number of cigarettes smoked per day was not pre-
dicted, although the smoking behavior rating was. Of the 21 traits listed in Table 2, 13 predicted some criterion. The 8 excep- tions were the PRF scales of Abasement, Affiliation, Change, Cognitive Structure, Defendence, Dominance, Endurance, and Exhibition.

PERSONALITY HIERARCHY
7. Indicate your overall average grade for last Year: % (percent)
8. Estimate the average number of dates per month that you have had this past year with someone of the opposite sex? (per month)
How many different people did you date over the course of the past year?
9. Do you consider yourself a nonsmoker, infrequent smoker, light smoker, moderate smoker, or heavy smoker? Circlea number below.
1 2 3 4 5 Non- Infrequent Light Moderate Heavy
Smoker Smoker Smoker Smoker Smoker
If you smoke, how many cigarettes do you smoke a day on average? ~ (per day)
10. If you had to choose one program of study (or, if you have already chosen one), which of the two below would you (did you) choose? Check one.
(1) LiberalArts (Arts, Fine Arts, Humanities, etc.) (2) Non-LiberalArts (Natural Sciences, Social Sciences, Professional Schools, etc.)
543
11. Are you currently a fraternity~sorority member or pledge? Check one.
(1) no (2) ., yes
If you are not currently a fraternity/sorority member or pledge, how much interest would you have in joining a fraternity/sorority?
UNINTERESTED NEUTRAL INTERESTED 1 2 3 4 5_ 6 7 8 9
Extremely Very Moderately Somewhat Somewhal Moderalely V e r y Extremely
12. How long have you had a driver's license? Put 0 if never.
If you have a driver's license:
How many speeding tickets have you had in the past? _ _
How many parking tickets?
How many other traffic violations? _ _
(years)
S T O P
Figure 3. Page 2 of the Behavior Report Form, containing measures of the criterion variables.
Most of the significant predictor-cri ter ion correlations in Ta- ble 2 are readily interpretable. For example, GPA was predicted by achievement striving ( r = .27) and low playfulness ( r = - . 2 7 ) ; smoking behavior was associated with individual differ- ences in impulsivity ( r = .38) and orderliness ( r = - . 30 , see also Smith, 1969); interest in fraternity membership was pre- dicted by the need for social recognition ( r = .42); religiosity was related to the tendency to display nurturant behaviors ( r = .36); roommate perceptions of attractiveness were predicted by individual differences in participants' social desirability ( r =
.34); ratings of intelligence were associated with the need for understanding ( r = .27); and the women in the sample tended to be more harmavoidant ( r = .30), nurturant ( r = .47 ), sentient ( r = .32), and in need of succorance ( r = .34) than were the men. A few correlations, however, are less easily understood. For instance, it is not clear why peer ratings of honesty should be associated with their roommates ' levels of nurturance ( r = .38), especially given that participant gender was partialed out of these correlations.
Higher level NEO-FFI predictors. The partial correlations

5 4 4 PAUNONEN
Table 1 PRF and NEO-FFI Scale Score Partial Correlations (Participant Gender Removed) and Reliabilities
NEO scales
PRF scales E A C N O ct
Abasement 27"* 36"* - 10 12 - 0 2 64 Achievement 12 - 11 56" * 13 27 * * 78 Affiliation 67** 27** - 0 6 -28** 10 80 Aggression - 08 -71"* - 0 6 28** 03 74 Autonomy -37** -45** - 1 4 -08 19 76 Change 20 -22* -12 -12 41"* 71 Cognitive Structure - 2 0 - 10 49** 27** -23* 76 Defendence - 1 9 - 5 3 " * - 0 3 20 - 1 8 72 Dominance 13 - 4 5 " * 15 - 0 9 27 * 90 Endurance 13 - 1 6 4 6 " * - 1 0 2 7 * * 77 Exhibition 60** - 16 01 - 15 25* 86 Harmavoidance - 26" 24" 13 27 * * - 35 * * 90 Impulsivity 35** - 14 -50** 03 30** 79 Nurturance 44** 37** 02 05 26* 81 Order - 17 - 0 4 62** 17 -28** 91 Play 58** 23* -27** -28** 08 64 Sentience 32** -05 13 10 57** 67 Social Recognition 15 10 09 47** - 0 6 84 Succorance 29"* 32"* 07 30"* - 13 81 Understanding 03 - 09 06 01 48 * * 75 Desirability 36** 24* 41"* -50** 20 59
a 80 86 81 88 75
Note. Decimals are omitted. PRF = Personality Research Form; NEO-FFI = NEO Five-Factor Inventory; ct = coefficient alpha reliability; E = Extraversion; A = Agreeableness; C = Conscientiousness; N = Neuroticism; O = Openness to Experience. * p < . 0 5 . **p <.0119.
(wi th participant gender removed) between the criteria and the NEO-FFI personality scores are shown in Table 3. As did the PRF scales, the Big Five factors predicted 10 of the 14 criteria (p < .05). The four exceptions were number of cigarettes smoked per day, choice of liberal arts or non liberal arts program of study, peer ratings of intelligence, and peer ratings of honesty. All five personality factors predicted some criterion, al though Agreeableness and Neuroticism were most successful in this regard, each being associated with five criteria.
Some of the correlations shown in Table 3 are interpretable f rom a psychological perspective. Smoking behavior was pre- dicted negatively by Conscientiousness ( r = - . 2 9 , see also Ashton et al., 1995; Smith, 1969) and positively by Neuroticism ( r = .25); peer ratings of popularity were related to Extraver- sion ( r = .25), Agreeableness ( r = .24), and low Neuroticism ( r = - . 34) ; and participant gender was predicted by Agreeable- ness ( r = .24) and Openness to Experience ( r = .30; with the women being higher than the men on these dimensions) . Other p red ic tor -c r i te r ion correlations, in contrast, were less easily explained. For instance, it is unclear why low Agreeableness should be associated with dating frequency ( r = - . 2 3 ) and dating variety ( r = - . 2 1 ) - - t h e reverse would seem to be more understandable. It is also not entirely clear why low Agreeable- ness predicts high GPA ( r = - . 2 4 ) or why Neuroticism is positively associated with religiosity ( r = .24) and interest in
fraternity membership ( r = .26) and negatively associated with ratings of physical attractiveness ( r = - . 3 2 ) .
Partial set correlations. Cohen and Cohen ' s (1983) method of set correlation was next applied to the present data. Set correlat ion yields a single index of the amount of shared vari- ance between a group of predictor variables and a group of criterion variables, being similar to canonical correlation analy- sis but without certain problems identified with the latter method (see Cohen & Cohen, 1983, pp. 4 8 9 - 4 9 0 ) . When all PRF scales were used to predict all criterion variables simultaneously (with gender removed from both sets) , the shrunken partial set corre- lation was .84 (p < .001). When the NEO-FFI scales were used to the same end, the shrunken partial set correlation was only .68 (p < .001 ). The set of PRF scales, therefore, accounted for 24.2% more variance in the criteria as a whole than did the set of NEO-FFI scales.
Predictors and Incremental Validity
There is another method of evaluating the relative predictive merits of lower level trait measures and higher level factor mea- sures, besides simply comparing pred ic tor -c r i te r ion correlation coefficients. That method is to determine whether the one type of predictor accounts for variance in the criterion beyond that accounted for by the other type. To illustrate, the lower level

PERSONALITY HIERARCHY
Table 2
Partial Correlations (Participant Gender Removed) Between Criteria and Participants' PRF Scale Scores
5 4 5
Criterion a
PRF scale GPA Datel Date2 Smokl Smok2 Arts Frat Viol Relg Attr Intl Popl Hons Sex a
Abasement - 2 1 " - 13 - 13 - 0 3 - 10 - 0 3 02 04 26* - 14 - 0 9 14 03 - 0 5 Achievement 27** 05 - 0 6 - 0 9 - 0 4 - 10 20 05 24* - 0 6 09 - 0 4 23* 02 Affiliation - 2 0 - 0 9 - 0 2 - 0 3 - 0 3 - 0 8 - 0 2 00 03 01 - 14 22* 12 13 Aggression 19 15 08 27** 22* 20 05 09 02 06 01 - 0 9 - 0 2 - 1 8 Autonomy 16 09 11 07 10 23* - 1 4 01 - 1 0 05 20 - 1 7 - 2 5 * - 4 2 * * Change - 0 1 - 0 1 06 00 - 0 2 03 - 1 2 09 13 02 - 0 1 - 2 0 - 1 1 21" Cognitive Structure 19 - 0 7 - 0 3 - 0 8 - 0 3 - 1 8 21" - 1 0 02 - 0 1 03 - 0 4 19 07 Defendence 21" 11 06 14 17 06 04 - 0 8 - 1 9 10 22* - 0 4 05 - 0 5 Dominance 01 16 08 11 08 16 10 05 13 10 08 - 1 4 13 - 0 7 Endurance 14 03 05 - 0 9 - 0 2 - 14 12 07 08 04 05 04 17 - 0 7 Exhibition - 1 5 23* 13 21" 11 12 14 16 - 0 2 21" - 1 8 12 - 0 8 06 Harmavoidance - 0 1 - 0 6 - 1 7 - 0 3 - 1 3 - 0 1 20 - 0 1 07 - 1 2 - 1 2 - 0 2 10 30** Impulsivity 02 10 13 38** 25* 28** - 1 6 09 - 0 5 - 1 2 - 1 7 01 - 1 4 - 0 0 Nurturance - 2 5 * 01 - 1 8 04 - 0 2 - 0 5 16 07 36** - 0 5 - 1 9 13 38** 47** Order - 1 1 01 - 0 6 - 3 0 * * - 2 3 * - 1 9 12 07 18 06 - 0 6 - 1 2 08 03 Play - 2 7 * * 01 24* 06 - 0 6 - 0 9 - 0 3 12 - 0 9 09 - 18 28** - 11 - 0 5 Sentience - 0 3 - 0 5 06 09 03 03 12 27* 25* - 0 1 05 03 10 32** Social Recognition 02 01 11 04 - 1 0 - 0 8 42** 04 16 - 0 1 - 0 8 - 0 1 - 0 3 17 Succorance 03 03 - 0 7 06 - 0 4 - 0 4 - 0 4 - 1 3 06 - 1 2 - 0 9 04 06 34** Understanding 05 - 0 8 - 1 2 11 07 11 06 04 25* - 0 9 27** - 0 5 12 25* Desirability - 0 7 - 0 8 - 0 5 - 1 8 - 0 6 - 1 8 07 04 02 34** 08 32** 24* 05
Note. Decimals are omitted. PRF = Personality Research Form; GPA = grade point average; Datel = dating frequency; Date2 = dating variety; Smokl = smoking rating; Smok2 = smoking amount; Arts = liberal arts study; Frat = fraternity interest; Viol = traffic violations; Relg = religiosity; Attr = attractiveness; Intl = intelligence; Popl = popularity; Hons = honesty; Sex = participant gender.
Participant gender is not partialed. * p < .05. * * p < .0119.
P R F sca les c an first be u s e d to p red ic t the c r i te r ion var iables .
Then , the B ig Five fac tor sca les can be a d d e d to the p red ic t ion
equa t i ons to see w h e t h e r they inc rease any o f the cor re la t ions .
T h e resu l t s w o u l d then be c o m p a r e d wi th those f r o m the reverse
s i tua t ion , in w h i c h the fac tor sca les are en te red first in to the
p red ic t ion equa t ions , and the lower level sca les eva lua ted for
thei r i nc r emen ta l con t r i bu t i ons to pred ic t ive validity.
Tests o f i nc remen ta l val id i ty are i m p o r t a n t in the p r e sen t con-
text b e c a u s e o f the g r o w i n g t endency o f r e sea rche r s to re ly on ly
on Big Five fac tor m e a s u r e s in pe r sona l i ty p red ic t ion s tudies .
I f the B ig Five a c c o u n t for m o s t o f the var ia t ions in h u m a n
behavior , then par t i a l ing those fac tors ou t o f the lower level
t rai ts shou ld leave little val id va r i ance b e h i n d for cr i ter ion pre-
dict ion. Bu t i f there is ev idence o f i nc r emen ta l val id i ty to the
trait m e a s u r e s , then one m u s t ques t ion the be l i e f tha t the c o m -
m o n va r i ance unde r ly ing the fac tors o f pe r sona l i ty is suf f ic ient
for op t ima l predic t ion . S u c h an o u t c o m e w o u l d imp ly tha t the
specif ic va r i ance o f ind iv idua l pe r sona l i ty trai t sca les adds use -
ful i n f o r m a t i o n to the u n d e r s t a n d i n g and p red ic t ion o f behavior .
A c o m p l e m e n t a r y in te rpre ta t ion w o u l d apply, o f course , i f the
Table 3
Partial Correlations (Participant Gender Removed) Between Criteria and Participants' NEO-FFI Scale Scores
Criterion
NEO scale GPA Datel Date2 Smokl Smok2 Arts Frat Viol Relg Attr Intl Popl Hons Sex a
Extraversion - 1 5 - 0 3 09 03 - 0 1 - 0 3 06 14 04 11 - 1 8 25* 14 18 Agreeableness - 2 4 * - 2 3 * - 2 1 " - 1 6 - 1 3 - 2 0 05 - 0 3 - 0 4 - 1 2 - 1 7 24* 16 24* Conscientiousness 06 03 04 - 2 9 * * - 1 7 - 1 5 16 05 05 10 10 - 0 4 11 16 Neuroticism 18 01 01 25* 10 13 26* 05 24* - 3 2 * * - 1 2 - 3 4 * * - 0 3 18 Openness to Experience 08 04 - 0 6 21" 15 18 19 25* 11 08 10 03 10 30**
Note. Decimals are omitted. NEO-FFI = NEO Five-Factor Inventory; GPA = grade point average; Datel = dating frequency; Date2 = dating variety; Smokl = smoking rating; Smok2 = smoking amount; Arts = liberal arts study; Frat = fraternity interest; Viol = traffic violations; Relg = religiosity; Attr = attractiveness; Intl = intelligence; Popl = popularity; Hons = honesty; Sex = participant gender. a Participant gender is not partialed. * p < .05. * * p < . 0 1 1 9 .

546 PAUNONEN
factor-based personality measures were found to have incremen- tal validity, adding to the criterion prediction of the lower level trait measures. In that case, the implication is that the variance underlying the factors adds something unique to prediction be- yond that provided by the variance of the individual traits.
In the analyses reported below, the predictor-cri terion partial correlations shown in Tables 2 and 3 were first corrected for attenuation in the predictors, using the reliabilities reported in Table 1. The set of PRF trait scales was then searched using stepwise regression for predictors of the criterion variables. Following that, the set of NEO-FFI measures of the Big Five factors was searched, again using stepwise regression, for scales that increased the degree of criterion prediction already achieved with the lower level predictors. The reverse case was also evalu- ated, in which the NEO-FFI factor scales were entered into the prediction equations first, followed by the PRF trait scales. It is important to note that the size of alpha used in deciding whether a predictor was statistically significant differed in these analyses according to the set of predictors being assessed. As in the correlational analyses, the NEO-FFI predictors were eval- uated at p < .05, whereas the larger number of PRF predictors were evaluated at p < .0119. Furthermore, all multiple correla- tions reported have been corrected for shrinkage for the number of participants and predictors in the analyses.
Incremental validity o f the NEO-FFI scales. The results of the first set of regression analyses are shown in Table 4. Column 1 lists the multiple correlations (shrunken) with the criteria of
any PRF scale(s) that added significantly (p < .0119) to predic- tion (those scales' names and the signs of their corresponding regression weights are summarized in parentheses, and each multiple correlation is based on all significant predictors to- gether in the regression equation). Column 2 of Table 4 shows the multiple correlations (shrunken) with the criteria of any NEO-FFI scale(s) found to increase prediction (p < .05) be- yond that of any significant PRF predictors (where applicable). The last column in Table 4 reveals the percentages of criterion variance accounted for by the significant NEO-FFI predictors in the equations, after partialing out (participant gender and) the significant PRF predictors. These percentages indicate the size of the NEO-FFI scales' incremental validities in relation to the validities of the lower level trait measures.
Examination of Table 4 reveals that including lower level personality traits in the regression equations added substantially to criterion prediction in most cases. Of the 14 criteria, with gender partialed, 13 could be predicted significantly (p < .0119) by participant standing on one or more of the PRF scales. Adding Big Five factor predictors to the equations further increased prediction (p < .05) of 7 of the 14 criteria. Thus, in those 7 cases, the personality factors were able to account for variance in the behavior criteria beyond that accounted for by the lower level personality traits. The mean additional criterion variance accounted for by the Big Five factors was 4.2%, averaged across the 7 criterion variables, or 2.1% if averaged across all 14 criteria.
Table 4 Multiple Correlations R (Shrunken) in Predicting Criterion Variables With PRF Scale Scores and NEO-FFI Scale Scores (Gender Partialed)
Predictor
Criterion PRP PRF + NEO b % change ~
Grade point average 32 (-P1) Dating frequency 21 ( -A) 4.6* Dating variety 40 (+P1, -Nu) 44 ( -A) 3.9* Smoking rating 47 (+Im, +Ag) 50 (+N) 3.0* Smoking amount 26 (+Im) Liberal arts study 38 (+Im, -P1) Fraternity interest 60 (+Sr, -Su, +Ac) Traffic violations 32 (+Se) Religiosity 50 (+Nu, +Un, +Or) 53 (+N) 3.3* Attractiveness 44 (+Dy) 50 ( -A) 5.5** Intelligence 41 (+Un, +De) 48 (-N, -E) 6.4* Popularity 60 (+P1, -Ch, +Dy) 62 ( -C) 2.7* Honesty 49 (+Cs, +Nu) Sex d 58 (+Nu, +Ha, +Ch)
Note. Decimals in R values are omitted. PRF = Personality Research Form; NEO-FFI = NEO Five-Factor Inventory.
Blank cell means no PRF scale significantly increased R at p < .0119. Significant PRF scales are shown in parentheses: Ac = Achievement; Ag = Aggression; Ch = Change; Cs = Cognitive Structure; De = Defendence; Ha = Harmavoidance; I m = Impulsivity; Nu = Nurturance; P1 = Play; Se = Sentience; Sr = Social Recognition; Su = Succorance; Un = Understanding; Dy = Desirability. b Blank cell means no NEO scale significantly increased R at p < .05. Significant NEO scales are shown in parentheses: A = Agreeableness; C = Conscientiousness; E = Extraversion; N = Neuroticism. c Percentage change in criterion variance accounted for by the addition of the NEO predictors to the PRF predictors. d Participant gender is not partialed. *p <.05. **p <.0119.

PERSONALITY HIERARCHY 547
Incremental validity of the PRF scales. In the next set of analyses, the order of variable entry into the prediction equations was changed from that described in the section above. The NEO-FFI scale scores were first included in the equations, in order to determine whether any personality factor could add to criterion prediction. Next, the PRF scale scores were included, assessing the incremental contributions of the lower level per- sonality traits to the personality factors in prediction. The results of these analyses are shown in Table 5.
As can be seen in the first column of Table 5, the NEO-FFI scales added significantly (p < .05) to the prediction of l l of the 14 criteria. Moreover, adding the lower level PRF traits to the equations further increased the prediction (p < .0119) of 12 of the 14 criteria. Note, however, in comparison with the analyses of the personality factors' incremental effects shown in Table 4, the relatively large percentages of additional criterion variance accounted for by the present lower level personality traits, averaging 15.7% across the 12 criterion variables, or 13.5% if averaged across all 14 criteria.
Bipartial set correlations. Set correlations were used again to determine the overlap between the PRF scales and the crite- rion variables and between the NEO-FFI scales and the criterion variables. On this occasion, however, bipartial set correlations (Cohen & Cohen, 1983) were computed, in which one group of predictors was partialed from the other before computing predictor-cri terion associations. Thus, the total amount of crite- rion variance accounted for by the NEO-FFI set of scales, above
and beyond the PRF set, could be determined. This amount could then be compared with the amount accounted for by the PRF set over the NEO-FFI set. The shrunken bipartial set corre- lation between the criterion set (with gender partialed) and the NEO-FFI scales (with the PRF scales partialed) was .00. (Note that the correction for shrinkage can reduce an otherwise posi- tive correlation to zero.) The corresponding value for the PRF scales (with the NEO-FFI scales partialed) was .32 (p < .05). Thus, considering the criterion set as a whole, the PRF scales were able to increase the criterion prediction of the NEO-FFI scales by about 10.2%, whereas the NEO-FFI scales showed no such increment over the PRF.
Summary. It is worthwhile summarizing the results of the present regression analyses at this point. Both the variance of the personality factors and the variance of the personality traits separately predicted most of the individual criteria of this study. Moreover, removing either of these sources of variance out of the other still left residual variation that was predictive of many of those criteria. Partialing the variance due to the personality traits out of the Big Five predictors left variation in the latter that was correlated with several of the criteria, as seen in Table 4. And partialing the variance due to the personality factors out of the lower level predictors similarly left variation in those predictors that was correlated with many criteria, as seen in Table 5. Thus, both the narrow, lower level personality trait measures and the broad, higher level personality factor measures in this study demonstrated significant levels of incremental va-
Table 5 Multiple Correlations R (Shrunken) in Predicting Criterion Variables With NEO-FFI Scale Scores and PRF Scale Scores (Gender Partialed)
Predictor
Criterion NEO a NEO + PRF b % change °
Grade point average 24 ( -A) 36 (+Ac) 7.2** Dating frequency 23 ( -A) Dating variety 20 ( -A) 41 (+PI) 12.6'** Smoking rating 43 (-C, +N, +O) 49 (+Im) 5.8** Smoking amount 26 (+Im) 7.0** Liberal arts study 26 ( -A, +O) 35 (-En) 5.8* Fraternity interest 41 (+N, +O, +C) 64 (+Sr, -Su, +Au) 27.8*** Traffic violations 27 (+O) Religiosity 24 (+N) 53 (+Nu, +Un, +Or) 22.8*** Attractiveness 32 ( -N) 50 (+Dy, +De) 14.8"** Intelligence 41 (+Un, +De) 16.6"** Popularity 40 (-N, +A) 60 (+Dy, +P1, -Ch) 20.0*** Honesty 49 (+Nu, +Cs) 23.7*** Sex ° 35 (+A, +O) 60 (-Au, +Ch, +Ha) 24.5***
Note. Decimals in R values are omitted. NEO-FFI = NEO Five-Factor Inventory; PRF = Personality Research Form.
Blank cell means no NEO scale significantly increased R at p < .05. Significant NEO scales are shown in parentheses: A = Agreeableness; C = Conscientiousness; N = Neuroticism; O = Openness to Experience. b Blank cell means no PRF scale significantly increased R at p < .0119. Significant PRF scales are shown in parentheses: Ac = Achievement; An = Autonomy; Ch = Change; Cs = Cognitive Structure; De = Defendence; En = Endurance; Ha = Harmavoidance; Im = Impulsivity; Nu = Nurturance; P1 = Play; Sr = Social Recognition; Su = Succorance; Un = Understanding; Dy = Desirability. c Percentage change in criterion variance accounted for by the addition of the PRF predictors to the NEO predictors. d Participant gender is not partialed. *p < .05. **p < .0119. ***p < .001.

548 PAUNONEN
lidity relative to each other. The incremental validity of the personality trait predictors, however, was generally much higher than that of the personality factor predictors.
S tudy 2
M e ~ o d
Overview
Study 2 was designed to test the generality of the criterion predictive- ness results of Study 1 by extending those findings to new personality variables. Although the same higher level personality factor predictors were used in this study as in the first study (i.e., the Big Five), the lower level trait predictors were different.
Participants and Procedure
A total of 92 undergraduate residents at a university dormitory (28 men and 64 women who had not participated in Study 1 ) volunteered for a study of personality in return for a cash stipend. Participants were 46 same-sex roommate pairs who had been living together for approximately 7 months. Their ages ranged from 17 to 24 years, with a mean of 19.2. As in Study 1, participants were tested in two sessions separated by 1 week. In the first session they completed a battery of self-report measures. In the second session the same measures were completed in a peer-rating format, in which each participant was asked to describe the characteristics of his or her roommate.
Personality Measures
All of the participants completed measures of lower level personality traits and higher level personality factors, in both self-report and peer- rating formats. As in Study l, only the self-ratings on the personality measures were used as predictors.
The lower level trait measures of this study were those contained in the Jackson Personality Inventory (JPI; Jackson, 1976). The JPI consists of 16 scales of 20 items each, which are responded to using true-false endorsements. The scales used as predictors in this study were Anxiety, Breadth of Interest, Complexity, Conformity, Energy Level, Innovation, Interpersonal Affect, Organization, Responsibility, Risk Taking, Self- Esteem, Social Adroitness, Social Participation, Tolerance, and Value Orthodoxy. Omitted in the analyses was the JPI Infrequency scale, which measures carelessness in responding to the questionnaire. Apart from their names, most JPI trait scales are manifestly different in content from the PRF scales used in Study 1. Whereas the latter constructs represent 20 variables in the tradition of Murray (1938), the former represent measures derived from the more recent research in individual differences (see Jackson, 1976, 1994; Paunonen & Jackson, 1996).
The higher level personality factor measures used in this study were the same as those used in Study 1, namely, the NEO-FFI scales of Extraversion, Agreeableness, Conscientiousness, Neuroticism, and Openness to Experience (Costa & McCrae, 1992c).
Criterion Measures
The criterion measures used in this study were, to maintain compara- bility, the same as those used in Study 1. Thus, the Behavior Report Form (Figures 2 and 3) was administered to participants in both self- report and peer-rating formats. The specific variables analyzed and re- ported below are those already referred to in the Results and Discussion section of Study l.
Results and Discussion
Reliability o f Measures
The coefficient alpha reliabilities of the participants' t rue - false responses to the 20-item JPI scales ranged from .61 (Social Adroitness) to .91 (Conformity) , with a mean of .79. These values, shown in the last column of Table 6, are consistent with those published for the JPI (Jackson, 1977, 1994). The reliabilities of the participants' 5-point ratings of the 12-item NEO-FFI scales, shown in the last row of Table 6, ranged from .68 (Openness to Experience) to .85 (Conscientiousness), with a mean of .77. The comparable mean alpha coefficients for the two questionnaires suggests that the attenuation in reliability due to the shorter length of the NEO-FFI scales was compensated for by the increase in reliability due to its use of multiple category ratings as responses.
Predictor-Criterion Correlations
The lower level JPI trait scale scores and the higher level NEO-FFI factor scale scores were first correlated with each other. Those correlations, with gender partialed, are shown in Table 6. The personality scales were then correlated with the criteria. As in Study 1, those correlations, reported below, were evaluated at the p < .05 level for the 5 NEO-FFI scales, but at a reduced level for the 15 JPI scales (p < .0167).
Lower level JPI predictors. The partial correlations (with participant gender removed) between the criteria and the JPI personality scale scores are shown in Table 7. Examining those correlations, one can see that the lower level traits were able to predict (p < .0167) 11 of the 14 criteria. Not predicted were participants' GPA, dating frequency, and peer ratings of their popularity. Of the 15 JPI traits, all but 1 predicted some crite- rion, the exception being Social Adroitness.
Most of the significant personality trai t-cri terion correlations shown in Table 5 are meaningful from a theoretical point of view. For instance, the number of different people dated was negatively related to the need for closeness and affect in interper- sonal relations ( r = - . 3 6 ) ; the number of cigarettes smoked was positively correlated with risk-taking behavior ( r = .37), and the smoking behavior rating was negatively correlated with the need for conformity ( r = - .41 ); choice of liberal arts study was associated with a preference for cognitive complexity ( r = .28) and with tolerance for others ( r = .29); the students' interests in fraternity membership were related to their levels of conformity ( r = .33); self-rated religiosity was predicted by a personality variable pertaining to having orthodox or conven- tional values ( r = .47); participants who received the higher roommate ratings of intelligence generally showed the higher levels of cognitive complexity ( r = .30); and the women stu- dents tended to be higher than the men on behaviors related to interpersonal affect ( r = .33), organization ( r = .26), and responsibility ( r = .40). A few of the predictor-cri terion corre- lations, in contrast, are less interpretable. It is not immediately clear why the number of traffic violations was predicted by individual differences in the tolerance of others ( r = .34); why attractiveness ratings were associated with low breadth of inter- est ( r = - . 2 7 ) , low energy level ( r = - . 3 3 ) , and low organiza-

PERSONALITY HIERARCHY
Table 6
JPI and NEO-FFI Scale Score Partial Correlations (Participant Gender Removed) and Reliabilities
NEO scale
JPI scale E A C N O a
Anxiety - 0 1 - 0 4 10 68** - 0 3 81 Breadth of Interest 20 - 12 17 - 15 68** 83 Complexity - 0 3 - 2 2 * 04 - 12 62** 71 Conformity - 12 36** 01 39** - 2 6 * 91 Energy Level 23* - 0 5 33** - 3 0 * * 39** 83 Innovation 17 - 2 8 * * - 0 7 - 0 4 50** 88 Interpersonal Affect 28** 17 - 0 1 29** 04 81 Organization - 17 07 61 ** 12 - 0 1 73 Responsibility 12 36** 24* 00 00 74 Risk Taking 09 - 4 1 * * - 13 07 24" 86 Self Esteem 50** - 2 5 * 15 - 4 0 * * 25* 89 Social Adroitness - 0 4 - 19 - 14 16 14 61 Social Participation 44** 11 01 07 - 2 4 * 83 Tolerance 05 25 * 12 - 19 25 * 68 Value Orthodoxy - 0 1 15 - 0 3 19 - 2 7 * 78
a 70 79 85 84 68
Note. Decimals are omitted. JPI = Jackson Personality Inventory; NEO-FFI = NEO Five-Factor Inventory; a = coefficient alpha reliability; E = Extraversion; A = Agreeableness; C = Conscientiousness; N = Neuroticism; O = Openness to Experience. * p < . 0 5 . * * p < . 0 1 6 7 .
5 4 9
t ion ( r = - . 3 0 ) ; o r w h y pee r pe rcep t ions o f h o n e s t y were
nega t ive ly cor re la ted wi th a p r e f e r ence for i nnova t i on ( r =
- . 2 6 ) .
Higher level NEO-FFI predictors. T h e par t ia l co r re la t ions
( w i t h pa r t i c ipan t gender r e m o v e d ) b e t w e e n the cr i ter ia an d the
N E O - F F I pe r sona l i ty s co re s are s h o w n in Table 8. The B ig Five
fac tors p red ic t ed 7 o f the 14 cr i ter ia ( p < .05) . T h o s e s ign i f i can t
co r re la t ions a re largely in terpre table : The n u m b e r o f c igare t tes
Table 7
Partial Correlations (Participant Gender Removed) Between Criteria and Participants' JPI Scale Scores
Criterion
JPI scale GPA Datel Date2 Smokl Smok2 Arts Frat Viol Relg Attr Intl Popl Hons Sex ~
Anxiety 20 - 0 1 - 2 9 * * 02 - 0 7 - 0 4 02 08 22* - 0 4 - 0 5 - 0 1 22* 23* Breadth of Interest 08 14 20 33** 23* 17 00 - 1 1 - 0 6 - 2 7 * * 06 - 2 3 * - 2 4 * 10 Complexity 22 - 0 3 16 35** 34** 28** 11 - 0 8 - 1 4 - 1 5 30** - 1 6 - 0 5 21 Conformity 05 09 - 0 7 - 2 7 * - 4 1 " * - 1 5 33** 02 24* 04 - 0 9 20 14 01 Energy Level 11 04 14 03 - 0 3 03 05 - 2 6 * - 0 1 - 3 3 * * 09 - 1 7 - 2 2 * 05 Innovation - 0 3 06 17 24* 13 28** 02 - 11 - 12 - 15 02 - 11 - 2 6 * * - 0 2 Interpersonal Affect 20 - 0 3 - 3 6 * * 19 23* 01 - 0 2 - 0 3 06 00 - 0 8 04 24* 33** Organization 19 - 0 8 - 0 6 - 2 0 - 1 4 - 1 2 26* 07 - 0 1 - 3 0 * * - 1 0 - 1 5 - 0 8 26** Responsibility 23* 02 03 - 0 8 01 18 - 0 5 - 1 2 - 0 2 - 1 1 12 - 0 7 10 40** Risk Taking - 0 9 07 18 37** 23* 10 08 - 0 1 - 0 4 - 0 4 - 0 2 - 0 2 - 1 6 - 2 2 * Self-Esteem 00 13 16 46** 48** 07 - 1 4 - 0 7 - 2 0 04 08 02 - 0 7 22* Social Adroitness - 1 1 11 13 - 0 3 - 1 3 - 0 4 17 18 21 - 1 4 - 0 6 - 1 4 - 1 3 - 0 8 Social Participation 05 17 - 0 3 26* 22 - 1 4 16 08 - 0 5 09 - 1 3 15 13 33** Tolerance 13 02 07 17 29** 29** - 0 9 - 3 4 * * - 0 6 - 0 9 21" 03 - 0 6 - 0 8 Value Orthodoxy 11 - 0 7 - 0 1 - 1 9 - 2 3 * - 1 3 12 15 47** - 0 6 08 02 19 23*
Note. Decimals are omitted. JPI = Jackson Personality Inventory; GPA = grade point average; Datel = dating frequency; Date2 = dating variety; Smokl = smoking rating; Smok2 = smoking amount; Arts = liberal arts study; Frat = fraternity interest; Viol = traffic violations; Retg = religiosity; Attr = attractiveness; Intl = intelligence; Popl = popularity; Hons = honesty; Sex = participant gender. a Participant gender is not partialed. * p < .05. * * p < .0167.
550 PAUNONEN
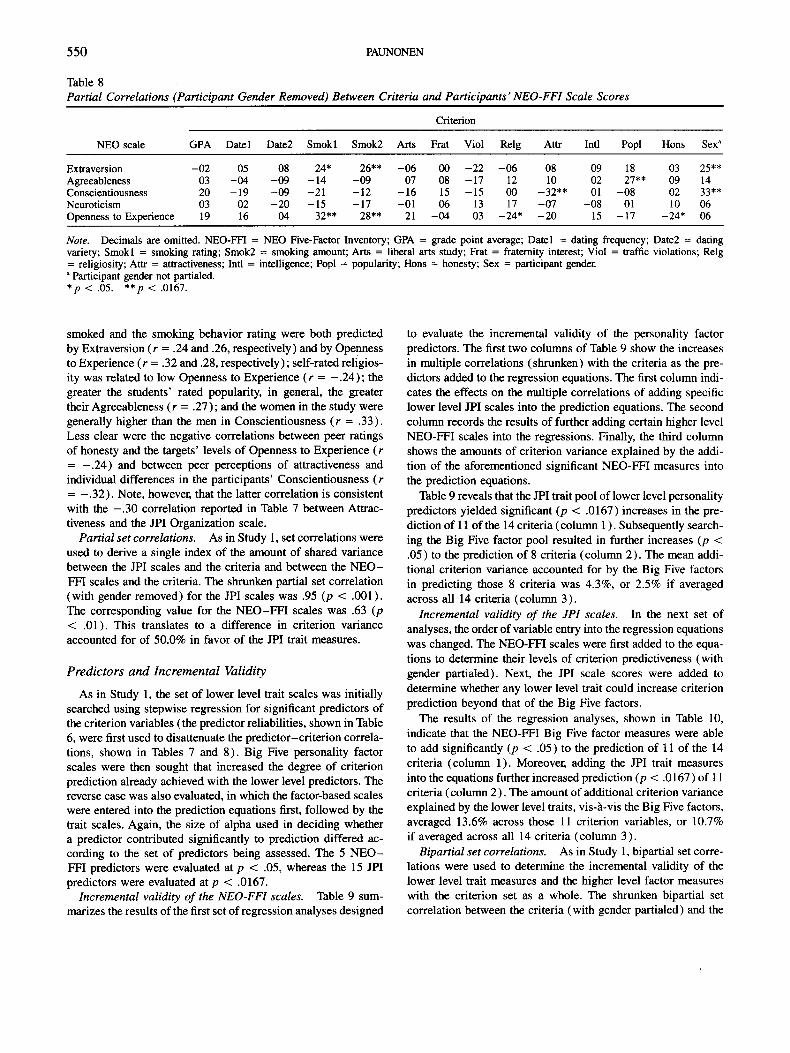
Table 8 Partial Correlations (Participant Gender Removed) Between Criteria and Participants' NEO-FFI Scale Scores
Criterion
NEO scale GPA Datel Date2 Smokl Smok2 Arts Frat Viol Relg Attr Intl Popl Hons Sex a
Extraversion -02 05 08 24* 26** -06 00 -22 -06 08 09 18 03 25** Agreeableness 03 -04 -09 - 14 -09 07 08 - 17 12 10 02 27"* 09 14 Conscientiousness 20 -19 -09 -21 -12 -16 15 -15 00 -32** 01 -08 02 33** Neuroticism 03 02 -20 -15 -17 -01 06 13 17 -07 -08 01 10 06 Openness to Experience 19 16 04 32** 28** 21 -04 03 -24* -20 15 -17 -24* 06
Note. Decimals are omitted. NEO-FFI = NEO Five-Factor Inventory; GPA = grade point average; Datel = dating frequency; Date2 = dating variety; Smokl = smoking rating; Smok2 = smoking amount; Arts = liberal arts study; Frat = fraternity interest; Viol = traffic violations; Relg = religiosity; Attr = attractiveness; Intl = intelligence; Popl = popularity; Hons = honesty; Sex = participant gender. a Participant gender not partialed. *p < .05. **p < .0167.
smoked and the smoking behavior rating were both predicted by Extraversion ( r = .24 and .26, respectively) and by Openness to Experience ( r = . 32 and .28, respectively); self-rated religios- ity was related to low Openness to Experience ( r = - . 2 4 ) ; the greater the students' rated popularity, in general, the greater their Agreeableness ( r = .27); and the women in the study were generally higher than the men in Conscientiousness ( r = .33). Less clear were the negative correlations between peer ratings of honesty and the targets' levels of Openness to Experience ( r = - . 2 4 ) and between peer perceptions of attractiveness and individual differences in the participants' Conscientiousness ( r = - . 3 2 ) . Note, however, that the latter correlation is consistent with the - . 3 0 correlation reported in Table 7 between Attrac- tiveness and the JPI Organization scale.
Partial set correlations. As in Study 1, set correlations were used to derive a single index of the amount of shared variance between the JPI scales and the criteria and between the N E O - FFI scales and the criteria. The shrunken partial set correlation (with gender removed) for the JPI scales was .95 (p < .001 ). The corresponding value for the N E O - F F I scales was .63 (p < .01 ). This translates to a difference in criterion variance accounted for of 50.0% in favor of the JPI trait measures.
Predictors and Incremental Validity
As in Study 1, the set of lower level trait scales was initially searched using stepwise regression for significant predictors of the criterion variables (the predictor reliabilities, shown in Table 6, were first used to disattenuate the predictor-criterion correla- tions, shown in Tables 7 and 8). Big Five personality factor scales were then sought that increased the degree of criterion prediction already achieved with the lower level predictors. The reverse case was also evaluated, in which the factor-based scales were entered into the prediction equations first, followed by the trait scales. Again, the size of alpha used in deciding whether a predictor contributed significantly to prediction differed ac- cording to the set of predictors being assessed. The 5 N E O - FFI predictors were evaluated at p < .05, whereas the 15 JPI predictors were evaluated at p < .0167.
Incremental validity of the NEO-FFI scales. Table 9 sum- marizes the results of the first set of regression analyses designed
to evaluate the incremental validity of the personality factor predictors. The first two columns of Table 9 show the increases in multiple correlations (shrunken) with the criteria as the pre- dictors added to the regression equations. The first column indi- cates the effects on the multiple correlations of adding specific lower level JPI scales into the prediction equations. The second column records the results of further adding certain higher level NEO-FFI scales into the regressions. Finally, the third column shows the amounts of criterion variance explained by the addi- tion of the aforementioned significant NEO-FFI measures into the prediction equations.
Table 9 reveals that the JPI trait pool of lower level personality predictors yielded significant (p < .0167) increases in the pre- diction of 11 of the 14 criteria (column 1 ). Subsequently search- ing the Big Five factor pool resulted in further increases (p < .05) to the prediction of 8 criteria (column 2). The mean addi- tional criterion variance accounted for by the Big Five factors in predicting those 8 criteria was 4.3%, or 2.5% if averaged across all 14 criteria (column 3).
Incremental validity of the JPI scales. In the next set of analyses, the order of variable entry into the regression equations was changed. The NEO-FFI scales were first added to the equa- tions to determine their levels of criterion predictiveness (with gender partialed). Next, the JPI scale scores were added to determine whether any lower level trait could increase criterion prediction beyond that of the Big Five factors.
The results of the regression analyses, shown in Table 10, indicate that the NEO-FFI Big Five factor measures were able to add significantly (p < .05) to the prediction of 11 of the 14 criteria (column 1). Moreover, adding the JPI trait measures into the equations further increased prediction (p < .0167) of 11 criteria (column 2). The amount of additional criterion variance explained by the lower level traits, vis-a-vis the Big Five factors, averaged 13.6% across those 11 criterion variables, or 10.7% if averaged across all 14 criteria (column 3).
Bipartial set correlations. As in Study 1, bipartial set corre- lations were used to determine the incremental validity of the lower level trait measures and the higher level factor measures with the criterion set as a whole. The shrunken bipartial set correlation between the criteria (with gender partialed) and the

PERSONALITY HIERARCHY
Table 9 Multiple Correlations R (Shrunken) in Predicting Criterion Variables With JPI Scale Scores and NEO-FFI Scale Scores (Gender Partialed)
Predictor
Cdterion JPI" JPI + NEO t' % change ~
Grade point average 20 (+O) 4.1" Dating frequency Dating variety 39 (-Ia) 44 (+E) 4.1" Smoking rating 67 (+Es, +Cp, +Sp, -Or) 70 ( -C, +O) 4.2* Smoking amount 74 (+Es, +To, -En, +Cp, +Sp) 76 (+O) 2.7* Liberal arts study 34 (+To) 38 ( -C) 3.5* Fraternity interest 33 (+Cf) Traffic violations 39 (-To) 45 ( -E) 4.9* Religiosity 52 (+Vo) Attractiveness 45 (-En, -Or) Intelligence 34 (+Cp) Popularity 29 (+A) 8.1"* Honesty 34 (-In, +Ax) Sex d 45 (+Re, +Sp) 48 (+C) 3.1"
Note. Decimals in R values are omitted. JPI = Jackson Personality Inventory; NEO-FFI = NEO Five- Factor Inventory. a Blank cell means no JPI scale significantly increased R at p < .0167. Significant JPI scales are shown in parentheses: Ax = Anxiety; En = Energy Level; Es = Self-Esteem; Cf = Conformity; Cp = Complexity; Ia = Interpersonal Affect; In = Innovation; Or = Organization; Re = Responsibility; Sp = Social Participa- tion; To = Tolerance; Vo = Value Orthodoxy. b Blank cell means no NEO scale significantly increased R at p < .05. Significant NEO scales are shown in parentheses: A = Agreeableness; C = Conscientiousness; E = Extraversion; O = Openness to Experience. c Percentage change in criterion variance accounted for by the addition of the NEO predictors to the JPI predictors. d Participant gender is not partialed. *p < .05. **p < .0167.
551
NEO-FFI scales (with the JPI scales partialed) was .00. (Again, the shrinkage correction reduced an otherwise positive correla- tion to zero.) The corresponding value for the JPI scales (with the NEO-FFI scales partialed) was .85 (p < .001 ). The resultant difference in criterion variance accounted for was 73.1% fa- voring the JPI scales.
Summary. Summarizing the results of the present regression analyses, both the variance of the common personality factors and the variance of the individual personality traits separately predicted the majority of the criteria of this study. Furthermore, removing either of these sources of variance out of the other still left residual variation in the predictors that was correlated with the criteria. However, the incremental validities of the higher level factor measures and the lower level trait measures relative to each other were not equivalent. Partialing the variance due to the narrow personality traits out of the Big Five factors left some amount of variation in the predictors that was corre- lated with the criteria, as seen in Table 9. But, partialing the variance due to the factors out of the traits left, on average, substantially more variation in the predictors that was criterion predictive, as seen in Table 10.
Genera l D i scus s ion
The studies reported in this article evaluated aspects of the hierarchical model of personality structure shown in Figure 1.
Specifically, the criterion predictiveness of higher level personal- ity factors, the Big Five factors in this case, and lower level personality traits were compared. Results of correlation and regression analyses indicated that measures of both the higher and lower level personality dimensions demonstrated predictive- ness with regard to the present criteria, but in an additive sense, the relatively narrow, lower level traits generally increased the criterion predictiveness of the broader, higher level factors more than the factors increased the predictiveness of the traits. These results largely replicated across two independent data sets, in which two different domains of lower level traits were evaluated using two different samples of participants.
The present findings have two important implications for per- sonality theory and assessment. First, the fact that the compo- nents of the two levels of the personality hierarchy evaluated (i.e., the Big Five factors and their constituent traits) both showed evidence of predictiveness with regard to important behavior criteria lends support to the viability of the model itself. Note that a failure to find such evidence would not auto- matically invalidate the model because the criteria chosen could be unrelated to the predictors in the population or the personality measures used could be psychometrically unsound. But such negative results might eventually lead to reasonable questions about the model 's veddicality.
The second implication of the present results for personality psychology concerns the finding of differences in the relative

552 PAUNONEN
Table 10 Multiple Correlations R (Shrunken) in Predicting Criterion Variables With NEO-FFI Scale Scores and JPI Scale Scores (Gender Partialed)
Predictor
Criterion NEO a NEO + JPI b % change c
Grade point average 20 (+O) 31 (+Re) 5.8* Dating frequency Dating variety 20 ( -N) 39 (-Ia) 11.7"* Smoking rating 54 (+E, -C , +O, -A) 68 (+Sp, +To) 16.8"** Smoking amount 43 (+O, +E) 74 (-En, +Es, +To, +Sp) 36.1"** Liberal arts study 23 (+O) 36 (+To) 7.8** Fraternity interest 33 (+Cf) 10.9"* Traffic violations 24 (-E) 45 (-To) 14.5"** Religiosity 27 ( -O) 54 (+Vo) 21.6"** Attractiveness 40 (-C, -O) Intelligence 34 (+Cp) 11.2"* Popularity 29 (+A) Honesty 27 ( -O) 37 (+Ia) 6.8** Sex d 37 (+C, +E) 45 (+Re) 6.4**
Note. Decimals in R values are omitted. NEO-FFI = NEO Five-Factor Inventory; JPI = Jackson Personality Inventory. a Blank cell means no NEO scale significantly increased R at p < .05. Significant NEO scales are shown in parentheses: A = Agreeableness; C = Conscientiousness; E = Extraversion; N = Neuroticism; O = Openness to Experience. b Blank cell means no JPI scale significantly increased R at p < .0167. Significant JPI scales are shown in parentheses: En = Energy Level; Es = Self-Esteem; Cf = Conformity; Cp = Complexity; Ia = Interpersonal Affect; Re = Responsibility; Sp = Social Participation; To = Tolerance; Vo = Value orthodoxy. ¢ Percentage change in criterion variance accounted for by the addition of the JPI predictors to the NEO predictors. d Participant gender is not partialed. *p < .05. **p < .0167. ***p < .001.
predictive merits of the higher and lower level personality dimen- sions, differences that favored the latter. This outcome bears on the increasingly common practice in research to assess personal- ity with Big Five factors measures on!y, eschewing the assess- ment of those factors' lower level components. If in the present studies only the NEO-FFI factor-based predictors had been used, a certain measure of criterion prediction would indeed have been achieved. Adding the PRF or JPI trait predictors to the prediction equations, however, increased the correlations sub- stantially in most cases. This finding is consistent with the argu- ment that combining narrow personality traits into their underly- ing broad factors can entail predictive losses, losses that are due to the ensuing elimination of trait-specific but criterion-valid variance (Ashton et al., 1995; Hough, 1992; Paunonen, 1993; Paunonen et al., 1992, in press; Schneider, Hough, & Dunnette, 1996; Sch6nemann, 1990).
On Common and Specific Trait Variance
It is clear from the results of this research that the personality trait measures showed good levels of incremental predictive validity vis-a-vis the personality factor measures. But is the interpretation of that finding cor rec t - - tha t the specific variance of the traits is as important, or more important, for prediction as is their common variance? The accuracy of such a conclusion depends in part on empirical associations existing between the
assessed lower level traits and higher level factors. It was as- sumed in the present studies that when the NEO-FFI scales were partialed out of the PRF and JPI trait scales, the common variance underlying those traits was partialed, allowing for a test of the predictive abilities of their specific variance compo- nents. But are the present lower level trait measures in fact related to the higher level factor measures?
There are good reasons to believe that the model illustrated in Figure 1 is probably a fair representation of the personality variables evaluated in these studies. These reasons are based on past factor analytic studies of the present lower level traits, studies that have amply documented the traits' close allegiances to the Big Five domain. The factors of both the PRF scales and the JPI scales have been evaluated in this context.
With regard to the factors underlying the PRF, many indepen- dent studies have shown its scales to fit well within the five- factor space (e.g., Costa & McCrae, 1988; Paunonen et al., 1992; Stumpf, 1993), with only small anomalies pertaining to the make-up of the Conscientiousness factor (Jackson, Pauno- nen, Fraboni, & Goffin, 1996). Furthermore, the P R F - N E O - FFI correlations shown in Table 1 are remarkably similar to the factor loadings of the PRF traits on Big Five factors reported by Costa and McCrae (1988). In fact, if one compares the highest correlation for each personality trait in Table 1 with that trait 's highest factor loading in Costa and McCrae 's Table 4, 16 out of 21 traits define the same Big Five dimension in both

PERSONALITY HIERARCHY 553
studies. The other five traits tended to split across more than one factor in both data sets, but still come close to meeting the same standard of replication.
The JPI scales have also been placed into the space of the Big Five. In a recent cross-replication analysis of 10 independent data sets, Paunonen and Jackson (1996) found strong JPI factors that bore close resemblances, both subjectively and objectively, to the Big Five. Moreover, the JPI (mean) factor structure re- ported in Table 1 of that study is strikingly similar to the JPI- NEO-FFI correlation matrix shown in the present Table 6. For instance, the Big Five factor on which each JP| scale was found to be most salient in Paunonen and Jackson's study is the same factor on which that scale had its highest correlation in this study.
Note, however, that Paunonen and Jackson's (1996) results led those authors to the conclusion that the JPI scales of Energy Level, Risk Taking, and Value Orthodoxy do not well define the five-factor space (see also Table 6). The implication of that finding for this research is that any predictive gains by those three JPI variables over the NEO-FFI Big Five measures might not have been due just to those traits' specific variances, but to their specific plus common (i.e., common to some factor or factors independent of the Big Five) variance components. But examination of Table 10 shows that those three JPI scales were not recurrent contributors to the incremental validities of the lower level traits in this research. Energy Level and Value Ortho- doxy each added to the Big Five's prediction of only one crite- rion, and Risk Taking showed no incremental utility in the pres- ent context.
In summary, it is maintained that most of the lower level personality traits assessed in this research have strong links to the Big Five personality factors. Thus, the empirical evaluations of incremental validity are interpreted as proper indications of the degree to which different components of trait variance con- tributed to criterion prediction. The common variance underly- ing the lower level traits, variance attributable to the Big Five factors of personality in this case, is certainly important to the prediction of behavior. But to overlook the supplementary infor- mation contained in the traits' specificities is to forego even greater levels of predictive accuracy.
Generalizability of the Present Results
The present studies have certain limitations that bear on the generalizability of their results. Those results are, to some ex- tent, dependent on the psychological variables chosen for study. They are also partly dependent on the participant samples assessed.
Effect of Variables Studied
To what extent are the present results dependent on the spe- cific psychological variables selected for study? With regard to the criteria, it is obvious that the results pertain to those vari- ables, and to those variables alone. Although it was found that the lower level traits generally, but not always, outpredicted their higher level factors, a different set of criterion variables could have yielded the opposite outcome. This contrary outcome
might be especially likely if, as suggested earlier, criteria were selected to represent a set of factor-based personality variables.
With regard to the generalizability of the predictors used, it could be argued that the present results are independent of the higher level personality variables selected for analysis, because supposedly no selection was involved. These personality dimen- sions, the Big Five factors, are presumed to constitute the entire universe of variables at the top level of the personality hierarchy (cf. Block, 1995; Jackson et al., 1996; M~shon & Gorsuch, 1988; Paunonen & Jackson, 1996). Of course, if that presump- tion is incorrect, if for example there are actually more personal- ity factors than the Big Five, then using those other dimensions as criterion predictors could yield results at variance with those reported in this article.
It could also be argued that the present results are mostly independent of the lower level personality traits used, because they can be thought of as just one of many randomly parallel sets of Big Five exemplars selected from the five-factor universe. Certainly there exists a multitude of different lower level trait variables representing the Big Five, each with its own compo- nent of trait-specific variance, variance that might or might not be predictive of the present criteria. Nevertheless, although those different lower level traits could yield different results in the prediction of specific criteria, the overall pattern of results could be the same as that found here. Consider that the PRF traits of Study 1 did not always predict the same variables as did the JPI traits of Study 2. But the overall findings of both studies led to the same conclusion: that relatively narrow, lower level traits, in general, add nonredundant information to their higher level personality factors in the prediction of diverse behavioral criteria.
Effect of Participants Tested
To what extent are the present findings dependent on the sam- ples of participants assessed? Although the general outcome indi- cating the superiority of the lower level traits over the higher level factors in criterion prediction was observed in both studies, it is apparent that some of the specific results that can be compared directly across the two studies did not replicate. In particular, many of the NEO-FFI scales that were strong criterion predictors in the first sample (Table 3) were not strong predictors of the same criteria in the second sample (Table 8). This lack of replica- tion could be due to undue amounts of error variance in the predictor or criterion variables. 2 The lack of replication could
2 It is acknowledged that the present lower level predictors (the PRF and JPI scales) and higher level predictors (the NEO-FFI scales) differ in ways other than just the stratum of the personality hierarchy they represent. Foremost among these differences is the fact that the items do not have the same content. Thus, it is possible that the PRF and JPI scales generally outpredioted the NEO-FFI scales in these studies be- cause the former simply have better items and, consequently, better psychometric properties. This is considered an unlikely explanation for the present results. The test manuals for the PRF (Jackson, 1984), the JPI (Jackson, 1994), and the NEO-FFI (Costa & McCrae, 1992c) abundantly document empirical evaluations supporting those instru- ments' reliability, construct validity, and freedom from response bias. There is, furthermore, no obvious reason why data for the latter instru- ment should be deficient specifically in the present studies.

554 PAU NONEN
also be due to relatively small sample sizes producing Type I errors. That is to say, there may in fact be no relation between the predictor variables and the criterion variables in the popula- tion, but the relatively small samples could have yielded unstable estimates of population correlations that were sometimes signifi- cant by chance alone. Note that this explanation posits that the personality dimensions measured by the NEO-FFI are not deter- minants of the criteria used in these studies, which implies that no Big Five personality factor is associated with variables such as smoking behavior, religiosity, and dating behavior.
If the Big Five factors are actually uncorrelated with the present criteria in the population, what are the implications for the ex- pected replicabilities of the PRF and JPI correlations reported in this article? Recall it was concluded that these lower level trait scales predicted the criteria partly because of their common (Big Five) factor variance and partly because of their trait-specific variance. But if the population correlations between the Big Five and the criteria are all zero, then cross-validation of the PRF and JPI predictors should, as with the NEO-FFI predictors, also result in a general decrease in predictiveness across those traits. This is because the common variance of the present lower level scales would have been predictive in the present studies only by chance and would not be likely to replicate. Whether the specific variance of the lower level traits would remain predictive under cross- validation is a separate question.
Unfortunately, it cannot be ascertained with the present data whether the lower level trait measures would maintain their predictiveness on cross-validation any better than did the higher level factor measures. The clear theoretical interpretability of some of the PRF and JPI predictor-criterion relations found in these studies, however, suggests that not all of them are spurious. Moreover, given the diversity of the content coverage of the present predictor variables, it seems implausible that the PRF and JPI personality traits and the Big Five personality factors are in actuality uncorrelated with the present heterogeneous set of behavior criteria.
weighted) or unweighted composites of the former, and (b) the two sets of measures are then compared in multiple regression analyses of the type described, for example, in this article.
An example of the circumstance in which lower level pre- dictors are guaranteed to outpredict higher level predictors can be found in Mershon and Gorsuch's (1988) study. Those authors compared the 16 individual scales of the 16 Personality Factor Questionnaire (Cattell, Eber, & Tatsuoka, 1970) with the 6 fac- tors underlying those scales in the prediction of various real- life criteria, such as worker pay, marijuana usage, and psychiat- ric status. As expected, their results confirmed the fact that the specific variance of the lower level personality scales must add to criterion prediction above and beyond that of the common variance contained in the higher level factors of those scales. What was unexpected about Mershon and Gorsuch's data, how- ever, was the relatively large amount by which the lower level measures added to the higher level measures in predict ion-- the former roughly doubled the amount of criterion variance explained by the latter. From a cost-benefit point of view, that degree of increased accuracy in predicting a criterion might be well worth any added cost of including the lower level predictors in one's research design.
The foregone conclusion regarding relative predictiveness re- ferred to above does not apply to the present studies, because the type of aggregation described was not done. The present higher level factor variables were not constructed from the parti- cipants' responses to the lower level trait measures (see, also, Ones et al., 1994). Instead, the two classes of variables were assessed independently, using two different batteries of mea- sures, yielding two different sets of data. Thus, it is entirely possible for the present Big Five factor measures to have specific variance of their own, variance independent of the lower level trait measures' commonality and yet predictive of any number of criterion variables. Indeed, the factors of the present studies did show some measure of incremental validity in relation to the traits, as seen in Tables 4 and 9.
Predetermined Prediction Results
The issue concerning the relative predictive merits of narrow, lower level traits and broad, higher level factors should, in cer- tain empirical applications, never even arise. Depending on the variables involved and the method of analysis, it may be possible to specify a priori which will win a statistical prediction contest. In most cases, however, explicit empirical comparisons of pre- dictive accuracy are warranted.
Effects of Variable Selection
Goldberg (1993) has correctly observed that, in any regression analysis, an aggregated measure will never be a better predictor of a criterion variable than will that aggregate's component vari- ables. This is because variance specific to the component vari- ables, which is lost in the process of combining those variables into the aggregate, can only add to prediction (or leave it un- changed) and not detract from it. Thus, lower level trait measures will always outpredict higher level factor measures if (a) the latter are derived arithmetically as weighted (excluding regression
Effects of Variable Dimensionality
Does the complexity or dimensionality of variables predeter- mine relative predictive accuracy? Although it may be reason- able to expect that a match in the factorial complexity of pre- dictor and criterion will result in optimal prediction and a mis- match in suboptimal prediction (Ones & Viswesvaran, 1996), neither outcome necessarily follows. No formal proof is needed for the assertion that a unidimensional predictor could either correlate perfectly with or be orthogonal to a unidimensional criterion. Nor is any needed for the statement that a multidimen- sional predictor might similarly correlate perfectly with or be orthogonal to a multidimensional criterion, their resultant corre- lation being dependent on the interrelations of all the individual dimensions involved.
What about the correlation expected between a unidimen- sional predictor and a multidimensional criterion (or the re- verse)? The single dimension of the predictor could be one of the multiple dimensions of the criterion or it could be an orthog- onal dimension; thus, the correlation could be relatively high or it could be zero. The present lower level PRF and JPI predictors

PERSONALITY HIERARCHY 555
were certainly constructed to be homogeneous measures of uni- dimensional personality traits. The criteria, in contrast, arguably represent measures of multidetermined and multidimensional behaviors. But, as seen in Tables 2 and 7, some of those unidi- mensional predictors correlated quite highly with some of those multidimensional criteria. Ashton et al. (1995) have reported some similar results. The point is that empirical evaluations of predictiveness are not obviated simply because predictors and criteria are, or are not, of equal dimensionality.
In a recent discussion of personality predictors and factorial complexity, Ones and Viswesvaran (1996) found it "puzz l ing" how the expectation has come about that " increased factorial purity in the personality predictor lead [ s ] to higher correlations with factorially complex and heterogeneous criteria" (p. 616). But this expectation should not be puzzling at all because, as observed in the preceding paragraphs, the factorially pure pre- dictor might be measuring one of the criterion variable 's facets. And, combining that unidimensional predictor with others into a broad composite predictor could decrease prediction if those other predictors are unrelated or negatively related to the facets of the criterion. (For extended discussions of issues raised by Ones & Viswesvaran, 1996, see Ashton, in press; Hogan & Roberts, 1996; Paunonen et al., in press; Schneider et al., 1996).
Nunnally (1978) has offered what this author considers to be unimpeachable advice on optimizing the prediction of multi- dimensional variables:
As some will argue, the criterion usually is factorially complex and consequently can be predicted best by a factorially complex pre- dictor test. Instead of building the factorial complexity into a partic- ular test, it is far better to meet the factorial complexity by combin- ing tests in a battery by multiple regression, in which case tests would be selected to measure the different factors that are thought to be important. (p. 268)
Nunnally (1978) described several advantages that this empirical approach has for the prediction and explanation of behavior (pp. 267-270) . Two are seen as particularly important in the present context. First, because the individual predictors are used together in a multiple regression analysis, the specific variance of each predictor has the opportunity of increasing criterion prediction over that achieved by the variance preserved in any composite. Second, being homogeneous variables of known compositions, those same predictors can be used to scale the test respondents in terms of their standing on important psychological constructs. In short, Nunnally recognized that aggregating a heterogeneous set of variables into a nmltidimensional predictor can entail pre- dictive losses and result in respondent scores having little psycho- logical meaning. 3 The present research represented an empirical evaluation of Nunnally's propositions, and the results can be interpreted as yielding strong support for his advice on measure- ment and prediction methods in psychology.
3 The same problems do not apply if the variables aggregated represent psychometrically parallel measures of the same construct. As demon- strated empirically (e.g., Jackson & Paunonen, 1985; Paunonen & Gard- ner, 1991; Paunonen & Jackson, 1985), psychometric theory correctly predicts that such aggregation leads to improvements in both the predic- tion of criteria and the measurement of underlying psychological characteristics.
Re fe rences
Ashton, M. C. (in press). Personality and job performance: The impor- tance of narrow traits. Journal of Organizational Behavior.
Ashton, M. C., Jackson, D. N., Pannonen, S. V., Helmes, E., & Rothstein, M.G. (1995). The criterion validity of broad factor scales versus specific trait scales. Journal of Research in Personality, 29, 432- 442.
Barrick, M. R., & Mount, M. K. (1991). The Big Five personality di- mensions and job performance: A recta-analysis. Personnel Psychol- ogy, 44, 1-26.
Block, J. (1995). A contrurian view of the five-factor approach to per- sonality description. Psychological Bulletin, 117, 187-215.
Cattell, R. B., Eber, H. W., & Tatsuoka, M. (1970). Handbook for the Sixteen Personality Factor Questionnaire. Champaign, IL: Institute for Personality and Ability Testing.
Cattell, R. B., & Krug, S. E. (1986). The number of factors in the 16PF: A review of the evidence with special emphasis on methodological problems. Educational and Psychological Measurement, 46, 509- 522.
Cohen, J., & Cohen, E (1983). Applied multiple regression~correlation analysis for the behavioral sciences. New York: Erlbaum.
Costa, E T., Jr., & McCrae, R. R. (1988). From catalog to classification: Murray's needs and the five-factor model. Journal of Personality and Social Psychology, 55, 258-265.
Costa, E T., Jr., & McCrae, R. R. (1992a). Four ways five factors are basic. Personality and Individual Differences, 13, 653-665.
Costa, E T., Jr., & McCrae, R. R. (1992b). Reply to Eysenck. Personal- ity and Individual Differences, 13, 861-865.
Costa, E T., Jr., & McCrae, R. R. (1992c). RevisedNEO Personality Inven- tory (NEO-PIoR) and NEO Five-Factor Inventory (NEO-FFI) profes- sional manual, Odessa, FL: Psychological Assessment Resources.
Costa, E T., Jr., & McCrae, R. R. (1995). Domains and facets: Hierar- chical personality assessment using the revised NEO Personality In- ventory. Journal of Personality Assessment, 64, 21-50.
Cronbach, L. J., & Meehl, E (1955). Construct validity in psychological tests. Psychological Bulletin, 52, 281-302.
Digman, J.M. (1990). Personality structure: Emergence of the five- factor model. Annual Review of Psychology, 41, 417-440.
Eysenck, H. J. (1947). Dimensions of personality. London: Routledge & Kegan Paul.
Eysenck, H. J. (1992a). Four ways five factors are not basic. Personality and Individual Differences, 13, 667-673.
Eysenck, H. J. (1992b). A reply to Costa and McCrae: P or A and C - - The role of theory. Personality and Individual Differences, 13, 867- 868.
Goldberg, L. R. (1972). Parameters of personality inventory construc- tion and utilization: A comparison of prediction strategies and tactics. Multivariate Behavioral Research Monographs, 72 (2).
Goldberg, L.R. (1993). The structure of personality traits: Vertical and horizontal aspects. In D. C. Funder, R. D. Parke, C. Tomlinson- Keasey, & K. Widaman (Eds.), Studying lives through time: Personal- ity and development (pp. 169 - 188 ). Washington, DC: American Psy- chologicai Association.
Hampson, S.E., John, O.P., & Goldberg, L.R. (1986). Category breadth and hierarchical structure in personality: Studies of asymmet- ries in judgments of trait implications. Journal of Personality and Social Psychology, 51, 37-54.
Hase, H. D., & Goldberg, L.R. (1967). The comparative validity of different strategies of deriving personality inventory scales. Psycho- logical Bulletin, 67, 231-248.
Hogan, J., & Roberts, B. W. (1996). Issues and non-issues in the fidel- ity-bandwidth trade-off. Journal of Organizational Behavior, 17, 627 -637.

5 5 6 PAUNONEN
Hough, L. M. (1992). The "Big Five" personality variables-construct confusion: Description versus prediction. Human Performance, 5, 139-155.
Jackson, D.N. (1976). Jackson Personality Inventory manual. Port Huron, MI: Research Psychologists Press.
Jackson, D. N. (1977). Reliability of the Jackson Personality Inventory. Psychological Reports, 40, 613-614.
Jackson, D. N. (1984). Personality Research Form manual. Port Huron, MI: Research Psychologists Press.
Jackson, D. N. (1994). Jackson Personality Inventory-Revised manual. Port Huron, MI: Sigma Assessment Systems.
Jackson, D. N., & Paunonen, S. V. (1985). Construct validity and the predictability of behavior. Journal of Personality and Social Psychol- ogy, 49, 554-570.
Jackson, D. N., Paunonen, S. V., Fraboni, M., & Goffin, R. G. (1996). A five-factor versus a six-factor model of personality structure. Per- sonality and Individual Differences, 20, 33-45.
John, O. P. (1990). The "Big Five" factor taxonomy: Dimensions of personality in the natural language and in questionnaires. In L. A. Pervin (Ed.), Handbook of personality: Theory and research (pp. 66-100). New York: Springer-Verlag.
McCrae, R. R., & Costa, P. T., Jr. (1992). Discriminant validity of the NEO-PI-R facet scales. Educational and Psychological Measure- ment, 52, 229-237.
McCrae, R. R., & John, O. P. (1992). An introduction to the five-factor model and its applications. Journal of Personality, 60, 175-215.
Mershon, B., & Gorsuch, R. L. (1988). Number of factors in the person- ality sphere: Does increase in factors increase the predictability of real-life criteria? Journal of Personality and Social Psychology, 55, 675-680.
Murray, H. A. (1938). Explorations in personality. New York: Oxford Press.
Nunnally, J. C. (1978). Psychometric theory. New York: McGraw-Hill. Ones, D.S., Schmidt, E L., & Viswesvaran, C. (1994, April). Do
broader personality variables predict job performance with higher validity? Paper presented at the Conference of the Society for Indus- trial and Organizational Psychology, Nashville, TN.
Ones, D. S., & Viswesvaran, C. (1996). Bandwidth-fidelity dilemma in personality measurement for personnel selection. Journal of Orga- nizational Behavior, 17, 609-626.
Paunonen, S.V. (1993, August). Sense, nonsense, and the Big Five
factors of personality. Paper presented at the 101st Annual Convention of the American Psychological Association, Toronto, Ontario, Canada.
Paunonen, S.V., & Gardner, R.C. (1991). Biases resulting from the use of aggregated variables in psychology. Psychological Bulletin, 109, 520-523.
Paunonen, S. V., & Jackson, D. N. (1985). The validity of formal and informal personality assessments. Journal of Research in Personality, 19, 331-342.
Paunonen, S, V., & Jackson, D.N. (1996). The Jackson Personality Inventory and the Five-Factor Model of personality. Journal of Re- search in Personality, 30, 42-59.
Paunonen, S. V., Jackson, D. N., Trzebinski, J., & Forsterling, E (1992). Personality structure across cultures: A multimethod evaluation. Jour- nal of Personality and Social Psychology, 62, 447-456.
Paunonen, S. V., Rothstein, M. G., & Jackson, D. N. (in press). Narrow reasoning about the use of broad personality measures in personnel selection. Journal of Organizational Behavior.
Schneider, R, J., Hough, L. M., & Dunnette, M. D. (1996). Broadsided by broad traits: How to sink science in five dimensions or less. Journal of Organizational Behavior, 17, 639-655.
SchOnemann, E H. (1990). Facts, fictions, and common sense about factors and components. Multivariate Behavioral Research, 25, 47- 51.
Smith, G. M. (1969). Relations between personality and smoking behav- ior in preadult subjects. Journal of Consulting and Clinical Psychol- ogy, 33, 710-715.
Stumpf, H. (1993). The factor structure of the Personality Research Form: A cross-national evaluation. Journal of Personality, 61, 27- 48.
Tett, R. E, Jackson, D. N., & Rothstein, M. G. (1991). Personality mea- sures as predictors of job performance: A meta-analytic review. Per- sonnel Psychology, 44, 703-742.
Velicer, W. E, Govia, J. M., Cherico, N. E, & Corriveau, D. E (1985). Item format and the structure of the Buss-Durkee Hostility Inventory. Aggressive Behavior, 11, 65-82.
Velicer, W. E, & Stevenson, J. E (1978). The relation between item format and the structure of the Eysenck Personality Inventory. Applied Psychological Measurement, 2, 293-304.
Received February 26, 1996 Revision received March 20, 1997
Accepted March 29, 1997 •