hi 2021 20 is (definitive) 02
TRANSCRIPT

COVER SHEET
1 5 3 9 3
S.E.C. Registration Number
H O U S E O F I N V E S T M E N T S I N C .
(Company’s Full Name)
9 / F L O O R G R E P A L I F E B U I L D I N G 2 2 1
S E N . G I L P U Y A T A V E N U E M A K A T I
(Business Address: No. Street City/ Town/ Province)
Atty. Lalaine P. Monserate 8815-96-36 Contact Person Company Telephone Number
1 2 3 1 SEC FORM 20 - IS (DEFINITIVE)
0 8 0 6
Month Day FORM TYPE Month Day Fiscal Year Annual Meeting
Secondary License Type, If Applicable
Dept. Requiring this Doc. Amended Articles Number/Section Total Amount of Borrowings
385 96.81% 3.09% Total No. Of Stockholders Domestic Foreign ---------------------------------------------------------------------------------------------------------------------------------------
To be accomplished by SEC Personnel concerned
_____________________ File Number LCU _____________________
Document I.D. Cashier STAMPS
Remarks= pls. Use black ink for scanning purposes


a

b

c
d
e

f

g

h

i
EXPLANATION OF AGENDA ITEMS The following are the rules of conduct and procedures for the meeting:
1. Stockholders may attend and participate in the meeting by remote communication. Stockholders who intend to attend and participate by remote communication shall inform the Company via email at [email protected], on or before July 27, 2021. After verification of the email request, the link to the live webcast of the meeting shall be sent to the indicated email address of the registered stockholder.
2. Stockholders may vote by appointing a proxy. Stockholders voting by proxy shall email the duly accomplished proxies for examination, validation and recording at least ten (10) days before the Annual Stockholders’ Meeting, or on or before July 27, 2021 to the Office of the Corporate Secretary at [email protected].
3. Pursuant to Sections 57 and 23 of the Revised Corporation Code, which allow for voting by remote communication or in absentia by the stockholders, the Company has set up a registration and voting mechanism. Stockholders may cast their votes electronically at the time provided for in the notice and mechanism, as detailed in the attachments to the Information Statement, Annex A and Annex B. A stockholder who votes by remote communication or in absentia shall be deemed present for purposes of quorum.
4. The items in the Agenda for the approval by the stockholders will need the affirmative vote of stockholders representing at least a majority of the outstanding voting stock, voting through a proxy or voting electronically in absentia.
5. Each of the proposed resolutions or items in the Agenda will be shown on the screen as the same is taken up at the meeting.
6. Election of directors will be by plurality of votes and every stockholder will be entitled to cumulate his/her/its votes.
7. The Company’s stock transfer agent will tabulate, verify and validate all votes received.
8. The Corporate Secretary shall report the results of voting during the meeting.
9. Stockholders may email to [email protected] relevant questions or comments to matters to be taken up, on or before the time of the meeting. Stockholders are advised to send questions early to be assured that these will be taken up in time.
10. A link to the recorded webcast of the meeting will be posted on the Company’s website after the meeting.

ii
Call to Order The Chairperson will formally open the meeting at 2:30 in the afternoon. Certification of Notice and Quorum (& Rules of Conduct and Procedures) The Corporate Secretary, will certify that written notice for the meeting was duly sent to the stockholders and that a quorum exists for the transaction of business. Approval of Minutes of the Annual Stockholders’ Meeting held on August 17, 2020 The minutes of the Annual Stockholders’ Meeting held on August 17, 2020 is posted on the Company’s website, at https://hoi.com.ph/category/minutes-of-all-general-or-special-stockholder-meeting/. A copy of the minutes is also attached to the Information Statement. A resolution approving the minutes will be presented to the stockholders for approval. Approval of the Management Report and Audited Financial Statements for 2020 The President and Chief Executive Officer of the Company, Mr. Lorenzo V. Tan, will deliver a report to the stockholders on the performance of the Company in 2020 and the outlook for 2021. The audited financial statements as of December 31, 2020 will be included in the Information Statement. A resolution noting the report and approving the 2020 audited financial statements will be presented to the stockholders for approval. Approval of the ratification and confirmation of the acts, resolutions and proceedings of the Board of Directors, Executive Committee, Other Committees and the Officers of the Company during the year 2020 The acts and resolutions of the Board of Directors, all Committees and Management of the Company for ratification were those adopted from August 17, 2020 until August 6, 2021. They include: a) opening/closing of bank accounts and delegation of bank signatories; b) approval of loans; c) appointment/promotion of officers; d) amendment of the Articles of Incorporation and By-laws; and other matters covered by disclosures to the Securities and Exchange Commission and the Philippine Stock Exchange. The acts of Management were those taken to implement the resolutions of the Board of Directors or its Committees and those taken in the general conduct of business. A resolution on this agenda item will be presented to the stockholders for approval. Election of Directors for 2021-2022 Any stockholder may submit to the Corporate Governance, Nomination and Related Party Transactions Committee nominations to the Board of Directors no later than May 14, 2021. The Corporate Governance, Nomination and Related Party Transactions Committee will determine whether the nominees for Directors, including the nominees for Independent Directors, have all the qualifications and none of the disqualifications to serve as members of the Board of Directors before submitting the nominees for election by the stockholders. The profiles of the nominees to the Board will be included in the Information Statement. It may be noted, however, that while the Company is guided by the SEC’s mandatory term limits for independent directors as provided for in SEC Memorandum Circular No. 4 (Series of 2017), two (2) of the independent director nominees, Dr. Roberto F. de Ocampo, OBE and Mr. Francisco H. Licuanan III, are already serving a cumulative term of nine (9) years as reckoned from the year 2012. Nonetheless, the Company proposes the re-election and retention of Dr. de Ocampo and Mr. Licuanan as independent directors. Meritorious justification for their retention/extension are provided in Item 5 of the Information Statement. Appointment of External Auditors The Audit Committee shall endorse to the stockholders the appointment of an external auditor for the ensuing year. The profile of the external auditor will be included in the Information Statement. A resolution for the appointment of the external auditor will be presented to the stockholders for approval. Such other business that may properly come before the meeting The Chairperson will open the floor for comments and questions from the stockholders. Stockholders may raise matters or issues that may be properly taken up at the meeting.

i
SECURITIES AND EXCHANGE COMMISSION SEC FORM 20-IS
INFORMATION STATEMENT PURSUANT TO SECTION 20 OF THE SECURITIES REGULATION CODE
1. Check the appropriate box:
[ ] Preliminary Information Statement [√] Definitive Information Statement
2. Name of Registrant as specified in its charter House of Investments, Inc.
3. Makati City, Metro Manila, PhilippinesProvince, country or other jurisdiction of incorporation or organization
4. SEC Identification Number 15393
5. BIR Tax Identification Code 000-463-069-000
6. 9F, Grepalife Bldg., 221 Sen. Gil J. Puyat Ave., Makati City, Metro Manila, Phil. 1200Address of principal office Postal Code
7. Registrant’s telephone number, including area code (632) 8815-9636 to 38
8. Date, Time and place of the meeting of security holdersAugust 6, 2021, 2:30 P.M., with proceedings livestreamed and voting conducted via remotecommunication or in absentia through the Company’s secure online voting facility.
9. Approximate date on which the Information Statement is first to be sent or given to security holders July 9,2021.
10. In case of Proxy Solicitations:
Name of Person Filing the Statement/Solicitor: Atty. Samuel V. TorresAddress: House of Investments, Inc., 9/F Grepalife Building, 221 Sen. Gil Puyat Avenue, Makati City,Metro ManilaTelephone No.: 8815-96-36Email address: [email protected]
11. Securities registered pursuant to Sections 8 and 12 of the Code (information on number of shares and amountof debt is applicable only to corporate registrants):
Title of Each Class Number of Shares Outstanding Common, P1.50 par value 776,465,281
Total Debt Outstanding as of March 31, 2021: P28.6 Billion
12. Are any or all of registrant's securities listed on a Stock Exchange?
Yes (Ö) No _____ Common Stocks
The common stock of the Corporation is listed on the Philippine Stock Exchange, Inc.
1
PART 1 INFORMATION REQUIRED IN INFORMATION STATEMENT
A. GENERAL INFORMATION
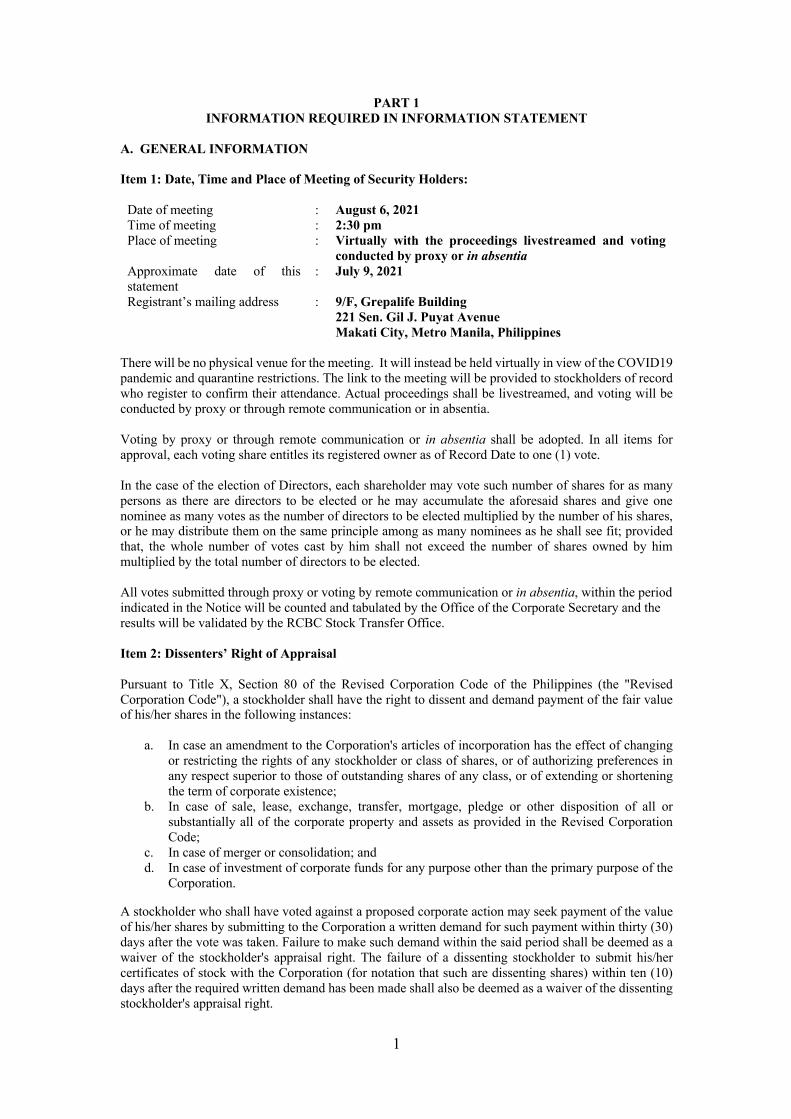
Item 1: Date, Time and Place of Meeting of Security Holders:
Date of meeting : August 6, 2021 Time of meeting : 2:30 pm Place of meeting : Virtually with the proceedings livestreamed and voting
conducted by proxy or in absentia Approximate date of this statement
: July 9, 2021
Registrant’s mailing address : 9/F, Grepalife Building 221 Sen. Gil J. Puyat Avenue Makati City, Metro Manila, Philippines
There will be no physical venue for the meeting. It will instead be held virtually in view of the COVID19 pandemic and quarantine restrictions. The link to the meeting will be provided to stockholders of record who register to confirm their attendance. Actual proceedings shall be livestreamed, and voting will be conducted by proxy or through remote communication or in absentia.
Voting by proxy or through remote communication or in absentia shall be adopted. In all items for approval, each voting share entitles its registered owner as of Record Date to one (1) vote.
In the case of the election of Directors, each shareholder may vote such number of shares for as many persons as there are directors to be elected or he may accumulate the aforesaid shares and give one nominee as many votes as the number of directors to be elected multiplied by the number of his shares, or he may distribute them on the same principle among as many nominees as he shall see fit; provided that, the whole number of votes cast by him shall not exceed the number of shares owned by him multiplied by the total number of directors to be elected.
All votes submitted through proxy or voting by remote communication or in absentia, within the period indicated in the Notice will be counted and tabulated by the Office of the Corporate Secretary and the results will be validated by the RCBC Stock Transfer Office.
Item 2: Dissenters’ Right of Appraisal
Pursuant to Title X, Section 80 of the Revised Corporation Code of the Philippines (the "Revised Corporation Code"), a stockholder shall have the right to dissent and demand payment of the fair value of his/her shares in the following instances:
a. In case an amendment to the Corporation's articles of incorporation has the effect of changingor restricting the rights of any stockholder or class of shares, or of authorizing preferences inany respect superior to those of outstanding shares of any class, or of extending or shorteningthe term of corporate existence;
b. In case of sale, lease, exchange, transfer, mortgage, pledge or other disposition of all orsubstantially all of the corporate property and assets as provided in the Revised CorporationCode;
c. In case of merger or consolidation; andd. In case of investment of corporate funds for any purpose other than the primary purpose of the
Corporation.
A stockholder who shall have voted against a proposed corporate action may seek payment of the value of his/her shares by submitting to the Corporation a written demand for such payment within thirty (30) days after the vote was taken. Failure to make such demand within the said period shall be deemed as a waiver of the stockholder's appraisal right. The failure of a dissenting stockholder to submit his/her certificates of stock with the Corporation (for notation that such are dissenting shares) within ten (10) days after the required written demand has been made shall also be deemed as a waiver of the dissenting stockholder's appraisal right.

2
If, within sixty (60) days from the approval of the corporate action by the stockholders, the dissenting stockholder and the Corporation cannot agree on the fair value of the shares, it shall be determined and appraised by three (3) disinterested persons, one of whom shall be named by the stockholder, another by the corporation and the third by the two (2) thus chosen. The findings of the majority of the appraisers shall be final, and their award shall be paid by the corporation within thirty (30) days after the same is made. Upon payment of the value of his/her shares, the dissenting stockholder shall forthwith transfer his shares to the Corporation. However, no payment shall be made to any dissenting stockholder unless the Corporation has retained earnings in its books to cover such payment. A dissenting stockholder's demand for payment may not be withdrawn unless the Corporation consents thereto. If, however, such demand is withdrawn with the Corporation's consent, or if the proposed corporate action is abandoned, rescinded or disapproved, or if it is determined that the stockholder is not entitled to the appraisal right, then the right of the stockholder to be paid the fair value of his/her shares shall cease, the status of the stockholder shall be restored, and all dividends which would have accrued on the shares shall be paid to the stockholder. There are no corporate matters in the Agenda for the annual meeting that will entitle dissenting stockholders to exercise their right of appraisal as provided in the Title X of the Revised Corporation Code. Item 3: Interest of Certain Persons in or Opposition to Matters to be Acted Upon
a) No current director or officer of the Company, or nominee, for election as directors of the Company or any associate thereof, has any substantial interest, direct or indirect, by security holdings or otherwise, in any matter to be acted upon other than the election to office.
b) No director has informed the Company in writing that he intends to oppose any action to be taken by the registrant at the meeting.
B. CONTROL AND COMPENSATION INFORMATION Item 4: Voting Securities and Principal Holders Thereof (a) Class of Voting shares as of May 31, 2021:
Common Stocks 776,465,281shares Each common share of the Company’s capital stock is entitled to one (1) vote at the Annual Stockholders’ Meeting. (b) Record Date: July 6, 2021
Only stockholders of record at the close of business on July 6, 2021 are entitled to vote at the meeting either in person or by proxy. (c) Election of Directors and Cumulative Voting Rights In all items for approval except election of directors, each share of stock entitles its registered owner to one (1) vote. In case of election of Directors, each stockholder may vote the number of shares of stock standing in his own name as of the record date of the meeting for as many persons as there are directors to be elected or he may cumulate said shares and give one candidate as many votes as the number of directors to be elected multiplied by the number of his shares shall equal, or he may distribute them on the same principle among as many candidates as he shall see fit; Provided, that the total number of votes cast by

3
him shall not exceed the number of shares owned by him as shown in the books of the Corporation multiplied by the whole number of directors to be elected. Security Ownership of Certain Beneficial Owners and Management 1. Owners of more than 5% of voting securities as of May 31, 2021. COMMON STOCK
SHARE CLASS NAME AND ADDRESS OF
RECORD OWNER
NAME OF BENEFICIAL OWNER
& RELATIONSHIP WITH RECORD
OWNER
CITIZENSHIP
NUMBER OF SHARES
BENEFICIALLY OWNED
% OF TOTAL
Common PAN MALAYAN MANAGEMENT & INVESTMENT CORPORATION 48/F, Yuchengco Tower, RCBC Plaza, 6819 Ayala Ave., Makati City Principal Stockholder
Ms. Helen Y. Dee Chairperson is authorized to direct voting of the shares held by Pan Malayan Management & Investment Corporation
Filipino 397,166,274* 51.15%
Common ESTATE OF ALFONSO T. YUCHENGCO 48/F, Yuchengco Tower, RCBC Plaza, 6819 Ayala Ave., Makati City Principal Stockholder
Ms. Helen Y. Dee In her capacity as Administrator is authorized to direct voting of the shares held the Estate of Alfonso T. Yuchengco
Filipino 90,123,082 11.61%
Common RCBC SECURITIES, INC. 7/F Yuchengco Tower, RCBC Plaza, 6819 Ayala Ave., Makati City
Mr. Raul M. Leopando Nominee Mr. Raul Ruiz VP - Research are authorized to direct voting of the shares held by RCBC Securities
Filipino 95,009,131 12.31%
Common BPI SECURITIES CORPORATION 8/F BPI Head Office Bldg., Ayala Ave., cor. Paseo de Roxas Makati City
Mr. John Kennard T. Fajardo Nominee-Applicant is authorized to direct voting of the shares held by BPI Securities Corporation
Filipino 45,867,948 5.90%
Common GPL Holdings, Inc. Ms. Helen Y. Dee President is authorized to direct voting of the shares held by GPL Holdings, Inc.
Filipino 41,170,360 5.30%
* Represents direct and indirect ownership. Among the above shareholders owning more than 5% of the Company’s capital stock, only Pan Malayan Management and Investment Corporation purchased shares of the Company in the past two years using internally generated funds. The details of which are as follows:
Date # of shares purchased Price November 29, 2019 7,029,980 5.400 December 6, 2019 4,649,990 5.410 January 15, 2019 4,000,000 5.400
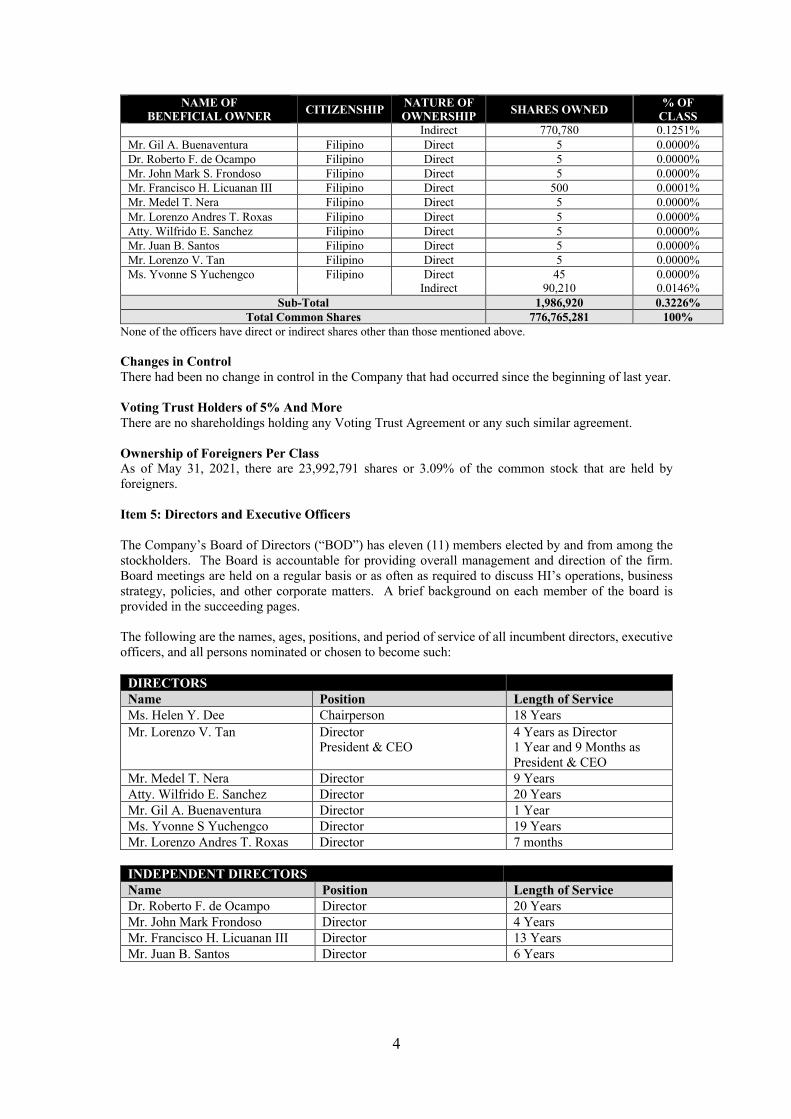
2. Security Ownership of Management Securities beneficially owned by the directors, nominees, officers, other than qualifying shares, as of April 30, 2021 according to the records of its stock and transfer agent, Rizal Commercial Banking Corp. (RCBC):
NAME OF BENEFICIAL OWNER CITIZENSHIP NATURE OF
OWNERSHIP SHARES OWNED % OF CLASS
Ms. Helen Y. Dee Filipino Direct 1,125,345 0.1827%
4
NAME OF BENEFICIAL OWNER CITIZENSHIP NATURE OF
OWNERSHIP SHARES OWNED % OF CLASS
Indirect 770,780 0.1251% Mr. Gil A. Buenaventura Filipino Direct 5 0.0000% Dr. Roberto F. de Ocampo Filipino Direct 5 0.0000% Mr. John Mark S. Frondoso Filipino Direct 5 0.0000% Mr. Francisco H. Licuanan III Filipino Direct 500 0.0001% Mr. Medel T. Nera Filipino Direct 5 0.0000% Mr. Lorenzo Andres T. Roxas Filipino Direct 5 0.0000% Atty. Wilfrido E. Sanchez Filipino Direct 5 0.0000% Mr. Juan B. Santos Filipino Direct 5 0.0000% Mr. Lorenzo V. Tan Filipino Direct 5 0.0000% Ms. Yvonne S Yuchengco Filipino Direct 45 0.0000% Indirect 90,210 0.0146%
Sub-Total 1,986,920 0.3226% Total Common Shares 776,765,281 100%
None of the officers have direct or indirect shares other than those mentioned above. Changes in Control There had been no change in control in the Company that had occurred since the beginning of last year. Voting Trust Holders of 5% And More There are no shareholdings holding any Voting Trust Agreement or any such similar agreement. Ownership of Foreigners Per Class As of May 31, 2021, there are 23,992,791 shares or 3.09% of the common stock that are held by foreigners. Item 5: Directors and Executive Officers The Company’s Board of Directors (“BOD”) has eleven (11) members elected by and from among the stockholders. The Board is accountable for providing overall management and direction of the firm. Board meetings are held on a regular basis or as often as required to discuss HI’s operations, business strategy, policies, and other corporate matters. A brief background on each member of the board is provided in the succeeding pages. The following are the names, ages, positions, and period of service of all incumbent directors, executive officers, and all persons nominated or chosen to become such:
DIRECTORS Name Position Length of Service Ms. Helen Y. Dee Chairperson 18 Years Mr. Lorenzo V. Tan Director
President & CEO 4 Years as Director 1 Year and 9 Months as President & CEO
Mr. Medel T. Nera Director 9 Years Atty. Wilfrido E. Sanchez Director 20 Years Mr. Gil A. Buenaventura Director 1 Year Ms. Yvonne S Yuchengco Director 19 Years Mr. Lorenzo Andres T. Roxas Director 7 months
INDEPENDENT DIRECTORS Name Position Length of Service Dr. Roberto F. de Ocampo Director 20 Years Mr. John Mark Frondoso Director 4 Years Mr. Francisco H. Licuanan III Director 13 Years Mr. Juan B. Santos Director 6 Years
5
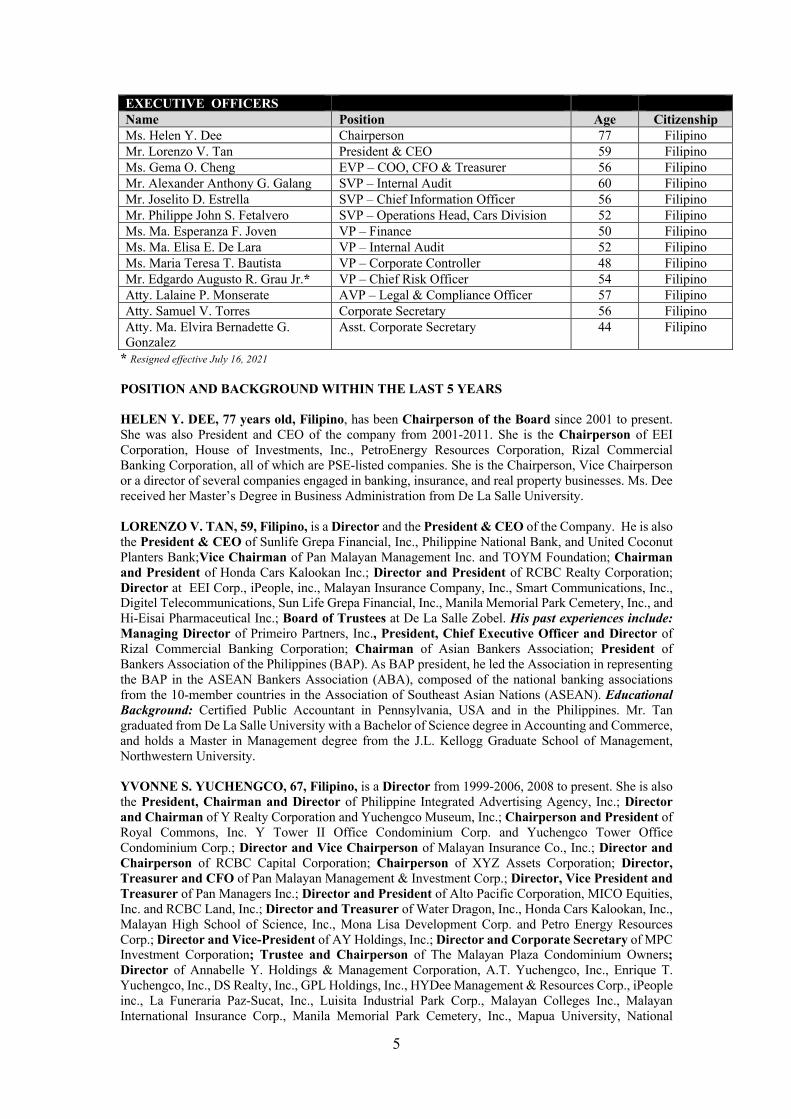
EXECUTIVE OFFICERS Name Position Age Citizenship Ms. Helen Y. Dee Chairperson 77 Filipino Mr. Lorenzo V. Tan President & CEO 59 Filipino Ms. Gema O. Cheng EVP – COO, CFO & Treasurer 56 Filipino Mr. Alexander Anthony G. Galang SVP – Internal Audit 60 Filipino Mr. Joselito D. Estrella SVP – Chief Information Officer 56 Filipino Mr. Philippe John S. Fetalvero SVP – Operations Head, Cars Division 52 Filipino Ms. Ma. Esperanza F. Joven VP – Finance 50 Filipino Ms. Ma. Elisa E. De Lara VP – Internal Audit 52 Filipino Ms. Maria Teresa T. Bautista VP – Corporate Controller 48 Filipino Mr. Edgardo Augusto R. Grau Jr.* VP – Chief Risk Officer 54 Filipino Atty. Lalaine P. Monserate AVP – Legal & Compliance Officer 57 Filipino Atty. Samuel V. Torres Corporate Secretary 56 Filipino Atty. Ma. Elvira Bernadette G. Gonzalez
Asst. Corporate Secretary 44 Filipino
* Resigned effective July 16, 2021 POSITION AND BACKGROUND WITHIN THE LAST 5 YEARS HELEN Y. DEE, 77 years old, Filipino, has been Chairperson of the Board since 2001 to present. She was also President and CEO of the company from 2001-2011. She is the Chairperson of EEI Corporation, House of Investments, Inc., PetroEnergy Resources Corporation, Rizal Commercial Banking Corporation, all of which are PSE-listed companies. She is the Chairperson, Vice Chairperson or a director of several companies engaged in banking, insurance, and real property businesses. Ms. Dee received her Master’s Degree in Business Administration from De La Salle University. LORENZO V. TAN, 59, Filipino, is a Director and the President & CEO of the Company. He is also the President & CEO of Sunlife Grepa Financial, Inc., Philippine National Bank, and United Coconut Planters Bank;Vice Chairman of Pan Malayan Management Inc. and TOYM Foundation; Chairman and President of Honda Cars Kalookan Inc.; Director and President of RCBC Realty Corporation; Director at EEI Corp., iPeople, inc., Malayan Insurance Company, Inc., Smart Communications, Inc., Digitel Telecommunications, Sun Life Grepa Financial, Inc., Manila Memorial Park Cemetery, Inc., and Hi-Eisai Pharmaceutical Inc.; Board of Trustees at De La Salle Zobel. His past experiences include: Managing Director of Primeiro Partners, Inc., President, Chief Executive Officer and Director of Rizal Commercial Banking Corporation; Chairman of Asian Bankers Association; President of Bankers Association of the Philippines (BAP). As BAP president, he led the Association in representing the BAP in the ASEAN Bankers Association (ABA), composed of the national banking associations from the 10-member countries in the Association of Southeast Asian Nations (ASEAN). Educational Background: Certified Public Accountant in Pennsylvania, USA and in the Philippines. Mr. Tan graduated from De La Salle University with a Bachelor of Science degree in Accounting and Commerce, and holds a Master in Management degree from the J.L. Kellogg Graduate School of Management, Northwestern University. YVONNE S. YUCHENGCO, 67, Filipino, is a Director from 1999-2006, 2008 to present. She is also the President, Chairman and Director of Philippine Integrated Advertising Agency, Inc.; Director and Chairman of Y Realty Corporation and Yuchengco Museum, Inc.; Chairperson and President of Royal Commons, Inc. Y Tower II Office Condominium Corp. and Yuchengco Tower Office Condominium Corp.; Director and Vice Chairperson of Malayan Insurance Co., Inc.; Director and Chairperson of RCBC Capital Corporation; Chairperson of XYZ Assets Corporation; Director, Treasurer and CFO of Pan Malayan Management & Investment Corp.; Director, Vice President and Treasurer of Pan Managers Inc.; Director and President of Alto Pacific Corporation, MICO Equities, Inc. and RCBC Land, Inc.; Director and Treasurer of Water Dragon, Inc., Honda Cars Kalookan, Inc., Malayan High School of Science, Inc., Mona Lisa Development Corp. and Petro Energy Resources Corp.; Director and Vice-President of AY Holdings, Inc.; Director and Corporate Secretary of MPC Investment Corporation; Trustee and Chairperson of The Malayan Plaza Condominium Owners; Director of Annabelle Y. Holdings & Management Corporation, A.T. Yuchengco, Inc., Enrique T. Yuchengco, Inc., DS Realty, Inc., GPL Holdings, Inc., HYDee Management & Resources Corp., iPeople inc., La Funeraria Paz-Sucat, Inc., Luisita Industrial Park Corp., Malayan Colleges Inc., Malayan International Insurance Corp., Manila Memorial Park Cemetery, Inc., Mapua University, National
6
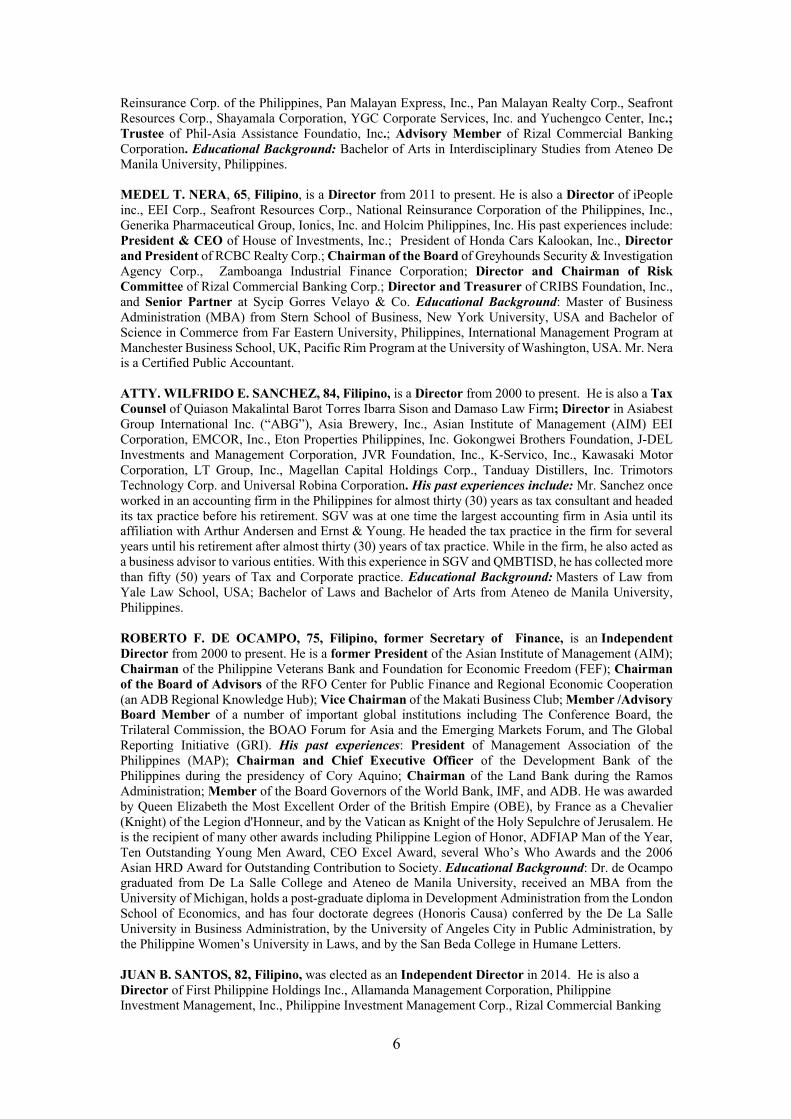
Reinsurance Corp. of the Philippines, Pan Malayan Express, Inc., Pan Malayan Realty Corp., Seafront Resources Corp., Shayamala Corporation, YGC Corporate Services, Inc. and Yuchengco Center, Inc.; Trustee of Phil-Asia Assistance Foundatio, Inc.; Advisory Member of Rizal Commercial Banking Corporation. Educational Background: Bachelor of Arts in Interdisciplinary Studies from Ateneo De Manila University, Philippines. MEDEL T. NERA, 65, Filipino, is a Director from 2011 to present. He is also a Director of iPeople inc., EEI Corp., Seafront Resources Corp., National Reinsurance Corporation of the Philippines, Inc., Generika Pharmaceutical Group, Ionics, Inc. and Holcim Philippines, Inc. His past experiences include: President & CEO of House of Investments, Inc.; President of Honda Cars Kalookan, Inc., Director and President of RCBC Realty Corp.; Chairman of the Board of Greyhounds Security & Investigation Agency Corp., Zamboanga Industrial Finance Corporation; Director and Chairman of Risk Committee of Rizal Commercial Banking Corp.; Director and Treasurer of CRIBS Foundation, Inc., and Senior Partner at Sycip Gorres Velayo & Co. Educational Background: Master of Business Administration (MBA) from Stern School of Business, New York University, USA and Bachelor of Science in Commerce from Far Eastern University, Philippines, International Management Program at Manchester Business School, UK, Pacific Rim Program at the University of Washington, USA. Mr. Nera is a Certified Public Accountant. ATTY. WILFRIDO E. SANCHEZ, 84, Filipino, is a Director from 2000 to present. He is also a Tax Counsel of Quiason Makalintal Barot Torres Ibarra Sison and Damaso Law Firm; Director in Asiabest Group International Inc. (“ABG”), Asia Brewery, Inc., Asian Institute of Management (AIM) EEI Corporation, EMCOR, Inc., Eton Properties Philippines, Inc. Gokongwei Brothers Foundation, J-DEL Investments and Management Corporation, JVR Foundation, Inc., K-Servico, Inc., Kawasaki Motor Corporation, LT Group, Inc., Magellan Capital Holdings Corp., Tanduay Distillers, Inc. Trimotors Technology Corp. and Universal Robina Corporation. His past experiences include: Mr. Sanchez once worked in an accounting firm in the Philippines for almost thirty (30) years as tax consultant and headed its tax practice before his retirement. SGV was at one time the largest accounting firm in Asia until its affiliation with Arthur Andersen and Ernst & Young. He headed the tax practice in the firm for several years until his retirement after almost thirty (30) years of tax practice. While in the firm, he also acted as a business advisor to various entities. With this experience in SGV and QMBTISD, he has collected more than fifty (50) years of Tax and Corporate practice. Educational Background: Masters of Law from Yale Law School, USA; Bachelor of Laws and Bachelor of Arts from Ateneo de Manila University, Philippines. ROBERTO F. DE OCAMPO, 75, Filipino, former Secretary of Finance, is an Independent Director from 2000 to present. He is a former President of the Asian Institute of Management (AIM); Chairman of the Philippine Veterans Bank and Foundation for Economic Freedom (FEF); Chairman of the Board of Advisors of the RFO Center for Public Finance and Regional Economic Cooperation (an ADB Regional Knowledge Hub); Vice Chairman of the Makati Business Club; Member /Advisory Board Member of a number of important global institutions including The Conference Board, the Trilateral Commission, the BOAO Forum for Asia and the Emerging Markets Forum, and The Global Reporting Initiative (GRI). His past experiences: President of Management Association of the Philippines (MAP); Chairman and Chief Executive Officer of the Development Bank of the Philippines during the presidency of Cory Aquino; Chairman of the Land Bank during the Ramos Administration; Member of the Board Governors of the World Bank, IMF, and ADB. He was awarded by Queen Elizabeth the Most Excellent Order of the British Empire (OBE), by France as a Chevalier (Knight) of the Legion d'Honneur, and by the Vatican as Knight of the Holy Sepulchre of Jerusalem. He is the recipient of many other awards including Philippine Legion of Honor, ADFIAP Man of the Year, Ten Outstanding Young Men Award, CEO Excel Award, several Who’s Who Awards and the 2006 Asian HRD Award for Outstanding Contribution to Society. Educational Background: Dr. de Ocampo graduated from De La Salle College and Ateneo de Manila University, received an MBA from the University of Michigan, holds a post-graduate diploma in Development Administration from the London School of Economics, and has four doctorate degrees (Honoris Causa) conferred by the De La Salle University in Business Administration, by the University of Angeles City in Public Administration, by the Philippine Women’s University in Laws, and by the San Beda College in Humane Letters. JUAN B. SANTOS, 82, Filipino, was elected as an Independent Director in 2014. He is also a Director of First Philippine Holdings Inc., Allamanda Management Corporation, Philippine Investment Management, Inc., Philippine Investment Management Corp., Rizal Commercial Banking

7
Corporation, Sunlife Grepa Financial, Inc.; Trustee of Dualtech Training Center Foundation, Inc. and St. Luke’s Medical Center; Member of the Board of Advisors of East-West Seeds Co., Mitsubishi Motor Phil. Corporation; Consultant of Marsman-Drysdale Group of Companies. His past experiences include: Chairman of Social Security System; Secretary of Trade and Industry, Philippines; Chairman and CEO of Nestle Philippines, Singapore and Thailand; Director of Philex Mining Corporation, Philippine Long Distance Telephone Company (PLDT), San Miguel Corporation; Educational Background: Advanced Management from International Institute of Management Development (IMD), Lausanne, Switzerland; Post-graduate studies on Foreign Trade from Thunderbird School of Global Management, Arizona, USA; and Bachelor of Science in Business Administration from Ateneo De Manila University, Philippines. GIL A. BUENAVENTURA, 68, Filipino is a Director from 2019 to present. He is also a Director in Malayan Insurance Co., Manila Memorial Park Cemetery, Inc. and Rizal Commercial Banking Corporation. His past experiences include: President, Chief Executive Officer and Executive Director of Rizal Commercial Banking Corporation. As RCBC President, CEO and Executive Director, he led the re-launch and re-branding of the bank to stay relevant amidst the changing banking landscape; President and Chief Executive Officer of Development Bank of the Philippines; Member of Makati Business Club, Management Association of the Philippines and Investment Committee, De La Salle Philippine School System; Board Member of Banker Association of the Philippines, BANCNET and Philippine Payments Management Inc. Educational Background: Mr. Buenaventura holds a Master of Business Administration in Finance from University of Wisconsin, Madison, Wisconsin. FRANCISCO H. LICUANAN III, 77, Filipino, is an Independent Director since 2006 to present. He is also Chairman & CEO of Battery Park Investment, Inc., Geo EState Development Corporation and New Pacific Resources Management Inc.; President & CEO of Innovative Property Solutions, Inc.; President of Stonebridge Corporation Educational Background: Master of Business Administration from Harvard Business School, USA; Bachelor of Arts in Economics (cum laude) from Ateneo De Manila University, Philippines. JOHN MARK S. FRONDOSO, 46, Filipino, was elected as an Independent Director in December 2016. He is the President of FSG Technology Ventures, Inc. (Digipay); President of Star Two Holdings, Inc.; Trustee and Chairman of the Investment Committee of the Philippine Public School Teachers Association; Director of HC Consumer Finance Philippines, Inc. (Home Credit); Chairman & President of FSG Capital, Inc. His Past experiences include: Philippine Chief Representative & Executive Director of Morgan Stanley (Singapore) Holdings Pte Ltd.; Associate Director of Barclays Capital (Investment Banking Division of Barclays Bank PLC). Educational Background: Bachelor of Science in Industrial Management (University Honors) from Carnegie Mellon University, USA. LORENZO ANDRES T. ROXAS, 57, Filipino, is a Director from 2020 to present. He is the Managing Director & Nominee at Philippine Equity Partners, Inc.; Director of RCBC Capital Corporation, RCBC Bankard Services Corporation, ATRAM Investment Management Partners Corporation, and ATR Holdings, Inc.; Advisory Board Member of PhilExcel Corporation; Board of Governors and Treasurer of Philippine Association of Securities Brokers and Dealers, Inc., and Chairman and President, LTR Holdings, Inc. His past experiences include: Chairman of Manila House Private Club, Inc.; Director of Asian Life & General Assurance Corporation, Tullett Prebon (Philippines), Inc. and Maybank ATR Kim Eng Capital Partners, Inc.; Board of Governors of the Philippine Association of Securities Brokers and Dealers, Inc.; and Chairman of the Board, President, and Director of Maybank ATR Kim Eng Securities, Inc. Educational Background: Masters in Business Administration, Northwestern University’s Kellogg School of Management and The Hong Kong University of Science and Technology and Bachelor of Arts Degree in Interdisciplinary Study, Ateneo de Manila University. EXECUTIVE OFFICERS: GEMA O. CHENG, 56, Filipino, is the Executive Vice President – Chief Operating Officer, Chief Finance Officer and Treasurer. She also holds the following positions within the group: Executive Vice President – Chief Financial Officer of iPeople, inc.; Chairman and President of Investment Managers, Inc.; Director, Vice President for Finance and Treasurer of Landev Corporation; and serves as Director of the following: Malayan Colleges Laguna, Inc., A Mapua School, Malayan Colleges Mindanao, A Mapua School, La Funeraria Paz-Sucat, Inc. and Manila Memorial Park Cemetery, Inc.

8
She was previously a Senior Vice President of SM Investments Corp. seconded as Treasury Head of SM Prime and its various business segments (Malls, Hotels & Conventions, Residences, Leisure and Commercial Properties Group) with concurrent role as CFO of the Commercial Properties Group; Educational Background: Bachelor of Arts in Economics (Magna Cum Laude) from the University of the Philippines-Diliman, Philippines; Certificate of Special Studies in Administration and Management from Harvard University, USA.
ALEXANDER ANTHONY G. GALANG, 60, Filipino, is the Senior Vice President for Internal Audit since 2009. He was Vice President of the company from 2004 to 2009. He is a Certified Public Accountant (CPA) having placed 12th in the 1981 licensure exams. He has a Global Certification as a Certified Fraud Examiner (CFE) and a Certification in Risk Management Assurance (CRMA). Educational Background: Bachelor of Science in Business Administration Major in Accounting (Cum Laude) from University of Sto. Tomas, Philippines.
JOSELITO D. ESTRELLA, 56, Filipino, is the Senior Vice President - Chief Information Officer. His past experiences include: Senior Vice President – Chief Information Officer of iPeople inc., President of Pan Pacific Computer Center Inc., Vice President for Sales & Marketing of AGD Infotech Inc. Educational Background: Bachelor of Science in Commerce Major in Management from San Beda College; Master of Science in Information Technology from De La Salle University.
PHILIPPE JOHN S. FETALVERO, 52, Filipino, is the SVP – Business Operations Head for the Cars Division. His past experiences include: General Manager of Honda Cars Kalookan, Inc. where he started as Sales Manager in 1994. He also served as a faculty member at the De la Salle University Impact Center. Educational Background: Bachelor of Science in Computer Science from the De La Salle University.
MA. ESPERANZA F. JOVEN, 50, Filipino, is the Vice President for Finance. She is also the Vice President & Treasurer in HI-Eisai Pharmaceutical, Inc.; and a Director in Manila Memorial Park Cemetery, Inc., La Funeraria Paz-Sucat, Inc., and San Lorenzo Ruiz Investment Holdings & Services, Inc. Her past experiences include: Vice President for Finance of iPeople, inc.; Director of Zamboanga Industrial Finance Corporation; MSCF Program Coordinator and Assistant Professional Lecturer at De La Salle University. She also held the Series 7, 63, and 24 licenses with the Financial Industry Regulatory Authority (FINRA), The Nasdaq Stock Market, and in the 52 states and territories of the USA. Educational Background: Master of Science in Computational Finance and Bachelor of Science in Applied Mathematics from De La Salle University-Manila.
MARIA ELISA E. DE LARA, 51, Filipino, is the Vice President for Internal Audit since 2013. She joined the company in October 2010 and was appointed as Assistant Vice President for Group Internal Audit effective January 2011. She is a Certified Public Accountant and holds a Global Certification in Risk Management Assurance (CRMA). Educational Background: Bachelor of Science in Business Administration Major in Accounting (Magna Cum Laude) from the Philippine Women’s University.
MARIA TERESA T. BAUTISTA, 48, Filipino, is the Vice President - Controller since July, 2017. She is also the Controller of Landev Corporation; CFO and Treasurer of Investment Managers Inc., Xamdu Motors, Inc., Zamboanga Carriers, Inc. and Zambowood Realty and Development Corp. and Hexagon Lounge, Inc.; Treasurer of Greyhounds Security and Investigation Agency Corp. and Secon Professional Security. She is a Certified Public Accountant, holds a Global Certification for Internal Auditors (CIA) and has completed the Six Sigma Green Belt Program. Educational Background: Bachelor of Science in Commerce, major in Accounting, from St. Paul College, Philippines.
EDGARDO AUGUSTO R. GRAU, JR., 54, Filipino, is the Vice President – Chief Risk Officer. He holds this position from July 9, 2019 to July 15, 2021. His previous affiliations include: Examiner, Financial Analyst and Policy Developer at the Office of The Comptroller of the Currency (an agency under the US Department of Treasury). In this capacity, he provided supervisory monitoring of local and regional financial institutions, both healthy and distressed. He has expertise in mortgage banking, real estate lending, asset securitization, risk management, consumer compliance, and holding company oversight. He has consulting experience with startups as well as small-to-medium sized enterprises. Educational Background: Bachelor of Business Administration (Magna Cum Laude) from Seton Hall University, USA.
9
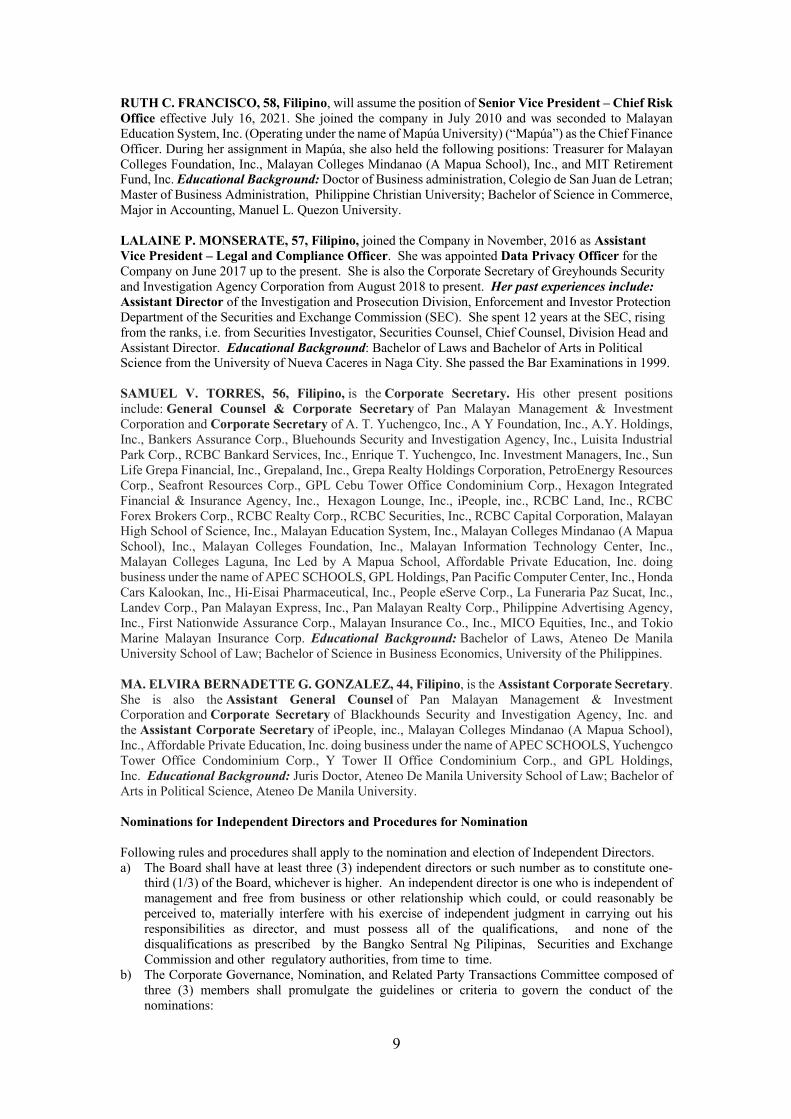
RUTH C. FRANCISCO, 58, Filipino, will assume the position of Senior Vice President – Chief Risk Office effective July 16, 2021. She joined the company in July 2010 and was seconded to Malayan Education System, Inc. (Operating under the name of Mapúa University) (“Mapúa”) as the Chief Finance Officer. During her assignment in Mapúa, she also held the following positions: Treasurer for Malayan Colleges Foundation, Inc., Malayan Colleges Mindanao (A Mapua School), Inc., and MIT Retirement Fund, Inc. Educational Background: Doctor of Business administration, Colegio de San Juan de Letran; Master of Business Administration, Philippine Christian University; Bachelor of Science in Commerce, Major in Accounting, Manuel L. Quezon University. LALAINE P. MONSERATE, 57, Filipino, joined the Company in November, 2016 as Assistant Vice President – Legal and Compliance Officer. She was appointed Data Privacy Officer for the Company on June 2017 up to the present. She is also the Corporate Secretary of Greyhounds Security and Investigation Agency Corporation from August 2018 to present. Her past experiences include: Assistant Director of the Investigation and Prosecution Division, Enforcement and Investor Protection Department of the Securities and Exchange Commission (SEC). She spent 12 years at the SEC, rising from the ranks, i.e. from Securities Investigator, Securities Counsel, Chief Counsel, Division Head and Assistant Director. Educational Background: Bachelor of Laws and Bachelor of Arts in Political Science from the University of Nueva Caceres in Naga City. She passed the Bar Examinations in 1999. SAMUEL V. TORRES, 56, Filipino, is the Corporate Secretary. His other present positions include: General Counsel & Corporate Secretary of Pan Malayan Management & Investment Corporation and Corporate Secretary of A. T. Yuchengco, Inc., A Y Foundation, Inc., A.Y. Holdings, Inc., Bankers Assurance Corp., Bluehounds Security and Investigation Agency, Inc., Luisita Industrial Park Corp., RCBC Bankard Services, Inc., Enrique T. Yuchengco, Inc. Investment Managers, Inc., Sun Life Grepa Financial, Inc., Grepaland, Inc., Grepa Realty Holdings Corporation, PetroEnergy Resources Corp., Seafront Resources Corp., GPL Cebu Tower Office Condominium Corp., Hexagon Integrated Financial & Insurance Agency, Inc., Hexagon Lounge, Inc., iPeople, inc., RCBC Land, Inc., RCBC Forex Brokers Corp., RCBC Realty Corp., RCBC Securities, Inc., RCBC Capital Corporation, Malayan High School of Science, Inc., Malayan Education System, Inc., Malayan Colleges Mindanao (A Mapua School), Inc., Malayan Colleges Foundation, Inc., Malayan Information Technology Center, Inc., Malayan Colleges Laguna, Inc Led by A Mapua School, Affordable Private Education, Inc. doing business under the name of APEC SCHOOLS, GPL Holdings, Pan Pacific Computer Center, Inc., Honda Cars Kalookan, Inc., Hi-Eisai Pharmaceutical, Inc., People eServe Corp., La Funeraria Paz Sucat, Inc., Landev Corp., Pan Malayan Express, Inc., Pan Malayan Realty Corp., Philippine Advertising Agency, Inc., First Nationwide Assurance Corp., Malayan Insurance Co., Inc., MICO Equities, Inc., and Tokio Marine Malayan Insurance Corp. Educational Background: Bachelor of Laws, Ateneo De Manila University School of Law; Bachelor of Science in Business Economics, University of the Philippines. MA. ELVIRA BERNADETTE G. GONZALEZ, 44, Filipino, is the Assistant Corporate Secretary. She is also the Assistant General Counsel of Pan Malayan Management & Investment Corporation and Corporate Secretary of Blackhounds Security and Investigation Agency, Inc. and the Assistant Corporate Secretary of iPeople, inc., Malayan Colleges Mindanao (A Mapua School), Inc., Affordable Private Education, Inc. doing business under the name of APEC SCHOOLS, Yuchengco Tower Office Condominium Corp., Y Tower II Office Condominium Corp., and GPL Holdings, Inc. Educational Background: Juris Doctor, Ateneo De Manila University School of Law; Bachelor of Arts in Political Science, Ateneo De Manila University. Nominations for Independent Directors and Procedures for Nomination Following rules and procedures shall apply to the nomination and election of Independent Directors. a) The Board shall have at least three (3) independent directors or such number as to constitute one-
third (1/3) of the Board, whichever is higher. An independent director is one who is independent of management and free from business or other relationship which could, or could reasonably be perceived to, materially interfere with his exercise of independent judgment in carrying out his responsibilities as director, and must possess all of the qualifications, and none of the disqualifications as prescribed by the Bangko Sentral Ng Pilipinas, Securities and Exchange Commission and other regulatory authorities, from time to time.
b) The Corporate Governance, Nomination, and Related Party Transactions Committee composed of three (3) members shall promulgate the guidelines or criteria to govern the conduct of the nominations:

10
c) Nomination of independent director shall be conducted by the Corporate Governance, Nomination and Related Party Transactions Committee prior to the stockholders’ meeting. All recommendations shall be signed by the nominating stockholders together with the acceptance and conformity by the would-be nominees.
d) The Corporate Governance, Nomination, and Related Party Transactions Committee shall pre-screen the qualifications and prepare a final list of all candidates and put in place screening policies and parameters to enable it to effectively review the qualifications of the nominees for independent directors;
e) After the nomination, the Corporate Governance, Nomination, and Related Party Transactions Committee shall prepare a Final List of Candidates which shall contain all the information about all the nominees for independent directors, as required by existing and applicable rules, which list, shall be made available to the Commission and to all stockholders through the filing and distribution of the Information Statement, or in such other reports the Company is required to submit to the Commission. The name of the person or group of persons who recommended the nomination of the independent director shall be identified in such report including any relationship with the nominee;
f) Only nominees whose names appear on the Final List of Candidates shall be eligible for election as Independent Directors. No other nominations shall be entertained after the Final List of Candidates shall have been prepared. No further nominations shall be entertained or allowed on the floor during the actual annual stockholders’ meeting.
g) Election of Independent Directors • Subject to pertinent existing rules and regulation of SEC, the conduct of the election of
independent directors shall be made in accordance with the standard election procedures of the By-laws.
• It shall be the responsibility of the Chairman of the Meeting to inform all stockholders in attendance of the mandatory requirement of electing independent directors. He shall ensure that independent directors are elected during the stockholders’ meeting.
• Specific slots for independent directors shall not be filled up by unqualified nominees. In case of failure of elections for independent directors, the Chairman of the Meeting shall call a separate election during the same meeting to fill up the vacancy. The following were nominated to the position of directors of the Company for the year 2021-2022:
Regular Directors 1) Ms. Helen Y. Dee 2) Mr. Lorenzo V. Tan 3) Atty. Wilfrido E. Sanchez 4) Ms. Yvonne S. Yuchengco 5) Mr. Medel T. Nera 6) Mr. Gil A. Buenaventura 7) Mr. Lorenzo Andres T. Roxas
Independent Directors
1) Dr. Roberto F. de Ocampo 2) Mr. Francisco H. Licuanan III 3) Mr. Juan B. Santos 4) Mr. John Mark S. Frondoso
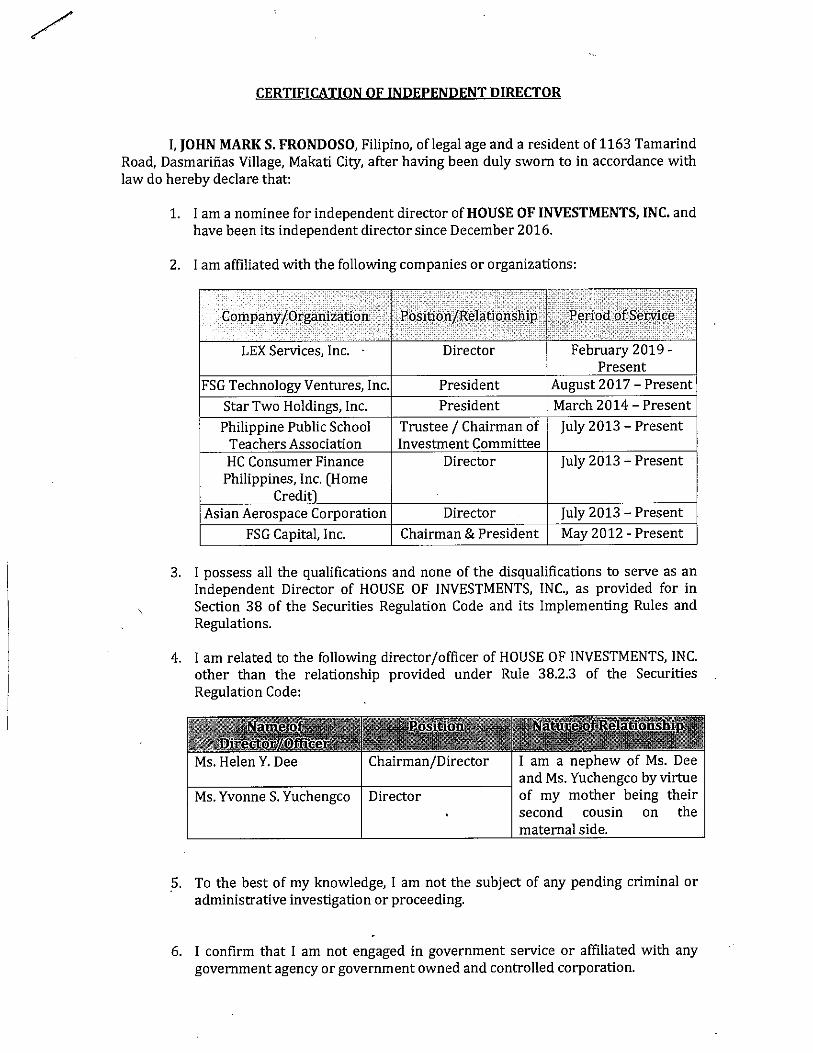
Mrs. Eliadah Neiel Dela Rama, a stockholder of the Company, who is not in any way related to the nominees, nominated Messrs. Roberto F, de Ocampo, Francisco H. Licuanan III, Juan B. Santos, and John Mark S. Frondoso as independent directors. The Corporate Governance, Nominations, and Related Party Transactions Committee reviews and evaluates the qualifications of all persons nominated as director as well as those to be nominated to other positions requiring appointment by the Board of Directors. With respect to the nominees for independent directors, they are neither officers nor employees, consultants or retainers, legal or otherwise, of the Company or any of its affiliates, and do not have any relationship with the Company which would interfere with the exercise of independent judgment in carrying out the responsibilities of a director. Their nomination and qualification by the Corporate Governance, Nominations, and Related
11
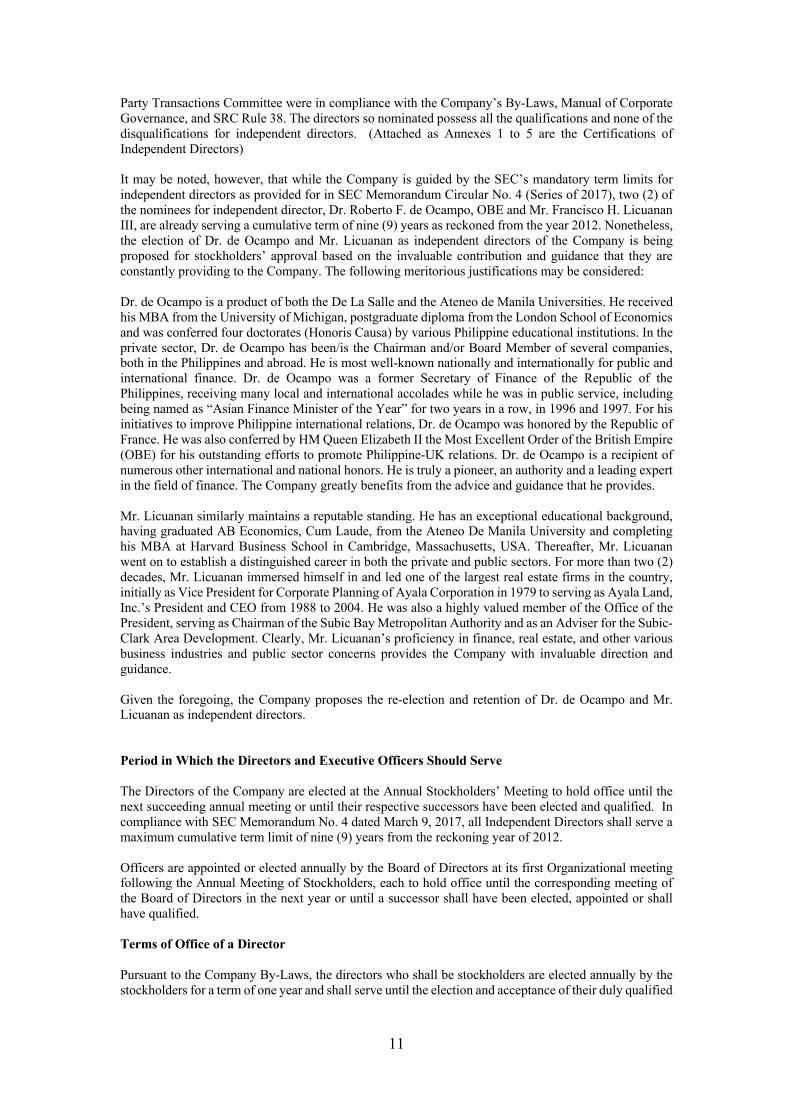
Party Transactions Committee were in compliance with the Company’s By-Laws, Manual of Corporate Governance, and SRC Rule 38. The directors so nominated possess all the qualifications and none of the disqualifications for independent directors. (Attached as Annexes 1 to 5 are the Certifications of Independent Directors) It may be noted, however, that while the Company is guided by the SEC’s mandatory term limits for independent directors as provided for in SEC Memorandum Circular No. 4 (Series of 2017), two (2) of the nominees for independent director, Dr. Roberto F. de Ocampo, OBE and Mr. Francisco H. Licuanan III, are already serving a cumulative term of nine (9) years as reckoned from the year 2012. Nonetheless, the election of Dr. de Ocampo and Mr. Licuanan as independent directors of the Company is being proposed for stockholders’ approval based on the invaluable contribution and guidance that they are constantly providing to the Company. The following meritorious justifications may be considered: Dr. de Ocampo is a product of both the De La Salle and the Ateneo de Manila Universities. He received his MBA from the University of Michigan, postgraduate diploma from the London School of Economics and was conferred four doctorates (Honoris Causa) by various Philippine educational institutions. In the private sector, Dr. de Ocampo has been/is the Chairman and/or Board Member of several companies, both in the Philippines and abroad. He is most well-known nationally and internationally for public and international finance. Dr. de Ocampo was a former Secretary of Finance of the Republic of the Philippines, receiving many local and international accolades while he was in public service, including being named as “Asian Finance Minister of the Year” for two years in a row, in 1996 and 1997. For his initiatives to improve Philippine international relations, Dr. de Ocampo was honored by the Republic of France. He was also conferred by HM Queen Elizabeth II the Most Excellent Order of the British Empire (OBE) for his outstanding efforts to promote Philippine-UK relations. Dr. de Ocampo is a recipient of numerous other international and national honors. He is truly a pioneer, an authority and a leading expert in the field of finance. The Company greatly benefits from the advice and guidance that he provides. Mr. Licuanan similarly maintains a reputable standing. He has an exceptional educational background, having graduated AB Economics, Cum Laude, from the Ateneo De Manila University and completing his MBA at Harvard Business School in Cambridge, Massachusetts, USA. Thereafter, Mr. Licuanan went on to establish a distinguished career in both the private and public sectors. For more than two (2) decades, Mr. Licuanan immersed himself in and led one of the largest real estate firms in the country, initially as Vice President for Corporate Planning of Ayala Corporation in 1979 to serving as Ayala Land, Inc.’s President and CEO from 1988 to 2004. He was also a highly valued member of the Office of the President, serving as Chairman of the Subic Bay Metropolitan Authority and as an Adviser for the Subic-Clark Area Development. Clearly, Mr. Licuanan’s proficiency in finance, real estate, and other various business industries and public sector concerns provides the Company with invaluable direction and guidance. Given the foregoing, the Company proposes the re-election and retention of Dr. de Ocampo and Mr. Licuanan as independent directors. Period in Which the Directors and Executive Officers Should Serve The Directors of the Company are elected at the Annual Stockholders’ Meeting to hold office until the next succeeding annual meeting or until their respective successors have been elected and qualified. In compliance with SEC Memorandum No. 4 dated March 9, 2017, all Independent Directors shall serve a maximum cumulative term limit of nine (9) years from the reckoning year of 2012. Officers are appointed or elected annually by the Board of Directors at its first Organizational meeting following the Annual Meeting of Stockholders, each to hold office until the corresponding meeting of the Board of Directors in the next year or until a successor shall have been elected, appointed or shall have qualified. Terms of Office of a Director Pursuant to the Company By-Laws, the directors who shall be stockholders are elected annually by the stockholders for a term of one year and shall serve until the election and acceptance of their duly qualified
12
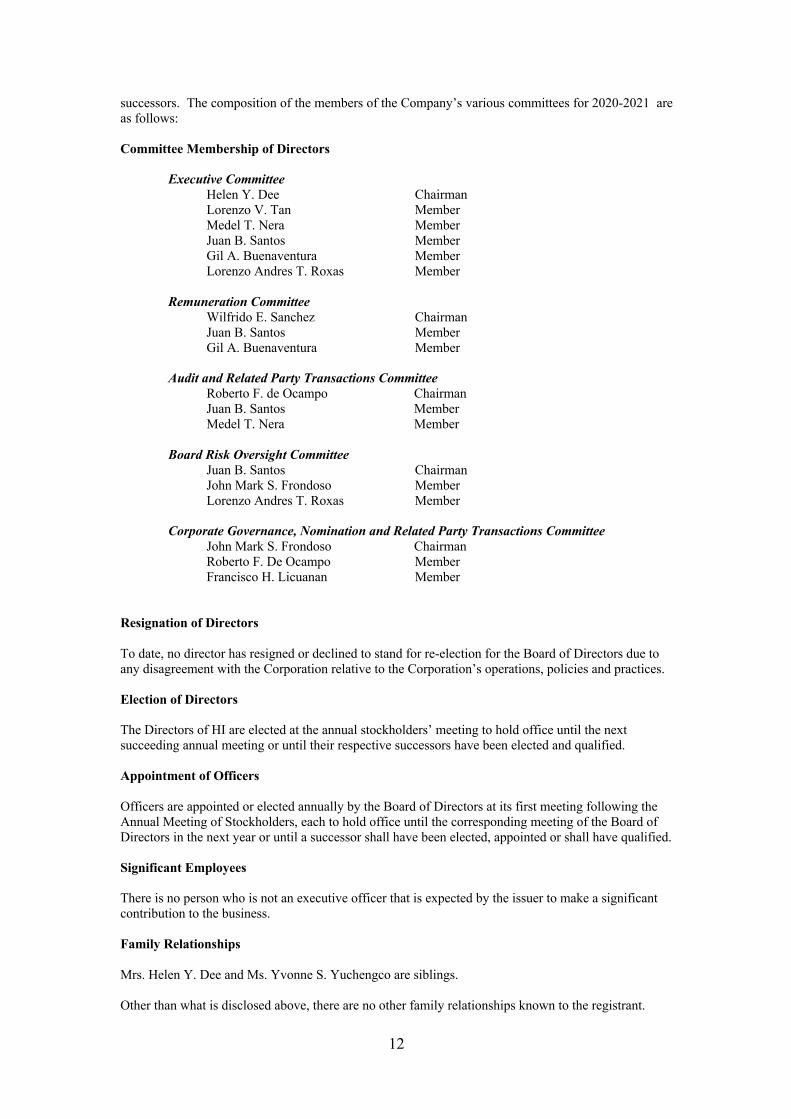
successors. The composition of the members of the Company’s various committees for 2020-2021 are as follows: Committee Membership of Directors
Executive Committee Helen Y. Dee Chairman Lorenzo V. Tan Member Medel T. Nera Member Juan B. Santos Member Gil A. Buenaventura Member Lorenzo Andres T. Roxas Member
Remuneration Committee
Wilfrido E. Sanchez Chairman Juan B. Santos Member Gil A. Buenaventura Member
Audit and Related Party Transactions Committee
Roberto F. de Ocampo Chairman Juan B. Santos Member Medel T. Nera Member
Board Risk Oversight Committee
Juan B. Santos Chairman John Mark S. Frondoso Member Lorenzo Andres T. Roxas Member
Corporate Governance, Nomination and Related Party Transactions Committee
John Mark S. Frondoso Chairman Roberto F. De Ocampo Member Francisco H. Licuanan Member
Resignation of Directors To date, no director has resigned or declined to stand for re-election for the Board of Directors due to any disagreement with the Corporation relative to the Corporation’s operations, policies and practices. Election of Directors The Directors of HI are elected at the annual stockholders’ meeting to hold office until the next succeeding annual meeting or until their respective successors have been elected and qualified. Appointment of Officers Officers are appointed or elected annually by the Board of Directors at its first meeting following the Annual Meeting of Stockholders, each to hold office until the corresponding meeting of the Board of Directors in the next year or until a successor shall have been elected, appointed or shall have qualified. Significant Employees There is no person who is not an executive officer that is expected by the issuer to make a significant contribution to the business. Family Relationships Mrs. Helen Y. Dee and Ms. Yvonne S. Yuchengco are siblings. Other than what is disclosed above, there are no other family relationships known to the registrant.

13
Interest on Certain Matters to be Acted Upon No director or officer of the Company has substantial interest, direct or indirect, in any matter to be acted upon in the meeting. Certain Relationships and Related Transactions There is no director, executive officer, nominee for director, beneficial holder, or any family member involved in any business transaction with HI and subsidiaries. There are no material transactions which were negotiated by the Company with parties whose relationship with the Company fall outside the definition of “related parties” under Philippine Accounting Standards 24, Related Party Disclosures, but with whom the Company has relationship that enables such parties to negotiate terms that may not be available from other, more clearly independent parties on an arm’s length basis. Please refer to Note 22 of the consolidated financial statements for the details of related party transactions. As discussed in the notes, in the normal conduct of business, other transactions with certain affiliates include sharing in general and administrative expenses and cash advances. Involvement in Legal Proceedings The Company is not aware and none of the directors and officers or persons nominated to become directors or officers has informed the Company of the following events during the past five years until April 30, 2020: (a) any bankruptcy petition filed by or against any business of which any of its director or executive officers was a general partner or executive officer either at the time of bankruptcy or within two (2) years prior to that time. (b) any conviction by final judgment of any director or senior executive in a criminal proceeding domestic or foreign or being subject to a pending criminal proceeding domestic or foreign, of any director, executive officer or person nominated to be a director (c) any director or senior executive being subject to any order, judgment or decree not subsequently reversed suspended or vacated of any court of competent jurisdiction, domestic or foreign permanently or temporarily enjoining barring, suspending or otherwise limiting such directors’ or executive officer’s involvement in any type of business securities, commodities or banking activities (d) any executive officer or director found by a domestic or foreign court of competent jurisdiction, the Commission or other foreign body or a domestic or foreign Exchange or other organized trading market or self-regulatory organization to have violated a securities or commodities law or regulation and the judgment has not been reversed, suspended, or vacated.

14
Item 6: Compensation of Directors and Executive Officers Information as to the aggregate compensation paid or accrued during the last two fiscal years and to be paid in the ensuing fiscal year to the Company’s Chief Executive Officer and other officers follows:
NAME AND POSITION YEAR SALARY BONUS OTHER ANNUAL COMPENSATION
The top 5 executives of the Company are as follows:
1. Lorenzo V. Tan, President & CEO 2. Gema O. Cheng, EVP – Chief
Operating Officer, Chief Financial Officer & Treasurer
3. Alexander Anthony G. Galang, SVP – Internal Audit
4. Joselito D. Estrella, SVP – Chief Information Officer
5. Edgardo R. Grau, Jr., VP – Chief Risk Officer
2021 P 40.6M (est) P0 P0 2020 P 38.7M P0 P0 2019 P 31.8M P0 P0
All other officers and directors as group unnamed.
2021 P42.2M (est) P0 P1.2M (est) 2020 P41.0M P0 P1.1M 2019 P43.0M P0 P0.9M
TOTALS 2021 P82.8M(est) P0 P1.2M (est) 2020 P79.7M P0 P1.1M 2019 P74.8M P0 P0.9M
The table states the aggregate compensation of all directors and executive officers as a group. Other Annual Compensation pertains to per diem allowances given to Directors as discussed below. Directors are paid a per diem of P25,000 for attendance in a Board meeting. Board meetings are scheduled every quarter in a year. A director is also paid a per diem of P10,000 for participation in Audit, Board Risk Oversight, and Corporate Governance, RPT and Nominations committee meetings and P5,000 in other committee meetings. Item 7: Independent Public Accountants The Accounting firm of Sycip Gorres Velayo and Company (SGV & Co.), with office address at 6760 Ayala Avenue, SGV Building, Makati City, Philippines, has been the Company’s Independent Auditors since the Company’s incorporation, and has been recommended to serve as such for the current year. Pursuant to SRC Rule 68, paragraph 3(b)(iv) and Memorandum Circular No. 8, series of 2003 (Five (5) Year Rotation of External Auditors), the Company has engaged Ms. Wenda Lynn M. Loyola, as the Engagement Partner of SGV & Co. effective 2016. The engagement of the external auditors was favorably endorsed by the Audit Committee to the Board of Directors. The engagement is ultimately submitted for approval of the stockholders. Disagreement with Accountants on Accounting and Financial Disclosure There was no event for the last 5 years where SGV & Co. had any disagreement with regard to any matter relating to accounting principles or practices, financial statement disclosure or auditing scope or procedure. Attendance of Accountants at the Meeting Representatives of SGV & Co. are expected to be present at the annual stockholders meeting on August 17, 2020 with the opportunity to make any statement, if they so desire, and will be available to respond to appropriate questions on the Company’s financial statements. External Audit Fees and Services The Company has engaged SGV & Co. as the external auditor, and is tasked to conduct the financial audit of the Company. For this service, SGV & Co. has billed the company the following amounts:

15
YEAR AUDIT FEE BILLING 2020 P3,417,000 2019 P3,296,450 2018 P3,182,750
The Company has not engaged SGV & Co. for any other services aside from its annual audit for the last five (5) years. Tax Fees The Company has not engaged the services of the external auditor for tax accounting, compliance, advice, planning and any other form of tax services. All Other Fees There are no other fees billed in each of the last two years for the products and services provided by the external auditor, other than the services reported under the items mentioned above. Item 8: Compensation Plans No action shall be taken with respect to any plan pursuant to which cash or non-cash compensation may be paid or distributed. C. ISSUANCE AND EXCHANGE OF SECURITIES
Item 9: Authorization or Issuance of Securities Other than for Exchange No action is to be taken with respect to the following:
1. modification or exchange of securities 2. financial and other information 3. mergers, consolidation, acquisition and similar matters 4. restatement of accounts
Item 10. Modification or Exchange of Securities No action is to be taken with respect to the modification of any class of securities of the registrant, or the issuance or authorization for issuance of one class of securities of the registrant in exchange for outstanding securities of another class. Item 11: Financial and Other Information The audited financial statements as of December 31, 2020, Management Discussion and Analysis, Market Price of Shares and Dividends and other date related to the Company’s financial information is attached hereto as “Annex C” Item 12: Mergers, Consolidations, Acquisitions and Similar Matters No action is to be taken with respect to any transaction involving the following:
1. the merger or consolidation of the registrant into or with any other person or of any other person into or with the registrant;
2. the acquisition by the registrant or any of its security holders of securities of another person; 3. the acquisition by the registrant of any other going business or of the assets thereof; 4. the sale or other transfer of all or any substantial part of the assets of the registrant; or 5. the liquidation or dissolution of the registrant.
Item 13: Acquisition or Disposition of Property No action is to be taken with respect to the acquisition or disposition of any property. Item 14: Restatement of Accounts No action is to be taken with respect to the restatement of any asset, capital, or surplus account of the registrant.

16
D. OTHER MATTERS Item 15: Action With Regard to Reports The Minutes of the previous stockholders meeting held on August 17, 2020 and the Management Report as set forth in the Annual Report will be submitted for stockholders approval.
The voting procedure utilized for election and approval of corporate actions in which Stockholders’ approval were required was by remotely or in absentia and by proxy. The stockholders present remotely or in absentia and by proxy are represented by 601,284,569 common shares or 77.44% of the total outstanding shares entitled to vote. The stockholders were given the opportunity to ask questions by submitting their questions electronically to the Company before the meeting and also before the meeting was adjourned. There were no questions submitted before, nor were asked during, the said meeting. The following matters were discussed and approved with no further comments or objections during the meeting:
1. Approval of the July 19, 2019 Minutes constitutes a ratification of the accuracy and faithfulness of the Minutes of the events that transpired during the said meeting, such as (a) 2018 annual report and audited financial statements, (b) ratification of the actions of the Board of Directors, different Committees and Management during the year 2018, (c) election of directors, and (d) appointment of external auditors.
2. Approval of the 2019 Management and Annual Report constitutes a ratification of the
Company’s performance during the previous calendar years as contained in the Annual Report.
3. Approval of the amendment of Article First of the Articles of Incorporation reflecting
the change in corporate name of the Company
4. Approval of the amendment of Article Third of the Articles of Incorporation reflecting the change in the principal address of the Company
5. Ratification and confirmation of all the acts, resolutions and proceedings of the Board of Directors, Executive Committee and officers of the Company. This pertains to all acts resolutions, proceedings and approval made by the Board of Directors, Executive Committee and Officers of the Company from the last stockholders’ meeting on July 19, 2019 for the period 2019 up to the date of meeting (August 17, 2020). This includes, among others, those that involve the day to day operations, administrations and management of the corporate affairs such as: a) opening/closing of bank accounts and delegation of bank signatories; b) approval of loans; c) redemption of preferred shares; d) declaration of cash dividends; and e) appointment/promotion of officers;
6. Election of Directors for 2020-2019.
7. Re-appointment of Sycip Gores Velayo & Co. as external auditor of the Company for
the fiscal year ending 31 December 2020.
The record of the voting results for each of the items listed above form part of the Minutes of the Annual Stockholders’ Meeting, which is attached herewith. The following directors and officers were present at the meeting:
Directors: 1. Mrs. Helen Y. Dee, Chairperson 2. Mr. Medel T. Nera, President 3. Ms. Yvonne S. Yuchengco 4. Mr. Lorenzo V. Tan

17
5. Dr. Reynaldo B. Vea6. Atty. Wilfrido E. Sanchez7. Mr. Juan B. Santos8. Mr. Lorenzo Andres T. Roxas
Officers:9. Ms. Gema O. Cheng, EVP-COO, CFO and Treasurer10. Mr. Anthony Alexander G. Galang, SVP-Internal Audit11. Ms. Ma. Esperanza F. Joven, VP-Finance12. Ms. Ma. Teresa T. Bautista, VP-Corporate Controller13. Ms. Maria Elisa E. De Lara, VP-Internal Audit14. Atty. Lalaine P. Monserate, AVP-Legal and Compliance Officer15. Atty. Samuel V. Torres, Corporate Secretary16. Atty. Ma. Elvira Bernadette C. Garcia-Gonzalez, Assistant Corporate Secretary
The President’s Report, which includes the financial performance of the Company form part of the minutes which is attached herewith. Approval of the Audited Financial Statements, which is provided to the stockholders is likewise stated in the minutes. All material information on current stockholders and their voting rights are stated in the Minutes.
Copies of the minutes of the stockholders’ meeting were made available on the Company’s website together with the Information Statement and were likewise available at the Disclosures Section of the Philippine Stock Exchange (edge.pse.com.ph). Likewise a recording of the proceedings were made available on the Company’s website.
Approval of the August 17, 2020 Minutes constitutes a ratification of the accuracy and faithfulness of the Minutes of the events that transpired during the said meeting, such as (a) 2019 annual report and audited financial statements, (b) ratification of the actions of the Board of Directors, different Committees and Management during the year 2019, (c) Approval of Article First of the Articles of Incorporation reflecting the change in corporate name of the Company , (d) Amendment of Article Third of the Articles of Incorporation reflecting the change in the principal address of the Company (e) election of directors, and (f) appointment of external auditors.
Approval of the Annual Report constitutes a ratification of the Company’s performance during the previous calendar years as contained in the Annual Report.
Ratification and confirmation of all the acts, resolutions and proceedings of the Board of Directors, Executive Committee and officers of the Company. This pertains to all acts resolutions, proceedings and approval made by the Board of Directors, Executive Committee and Officers of the Company from the last stockholders’ meeting on July 19, 2019 for the period 2019 up to the date of meeting (August 17, 2020). This includes, among others, those that involve the day to day operations, administrations and management of the corporate affairs such as: a) opening/closing of bank accounts and delegation of bank signatories; b) approval of loans; c) appointment/promotion of officers; d) acquisition of the outstanding common stock of San Lorenzo Ruiz Investment Holdings and Services, Inc. and other matters covered by disclosures to the Securities and Exchange Commission and the Philippine Stock Exchange.
Item 16: Matters Not Required to be Submitted
No action is to be taken with respect to any matter, which is not required to be submitted to a vote of security holders.
Item 17: Amendment of Charter, Bylaws or Other Documents
No action is to be taken with respect to the amendment of Charter, By-laws of Other Documents.
Item 18: Other Proposed Action
The following matters will be submitted to a vote at the meeting:
1. Approval of the Minutes of the Annual Stockholders’ Meeting held on August 17, 2020.

18
2. Approval of the Management Report and the Audited Financial Statements of the Company forthe year ended December 31, 2020;
3. Ratification and confirmation of all acts, resolutions and proceedings of the Board of Directors,Executive Committee, Other Committees and Officers of the Company during the year 2020.
4. Election of Directors for 2021-2022;a. Extension of the term of Dr. Roberto F. de Ocampo and Mr. Francisco H. Licuanan, III
5. Appointment of External Auditors
Item 19: Voting Procedures
All shareholders who wish to cast their votes may do so via the method provided for voting by remote communication or in absentia, or by providing the proxy form provided herein. The procedures for voting in absentia shall be provided securely through the emails of the stockholders.
At all elections of Directors, each stockholder may vote the shares registered in his/her/its name for as many persons as there are Directors, or he may cumulate said shares and give one candidate as many votes, as the number of Directors to be elected multiplied by the number of his share, or he may distribute them on the same principle among as many candidates as he shall see fit; provided, however, that the whole number of votes cast by him shall not exceed the number of shares owned by him as shown on the Company’s stock transfer books multiplied by the number of Directors to be elected.
The Company will not declare stock dividends during the year.
Corporate Governance
(a) Evaluation System to Measure Compliance with the Manual on Corporate Governance
The Company has monitored its compliance with Securities and Exchange Commission (SEC)Memorandum Circulars as well as all relevant Philippine Stock Exchange (PSE) Circulars onCorporate Governance. The Company continues to comply with the leading practices andprinciples on good corporate governance and appropriate self-rating assessment and performanceevaluation to determine and measure its compliance with the Company’s Manual on CorporateGovernance.
The Company has submitted its Integrated Annual Corporate Governance Report (IACGR) for theperiod covering the years 2017, 2018 and 2019. For the period covering the year 2020, theCompany will submit its IACGR on or before May 30, 2021.
(b) Measures Undertaken to Fully Comply with Leading Practices on Corporate Governance
In its 2017, 2018 and 2019 Integrated Annual Corporate Governance Reports (IACGRs), theCompany has complied with majority of all recommendations specified in the said Report. In2019, except for two recommendations, the Company is compliant with all of therecommendations. In its 2020 I-ACGR, the Company will endeavor to comply with the said twoun-complied recommendations.
(c) Deviation from the Manual on Corporate Governance
There is no deviation from the Manual on Corporate Governance. This can be gleaned from theIntegrated Annual Corporate Governance Report (IACGR) where majority of therecommendations were complied by the Company. In 2019, while there were two (2)recommendations which the Company cannot comply, the Company provided for substantialexplanation (pursuant to the “comply or explain” approach required by SEC) including the factthat the principles recommended were still being achieved by the Company despite its non-compliance. In its 2020 report, the Company will endeavor to comply with the said two un-complied recommendations in 2019, however, if it cannot, despite its efforts, then it will providesubstantial explanation to the effect that the principles recommended were still achieved by theCompany despite its non-compliance.

19
(d) Plans to Improve Corporate Governance In order to improve the performance of the Chairperson, the Board of Directors and its officers, the Company required them to submit an Annual Self-Assessment Questionnaire which is composed of varying statements on their roles, functions and responsibilities under the Manual on Corporate Governance. Likewise, the Company, as required under its Policy on Related Party Transactions, implemented the annual submission of Related Party Questionnaire in order to elicit information about any potential or actual related party transactions entered into by the Chairperson, the Board of Directors, the Company and its officers on the said year. In addition, the Company also required them to submit a Biographical Data containing their personal information, work experience, family relations, and others, to determine their relatives within the third-degree of consanguinity and their related party transactions with the Company, if there is any. The Committee on Corporate Governance, Nominations and Related Party Transactions has been monitoring their submissions. The Company continuously monitors all relevant PSE and SEC Circulars on Corporate Governance that maybe used to improve compliance with the Manual on Corporate Governance. With the pandemic (COVID 19), the PSE and SEC have issued numerous Circulars and Advisories which the Company have complied. The Company continues to adhere to the leading practices in good corporate governance as well as the Manual on Corporate Governance by requiring its Chairperson, Directors and Officers to attend the annual seminar on Corporate Governance conducted by entities accredited by the Securities and Exchange Commission (SEC).


HOUSE OF INVESTMENTS, INC.
PROXY
I, the undersigned holder of shares of stock of House of Investments, Inc. (“Corporation”), do hereby constitute, name and appoint the Chairman of the Meeting, or in his absence, the Secretary of the Meeting, as my attorney and proxy, to represent me and to vote all the shares registered under my name in the Books of the Corporation at the Annual Meeting of the Stockholders of the Corporation on August 6, 2021 and any adjournment(s) thereof. In particular, I hereby direct my said proxy to vote on the matters set forth below as I have expressly indicated by marking the same with an “X”. If I fail to indicate my vote on the items specified below, I authorize my proxy full discretion to act and I understand that my proxy shall vote in accordance with the recommendation of the Management. Management recommends a “FOR ALL” vote for proposal 1 and a “FOR” for proposals 2 through 5.
PROPOSAL ACTION FOR ALL WITHHOLD
FOR ALL EXCEPTION
1. Election of Management’s Nominees as Directors Management Nominees:
1. Helen Y. Dee 2. Lorenzo V. Tan 3. Yvonne S. Yuchengco 4. Medel T. Nera 5. Wilfrido E. Sanchez 6. Gil A. Buenventura 7. Lorenzo Andres T. Roxas
Independent Directors: 1. Roberto F. De Ocampo* 2. John Mark S. Frondoso 3. Francisco H. Licuanan III* 4. Juan B. Santos
All incumbent members of the Board of Directors. *For retention/extension of term. INSTRUCTIONS: To withhold authority to vote for any individual nominee(s) of Management, please mark Exception box and list name(s) under.
FOR AGAINST ABSTAIN 2. Approval of the Minutes of the Annual Stockholders’ Meeting
held on August 17, 2020.
3. Approval of the Management Report and Audited Financial Statements for 2020.
4. Ratification and confirmation of the acts, resolutions and proceedings of the Board of Directors, Executive Committee, Other Committees and the Officers of the Company during the year 2020, which includes, among others, those that involve the day to day operations, administrations and management of the corporate affairs.
5. Appointment of SGV as External Auditors
THIS PROXY, SOLICITED ON BEHALF OF THE INCUMBENT BOARD OF DIRECTORS OF HOUSE OF INVESTMENTS, INC. SHOULD BE RECEIVED BY THE CORPORATE SECRETARY ON OR BEFORE 10:00 A.M OF AUGUST 14, 2020, THE DEADLINE FOR SUBMISSION OF PROXIES. REVOCABILITY OF PROXY
THE SHAREHOLDER MAY REVOKE THE PROXY ISSUED BY HIM AT ANY TIME PRIOR TO ITS USE BY THE PARTY WHO IS THEREBY AUTHORIZED TO EXERCISE THE SAME. THE PERSON SIGNING THE PROXY HAS THE RIGHT TO REVOKE THE PROXY BY ATTENDING THE MEETING IN PERSON OR EXECUTION OF A PROXY AT A LATER DATE. PERSONS MAKING THE SOLICITATION THIS PROXY IS SOLICITED ON BEHALF OF THE MANAGEMENT. THE PROXY STATEMENT AND THE ENCLOSED PROXY SHALL BE SENT BY THE SECRETARY OF THE CORPORATION EITHER BY MAIL, POSTAGE PREPAID, OR BY PERSONAL DELIVERY TO EACH STOCKHOLDER AT HIS ADDRESS APPEARING IN THE RECORDS OF THE

CORPORATION. DULY EXECUTED PROXIES MAY BE RETURNED BY MAIL, FAX, OR BY HAND TO THE OFFICE OF THE CORPORATE SECRETARY ON OR BEFORE 10:00 A.M. ON JULY 27, 2021. SOLICITATIONS OF PROXIES WILL BE MAINLY CONDUCTED THROUGH MAIL. IN ADDITION TO SOLICITATION OF THE PROXIES BY MAIL, OFFICERS AND EMPLOYEES OF THE COMPANY MAY ALSO SOLICIT PROXIES PERSONALLY OR BY TELEPHONE. THE COST OF SOLICITATION, APPROXIMATELY P= 250,000 WILL BE BORNE BY THE COMPANY. THERE IS NO MATERIAL CONSIDERATION CONTRACT OR ARRANGEMENT FOR THE SOLICITATION. THE COMPANY IS NOT A PARTY TO ANY ARRANGEMENT OR UNDERSTANDING WITH ANY PERSON WITH RESPECT TO ANY MATTER TO BE ACTED UPON THE MEETING. THIS PROXY SHALL BE VALID FOR FIVE (5) YEARS FROM THE DATE HEREOF UNLESS OTHERWISE INDICATED IN THE BOX HEREIN PROVIDED:
THIS PROXY, WHEN PROPERLY EXECUTED, WILL BE VOTED IN THE MANNER AS DIRECTED HEREIN BY THE STOCKHOLDER(S). IF NO DIRECTION IS MADE, THIS PROXY WILL BE VOTED “FOR” THE ELECTION OF ALL NOMINEES AND FOR SUCH MATTERS AS MAY PROPERLY COME BEFORE THE MEETING, INCLUDING MATTERS WHICH THE SOLICITOR(S) DO NOT KNOW A REASONABLE TIME BEFORE THE SOLICITATION ARE TO BE PRESENTED AT THE MEETING, IN THE MANNER DESCRIBED IN THE INFORMATION STATEMENT AND/OR AS RECOMMENDED BY MANAGEMENT OR THE BOARD OF DIRECTORS. INTEREST OF CERTAIN PERSONS IN OR OPPOSITION TO MATTERS TO BE ACTED UPON:
1. No current director or officer of the Company, or nominee for election as directors of the Company or any associate thereof, has any substantial interest, direct or indirect, by security holdings or otherwise, in any matter to be acted upon other than the election to office.
2. No director has informed the Company in writing that he intends to oppose any action to be taken by the registrant at the meeting.
THIS PROXY SHALL CONFER DISCRETIONARY AUTHORITY TO VOTE WITH RESPECT TO ANY OF THE FOLLOWING MATTERS:
1. MATTERS WHICH THE COMPANY DOES NOT KNOW DURING A REASONABLE TIME BEFORE THIS SOLICITATION ARE TO BE PRESENTED AT THE MEETING.
2. MATTERS INCIDENT TO THE CONDUCT OF THE MEETING.
Printed Name Signature of Stockholder No. of Shares Date
___________________________________________________________________________________________________________
Address and Telephone Number
THIS PROXY IS BEING SOLICITED ON BEHALF OF THE MANAGEMENT OF HOUSE OF INVESTMENTS, INC. Please mail this proxy form to : ATTY. SAMUEL V. TORRES CORPORATE SECRETARY House of Investments, Inc. 9/F Grepalife Bldg. 221 Sen. Gil Puyat Avenue OR FAX TO : 8816-11-27 / 8815-99-81 Makati City Metro Manila E-mail: [email protected]

ANNEX “A” A. Procedure to Register to be able to Attend and Participate in the Meeting
Stockholders are requested to notify the Company, by email to the following email address: [email protected], by July 27, 2021, of their intention to participate in the Annual Stockholders’ Meeting by remote communications. For validation purposes, Stockholders shall also provide the Company with the following information: (a) Name; (b) Address; and (c) Contact Number. The Company may require documents to ascertain and verify the identity of the requesting person.
B. Procedures for Electronic Voting in Absentia
I. Coverage Stockholders of House of Investments, Inc. who chose to electronically vote in absentia, upon registration and validation.
II. Registration a. Who may Register – Stockholders of Record as of July 6, 2021
b. When to Register – Registration period shall be from July 6, 2021 at 8:00 AM to July 27,
2021 at 5:00 PM, Philippine Standard Time (“Registration Period”). Beyond this date, Stockholders may no longer avail of the option to electronically vote in absentia.
c. How to Register – The Stockholders will be requested to send a notification together with a scanned or digital copy of the documents listed below, to the following email address: [email protected], within the Registration Period, for validation. Individual Stockholders:
1. A recent photo of the Stockholder, with face fully visible, 2. Front and back portions of the Stockholder’s valid government-issued,
identification card, preferably with residence address, and 3. Contact number
Stockholders with Joint Account: 1. Authorization letter signed by all Stockholders, identifying who among them is
authorized to cast the vote for the account, 2. A recent of the authorized Stockholder, with face fully visible, 3. Front and back portions of the Authorized Stockholder’s valid government-issued
identification card, preferably with residence address, and 4. Contact number of the Authorized Stockholder
Broker Accounts: 1. The broker’s certification on the Stockholder’s number of shareholdings duly
signed by the named Nominee or Associated Person of the said broker, 2. A recent photo of the Stockholder, with face fully visible, 3. Front and back portions of the Stockholder's valid government-issued
identification card, preferably with residence address, and 4. Contact number

Corporate Stockholders 1. Signed Corporate Secretary’s certificate attesting to the authority of the
representative to vote for and on behalf of the Corporation, 2. A recent photo of the Stockholder’s representative, with face fully visible, 3. Front and back portions of the valid government-issued identification card
Stockholder’s representative, preferably with residence address, and 4. Contact number of the Stockholder’s representative
Stockholders with incomplete requirements will not be given the link to attend the meeting through remote communication or vote in absentia, but may still vote by sending a proxy to the Annual Stockholders’ Meeting.
d. Validation of Registration The registration notification, information and documents required to be submitted by the Stockholder, as provided for above, shall be reviewed and evaluated whereby the identity and number of shares of the stockholder shall be ascertained and verified. The validation of the information provided, the documents submitted and the propriety of the stockholder’s registration shall be completed by the Company within three (3) business days from receipt of the registration notification and required information and documents. The Company will send an email confirming the successful validation of the Stockholders’ registration. Please note that submission of incomplete or inconsistent information may result in an unsuccessful registration and attendance in the meeting through remote communication means will not be allowed. Note: In light of the recent events and government pronouncements and guidelines surrounding the COVID-19 pandemic, the Company shall allow electronic signatures for the required documents, as may be applicable. Notarization requirements shall also be dispensed with at this time. However, the Company reserves the right to request additional information, and original signed and notarized copies of these documents, as it deems necessary.
III. Voting
Please use the form attached as Annex “B” to record your vote and then email to: [email protected], on or before July 27, 2021 Notes and Conduct of Voting: A. Voting
a. The Stockholder appointing a Proxy: Stockholders may give the Proxy the authority to vote in all matters for approval.
b. The Stockholder Voting by Remote Communication or in Absentia The Stockholders will be asked to fill in the attached Annex “B” 1. For items other than the Election of Directors, the registered Stockholder has the
option to vote: FOR, AGAINST, or ABSTAIN. The vote is considered cast for all the registered Stockholders’ shares.
2. For Election of Directors, the registered Stockholder may vote for all nominees, not vote for any of the nominees, or vote for some nominees only, in such
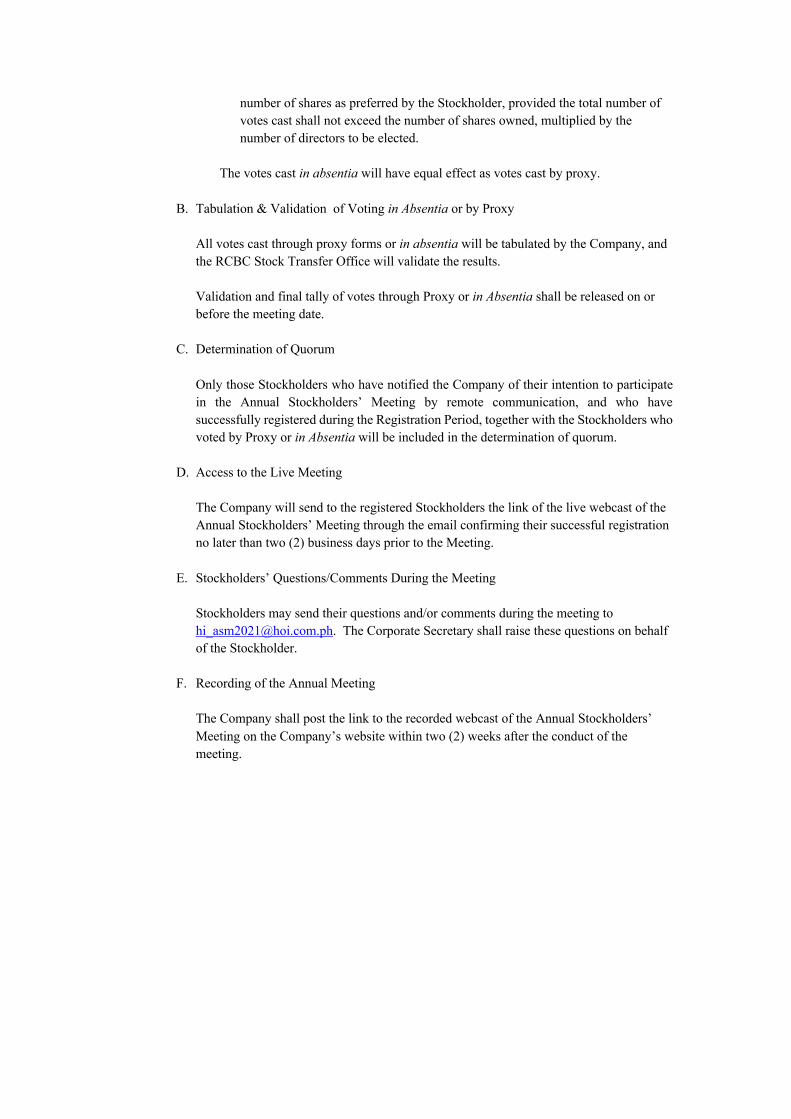
number of shares as preferred by the Stockholder, provided the total number of votes cast shall not exceed the number of shares owned, multiplied by the number of directors to be elected.
The votes cast in absentia will have equal effect as votes cast by proxy.
B. Tabulation & Validation of Voting in Absentia or by Proxy
All votes cast through proxy forms or in absentia will be tabulated by the Company, and the RCBC Stock Transfer Office will validate the results. Validation and final tally of votes through Proxy or in Absentia shall be released on or before the meeting date.
C. Determination of Quorum Only those Stockholders who have notified the Company of their intention to participate in the Annual Stockholders’ Meeting by remote communication, and who have successfully registered during the Registration Period, together with the Stockholders who voted by Proxy or in Absentia will be included in the determination of quorum.
D. Access to the Live Meeting The Company will send to the registered Stockholders the link of the live webcast of the Annual Stockholders’ Meeting through the email confirming their successful registration no later than two (2) business days prior to the Meeting.
E. Stockholders’ Questions/Comments During the Meeting Stockholders may send their questions and/or comments during the meeting to [email protected]. The Corporate Secretary shall raise these questions on behalf of the Stockholder.
F. Recording of the Annual Meeting The Company shall post the link to the recorded webcast of the Annual Stockholders’ Meeting on the Company’s website within two (2) weeks after the conduct of the meeting.

ANNEX “B” ELECTRONIC VOTING IN ABSENTIA
PROPOSAL ACTION FOR ALL WITHHOLD
FOR ALL EXCEPTION
ELECTION OF DIRECTORS Management Nominees:
1. HELEN Y. DEE 2. LORENZO V. TAN 3. YVONNE S. YUCHENGCO 4. MEDEL T. NERA 5. WILFRIDO E. SANCHEZ 6. GIL A. BUENVENTURA 7. LORENZO ANDRES T. ROXAS
Independent Directors: 8. ROBERTO F. DE OCAMPO* 9. FRANCISCO H. LICUANAN III* 10. JUAN B. SANTOS 11. JOHN MARK S. FRONDOSO
All incumbent members of the Board of Directors. *For retention/extension of term. INSTRUCTIONS: To withhold authority to vote for any individual nominee(s) of Management, please mark Exception box and list name(s) under.
FOR AGAINST ABSTAIN APPROVAL OF THE MINUTES OF THE ANNUAL STOCKHOLDERS’ MEETING HELD ON AUGUST 17, 2020.
APPROVAL OF THE MANAGEMENT REPORT AND AUDITED FINANCIAL STATEMENTS FOR 2020.
RATIFICATION AND CONFIRMATION OF THE ACTS, RESOLUTIONS AND PROCEEDINGS OF THE BOARD OF DIRECTORS, EXECUTIVE COMMITTEE, OTHER COMMITTEES, AND THE OFFICERS OF THE COMPANY DURING THE YEAR 2020.
APPOINTMENT OF SGV AS EXTERNAL AUDITORS.
DATE: ______________________________________________ STOCKHOLDER’S NAME: ______________________________________________ STOCKHOLDER’S SIGNATURE: ______________________________________________ NOTE: Please submit this form on or before July 27, 2021 and accompanied by any government issued identification.

ANNEX “C”
MANAGEMENT REPORT

Financial and Other Information
Audited Financial Statements The Statement of Management’s Responsibility and Consolidated Audited Financial Statements of the Group as at December 31, 2020 are attached hereto as Annex “D”. Changes in and Disagreements with Accountants in Accounting and Financial Disclosure None Management Discussion and Analysis of Financial Condition and Plan of Operations Item 1: Description of Business 1.1 Business Development
House of Investments, Inc. (“the Company”) was incorporated in 1959 as an investment bank, the first of such bank to be organized in the Philippines. Through the years, the Company evolved into an investment holding and management company with a diversified portfolio and became one of the four major flagship corporations of the Yuchengco Group of Companies (“YGC”). The Company’s core business focus is organized into four segments, namely: car dealership, construction, education and property management services. Its portfolio investments are in pharmaceuticals, energy, and deathcare. CORE BUSINESS UNITS: A. CAR DEALERSHIP: House of Investments operates three car-retailing brands: Honda, Isuzu and Geely. House of Investments owns and operates Honda dealerships in the following Metro Manila locations: Quezon Ave., Manila, Marikina, Fairview, and Marcos Highway and one service center in Tandang Sora. HI also owns a majority stake in Honda Cars Kalookan, Inc. that owns and operates dealerships in Kalookan and Greenhills. The Company’s Isuzu dealerships are in four locations: Manila, Commonwealth, Greenhills, and Leyte. House of Investments owns a minority stake in Sojitz G Auto Philippines Corporation (“SGAP”) which owns and operates the Geely distributorship and the flagship dealership in North Edsa. B. CONSTRUCTION House of Investments owns a majority stake in one of the largest Philippine construction and general contracting firms, EEI Corporation. EEI has international operations spanning from the Kingdom of Saudi Arabia to Africa and Asia. It is also a market leader in the domestic construction and contracting sector. C. EDUCATION House of Investments owns a significant stake in iPeople, inc. (“iPeople”), the vehicle for investments in education. iPeople wholly owns the Malayan Education System, Inc. (Operating under the name of Mapúa University) (“MES”). Mapúa University is widely considered to be the leading and largest private engineering and I.T. school in the country. Mapua University also owns and operates three other schools: Malayan Colleges Laguna (A Mapua School) Inc, Malayan Colleges Mindanao, A Mapua School and Malayan High School of Science. The merger of Ayala Education Inc. (AEI) into iPeople which took effect in May 2019 brought in three more schools into the iPeople network, bringing the total number of operating schools to seven (7). The three new schools from the merger are as follows: The APEC Schools, University of Nueva Caceres (UNC) and National Teachers College (NTC).
D. PROPERTY SERVICES House of Investments wholly owns Landev Corporation. Landev is primarily engaged in property, facilities, and project management for the YGC. It also provides comprehensive security services to leading institutions through its subsidiary Greyhounds Security and Investigation Agency Corporation (“GSIA”). House of Investments also owns a minority stake in RCBC Realty Corporation (“RRC”), which owns the RCBC Plaza. The operations of RCBC Plaza are managed by Landev Corporation. In 2020, House of Investments acquired San Lorenzo Ruiz Investment Holdings and Services, Inc. which owns a property within the Makati Central Business District. The operations of each core business, along with a discussion of risks and 2019 performance, will be discussed in the appropriate section. PORTFOLIO INVESTMENTS: A. ENERGY House of Investments has investments in the energy sector through its stake in PetroEnergy Resources Corporation (“PERC”) and EEI Power Corporation, a wholly-owned subsidiary of EEI. PetroEnergy Resources Corporation (PERC) is a publicly listed Philippine energy company founded in 1994 to undertake upstream oil exploration and development. Since then, it has diversified into renewable energy and power generation. PetroEnergy, through its renewable energy arm, PetroGreen Energy Corporation (PGEC), has investments in the following joint venture companies: PetroSolar Corporation, PetroWind Energy Inc., and Maibarara Geothermal Incoporated. EEI Power Corporation is involved in the business of power generation by way of its investments in renewable energy. It is also engaged in retail electricity supply and in the supply of electrical equipment and services, as well as electro-mechanical contracting works. B. PHARMACEUTICALS House of Investments owns 50% of HI-Eisai Pharmaceuticals, Inc. (“HEPI”), which is a joint venture with the Eisai Co. of Japan. HEPI imports pharmaceuticals from Japan, which it sells in the Philippine market through established drug distributors. C. DEATHCARE House of Investments owns a material stake in Manila Memorial Park Cemetery, Inc. (“MMPCI”). MMPCI is the recognized market leader in afterlife services. It sells memorial lots and owns, operates, and maintains memorial parks. House of Investments, together with MMPCI jointly owns La Funeraria Paz-Sucat, Inc. (“LFPSI”). LFPSI provides mortuary services to the bereaved and their loved ones. 1.2 Business of the Issuer THE HOLDING COMPANY The executive management takes an active role in the management of the core businesses. In addition, the executive management monitors the business performance of the portfolio companies very closely. Through management meetings and regular review of actual results compared to budgets and previous year performance, House of Investments is able to direct corporate strategy and operations. In particular, management watches operating metrics very closely and how these would impact the financial metrics. By monitoring operating and financial metrics, executive management can always determine whether the capital deployed to various businesses within the portfolio is being used efficiently, and generating returns that meet hurdle rates.
Executive management also engages in a continuous business development program. These business development activities range from identifying growth opportunities in existing businesses; helping develop new products and services that increase organic growth; or buying entire companies or controlling stakes in companies which show high growth potential. Risks at the Holding Company Level Risk management is an integral part of the Company’s governance. Through the Risk Management Council ("RMC"), key risk exposures are identified, analyzed, and categorized; and then risk mitigation plans are developed. The RMC is composed of the following: Chief Executive Officer, Chief Operating Officer, Chief Finance Officer, Chief Risk Officer, Chief Audit Officer, Complaince Officer, and all Group Heads. The council is responsible for monitoring and evaluating the effectiveness of the organization’s risk management processes and in communicating significant risks, control issues and risk mitigation plans to the Board Risk Oversight Committee (“BROC”) which is composed of three non-executive directors. The following covers the risk management policies at the holding company level. For a discussion of risks faced by each core business unit, please refer to the appropriate section in this report.
a. Interest Rate Risk The Company is exposed to interest rate risk because it has borrowings from local banks. It is a company policy to use excess liquidity to pay down borrowings in order to decrease financing costs, and reduce exposure to rising interest rates. It is also a company policy to actively discuss with lending banks on how to lower financing costs. HI does not speculate on the direction of interest rates. The main objective is to lower financing costs as much as possible.
b. Liquidity Risk
The Company seeks to manage its liquidity to be able to service maturing debts, finance capital requirements, and pay for existing operations. House of Investments maintains a consistent level of funding to be able to pay for its day-to-day operations. The Company constantly monitors its projected cash flows. Close attention is paid to asset liability management.
c. Credit Risk
The Company’s exposure to credit risk is very minimal because its receivables are mostly from related parties, which are being managed through close account monitoring and limit setting. However, the Company’s cash and short-term securities exposes the company to the credit risk of the counterparty.
d. Price Risk Available for sale (AFS) financial instruments are subject to price risk due to changes in market values because of specific factors related to these securities, or because of factors related to the overall market for financial assets. These prices change depending on how market participants act in the market. The Company has minimal non-core holdings in its AFS investments. For its non-core holdings, the Company’s investment policy is to monitor developments in the market and these securities very closely. The Company regularly assesses the opportunity cost of holding these securities.
e. Business Continuity Risk The Company is acutely conscious of the risks posed by natural disasters, acts of God, or other man-made actions that can have an adverse impact on the continuity of regular operations. The Company’s Board through the Board Risk Oversight Committee and the management team ensures that the business continuity plans of each operating subsidiary are in place and is up to date. Further, the management works with the Yuchengco Group of Companies Business Continuity Management - Disaster Recovery Management (YGC BCM-
DRM) Council to ensure that necessary precautionary measures are taken to mitigate risks that may cause disruptions to the operations of our various subsidiaries.
f. Pandemic Risk Pandemics are large-scale outbreaks of infectious disease that can greatly increase morbidity and mortality over a wide geographic area and cause significant economic, social, and political disruption. The spread of the COVID-19 which originated from Wuhan, China could in 2019 have significant implications for businesses here in the Philippines and around the globe. The businesses that the Company is invested in may be impacted by the government mandated Community Quarantines which resulted in lockdown of business operations and/or increased operating costs thereby affecting the profitability of our various operations. These lockdowns have resulted in a decline in revenues and income for our major businesses for 2020. Despite the setbacks, we continue to prepare our businesses to take advantage of a reopening economy. Pandemic risk mitigation is by our respective companies with the assistance of the Business Continuity Management – Disaster Risk Management (“BCM-DRM”) Council.
g. Competition The company is subject to competition in the segments in which each of its core business units operates. Please refer to the related section of each core business unit on the risks each group faces.
h. Succession Risk The Company knows that people are an important resource and that its executive management team is a significant contributor to the continuing growth of House of Investments’ investment portfolio. In order to preserve the management chain of succession and institutional knowledge that comes with it, the executive management works with the executives of the operating subsidiaries to ensure continuous training and career development are in place.
i. Reputation Risk As a holding company, events occurring at its subsidiaries may ultimately impact the HI brand. Through monthly Mancom and quarterly board committee meetings, HI continues to effectively oversee the affairs of its subsidiaries.
HI has a Board Risk Oversight Committee (“BROC”), an extension of the full Board of Directors, which meets every quarter to discuss key risks and opportunities of the company. One of the BROCs main role is to review management’s effectiveness in managing risks. The BROC also provides direction and guidance on how the company will not only respond to risks, but also take advantage of opportunities. To support the BROC, the Risk Management Council (“RMC”) which is composed of the HI top management, is also tasked to help execute the direction set by the BROC regarding strategic risks and opportunities. The Chief Risk Officer, with guidance from the RMC and BROC, oversees the implementation of HI Enterprise Risk Management Plan. CAR DIVISIONS House of Investments operates two car-retailing brands: Honda and Isuzu. Honda’s vehicle line-up includes passenger cars and commercial vehicle categories while Isuzu’s is purely commercial vehicles. The Company also holds a minority interest in SGAP, the distributor of Geely vehicles and the owner and operator of the flaghip dealership in North Edsa. New vehicle unit sales are cyclical. Changes in unit sales are driven by factors like new models, manufacturer incentives, interest rates, fuel prices, unemployment, inflation, the level of personal discretionary spending, credit availability, consumer confidence and others. Our dealerships also generate revenue through repair services, the sale of replacement and aftermarket parts, and the sale of third-party finance and insurance products. We believe our various income

streams help to lower the impact of the cyclicality found in the automotive sector. Revenues from service and parts sales are typically less cyclical than retail vehicle sales. In 2020, the Company took a long hard look at the future of its Cars business and closed down five of our least profitable auto dealerships, in an effort to reduce costs and better position the business for improved profitability. Risk Factors at the Car Divisions
a. Macro-economic conditions The Car Divisions’ performance is impacted by general economic conditions overall, and in particular, by economic conditions in the markets in which we operate. These economic conditions include: availability of consumer credit; changes in consumer demand; consumer confidence levels; fuel prices; personal discretionary spending levels; interest rates; and unemployment rates.
b. Operational Risks
• Franchise Agreements with Honda, Isuzu, and Geely. Our dealerships operate under a franchise agreement with Honda Cars Philippines Inc.with Isuzu Philippines Corp. and Sojitz G Auto Philippines Corp., which authorizes our dealerships to sell new vehicles of the brands we carry or perform manufacturer authorized warranty service. These agreements govern almost every aspect of the operation of our dealerships, and give manufacturers the discretion to terminate or not renew our franchise agreements for a variety of reasons
• Information Technology and Cyber Security. Our information systems are fully integrated into our operations. If these systems go down, our business could be significantly disrupted. In addition, to the extent our systems are subject to intentional attacks or unintentional events that allow unauthorized access that disrupts our systems, our business could be significantly disrupted.
• Property loss, business interruption or other liabilities. Our operations can be hampered by
property losses due to fire, adverse weather conditions, and militant activities e.g. rallies and strikes, among others. In addition, our business is subject to substantial risk of loss resulting from: the significant concentration of property values, including vehicle and parts inventories, at our operating locations; claims by employees, customers, and third parties for personal injury or property damage; and fines and penalties in connection with alleged violations of regulatory requirements.
c. Market Risk • Overall success of the automotive industry and in particular on the success of the Honda,
Isuzu, and Geely brands. Significant adverse events that may result in product recalls, product launch delays or general delays caused by import supply chain logistic issues may interrupt vehicle or parts supply to our dealerships. Such matters would likely have a significant and/or adverse impact in our car business if the events relate to any of the manufacturers whose franchises generate a significant percentage of our revenue.
• Competition. We compete with other automotive brands as well as other franchised
automotive dealerships; private market buyers and sellers of imported and/or used vehicles; local service and repair shops and parts retailers; and automotive manufacturers (those that own their own dealerships).
In addition to competing on car models, buying decisions by consumers when shopping for a vehicle are extremely price sensitive. The level of competition in the market can lead to lower selling prices and lower profits
d. Availability of financing and interest rate sensitivity
• To the Company. The operations rely heavily on loans to fund its working capital and cash flow. The car divisions access credit through the lines available to House of Investments, Inc. while Honda Cars Kalookan, Inc. has its own lines with Banks.
A sustained or significant decrease in our operating cash flows could lead to an inability to meet our debt service requirements.
The interest rates we are charged on a substantial portion of our debt are variable, increasing or decreasing based on changes in certain published interest rates. Increases to such interest rates would likely result in significantly higher interest expense for us, which would negatively affect our operating results.
• To our clients. A significant portion of vehicle sales in the Philippines is funded through
bank financing. Access to credit for vehicle buyers and increased interest rates may also decrease vehicle sales, which would negatively affect our operating results.
e. Regulatory issues
We are subject to a wide variety of regulatory activities, including: government regulations, claims and legal proceedings. Government regulations affect almost every aspect of our business, including taxation, and the treatment of our employees. Data Privacy Act. The Data Privacy Law requires that personal and sensitive information of the car dealerships’ stakeholders held by the company be taken care of with utmost privacy. A breach of this requirement would mean stiff penalty and also possibly result to costly lawsuits that may tarnish our reputation. A committee has already been formed to spearhead the awareness for this requirement and implementation of necessary policies that protect personal data.
In the event of regulation restricting our ability to generate revenue from arranging financing for our customers, we could be adversely affected. We could also be susceptible to claims or related actions if we fail to operate our business in accordance with applicable laws. Claims arising out of actual or alleged violations of law which may be asserted against our dealers by individuals, through class actions, or by governmental entities in civil or criminal investigations and proceedings, may expose us to substantial monetary damages which may adversely affect us.
f. Environmental regulations We are subject to a wide range of environmental laws and regulations, including those governing: discharges into the air and water; the operation and removal of storage tanks; and the use, storage; and disposal of hazardous substances.
In the normal course of our operations we use, generate and dispose of materials covered by these laws and regulations. We face potentially significant costs relating to claims, penalties and remediation efforts in the event of non-compliance with existing and future laws and regulations.
THE CONSTRUCTION SECTOR EEI CORPORATION AND SUBSIDIARIES EEI Corporation (EEI or the Company) was founded in 1931 as machinery and mills supply house for the mining industry. Over the past 88 years, aside from broadening the range of industrial machinery and systems it distributes, the Company also expanded into construction services, and in the supply of manpower in the Philippines and overseas. Today, EEI is one of the country’s leading construction companies, with a reputable track record in general contracting and specialty works. Driven by a commitment to Philippine development and to have greater presence in the economy, EEI continues to expand its core business to a wide array of construction competencies. The Company has also been engaged in doing construction projects overseas for more than forty years. It has been involved in the installation, construction, and erection of power generating facilities; oil refineries; chemical production plants; cement plants; food and beverage manufacturing facilities; semiconductor assembly plants; roads, bridges, railroads, ports, airports, elevated expressways, metro rail transit system and other infrastructure; high rise residential and office towers, and hotel buildings. The Company also operates one of the country’s modern steel fabrication plants.

Through its long years of working and collaborating with global contractors, EEI has achieved world class caliber project management and execution expertise with the use of better technologies in all disciplines of the construction industry. EEI has been recognized by contractors worldwide for the quality of its work and for its safety records, and is certified as compliant with ISO 9001:2008, ISO 14001:2004 (Environmental Management System), and OHSAS 18001:2007 (Occupational Safety and Health Management System) standards. The Company stays abreast with the latest developments in technology, materials engineering, and construction methodologies while including its own innovation in the application of its work, making it a preferred provider of construction services to global Engineering, Procurement, and Construction companies. EEI also owns five major subsidiaries:
• Equipment Engineers, Inc. engages in the supply and marketing of a broad range of industrial plant facilities, process equipment, systems, and parts to the industrial, commercial, and property development companies; and, engages also in supply management services.
• EEI Power Corporation is engaged in retail electricity supply and in the supply of electrical equipment and services, as well as electro-mechanical contracting works. It also has investments in renewable energy.
• EEI Construction and Marine, Inc. engages in structural fabrication works and light steel construction works such as storage tanks, pressure vessels, ducts and pipes.
• GAIC Group provides manpower services to both local and foreign markets. • EEI Realty Corporation is engaged in the development of land, housing, and other
properties. • JPSAI is a provider of formworks and scaffolding.
Risk Factors at the Construction Sector The risk management function is an important aspect of corporate governance. EEI has a Risk Management Program which has been in place since 2009. A Risk Management Council composed of the President and CEO, the Chief Risk Officer and key department heads meet regularly to discuss the new and emerging risks brought about by the peculiarities of new projects, changes in the market place, economic shifts, political upheavals, disasters, unusual events and probable impending events which had been identified in the various areas of company’s business activities. The Risk Management Council is responsible for providing timely, relevant and comprehensive risk information to the Board through the Board Risk Oversight Committee which is composed of five directors. EEI has identified the following major risks (in no particular order) and corresponding mitigating measures: 1. Pandemic Risk The life, well-being, and mental health of EEI’s people are at risk as the Covid-19 virus remains prevalent. Also, disruption to its operations is a possibility as the pandemic protocols may restrict the availability and movement of needed resources. Award of new projects in certain market segments (e.g. tourism and leisure oriented ones) may experience slowdown until the pandemic is resolved or sufficiently contained by a successful vaccine. The Backlog from and expected subsequent rewards of new infrastructure projects can make up for any shortfall in the other portfolios. This is mainly driven by the government’s infrastructure spending as part of its effort to stimulate the economy and the Company’s reputation as a trusted partner in infrastructure construction. Their client’s willingness to share with the cost of Covid-19 safety measures is a positive factor. To further mitigate this risk, EEI has implemented improved Covid-19 safety protocols. Initiatives to have their own vaccination program (including purchase of Covid 19 vaccines) is being undertaken to complement the government’s own program. EEI is exploring new programs to take care of the mental health of our workers.

2. Operational risks Volatility in the availability of activities or areas executable in our projects, made more volatile due to the effects of the pandemic to the movement of resources, creates a higher probability of such resources being under-utilized that can contribute to project overruns. To mitigate this risk, EEI anticipates executable project work-fronts are now more rigorously done; shift under-utilized resources to projects where it will be better utilized is part of our strategy; and drive to increase work productivity by 20% this year is now in-place and this includes further improvement in project controls 3. Liquidity risks The natural pace of how construction projects are being executed (i.e. S-curve) tends to create temporary negative cashflows in the middle of project implementation. Moreover, the current weak economy tends to make some clients handle their cash flows a bit tighter possibly resulting to some delays in payment of our receivables. To mitigate this risk, close monitoring of project cashflows and prompt billing are being done and cashflow projection models are being developed to determine the ample pace of our projects to minimize these temporary negative cashflows without compromising contractual commitments. 4. Geopolitical risks Prevailing travel restrictions may hamper on-going diversification efforts to other foreign markets in the meantime as their governments are expected to prioritize local and already in-place businesses to support their economies. On the contrary, the Company’s current presence in the Kingdom of Saudi Arabia (KSA) and developing presence in Qatar will benefit from this situation. To mitigate this risk, EEI continues to build up capacity, partnership and competence to enter foreign markets in preparation for its anticipated opening when the pandemic is resolved; leverage talent in project management by offering services thru consultancy or online platforms locally and internationally; and look for other global players that would want to enter and are willing to work with us in KSA and Qatar. 5. Interest rate risk The Company’s debt increased mainly due to the effects of the Pandemic though the prevailing low interest rates did mitigate the impact. However, rates are expected to rise as the government will try to curb inflation when the economy recovers later this year. To mitigate this risk, EEI has availed sufficient long-term loans to lock-in interest rates to help protect against its future anticipated increase. 6. Inflation and possible price shocks Inflationary forces are expected to be a factor in 2021 as the economy stays afloat and then attempts to recover. Restrictions in supply and movement of goods together with the eagerness of some businesses to recover its losses due to the Pandemic are part of what drives inflation and may result to price shocks if not regulated properly by the government. The increase in demand for resources used in infrastructure projects may also play a part in these dynamics. To mitigate this risk, contracts with suppliers and partners are being worked on in part to locked-in or make the possible upward price movements of project resources more predictable and subdued; provisions protecting the Company from price increases are included in their contracts as much as possible; and sufficient contingencies are included in the price of construction contracts to account for this risk when necessary. 7. Environmental risks: Acts of nature

EEI’s ability to handle natural calamities may encounter some challenges as these events happen alongside the Covid 19 pandemic. Moreover, 2021 is a La Nina year for the Philippines and coupled with the effect of the climate change may result to a more pronounced rainy season ahead – which has the possibility of hampering the pace of our projects more than usual. To mitigate this risk, EEI’s crisis management and business continuity plans are being improved to take into account these combined threats; project schedules are being adjusted to mitigate the effects of inclement weather; and sufficient insurance coverage is in-place to protect the Company from possible financial impact of this risk. 8. Disruptive technologies and businesses Emergence of new and possibly disruptive technologies and businesses that can threaten EEI’s current business will continue in 2021. More so because of its necessity as the pandemic makes untenable some of the old ways of life – including our needs and ways of work. Research, acquisition and deployment of latest tools and technology to improve or change our business are continuously being explored and deployed to mitigate this risk. 9. Fraud risk Though fraud risk is not new, the pandemic has the potential to increase this risk. Economic hardships can provide unscrupulous entities the motivation and burdened control systems can provide the opportunity for fraud. To mitigate this risk, EEI’s internal audit team acquired improved expertise to handle fraud risks. Moreover, a dedicated council at management level is established to serve as the operating arm of the Board on its anti-fraud efforts and complement the internal audit team in fraud detection and mitigation. 10. Cybersecurity risks As EEI relies heavily in the use of the internet in our way of work as part of our response to the challenges of the Pandemic, vulnerability to cyber threats (i.e. crimes and/or attacks) is seen to rise. Security of its data and continuity of business processes may be at risk. To mitigate this risk, cybersecurity assets (e.g. firewalls, antiviruses, etc.) are being deployed coupled with awareness and education programs on cybersecurity threats for employees and engineering interventions are being employed such as eliminating the use of traditional less secured data storage devices (e.g. flash drives, external hard disks, etc.) and instead promote the use of more secured network/cloud drives. Moreover, EEI has started its migration to the use of more secured IT assets.
THE EDUCATION SECTOR iPeople, inc. (‘iPeople”) is the holding company under House of Investments that drives investments in the education sector. iPeople is a publicly listed company on the Philippine Stock Exchange (PSE:IPO). iPeople wholly owns Mapúa University, which owns three other operating schools: Malayan Colleges Laguna, Malayan Colleges Mindanao and Malayan High School of Science. On May 2, 2019, the merger by and between iPeople and Ayala Corporation’s wholly-owned subsidiary, AC Education, Inc. (“AC Education”) was completed. iPeople is be the surviving entity, with House of Investments and its affiliates, and AC, controlling 51.3% and 33.5%, respectively. With the merger, iPeople has become one of the leading education groups in the country, with almost 60,000 students. The merger folded into the iPeople network the three schools of AEI namely: Affordable Private Education Center, Inc. (“APEC Schools”), University of Nueva Caceres (“UNC”) and National Teachers College (“NTC”). The operating schools under the iPeople network are as follows:

(1) Malayan Education System, Inc. (Operating under the name of Mapúa University). Mapúa University is widely considered as the leading and largest private engineering and technological university in the Philippines. Don Tomas Mapúa, the first registered Filipino architect, founded Mapúa Institute of Technology on January 25, 1925. It was acquired in 1999 by the YGC, which brought the school into the global and digital age. Mapúa operates in two (2) major campuses: its main campus in Intramuros and its extension campus in Makati. Mapúa University’s commitment to its philosophy of Outcomes-Based Education and its judicious use of digital educational technologies have earned the institution the reputation of being the leader in providing quality education in the country, especially in the field of engineering and information technology.
(2) Malayan Colleges Laguna, Inc., A Mapúa School (“MCL”) is a wholly-owned subsidiary of Mapúa University located in Cabuyao, Laguna, alongside several science and industrial parks. MCL was established to extend the brand of the Mapúa Institute of Technology to the south by offering programs in engineering and architecture, accountancy, business, communication, computer science, , information technology, maritime education, and multimedia arts to students who prefer to stay closer to home. With 22 baccalaureate programs of which 3 are fully online programs, MCL has five degree-offering colleges, namely College of Arts and Science, College of Computer and Information Science, E.T. Yuchengco College of Business, Mapúa Institute of Technology at Laguna, and the Mapúa-PTC College of Maritime Education and Training. In 2016, MCL also opened its doors to Senior High School (SHS) students, offering a total of six strands under the Academic and the Technical-Vocational-Livelihood Tracks. After thirteen years of operation, MCL was granted Autonomous Status by the Commission on Higher Education last October 2019, as per CHED Memorandum Order No. 12, Series of 2019. Given this, MCL offered two new programs, B.S. Business Administration and B.S. Psychology, starting Academic Year 2020-2021.MCL has achieved another milestone by obtaining a three-star overall rating in Quacquarelli Symonds (QS) Star Rating System from the United Kingdom last December 2020.To date, there are 5,028 students under both college and SHS with 44% percent of its college students enrolled in engineering programs.
(3) Malayan Colleges Mindanao (A Mapúa School), Inc. (“MCM”) is a wholly-owned subsidiary of Mapúa University. Incorporated in 2015, MCM was established to offer Mapua-education in Davao and Mindanao. MCM looms along General Douglas MacArthur Highway in Matina, Davao City, and opened its doors to senior high school and college students last July 2, 2018. MCM has built a community of competent and innovative leaders who possess attributes that make them globally competitive and locally in-demand, distinguishing itself from the rest through these important facets in its educational system: Learner-Centered Outcomes-Based Education, Blended Online and Face-to-Face Learning Sessions, Industry Partnerships, Mindanao-Centric Learning, and Advanced Learning Facilities. Within MCM’s DNA is the academic excellence that Mapúa is known for, and MCM is committed to bring about the same level of excellence into its community in Mindanao.
(4) Malayan High School of Science, Inc. (“MHSS”) is a wholly-owned subsidiary of Mapúa University. MHSS is a science- and math-oriented high school located in Pandacan, Manila. Modeled after similar but publicly funded science high schools, MHSS offers a rigorous academic program geared towards graduating hard-working, mathematical and scientific-trained students that will excel in their university studies and beyond. The school is focused on optimizing student-to-teacher time and currently has 237 students. MHSS has a top-notch faculty, state-of-the-art facilities, and a curriculum that will allow students to “fully express not only their scientific inclinations but also their artistic bent.”
(5) The University of Nueva Caceres (UNC), the first university in Southern Luzon, traces its humble beginning with the benevolence of Dr. Jaime Hernandez, former Secretary of the Department of Finance, as his way of giving back to the Bicolano community. In February 1948, Dr. Hernandez together with other prominent Bicolanos, formed the Nueva Caceres College, and in 1953, the school attained University Status. In July 2015, the University of Nueva Caceres partnered with Ayala Corporation through Ayala Education, Inc to further enhance the quality of education through industry and technology driven innovations. Currently, the University offers complete basic education, four programs in the College of Arts
and Sciences, thirteen in the College of Business and Administration, five in the College of Computer Studies, thirteen in the College of Education, six in the College of Engineering, Nursing Course, Criminal Justice Education, Juris Doctor, and three Doctorate and fifteen Masters Degree programs in the Graduate Studies department. UNC endeavors to fulfill its tri-focal function of instruction, research, and extension while making education accessible and affordable. The battle cry “from first to number one” summarizes UNC’s goals of excellence in quality, access, relevance, and responsiveness. UNC aims to be known not only as the first university in Bicol, but to be the Number 1 university in terms of employability of graduates.
(6) The National Teachers College (Doing Business Under the Name of the National Teachers College) was founded by Dr. Segundo M. Infantado, Sr., a former Director of Public Instruction of the Philippines and Dr. Flora Amoranto-Ylagan, one of the country’s leading educator. NTC was officially incorporated on September 29, 1928 and was authorized by the Department of Public Instruction on April 17, 1929 to operate as an educational institution. Its doors opened to the student public on June 10, 1929 and was granted government recognition on February 17, 1930. NTC was the first Higher Education Institution (HEI) in the Philippines to offer collegiate programs dedicated to teacher education. Among private educational institutions in the Philippines, it has attained a pre-eminent place in educational leadership, particularly in the field of teacher education. Its performance in the Licensure Examination for Teachers is always above the national passing rate. With a student population of close to 13,000, NTC continues to perform its share in educating and training teachers, administrators, supervisors, and other professionals who will serve in the interest of the Republic of the Philippines and the world at large.
(7) Affordable Private Education Center, Inc. (Doing Business Under the Name of APEC Schools) was founded in 2013 with the vision of providing affordable but quality private education to thousands of Filipinos. Its mission then was to prepare its students for college, employment or both. It is a chain of private high school that offers K-12 program of the Department of Education. Started with only 130 students in 2013, APEC Schools has expanded to 23 branches with more than 15,800 students and almost 800 employees. In 2016, APEC Schools offered Senior High School with the Accounting Business Management (ABM) strand, and Accelerated Career Experience, its own job immersion program developed with employer partners. In 2018, APEC Schools celebrated its 5th year anniversary and graduated the first batch of 2,000 Senior High School students. In 2020, APEC Schools offered two new programs suited for the education’s new normal: APEC Agile Distance Learning program and APEC Flex Homeschool program to help students continue with their education despite the pandemic. In December of the same year, Google recognized APEC Schools as a Google Reference School - the first and only in the Philippines. Most students have gone on to top colleges and universities, while 15% have gone on to be employed within three months of graduation.
Risk Factors related to School Operations
a. Regulatory, recognition of academic programs, and accreditations from government, and self-regulating private accreditation organizations. • Accreditations. The schools are governed and regulated by the Commission on Higher
Education (“CHED”) and by the Department of Education (“DepEd”), depending on the program offerings. In addition, MESI and MCL are also accredited by PACUCOA. MESI is also accredited by the ABET; MESI and MCL are both accredited by PTC-ACBET and PICAB. APEC has a MOA with DepEd which allows the company to operate schools without owning the premises. There is a pending Revised DepEd Manual which will formalize this exception.
The failure of any of our schools to pass government standards, or to meet accreditation renewal standards, may negatively impact the perception of the quality of our academic programs and facilities. If this happens, we might expect our enrolment to decrease, which would have an adverse impact to our profits and cash flow.
• Tuition Fee. The CHED and the DepEd regulates tuition increases at the university level
and the secondary level, respectively, and routinely sets maximum limits on percentage increases in tuition fees. This regulation applies to our non-autonomous schools, MCM,
UNC, NTC and APEC. The inability of non-autonomous education institutions to increase tuition fees to cover higher operating costs may pose a risk to profits and cash flows over time.
• Changes in regulations. The Universal Access to Tertiary Education Act (RA10931) had
its implementation in AY 2018-19. This resulted to notable decline in college freshman intake in private schools as large portion of the incoming freshman applied to SUCs/LUCs to avail of free education under the Act.
The Free College Education Act poses a risk to our schools. This may adversely impact enrollment numbers if prospective students will opt to enroll in state-run universities and colleges.
b. Competition
• Faculty. The schools depend on high quality faculty to teach the educational programs. To the extent that they can, the schools at both the tertiary and secondary level recruit faculty with excellent academic credentials and teaching skills. The schools might not be able to recruit the desired faculty due to any number of factors, including mismatches between the desired compensation and offer; competing recruitment from other educational institutions; or candidates seeking opportunities abroad.
The schools also work to retain key faculty in certain academic disciplines in order to maintain continuity and reduce turnover. If recruitment and retention efforts suffer, the quality of teaching and the quality of academic programs might suffer.
• Students. Competition among schools for greater student enrolment is fierce. Mapua is an established brand, with ISO 14001:2015 and 9001:2015 certifications, while the other IPO schools are establishing or have established their own brands.
• Accreditations. IPO Schools continue to pursue accreditations from self-regulating private accreditation organizations in addition to the government accreditation bodies.
c. Credit Risk
As the schools increase their enrollment, the level of receivables also increases. Some of the students who cannot afford to make the full payment of tuition and miscellaneous fees during an academic term execute a Promissory Note and are expected to settle their accounts prior to the start of the next academic term. Majority of the senior high school students of APEC avail of the Senior High School Voucher Program (SHSVP) of the DepEd which results to a longer collection period for the school. The schools do not aggressively pursue collection of defaulted student debt given that the default rate is small. Regardless, the schools face a risk that a rise in student defaults on promissory notes would impact profits and cash flows negatively.
d. Operational Risk The following may hamper the operations of the IPO schools: • Natural calamities and disasters. Our schools, like many other enterprises, are subject to
adverse occurrences beyond our control, which include (but are not limited to) earthquakes, floods, and similar natural phenomena. We believe we carry enough insurance to hedge against the monetary damages caused by these events. In the event that the damage to our facilities arising from said events are severe and our insurance is not enough to cover it, our operations and ability to return to normal conditions might be severely affected.
• Labor unrest. Mapúa University has two unions, Faculty Association of MIT (FAMIT)
and MIT Labor Union (MITLU). The other iPeople Schools have none.
Mapúa University is bound by the collective bargaining agreement (CBA) signed between the institution and the two unions. Mapúa University negotiates with each union separately. The FAMIT represents the faculty members. The MITLU represents the non-teaching staff. To the extent that unions negotiate CBA’s with higher increases over time, this would negatively impact the cost structure of Mapúa University and lower the expected value of its profit and cash flows over time. Furthermore, in the event that

a CBA is not negotiated successfully or there is an issue that results in labor unrest or a strike, it could have a material adverse impact on the operations of Mapúa University.
In the event of calamities, strikes, pandemic events, and the like that could hamper the operations of the schools, IPO and all schools have their respective protocols and procedures to manage each particular type of risk. In particular, Mapúa has tested and instituted the use of online facilities such as Blackboard, its learning management system, that enables the school to conduct real-time online classes and facilitates online learning on a school-wide level. This enables the school to continue its classes with minimal disruption. Mapua also has a fully online post-graduate degree courses, implemented online admissions and examinations, and uses e-books instead of traditional school textbooks for all undergraduate and Senior High School students through subscriptions to Wiley and Cengage.
Online learning is likewise being adopted by the other IPO schools through the use of online tools and facilities that approximate a learning management system. Work-from-home arrangements, video-conferencing for meetings and online facilities may also be used to transact business and to ensure operations are not hampered during calamities and pandemic events. Our schools have been preparing for school reopening with limited face to face. Schools are awaiting final guidelines to be issued by CHED in order to finalize its school reopening guidelines.
e. Interest Rate Risk The schools need capital to grow. All of our schools pursue growth opportunities, which may involve any of the following actions: building new teaching and non-teaching facilities at existing campuses; building campuses at new locations. In order to grow, the schools will need funding. Fund raising can arise from the sale of equity, selling debt securities or bank borrowing. If capital is raised through borrowings, the IPO schools will be subject to interest rate risk. An increase in our negative carry will also adversely impact our profitability.
f. Market Risk and Political Risk
In the event that adverse economic factors hit the country, that may force a subset of students to temporarily drop out and continue their education at a later time, permanently stop school, or transfer to another school. Our student enrolment may be negatively impacted and this will have a negative effect on our profitability. Since a certain portion of the student population depends on family members who are Overseas Filipino Workers to pay for their tuition and miscellaneous fees. International relations of the Philippines with the employer countries may impact the size and frequency of inward-bound overseas remittances thereby affecting student enrollments.
g. Campus Safety and Security Risk The potential presence of criminal elements outside the schools poses a risk to our students, especially those who take public transportation. In the event that criminal elements are able to force their way into the schools, the students may lose confidence in the administration’s ability to keep them safe. Student enrolment may be negatively impacted and this will have a negative effect on our profitability. IPO manages this by enforcing security measures such as having guards at entrances and exits, roving guards, and CCTV.
PROPERTY SERVICES LANDEV CORPORATION House of Investments, Inc. wholly owns Landev Corporation. Landev Corporation is primarily engaged in property management and project management for the YGC. In 2019, Its large contracts include:
• Property management for RCBC Plaza, RCBC Savings Bank Corporate Center, Y Tower 1 and 2, and ETY Building;

• Facilities management for RCBC and RCBC Savings Bank branches nationwide; and • Project management for the construction of the new Mapúa Makati campus and the
renovations of National Teachers’ College. GREYHOUNDS SECURITY AND INVESTIGATION AGENCY CORPORATION Landev wholly owns a subsidiary named Greyhounds Security and Investigation Agency. GSIA provides comprehensive security services to leading institutions like RCBC Plaza, RCBC Savngs Bank Corporate Center, all RCBC branches, and RCBC Savings Bank. SAN LORENZO RUIZ INVESTMENT HOLDINGS & SERVICES, INC. In December 2020, House of Investments purchased 100% of the issued and outstanding capital stock in San Lorenzo Ruiz Investment Holdings & Services, Inc. (“San Lorenzo Ruiz”) which owns a property within the Makati Central Business District. RCBC REALTY CORPORATION House of Investments owns 10% of RCBC Realty Corporation, which owns the YGC flagship property, RCBC Plaza. The RCBC Plaza is the biggest and most modern office development in the Philippines today. Inaugurated in 2001, the complex consists of the 46-storey Yuchengco Tower, 41-storey Tower 2, and a three-level podium. Also housed in RCBC Plaza are the 450-seat Carlos P. Romulo Auditorium, the Yuchengco Museum, a 200-seat chapel, a VIP lounge, banking chambers, convenience and service shops, food court, seven-level basement parking, gym and health spa, and open-air courtyard. YGC members such as the RCBC and AY Foundation hold their offices here. RCBC Plaza is the first IT zone in Makati designated by the Philippine Economic Zone Auhority. In May 2018, RCBC Plaza received its Leadership in Energy and Environmental Design (LEED) EBOM Gold certification, making it the first multi-tenanted building in the Philippines to achieve the prestigious certification. LEED is a certification program designed by the US Green Building Council (USGBC) and has become the most widely used green building rating system to assess environmental compliance in terms of sustainability, energy conservation, water reduction, air quality and materials, and resources. Risk Factors at the Property Services
a. General Economic Conditions The success of our business is significantly related to general economic conditions and accordingly, our business could be harmed by an economic slowdown and downturn in commercial real estate. Periods of economic weakness or recession, significantly rising interest rates, declining employment levels, declining demand for commercial real estate, falling real estate values, or the public perception that any of these events may occur, may negatively affect the performance of some or all of our business lines. These economic conditions can result in a general decline in disposition and leasing activity, as well as a general decline in the value of commercial real estate and in rents, which in turn reduces revenue from property management fees and commissions derived from property sales and leasing.
b. Credit Risk Our business efficiency is highly dependent on our ability to manage our working capital well. If we experience delays in collections of accounts receivable, there will be a impact on the availability of funding for our day-to-day operations.
c. Operational Risk The success of our business depends on how smoothly we manage the operations of the
properties and projects under our management. If we do not successfully manage our existing operational and administrative staff, we may not be able to achieve the anticipated gross margins, service quality, overtime levels and other performance measures that are important to our business, financial condition and results of operations.
Our operations can be challenged by machinery breakdowns, obsolescent parts, logistics and/or manpower shortages or property losses due to fire, adverse weather conditions, earthquakes, and militant activities e.g. rallies and strikes, among others. In addition, our business is subject to substantial risk of loss resulting from: claims by employees, customers, and third parties for personal injury or property damage; and fines and penalties in connection with alleged violations of regulatory requirements. To mitigate these risks, the company ensures that both the client and the company have adequate insurance.
d. Litigation Risk
We are subject to litigation risks and may face liabilities and damage to our professional reputation as a result of litigation allegations and negative publicity. In our property and facilities management business, we supervise third-party contractors to provide construction services for our managed properties. While our role is limited to that of an agent for the owner, we may be subject to claims for construction defects or other similar actions.
e. Competition We compete across a variety of business disciplines within the commercial real estate services industry, including commercial property and corporate facilities management, leasing, and security services. We face competition from other commercial real estate and security service providers, including outsourcing companies that traditionally competed in limited portions of our facilities management business and have recently expanded their offerings, in-house corporate real estate departments, and developers. • Service Contracts. Competitive pressures in the security services sector may prevent us
from increasing our billing rates on contract anniversary or renewal dates. Our profitability will be adversely affected if, due to inflation or other causes, including increases in statutory payroll taxes, we are compelled to increase the wages, salaries and related benefits of our employees in amounts that exceed the amount that we can pass on to our customers through increased billing rates charged under our service contracts.
• Recruitment and Retention. Our business involves the labor-intensive delivery of our
services. We derive our revenues through the services rendered by our employees. Our future performance depends in large part upon our ability to attract, train, motivate and retain our skilled operational and administrative staff.
The loss of the services of, or the failure to recruit, the required complement of security, operational and administrative staff would have a material adverse effect on our business, financial condition and results of operations, including our ability to secure and complete security service contracts.
f. Regulatory Risk
If we fail to comply with laws and regulations applicable to us in our role as a property/facility manager, we may incur significant financial penalties. We are also subject to a large number of national and local laws and regulations that apply to security agencies and their guards. Any liability we may have from our failure to comply with these regulations may materially and adversely affect our business by restricting our operations and subjecting us to potential penalties.
g. Environmental Liability We may be subject to environmental liability as a result of our role as a property or facility manager or developer of real estate. Various laws and regulations impose liability on real property owners or operators for the cost of investigating, cleaning up or removing contamination caused by hazardous or toxic substances at a property. If we fail to disclose environmental issues, we could also be liable to the owner or lessee of a property. Negligence or oversight leading to liabilities incurred by the property owner could adversely result to non-renewal of our contract.
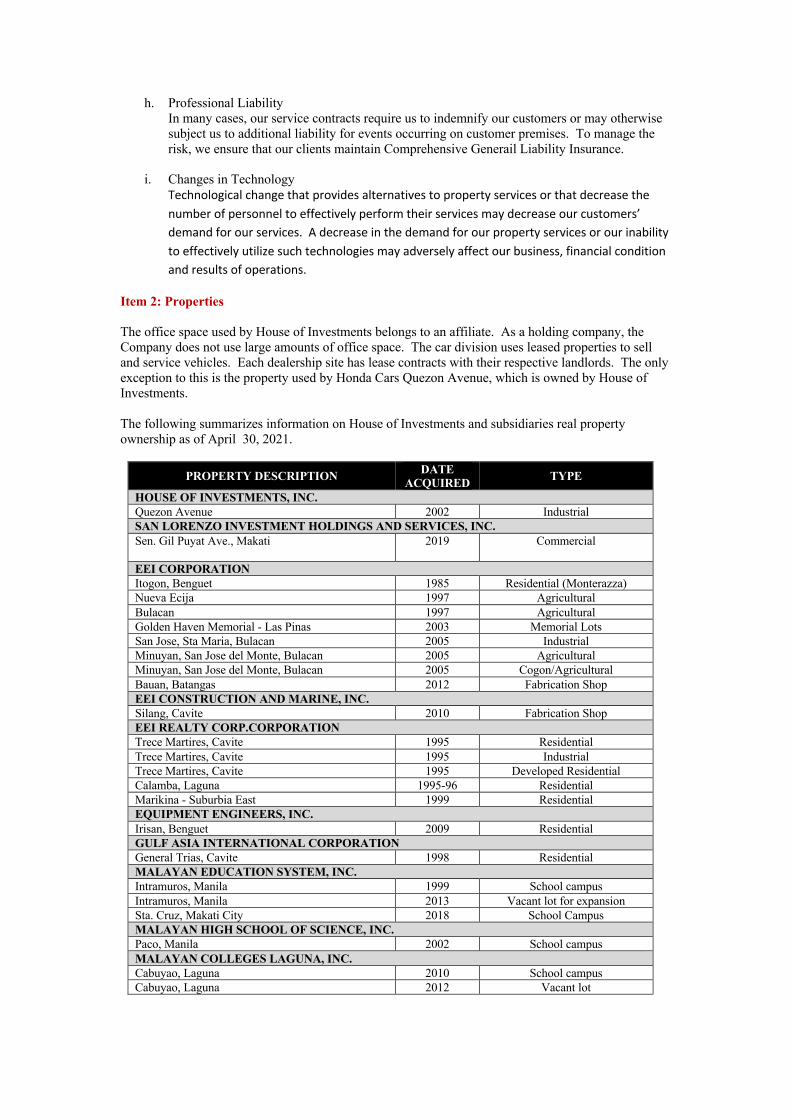
h. Professional Liability In many cases, our service contracts require us to indemnify our customers or may otherwise subject us to additional liability for events occurring on customer premises. To manage the risk, we ensure that our clients maintain Comprehensive Generail Liability Insurance.
i. Changes in Technology Technological change that provides alternatives to property services or that decrease the number of personnel to effectively perform their services may decrease our customers’ demand for our services. A decrease in the demand for our property services or our inability to effectively utilize such technologies may adversely affect our business, financial condition and results of operations.
Item 2: Properties The office space used by House of Investments belongs to an affiliate. As a holding company, the Company does not use large amounts of office space. The car division uses leased properties to sell and service vehicles. Each dealership site has lease contracts with their respective landlords. The only exception to this is the property used by Honda Cars Quezon Avenue, which is owned by House of Investments. The following summarizes information on House of Investments and subsidiaries real property ownership as of April 30, 2021.
PROPERTY DESCRIPTION DATE ACQUIRED TYPE
HOUSE OF INVESTMENTS, INC. Quezon Avenue 2002 Industrial SAN LORENZO INVESTMENT HOLDINGS AND SERVICES, INC. Sen. Gil Puyat Ave., Makati 2019 Commercial
EEI CORPORATION Itogon, Benguet 1985 Residential (Monterazza) Nueva Ecija 1997 Agricultural Bulacan 1997 Agricultural Golden Haven Memorial - Las Pinas 2003 Memorial Lots San Jose, Sta Maria, Bulacan 2005 Industrial Minuyan, San Jose del Monte, Bulacan 2005 Agricultural Minuyan, San Jose del Monte, Bulacan 2005 Cogon/Agricultural Bauan, Batangas 2012 Fabrication Shop EEI CONSTRUCTION AND MARINE, INC. Silang, Cavite 2010 Fabrication Shop EEI REALTY CORP.CORPORATION Trece Martires, Cavite 1995 Residential Trece Martires, Cavite 1995 Industrial Trece Martires, Cavite 1995 Developed Residential Calamba, Laguna 1995-96 Residential Marikina - Suburbia East 1999 Residential EQUIPMENT ENGINEERS, INC. Irisan, Benguet 2009 Residential GULF ASIA INTERNATIONAL CORPORATION General Trias, Cavite 1998 Residential MALAYAN EDUCATION SYSTEM, INC. Intramuros, Manila 1999 School campus Intramuros, Manila 2013 Vacant lot for expansion Sta. Cruz, Makati City 2018 School Campus MALAYAN HIGH SCHOOL OF SCIENCE, INC. Paco, Manila 2002 School campus MALAYAN COLLEGES LAGUNA, INC. Cabuyao, Laguna 2010 School campus Cabuyao, Laguna 2012 Vacant lot
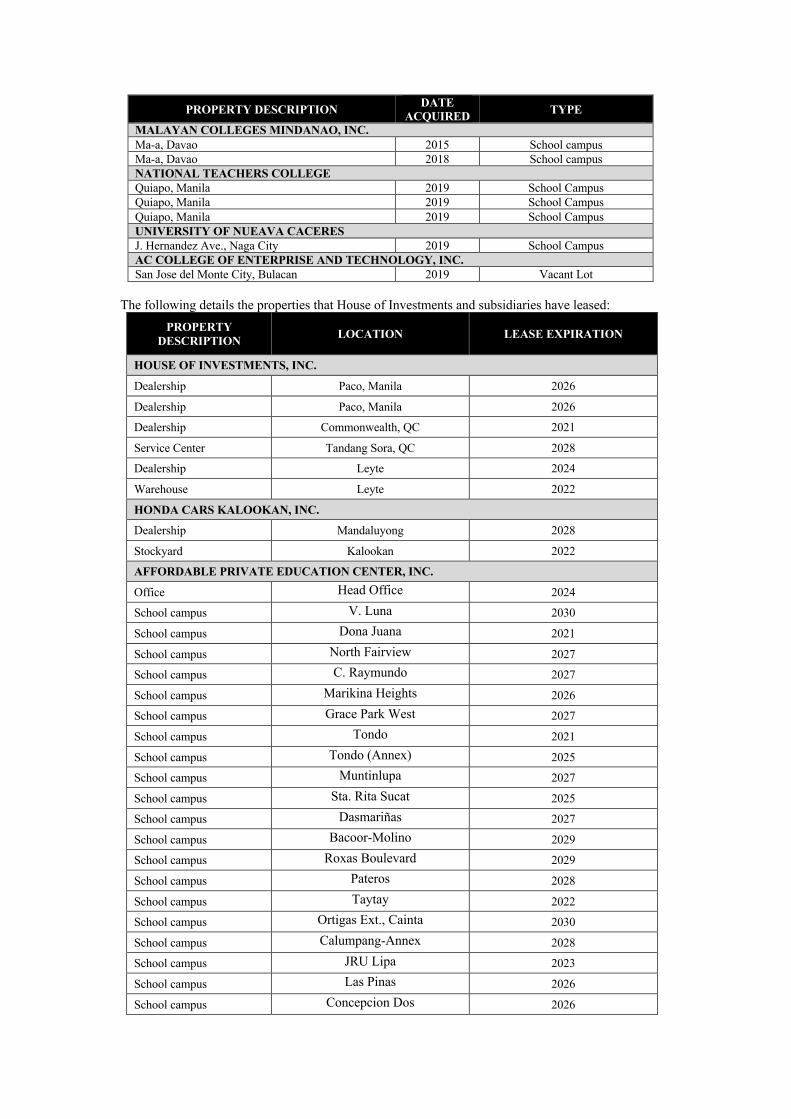
PROPERTY DESCRIPTION DATE ACQUIRED TYPE
MALAYAN COLLEGES MINDANAO, INC. Ma-a, Davao 2015 School campus Ma-a, Davao 2018 School campus NATIONAL TEACHERS COLLEGE Quiapo, Manila 2019 School Campus Quiapo, Manila 2019 School Campus Quiapo, Manila 2019 School Campus UNIVERSITY OF NUEAVA CACERES J. Hernandez Ave., Naga City 2019 School Campus AC COLLEGE OF ENTERPRISE AND TECHNOLOGY, INC. San Jose del Monte City, Bulacan 2019 Vacant Lot
The following details the properties that House of Investments and subsidiaries have leased:
PROPERTY DESCRIPTION LOCATION LEASE EXPIRATION
HOUSE OF INVESTMENTS, INC.
Dealership Paco, Manila 2026
Dealership Paco, Manila 2026
Dealership Commonwealth, QC 2021
Service Center Tandang Sora, QC 2028
Dealership Leyte 2024
Warehouse Leyte 2022
HONDA CARS KALOOKAN, INC.
Dealership Mandaluyong 2028
Stockyard Kalookan 2022
AFFORDABLE PRIVATE EDUCATION CENTER, INC.
Office Head Office 2024
School campus V. Luna 2030
School campus Dona Juana 2021
School campus North Fairview 2027
School campus C. Raymundo 2027
School campus Marikina Heights 2026
School campus Grace Park West 2027
School campus Tondo 2021
School campus Tondo (Annex) 2025
School campus Muntinlupa 2027
School campus Sta. Rita Sucat 2025
School campus Dasmariñas 2027
School campus Bacoor-Molino 2029
School campus Roxas Boulevard 2029
School campus Pateros 2028
School campus Taytay 2022
School campus Ortigas Ext., Cainta 2030
School campus Calumpang-Annex 2028
School campus JRU Lipa 2023
School campus Las Pinas 2026
School campus Concepcion Dos 2026
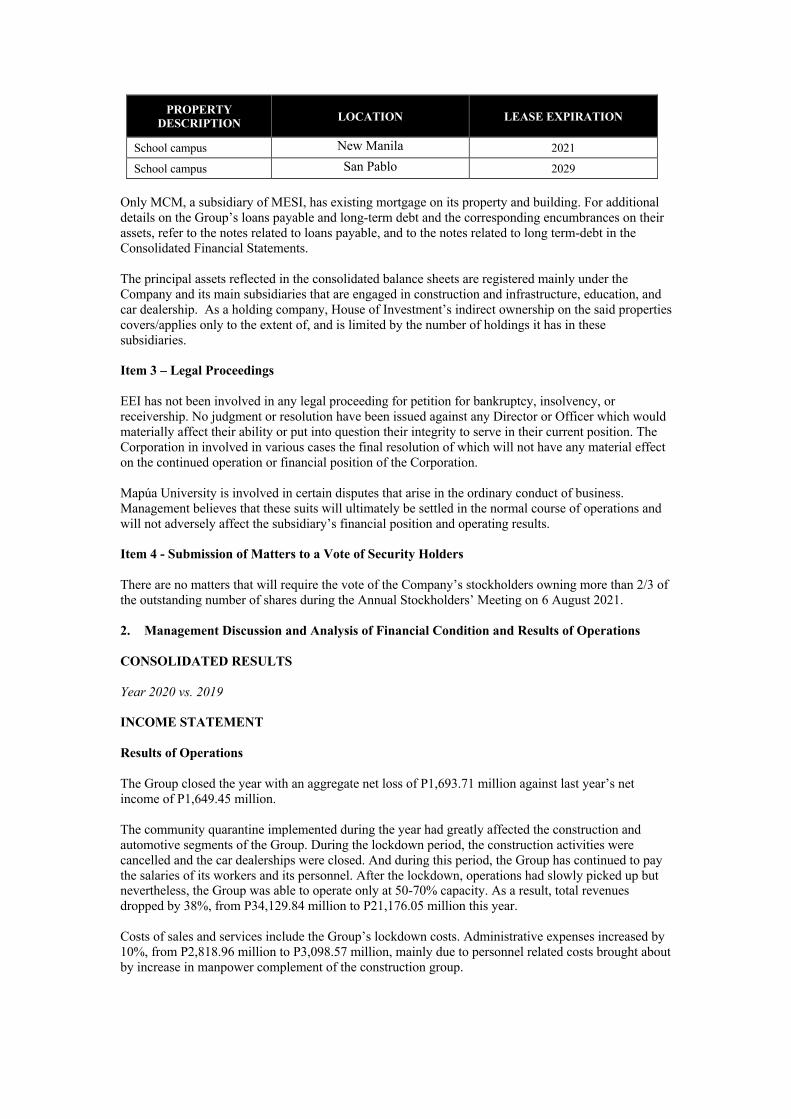
PROPERTY DESCRIPTION LOCATION LEASE EXPIRATION
School campus New Manila 2021
School campus San Pablo 2029 Only MCM, a subsidiary of MESI, has existing mortgage on its property and building. For additional details on the Group’s loans payable and long-term debt and the corresponding encumbrances on their assets, refer to the notes related to loans payable, and to the notes related to long term-debt in the Consolidated Financial Statements. The principal assets reflected in the consolidated balance sheets are registered mainly under the Company and its main subsidiaries that are engaged in construction and infrastructure, education, and car dealership. As a holding company, House of Investment’s indirect ownership on the said properties covers/applies only to the extent of, and is limited by the number of holdings it has in these subsidiaries. Item 3 – Legal Proceedings EEI has not been involved in any legal proceeding for petition for bankruptcy, insolvency, or receivership. No judgment or resolution have been issued against any Director or Officer which would materially affect their ability or put into question their integrity to serve in their current position. The Corporation in involved in various cases the final resolution of which will not have any material effect on the continued operation or financial position of the Corporation. Mapúa University is involved in certain disputes that arise in the ordinary conduct of business. Management believes that these suits will ultimately be settled in the normal course of operations and will not adversely affect the subsidiary’s financial position and operating results. Item 4 - Submission of Matters to a Vote of Security Holders There are no matters that will require the vote of the Company’s stockholders owning more than 2/3 of the outstanding number of shares during the Annual Stockholders’ Meeting on 6 August 2021. 2. Management Discussion and Analysis of Financial Condition and Results of Operations CONSOLIDATED RESULTS Year 2020 vs. 2019 INCOME STATEMENT Results of Operations The Group closed the year with an aggregate net loss of P1,693.71 million against last year’s net income of P1,649.45 million. The community quarantine implemented during the year had greatly affected the construction and automotive segments of the Group. During the lockdown period, the construction activities were cancelled and the car dealerships were closed. And during this period, the Group has continued to pay the salaries of its workers and its personnel. After the lockdown, operations had slowly picked up but nevertheless, the Group was able to operate only at 50-70% capacity. As a result, total revenues dropped by 38%, from P34,129.84 million to P21,176.05 million this year. Costs of sales and services include the Group’s lockdown costs. Administrative expenses increased by 10%, from P2,818.96 million to P3,098.57 million, mainly due to personnel related costs brought about by increase in manpower complement of the construction group.

Equity in net earnings of associates and joint ventures grew from P727.82 million to P1,368.43 million. Increase is attributable to improved performance of Al-Rushaid Construction Company, Ltd. (“ARCC”, a foreign affiliate of EEI) and PetroSolar Corporation. Interest and finance charges were lower, from P780.61 million to P712.57 million primarily due to lower borrowing rates. BALANCE SHEET Financial Position Total assets stood at P51,885.47 million, slightly lower from P51,995.76 million in 2019. Increase in cash and cash equivalents was largely due to collection of trade receivables from clients and net proceeds from bank loans. Reduction in receivables was due to lower revenues coupled with collection from clients and customers. Decrease in contract assets is largely attributable to low production of the construction arm of the Group. Inventories dropped from P2,362.28 million to P1,888.03 million due to lower purchases. Receivable from related parties was lower due to reduced manpower services relative to the lockdown. Increase in prepaid expenses and other current assets was due to increase in unutilized creditable withholding taxes and input tax (VAT), coupled with increase in advances to suppliers and contractors. Reduction in equity investments at FVOCI pertains mainly to reclassification of investment in PetroGreen Energy Corporation (PGEC) to investment in associates due to indirect ownership of the Parent Company through EEI and PERC. Increase in investment property pertains to the property owned by the newly acquired subsidiary of the Parent Company. Decrease in right of use assets (as well as in lease liabilities) was mainly due to termination of lease contracts of closed car dealership branches. Increase in deferred tax asset pertains to recognition of EEI relative to its NOLCO. Increase in other noncurrent assets pertains to non-current portion of the contract assets of EEI. Total liabilities increased from P28,502.05 million to P30,031.29 million. Effectively, the total bank loans of the Group increased by P2,316.81 million, net of repayments. These were used to finance operations and investment activities of the Group. Reduction in contract liabilities pertain to application of deposits against progress billings for the period. The significant reduction in due to related parties was because of the settlement of EEI Limited’s liability to ARCC. Increase in retirement liability was due to higher provisioning based on the recent valuation of the Group’s actuary. Increase in other noncurrent liabilities pertain to additional retention on progress billings of EEI’s subcontractors. Total equity dropped from P23,493.71 million to P21,854.19 million. Decrease is primarily due to net losses recognized by the Group for the period which reduced its retained earnings from P10,111.28 million last year to P9,785.83 million this year. Change in fair value reserve of equity investments pertains to reclassification of investment in PGEC. Year 2019 vs. 2018 INCOME STATEMENT The Group registered a 42% growth in net income, from P1,164.28 million in 2018 to P1,649.45 million this year. Total revenues grew by 6%, from P32,346.34 million to P34,129.84 million, primarily because of increase in construction revenues driven by the robust production levels of infrastructure projects of EEI; coupled with higher revenues from education segment brought about by (a) higher number of enrollees; (b) full 9-month operations of Malayan Colleges Mindanao (“MCM”) compared to just 2 months last year; and (c) contributions from newly acquired subsidiaries of iPeople as a result of the merger effective May 2, 2019. On the other hand, the car dealerships registered an 8% drop in revenues due to increased competition which resulted to lower number of vehicle units sold.

Equity in net earnings of associates increased from P255.78 million to P727.82 million primarily because of higher intake from Al-Rushaid Construction Company, Ltd. (a foreign affiliate of EEI). General and administrative expenses increased by 6%, from P2,651.24 million to P2,818.97 million, primarily attributable to (a) payment of Capital Gains Tax relative to the sale by the Parent Company of its direct investment in Mapua to iPeople; (b) increase in the number of personnel to support the growing business of the group; (c) depreciation of newly constructed/renovated school campuses; and (e) expenses of the newly acquired companies of iPeople group. Interest and finance charges increased due to new loans obtained by the Group to finance its existing projects and developments costs. Also, the adoption of the new accounting standard on Leases, PFRS 16, contributed P79.5 million in interest cost this year. BALANCE SHEET Consolidated total assets stood at P52.0 billion against P39.60 billion last year. Total current assets increased by 42%, from P16.09 billion last year to P22.83 billion, whereas the total non-current assets increased by 24%, from P23.50 billion to P29.16 billion. The significant movements of the balance sheet accounts are brought about by the Group’s adoption of PFRS 16 (Leases) effective January 2019 and the consolidation of newly acquired subsidiaries resulting from the merger of AC Education into iPeople effective May 2, 2019. Cash and cash equivalents increased from P2.04 billion to P2.69 billion mainly because of iPeople’s new subsidiaries coupled with collection of progress billings and retention receivables from various completed domestic projects of EEI. Receivables were higher due to billed trade receivables of EEI, timing of start of classes of the schools and contribution of the newly acquired subsidiaries of iPeople. Contract assets, which is composed of unbilled production and net retention receivables, registered a significant growth this year due to higher construction activities of EEI. Receivable from related parties was lower by P74.73 million due to payment of an affiliate. Inventories dropped by 12% as a result of lower inventory held by car dealerships. Prepaid expense and other current assets, which includes unutilized input and creditable withholding taxes of the Group, increased from P1.46 billion to P1.98 billion primarily because of increased advances to suppliers and contractors of EEI. Total noncurrent assets at P29.16 billion from P23.51 billion last year, includes assets of the entities acquired by iPeople. Equity investments grew from P0.97 billion to P1.15 billion primarily because of the increase in the valuation of the unquoted shares of EEI in Hermosa Ecozone Development Corporation in compliance with PFRS 9. Investments in associates and joint ventures grew by 12% due to investment in Sojitz G Auto Philippines Corporation, wherein the Parent company has 20% stake, coupled with higher equity earnings intake for the period. Increase in property and equipment at cost and revalued pertains mainly to assets of the newly acquired subsidiaries of iPeople as a result of the merger with AC Education, Inc. Right of use asset is a result of adoption of the new accounting standard, PFRS 16. Retirement assets dropped due to higher cost recognized for the year as a result of higher headcount and lower discount rate. Deferred tax asset pertains mainly to the tax effect of remeasurement loss on defined benefit plans of the Group. The reduction in other noncurrent assets pertain mainly to collection of the outstanding receivables of EEI. Consolidated total liabilities increased from P21.43 billion to P28.50 billion. Total current liabilities increased from P18.58 billion to P20.30 billion. Loans payable dropped as a result of the conversion of loans of iPeople to a longer term, coupled with payments of matured loans. Increase in accounts payable and accrued expenses pertain to heightened production activities of EEI which resulted to increased billings from various subcontractors and suppliers. Income tax payable increased by P32 million as a result of higher taxable income of the Group. Due to related parties mainly pertains to foreign currency adjustment in relation to EEI’s account in ARCC. Current portion of lease liability resulted from the new accounting standard, PFRS 16, wherein present value of operating leases is recorded in the books of the Company.

Total noncurrent liabilities increased from P2.85 billion to P8.20 billion. Increase in long term debt pertains mainly to reclassification of iPeople’s short-term loan to long-term loan. Accrued retirement liability increased significantly due to higher actuarial losses recognized for the year as a result of lower discount rate compared to last year. Increase in deferred tax liabilities is related to the revaluation increment on land of the Group, including the properties of the newly acquired companies of iPeople. Noncurrent lease liability pertains to recognized liability on the remaining lease term of the group in compliance with PFRS 16. Other noncurrent liabilities pertain mainly to contract obligations of EEI on projects with completion date beyond one year after balance sheet date. Consolidated equity grew from P18.17 billion to P23.49 billion, of which P14.744 billion is attributable to the Parent Company. Reduction in preferred stock and increase in common stock is attributable to the conversion of preferred shares of the Parent Company. Equity reserve on acquisition of noncontrolling interest pertains to the difference in acquisition cost and par value of the EEI shares acquired by the Parent Company, as well as the result of the dilution of its ownership interest in iPeople. Reduction in revaluation increment pertains to re-attribution of the Parent Company’s share in iPeople to noncontrolling interest, as a result of the merger. Changes in fair value of equity investments carried at FVOCI is higher due to the increase in fair market value of investment in Hermosa Ecozone Development Corporation. Total consolidated retained earnings increased from P9.20 billion to P10.11 billion. Year 2018 vs. Year 2017 INCOME STATEMENT The Group registered a net income after tax of P1.16 billion against P1.46 billion in 2017. Total revenues grew by 17%, from P27.55 billion to P32.31 billion, primarily because of increase in construction revenues as a result of higher construction activities of on-going domestic projects of EEI. This was softened, however, by lower revenues from both the education and the car dealership segments. For the year, the car dealerships registered a 29% drop in revenues due to lower number of vehicle units sold. Likewise, the education segment showed a decline compared to last year due to combined effects of change in academic calendar year and lower average number of students. Other income is lower this year primarily because of the following: (a) recognition of gain on sale of its investment property amounting to P270 million in 2017; (b) reversal of long outstanding payables amounting to P79 million, also in 2017; and (c) reclassification of the dealer’s income and commission income to Revenues, as a result of adoption of PFRS 15 effective this year. Equity in net earnings dropped by 12% primarily because of the Group’s share in the net losses of one of its associates, Al-Rushaid Construction Company, Ltd. (ARCC). General and administrative expenses increased by 14% primarily due to: (a) provision for probable losses on consultancy fee receivable under the construction segment amounting to P325 million, (b) increase in taxes and licenses due to higher DST, resulting from additional loans obtained by the Group coupled with increase in tax rates upon implementation of the TRAIN law; and (c) increase in rent and utility expenses. Interest expenses increased by 65% due to increase in loan level coupled with increase in interest rates. Provision for income tax is higher by 26% due to higher taxable income posted by the Group during the year. BALANCE SHEET Consolidated total assets stood at P39.60 billion against P37.35 billion last year. Total current assets dropped by 9%, from P17.73 billion last year to P16.09 billion, whereas the total non-current assets increased by 20%. The significant movements in the following accounts are brought about by the Group’s adoption of the new standards, PFRS 9 (Financial Instruments) and 15 (Revenue from Contracts with Customers), effective January 2018:

• Receivables, due to reclassification of retention receivables of EEI to a new account, Contract
Assets (for the current portion) and to Other non-current assets (for the non-current portion); • Contract assets, a new account upon adoption of PFRS 15, which represents all construction
work-in-progress, including the portion retained by the customer; • Costs and estimated earnings in excess of billings on uncompleted contracts, the old account
description prior to adoption of PFRS 15, which included unbilled production and uninstalled materials;
• Inventories, which now includes uninstalled materials; • Equity investments at fair value through other comprehensive income, formerly presented as
Available for Sale Financial Assets, which represents the Group’s total investments at its fair value. Prior to PFRS 9, the unquoted equity investments of the Group are measured at its cost.
• Deferred tax assets, due to the tax effect on the recognition of allowance for impairment on receivables relative to adoption of PFRS 9.
Receivable from related parties is lower compared to last year due to improved collections of an EEI subsidiary from other YGC entities. Prepaid expenses and other current assets increased due to higher unutilized input value added tax and creditable withholding taxes of the Group. Investments in associates and joint ventures increased by 14% mainly due to the additional shares of Petroenergy Resources Corporation (PERC) purchased by the Parent Company amounting to P332.60 million. Increase in property and equipment pertains mainly to acquisition of machinery, tools and equipment intended for newly awarded domestic projects of EEI, and the increase in the market value of the Group’s real properties. Consolidated total liabilities increased from P21.0 billion to P21.43 billion. The Group’s adoption of PFRS 9 and 15 resulted to the following changes:
• Introduction of a new account, Contract Liabilities, which represents the consideration received by the Group before it transfers goods or services to its customers. For this period, the Contract Liabilities presented in the Group’s Statement of Financial Position represent its unearned tuition fees and customers’ deposits;
• Reclassification of Billings in Excess of Costs and Estimated Earnings to Contract Liabilities. This account represents the unrecouped portion of the down payment paid by the customers on construction contracts. For this period, the total transaction amount has been offset against the Contract Assets.
• Increase in deferred tax liabilities, which represent taxes related to change in measurement of the Group’s investment in unquoted securities, from cost to fair value.
Total current liabilities increased from P18.10 billion to P18.58 billion primarily due to additional loans obtained by the Group to finance the new projects of EEI and the on-going construction in P.Ocampo property, as well as to settle the outstanding development costs of Malayan Colleges of Mindanao. Increase in accounts payable and accrued expenses pertain to increased production activities of EEI thereby incurring higher billings from subcontractors and suppliers. Current portion of long term debt is higher due to additional borrowings of EEI to fund its operational requirements. Income tax payable increased by P20 million as result of higher taxable income incurred by the Group. Due to related parties mainly pertains to foreign currency adjustment in relation to EEI’s share in ARCC’s income tax and other administrative fees. Total noncurrent liabilities decreased from P2.90 billion to P2.85 billion. Reduction in long term debt pertains mainly to net impact of the partial settlement of the Parent Company of its loans. Reduction in other noncurrent liabilities was due to reclassification of deferred VAT output to accounts payables and accrued expenses account. Consolidated equity grew from P16.35 billion to P18.17 billion, of which P12.43 billion is attributable to the Parent Company. Reduction in preferred stock represents the regular redemption of the Parent Company. Revaluation increment represents the increase in the fair market value of the Group’s real properties based on the recent valuation reports. Cumulative translation adjustment pertains mainly to exchange differences arising from the translation of financial statements of the foreign subsidiary, EEI

BVI, whose functional currency is the United States dollar and foreign associate, ARCC with functional currency of Saudi Arabia Riyal. Retained earnings grew from P8.41 billion to P9.20 billion. Financial Ratios Below are the financial ratios that are relevant to the Group’s for the years ended December 31, 2020 and 2019:
Financial ratios 2020 2019 Current ratio Current Assets 1.02:1 1.12:1
Indicates the Group's ability to pay Current Liabilities short-term obligation
Solvency Ratio Net Income + Depreciation (0.011:1) 0.11:1
Shows how likely a company will be to continue Total liabilities meeting its debt obligations
Debt-to-equity ratio Total Debt 1.37:1 1.21:1
Measures the Group's overall leverage Total Equity Asset to Equity Ratio Total Assets 2.37:1 2.21:1
Measures the group’s leverage and Total Equity long-term solvency
Interest Rate Coverage EBIT* (3.16:1) 3.70:1
Shows how easily a company can pay interest Interest Expense on outstanding debt
Return on Assets Net Income 3:26% 3.60%
Measure the ability to utilize the Group's Average Total Assets assets to create profits
Return on Equity Net Income (7.47%) 7.92%
Reflects how much the Group's has Average Total Equity earned on the funds invested by the stockholders
*Earnings before interest and taxes Current ratio went down from 1.12 in 2019 to 1.02 in 2020. This is mainly attributable to the decrease in contract assets and receivables of EEI in 2020 as a result of slowdown in production activities. Solvency ratio decreased from 0.11 in 2019 to (0.011) in 2020 mainly because of losses incurred by construction and dealership segment brought by the pandemic. Debt-to-Equity ratio measures the Group’s leverage. It increased from 1.21 to 1.37 this year primarily due to loan availments made especially by EEI to finance its operations, coupled with losses incurred for the year. Asset-to-Equity ratio increased from 2.21 to 2.37 attributable to net losses registered by the Group.

Interest Rate Coverage ratio shows how easily a company can pay interest on outstanding debt. It is lower at (3.16) times compared to last year due to losses incurred by the Group against net income earned of last year. Return on Assets measures the ability to utilize the Group’s assets to create profits. The Group’s return on assets for the year 2020 decreased to 3.26% from 3.60% in 2019 because of net loss posted by the construction and car dealership segments for the year. Return on Average Stockholders’ Equity (ROAE) measures the profitability of the Company in relation to the average stockholders’ equity. The ROAE for 2020 declined to (7.47%) from 7.92% in 2019 due to losses incurred of the Group for the year. The above-mentioned ratios are applicable to the Group as a whole. Other qualitative and quantitative factors
(i) There are no known trends or any known demands, commitments, events or uncertainties that will result in or that are reasonably likely to result in the Company’s liquidity increasing or decreasing in any material way;
a. House of Investments does not anticipate any cash flow or liquidity problems within the next twelve months;
b. House of Investments is not in default or breach of any note, loan, lease, or other indebtedness or financing arrangement which will require the Company to make payments;
c. There is no significant amount of trade payable that have not been paid within the stated terms; and
d. House of Investments depends on dividends from its subsidiaries as its source of liquidity.
(ii) There are no events that will trigger direct or contingent financial obligation that is material to
the company, including any default or acceleration of an obligation;
(iii) There are no material off-balance sheet transactions, arrangements, obligations (including contingent obligations), and other relationships of the company with unconsolidated entities or other persons created during the reporting period;
(iv) Below are the material commitments for capital expenditures, the general purpose of such commitments, and the expected sources of funds for such expenditures.
iPeople, inc’s subsidiary, Malayan Education System, Inc. (Operating under the name of Mapúa University) is constructing of a new campus on a 5,114 square-meter property in Makati. Completion is expected in time for the Academic Year 2020-2021. The entire project is estimated to cost around P2.5 billion and will be funded partially by debt.
(v) Below are the known trends, events or uncertainties that have had or that are reasonably expected to have a material favorable or unfavorable impact on net sales or revenues or income from continuing operations.
There is no known trend, event or uncertainty that have had or that are reasonably expected to have a material impact on the net sales or revenues or income of the Group from continuing operations;
(vi) There are no significant elements of income or loss that did not arise from the House of Investments’ continuing operations;
(vii) The causes for any material change from period to period which shall include vertical and horizontal analyses of any material item are discussed above;
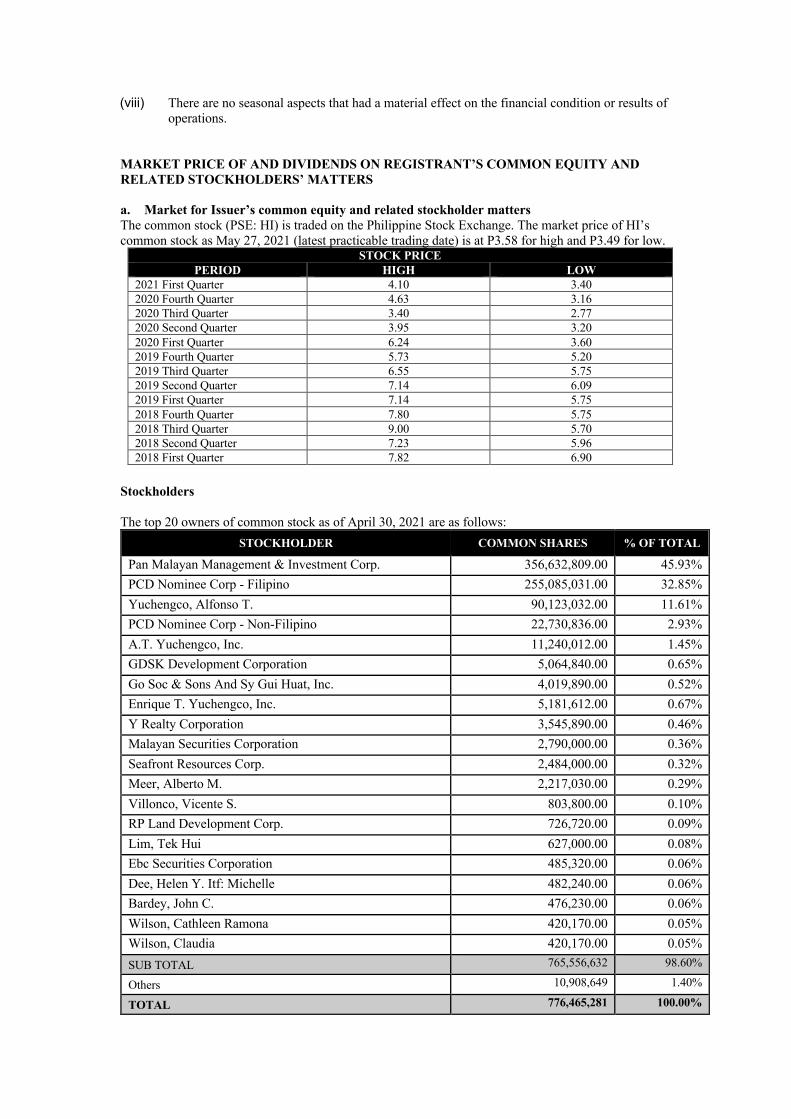
(viii) There are no seasonal aspects that had a material effect on the financial condition or results of operations.
MARKET PRICE OF AND DIVIDENDS ON REGISTRANT’S COMMON EQUITY AND RELATED STOCKHOLDERS’ MATTERS a. Market for Issuer’s common equity and related stockholder matters The common stock (PSE: HI) is traded on the Philippine Stock Exchange. The market price of HI’s common stock as May 27, 2021 (latest practicable trading date) is at P3.58 for high and P3.49 for low.
STOCK PRICE PERIOD HIGH LOW
2021 First Quarter 4.10 3.40 2020 Fourth Quarter 4.63 3.16 2020 Third Quarter 3.40 2.77 2020 Second Quarter 3.95 3.20 2020 First Quarter 6.24 3.60 2019 Fourth Quarter 5.73 5.20 2019 Third Quarter 6.55 5.75 2019 Second Quarter 7.14 6.09 2019 First Quarter 7.14 5.75 2018 Fourth Quarter 7.80 5.75 2018 Third Quarter 9.00 5.70 2018 Second Quarter 7.23 5.96 2018 First Quarter 7.82 6.90
Stockholders The top 20 owners of common stock as of April 30, 2021 are as follows:
STOCKHOLDER COMMON SHARES % OF TOTAL
Pan Malayan Management & Investment Corp. 356,632,809.00 45.93% PCD Nominee Corp - Filipino 255,085,031.00 32.85% Yuchengco, Alfonso T. 90,123,032.00 11.61% PCD Nominee Corp - Non-Filipino 22,730,836.00 2.93% A.T. Yuchengco, Inc. 11,240,012.00 1.45% GDSK Development Corporation 5,064,840.00 0.65% Go Soc & Sons And Sy Gui Huat, Inc. 4,019,890.00 0.52% Enrique T. Yuchengco, Inc. 5,181,612.00 0.67% Y Realty Corporation 3,545,890.00 0.46% Malayan Securities Corporation 2,790,000.00 0.36% Seafront Resources Corp. 2,484,000.00 0.32% Meer, Alberto M. 2,217,030.00 0.29% Villonco, Vicente S. 803,800.00 0.10% RP Land Development Corp. 726,720.00 0.09% Lim, Tek Hui 627,000.00 0.08% Ebc Securities Corporation 485,320.00 0.06% Dee, Helen Y. Itf: Michelle 482,240.00 0.06% Bardey, John C. 476,230.00 0.06% Wilson, Cathleen Ramona 420,170.00 0.05% Wilson, Claudia 420,170.00 0.05% SUB TOTAL 765,556,632 98.60%
Others 10,908,649 1.40%
TOTAL 776,465,281 100.00%

House of Investments has a total of 384 common shareholders owning a total of 776,465,281shares as of May 31, 2021. * Represents certificated shares only.
Dividends In accordance with the Section 42 of the Revised Corporation Code of the Philippines, HI intends to declare dividends (either in cash or stock or both) in the future. Common and preferred stockholders of HI are entitled to receive a proportionate share in cash dividends that may be declared by the Board of Directors out of surplus profits derived from HI’s operations after satisfying the cumulative interest of preferred shares. The same right exists with respect to a stock dividend of which the declaration is subject to the approval of stockholders representing at least two-thirds (2/3) of the outstanding shares entitled to vote. The amount will depend on HI’s profits and its capital expenditure and investment requirements at the relevant time. The company has declared cash dividends as follows:
YEAR DIVIDEND PER COMMON SHARE
DIVIDEND PER PREFERRED
SHARE
TOTAL AMOUNT
Q1 2020 N/A P0.00516 P86.56 K Q4 2019 N/A P0.00512 P85.86 K Q3 2019 N/A P0.00542 P3.35 MM Q2 2019 P0.065 P0.00721 P55.22 MM Q1 2019 N/A P0.00758 P4.69 MM Q4 2018 N/A P0.00719 P4.45 MM Q3 2018 N/A P0.00529 P3.27 MM Q2 2018 P0.065 P0.02274 P54.10 MM Q1 2018 N/A P0.00465 P2.95 MM
HI has not identified any restriction that limits the ability to pay dividends on common equity or that are likely to do so in the future. b. Recent Sales of Unregistered or Exempt Securities, Including Recent Issuance of Securities
Constituting an Exempt Transaction
There was no sale of unregistered securities and no recent issuance of securities in 2019 except for those related to conversions from preferred shares to common shares during the period. Description of Registrant's Securities: The equity capital structure of the firm as of April 30, 2021 is shown below:
Common Stock Preferred Authorized Capital 1,250,000,000 2,500,000,000 Issued 776,765,281 - Paid Up Capital P1,165,147,921,50 - Par Value P1.50 P0.40

ANNEX “D”
HOUSE OF INVESTMENTS, INC. AND SUBSIDIARIES
CONSOLIDATED FINANCIAL STATEMENTS
DECEMBER 31, 2020 AND 2019
AND
REPORT OF INDEPENDENT AUDITOR
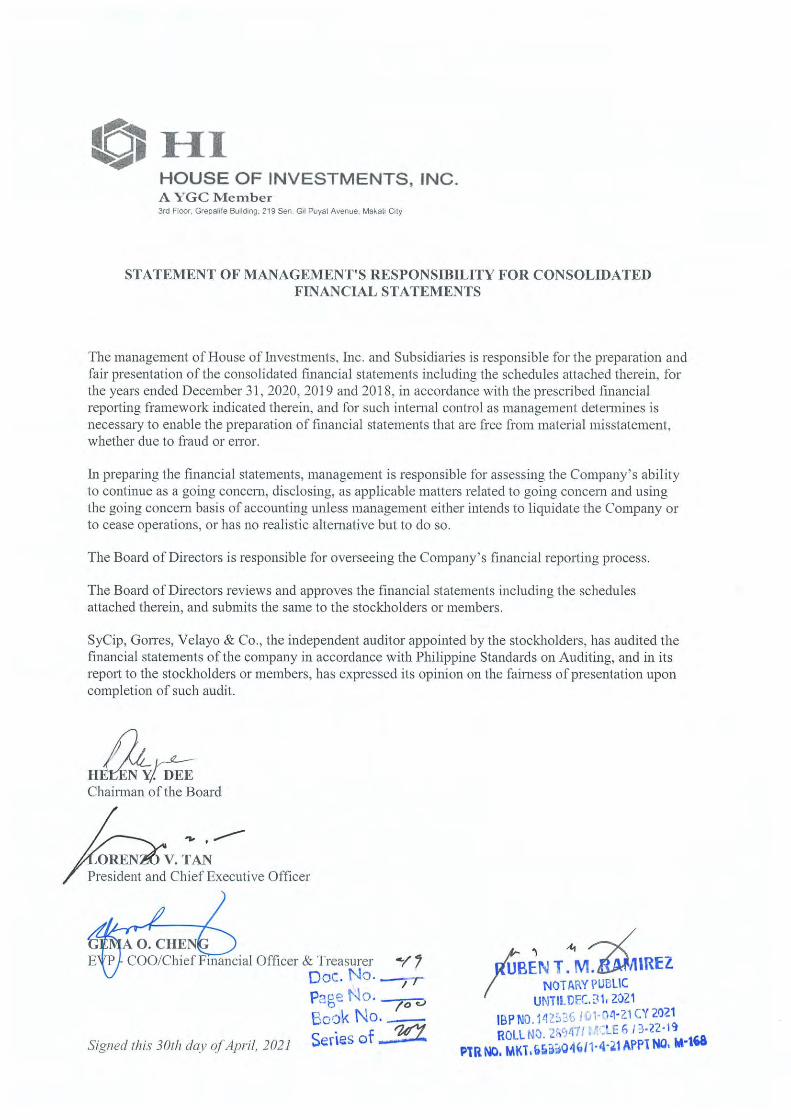

*SGVFSM009820*
INDEPENDENT AUDITOR’S REPORT
The Board of Directors and the StockholdersHouse of Investments, Inc.
Opinion
We have audited the consolidated financial statements of House of Investments, Inc. (the ParentCompany) and its subsidiaries (the Group), which comprise the consolidated statements of financialposition as at December 31, 2020 and 2019, and the consolidated statements of income, consolidatedstatements of comprehensive income, consolidated statements of changes in equity and consolidatedstatements of cash flows for each of the three years in the period ended December 31, 2020, and notes tothe consolidated financial statements, including a summary of significant accounting policies.
In our opinion, the accompanying consolidated financial statements present fairly, in all material respects,the consolidated financial position of the Group as at December 31, 2020 and 2019, and its consolidatedfinancial performance and its consolidated cash flows for each of the three years in the period endedDecember 31, 2020 in accordance with Philippine Financial Reporting Standards (PFRSs).
Basis for Opinion
We conducted our audits in accordance with Philippine Standards on Auditing (PSAs). Ourresponsibilities under those standards are further described in the Auditor’s Responsibilities for the Auditof the Consolidated Financial Statements section of our report. We are independent of the Group inaccordance with the Code of Ethics for Professional Accountants in the Philippines (Code of Ethics)together with the ethical requirements that are relevant to our audit of the consolidated financialstatements in the Philippines, and we have fulfilled our other ethical responsibilities in accordance withthese requirements and the Code of Ethics. We believe that the audit evidence we have obtained issufficient and appropriate to provide a basis for our opinion.
Key Audit Matters
Key audit matters are those matters that, in our professional judgment, were of most significance in ouraudit of the consolidated financial statements of the current period. These matters were addressed in thecontext of our audit of the consolidated financial statements as a whole, and in forming our opinionthereon, and we do not provide a separate opinion on these matters. For each matter below, ourdescription of how our audit addressed the matter is provided in that context.
We have fulfilled the responsibilities described in the Auditor’s Responsibilities for the Audit of theConsolidated Financial Statements section of our report, including in relation to these matters.Accordingly, our audit included the performance of procedures designed to respond to our assessment ofthe risks of material misstatement of the consolidated financial statements. The results of our auditprocedures, including the procedures performed to address the matters below, provide the basis for ouraudit opinion on the accompanying consolidated financial statements.
SyCip Gorres Velayo & Co.6760 Ayala Avenue1226 Makati CityPhilippines
Tel: (632) 8891 0307Fax: (632) 8819 0872ey.com/ph
BOA/PRC Reg. No. 0001, October 4, 2018, valid until August 24, 2021SEC Accreditation No. 0012-FR-5 (Group A),
November 6, 2018, valid until November 5, 2021
A member firm of Ernst & Young Global Limited

*SGVFSM009820*
- 2 -
Recognition of revenue from construction contracts
The Group’s revenue from construction projects on electro-mechanical works, industrial, buildings andinfrastructure accounts more than 60% of the total revenue of the Group. Under PFRS 15, Revenue fromContracts with Customers, the Group assessed that there is only one performance obligation for eachconstruction agreement that it has entered and that the revenue arising from such agreements qualify forrecognition over time. The Group also recognized as part of its construction revenue, the effects ofvariable considerations arising from various change orders and claims, to the extent that they reflect theamounts the Group expects to be entitled to and to be received from the customers, provided that it ishighly probable that a significant reversal of the revenue recognized in connection with these variableconsiderations will not occur in the future. The Group elected to use the input method to measure theprogress of the fulfilment of its performance obligation, which is based on the actual costs incurred todate relative to the total estimated cost to complete the construction projects.
Aside from the significance of the amount involved, we consider this as a key audit matter because therevenue recognition process involves significant judgment and estimates, particularly, with respect to theestimation of the variable considerations arising from the change orders and claims and calculation ofestimated cost to complete construction projects (i.e., determination of the quantity of the inputs such asmaterials, labor and equipment needed to complete the construction), which requires the technicalexpertise of the Group’s engineers.
The Group’s disclosures about construction revenue are included in Notes 4 and 23 to the consolidatedfinancial statements.
Audit response
We inspected sample contracts and supplemental agreements and reviewed management’s assessment onthe identification of performance obligation within the contract and the timing of revenue recognition.For construction revenue which includes significant effects of the variable considerations, we obtained anunderstanding and tested the relevant controls over the management’s process to estimate the amount ofconsideration expected to be received from the customers. For change orders and claims of samplecontracts, we compared the amounts recognized as revenue to the change orders and claims approved bythe customers and other relevant documentary evidences supporting the management’s estimate ofrevenue recognized.
For the measurement of progress of the construction projects, we obtained an understanding of theGroup’s process to accumulate actual costs incurred and to estimate the expected cost to complete andtested relevant controls. We also tested actual costs incurred by examining sample invoices and othersupporting third party correspondences. We also considered the competence, capabilities and objectivityof the Group’s cost engineers by referring to their qualifications, experience and reportingresponsibilities. We examined the approved total estimated completion costs, any revisions thereto, andthe cost variance analysis with supporting details. We conducted ocular inspections on selected sampleprojects and discussed the status of the projects under construction with the Group’s engineers. We alsoinspected the related project documentation and inquired about the significant deviations from thetargeted completion.
A member firm of Ernst & Young Global Limited

*SGVFSM009820*
- 3 -
Accounting for investment in Al-Rushaid Construction Company Ltd.
The Group owns 49% equity interest in Al-Rushaid Construction Company Ltd. (ARCC), associateaccounted for under the equity method. As of December 31, 2020, ARCC recognized deferred tax asseton net operating loss carryover of P=330.10 million. We consider the accounting for the investment inARCC as a key audit matter because the Group’s share in ARCC’s net earnings and the carrying value ofthe investment represents 43% of Group’s consolidated net loss and 3% of the Group’s total assets,respectively. The Group’s share in ARCC’s net earnings is significantly affected by ARCC’s revenuerecognition from its construction contracts. In addition, management’s assessment process on therecognition of deferred tax asset is based on assumptions, which are affected by expected future market oreconomic conditions.
The Group’s disclosures about the investment in ARCC are included in Note 12 to the consolidatedfinancial statements.
Audit response
We sent instructions to statutory auditors of ARCC to perform an audit on the relevant financialinformation of ARCC for the purpose of the Group’s consolidated financial statements. These auditinstructions cover their scope of work, risk assessment procedures, audit strategy and reportingresponsibilities. We discussed with ARCC’s statutory auditors about their key audit areas, planning andexecution of audit procedures, significant areas of estimation and judgment. We also reviewed theirworking papers and obtained relevant conclusion statements related to their audit procedures. Wereviewed their working papers, focusing on the procedures performed on ARCC’s revenue recognitionand obtained relevant conclusion statements related to their audit procedures. Furthermore, we evaluatedmanagement’s assumptions on the recognition of deferred tax assets and inquired with the Group’smanagement on the basis of the financial forecast. We also evaluated management’s forecast againsthistorical performance of ARCC.
We also obtained the financial information of ARCC for the year ended December 31, 2020 andrecomputed the Group’s share in net earnings for the year ended December 31, 2020.
Valuation of unquoted equity investments carried at fair value through other comprehensive income
The Group has investments in unquoted equity securities of Hermosa Ecozone Development Corporation(HEDC) carried at fair value through other comprehensive income. As of December 31, 2020, theinvestments’ carrying values amounted to P=440.75 million. In determining the fair values of theseinvestments, the Group engaged external valuers and exercised judgments in selecting the appropriatevaluation methodology. This includes using assumptions and inputs taking into consideration theindustry where the investee operates. This matter is significant to our audit because estimating the fairvalue of an unquoted equity instrument involves the use of valuation inputs that are not observable in themarket.
The Group’s disclosures about its unquoted equity investments are included in Notes 11 and 38 to theconsolidated financial statements.
A member firm of Ernst & Young Global Limited
*SGVFSM009820*
- 4 -
Audit response
We evaluated the competence, capabilities and qualifications of the external valuers by considering theirqualifications, experience and reporting responsibilities. We involved our internal specialist in the reviewof the methodology and assumptions used in the valuation of unquoted equity investment valued, whichinclude sales price of comparable properties with reference to market data and cost to develop the parcelsof land of HEDC. We also reviewed the Group’s disclosures about those assumptions to which theoutcome of the valuation is most sensitive; specifically, those that have the most significant effect on thedetermination of the fair value of the unquoted equity investments.
Valuation of land classified as property and equipment
The Group accounts for its land, where the school buildings and other facilities are located, using therevaluation model. As at December 31, 2020, the carrying value of the Group’s land amounted toP=7,957.66 million, representing 15% of the Group’s total assets. The valuation of the land requires theassistance of external appraisers whose calculations involve certain assumptions, such as sales price ofsimilar properties and adjustments to sales price based on internal and external factors. This matter issignificant to our audit because it involves significant judgment and estimates.
Refer to Notes 4 and 13 to the consolidated financial statements for the detailed disclosures.
Audit response
With the assistance of our internal specialist, we reviewed the scope, bases, methodology and results ofthe work done by the Group’s external appraisers whose professional qualifications and objectivity werealso taken into consideration. We compared the relevant information supporting the sales price of similarproperties and the adjustments made to the sales price against real estate industry data and made inquiriesto the external appraisers as to the basis. We also reviewed the Group’s disclosures with respect to thefair value of the land.
Recoverability of nonfinancial assets
The Group has nonfinancial assets attributable to the acquisition of Malayan Education System which areconsidered significant to the consolidated financial statements. Under PFRSs, the Group is required toannually test for impairment the goodwill amounting to P=137.85 million and intellectual property rightswith infinite life amounting to P=523.10 million. In addition, management’s assessment process involvesjudgments and is based on assumptions which are subject to higher level of estimation uncertainty due tothe current economic conditions which have been impacted by the coronavirus pandemic. Theassumptions used in estimating the discounted cash flow projections include forecasted revenue, long-term growth rates, royalty rates, and discount rates.
The Group’s disclosures about nonfinancial assets are included in Notes 4, 15 and 17 to the consolidatedfinancial statements.
A member firm of Ernst & Young Global Limited

*SGVFSM009820*
- 5 -
Audit response
We involved our internal specialist in evaluating the methodology and assumptions used. We obtained anunderstanding of the Group’s impairment model and the assumptions on the key business drivers of thecash flow forecasts such as the revenue from number of forecasted students and related tuition and othermatriculation fees. We checked if the Group has considered the impact of the K to 12 Basic EducationProgram implementation and the coronavirus pandemic on these key assumptions and also comparedthem against historical performance. We compared the long-term growth rates and royalty rates againstrelevant published market information. We tested the parameters used in the determination of discountrates against market data. In addition, we reviewed the Group’s disclosures about those assumptions towhich the outcome of the impairment tests is most sensitive, that is, those that have the most significanteffect on the determination of the recoverable amount of these assets.
Adequacy of allowance for expected credit loss (ECL)
The Group applies simplified approach in calculating expected credit loss (ECL) on its receivablesderived from education segment. Under this approach, the Group establishes a provision matrix that isbased on its historical credit loss experience and adjusted for forward-looking factors specific to thedebtors and the economic environment. Allowance for ECL and the provision for ECL as of and for theyear ended December 31, 2020 amounted to P=168.98 million and P=48.76 million, respectively.
The Group’s calculation of allowance for ECL is significant to our audit as it involves the exercise ofsignificant management judgment. Key areas of judgment include: segmenting the Group’s credit riskexposures; defining default; determining assumptions to be used in the ECL model such as the expectedlife of the financial asset; and incorporating forward-looking information (called overlays), including theimpact of the coronavirus pandemic, in calculating ECL.
The disclosures on the allowance for ECL are included in Notes 4 and 7 to the consolidated financialstatements.
Audit response
We updated our understanding of the approved methodology and assumptions used for the Group’sdifferent credit exposures and reassessed whether these considered the requirements of PFRS 9 to reflectan unbiased and probability-weighted outcome and the best available forward-looking information.
We (a) assessed the Group’s segmentation of its credit risk exposures based on homogeneity of credit riskcharacteristics; (b) tested the definition of default against historical analysis of accounts and credit riskmanagement policies and practices in place and management’s assessment of the impact of thecoronavirus pandemic on the counterparties; (c) tested historical loss rates by inspecting historicalrecoveries including the write-offs; (d) checked the classification of outstanding exposures to theircorresponding aging buckets; and (e) evaluated the forward-looking information used for overlay throughstatistical test and corroboration using publicly available information and our understanding of theGroup’s receivable portfolios and industry practices, including the impact of the coronavirus pandemic.
A member firm of Ernst & Young Global Limited

*SGVFSM009820*
- 6 -
Further, we checked the data used in the ECL models, such as the historical analysis of defaults, andrecovery data, by reconciling data from loss allowance analysis/model to the source reports and financialreporting system. To the extent that the loss allowance analysis is based on credit exposures that havebeen disaggregated into subsets with similar risk characteristics, we traced or re-performed thedisaggregation from source reports to the loss allowance analysis.
We recalculated the impairment provisions. We checked the disclosures made in the financial statementson allowance for ECL by tracing such disclosures to the ECL analysis prepared by management.
Other Information
Management is responsible for the other information. The other information comprises the informationincluded in the SEC Form 20-IS (Definitive Information Statement), SEC Form 17-A and Annual Reportfor the year ended December 31, 2020, but does not include the consolidated financial statements and ourauditor’s report thereon. The SEC Form 20-IS (Definitive Information Statement), SEC Form 17-A andAnnual Report for the year ended December 31, 2020 are expected to be made available to us after thedate of this auditor’s report.
Our opinion on the consolidated financial statements does not cover the other information and we will notexpress any form of assurance conclusion thereon.
In connection with our audits of the consolidated financial statements, our responsibility is to read theother information identified above when it becomes available and, in doing so, consider whether the otherinformation is materially inconsistent with the consolidated financial statements or our knowledgeobtained in the audits, or otherwise appears to be materially misstated.
Responsibilities of Management and Those Charged with Governance for the ConsolidatedFinancial Statements
Management is responsible for the preparation and fair presentation of the consolidated financialstatements in accordance with PFRSs, and for such internal control as management determines isnecessary to enable the preparation of consolidated financial statements that are free from materialmisstatement, whether due to fraud or error.
In preparing the consolidated financial statements, management is responsible for assessing the Group’sability to continue as a going concern, disclosing, as applicable, matters related to going concern andusing the going concern basis of accounting unless management either intends to liquidate the Group or tocease operations, or has no realistic alternative but to do so.
Those charged with governance are responsible for overseeing the Group’s financial reporting process.
A member firm of Ernst & Young Global Limited

*SGVFSM009820*
- 7 -
Auditor’s Responsibilities for the Audit of the Consolidated Financial Statements
Our objectives are to obtain reasonable assurance about whether the consolidated financial statements as awhole are free from material misstatement, whether due to fraud or error, and to issue an auditor’s reportthat includes our opinion. Reasonable assurance is a high level of assurance, but is not a guarantee that anaudit conducted in accordance with PSAs will always detect a material misstatement when it exists.Misstatements can arise from fraud or error and are considered material if, individually or in theaggregate, they could reasonably be expected to influence the economic decisions of users taken on thebasis of these consolidated financial statements.
As part of an audit in accordance with PSAs, we exercise professional judgment and maintainprofessional skepticism throughout the audit. We also:
Identify and assess the risks of material misstatement of the consolidated financial statements,whether due to fraud or error, design and perform audit procedures responsive to those risks, andobtain audit evidence that is sufficient and appropriate to provide a basis for our opinion. The risk ofnot detecting a material misstatement resulting from fraud is higher than for one resulting from error,as fraud may involve collusion, forgery, intentional omissions, misrepresentations, or the override ofinternal control.
Obtain an understanding of internal control relevant to the audit in order to design audit proceduresthat are appropriate in the circumstances, but not for the purpose of expressing an opinion on theeffectiveness of the Group’s internal control.
Evaluate the appropriateness of accounting policies used and the reasonableness of accountingestimates and related disclosures made by management.
Conclude on the appropriateness of management’s use of the going concern basis of accounting and,based on the audit evidence obtained, whether a material uncertainty exists related to events orconditions that may cast significant doubt on the Group’s ability to continue as a going concern. Ifwe conclude that a material uncertainty exists, we are required to draw attention in our auditor’sreport to the related disclosures in the consolidated financial statements or, if such disclosures areinadequate, to modify our opinion. Our conclusions are based on the audit evidence obtained up tothe date of our auditor’s report. However, future events or conditions may cause the Group to ceaseto continue as a going concern.
Evaluate the overall presentation, structure and content of the consolidated financial statements,including the disclosures, and whether the consolidated financial statements represent the underlyingtransactions and events in a manner that achieves fair presentation.
Obtain sufficient appropriate audit evidence regarding the financial information of the entities orbusiness activities within the Group to express an opinion on the consolidated financial statements.We are responsible for the direction, supervision and performance of the audit. We remain solelyresponsible for our audit opinion.
We communicate with those charged with governance regarding, among other matters, the planned scopeand timing of the audit and significant audit findings, including any significant deficiencies in internalcontrol that we identify during our audit.
A member firm of Ernst & Young Global Limited
*SGVFSM009820*
- 8 -
We also provide those charged with governance with a statement that we have complied with relevantethical requirements regarding independence, and to communicate with them all relationships and othermatters that may reasonably be thought to bear on our independence, and where applicable, relatedsafeguards.
From the matters communicated with those charged with governance, we determine those matters thatwere of most significance in the audit of the consolidated financial statements of the current period andare therefore the key audit matters. We describe these matters in our auditor’s report unless law orregulation precludes public disclosure about the matter or when, in extremely rare circumstances, wedetermine that a matter should not be communicated in our report because the adverse consequences ofdoing so would reasonably be expected to outweigh the public interest benefits of such communication.
The engagement partner on the audit resulting in this independent auditor’s report isNarciso T. Torres, Jr.
SYCIP GORRES VELAYO & CO.
Narciso T. Torres, Jr.PartnerCPA Certificate No. 84208SEC Accreditation No. 1511-AR-1 (Group A), October 18, 2018, valid until October 17, 2021Tax Identification No. 102-099-147BIR Accreditation No. 08-001998-111-2020, November 27, 2020, valid until November 26, 2023PTR No. 8534374, January 4, 2021, Makati City
April 30, 2021
A member firm of Ernst & Young Global Limited

*SGVFSM009820*
HOUSE OF INVESTMENTS, INC. AND SUBSIDIARIESCONSOLIDATED STATEMENTS OF FINANCIAL POSITION
December 312020 2019
ASSETS
Current AssetsCash and cash equivalents (Note 6) P=3,218,733,775 P=2,686,669,074Receivables (Note 7) 5,346,073,837 6,246,486,725Contract assets (Note 8) 7,605,270,420 9,483,493,604Inventories (Note 9) 1,888,033,691 2,362,277,465Receivables from related parties (Note 22) 53,415,133 71,235,301Prepaid expenses and other current assets (Note 10) 2,544,943,848 1,982,854,200
Total Current Assets 20,656,470,704 22,833,016,369
Noncurrent AssetsEquity investments at fair value through
other comprehensive income (FVOCI) (Note 11) 547,076,494 1,147,773,806Investments in associates and joint ventures (Note 12) 7,092,623,906 6,193,051,356Property and equipment (Note 13)
At cost 8,450,819,862 8,808,917,553At revalued amount 7,957,658,100 9,185,924,384
Investment properties (Note 16) 1,977,608,213 17,689,018Deferred tax assets - net (Note 33) 1,580,396,762 195,020,389Right-of-use assets (Note 14) 1,271,074,183 1,605,726,653Goodwill (Note 15) 484,829,719 484,829,719Retirement assets (Note 32) 4,726,582 18,289,597Other noncurrent assets - net (Note 17) 1,862,191,461 1,505,524,395
Total Noncurrent Assets 31,229,005,282 29,162,746,870Total Assets P=51,885,475,986 P=51,995,763,239
LIABILITIES AND EQUITY
Current LiabilitiesAccounts payable and other current liabilities (Note 18) P=8,778,272,881 P=8,412,082,541Loans payable (Note 19) 7,982,000,000 8,393,800,000Current portion of long-term debt (Note 20) 2,302,998,099 1,385,714,285Current portion of contract liabilities (Note 8) 898,322,177 1,694,367,011Current portion of lease liabilities (Note 14) 164,647,368 215,416,367Income tax payable 44,134,970 74,755,176Due to related parties (Note 22) 10,214,099 126,417,175
Total Current Liabilities 20,180,589,594 20,302,552,555
Noncurrent LiabilitiesLong-term debt - net of current portion (Note 20) 5,117,304,037 3,305,974,841Contract liabilities - net of current portion (Note 8) 1,658,679,655 1,820,243,384Lease liabilities - net of current portion (Note 14) 1,085,685,479 1,323,247,962Deferred tax liabilities - net (Note 33) 1,047,739,837 1,023,530,274Retirement liabilities (Note 32) 611,599,429 457,836,487Other noncurrent liabilities (Note 38) 329,691,519 268,665,644
Total Noncurrent Liabilities 9,850,699,956 8,199,498,592Total Liabilities P=30,031,289,550 P=28,502,051,147
(Forward)

*SGVFSM009820*
- 2 -
December 312020 2019
EquityAttributable to equity holders of the Parent Company
Preferred stock (Note 39) P=‒ P=6,710,402Common stock (Note 39) 1,162,540,326 1,162,540,326Additional paid-in capital 154,578,328 154,578,328Equity reserve on acquisition of non-controlling interest (Note 36) 1,623,004,873 1,641,756,492Revaluation increment on land - net (Note 13) 1,294,577,413 1,298,881,074Cumulative translation adjustments 225,033,109 245,958,913Fair value reserve of equity investments at FVOCI (Note 11) 175,482,889 311,094,152Remeasurement loss on retirement (Note 32) (259,954,684) (188,329,963)Retained earnings: (Note 40)
Unappropriated 3,280,479,055 3,605,930,659Appropriated 6,505,355,000 6,505,355,000
14,161,096,309 14,744,475,383Non-controlling interests (Note 36) 7,693,090,127 8,749,236,709
Total Equity 21,854,186,436 23,493,712,092P=51,885,475,986 P=51,995,763,239
See accompanying Notes to Consolidated Financial Statements.
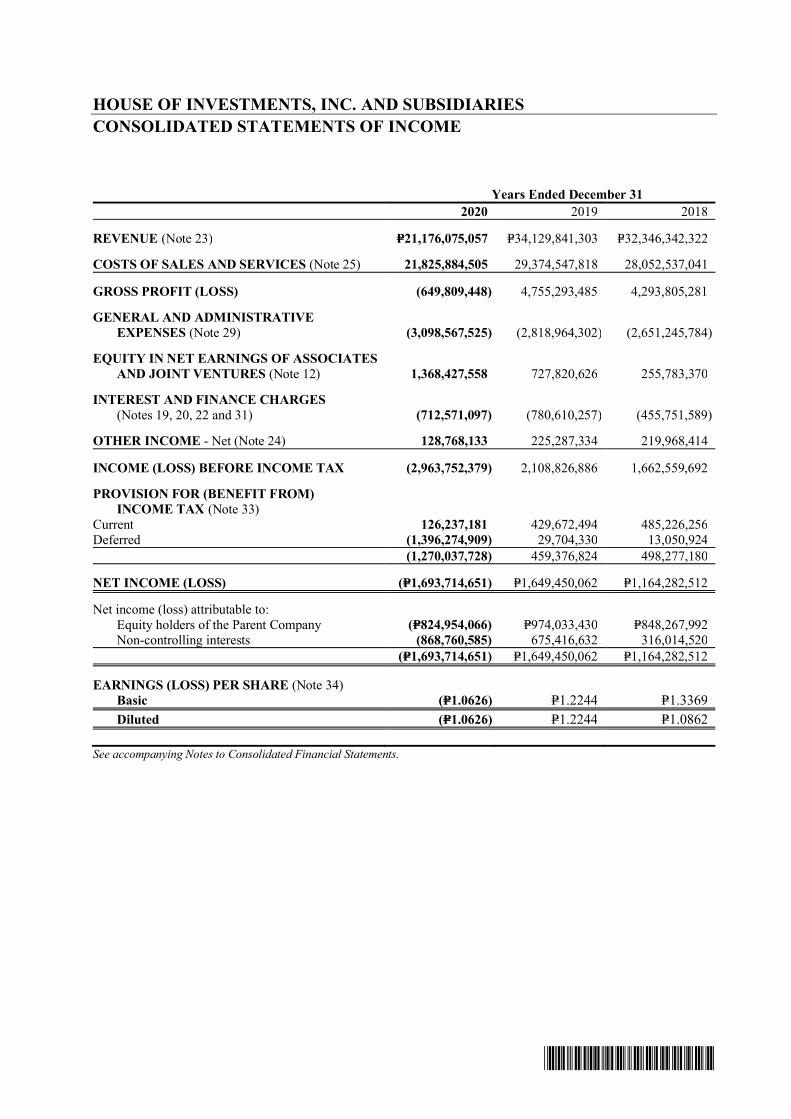
*SGVFSM009820*
HOUSE OF INVESTMENTS, INC. AND SUBSIDIARIESCONSOLIDATED STATEMENTS OF INCOME
Years Ended December 312020 2019 2018
REVENUE (Note 23) P=21,176,075,057 P=34,129,841,303 P=32,346,342,322
COSTS OF SALES AND SERVICES (Note 25) 21,825,884,505 29,374,547,818 28,052,537,041
GROSS PROFIT (LOSS) (649,809,448) 4,755,293,485 4,293,805,281
GENERAL AND ADMINISTRATIVEEXPENSES (Note 29) (3,098,567,525) (2,818,964,302) (2,651,245,784)
EQUITY IN NET EARNINGS OF ASSOCIATESAND JOINT VENTURES (Note 12) 1,368,427,558 727,820,626 255,783,370
INTEREST AND FINANCE CHARGES(Notes 19, 20, 22 and 31) (712,571,097) (780,610,257) (455,751,589)
OTHER INCOME - Net (Note 24) 128,768,133 225,287,334 219,968,414
INCOME (LOSS) BEFORE INCOME TAX (2,963,752,379) 2,108,826,886 1,662,559,692
PROVISION FOR (BENEFIT FROM)INCOME TAX (Note 33)
Current 126,237,181 429,672,494 485,226,256Deferred (1,396,274,909) 29,704,330 13,050,924
(1,270,037,728) 459,376,824 498,277,180
NET INCOME (LOSS) (P=1,693,714,651) P=1,649,450,062 P=1,164,282,512
Net income (loss) attributable to:Equity holders of the Parent Company (P=824,954,066) P=974,033,430 P=848,267,992Non-controlling interests (868,760,585) 675,416,632 316,014,520
(P=1,693,714,651) P=1,649,450,062 P=1,164,282,512
EARNINGS (LOSS) PER SHARE (Note 34)Basic (P=1.0626) P=1.2244 P=1.3369Diluted (P=1.0626) P=1.2244 P=1.0862
See accompanying Notes to Consolidated Financial Statements.
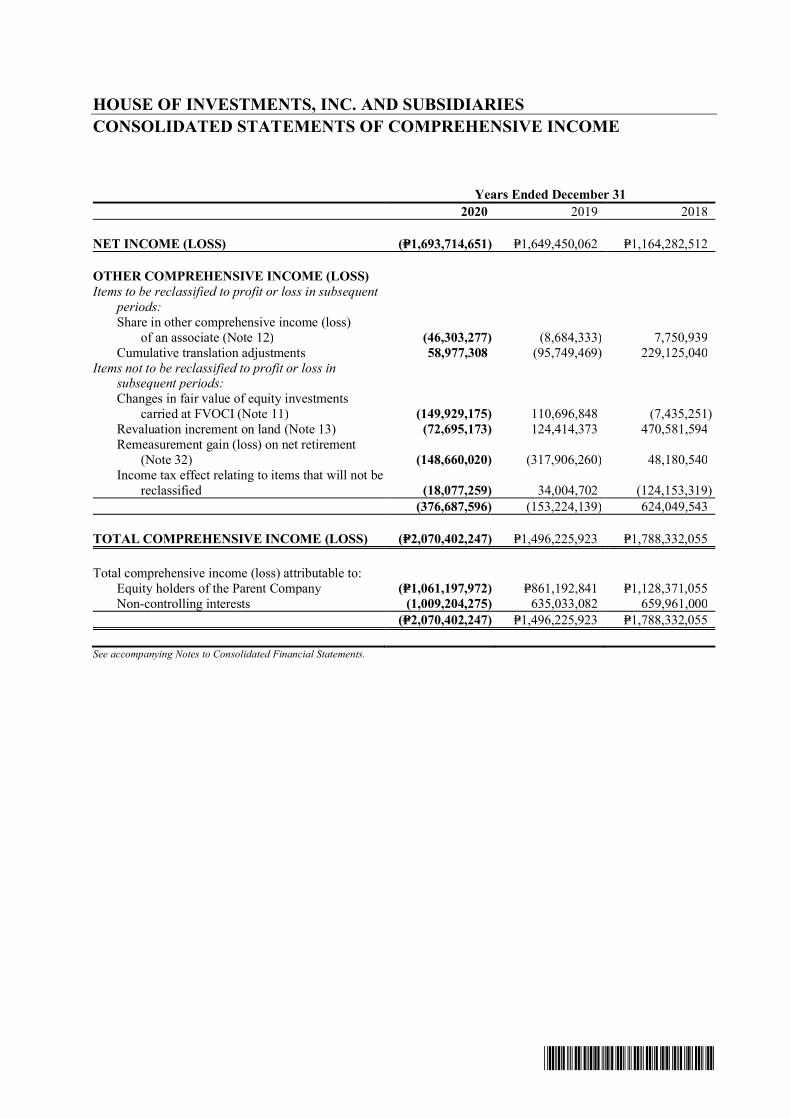
*SGVFSM009820*
HOUSE OF INVESTMENTS, INC. AND SUBSIDIARIESCONSOLIDATED STATEMENTS OF COMPREHENSIVE INCOME
Years Ended December 312020 2019 2018
NET INCOME (LOSS) (P=1,693,714,651) P=1,649,450,062 P=1,164,282,512
OTHER COMPREHENSIVE INCOME (LOSS)Items to be reclassified to profit or loss in subsequent
periods:Share in other comprehensive income (loss)
of an associate (Note 12) (46,303,277) (8,684,333) 7,750,939Cumulative translation adjustments 58,977,308 (95,749,469) 229,125,040
Items not to be reclassified to profit or loss insubsequent periods:
Changes in fair value of equity investmentscarried at FVOCI (Note 11) (149,929,175) 110,696,848 (7,435,251)
Revaluation increment on land (Note 13) (72,695,173) 124,414,373 470,581,594Remeasurement gain (loss) on net retirement
(Note 32) (148,660,020) (317,906,260) 48,180,540Income tax effect relating to items that will not be
reclassified (18,077,259) 34,004,702 (124,153,319)(376,687,596) (153,224,139) 624,049,543
TOTAL COMPREHENSIVE INCOME (LOSS) (P=2,070,402,247) P=1,496,225,923 P=1,788,332,055
Total comprehensive income (loss) attributable to:Equity holders of the Parent Company (P=1,061,197,972) P=861,192,841 P=1,128,371,055Non-controlling interests (1,009,204,275) 635,033,082 659,961,000
(P=2,070,402,247) P=1,496,225,923 P=1,788,332,055
See accompanying Notes to Consolidated Financial Statements.

*SGVFSM009820*
HOUSE OF INVESTMENTS, INC. AND SUBSIDIARIESCONSOLIDATED STATEMENTS OF CHANGES IN EQUITYFOR THE YEARS ENDED DECEMBER 31, 2020, 2019 AND 2018
Attributable to Equity Holders of the Parent Company
Capital stock (Note 39) Additionalpaid-incapital
Equityreserve on
acquisition ofnon-controlling
interest
Revaluationincrement
on land - net(Note 13)
Cumulativetranslation
adjustments(Notes 12
and 38)
Fair Valuereserve of equity
investments atFVOCI
(Note 11)
Remeasurementloss on retirement
(Note 32)
Retained earnings
Subtotal
Non-controllinginterests(Note 36) Total
Preferredstock
Commonstock
Unappropriated(Note 40)
Appropriated(Note 40)
BALANCES ATJANUARY 1, 2018 P=253,758,109 P=921,836,572 P=154,578,328 (P=179,954,180) P=1,329,730,248 P=224,366,002 P=254,766,791 (P=5,100,398) P=8,414,417,152 P=600,000 P=11,368,998,624 P=5,157,194,941 P=16,526,193,565
Net incomeOther comprehensive income
––
––
––
––
–272,500,479
–25,337,343
–5,088,916
–(22,823,675)
848,267,992–
‒‒
848,267,992280,103,063
316,014,520343,946,480
1,164,282,512624,049,543
Total comprehensive income – – – – 272,500,479 25,337,343 5,088,916 (22,823,675) 848,267,992 ‒ 1,128,371,055 659,961,000 1,788,332,055Redemption of preferred
stock (6,343,953) – – – – – – – – – (6,343,953) – (6,343,953)Reversal of appropriated
retained earnings – – – – – – – – 600,000 (600,000) ‒ ‒ ‒Appropriation of retained
earnings – – – – – – – – (6,105,300,000) 6,105,300,000 ‒ ‒ ‒Dividend declaration – – – – – – – – (64,772,686) ‒ (64,772,686) (71,619,746) (136,392,432)
BALANCES ATDECEMBER 31, 2018 247,414,156 921,836,572 154,578,328 (179,954,180) 1,602,230,727 249,703,345 259,855,707 (27,924,073) 3,093,212,458 6,105,300,000 12,426,253,040 5,745,536,195 18,171,789,235
Net income – – – – – – – – 974,033,430 ‒ 974,033,430 675,416,632 1,649,450,062Other comprehensive income – – – – (4,360,837) (4,702,267) 49,199,478 (152,976,963) ‒ ‒ (112,840,589) (40,383,550) (153,224,139)Total comprehensive income – – – – (4,360,837) (4,702,267) 49,199,478 (152,976,963) 974,033,430 ‒ 861,192,841 635,033,082 1,496,225,923Conversion of preferred to common
stock (240,703,754) 240,703,754 – – – – – – – ‒ – – –Reversal of appropriated retained
earnings – – – – – – – – 5,300,000 (5,300,000) – – –Appropriation of retained earnings – – – – – – – – (405,355,000) 405,355,000 – – –Acquisition and disposal of
subsidiary – – – – – – – (355,202) 2,081,876 ‒ 1,726,674 (12,108,346) (10,381,672)Changes in non-controlling interest – – – 1,821,710,672 (298,988,816) 957,835 2,038,967 (7,073,725) – ‒ 1,518,644,933 2,505,603,852 4,024,248,785Dividend declaration – – – – – – – – (63,342,105) ‒ (63,342,105) (124,828,074) (188,170,179)
BALANCES ATDECEMBER 31, 2019 6,710,402 1,162,540,326 154,578,328 1,641,756,492 1,298,881,074 245,958,913 311,094,152 (188,329,963) 3,605,930,659 6,505,355,000 14,744,475,383 8,749,236,709 23,493,712,092
Net loss – – – – – – – – (824,954,066) ‒ (824,954,066) (868,760,585) (1,693,714,651)Other comprehensive loss – – – – (11,714,131) (23,145,055) (139,313,149) (69,482,041) ‒ ‒ (243,654,376) (133,033,220) (376,687,596)Total comprehensive loss – – – – (11,714,131) (23,145,055) (139,313,149) (69,482,041) (824,954,066) ‒ (1,068,608,442) (1,001,793,805) (2,070,402,247)Redemption of preferred
stock (6,710,402) – – – – – – – – ‒ (6,710,402) – (6,710,402)Changes in non-controlling interest – – – (18,751,619) 7,410,470 2,219,251 3,701,886 (2,142,680) 499,588,991 ‒ 492,026,299 (11,396,980) 480,629,319Dividend declaration – – – – – – – ‒ (86,529) ‒ (86,529) (42,955,797) (43,042,326)
BALANCES ATDECEMBER 31, 2020 P=– P=1,162,540,326 P=154,578,328 P=1,623,004,873 P=1,294,577,413 P=225,033,109 P=175,482,889 (P=259,954,684) P=3,280,479,055 P=6,505,355,000 P=14,161,096,309 P=7,693,090,127 P=21,854,186,436
See accompanying Notes to Consolidated Financial Statements.
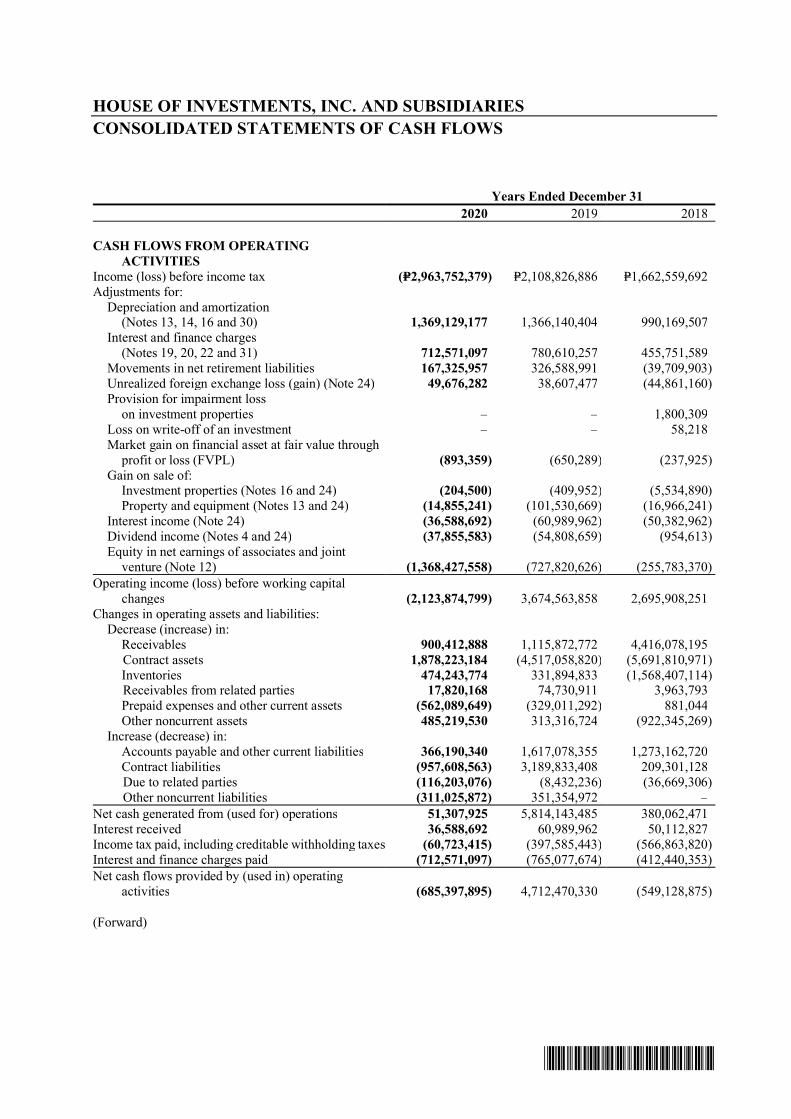
*SGVFSM009820*
HOUSE OF INVESTMENTS, INC. AND SUBSIDIARIESCONSOLIDATED STATEMENTS OF CASH FLOWS
Years Ended December 312020 2019 2018
CASH FLOWS FROM OPERATINGACTIVITIES
Income (loss) before income tax (P=2,963,752,379) P=2,108,826,886 P=1,662,559,692Adjustments for: Depreciation and amortization
(Notes 13, 14, 16 and 30) 1,369,129,177 1,366,140,404 990,169,507 Interest and finance charges
(Notes 19, 20, 22 and 31) 712,571,097 780,610,257 455,751,589Movements in net retirement liabilities 167,325,957 326,588,991 (39,709,903)Unrealized foreign exchange loss (gain) (Note 24) 49,676,282 38,607,477 (44,861,160)
Provision for impairment losson investment properties ‒ ‒ 1,800,309
Loss on write-off of an investment ‒ ‒ 58,218 Market gain on financial asset at fair value through
profit or loss (FVPL) (893,359) (650,289) (237,925)Gain on sale of:
Investment properties (Notes 16 and 24) (204,500) (409,952) (5,534,890)Property and equipment (Notes 13 and 24) (14,855,241) (101,530,669) (16,966,241)
Interest income (Note 24) (36,588,692) (60,989,962) (50,382,962)Dividend income (Notes 4 and 24) (37,855,583) (54,808,659) (954,613)
Equity in net earnings of associates and jointventure (Note 12) (1,368,427,558) (727,820,626) (255,783,370)
Operating income (loss) before working capitalchanges (2,123,874,799) 3,674,563,858 2,695,908,251
Changes in operating assets and liabilities:Decrease (increase) in:
Receivables 900,412,888 1,115,872,772 4,416,078,195Contract assets 1,878,223,184 (4,517,058,820) (5,691,810,971)Inventories 474,243,774 331,894,833 (1,568,407,114)Receivables from related parties 17,820,168 74,730,911 3,963,793Prepaid expenses and other current assets (562,089,649) (329,011,292) 881,044Other noncurrent assets 485,219,530 313,316,724 (922,345,269)
Increase (decrease) in:Accounts payable and other current liabilities 366,190,340 1,617,078,355 1,273,162,720Contract liabilities (957,608,563) 3,189,833,408 209,301,128Due to related parties (116,203,076) (8,432,236) (36,669,306)Other noncurrent liabilities (311,025,872) 351,354,972 ‒
Net cash generated from (used for) operations 51,307,925 5,814,143,485 380,062,471Interest received 36,588,692 60,989,962 50,112,827Income tax paid, including creditable withholding taxes (60,723,415) (397,585,443) (566,863,820)Interest and finance charges paid (712,571,097) (765,077,674) (412,440,353)Net cash flows provided by (used in) operating
activities (685,397,895) 4,712,470,330 (549,128,875)
(Forward)
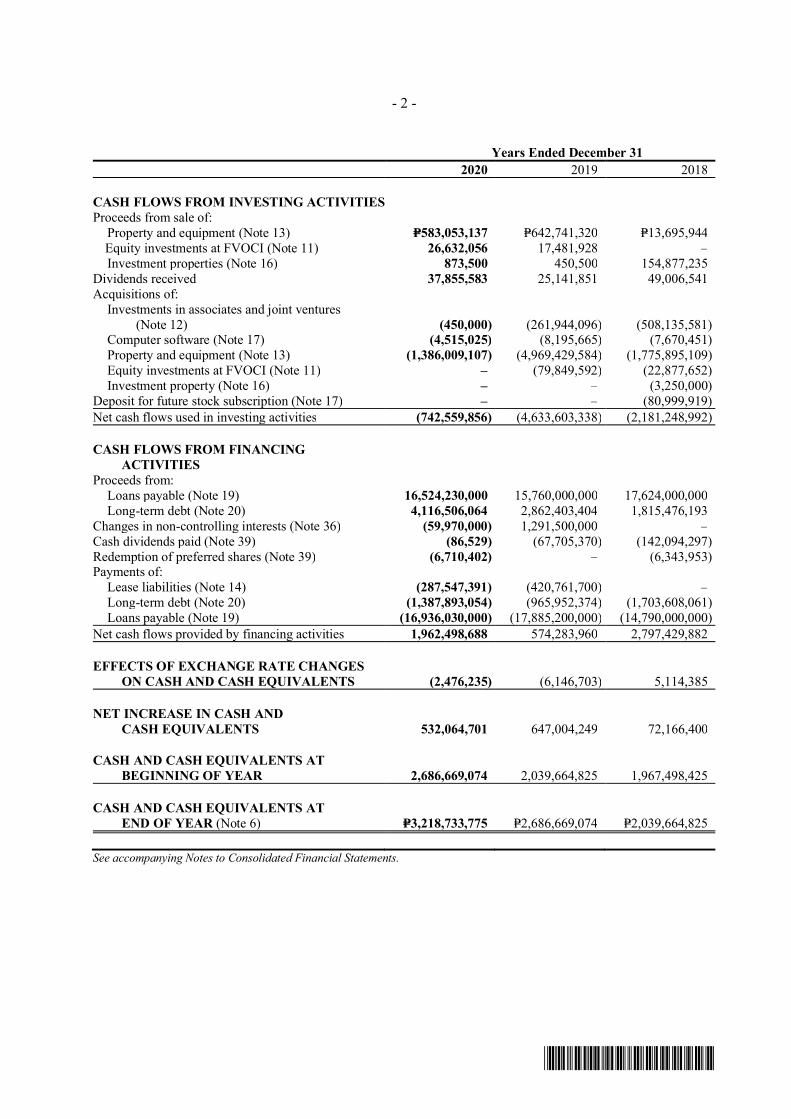
- 2 -
*SGVFSM009820*
Years Ended December 312020 2019 2018
CASH FLOWS FROM INVESTING ACTIVITIESProceeds from sale of:
Property and equipment (Note 13) P=583,053,137 P=642,741,320 P=13,695,944Equity investments at FVOCI (Note 11) 26,632,056 17,481,928 ‒Investment properties (Note 16) 873,500 450,500 154,877,235
Dividends received 37,855,583 25,141,851 49,006,541Acquisitions of: Investments in associates and joint ventures
(Note 12) (450,000) (261,944,096) (508,135,581)Computer software (Note 17) (4,515,025) (8,195,665) (7,670,451)Property and equipment (Note 13) (1,386,009,107) (4,969,429,584) (1,775,895,109)Equity investments at FVOCI (Note 11) ‒ (79,849,592) (22,877,652)Investment property (Note 16) ‒ ‒ (3,250,000)
Deposit for future stock subscription (Note 17) ‒ ‒ (80,999,919)Net cash flows used in investing activities (742,559,856) (4,633,603,338) (2,181,248,992)
CASH FLOWS FROM FINANCINGACTIVITIES
Proceeds from:Loans payable (Note 19) 16,524,230,000 15,760,000,000 17,624,000,000Long-term debt (Note 20) 4,116,506,064 2,862,403,404 1,815,476,193
Changes in non-controlling interests (Note 36) (59,970,000) 1,291,500,000 ‒Cash dividends paid (Note 39) (86,529) (67,705,370) (142,094,297)Redemption of preferred shares (Note 39) (6,710,402) ‒ (6,343,953)Payments of:
Lease liabilities (Note 14) (287,547,391) (420,761,700) ‒Long-term debt (Note 20) (1,387,893,054) (965,952,374) (1,703,608,061)Loans payable (Note 19) (16,936,030,000) (17,885,200,000) (14,790,000,000)
Net cash flows provided by financing activities 1,962,498,688 574,283,960 2,797,429,882
EFFECTS OF EXCHANGE RATE CHANGESON CASH AND CASH EQUIVALENTS (2,476,235) (6,146,703) 5,114,385
NET INCREASE IN CASH ANDCASH EQUIVALENTS 532,064,701 647,004,249 72,166,400
CASH AND CASH EQUIVALENTS ATBEGINNING OF YEAR 2,686,669,074 2,039,664,825 1,967,498,425
CASH AND CASH EQUIVALENTS ATEND OF YEAR (Note 6) P=3,218,733,775 P=2,686,669,074 P=2,039,664,825
See accompanying Notes to Consolidated Financial Statements.

*SGVFSM009820*
HOUSE OF INVESTMENTS, INC. AND SUBSIDIARIESNOTES TO CONSOLIDATED FINANCIAL STATEMENTS
1. Corporate Information and Authorization for Issuance of Consolidated Financial Statements
Corporate InformationHouse of Investments, Inc. (the Parent Company) is a stock corporation incorporated under the lawsof the Republic of the Philippines on May 21, 1959.
The Parent Company and its subsidiaries (collectively known as the Group) are primarily engaged incar dealership, construction, education, afterlife services, consumer finance, property management,project management, security and pharmaceuticals.
The Parent Company’s common stock was listed with the Philippine Stock Exchange (PSE) onJuly 2, 1962, the Parent Company’s initial public offering. The Parent Company’s shares of stock arecurrently traded at the PSE. The ultimate parent company of the Group is Pan Malayan Managementand Investment Corporation (PMMIC), a domestic corporation.
The registered office address and principal place of business of the Parent Company is at 3rd Floor,Grepalife Building, 219 Sen. Gil J. Puyat Avenue, Makati City, Metro Manila. On March 30, 2021,the Philippine Securities and Exchange Commission (SEC) approved its amended Articles ofIncorporation to change its registered office address to its current address from 3rd Floor, GrepalifeBuilding, 219 Sen. Gil J. Puyat Avenue, Makati City, Metro Manila to 9th Floor, Grepalife Building,221 Sen. Gil J. Puyat Avenue, Makati City, Metro Manila.
Authorization for Issuance of Consolidated Financial StatementsThe consolidated financial statements were approved for issuance and filing by the Board of Directors(BOD) on April 30, 2021.
2. Basis of Preparation and Statement of Compliance
Basis of PreparationThe consolidated financial statements of the Group have been prepared under the historical cost basis,except for land, which is carried at revalued amount and financial assets at FVPL, included as part of“Prepaid expenses and other current assets,” and FVOCI which are measured at fair value. Theaccompanying consolidated financial statements are presented in Philippine Peso (Php, P=), which isalso the Parent Company’s functional currency. Except as indicated, all amounts are rounded off tothe nearest peso.
Statement of ComplianceThe consolidated financial statements have been prepared in compliance with Philippine FinancialReporting Standards (PFRSs).
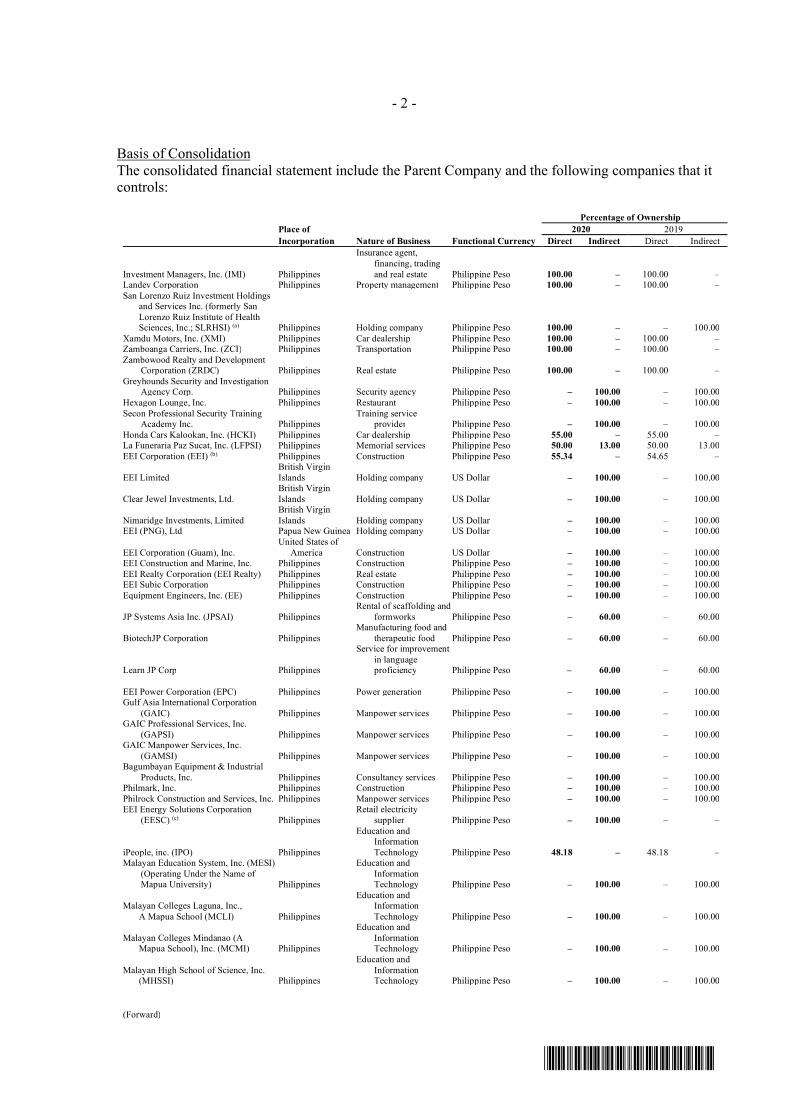
- 2 -
*SGVFSM009820*
Basis of ConsolidationThe consolidated financial statement include the Parent Company and the following companies that itcontrols:
Percentage of OwnershipPlace of 2020 2019Incorporation Nature of Business Functional Currency Direct Indirect Direct Indirect
Investment Managers, Inc. (IMI) Philippines
Insurance agent,financing, tradingand real estate Philippine Peso 100.00 – 100.00 –
Landev Corporation Philippines Property management Philippine Peso 100.00 – 100.00 –San Lorenzo Ruiz Investment Holdings and Services Inc. (formerly San Lorenzo Ruiz Institute of Health
Sciences, Inc.; SLRHSI) (a) Philippines Holding company Philippine Peso 100.00 – – 100.00Xamdu Motors, Inc. (XMI) Philippines Car dealership Philippine Peso 100.00 – 100.00 –Zamboanga Carriers, Inc. (ZCI) Philippines Transportation Philippine Peso 100.00 – 100.00 –Zambowood Realty and Development
Corporation (ZRDC) Philippines Real estate Philippine Peso 100.00 – 100.00 –Greyhounds Security and Investigation
Agency Corp. Philippines Security agency Philippine Peso ‒ 100.00 ‒ 100.00Hexagon Lounge, Inc. Philippines Restaurant Philippine Peso ‒ 100.00 ‒ 100.00Secon Professional Security Training
Academy Inc. PhilippinesTraining service
provider Philippine Peso ‒ 100.00 ‒ 100.00Honda Cars Kalookan, Inc. (HCKI) Philippines Car dealership Philippine Peso 55.00 – 55.00 –La Funeraria Paz Sucat, Inc. (LFPSI) Philippines Memorial services Philippine Peso 50.00 13.00 50.00 13.00EEI Corporation (EEI) (b) Philippines Construction Philippine Peso 55.34 – 54.65 –
EEI LimitedBritish VirginIslands Holding company US Dollar – 100.00 – 100.00
Clear Jewel Investments, Ltd.British VirginIslands Holding company US Dollar – 100.00 – 100.00
Nimaridge Investments, LimitedBritish VirginIslands Holding company US Dollar – 100.00 – 100.00
EEI (PNG), Ltd Papua New Guinea Holding company US Dollar – 100.00 – 100.00
EEI Corporation (Guam), Inc.United States of
America Construction US Dollar – 100.00 – 100.00EEI Construction and Marine, Inc. Philippines Construction Philippine Peso – 100.00 – 100.00EEI Realty Corporation (EEI Realty) Philippines Real estate Philippine Peso – 100.00 – 100.00EEI Subic Corporation Philippines Construction Philippine Peso – 100.00 – 100.00Equipment Engineers, Inc. (EE) Philippines Construction Philippine Peso – 100.00 – 100.00
JP Systems Asia Inc. (JPSAI) PhilippinesRental of scaffolding and
formworks Philippine Peso – 60.00 – 60.00
BiotechJP Corporation PhilippinesManufacturing food and
therapeutic food Philippine Peso – 60.00 – 60.00
Learn JP Corp Philippines
Service for improvementin languageproficiency Philippine Peso – 60.00 – 60.00
EEI Power Corporation (EPC) Philippines Power generation Philippine Peso – 100.00 – 100.00Gulf Asia International Corporation
(GAIC) Philippines Manpower services Philippine Peso – 100.00 – 100.00GAIC Professional Services, Inc.
(GAPSI) Philippines Manpower services Philippine Peso – 100.00 – 100.00GAIC Manpower Services, Inc.
(GAMSI) Philippines Manpower services Philippine Peso – 100.00 – 100.00Bagumbayan Equipment & Industrial
Products, Inc. Philippines Consultancy services Philippine Peso – 100.00 – 100.00Philmark, Inc. Philippines Construction Philippine Peso – 100.00 – 100.00Philrock Construction and Services, Inc. Philippines Manpower services Philippine Peso – 100.00 – 100.00EEI Energy Solutions Corporation
(EESC) (c) PhilippinesRetail electricity
supplier Philippine Peso – 100.00 – –
iPeople, inc. (IPO) Philippines
Education andInformationTechnology Philippine Peso 48.18 – 48.18 –
Malayan Education System, Inc. (MESI)(Operating Under the Name ofMapua University) Philippines
Education andInformationTechnology Philippine Peso ‒ 100.00 ‒ 100.00
Malayan Colleges Laguna, Inc.,A Mapua School (MCLI) Philippines
Education andInformationTechnology Philippine Peso – 100.00 – 100.00
Malayan Colleges Mindanao (AMapua School), Inc. (MCMI) Philippines
Education andInformationTechnology Philippine Peso – 100.00 – 100.00
Malayan High School of Science, Inc.(MHSSI) Philippines
Education andInformationTechnology Philippine Peso – 100.00 – 100.00
(Forward)

- 3 -
*SGVFSM009820*
Percentage of OwnershipPlace of 2020 2019Incorporation Nature of Business Functional Currency Direct Indirect Direct Indirect
Mapua Information Technology Center,Inc. (MITC) Philippines
Education andInformationTechnology Philippine Peso
–
100.00
–
100.00Mapua Techserv, Inc. (MTI) Philippines Consultancy Philippine Peso – 100.00 – 100.00Mapua Techpower Inc. Philippines Consultancy Philippine Peso – 75.00 – 75.00
People eServe Corporation Philippines
Education andInformationTechnology Philippine Peso – 100.00 – 100.00
Pan Pacific Computer Center,Incorporated (PPCCI) Philippines
Education andInformationTechnology Philippine Peso – 100.00 – 100.00
Affordable Private Education Center, Incdoing business under the name ofAPEC Schools (APEC) Philippines
Education andInformationTechnology Philippine Peso – 100.00 – 100.00
National Teachers College doing business under the name/s and style/s of The National Teachers
College Philippines
Education andInformationTechnology Philippine Peso – 99.79 – 99.79
University of Nueva Caceres Philippines
Education andInformationTechnology Philippine Peso – 83.62 – 83.62
AC College of Enterprise andTechnology, Inc Philippines
Education andInformationTechnology Philippine Peso – 100.00 – 100.00
LINC Institite, Inc doing business under the Name and Style of LINC
Academy Philippines
Education andInformationTechnology Philippine Peso – 100.00 – 100.00
(a) Acquired from MESI in December 2020 (Note 13)(b) Purchased additional shares in February 2020(c) On February 14, 2020, EESC was incorporated as a wholly owned subsidiary of EPC. EESC is engaged in the business of a retailelectricity supplier pursuant to Republic Act (RA) No. 9136, otherwise known as Electric Power Industry Reform Act of 2001. EESC’sfinancial reporting period is December 31
The consolidated financial statements are prepared for the same reporting year as the ParentCompany, using consistent accounting policies. All significant intercompany balances andtransactions, including income, expenses and dividends, are eliminated in full. Profits and lossesresulting from intercompany transactions that are recognized in assets are eliminated in full.
The financial statements of the subsidiaries are prepared for the same reporting year as the ParentCompany, using consistent accounting policies.
Control is achieved when the Parent Company is exposed, or has rights to variable returns from itsinvolvement with the investee and has the ability to affect those returns through its power over theinvestee. Specifically, the Parent Company controls an investee if and only if the Parent Companyhas:
power over the investee (i.e. existing rights that give it the current ability to direct the relevantactivities of the investee);
exposure, or rights, to variable returns from its involvement with the investee; and the ability to use its power over the investee to affect its returns.
When the Parent Company has less than a majority of the voting or similar rights of an investee, theParent Company considers all relevant facts and circumstances in assessing whether it has power overan investee, including:
the contractual arrangement with the other vote holders of the investee; rights arising from other contractual arrangements; and the Parent Company’s voting rights and potential voting rights.

- 4 -
*SGVFSM009820*
The Parent Company re-assesses whether or not it controls an investee if facts and circumstancesindicate that there are changes to one or more of the three elements of control. Consolidation of asubsidiary begins when the Parent Company obtains control over the subsidiary and ceases when theParent Company loses control of the subsidiary. Assets, liabilities, income and expenses of asubsidiary acquired or disposed of during the year are included in the consolidated statements ofincome and consolidated statements of comprehensive income from the date the Parent Companygains control until the date the Parent Company ceases to control the subsidiary.
Subsidiaries are fully consolidated from the date of acquisition, being the date on which the ParentCompany obtains control, and continue to be consolidated until the date when such control ceases.
Losses within a subsidiary are attributed to the non-controlling interest until the balance is reduced tonil. A change in the ownership interest of a subsidiary, without a loss of control, is accounted for asan equity transaction. If the Parent Company loses control over a subsidiary, it:
Derecognizes the assets (including goodwill) and liabilities of the subsidiary; Derecognizes the carrying amount of any non-controlling interests; Recognizes the fair value of the consideration received; Recognizes the fair value of any investment retained; Reclassifies to profit or loss, or transfer directly to retained earnings if required by other PFRSs,
the amounts recognized in other comprehensive income in relation to the subsidiary; andrecognizes any resulting difference as a gain or loss in profit or loss attributable to the ParentCompany
Non-controlling interests (NCI) represent the portion of equity not attributable to the ParentCompany. Profit or loss and each component of other comprehensive income (OCI) are attributed tothe equity holders of the Parent Company and to the non-controlling interests, even if this results inthe non-controlling interests having a deficit balance. Non-controlling interests are presentedseparately in the consolidated statements of comprehensive income and within the equity section ofthe consolidated statements of financial position and consolidated statements of changes in equity,separately from the equity attributable to equity holders of the Parent Company.
3. Changes in Accounting Policies and Disclosures
The accounting policies adopted are consistent with those of the previous financial year, except thatthe Group has adopted the following new accounting pronouncements starting January 1, 2020.Adoption of these pronouncements did not have any significant impact on the Group’s financialstatements unless otherwise indicated.
The Group did not early adopt any other standard, interpretation or amendment that has been issuedbut is not yet effective. The adoption of these pronouncements does not have a significant impact onthe Group’s consolidated financial statements unless otherwise indicated.
- 5 -
*SGVFSM009820*
Amendments to PFRS 3, Business Combinations, Definition of a Business
The amendments to PFRS 3 clarify the minimum requirements to be a business, remove theassessment of a market participant’s ability to replace missing elements, and narrow the definitionof outputs. The amendments also add guidance to assess whether an acquired process issubstantive and add illustrative examples. An optional fair value concentration test is introducedwhich permits a simplified assessment of whether an acquired set of activities and assets is not abusiness.
Amendments to PFRS 7, Financial Instruments: Disclosures and PFRS 9, Financial Instruments, Interest Rate Benchmark Reform
The amendments to PFRS 9 provide a number of reliefs, which apply to all hedging relationshipsthat are directly affected by the interest rate benchmark reform. A hedging relationship is affectedif the reform gives rise to uncertainties about the timing and or amount of benchmark-based cashflows of the hedged item or the hedging instrument.
Amendments to PAS 1, Presentation of Financial Statements, and PAS 8, Accounting Policies, Changes in Accounting Estimates and Errors, Definition of Material
The amendments refine the definition of material in PAS 1 and align the definitions used acrossPFRSs and other pronouncements. They are intended to improve the understanding of the existingrequirements rather than to significantly impact an entity’s materiality judgements.
Conceptual Framework for Financial Reporting issued on March 29, 2018
The Conceptual Framework is not a standard, and none of the concepts contained therein overridethe concepts or requirements in any standard. The purpose of the Conceptual Framework is toassist the standard-setters in developing standards, to help preparers develop consistent accountingpolicies where there is no applicable standard in place and to assist all parties to understand andinterpret the standards.
The revised Conceptual Framework includes new concepts, provides updated definitions andrecognition criteria for assets and liabilities and clarifies some important concepts.
Amendments to PFRS 16, COVID-19-related Rent Concessions
The amendments provide relief to lessees from applying the PFRS 16 requirement on leasemodifications to rent concessions arising as a direct consequence of the COVID-19 pandemic. Alessee may elect not to assess whether a rent concession from a lessor is a lease modification if itmeets all of the following criteria:
- The rent concession is a direct consequence of COVID-19;- The change in lease payments results in a revised lease consideration that is substantially the
same as, or less than, the lease consideration immediately preceding the change;- Any reduction in lease payments affects only payments originally due on or before
June 30, 2021; and- There is no substantive change to other terms and conditions of the lease.
The amendments were early adopted by the Group beginning July 1, 2020 and properly reflectedin the consolidated financial statements as at December 31, 2020.

- 6 -
*SGVFSM009820*
The Group as a lessee accounted for COVID-19 related lease concessions (e.g. rent holidays) asnegative variable lease expense in the period when changes in facts and circumstances on whichthe variable lease payments are based occur (Note 14). The amendments did not significantlyimpact the consolidated financial statements as at December 31, 2020.
New Accounting Standards, Interpretations and Amendments Effective Subsequent toDecember 31, 2020Pronouncements issued but not yet effective are listed below. The Group intends to adopt thefollowing pronouncements when they become effective. The adoption of these pronouncements isnot expected to have a significant impact on the Group’s consolidated financial statements unlessotherwise indicated.
Effective beginning on or after January 1, 2021 Amendments to PFRS 9, PFRS 7, PFRS 4 and PFRS 16, Interest Rate Benchmark Reform -
Phase 2
The amendments provide the following temporary reliefs which address the financial reportingeffects when an interbank offered rate (IBOR) is replaced with an alternative nearly risk-freeinterest rate (RFR):o Practical expedient for changes in the basis for determining the contractual cash flows as a
result of IBOR reformo Relief from discontinuing hedging relationshipso Relief from the separately identifiable requirement when an RFR instrument is designated as
a hedge of a risk component
The Group shall also disclose information about:o The nature and extent of risks to which the entity is exposed arising from financial
instruments subject to IBOR reform, and how the entity manages those risks; ando Their progress in completing the transition to alternative benchmark rates, and how the entity
is managing that transition
The amendments are effective for annual reporting periods beginning on or after January 1, 2021and apply retrospectively, however, the Group is not required to restate prior periods. The Groupis still assessing the impact of the amendments to the consolidated financial statements.
Effective beginning on or after January 1, 2022 Amendments to PFRS 3, Reference to the Conceptual Framework
The amendments are intended to replace a reference to the Framework for the Preparation andPresentation of Financial Statements, issued in 1989, with a reference to the ConceptualFramework for Financial Reporting issued in March 2018 without significantly changing itsrequirements. The amendments added an exception to the recognition principle of PFRS 3,Business Combinations to avoid the issue of potential ‘day 2’gains or losses arising for liabilitiesand contingent liabilities that would be within the scope of PAS 37, Provisions, ContingentLiabilities and Contingent Assets or Philippine-IFRIC 21, Levies, if incurred separately.
At the same time, the amendments add a new paragraph to PFRS 3 to clarify that contingentassets do not qualify for recognition at the acquisition date.
The amendments are effective for annual reporting periods beginning on or after January 1, 2022and apply prospectively. The Group is still assessing the impact of the amendments to theconsolidated financial statements.
- 7 -
*SGVFSM009820*
Amendments to PAS 16 , Plant and Equipment: Proceeds before Intended Use
The amendments prohibit entities deducting from the cost of an item of property, plant andequipment, any proceeds from selling items produced while bringing that asset to the location andcondition necessary for it to be capable of operating in the manner intended by management.Instead, an entity recognizes the proceeds from selling such items, and the costs of producingthose items, in profit or loss.
The amendment is effective for annual reporting periods beginning on or after January 1, 2022and must be applied retrospectively to items of property, plant and equipment made available foruse on or after the beginning of the earliest period presented when the entity first applies theamendment.
The amendments are not expected to have a material impact on the Group.
Amendments to PAS 37, Onerous Contracts - Costs of Fulfilling a Contract
The amendments specify which costs an entity needs to include when assessing whether acontract is onerous or loss-making. The amendments apply a “directly related cost approach”.The costs that relate directly to a contract to provide goods or services include both incrementalcosts and an allocation of costs directly related to contract activities. General and administrativecosts do not relate directly to a contract and are excluded unless they are explicitly chargeable tothe counterparty under the contract.
The amendments are effective for annual reporting periods beginning on or after January 1, 2022.The Group will apply these amendments to contracts for which it has not yet fulfilled all itsobligations at the beginning of the annual reporting period in which it first applies theamendments.
The amendments are not expected to have a material impact on the Group.
Annual Improvements to PFRSs 2018-2020 Cycle
o Amendments to PFRS 1, First-time Adoption of Philippines Financial Reporting Standards, Subsidiary as a first-time adopter
The amendment permits a subsidiary that elects to apply paragraph D16(a) of PFRS 1 tomeasure cumulative translation differences using the amounts reported by the parent, basedon the parent’s date of transition to PFRS. This amendment is also applied to an associate orjoint venture that elects to apply paragraph D16(a) of PFRS 1.
The amendment is effective for annual reporting periods beginning on or after January 1,2022 with earlier adoption permitted. The amendments are not expected to have a materialimpact on the Group.
o Amendments to PFRS 9, Financial Instruments, Fees in the ‘10 per cent’ test for derecognition of financial liabilities
The amendment clarifies the fees that an entity includes when assessing whether the terms ofa new or modified financial liability are substantially different from the terms of the originalfinancial liability. These fees include only those paid or received between the borrower andthe lender, including fees paid or received by either the borrower or lender on the other’sbehalf. An entity applies the amendment to financial liabilities that are modified or

- 8 -
*SGVFSM009820*
exchanged on or after the beginning of the annual reporting period in which the entity firstapplies the amendment.
The amendment is effective for annual reporting periods beginning on or after January 1,2022 with earlier adoption permitted. The Group will apply the amendments to financialliabilities that are modified or exchanged on or after the beginning of the annual reportingperiod in which the entity first applies the amendment. The amendments are not expected tohave a material impact on the Group. The Group is still assessing the impact of theamendments to the consolidated financial statements.
Amendments to PAS 41, Agriculture, Taxation in fair value measurements
The amendment removes the requirement in paragraph 22 of PAS 41 that entities excludecash flows for taxation when measuring the fair value of assets within the scope of PAS 41.
An entity applies the amendment prospectively to fair value measurements on or after thebeginning of the first annual reporting period beginning on or after January 1, 2022 withearlier adoption permitted. The amendments are not expected to have a material impact onthe Group.
Effective beginning on or after January 1, 2023 Amendments to PAS 1, Classification of Liabilities as Current or Non-current
The amendments clarify paragraphs 69 to 76 of PAS 1, Presentation of Financial Statements, tospecify the requirements for classifying liabilities as current or non-current. The amendmentsclarify:o What is meant by a right to defer settlemento That a right to defer must exist at the end of the reporting periodo That classification is unaffected by the likelihood that an entity will exercise its deferral righto That only if an embedded derivative in a convertible liability is itself an equity instrument
would the terms of a liability not impact its classification
The amendments are effective for annual reporting periods beginning on or after January 1, 2023and must be applied retrospectively. The Group is currently assessing the impact theamendments will have on current practice and whether existing loan agreements may requirerenegotiation.
PFRS 17, Insurance Contracts
PFRS 17 is a comprehensive new accounting standard for insurance contracts coveringrecognition and measurement, presentation and disclosure. Once effective, PFRS 17 will replacePFRS 4, Insurance Contracts. This new standard on insurance contracts applies to all types ofinsurance contracts (i.e., life, non-life, direct insurance and re-insurance), regardless of the type ofentities that issue them, as well as to certain guarantees and financial instruments withdiscretionary participation features. A few scope exceptions will apply.
The overall objective of PFRS 17 is to provide an accounting model for insurance contracts thatis more useful and consistent for insurers. In contrast to the requirements in PFRS 4, which arelargely based on grandfathering previous local accounting policies, PFRS 17 provides a

- 9 -
*SGVFSM009820*
comprehensive model for insurance contracts, covering all relevant accounting aspects. The coreof PFRS 17 is the general model, supplemented by:
A specific adaptation for contracts with direct participation features (the variable feeapproach)
A simplified approach (the premium allocation approach) mainly for short-duration contracts
PFRS 17 is effective for reporting periods beginning on or after January 1, 2021, withcomparative figures required. Early application is permitted. The amendments are not expectedto have a material impact on the Group.
Deferred Effectivity Amendments to PFRS 10 and PAS 28, Sale or Contribution of Assets between an Investor and its
Associate or Joint Venture
The amendments address the conflict between PFRS 10 and PAS 28 in dealing with the loss ofcontrol of a subsidiary that is sold or contributed to an associate or joint venture. Theamendments clarify that a full gain or loss is recognized when a transfer to an associate or jointventure involves a business as defined in PFRS 3, Business Combinations. Any gain or lossresulting from the sale or contribution of assets that does not constitute a business, however, isrecognized only to the extent of unrelated investors’ interests in the associate or joint venture.
On January 13, 2016, the Financial Reporting Standards Council deferred the original effectivedate of January 1, 2016 of the said amendments until the International Accounting StandardsBoard completes its broader review of the research project on equity accounting that may result inthe simplification of accounting for such transactions and of other aspects of accounting forassociates and joint ventures.
4. Summary of Significant Accounting Policies
Leases - Group as a lessee, Effective starting January 1, 2019
The Group assesses at contract inception whether a contract is, or contains, a lease. That is, if thecontract conveys the right to control the use of an identified asset for a period of time in exchange forconsideration.
Group as a lesseeThe Group applies a single recognition and measurement approach for all leases, except for short-term leases and leases of low-value assets. The Group recognizes lease liabilities to make leasepayments and right-of-use assets representing the right to use the underlying assets.
Right-of-use assetsThe Group recognizes right-of-use assets at the commencement date of the lease. Right-of-use assetsare measured at cost, less any accumulated depreciation and impairment losses, and adjusted for anyremeasurement of lease liabilities. The cost of right-of-use assets includes the amount of leaseliabilities recognized, initial direct costs incurred, and lease payments made at or before thecommencement date ease incentives received.

- 10 -
*SGVFSM009820*
Right-of-use assets are depreciated on a straight-line basis over the shorter of the lease term and theestimated useful lives (EUL) of the assets, as follows:
YearsLand 5 to 66Building 2 to 10
Right-of-use assets are subject to impairment. Refer to the accounting policies in section impairmentof non-financial assets.
Lease liabilitiesAt the commencement date of the lease, the Group recognizes lease liabilities measured at the presentvalue of lease payments to be made over the lease term. The lease payments include fixed payments(including in substance fixed payments) less any lease incentives receivable, variable lease paymentsthat depend on an index or a rate, and amounts expected to be paid under residual value guarantees.The lease payments also include the exercise price of a purchase option reasonably certain to beexercised by the Group and payments of penalties for terminating a lease, if the lease term reflects theGroup exercising the option to terminate. The variable lease payments that do not depend on anindex or a rate are recognized as expense in the period on which the event or condition that triggersthe payment occurs.
Lease liabilities that are expected to be settled for no more than 12 months after reporting period areclassified as current liabilities presented as current portion of lease liabilities. Otherwise, these areclassified as noncurrent liabilities.
In calculating the present value of lease payments, the Group uses the incremental borrowing rate atthe lease commencement date if the interest rate implicit in the lease is not readily determinable.After the commencement date, the amount of lease liabilities is increased to reflect the accretion ofinterest and reduced for the lease payments made. In addition, the carrying amount of lease liabilitiesis remeasured if there is a modification, a change in the lease term, a change in the in-substance fixedlease payments or a change in the assessment to purchase the underlying asset.
Short-term leases and leases of low-value assetsThe Group applies the short-term lease recognition exemption to its short-term leases of machineryand equipment (i.e., those leases that have a lease term of 12 months or less from the commencementdate and do not contain a purchase option). It also applies the leases of low-value assets recognitionexemption to leases of property and equipment that are considered of low value. Lease payments onshort-term leases and leases of low-value assets are recognized as expense on a straight-line basisover the lease term.
Leases - Group as a lessee, Prior to January 1, 2019
Operating LeasesOperating leases represent those leases under which substantially all risks and rewards of ownershipof the leased assets remain with the lessors. Lease receipts (payments) under operating leaseagreements are recognized as income (expense) on a straight-line basis over the term of the lease.
Leases - Group as a lessor
Leases in which the Group does not transfer substantially all the risks and rewards incidental toownership of an asset are classified as operating leases. Rental income arising is accounted for on astraight-line basis over the lease terms and is included in revenue in the statement of profit or loss due

- 11 -
*SGVFSM009820*
to its operating nature. Initial direct costs incurred in negotiating and arranging an operating lease areadded to the carrying amount of the leased asset and recognized over the lease term on the same basisas rental income. Contingent rents are recognized as revenue in the period in which they are earned.
Revenue Recognition
Revenue from contracts with customers is recognized when control of the goods or services aretransferred to the customer at an amount that reflects the consideration to which the Group expects tobe entitled in exchange for those goods or services. The Group has generally concluded that it is theprincipal in its revenue arrangements, because it typically controls the goods or services beforetransferring them to the customer.
Revenue from construction contractsThe Group assessed that there is only one performance obligation for each construction agreementthat it has entered and that revenue arising from such agreements qualify for recognition over timebecause the Group’s performance creates or enhances an asset that the customer controls as the assetis created or enhanced by applying par. 35(b) of PFRS 15. Control of an asset refers to the ability todirect the use of, and obtain substantially all of the remaining benefits from, the asset. The customer,having the ability to specify the design (or any changes thereof) of the asset, controls the asset as it isbeing constructed. Furthermore, the Group builds the asset on the customer’s land (or propertycontrolled by the customer), hence, the customer generally controls any work in progress arising fromthe Group’s performance. The Group also recognized as part of its construction revenue, the effectsof variable considerations arising from various change orders and claims, to the extent that theyreflect the amounts the Group expects to be entitled to and to be received from the customers,provided that it is highly probable that a significant reversal of the revenue recognized in connectionwith these variable considerations will not occur in the future. For unpriced change orders andclaims, the Group uses the “most likely amount” method to predict the amounts the Group expects tobe entitled to and to be received from the customers. The Group updates its estimate of thetransaction price at the end of each reporting period to reflect any changes in circumstances thatwould result to changes in amount of variable consideration.
The Group elected to use the input method to measure the progress of the fulfilment of itsperformance obligation, which is based on the actual costs incurred to date relative to the totalestimated cost to complete the construction projects because there is a direct relationship between theGroup’s effort (i.e., costs incurred) and the transfer of service to the customer. The Group excludesthe effect of any costs incurred that do not contribute to the Group’s performance in transferringcontrol of goods or services to the customer (such as unexpected amounts of wasted materials, laboror other resources) and adjusts the input method for any costs incurred that are not proportionate tothe Group’s progress in satisfying the performance obligation (such as uninstalled materials).
Revenue from sale of goodsRevenue from sale of goods is recognized at a point in time when control of the asset is transferred tothe customer, generally on delivery and acceptance of the inventory item.
Revenue from tuition and other related feesRevenue from tuition fees and other matriculation fees are recognized over time as revenue over thecorresponding school term using the output method (i.e., time lapsed over the service period such assemester or school year, depending on the curriculum registered). Upon enrollment, students havethe option to pay the tuition and other matriculation fees in full or installment.
- 12 -
*SGVFSM009820*
Admission, examination and other fees are recognized as income when examination has been grantedby the school and related services have been provided to the students (at point in time).
Revenue from manpower servicesUnder the Group’s service agreements with its customers, the Group is required to provide manpowerservices (including but not limited to janitorial, messengerial and other allied services). As provisionof these services constitutes a series of distinct good or services that are substantially the same andhave the same pattern of transfer to the customer (i.e., the good or service would be recognized overtime using the same measure of progress), this was treated by the Group as a single performanceobligation. Because the services are simultaneously provided and consumed by the customer, theGroup’s performance obligation to render such services qualifies for revenue recognition over timeby applying par. 35(a) of PFRS 15. The Group recognizes revenue from manpower supply servicesby applying the “right to invoice” practical expedient since the Group’s right to payment is for anamount that corresponds directly with the value to the customer of the Group’s performance to date.
Revenue from power generationThe Group’s power supply agreement with its customer requires the Group to deliver certain units ofelectricity (in kWh) to the customer per month. As delivery of electricity constitutes a series ofdistinct good or services that are substantially the same and have the same pattern of transfer to thecustomer (i.e., the good or service would be recognized over time using the same measure ofprogress), this was treated by the Group as a single performance obligation. Because electricity issimultaneously provided and consumed, the Group’s performance obligation to deliver electricityqualifies for revenue recognition over time by applying par. 35(a) of PFRS 15. The Group recognizesrevenue from power generation by applying the “right to invoice” practical expedient since theGroup’s right to payment is for an amount that corresponds directly with the value to the customer ofthe Group’s performance to date.
Onerous contractsIf the Group has a contract that is onerous, the present obligation under the contract is recognized andmeasured as a provision. However, before a separate provision for an onerous contract is established,the Group recognizes any impairment loss that has occurred on assets dedicated to that contract.An onerous contract is a contract under which the unavoidable costs (i.e., the costs that the Groupcannot avoid because it has the contract) of meeting the obligations under the contract exceed theeconomic benefits expected to be received under it. The unavoidable costs under a contract reflectthe least net cost of exiting from the contract, which is the lower of the cost of fulfilling it and anycompensation or penalties arising from failure to fulfil it. The cost of fulfilling a contract comprisesthe costs that relate directly to the contract (i.e., both incremental costs and an allocation of costsdirectly related to contract activities).
Contract balances arising from revenue with customer contractsReceivablesA receivable represents the Group’s right to an amount of consideration that is unconditional(i.e., only the passage of time is required before payment of the consideration is due).
Contract assetsA contract asset is the right to consideration in exchange for goods or services transferred to thecustomer. If the Group performs by transferring goods or services to a customer before the customerpays consideration or before payment is due, a contract asset is recognized for the earnedconsideration that is conditional.

- 13 -
*SGVFSM009820*
Contract liabilitiesA contract liability is the obligation to transfer goods or services to a customer for which the Grouphas received consideration (or an amount of consideration is due) from the customer. If a customerpays consideration before the Group transfers goods or services to the customer, a contract liability isrecognized when the payment is made or the payment is due (whichever is earlier). Contractliabilities are recognized as revenue when the Group performs under the contract.
The Group presents each contract with customer in the consolidated statement of financial positioneither as a contract asset or a contract liability.
ExpensesExpenses are recognized in the consolidated statement of income when decrease in future economicbenefits related to a decrease in an asset or an increase of a liability has arisen that can be measuredreliably.
Cost of sales and servicesCost of sales is recognized as an expense when the related goods are sold. Cost of services include alldirect materials and labor costs and those indirect costs related to contract performance which arerecognized as incurred.
General and administrative expensesAdministrative expenses constitute costs of administering the business and are expensed as incurred.
Current versus Non-current ClassificationThe Group presents assets and liabilities in statement of financial position based oncurrent/non-current classification. An asset as current when it is:
Expected to be realized or intended to be sold or consumed in normal operating cycle Held primarily for the purpose of trading Expected to be realized within twelve months after the reporting period or Cash and cash equivalent unless restricted from being exchanged or used to settle a liability for at
least 12 months after the reporting period
All other assets are classified as non-current.
A liability is current when:
It is expected to be settled in normal operating cycle It is held primarily for the purpose of trading It is due to be settled within twelve months after the reporting period or There is no unconditional right to defer the settlement of the liability for at least 12 months after
the reporting period
The Group classifies all other liabilities as non-current. Deferred tax assets and deferred tax liabilitiesare classified as non-current assets and liabilities, respectively.
Cash and Cash EquivalentsCash includes cash on hand and in banks. Cash equivalents are short-term, highly liquid investmentsthat are readily convertible to known amounts of cash with original maturities of three (3) months orless from date of placement and that are subject to an insignificant risk of changes in value.

- 14 -
*SGVFSM009820*
Fair Value MeasurementFair value is the price that would be received to sell an asset or paid to transfer a liability in an orderlytransaction between market participants at the measurement date. The fair value measurement isbased on the presumption that the transaction to sell the asset or transfer the liability takes placeeither:
In the principal market for the asset or liability, or In the absence of a principal market, in the most advantageous market for the asset or liability.
The principal or the most advantageous market must be accessible to the Group. The fair value of anasset or a liability is measured using the assumptions that market participants would use when pricingthe asset or liability, assuming that market participants act in their economic best interest.
A fair value measurement of a non-financial asset takes into account a market participant's ability togenerate economic benefits by using the asset in its highest and best use or by selling it to anothermarket participant that would use the asset in its highest and best use.
The Group uses valuation techniques that are appropriate in the circumstances and for whichsufficient data are available to measure fair value, maximizing the use of relevant observable inputsand minimizing the use of unobservable inputs.
All assets and liabilities for which fair value is measured or disclosed in the financial statements arecategorized within the fair value hierarchy, described as follows, based on the lowest level input thatis significant to the fair value measurement as a whole:
Level 1 - quoted (unadjusted) market prices in active markets for identical assets or liabilities; Level 2 - valuation techniques for which the lowest level input that is significant to the fair value
measurement is directly or indirectly observable; and Level 3 - valuation techniques for which the lowest level input that is significant to the fair value
measurement is unobservable.
For assets and liabilities that are recognized in the consolidated financial statements on a recurringbasis, the Group determines whether transfers have occurred between Levels in the hierarchy by re-assessing categorization (based on the lowest level input that is significant to the fair valuemeasurement as a whole) at the end of each reporting period.
For the purpose of fair value disclosures, the Group has determined classes of assets and liabilities onthe basis of the nature, characteristics and risks of the asset or liability and the level of the fair valuehierarchy as explained above.
‘Day 1’ differenceWhere the transaction price in a non-active market is different to the fair value from other observablecurrent market transactions in the same instrument or based on a valuation technique whose variablesinclude only data from observable market, the Group recognizes the difference between thetransaction price and fair value (a ‘Day 1’ difference) in profit or loss, unless it qualifies forrecognition as some other type of asset. In cases where use is made of data which is not observable,the difference between the transaction price and model value is only recognized in profit or loss whenthe inputs become observable or when the instrument is derecognized. For each transaction, theGroup determines the appropriate method of recognizing the ‘Day 1’ difference amount.

- 15 -
*SGVFSM009820*
Financial InstrumentsThe Group recognizes a financial asset or a financial liability in the consolidated statement offinancial position when it becomes a party to the contractual provisions of the instrument. Purchasesor sales of financial assets that require delivery of assets within the time frame established byregulation or convention in the marketplace are recognized on the settlement date. The Groupfollows the settlement date accounting where an asset to be received and liability to be paid arerecognized on the settlement date and derecognition of an asset that is sold and the recognition of areceivable from the buyer are recognized on the settlement date.
Financial Instruments - Initial Recognition and Subsequent Measurement
Initial recognition and measurementFinancial assets are classified, at initial recognition, as subsequently measured at amortized cost, fairvalue through other comprehensive income (OCI), and fair value through profit or loss.
The classification of financial assets at initial recognition depends on the financial asset’s contractualcash flow characteristics and the Group’s business model for managing them. With the exception oftrade receivables that do not contain a significant financing component, the Group initially measuresa financial asset at its fair value plus, in the case of a financial asset not at fair value through profit orloss, transaction costs. Trade receivables that do not contain a significant financing component aremeasured at the transaction price determined under PFRS 15.
In order for a financial asset to be classified and measured at amortized cost or fair value throughOCI, it needs to give rise to cash flows that are ‘solely payments of principal and interest (SPPI)’ onthe principal amount outstanding. This assessment is referred to as the SPPI test and is performed atan instrument level.
The Group’s business model for managing financial assets refers to how it manages its financialassets in order to generate cash flows. The business model determines whether cash flows will resultfrom collecting contractual cash flows, selling the financial assets, or both.
Purchases or sales of financial assets that require delivery of assets within the time frame establishedby regulation or convention in the marketplace are recognized on the settlement date.
Subsequent measurementFor purposes of subsequent measurement, financial assets are classified in four categories: Financial assets at amortized cost (debt instruments) Financial assets at fair value through OCI with recycling of cumulative gains and losses (debt
instruments) Financial assets designated at fair value through OCI with no recycling of cumulative gains and
losses upon derecognition (equity instruments) Financial assets at fair value through profit or loss
Financial assets at amortized cost (debt instruments)The Group measures financial assets at amortized cost if both of the following conditions are met: The financial asset is held within a business model with the objective to hold financial assets in
order to collect contractual cash flows; and The contractual terms of the financial asset give rise on specified dates to cash flows that are
solely payments of principal and interest on the principal amount outstanding
- 16 -
*SGVFSM009820*
Financial assets at amortized cost are subsequently measured using the effective interest (EIR)method and are subject to impairment. Gains and losses are recognized in profit or loss when theasset is derecognized, modified or impaired.
The Group’s financial assets at amortized cost includes Cash and cash equivalents, Receivables andReceivables from related parties.
Financial assets at fair value through profit or lossA financial asset shall be measured at fair value through profit or loss unless it is measured atamortized cost or at fair value through other comprehensive income (OCI). However, an entity maymake an irrevocable election at initial recognition for particular investments in equity instruments thatwould otherwise be measured at fair value through profit or loss to present subsequent changes in fairvalue in OCI.
The Group may, at initial recognition, irrevocably designate a financial asset as measured at fair valuethrough profit or loss if doing so eliminates or significantly reduces a measurement or recognitioninconsistency (sometimes referred to as an ‘accounting mismatch’) that would otherwise arise frommeasuring assets or liabilities or recognizing the gains and losses on them on different bases.
Included in this classification is the peso-denominated investment in UITF in Rizal CommercialBanking Corporation (RCBC) under Prepaid expenses and other current assets account.
Financial assets designated at fair value through OCI (equity instruments)Upon initial recognition, the Group can elect to classify irrevocably its equity investments as equityinstruments designated at fair value through OCI when they meet the definition of equity underPAS 32, Financial Instruments: Presentation, and are not held for trading. The classification isdetermined on an instrument-by-instrument basis.
Gains and losses on these financial assets are never recycled to profit or loss. Dividends arerecognized as other income in the consolidated statement of income when the right of payment hasbeen established, except when the Group benefits from such proceeds as a recovery of part of the costof the financial asset, in which case, such gains are recorded in OCI. Equity instruments designatedat fair value through OCI are not subject to impairment assessment.
The Group elected to classify irrevocably all equity investments other than those classified to fairvalue through profit or loss under this category.
The Group does not have any debt financial assets at fair value through OCI as of December 31, 2020and 2019.
Impairment of financial assetsThe Group recognizes an allowance for expected credit losses (ECLs) for all debt instruments notheld at fair value through profit or loss. ECLs are based on the difference between the contractualcash flows due in accordance with the contract and all the cash flows that the Group expects toreceive, discounted at an approximation of the original effective interest rate. The expected cashflows will include cash flows from the sale of collateral held or other credit enhancements that areintegral to the contractual terms.
ECLs are recognized in two stages. For credit exposures for which there has not been a significantincrease in credit risk since initial recognition, ECLs are provided for credit losses that result fromdefault events that are possible within the next 12-months (a 12-month ECL). For those creditexposures for which there has been a significant increase in credit risk since initial recognition, a lossallowance is required for credit losses expected over the remaining life of the exposure, irrespectiveof the timing of the default (a lifetime ECL).

- 17 -
*SGVFSM009820*
For trade receivables and contract assets, the Group applies a simplified approach in calculatingECLs. Therefore, the Group does not track changes in credit risk, but instead recognizes a lossallowance based on lifetime ECLs at each reporting date. The loss allowance was adjusted forforward-looking factors specific to the debtors and the economic environment.
For other debt financial assets, the ECL is based on the 12-month ECL. The 12-month ECL is theportion of lifetime ECLs that results from default events on a financial instrument that are possiblewithin 12 months after the reporting date. However, when there has been a significant increase incredit risk since origination, the allowance will be based on the lifetime ECL.
The Group generally considers a financial asset in default when contractual payments are 90 dayspast due. For a financial asset that arises from long-term construction contracts, the Group considersthe asset to be in default if contractual payments are not settled within 30 days from the completion ofthe construction project. However, in certain cases, the Group may also consider a financial asset tobe in default when internal or external information indicates that the Group is unlikely to receive theoutstanding contractual amounts in full before taking into account any credit enhancements held bythe Group. A financial asset is written off when there is no reasonable expectation of recovering thecontractual cash flows.
Financial LiabilitiesThe accounting for the Group’s financial liabilities remains the same as it was under PAS 39. TheGroup initially measures a financial liability at its fair value plus, in the case of a financial liabilitynot at fair value through profit or loss, transaction costs. The Group has no financial liabilities atFVPL.
Subsequent to initial recognition, the Group’s financial liabilities are carried at amortized cost.Amortized cost is calculated by taking into account any discount or premium on acquisition and feesor costs that are an integral part of the EIR. The EIR amortization is included as finance costs in theconsolidated statement of income. Gains and losses are recognized in profit or loss when theliabilities are derecognized as well as through the EIR amortization process.
This category generally applies to the Group’ accounts payable and other current liabilities, loanspayable, long-term debt, due to related parties and lease liabilities.
Derecognition of Financial InstrumentsFinancial assetsA financial asset (or, where applicable a part of a financial asset or part of a group of similar financialassets) is derecognized when: (a) the rights to receive cash flows from the asset have expired; or (b)the Group has transferred its rights to receive cash flows from the asset or has assumed an obligationto pay them in full without material delay to a third party under a“pass-through” arrangement; and either (i) has transferred substantially all the risks and rewards ofthe asset, or (ii) has neither transferred nor retained substantially all the risks and rewards of the asset,but has transferred control of the asset.
Where the Group has transferred its rights to receive cash flows from an asset and has neithertransferred nor retained substantially all the risks and rewards of the asset nor transferred control ofthe asset, the asset is recognized to the extent of the Group’s continuing involvement in the asset.Continuing involvement that takes the form of a guarantee over the transferred asset is measured atthe lower of the original carrying amount of the asset and the maximum amount of consideration thatthe Group could be required to repay.

- 18 -
*SGVFSM009820*
Financial liabilitiesA financial liability is derecognized when the obligation under the liability is discharged or cancelledor has expired. Where an existing financial liability is replaced by another from the same lender onsubstantially different terms, or the terms of an existing liability are substantially modified, such anexchange or modification is treated as a derecognition of the original liability and the recognition of anew liability, and the difference in the respective carrying amounts is recognized in the consolidatedstatement of income.
Offsetting of Financial InstrumentsFinancial assets and financial liabilities are offset and the net amount is reported in the consolidatedstatements of financial position if there is a currently enforceable legal right to set off the recognizedamounts and there is intention to settle on a net basis, or to realize the asset and settle the liabilitysimultaneously. The Group assesses that it has a currently enforceable right of offset if the right isnot contingent on a future event, and is legally enforceable in the normal course of business, event ofdefault, and event of insolvency or bankruptcy of the Group and all of the counterparties.
InventoriesInventories are valued at the lower of cost and net realizable value (NRV). NRV is the selling pricein the ordinary course of business, less the estimated costs of completion of inventories and theestimated costs necessary to sell.
Cost includes purchase price and other costs directly attributable to its acquisition such as non-refundable taxes, handling and transportation cost.
The cost of real estate inventories includes (a) land cost; (b) freehold and leasehold rights for land;(c) amounts paid to contractors for construction; (d) borrowing costs, planning and design cost, costof site preparation, professional fees, property taxes, construction overheads and other related costs.
Cost of inventories is generally determined primarily using the moving-average method, except forautomotive units of the car dealerships and real estate inventories of EEI Realty, which are accountedfor using the specific identification method.
NRV is the estimated selling price in the ordinary course of the business less the estimated costsnecessary to make the sale.
Prepaid ExpensesThese are recorded as asset before they are utilized and apportioned over the period covered by thepayment and charged to the appropriate account in the consolidated statement of income whenincurred.
Advances to Suppliers and SubcontractorsAdvances to suppliers and subcontractors represent advance payment for the purchase of variousconstruction materials and machineries and equipment and down payment to subcontractors for thecontract work to be performed.
Value-Added Tax (VAT)Revenues, expenses, and assets are recognized net of the amount of VAT, if applicable.

- 19 -
*SGVFSM009820*
When VAT from sales of goods and/or services (output VAT) exceeds VAT passed on frompurchases of goods or services (input VAT), the excess is recognized as payable in the consolidatedstatement of financial position. When VAT passed on from purchases of goods or services (inputVAT) exceeds VAT from sales of goods and/or services (output VAT), the excess is recognized as anasset in the consolidated statement of financial position up to the extent of the recoverable amount.
Other Current AssetsOther current assets pertain to other resources controlled by the Group as a result of past events andfrom which future economic benefits are expected to flow to the Group within the reporting period.
Investments in Associates and Joint VentureAn associate is an entity in which the Group has significant influence. A joint venture is a jointarrangement whereby the parties that have joint control of the arrangement have rights to the netassets of the arrangement.
Investments in associates and joint venture are accounted for using the equity method of accounting.Under this method, the investment amount is increased or decreased to recognize the Group’s share inthe profit or loss of the investee after the date of acquisition. Dividends received from the investeereduces the carrying amount of the investment. Adjustments to the carrying amount may also benecessary for changes in the Group’s proportionate interest in the investee arising from changes in theinvestee’s other comprehensive income.
Gains and losses resulting from ‘upstream’ and ‘downstream’ transactions between the Group and itsassociate or joint venture are recognized in the consolidated financial statements only to the extent ofunrelated investors’ interests in the associate or joint venture.
The reporting dates and the accounting policies of the associates and joint venture conform to thoseused by the Group for like transactions and events in similar circumstances.
The Group discontinues applying the equity method when their investment in investee company isreduced to zero. Accordingly, additional losses are not recognized unless the Group has guaranteedcertain obligations of the investee company. When the investee company subsequently reports netincome, the Group will resume applying the equity method but only after its share of that net incomeequals the share of net losses not recognized during the period the equity method was suspended.
The reporting dates of the investee company and the Group are identical and the investee companies’accounting policies conform to those used by the Group for like transactions and events in similarcircumstances.
After application of the equity method, the Group determines whether it is necessary to recognize anadditional impairment loss on the Group’s investment in its associates and joint venture. The Groupdetermines at each reporting date whether there is any objective evidence that the investment in theassociates and joint venture is impaired. If this is the case the Group calculates the amount ofimpairment as the difference between the recoverable amount of the associate and its carrying valueand recognizes the impairment loss in the consolidated statement of income.
Upon loss of significant influence over the associate, the Group measures and recognizes anyretaining investment at its fair value. Any difference between the carrying amount of the associatesor joint venture upon loss of significant influence and the fair value of the retaining investment andproceeds from disposal is recognized in the consolidated statement of income.
- 20 -
*SGVFSM009820*
The Group’s associates and joint venture accounted for using the equity method as of December 31follows:
Place of Functional Percentage of OwnershipIncorporation Nature of Business Currency 2020 2019
Associates: Hi-Eisai Pharmaceutical, Inc.
(HEPI) Philippines Pharmaceutical Philippine peso 50.00 50.00 Petroenergy Resources Corporation
(PERC) (a) Philippines Renewable energy Philippine peso 29.10 29.10 T’boli Agro-Industrial Development, Inc. Philippines Agriculture Philippine peso 28.47 28.47 Manila Memorial Park Cemetery,
Inc. (MMPC) Philippines Funeral service Philippine peso 25.98 25.98Sojitz G Auto Philippines
Corporation (SGAPC) PhilippinesAutomotivedistributor Philippine peso 20.00 20.00
RCBC Realty Corporation (RRC) Philippines Realty Philippine peso 10.00 10.00 Al-Rushaid Construction Company
Limited (ARCC) Saudi Arabia Construction Saudi riyal 49.00 49.00 PetroSolar Corporation (PSOC) Philippines Renewable energy Philippine peso 44.00 44.00Joint venture:
PetroWind Energy, Inc. (PWEI) Philippines Renewable energy Philippine peso 20.00 20.00Shinbayanihan Heavy Equipment
Corporation (SHEC) Philippines Equipment rental Philippine peso 40.00 40.00 BEO Distribution and Marketing
Corporation (BEO DMC) (b) PhilippinesDistribution andmarketing Philippine peso 30.00 –
Shimizu-Fujita-Takenaka-EEI Joint Venture (SFTE) (b)
PhilippinesConstruction Philippine peso 5.00 –
Acciona-EEI Joint Venture (AE) (b) Philippines Construction Philippine peso 30.00 –
(a) Effective ownership in PERC is 32.24% after considering the Group’s 10% indirect investment in PetroGreen Energy Corporation (PGEC), a 90%-ownedsubsidiary of PERC (Note 12)(b) Entered into in 2020
Property and EquipmentProperty and equipment, except for land, are stated at cost, less accumulated depreciation,amortization and impairment loss, if any. The initial cost of property and equipment consists of itspurchase price, including import duties, taxes and any directly attributable costs of bringing the assetto its working condition and location for its intended use. Expenditures incurred after the assets havebeen put into operation, such as repairs and maintenance, are normally charged to operations in theperiod in which the costs are incurred. In situations where it can be clearly demonstrated that theexpenditures have resulted in an increase in the future economic benefits expected to be obtainedfrom the use of an item of property and equipment beyond its originally assessed standard ofperformance, the expenditures are capitalized as an additional cost of property and equipment. Whenassets are retired or otherwise disposed of, the cost and the related accumulated depreciation areremoved from the accounts and any resulting gain or loss is reflected as part of current operations.
Depreciation is computed using the straight-line method over the following average EUL:
YearsBuildings and improvements 5 to 40Machinery, tools and construction equipment 2 to 20Transportation and service equipment 5Furniture, fixtures and office equipment 3 to 10
Amortization of improvements is computed over the EUL of the improvement or term of the lease,whichever is shorter.

- 21 -
*SGVFSM009820*
The useful lives and depreciation method are reviewed periodically to ensure that the period andmethod of depreciation are consistent with the expected pattern of economic benefits from items ofproperty and equipment.
Minor repairs and maintenance costs are charged to consolidated statement of income as incurred;significant renewals and betterments are capitalized. When assets are retired or otherwise disposedof, the cost or revalued amount, appraisal increase and related accumulated depreciation andamortization are removed from the accounts and any resulting gains or losses are reflected in theconsolidated statement of income.
Construction in progress represents property and equipment under construction and is stated at cost.This includes cost of construction, plant and equipment and other direct costs. Construction inprogress is not depreciated until such time that the relevant assets are completed and put intooperational use.
An item of property and equipment is derecognized upon disposal or when no future economicbenefits are expected from its use or disposal. Any gain or loss arising on derecognition of the asset(calculated as the difference between the net disposal proceeds and the carrying amount of the asset)is included in the consolidated statement of income in the year the asset is derecognized.
Land is carried at its revalued amount. The appraised values used for revaluation were determined byan independent firm of appraisers.
The initial cost of land consists of its purchase price and directly attributable costs of bringing theasset to its working condition and location for its intended use.
The appraisal increment (net of deferred tax) resulting from the revaluation is credited to OCI andaccumulated in equity under “revaluation increment on land - net” account. Decreases in valuation ischarged to profit or loss, except to the extent that it reverses the existing accumulated revaluationincrement on the same asset and therefore such decrease is recognized in OCI. The decreaserecognized in OCI reduces the revaluation increment on land - net account in equity. In case asubsequent revaluation increase of an asset reverses a revaluation decrease previously recognized inprofit or loss, such increase is credited to income in profit or loss.
The same rules apply to impairment losses. An impairment loss on a revalued asset is first used toreduce the revaluation increment for that asset. Only when the impairment loss exceeds the amountin the revaluation increment for that same asset is any further impairment loss recognized in profit orloss.
Upon disposal of land, any revaluation reserve relating to the particular asset being sold is transferredto retained earnings.
The asset’s residual values, useful lives and methods of depreciation and amortization are reviewed,and adjusted if appropriate, at each financial year-end.
Investment PropertiesInvestment properties are measured at cost less accumulated depreciation and impairment loss, if any,including transaction costs. The carrying amount includes the cost of replacing part of an existinginvestment property at the time that cost is incurred if the recognition criteria are met. Investmentproperties are depreciated on a straight-line basis over its estimated useful life of fifteen (15) totwenty years (20). Subsequent to initial recognition, investment properties are stated at cost lessaccumulated depreciation and any impairment in value.

- 22 -
*SGVFSM009820*
Investment properties are derecognized when they either have been disposed of or when theinvestment property is permanently withdrawn from use and no future economic benefit is expectedfrom its disposal. Any gains or losses on the retirement or disposal of an investment property arerecognized in the consolidated statement of income in the year of retirement or disposal.
Transfers are made to investment property when there is a change in use, evidenced by ending ofowner-occupation, commencement of an operating lease to another party or ending of construction ordevelopment. Transfers are made from investment property when there is a change in use, evidencedby commencement of owner-occupation or commencement of development with a view to sale.
For a transfer from owner-occupied property to investment property, the deemed cost for subsequentaccounting is the fair value at the date of change in use. Upon transfer of an asset accounted forunder revaluation model to asset accounted for under cost model, any revaluation reserve relating tosuch particular asset is transferred to retained earnings.
Software CostsSoftware costs are stated at cost less accumulated amortization and any impairment in value. Costsrelated to software purchased by the Group for use in the operations are amortized on a straight-linebasis over a period of three (3) years.
Costs associated with developing and maintaining computer software programs are recognized as anexpense when incurred. Costs that are directly associated with identifiable and unique softwarecontrolled by the Group and will generate economic benefits exceeding costs beyond one year, arerecognized as intangible assets to be measured at cost less accumulated amortization and provisionfor impairment losses, if any.
Impairment of Nonfinancial AssetsFor investments in associate and joint venture, property and equipment, right-of-use asset, investmentproperties and computer software costs, the Group assesses at each reporting date whether there is anindication that an asset may be impaired. If any such indication exists, or when annual impairmenttesting for an asset is required, the Group makes an estimate of the asset’s recoverable amount. Anassets’ recoverable amount is the higher of an asset’s or cash-generating unit’s fair value less costs tosell and its value in use and is determined for an individual asset, unless the asset does not generatecash inflows that are largely independent of those from other assets or groups of assets. Where thecarrying amount of an asset exceeds its recoverable amount, the asset is considered impaired and iswritten down to its recoverable amount. In assessing value in use, the estimated future cash flows arediscounted to their present value using pre-tax discount rate that reflects current market assessment ofthe time value of money and the risks specific to the asset.
An assessment is made at each reporting date as to whether there is any indication that previouslyrecognized impairment losses may no longer exist or may have decreased. If such indication exists,the recoverable amount is estimated. A previously recognized impairment loss is reversed only ifthere has been a change in the estimates used to determine the asset’s recoverable amount since thelast impairment loss was recognized. If that is the case, the carrying amount of the asset is increasedto its recoverable amount. That increased amount cannot exceed the carrying amount that would havebeen determined, net of depreciation, had no impairment loss been recognized for the asset in prioryears. Such reversal is recognized in the consolidated statement of income.
Impairment losses are recognized in the consolidated statement of income in those expense categoriesconsistent with the function of the impaired asset, except for property previously revalued where therevaluation was taken to equity. In this case, the impairment is also recognized in equity up to theamount of any previous revaluation.

- 23 -
*SGVFSM009820*
Business Combination and GoodwillBusiness combinations are accounted for using the acquisition method. The cost of an acquisition ismeasured as the aggregate of the consideration transferred, measured at acquisition date fair value andthe amount of any non-controlling interest in the acquiree. For each business combination, theacquirer measures the non-controlling interest in the acquiree either at fair value or at theproportionate share of the acquiree’s identifiable net assets.
When the Group acquires a business, it assesses the financial assets and liabilities assumed forappropriate classification and designation in accordance with the contractual terms, economiccircumstances and pertinent conditions as at the acquisition date. This includes the separation ofembedded derivatives in host contracts by the acquiree.
Any contingent consideration to be transferred by the acquirer will be recognized at fair value at theacquisition date. Subsequent changes to the fair value of the contingent consideration which isdeemed to be an asset or liability will be recognized in accordance with PAS 39 either in profit or lossor as a change to OCI. If the contingent consideration is classified as equity, it should not beremeasured until it is finally settled within equity.
PFRS 3 provides that if the initial accounting for a business combination can be determined onlyprovisionally by the end of the period in which the combination is effected because either the fairvalues to be assigned to the acquiree’s identifiable assets, liabilities or contingent liabilities or the costof the combination can be determined only provisionally, the acquirer shall account for thecombination using those provisional values. The acquirer shall recognize any adjustments to thoseprovisional values as a result of completing the initial accounting within twelve months of theacquisition date as follows: (i) the carrying amount of the identifiable asset, liability or contingentliability that is recognized or adjusted as a result of completing the initial accounting shall becalculated as if its fair value at the acquisition date had been recognized from that date; (ii) goodwillor any gain recognized shall be adjusted by an amount equal to the adjustment to the fair value at theacquisition date of the identifiable asset, liability or contingent liability being recognized or adjusted;and (iii) comparative information presented for the periods before the initial accounting for thecombination is complete shall be presented as if the initial accounting has been completed from theacquisition date.
Goodwill is initially measured at cost being the excess of the aggregate of the considerationtransferred and the amount recognized for non-controlling interest over the net identifiable assetsacquired and liabilities assumed. If this consideration is lower than the fair value of the net assets ofthe subsidiary acquired, the difference is recognized in profit or loss. Before recognizing a gain on abargain purchase, the Group assesses whether it has correctly identified all of the assets acquired anall of the liabilities assumed, and recognize any additional assets or liabilities that are identified inthat review.
Following initial recognition, goodwill is measured at cost less any accumulated impairment loss.Goodwill is reviewed for impairment, annually or more frequently if events or changes incircumstances indicate that the carrying value may be impaired. For purposes of impairment testing,goodwill acquired in a business combination is, from the acquisition date, allocated to each of theGroup’s CGUs, or groups of CGUs, that are expected to benefit from the synergies of thecombination, irrespective of whether other assets or liabilities of the Group are assigned to those unitsor groups of units.

- 24 -
*SGVFSM009820*
Each unit or group of units to which the goodwill is allocated should:
represent the lowest level within the Group at which the goodwill is monitored for internalmanagement purposes; and
not be larger than an operating segment determined in accordance with PFRS 8, OperatingSegments
Impairment is determined by assessing the recoverable amount of the CGU (or group of CGUs), towhich the goodwill relates. Where the recoverable amount of the CGU (or group of CGUs) is lessthan the carrying amount, an impairment loss is recognized. Where goodwill forms part of a CGU (orgroup of CGUs) and part of the operation within that unit is disposed of, the goodwill associated withthe operation disposed of is included in the carrying amount of the operation when determining thegain or loss on disposal of the operation. Goodwill disposed of in these circumstances is measuredbased on the relative values of the operation disposed of and the portion of the CGU retained. If theacquirer’s interest in the net fair value of the identifiable assets, liabilities and contingent liabilitiesexceeds the cost of the business combination, the acquirer shall recognize immediately in theconsolidated statement of income any excess remaining after reassessment.
Foreign Currency-denominated Transaction and TranslationThe consolidated financial statements are presented in Philippine Peso. Each entity in the Groupdetermines its own functional currency and items included in the consolidated financial statements ofeach entity are measured using that functional currency.
Transactions in foreign currencies are initially recorded in the functional currency rate at the date ofthe transaction. Monetary assets and liabilities denominated in foreign currencies are retranslated atthe functional currency closing rate at the reporting date. All differences are taken to consolidatedstatement of income. Non-monetary items that are measured in terms of historical cost in foreigncurrency are translated using the exchange rates as at the dates of initial transactions. Non-monetaryitems measured at fair value in a foreign currency are translated using the exchange rates at the datewhen the fair value was determined.
As at reporting date, the assets and liabilities of subsidiaries whose functional currency is not thePhilippines Peso are translated into the presentation currency of the Parent Company (the PhilippinePeso) at the closing rate as at the reporting date, and the consolidated statement of income accountsare translated at monthly weighted average exchange rate. Likewise, the the financials of the Group’sassociate whose functional currency is not the Philippine Peso that is accounted for under equitymethod are translated to the presentation currency of the Parent Company in a similar manner. Theexchange differences arising on the translation are taken directly to a separate component of equityunder “Cumulative translation adjustments” account.
Upon disposal of a foreign subsidiary, the deferred cumulative amount recognized in othercomprehensive income relating to that particular foreign operation is recognized in the consolidatedstatement of income.
Retirement CostDefined benefit planThe defined benefit liability or asset is the aggregate of the present value of the defined benefitobligation at the end of the reporting period reduced by the fair value of plan assets, if any, adjustedfor any effect of limiting a net defined benefit asset to the asset ceiling. The asset ceiling is thepresent value of any economic benfits available in the form or refunds from the plan or reduction inthe future contributions to the plan.
- 25 -
*SGVFSM009820*
Defined benefit costs on the Group’s defined benefit retirement plan are actuarially computed usingthe projected unit credit (PUC) valuation method. Under this method, the current service cost is thepresent value of retirement benefits payable in the future with respect to the services rendered in thecurrent period.
Defined benefit costs comprise the following:(a) service cost;(b) net interest on the net defined benefit liability or asset; and(c) remeasurements of net defined benefit liability or asset.
Service costs which include current service costs, past service costs and gains or losses on non-routine settlements are recognized as expense in profit or loss. Past service costs are recognizedwhen plan amendment or curtailment occurs.
Net interest on the net defined benefit liability or asset is the change during the period in the netdefined benefit liability or asset that arises from the passage of time which is determined by applyingthe discount rate based on government bonds to the net defined benefit liability or asset. Net intereston the net defined benefit liability or asset is recognized as expense or income in profit or loss.Remeasurements comprising actuarial gains and losses, return on plan assets and any change in theeffect of the asset ceiling (excluding net interest on defined benefit liability) are recognizedimmediately in OCI in the period in which they arise. Remeasurements are not reclassified to profitor loss in subsequent periods.
Plan assets are assets that are held by a long-term employee benefit fund or qualifying insurancepolicies. Plan assets are not available to the creditors of the Group, nor can they be paid directly tothe Group. Fair value of plan assets is based on market price information. When no market price isavailable, the fair value of plan assets is estimated by discounting expected future cash flows using adiscount rate that reflects both the risk associated with the plan assets and the maturity or expecteddisposal date of those assets (or, if they have no maturity, the expected period until the settlement ofthe related obligations).
The Group’s right to be reimbursed of some or all of the expenditure required to settle a definedbenefit obligation is recognized as a separate asset at fair value when and only when reimbursement isvirtually certain.
Income TaxCurrent taxCurrent tax assets and liabilities for the current and prior periods are measured at the amount expectedto be recovered from or paid to the taxation authorities. The tax rates and the tax laws used tocompute the amount are those that are enacted or substantially enacted by the end of the financialreporting date.
Deferred taxDeferred tax is provided using the liability method on temporary differences at the reporting datebetween the tax bases of assets and liabilities and their carrying amounts for financial reportingpurposes.
Deferred tax liabilities are recognized for all taxable temporary differences, including assetrevaluations. Deferred income tax assets are recognized for all deductible temporary differences,carryforward of unused tax credits from excess minimum corporate income tax (MCIT) over regularcorporate income tax (RCIT), net operating loss carryover (NOLCO), to the extent that it is probable

- 26 -
*SGVFSM009820*
that taxable profit will be available against which the deductible temporary differences andcarryforward of unused MCIT and NOLCO can be utilized.
Deferred tax liabilities are not provided on non-taxable temporary differences associated withinvestments in domestic subsidiaries, associate and interest in joint venture. With respect toinvestments in foreign subsidiaries, associate and interest in joint venture, deferred tax liabilities arerecognized except where the timing of the reversal of the temporary differences can be controlled andit is probable that the temporary differences will not reverse in the foreseeable future.
The carrying amount of deferred tax assets is reviewed by the end of each financial reporting date andreduced to the extent that it is no longer probable that sufficient taxable profit will be available toallow all or part of the deferred tax asset to be used. Unrecognized deferred tax assets are reassessedat the end of each financial reporting date and are recognized to the extent that it has become probablethat future taxable profit will be available to allow the deferred tax assets to be recovered.
Deferred tax assets and liabilities are measured at the tax rates that are expected to apply in the yearwhen the asset is realized or the liability is settled, based on tax rates (and tax laws) that have beenenacted or substantially enacted by the end of the financial reporting date.
Deferred tax relating to items recognized outside profit or loss are recognized in correlation to theunderlying transactions either in other comprehensive income or directly in equity.
Deferred tax assets and deferred tax liabilities are offset, if a legally enforceable right exists to set offcurrent income tax assets against current income tax liabilities and deferred income taxes relate to thesame entity and the same taxation authority.
Basic and Diluted Earnings Per Share (EPS)Basic EPS is computed by dividing net income for the year attributable to equity holders of the ParentCompany adjusted for the after-tax amounts of dividends on preferred stock by the weighted averagenumber of common stock outstanding during the year, after giving retroactive effect for any stockdividends, stock splits or reverse stock splits.
Diluted EPS is computed by adjusting the net income attributable to ordinary equity holders of theParent Company to reflect any changes from dilutive potential shares divided by the weightedaverage number of common stock outstanding during the year after giving retroactive effect for anystock dividends, stock splits or reverse stock splits and adjusted for the effects of all dilutive potentialcommon stock.
The calculation of diluted EPS does not assume conversion, redemption, exercise, or other issue ofpotential ordinary shares that would have an antidilutive effect on earnings per share. Potentialordinary shares are antidilutive when their conversion to ordinary shares would increase earnings pershare or decrease loss per share. As there are no potential dilutive ordinary shares, basic and dilutedEPS are stated at the same amount.
ProvisionsProvisions are recognized when: (a) the Group has a present obligation (legal or constructive) as aresult of a past event; (b) it is probable that an outflow of resources embodying economic benefitswill be required to settle the obligation; and (c) a reliable estimate can be made of the amount of theobligation. If the effect of the time value of money is material, provisions are discounted using acurrent pre-tax rate that reflects, where appropriate, the risks specific to the liability. Wherediscounting is used, the increase in the provision due to the passage of time is recognized as a financecost.
- 27 -
*SGVFSM009820*
ContingenciesContingent liabilities are not recognized in the consolidated financial statements. They are disclosedunless the possibility of an outflow of resources embodying economic benefits is remote. Contingentassets are not recognized in the consolidated financial statements but disclosed when an inflow ofeconomic benefits is probable.
Stock Option PlanNo benefit expense is recognized relative to the shares issued under the stock options plan. When theshares related to the stock option plans are subscribed, these are treated as capital stock issuances.The stock option plan is exempt from PFRS 2, Share-based Payment.
Segment ReportingThe Group’s operating business are organized and managed separately according to the nature ofservices provided, with each segment representing a strategic business unit that offers differentproducts and serves different markets. Financial information on business segments is presented inNote 37.
Capital StockThe Group records common stocks at par value and additional paid-in capital in excess of the totalcontributions received over the aggregate par values of the equity shares. Incremental costs incurreddirectly attributable to the issuance of new shares are shown in equity as a deduction from proceeds,net of tax. When the Group purchases the Group’s capital stock (treasury shares), the considerationpaid, including any attributable incremental costs, is deducted from equity attributable to the Group’sequity holders until the shares are cancelled, reissued or disposed of. Where such shares aresubsequently sold or reissued, any consideration received, net of any directly attributable incrementaltransaction costs and the related tax effects is included in equity (Note 39).
Equity ReserveEquity reserve consist of equity transactions other than capital contributions, such as equitytransactions arising from transactions with NCI.
Retained EarningsRetained earnings represent accumulated earnings of the Group and any adjustment arising fromapplication of new accounting standards, policies or corrections of errors applied retroactively lessdividends declared. It includes the accumulated equity in undistributed earnings of consolidatedsubsidiaries which are not available for dividends until declared by subsidiaries. Appropriatedretained earnings are those that are restricted for planned investments and business expansion.Unappropriated retained earnings are those that can be allocated for specific purposes and can bedistributed as dividend. Retained earnings are further restricted for the payment of dividends to theextent of the cost of treasury shares (Note 40).
Events After the Financial Reporting DatePost year-end events that provide additional information about the Group’s position at the end of thefinancial reporting date (adjusting events) are reflected in the consolidated financial statements. Postyear-end events that are not adjusting events are disclosed in the notes to consolidated financialstatements when material.

- 28 -
*SGVFSM009820*
5. Significant Accounting Judgments and Estimates
The preparation of the consolidated financial statements in compliance with PFRSs requires theGroup to make judgments, estimates and assumptions that affect the reported amounts of assets,liabilities, income and expenses and disclosure of contingent assets and contingent liabilities. Futureevents may occur which can cause the assumptions used in arriving at those estimates to change. Theeffects of any changes in estimates will be reflected in the consolidated financial statements as theybecome reasonably determinable.
Judgments and estimates are continually evaluated and are based on historical experience and otherfactors, including expectations of future events that are believed to be reasonable under thecircumstances. Actual results could differ for such estimates.
JudgmentDetermining control over an entity in which Parent Company holds less than majority of voting rightsThe Parent Company has determined that it is still the largest stockholder of IPO with 48.18% equityinterest and continues to have control over IPO by virtue of the its power to nominate majority of themembers of the BOD of IPO thereby exercising control and supervision on IPO’s operations as wellas financing activities. Accordingly, the Parent Company assessed that IPO continues to be asubsidiary even though it owns less than 50% equity interest over IPO after the merger.
Determination of functional currencyPAS 21, The Effects of Changes in Foreign Exchange Rates, requires management to use itsjudgment to determine the entity’s functional currency such that it most faithfully represents theeconomic effects of the underlying transactions, events and conditions that are relevant to theentity. In making this judgment, the following were considered: The currency that mainly influences sales prices for financial instruments and services (this will
often be the currency in which sales prices for its financial instruments and services aredenominated and settled);
The currency in which funds from financing activities are generated; and The currency in which receipts from operating activities are usually retained.
The functional currency is Philippine peso as disclosed in Note 2.
Determination of lease term of contracts with renewal and termination options - Group as a lesseeThe Group has several lease contracts that include extension and termination options. The Groupapplies judgement in evaluating whether it is reasonably certain whether or not to exercise the optionto renew or terminate the lease. That is, it considers all relevant factors that create an economicincentive for it to exercise either the renewal or termination. After the commencement date, theGroup reassesses the lease term if there is a significant event or change in circumstances that is withinits control and affects its ability to exercise or not to exercise the option to renew or to terminate (e.g.,construction of significant leasehold improvements or significant customization to the leased asset).
The Group included the renewal period as part of the lease term for leases with shorter non-cancellable period (i.e., three to ten years). The Group typically exercises its option to renew forthese leases because there will be a significant negative effect on production if a replacement asset isnot readily available. The renewal periods for leases of land and office spaces with longer non-cancellable periods are not included as part of the lease term as these are not reasonably certain to beexercised (Note 14).

- 29 -
*SGVFSM009820*
Recognition of revenue from construction contractsUnder PFRS 15, the Group assessed that there is only one performance obligation for eachconstruction agreement that it has entered and that revenue arising from such agreements qualify forrecognition over time. The Group elected to use the input method to measure the progress of thefulfilment of its performance obligation, which is based on the actual costs incurred to date relative tothe total estimated cost to complete the construction projects. The Group believes that this methodfaithfully depicts the Group’s performance towards satisfaction of its performance obligation becausethere is a direct relationship between the Group’s effort (i.e., costs incurred) and the transfer ofservice to the customer (Notes 4 and 23).
Recognition of tuition and other matriculation fees over timeThe Group determined that tuition and other matriculation fees are to be recognized over time usingthe output method on the basis of time lapsed over the service period since it provides a faithfuldepiction of the Group’s performance in transferring control of the services to the students. The factthat another entity would not need to re-perform the service that the Group has provided to datedemonstrates that the customer or the student simultaneously receives and consumes the benefits ofthe Group’s performance as it performs (Note 23).
Determination of significant influence on investment in an associate if ownership is less than 20%Holding of less than 20% of voting rights is presumed not to give rise to significant influence unless itcan be clearly demonstrated that there is in fact significant influence. The Parent Company is able toexercise significant influence for ownership less than 20% because it has an active participation in thepolicy-making process including operating decisions of the investee.
As of December 31, 2020 and 2019, the Parent Company holds 10% of interest in RRC. The ParentCompany exercises significant influence in RRC since the Parent Company’s President is theconcurrent president of RRC. The president is also a member of the BOD. As such, the president ofthe Parent Company effectively has a participation in the policy-making process of RRC. Hence, theParent Company is able to exercise significant influence even if ownership is less than 20%.
Assessment of joint controlJudgment is required to determine when the Group has joint control over an arrangement, whichrequires an assessment of the relevant activities and when the decisions in relation to those activitiesrequire unanimous consent. The Group assesses their rights and obligations arising from thearrangement and specifically considers: the structure of the joint arrangement - whether it is structured through a separate vehicle when the arrangement is structured through a separate vehicle, the Group also considers the rights
and obligations arising from: the legal form of the separate vehicle the terms of the contractual arrangement other facts and circumstances, considered on a case by
case basis
Refer to Note 12 for details of the Group’s investment in joint venture.
Distinguishing investment property from owner-occupied propertyThe Group distinguishes between investment property, owner-occupied property and property heldfor sale in the ordinary course of business based on the actual use of the property (i.e. earn rentals orfor capital appreciation, owner-occupation or commencement of development with a view to sale).
Management reclassified the land transferred from Property and equipment to Investment propertyamounting to P=1,946.6 million due to change in the intended use of the land (Note 13).
- 30 -
*SGVFSM009820*
EstimatesThe key assumptions concerning the future and other key sources of estimation uncertainty at thereporting date, that have a significant risk of causing a material adjustment to the carrying amounts ofassets and liabilities within the next financial year, are described below. The Group based itsassumptions and estimates on parameters available when the financial statements were prepared.Existing circumstances and assumptions about future developments, however, may change due tomarket changes or circumstances arising that are beyond the control of the Group. Such changes arereflected in the assumptions when they occur.
Leases - Estimating the incremental borrowing rateThe Group cannot readily determine the interest rate implicit in the lease, therefore, it uses itsincremental borrowing rate (IBR) to measure lease liabilities. The IBR is the rate of interest that theGroup would have to pay to borrow over a similar term, and with a similar security, the fundsnecessary to obtain an asset of a similar value to the right-of-use asset in a similar economicenvironment. The IBR therefore reflects what the Group ‘would have to pay’, which requiresestimation when no observable rates are available or when they need to be adjusted to reflect theterms and conditions of the lease. The Group estimates the IBR using observable inputs (such asmarket interest rates) when available and is required to make certain entity-specific estimates (such asthe subsidiary’s stand-alone credit rating).
The Group’s lease liabilities amounted to P=1.25 billion and P=1.54 billion as of December 31, 2020and 2019, respectively (Note 14).
Estimating variable considerations arising from change orders and claimsThe Group frequently agrees to change orders that modify the scope of its work previously agreedwith customers and regularly submits claims to customers when unanticipated additional costs areincurred because of delays or changes in scope caused by the customers. PFRS 15 requires the Groupto recognize, as part of its revenue from construction contracts, the estimated amounts the Groupexpects to be entitled to and to be received from customers due to these change orders and claims(otherwise known as variable considerations), provided that it is highly probable that a significantreversal of the revenue recognized in connection with these variable considerations will not occur inthe future. For these unpriced change orders and claims, the Group uses the “most likely amount”method to predict the amount to which it will be entitled and expected to be received from thecustomers. The Group also updates its estimate of the transaction price to reflect any changes incircumstances that would result to changes in amount of variable considerations and correspondingincrease or decrease in the contract assets.
The aggregate carrying values of receivables and contract assets amounted to P=12.95 billion andP=15.73 billion as of December 31, 2020 and 2019, respectively (Notes 7, 8 and 17).
Fair value measurement of unquoted equity investments at FVOCIThe Group uses valuation techniques such as adjusted net asset method to estimate the fair value ofinvestment in Hermosa Ecozone Development Corporation (HEDC). These valuation techniquesrequire significant unobservable inputs to calculate the fair value of the Group’s unquoted equityinvestments at FVOCI. These inputs include appraised value of real properties, among others.Changes in assumptions relating to these factors could affect the reported fair value of these unquotedequity financial instruments. The estimate of fair value of unquoted equity investments at FVOCIconsidered the effects of COVID-19 in the selling price of comparable listings of real estateproperties related to investment in HEDC and were not accounted for separately.
The fair value of unquoted equity investments amounted to P=0.46 billion and P=1.04 billion as ofDecember 31, 2020 and 2019, respectively (Note 11).
- 31 -
*SGVFSM009820*
Provision for expected credit losses of trade receivables and contract assetsThe Group uses the simplified approach in calculating the ECL of its trade receivables and contractassets wherein the Group does not track changes in credit risk, but instead recognizes a lossallowance based on lifetime ECLs at each reporting date. The model is based on the Group’shistorical observed default rates and adjusted to include forward looking information. At everyreporting date, the historical observed default rates are updated and changes in the forward-lookingestimates are analyzed.
The assessment of the correlation between historical observed default rates, forecast economicconditions and ECLs is a significant estimate. The amount of ECLs is sensitive to changes incircumstances and of forecast economic conditions. The Group’s historical credit loss experience andforecast of economic conditions may also not be representative of customer’s actual default in thefuture.
As of December 31, 2020 and 2019, the aggregate carrying values of receivables and contract assetsare disclosed in Notes 7, 8, 17 and 22 to the consolidated financial statements.
Purchase price allocation in business combinations and goodwillThe Group’s consolidated financial statements reflect the acquired entities (AEI and its subsidiariesprior to the merger) after the completion of the merger between IPO and AEI which is effectiveMay 2, 2019. The Group accounts for the acquired business using the acquisition method, whichrequires extensive use of accounting judgments and estimates to allocate the purchase price to the fairmarket values of the acquiree’s identifiable assets and liabilities and contingent liabilities, if any, atthe acquisition date. Any excess in the purchase price over the fair market values of the net assetsacquired is recorded as goodwill in the consolidated statement of financial position. Thus, thenumerous judgments made in estimating the fair value to be assigned to the acquiree’s assets andliabilities can materially affect the Group’s financial position and performance.
The merger resulted in the recognition of student relationship, intellectual property rights and goodwillfrom the excess of the acquisition cost over the fair value of net assets acquired (Notes 15 and 17).
Valuation of land under revaluation basisThe Group’s parcel of land are carried at revalued amounts. The valuations of these parcels of landwere performed by SEC accredited independent appraisers and were determined using the marketapproach. Significant adjustments to inputs used in determining the fair value of land such aslocation and utility could affect the appraised value of the assets. The estimate of fair value of landcarried at revalued amounts considered the effects of COVID-19 in its net selling price byadjustments made to external factors, and these were not accounted for separately.
Land carried under revaluation basis amounted to P=7.96 billion and P=9.19 billion as of December 31,2020 and 2019, respectively. The key assumptions used to determine the fair value of the parcels ofland are disclosed in Note 13.
Impairment of nonfinancial assetsThe Group assesses impairment on its property and equipment, right-of-use assets, intangible assets(other than goodwill and intellectual property rights) and noncurrent assets whenever events orchanges in circumstances indicate that the carrying amount of these assets may not be recoverable.The factors that the Group considers important which could trigger an impairment review includesignificant underperformance relative to expected historical or projected future operating results,significant changes in the manner of use of the acquired assets or the strategy for overall business,and significant negative industry or economic trends.
- 32 -
*SGVFSM009820*
An impairment loss is recognized whenever the carrying amount of an asset exceeds its recoverableamount. The recoverable amount is the higher of an asset’s fair value less cost to sell and value inuse. The fair value is the amount obtainable from the sale of an asset in an arm’s length transactionwhile value in use is the present value of estimated future cash flows expected to arise fromcontinuing use of an asset and from its disposal at the end of its useful life. Recoverable amounts areestimated for individual assets or, if it is not possible, for the cash-generating unit to which the assetbelongs.
Impairment of goodwill, student relationship and intellectual property rights are assessed at least onan annual basis. In assessing the impairment, the Group determines the recoverable amount usingvalue in use with detailed disclosures made in Note 15. There is no impairment loss recognized onthese assets in 2020, 2019 and 2018. As at December 31, 2020 and 2019, the carrying value ofgoodwill amounted to P=484.83 million (Note 15).
As to the Group’s property and equipment, student relationship and noncurrent assets, no impairmentloss was recognized for the years ended December 31, 2020, 2019 and 2018 except for the provisionfor impairment in value of land recognized in 2019 amounting to P=21.00 million (Notes 13 and 17).
Estimation of retirement benefitsThe determination of the obligation and cost of retirement benefits is dependent on the selection ofcertain assumptions used by actuaries in calculating such amounts. Those assumptions include,among others, discount rates and salary increase rates which were disclosed in Note 32. While theGroup believes that the assumptions are reasonable and appropriate, significant differences in theactual experience or significant changes in the assumptions may materially affect the retirement andother obligations.
Retirement assets amounted to P=4.73 million and P=18.29 million as of December 31, 2020 and 2019,respectively whereas retirement liabilities amounted to P=611.6 million and P=457.84 million as ofDecember 31, 2020 and 2019, respectively (Note 32).
Realizability of deferred tax assetsThe Group reviews the carrying amounts of deferred income taxes at each reporting date and reducesdeferred tax assets to the extent that it is no longer probable that sufficient taxable profit will beavailable to allow all or part of the deferred tax assets to be utilized. Where there is no absoluteassurance that each legal entity in the Group will generate sufficient taxable profit to allow all or partof its deferred tax assets to be utilized, deferred tax assets are not recognized.
Deferred tax assets recognized and unrecognized by the Group are disclosed in Note 33 to theconsolidated financial statements.
Provisions and contingenciesThe Group is currently involved in various proceedings. The estimate of the probable costs for theresolution of these claims has been developed in consultation with outside counsel handling theGroup’s defense in these matters and is based upon an analysis of potential results. The Managementdoes not believe that these proceedings will have a material adverse effect on the Group’s financialstatement because management and its legal counsels believe that the Group has substantial legal andfactual bases for its position (Notes 18 and 35).
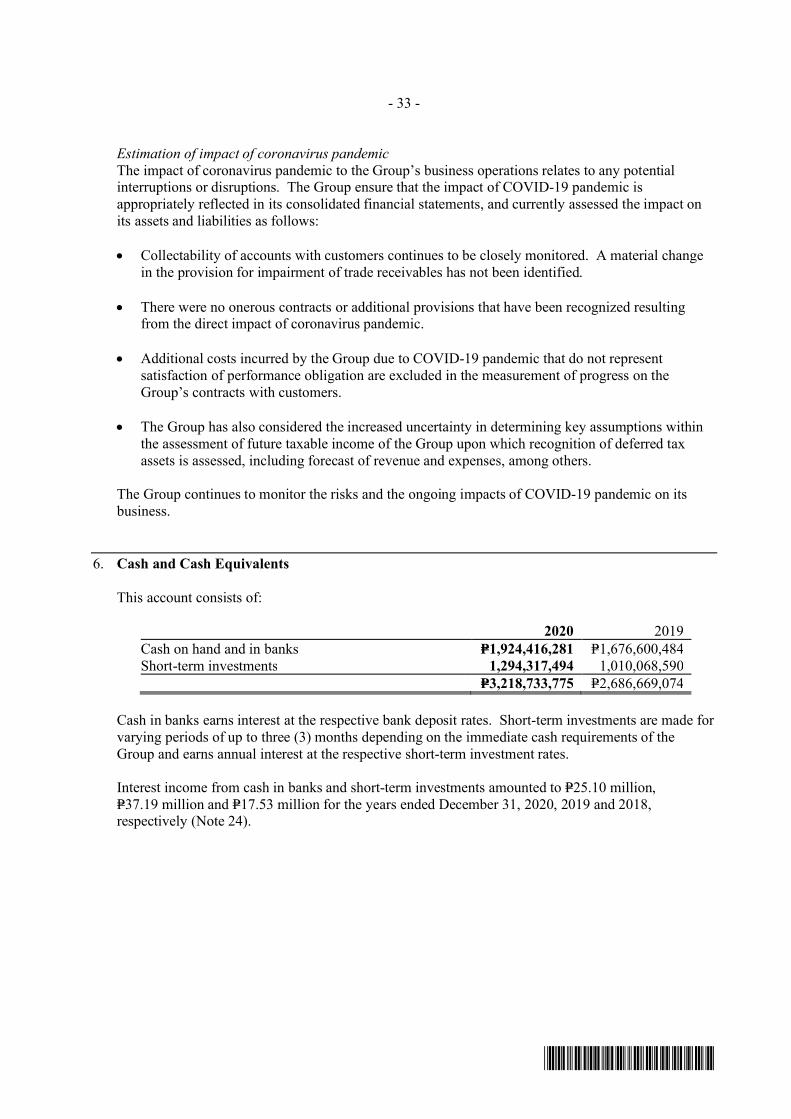
- 33 -
*SGVFSM009820*
Estimation of impact of coronavirus pandemicThe impact of coronavirus pandemic to the Group’s business operations relates to any potentialinterruptions or disruptions. The Group ensure that the impact of COVID-19 pandemic isappropriately reflected in its consolidated financial statements, and currently assessed the impact onits assets and liabilities as follows:
Collectability of accounts with customers continues to be closely monitored. A material changein the provision for impairment of trade receivables has not been identified.
There were no onerous contracts or additional provisions that have been recognized resultingfrom the direct impact of coronavirus pandemic.
Additional costs incurred by the Group due to COVID-19 pandemic that do not representsatisfaction of performance obligation are excluded in the measurement of progress on theGroup’s contracts with customers.
The Group has also considered the increased uncertainty in determining key assumptions withinthe assessment of future taxable income of the Group upon which recognition of deferred taxassets is assessed, including forecast of revenue and expenses, among others.
The Group continues to monitor the risks and the ongoing impacts of COVID-19 pandemic on itsbusiness.
6. Cash and Cash Equivalents
This account consists of:
2020 2019Cash on hand and in banks P=1,924,416,281 P=1,676,600,484Short-term investments 1,294,317,494 1,010,068,590
P=3,218,733,775 P=2,686,669,074
Cash in banks earns interest at the respective bank deposit rates. Short-term investments are made forvarying periods of up to three (3) months depending on the immediate cash requirements of theGroup and earns annual interest at the respective short-term investment rates.
Interest income from cash in banks and short-term investments amounted to P=25.10 million,P=37.19 million and P=17.53 million for the years ended December 31, 2020, 2019 and 2018,respectively (Note 24).

- 34 -
*SGVFSM009820*
7. Receivables
This account consists of:
2020 2019Trade
Construction and infrastructure P=3,460,003,600 P=4,132,893,711Education 1,166,226,739 901,585,558Car dealership 469,628,623 708,660,520Other services 189,255,856 114,165,831
Other receivablesReceivables from plant 38,118,335 56,369,572Receivable from EEI RFI 38,000,000 55,000,000Advances to officers and employees 29,425,653 103,349,773Receivable from sale of investment properties 21,280,648 22,790,885Receivable from customers 20,479,281 35,174,526Accrued referral incentives 17,817,943 29,334,923Dividends receivable (Note 22) 3,236,665 29,666,808Rent receivable 111,322 626,549Others 259,425,599 342,911,593
5,713,010,264 6,532,530,249Less allowance for impairment 366,936,427 286,043,524
P=5,346,073,837 P=6,246,486,725
Trade receivablesThe trade receivables are noninterest-bearing and collectible within one (1) year which consists of thefollowing:
Receivable from construction and infrastructureReceivables from construction and infrastructure mainly represent amounts arising from domesticconstruction contracts which are generally on a 30-day credit term.
Receivables from educationReceivables from education represent amounts arising from tuition and other matriculation fees whichare normally collected at end of every school term before the students can proceed to the next term.This also includes receivable from Department of Education amounting to P=138.8 million andP=131.1 million as at December 31, 2020 and 2019, respectively, arising from the Senior High School(SHS) Voucher Program wherein qualified SHS students are given assistance on tuition fees. Thesereceivables are noninterest-bearing and are generally collectible within one year.
Receivables from car dealershipReceivables from car dealership represent amounts arising from the sale of car, parts and accessoriesand services collectible within 30 days.
Receivables from other servicesReceivables from other services represent amounts arising from management and consultancyservices provided by the Group generally collectible within 30 days.
No trade receivables were used as collaterals to secure obligations as of December 31, 2020 and2019.

- 35 -
*SGVFSM009820*
Other receivablesReceivables from plant pertain to noninterest-bearing receivables from Honda Cars Philippines, Inc.and Isuzu Philippines Corporation, for promotional subsidy and fleet discounts. Receivables fromplant are collectible within a year in the normal course of Group’s business.
Receivable from EEI RFI pertains to the Group’s sale of land to EEI RFI, a trustee of the Group’semployee retirement fund in previous years. Both parties agreed the selling price will be repaid ininstallments and shall bear annual interest rate of 5%. In 2016, the Group agreed to extend the termof the payment of receivables based on scheduled payments until April 30, 2021 (Note 17).
Advances to officers and employees are interest-bearing and repaid on a monthly basis through salarydeductions.
Receivable from sale of investment propertiesOn December 11, 2017, the Group through EEI, sold a parcel of land located in Batangas forP=466.7 million. Both parties agreed the selling price will be settled in eight (8) semi-annualinstallments and shall bear annual interest rate of 2%.
Receivable from customersIn 2017, certain trade receivables were reclassified as interest-bearing trade receivables after theGroup and the customers agreed to extend the credit terms. These receivables bear interest of 5% perannum and will be repaid in five (5) years’ time. As of December 31, 2020 and 2019, the currentportion of receivable amounted to P=20.5 million and P=35.2 million, respectively, while the noncurrentportion of receivable as of December 31, 2020 and 2019 amounted to P=2.8 million and P=51.5 million,respectively (Note 17).
Accrued referral incentives pertain to income from accredited bank institutions earned by the cardealership branches through referrals made to customers who obtained bank financing in theacquisition of vehicles.
Receivables classified as “Others” consist of interest, commission, insurance and various receivables.
The movements in allowance for impairment for the years ended December 31 follow:
2020Construction
andInfrastructure
CarDealership
Education andInformationTechnology
OtherServices
OtherReceivables Total
Balance at beginning of year P=51,189,642 P=39,310,600 P=131,164,201 P=7,709,751 P=56,669,330 P=286,043,524Provisions - net of recoveries
(Note 29) 11,500,671 1,718,005 48,755,470 2,753,111 40,896,344 105,623,601Write-offs ‒ (4,477,424) (5,038,602) (787,503) (14,427,169) (24,730,698)Balance at end of year P=62,690,313 P=36,551,181 P=174,881,069 P=9,675,359 P=83,138,505 P=366,936,427
2019Construction
andInfrastructure
CarDealership
Education andInformationTechnology
OtherServices
OtherReceivables Total
Balance at beginning of year P=52,855,392 P=39,310,600 P=61,347,299 P=7,835,959 P=71,505,921 P=232,855,171Provisions - net of recoveries
(Note 29) (1,665,750) ‒ 69,816,902 14,141 (14,836,591) 53,328,702Write-offs − ‒ ‒ (140,349) ‒ (140,349)Balance at end of year P=51,189,642 P=39,310,600 P=131,164,201 P=7,709,751 P=56,669,330 P=286,043,524

- 36 -
*SGVFSM009820*
8. Contract Assets and Liabilities
Contract AssetsThe Group presents contract receivable and retentions withheld by customer as contract assets as theGroup’s right for consideration is conditioned on the lapse of the defect and liability period and thereceipt of customer certification that there are no defects on the constructed asset. These arereclassified as receivables upon the lapse of the defect and liability period and final customeracceptance.
The Group’s contract assets amounted to P=8.6 billion and P=10.0 billion as of December 31, 2020 and2019, respectively. The decrease in this account is largely caused by low production in constructionworks due to the COVID-19 pandemic restrictions and changes in the estimate of variable componentof transaction price amounting to P=1.3 billion.
Details of the Group’s contract assets as of December 31, 2020 and 2019 are shown below (Note 17).
2020Current Noncurrent Total
Contract assets P=7,642,055,723 P=993,635,397 P=8,635,691,120Less: Allowance for expected credit losses 36,785,303 15,154,047 51,939,350
P=7,605,270,420 P=978,481,350 P=8,583,751,770
2019Current Noncurrent Total
Contract assets P=9,492,566,375 P=494,075,106 P=9,986,641,481Less: Allowance for expected credit losses 9,072,771 226,907 9,299,678
P=9,483,493,604 P=493,848,199 P=9,977,341,803
Movement in the allowance for expected credit losses for the years ended December 31, 2020 and2019 follows:
2020Current Noncurrent Total
Balance at beginning of year P=9,072,771 P=226,907 P=9,299,678Provision (Note 29) 27,712,532 14,927,140 42,639,672Balance at end of year P=36,785,303 P=15,154,047 P=51,939,350
2019Current Noncurrent Total
Balance at beginning of year P=13,257,601 P=1,624,975 P=14,882,576Reclassification to current portion 1,398,068 (1,398,068) ‒Recoveries (5,582,898) ‒ (5,582,898)Balance at end of year P=9,072,771 P=226,907 P=9,299,678
Contract LiabilitiesDetails of the Group’s contract liabilities as of December 31, 2020 and 2019 are shown below.
2020 2019Total contract liabilities P=2,557,001,832 P=3,514,610,395Less current portion 898,322,177 1,694,367,011
P=1,658,679,655 P=1,820,243,384

- 37 -
*SGVFSM009820*
Contract liabilities from construction and infrastructure segment consist of down payments receivedin relation to construction contracts that will be recognized as revenue in the future as the Groupsatisfies its performance obligations while contract liabilities from education segment represent theunearned tuition fees and accounts payable to students and will be recognized as revenue when therelated educational services are rendered.
Contract liabilities related to the remaining performance obligations of the education segment aregenerally recognizable within one (1) year.
9. Inventories
This account consists of:
2020 2019Construction materials P=1,042,419,432 P=1,309,202,556Merchandise 624,248,970 812,826,521Real estate:
Land and land development 151,725,740 152,110,988Raw lands 42,584,391 43,121,391Subdivision lots and contracted units for sale 36,460,877 44,305,060
230,771,008 239,537,439Spare parts and supplies 72,729,484 108,306,374
1,970,168,894 2,469,872,890Less: Allowance for inventory obsolescence 82,135,203 107,595,425
P=1,888,033,691 P=2,362,277,465
Merchandise includes automotive units, parts and accessories, food and beverages, among others.The summary of the movement in real estate inventories is set out below:
2020 2019Balance at beginning of year P=239,537,439 P=274,748,124Construction/development costs incurred 13,698,819 25,703,794Cost of real estate sales (Note 25) (22,465,250) (60,914,479)Balance at end of year P=230,771,008 P=239,537,439
The total cost of goods sold recognized in the Group’s statements of comprehensive incomeamounted to P=3,646.8 million, P=6,604.4 million and P=7,281.9 million in 2020, 2019 and 2018respectively (Note 25).
The Group recognizes inventory write-down whenever the NRV of the existing inventories is lowerthan its cost.
The rollforward of allowance for inventory obsolescence is as follows:
2020 2019Balance at beginning of year P=107,595,425 P=96,442,347Provision (Note 29) 21,960,851 21,533,760Write-off (47,421,073) (10,380,682)Balance at end of year P=82,135,203 P=107,595,425

- 38 -
*SGVFSM009820*
No inventories were pledged as security to obligations as of December 31, 2020 and 2019.
10. Prepaid Expenses and Other Current Assets
This account consists of:
2020 2019Advances to suppliers and contractors P=1,004,942,386 P=925,755,733Creditable withholding taxes (CWTs) 929,043,644 561,513,235Prepaid expenses 190,085,167 161,401,961Miscellaneous deposits 120,704,511 108,700,012Advances to officers and employees 58,475,817 51,264,303Input value added tax (VAT) 55,371,913 29,585,878Restricted funds 30,960,042 21,029,868Restricted cash investment 27,747,232 27,006,721Others 144,071,804 101,506,527
2,561,402,516 1,987,764,238Less allowance for impairment 16,458,668 4,910,038
P=2,544,943,848 P=1,982,854,200
Advances to suppliers and contractors represent down payment to subcontractors for the contractwork to be performed and advance payment for the purchase of various construction materials andmachineries and equipment items.
CWTs pertain to unutilized creditable withholding tax which will be used as tax credit againstincome taxes due. The Group determines that taxes withheld can be recovered in future periods.
Prepaid expenses mainly include prepayments for membership fees, subscriptions, rentals andinsurance, among others.
Miscellaneous deposits mainly represent the Group’s refundable rental, utilities and guaranteedeposits on various machinery and equipment items.
Others include payments made on certain claims that are under protest (Note 35), financial assets atFVPL, various deposits, other supplies, among others.
Movements in allowance for impairment for the years ended December 31 are shown below:
2020
Miscellaneousdeposits
Advances toofficers
and employees
Advances tosuppliers
andsubcontractors Total
Balance at beginning of year P=3,335,193 P=29,516 P=1,545,329 P=4,910,038Provisions for ECL (Note 29) ‒ ‒ 11,548,630 11,548,630Balance at end of year P=3,335,193 P=29,516 P=13,093,959 P=16,458,668

- 39 -
*SGVFSM009820*
2019
Miscellaneousdeposits
Advances toofficers
and employees
Advances tosuppliers and
subcontractors TotalBalance at beginning of year P=3,335,193 P=242,793 P=‒ P=3,577,986Provisions for ECL (Note 29) ‒ ‒ 1,545,329 1,545,329Recoveries (Note 29) ‒ (213,277) ‒ (213,277)Balance at end of year P=3,335,193 P=29,516 P=1,545,329 P=4,910,038
11. Equity Investments at Fair Value through Other Comprehensive Income (FVOCI)
This account consists of:
2020 2019Quoted equity investments P=91,603,168 P=107,292,675Unquoted equity investments 455,473,326 1,040,481,131
P=547,076,494 P=1,147,773,806
In 2020, the Group’s equity investment in PGEC, a 90%-owned subsidiary of PERC, amounting toP=560.68 million was reclassified to investments in associate considering the significant influenceexercised by the Group on PERC. PERC is the parent company of PGEC.
In 2019, the Group invested additional P=79.8 million in various quoted and unquoted equityinstruments. In 2020, there were no additional investment made in quoted and unquoted equityinstruments.
In May 2019, IPO sold it shares in PERC for P=17.5 million and the loss on disposal was recorded at P=1.3 million.
Movements in the fair value reserve recognized in other comprehensive income (net of tax effect) areas follows:
2020 2019Attributable to equity holders of the parent:
Balance at beginning of year P=311,094,152 P=259,855,707Income (loss) recognized in OCI (135,611,263) 51,238,445Balance at end of year 175,482,889 311,094,152
Non-controlling interests:Balance at beginning of year 240,945,407 202,090,420Income (loss) recognized in OCI (8,449,929) 38,854,987Balance at end of year 232,495,478 240,945,407
P=407,978,367 P=552,039,559
The Group elected to present the fair value changes of these equity investments in othercomprehensive income because it does not intend to hold these investments for trading.
The fair value of the Group’s unquoted equity investments in HEDC is determined using the adjustednet asset approach wherein the assets of investee are adjusted from cost to their fair value. Thevaluation was performed by an independent SEC-accredited appraiser as of December 31, 2020.

- 40 -
*SGVFSM009820*
Dividends earned from equity investments at FVOCI amounted to P=37.9 million, P=54.8 million andP=1.0 million in 2020, 2019 and 2018, respectively (Note 24).
No equity investments at FVOCI were pledged as security to obligations as of December 31, 2020and 2019.
12. Investments in Associates and Joint Venture
The rollforward analysis of this account follows:
2020 2019Acquisition cost:
Balance at beginning of year P=4,841,636,714 P=4,622,763,779Additions 450,000 261,944,096Return of investment in ARCC (575,959,276) ‒Reclassification from investment in FVOCI (Note 11) 424,136,082 ‒Reclassification to subsidiary (Note 36) ‒ (43,071,161)Balance at end of year 4,690,263,520 4,841,636,714
Accumulated impairment loss 74,536,609 74,536,609Accumulated equity in net earnings:
Balance at beginning of year 1,262,916,499 742,132,503Equity in net earnings 1,368,427,558 727,820,626Dividends received (171,616,331) (207,036,630)Balance at end of year 2,459,727,726 1,262,916,499
Subtotal 7,075,454,637 6,030,016,604Share in other comprehensive income
(loss) of an associate (46,303,277) 55,887,540Cumulative translation adjustment 63,472,546 107,147,212
P=7,092,623,906 P=6,193,051,356
The details of significant investments accounted for under the equity method are as follows:
(Amounts in millions)2020
RRC PERC PGEC MMPC SGAPC ARCC PSOC PWEI SHECBEO
DMC SFTEAcquisition cost:
Balance, January 1 P=959 P=889 P=‒ P=120 P=50 P=1,626 P=690 P=257 P=21 P=‒ P=‒Additions (Advances) – – 470 – ‒ ‒ – – – 1 ‒Return of investments – – – – ‒ (576) – – – – ‒Balance, December 31 959 889 470 120 50 1,050 690 257 21 1 ‒
Accumulated equity in netearnings (losses):Balance, January 1 479 452 ‒ 431 ‒ (472) 267 130 (1)Equity in net earnings
(losses) 147 95 46 82 (18) 741 182 55 (1) (1) 4Dividends declared (110) ‒ ‒ (24) ‒ ‒ (55) (20) – – –Balance, December 31 516 547 46 489 (18) 269 394 165 (2) (1) 4
Subtotal 1,475 1,436 516 609 32 1,319 1,084 422 19 ‒ 4Accumulated share in other
comprehensive income:Balance, January 1 603 72 ‒ ‒ ‒ (8) ‒ – – – –Share in other
comprehensive loss ‒ (6) (46) ‒ ‒ (14) ‒ – – – –Balance, December 31 603 66 (46) ‒ ‒ (22) ‒ – – – –
Equity in cumulativetranslation adjustments ‒ ‒ ‒ ‒ ‒ 63 ‒ ‒ ‒ ‒ ‒
P=2,078 P=1,502 P=470 P=610 P=32 P=1,360 P=1,084 P=422 P=19 P=‒ P=4

- 41 -
*SGVFSM009820*
2019RRC PERC MMPC SGAPC ARCC PSOC PWEI SHEC
Acquisition cost:Balance, January 1 P=959 P=871 P=120 P=‒ P=1,626 P=542 P=257 P=–Additions – 18 – 50 – 148 – 21Balance, December 31 959 889 120 50 1,626 690 257 21
Accumulated equity in netearnings (losses):Balance, January 1 419 307 337 ‒ (685) 212 114 –Equity in net earnings (losses) 147 81 116 ‒ 213 88 46 (1)Dividends declared (79) – (22) ‒ – (33) (30) –Balance, December 31 487 388 431 ‒ (472) 267 130 (1)
Subtotal 1,446 1,277 551 50 1,154 957 387 20Accumulated share in other
comprehensive income:Balance, January 1 603 72 ‒ ‒ 1 ‒ ‒ ‒Share in other
comprehensive loss ‒ ‒ ‒‒
(9) ‒ ‒ ‒Balance, December 31 603 72 ‒ ‒ (8) ‒ ‒ ‒
Equity in cumulative translationadjustments ‒ ‒ ‒ ‒ 144 – –
P=2,049 P=1,349 P=551 P=50 P=1,290 P=957 P=387 P=20
RRCRRC was incorporated on July 29, 1997 and is presently engaged in developing real estate andleasing condominium units for commercial and/or residential purposes.
PERCIn April 2019, the Parent Company purchased additional 4,153,651 shares of PERC, an entity listedwith PSE, amounting to P=17.8 million, resulting to an increase in ownership interest from 28.36% to29.10%.
On February 2, 2018, the Parent Company purchased additional 69,285,418 shares amounting forP=332.6 million on P=4.8 per share resulting to an increase in ownership interest from 22.41% to28.36%.
Its share price amounted to P=3.7 per share and P=4.1 per share as of December 31, 2020 and 2019respectively.
PGECPGEC was incorporated on March 31, 2010 primarily to carry on the general business of generating,transmitting, and/or distributing power derived from renewable and conventional sources of power.
MMPCMMPC was incorporated and registered with the SEC on September 26, 1962 primarily to engage indevelopment and sale of memorial lots.
SGAPCOn November 8, 2019, the Parent Company purchased 2,500,000 shares of SGAPC from SojitzCorporation amounting to P=50.00 million or equivalent to 20.00% ownership equity.
ARCCIn 2020, ARCC repaid investment amounting to P=576.0 million. The transaction did not result to achange in the 49% ownership of EEI Limited over ARCC.

- 42 -
*SGVFSM009820*
In 2017, the stockholders of ARCC extended advances amounting to P=1,620.8 million(SAR121.75 million) to ARCC to refinance the associate’s maturing bank loan and otherfunding requirements. The amount of the extended loan is proportionate to the ownershipinterests of the stockholders. Subsequently, the stockholders agreed to treat the P=1,591.5 million(SAR121.75 million) loan as non-refundable Shareholders’ funding in the statement of equity ofARCC. Consequently, the P=794.2 million (SAR59.66 million) advances extended by the Group toARCC was reclassified as additional investment in ARCC.
EEI Limited made additional investment of P=294.9 million in ARCC in 2016.
PSOCIn 2020 and 2019, the Group, through EEI made an additional investment of nil andP=148.3 million respectively, in PSOC. These transactions did not result to a change in the %ownership of the Group over PSOC.
PWEIIn 2013, the Group, through EEI Power acquired 20% stake in PWEI for P=118.75 million. PWEI hasa wind energy project in Nabas, Aklan.
PWEI is owned 40% by PERC, 40% by BCPG Wind Cooperatief U.A. and 20% by EEI. BCPGWind Cooperatief U.A. bought out the other shareholder (CapAsia ASEAN Wind HoldingsCooperatief U.A.) on May 16, 2017.
SHECIn 2020, the Group, through EEI, acquired 40% stake in Shinbayanihan Heavy EquipmentCorporation (SHEC) and was accounted as investment in joint venture. SHEC was incorporated onJuly 26, 2019 primarily to engage in the business of managing the operation of used and newconstruction equipment rental and used and new construction equipment wholesale business in thePhilippines and import and export of used and new construction equipment without engaging in retailtrading.
BEO DMCIn 2020, the Group, through EEI, acquired 30% stake in BEO Distribution and MarketingCorporation (BEO DMC) and was accounted as joint venture. BEO DMC was incorporated onSeptember 20, 2019 primarily to engage in the business of distributing and marketing goods, productsand items of commerce without engaging in retail activity.
SFTE JVOn September 12, 2020, the Group entered into a joint venture agreement with Shimizu Corporation,Fujita Corporation, Takenaka Civil Engineering & Construction Co. Ltd. (SFTE JV) to contract withthe Department of Transportation (DOTr) of the Republic of the Philippines for the Metro ManilaSubway Project (MMSP)-Phase 1, Contract Package 101. In the joint venture, the Group acquired aproportionate share of 5% with regard to the assets, liabilities, costs, profits and losses arising out ofthe execution of the Works as identified in the contract with DOTr.
ACCIONA-EEI JVOn October 13, 2020, the Group entered into a joint venture agreement with Acciona ConstructionPhilippines, Inc. to undertake the construction of the Malolos-Clark Railway Project-PackageNo. CP N-04. The Group’s participating interest in the joint venture is 30%. Since the project is stillon its pre-operating phase, the Group has not yet recognized its share in the operating results of thejoint venture.
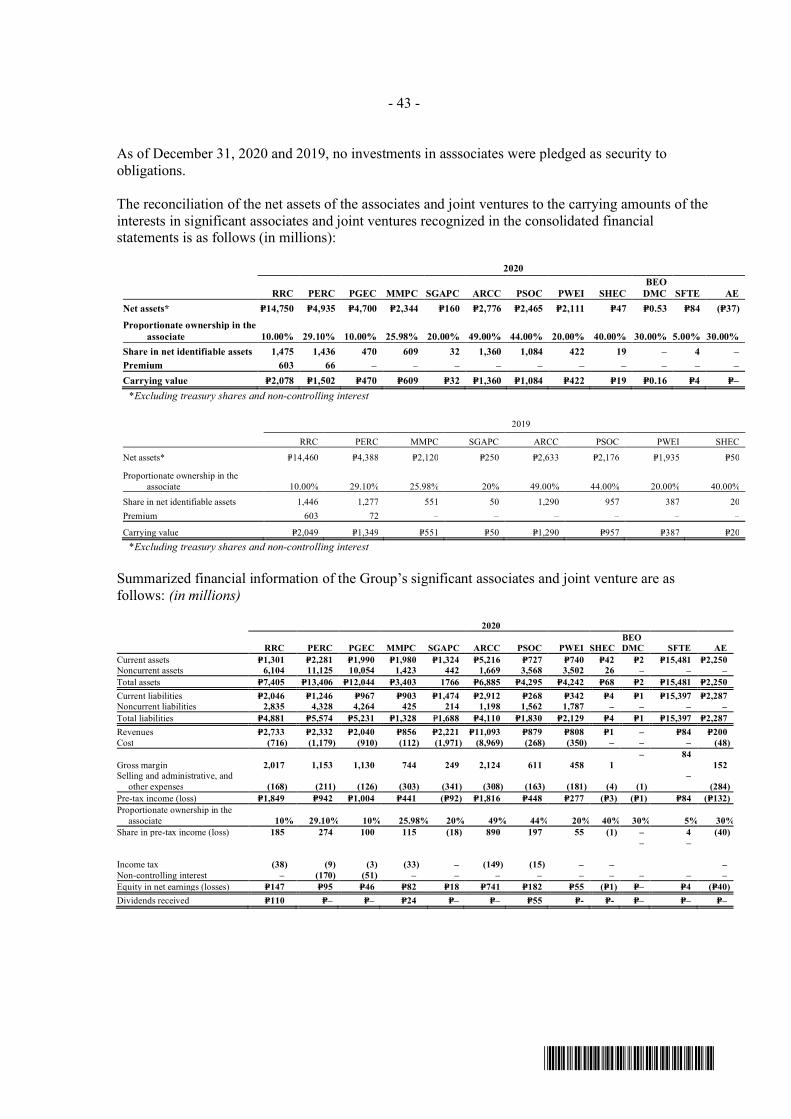
- 43 -
*SGVFSM009820*
As of December 31, 2020 and 2019, no investments in asssociates were pledged as security toobligations.
The reconciliation of the net assets of the associates and joint ventures to the carrying amounts of theinterests in significant associates and joint ventures recognized in the consolidated financialstatements is as follows (in millions):
2020
RRC PERC PGEC MMPC SGAPC ARCC PSOC PWEI SHECBEO
DMC SFTE AENet assets* P=14,750 P=4,935 P=4,700 P=2,344 P=160 P=2,776 P=2,465 P=2,111 P=47 P=0.53 P=84 (P=37)
Proportionate ownership in theassociate 10.00% 29.10% 10.00% 25.98% 20.00% 49.00% 44.00% 20.00% 40.00% 30.00% 5.00% 30.00%
Share in net identifiable assets 1,475 1,436 470 609 32 1,360 1,084 422 19 ‒ 4 ‒Premium 603 66 ‒ – ‒ ‒ ‒ ‒ ‒ ‒ ‒ ‒Carrying value P=2,078 P=1,502 P=470 P=609 P=32 P=1,360 P=1,084 P=422 P=19 P=0.16 P=4 P=‒
*Excluding treasury shares and non-controlling interest
2019
RRC PERC MMPC SGAPC ARCC PSOC PWEI SHEC
Net assets* P=14,460 P=4,388 P=2,120 P=250 P=2,633 P=2,176 P=1,935 P=50
Proportionate ownership in theassociate 10.00% 29.10% 25.98% 20% 49.00% 44.00% 20.00% 40.00%
Share in net identifiable assets 1,446 1,277 551 50 1,290 957 387 20Premium 603 72 – ‒ ‒ ‒ ‒ ‒
Carrying value P=2,049 P=1,349 P=551 P=50 P=1,290 P=957 P=387 P=20*Excluding treasury shares and non-controlling interest
Summarized financial information of the Group’s significant associates and joint venture are asfollows: (in millions)
2020
RRC PERC PGEC MMPC SGAPC ARCC PSOC PWEI SHECBEODMC SFTE AE
Current assets P=1,301 P=2,281 P=1,990 P=1,980 P=1,324 P=5,216 P=727 P=740 P=42 P=2 P=15,481 P=2,250Noncurrent assets 6,104 11,125 10,054 1,423 442 1,669 3,568 3,502 26 ‒ ‒ ‒Total assets P=7,405 P=13,406 P=12,044 P=3,403 1766 P=6,885 P=4,295 P=4,242 P=68 P=2 P=15,481 P=2,250Current liabilities P=2,046 P=1,246 P=967 P=903 P=1,474 P=2,912 P=268 P=342 P=4 P=1 P=15,397 P=2,287Noncurrent liabilities 2,835 4,328 4,264 425 214 1,198 1,562 1,787 ‒ ‒ ‒ ‒Total liabilities P=4,881 P=5,574 P=5,231 P=1,328 P=1,688 P=4,110 P=1,830 P=2,129 P=4 P=1 P=15,397 P=2,287Revenues P=2,733 P=2,332 P=2,040 P=856 P=2,221 P=11,093 P=879 P=808 P=1 ‒ P=84 P=200Cost (716) (1,179) (910) (112) (1,971) (8,969) (268) (350) ‒ ‒ ‒ (48)
Gross margin 2,017 1,153 1,130 744 249 2,124 611 458 1‒ 84
152Selling and administrative, and
other expenses (168) (211) (126) (303) (341) (308) (163) (181) (4) (1)‒
(284)Pre-tax income (loss) P=1,849 P=942 P=1,004 P=441 (P=92) P=1,816 P=448 P=277 (P=3) (P=1) P=84 (P=132)Proportionate ownership in the
associate 10% 29.10% 10% 25.98% 20% 49% 44% 20% 40% 30% 5% 30%Share in pre-tax income (loss) 185 274 100 115 (18) 890 197 55 (1) ‒ 4 (40)
Income tax (38) (9) (3) (33) ‒ (149) (15) ‒ ‒
‒ ‒
‒Non-controlling interest – (170) (51) – ‒ – – – – ‒ ‒ ‒Equity in net earnings (losses) P=147 P=95 P=46 P=82 P=18 P=741 P=182 P=55 (P=1) P=‒ P=4 (P=40)Dividends received P=110 P=‒ P=– P=24 P=‒ P=‒ P=55 P=- P=- P=‒ P=‒ P=‒

- 44 -
*SGVFSM009820*
2019RRC PERC MMPC SGAPC ARCC PSOC PWEI SHEC
Current assets P=1,318 P=2,150 P=1,730 P=270 P=4,638 P=504 P=790 P=43Noncurrent assets 6,170 11,204 1,384 507 1,398 3,707 3,629 26Total assets P=7,488 P=13,354 P=3,114 P=777 P=6,036 P=4,211 P=4,419 P=69Current liabilities P=2,012 P=1,573 P=831 382 P=2,165 P=278 P=466 P=2Noncurrent liabilities 3,322 4,518 438 224 1,239 1,757 2,018 ‒Total liabilities P=5,334 P=6,091 P=1,269 P=606 P=3,404 P=2,035 P=2,484 P=2Revenues P=2,851 P=2,122 P=1,135 P=114 P=8,752 P=642 P=796 P=‒Cost (804) (1,106) (419) (96) (7,778) (115) (154) ‒Gross margin 2,047 1,016 716 18 974 527 642 ‒Selling and administrative,
and other expenses (121) (471) (143) (20) (430) (316) (410) (2)
Pre-tax income (loss) P=1,926 P=545 P=573 (P=2) P=544 P=211 P=232 (P=2)Proportionate ownership in
the associate 10.00% 29.10% 25.98% 20.00% 49.00% 44.00% 20.00% 20.00%
Share in pre-tax income(loss) 193 159 149 ‒ 266 93 46 (1)
Income tax (42) (5) (33) (53) (5) ‒ ‒Non-controlling interest – (235) – ‒ – – – –Equity in net earnings
(losses) P=151 P=81 P=116 ‒ P=213 P=88 P=46 (P=1)
Dividends received P=90 P=‒ P=22 P=‒ P=‒ P=33 P=30 P=‒
The Group’s share in the net income of ARCC is subject to 20% income tax rate in Saudi Arabia.
Other relevant financial information of RRC are as follows:
2020 2019Cash and cash equivalents P=968,680,271 P=993,625,880Current financial liabilities * 994,389,407 1,084,26,551Noncurrent financial liabilities * 2,835,462,778 3,322,405,448Depreciation and amortization 181,476,361 195,496,683Interest income 58,110,467 48,549,717Interest expense (252,078,899) (274,642,995)*Excluding trade and other payables and provisions
Other relevant financial information of PGEC are as follows:
2020 2019Cash and cash equivalents P=1,213,491,771 P=887,023,563Current financial liabilities * 79,488,730 948,030,061Noncurrent financial liabilities * 4,192,981,639 4,421,138,351Depreciation and amortization 433,298,347 418,053,028Interest income 15,774,504 35,664,103Interest expense 369,768,105 391,393,590*Excluding trade and other payables and provisions
Other relevant financial information of PERC are as follows:
2020 2019Cash and cash equivalents P=1,267,332,044 P=1,066,698,077Current financial liabilities * 870,673,420 1,216,530,061Noncurrent financial liabilities * 4,192,981,639 4,421,138,351Depreciation and amortization 524,500,435 481,425,080Interest income 18,362,302 44,025,392Interest expense 386,788,348 409,690,469*Excluding trade and other payables and provisions

- 45 -
*SGVFSM009820*
Other relevant financial information of MMPC are as follows:
2020 2019Cash and cash equivalents P=216,283,088 P=81,751,894Current financial liabilities * 25,266,411 21,815,222Noncurrent financial liabilities * 425,226,349 437,648,210Depreciation and amortization 40,794,840 40,300,480Interest income 152,536,077 125,682,782Interest expense 6,345,593 9,217,411*Excluding trade and other payables and provisions
Other relevant financial information of SGAPC are as follows:
2020 2019Cash and cash equivalents P=350,025,000 P=75,363,491Current financial liabilities * 501,424,000 36,988,932Noncurrent financial liabilities * 214,292,000 224,458,423Interest income 337,923 25,997*Excluding trade and other payables and provisions
Other relevant financial information of PWEI are as follows:
2020 2019Cash and cash equivalents P=146,374,970 P=359,036,098Current financial liabilities * 235,934,771 240,000,000Noncurrent financial liabilities * 1,787,557,500 1,998,726,542Depreciation and amortization 199,496,579 192,496,481Interest income 6,792,292 17,931,614Interest expense (161,083,658) 205,142,642*Excluding trade and other payables and provisions
Other relevant financial information of SHEC are as follows:
2020 2019Cash and cash equivalents P=36,954,405 P=42,654,519Current financial liabilities * 3,756,956 1,428,916Depreciation and amortization 1,457,940 ‒Interest income 44,801 24,629*Excluding trade and other payables and provisions
Other relevant financial information of BEO are as follows:
2020Cash and cash equivalents P=1,501,854Current financial liabilities * 672,106Interest income 1,854Excluding trade and other payables and provisions

- 46 -
*SGVFSM009820*
Other relevant financial information of SFTE are as follows:
2020Cash and cash equivalents P=13,907,484,052Interest income 83,969,837
Other relevant financial information of AE are as follows:
2020Cash and cash equivalents P=1,626,763,861Current financial liabilities * (605,001,690)Depreciation and amortization 508,081Excluding trade and other payables and provisions
13. Property and Equipment
Property and equipment at revalued amountMovements in the revalued land are as follows:
2020 2019Balance at beginning of year P=9,185,924,384 P=7,023,425,494Additions (deductions):
Reversal of impairment 5,237,506 ‒Acquisition ‒ 2,038,084,517Appraisal increase (72,695,173) 124,414,373Reclassification to investment properties - net (1,160,808,617) ‒
Balance at end of year P=7,957,658,100 P=9,185,924,384
Land at revalued amounts consists of owner-occupied property wherein the school buildings, cardealership showroom, and other facilities are located.
In December 2020, MESI (a wholly-owned subsidiary of IPO), sold its investment in SLRHSI, itssubsidiary, to the Parent Company for P=1,946.6 million (Note 16). The only asset of SLRHSI is theparcel of land in Makati. The selling price represents the fair value of the land classified as owner-occupied property and equipment which was accounted for using the revaluation model. The sale iseliminated in the consolidated financial statements.
Upon transfer to the Parent Company, the land was reclassified to investment property which isaccounted for using the cost model. Accordingly, the corresponding revaluation increment in IPO,amounting to P=785.8 million, was transferred to retained earnings.
As of December 31, 2020 and 2019, the appraised values of the parcels of land were determinedusing the market approach which is a valuation technique that uses prices and other relevantinformation generated by market transactions involving identical or comparable assets and adjusted toreflect differences on size, shape and terrain and location among others. The significantunobservable valuation input is price per square meter (level 3 - Significant unobservable inputs).The parcels of land were valued in terms of their highest and best use. The valuation was performedby an independent SEC-accredited appraiser as of December 31, 2020.
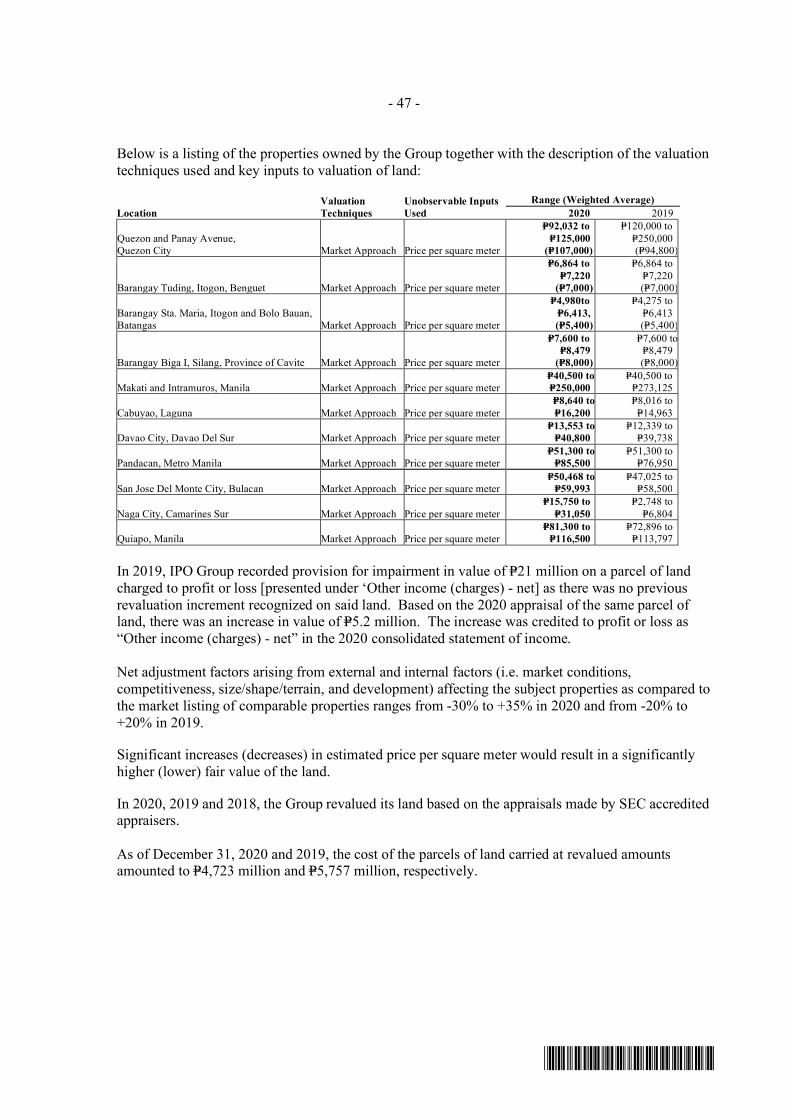
- 47 -
*SGVFSM009820*
Below is a listing of the properties owned by the Group together with the description of the valuationtechniques used and key inputs to valuation of land:
LocationValuationTechniques
Unobservable InputsUsed
Range (Weighted Average)2020 2019
Quezon and Panay Avenue,Quezon City Market Approach Price per square meter
P=92,032 toP=125,000
(P=107,000)
P=120,000 toP=250,000(P=94,800)
Barangay Tuding, Itogon, Benguet Market Approach Price per square meter
P=6,864 toP=7,220
(P=7,000)
P=6,864 toP=7,220(P=7,000)
Barangay Sta. Maria, Itogon and Bolo Bauan,Batangas Market Approach Price per square meter
P=4,980toP=6,413,(P=5,400)
P=4,275 toP=6,413(P=5,400)
Barangay Biga I, Silang, Province of Cavite Market Approach Price per square meter
P=7,600 toP=8,479
(P=8,000)
P=7,600 toP=8,479(P=8,000)
Makati and Intramuros, Manila Market Approach Price per square meterP=40,500 toP=250,000
P=40,500 toP=273,125
Cabuyao, Laguna Market Approach Price per square meterP=8,640 toP=16,200
P=8,016 toP=14,963
Davao City, Davao Del Sur Market Approach Price per square meterP=13,553 to
P=40,800P=12,339 to
P=39,738
Pandacan, Metro Manila Market Approach Price per square meterP=51,300 to
P=85,500P=51,300 to
P=76,950
San Jose Del Monte City, Bulacan Market Approach Price per square meterP=50,468 to
P=59,993P=47,025 to
P=58,500
Naga City, Camarines Sur Market Approach Price per square meterP=15,750 to
P=31,050P=2,748 to
P=6,804
Quiapo, Manila Market Approach Price per square meterP=81,300 to
P=116,500P=72,896 to
P=113,797
In 2019, IPO Group recorded provision for impairment in value of P=21 million on a parcel of landcharged to profit or loss [presented under ‘Other income (charges) - net] as there was no previousrevaluation increment recognized on said land. Based on the 2020 appraisal of the same parcel ofland, there was an increase in value of P=5.2 million. The increase was credited to profit or loss as“Other income (charges) - net” in the 2020 consolidated statement of income.
Net adjustment factors arising from external and internal factors (i.e. market conditions,competitiveness, size/shape/terrain, and development) affecting the subject properties as compared tothe market listing of comparable properties ranges from -30% to +35% in 2020 and from -20% to+20% in 2019.
Significant increases (decreases) in estimated price per square meter would result in a significantlyhigher (lower) fair value of the land.
In 2020, 2019 and 2018, the Group revalued its land based on the appraisals made by SEC accreditedappraisers.
As of December 31, 2020 and 2019, the cost of the parcels of land carried at revalued amountsamounted to P=4,723 million and P=5,757 million, respectively.

- 48 -
*SGVFSM009820*
Property and equipment at costThe rollforward analysis of this account follows:
2020
Buildings andImprovements
Machinery,Tools and
ConstructionEquipment
Transportationand ServiceEquipment
Furniture,Fixtures,
and OfficeEquipment
Constructionin Progress Total
CostBalance at beginning of year P=5,960,522,318 P=6,252,252,633 P=1,438,748,721 P=2,893,989,150 P=877,759,524 P=17,423,272,346Acquisitions 272,520,314 205,385,165 43,846,508 259,721,051 604,536,069 1,386,009,107Disposals (39,090,804) (1,044,781,123) (61,925,902) (63,391,487) ‒ (1,209,189,316)Reclassifications 23,798,923 ‒ 8,839,678 (8,839,678) (23,798,923) ‒Balance at end of year 6,217,750,751 5,412,856,675 1,429,509,005 3,081,479,036 1,458,496,670 17,600,092,137Accumulated Depreciation and
AmortizationBalance at beginning of year 2,222,853,623 3,353,773,460 845,446,285 2,192,281,425 – 8,614,354,793Depreciation and amortization
(Note 30) 296,631,558 404,382,653 148,764,510 292,165,201 – 1,141,943,922Disposals/retirements (18,866,789) (478,615,067) (50,678,558) (58,866,026) – (607,026,440)Reclassifications ‒ ‒ 5,109,414 (5,109,414) – ‒Balance at end of year 2,500,618,392 3,279,541,046 948,641,651 2,420,471,186 – 9,149,272,275Net Book Value at Cost P=3,717,132,359 P=2,133,315,629 P=480,867,354 P=661,007,850 P=1,458,496,670 P=8,450,819,862
2019
Buildings andImprovements
Machinery,Tools and
ConstructionEquipment
Transportationand ServiceEquipment
Furniture,Fixtures,
and OfficeEquipment
Constructionin Progress Total
CostBalance at beginning of year P=4,290,357,917 P=6,204,616,227 P=1,389,379,772 P=2,658,177,122 P=89,872,543 P=14,632,403,581Acquisitions/additions from
business combination 1,641,996,921 193,959,362 92,836,246 707,343,091 860,976,223 3,497,111,843Disposals (42,306,460) (615,422,065) (43,467,297) (5,047,256) ‒ (706,243,078)Reclassifications 70,473,940 469,099,109 ‒ (466,483,807) (73,089,242) ‒Balance at end of year 5,960,522,318 6,252,252,633 1,438,748,721 2,893,989,150 877,759,524 17,423,272,346Accumulated Depreciation and
AmortizationBalance at beginning of year 1,745,169,128 2,560,444,812 760,429,142 2,034,942,044 ‒ 7,100,985,126Depreciation and amortization
(Note 30) 204,356,049 520,587,890 139,710,197 247,981,182 ‒ 1,112,635,318Disposals/retirements 89,566,980 (132,371,472) (62,348,393) (59,879,542) ‒ (165,032,427)Additions from business
combination 183,761,466 ‒ 7,655,339 374,349,971 ‒ 565,766,776Reclassifications ‒ 405,112,230 ‒ (405,112,230) ‒ ‒Balance at end of year 2,222,853,623 3,353,773,460 845,446,285 2,192,281,425 – 8,614,354,793Net Book Value at Cost P=3,737,668,695 P=2,898,479,173 P=593,302,436 P=701,707,725 P=877,759,524 P=8,808,917,553
Construction in progress mainly includes the general cost of construction of the Group’s schoolbuilding in Makati City and other direct cost.
The distribution of the depreciation and amortization expenses of the Group’s property andequipment follows:
2020 2019 2018Cost of sales and services
Construction contracts (Note 27) P=446,829,677 P=505,054,894 P=533,700,871Tuition and other fees (Note 28) 367,983,710 273,365,949 187,605,487Manpower and other services
(Note 27) 13,483,485 85,027,698 48,899,277Capitalized as part of cost of
inventories ‒ ‒ 554,093828,296,872 863,448,541 770,759,728
General and administrative expenses(Note 29) 313,647,050 249,186,777 212,215,132
P=1,141,943,922 P=1,112,635,318 P=982,974,860

- 49 -
*SGVFSM009820*
Gain on sale of property and equipment amounted to P=14.86 million, P=101.53 million andP=16.97 million in 2020, 2019 and 2018, respectively.
14. Leases
Group as a lessorIPO Group’s Intramuros and Makati campuses lease spaces to Digital TelecommunicationsPhilippines or Digitel, IMI and Bell Telecommunication Philippines, Inc. The lease terms cover leaseperiods of between three (3) years to ten (10) years with escalation rates ranging from 3.00% to10.00%.
The future minimum rentals receivable under the aforementioned lease agreements follow:
2020 2019Within one year P=869,675 P=790,614More than one year but not more than five years 4,036,164 4,036,164Later than five years 106,108 1,273,292
P=5,011,947 P=6,100,070
Group as a lesseeThe Group has lease contracts for various items of land, improvements, office spaces, warehouses,school sites and annexes and other equipment used in its operations, among others. Leases of land,improvements and school sites generally have lease terms between 4 and 66 years, while otherequipment generally have lease terms between 1 and 3 years. The Group’s obligations under itsleases are secured by the lessor’s title to the leased assets. There are several lease contracts thatinclude extension and termination options and variable lease payments, which are further discussedbelow.
The Group also has certain leases with lease terms of 12 months or less and leases of officeequipment with low value. The Group applies the ‘short-term lease’ and ‘lease of low-value assets’recognition exemptions for these leases.
a. The Parent Company’s lease contract term is one (1) year and includes renewal option for anotheryear subject to mutual agreement of the Compay and lessor. Management exercises significantjudgement in determining whether the renewal option is reasonably certain to be exercised.
b. Starting January 2007, EEI and EEI Retirement Fund, Inc. (RFI) entered into a lease agreementfor the lease of land and improvements. The lease terms are for one year and renewable everyyear with 5% increase effective January 1, 2014.
c. EEI Group leases a staff house which it occupies for its operations for a period of two years, bothparties has the option to renew as per agreement. EEI Group entered into a lease contractcovering the period of July 2, 2019 to July 2, 2020.
d. EEI Group leases a lot and offices which it occupies for its operations during the period of theprojects of the Group with option to renew as per agreement. The Group entered into a leasecontract covering the period of October 16, 2011 to October 15, 2014. The contract has a rate ofP=450 per square meter for the first two years and P=460 per square meter for the third year.
e. In May 2016, EEI Group entered into a lease agreement for a period of five (5) yearscommencing on July 7, 2016 and expired on July 6, 2021. The leased premises has an escalation

- 50 -
*SGVFSM009820*
of 10% on the rent starting the second year. The lease contract has a rate of P=630 per squaremeter for the first year and 5% yearly increase thereafter.
f. IPO Group leases staffhouses for a period of one (1) year that are renewable annually uponmutual agreement of IPO Group and its lessors. Monthly lease payments range from P=14,000 toP=65,000.
g. Landev Corporation entered into lease agreements that are renewable upon mutual agreement ofLandev Corporation and the lessors:
Lessor Commencement date Term Monthly RentalGrepa Realty Holdings Corporation January 1, 2020 1 year P=324,802Rizal Commercial Banking Corporation July 25, 2020 3 years 129,975*Rizal Commercial Banking Corporation July 25, 2017 3 years 93,756*Grepa Realty Holdings Corporation January 1, 2020 1 year 7,252RCBC Savings Bank January 1, 2015 5 years 6,300*
*subject to 5% annual escalation rate
Rent expense recognized in 2020 and 2019 amounted P=5.66 million and P=6.45 million,respectively.
Future minimum lease payments of above lease agreements as at December 31 are as follows:
2020 2019Within one year P=1,512,585 P=728,554After one year but not more than five years 2,417,638 −
P=3,930,223 P=728,554
h. The Greyhounds Security and Investigation Agency Corporation entered into an agreement withGrepa Realty Holdings Corporation for the lease of office space. The lease is renewable annuallyupon mutual agreement by both parties. Rent expense recognized in 2020 and 2019 amounted toP=0.66 million and P=0.64 million, respectively.
i. In 2011, IMI entered into lease agreements with Mapua Information Technology Centers, Inc.,Malayan Colleges, Inc. and Malayan High School of Science for canteen spaces. In 2016, theCompany started to lease a canteen space from Malayan Colleges Laguna, Inc. These leaseagreements cover a period of one year with monthly lease payments ranging from P=4,464 toP=165,934.
j. Hexagon Lounge, Inc. entered into a lease agreement for the lounge and office space it occupies.The lease is renewable annually as may be mutually agreed upon by the parties with monthlyminimum lease payments of P=10,000 or 2% of net restaurant sales, whichever is higher.
k. In 2020, the Group pre-terminated the lease contracts of property used by the following closedcar dealership branches:
Closed Branches Contract Date Contract End Date Date TerminatedHonda Cars Kalookan December 26, 2018 December 25, 2023 June 30, 2020Honda Cars Fairview April 24, 2014 April 23, 2020 June 30, 2020Honda Cars Marikina January 1, 2009 June 15, 2020 June 30, 2020Honda Cars Marcos Highway June 1, 2013 May 31, 2023 July 30, 2020Isuzu Greenhills January 26, 2009 January 25, 2024 June 30, 2020

- 51 -
*SGVFSM009820*
The carrying amount of right-of-use assets and the movement for the years ended December 31follow:
2020 2019Balance at beginning of year P=1,605,726,653 P=1,378,023,041Additions 41,738,517 474,569,625Derecognition (136,826,253) ‒Amortization of right-of-use asset (239,564,734) (246,866,013)Balance at end of year P=1,271,074,183 P=1,605,726,653
The distribution of the amortization of the Group’s right-of-use assets follow:
2020 2019Cost of sales and services
Construction contracts (Note 27) P=71,004,873 P=43,008,349Tuition and other fees (Note 28) 4,628,679 63,477,198
75,633,552 106,485,547General and administrative expenses 163,931,182 140,380,466
P=239,564,734 P=246,866,013
The carrying amount of lease liability and the movement for the years ended December 31 follow:
2020 2019Balance at beginning of year P=1,538,664,329 P=1,436,130,147Interest expense 107,042,613 79,459,539Additions 94,311,240 443,836,343Derecognition (202,137,944) ‒Payments (287,547,391) (420,761,700)Balance at end of year 1,250,332,847 1,538,664,329Less: Current portion 164,647,368 215,416,367Noncurrent portion P=1,085,685,479 P=1,323,247,962
Derecognition pertains to termination of lease contracts of closed car dealership branches. Thedifference between right-of-use asset and lease liability is accounted for under miscellaneous expenseof General and administrative expenses in the 2020 consolidated statement of income (Note 29).
The following are the amounts recognized in consolidated statement of income:
2020 2019Amortization of right-of-use assets under cost of
sales and services (Notes 27, 28, and 30) P=75,633,552 P=106,485,547Amortization of right-of-use assets under general
and administrative expenses (Notes 29 and 30) 144,513,052 140,380,466Gain on derecognition of right-of-use assets and
lease liabilities (65,311,691) ‒Interest expense on lease liabilities 107,042,613 79,459,539Expenses relating to short-term leases and
low value assets 526,005,056 25,919,076P=787,882,582 P=352,244,628

- 52 -
*SGVFSM009820*
The COVID-19-related lease concessions amounting to P=19.42 million were accounted as negativevariable lease expense charged against depreciation and amortization under General andadministrative expense account in the 2020 consolidated statement of income.
15. Goodwill
The carrying amount of goodwill allocated to each of the CGUs follows:
2020 2019EEI Corporation and Subsidiaries P=300,859,305 P=300,859,305MESI 137,853,346 137,853,346IPO 32,644,808 32,644,808Business combination of IPO and AEI 13,472,260 13,472,260
P=484,829,719 P=484,829,719
Goodwill of EEI and IPOThe Group performed impairment testing on goodwill arising from acquisition of EEI and IPO. Forpurposes of impairment testing, EEI and IPO are considered as the CGUs.
Management determined that the recoverable amount of the goodwill balances of EEI and IPO werefair values less costs of disposal wherein the fair values are the quoted prices of the shares of stocksof EEI and IPO in the Philippine Stock Exchange as of December 31, 2020 and 2019 andincorporated control premium in the said fair values (Level 3 - Significant unobservable inputs).Management assessed that the costs of disposal, which mainly consist of the stock transaction tax,brokers’ commission and transaction fee with the stock exchange to be insignificant.
In 2020, 2019 and 2018, Management assessed that the recoverable amount of the goowill balancesexceed their carrying values, thus, no impairment loss should be recognized.
Goodwill of MESIThe goodwill recognized in the consolidated statement of financial position amountingP=137.85 million as at December 31, 2020 and 2019 pertains to the excess of the acquisition cost overthe fair values of the net assets of MESI acquired by the Group through IPO in 1999.
The Group performed impairment testing on goodwill arising from acquisition of MESI whereinMESI was considered as the CGU.
Key assumptions used in the value in use (VIU) calculationAs at December 31, 2020 and 2019, the recoverable amount of the CGU has been determined basedon a VIU calculation using five-year cash flow projections. Key assumptions in the VIU calculationof the CGU are most sensitive to the following:
Future revenues and revenue growth rates. Cash flow projections based on financial budgetsapproved by management covering a five-year period and considers the impact of the K to 12Basic Education Program on MESI’s financial performance effective 2016 and the coronaviruspandemic.
Long-term growth rates (3.78% for 2020 and 3.73% for 2019). The Long-term growth rate is theexpected growth rate in the education industry sector.
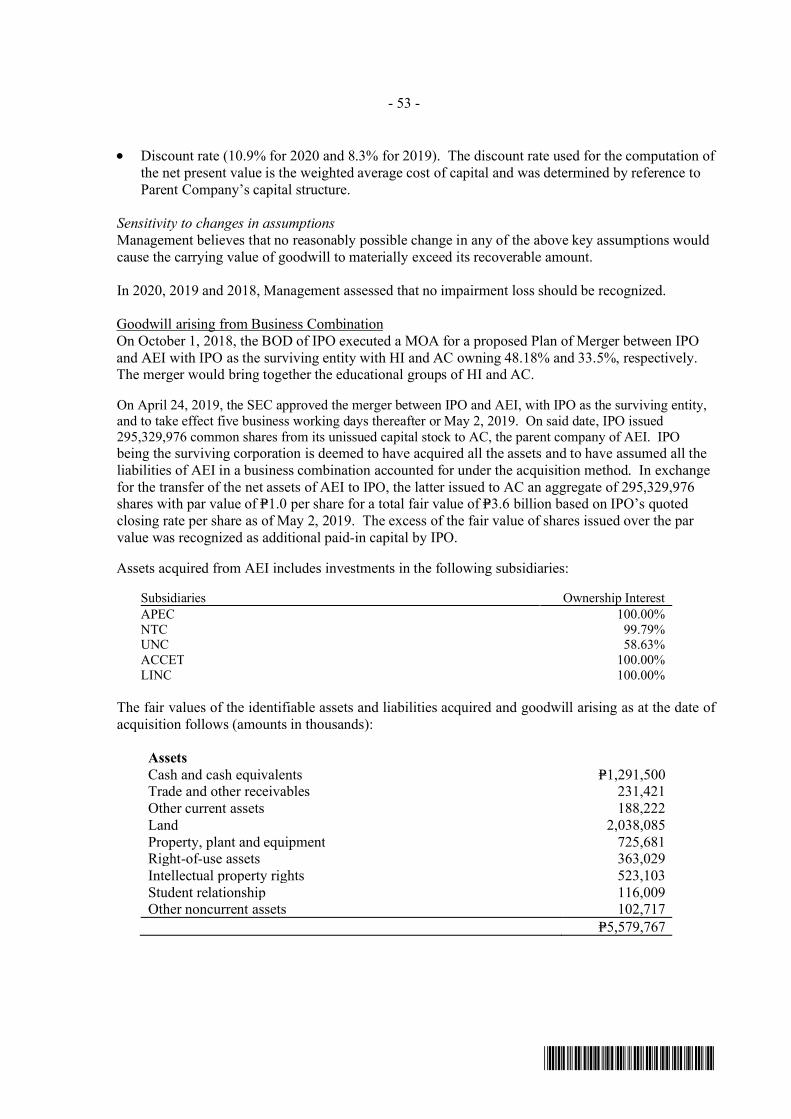
- 53 -
*SGVFSM009820*
Discount rate (10.9% for 2020 and 8.3% for 2019). The discount rate used for the computation ofthe net present value is the weighted average cost of capital and was determined by reference toParent Company’s capital structure.
Sensitivity to changes in assumptionsManagement believes that no reasonably possible change in any of the above key assumptions wouldcause the carrying value of goodwill to materially exceed its recoverable amount.
In 2020, 2019 and 2018, Management assessed that no impairment loss should be recognized.
Goodwill arising from Business CombinationOn October 1, 2018, the BOD of IPO executed a MOA for a proposed Plan of Merger between IPOand AEI with IPO as the surviving entity with HI and AC owning 48.18% and 33.5%, respectively.The merger would bring together the educational groups of HI and AC.
On April 24, 2019, the SEC approved the merger between IPO and AEI, with IPO as the surviving entity,and to take effect five business working days thereafter or May 2, 2019. On said date, IPO issued295,329,976 common shares from its unissued capital stock to AC, the parent company of AEI. IPObeing the surviving corporation is deemed to have acquired all the assets and to have assumed all theliabilities of AEI in a business combination accounted for under the acquisition method. In exchangefor the transfer of the net assets of AEI to IPO, the latter issued to AC an aggregate of 295,329,976shares with par value of P=1.0 per share for a total fair value of P=3.6 billion based on IPO’s quotedclosing rate per share as of May 2, 2019. The excess of the fair value of shares issued over the parvalue was recognized as additional paid-in capital by IPO.
Assets acquired from AEI includes investments in the following subsidiaries:
Subsidiaries Ownership InterestAPEC 100.00%NTC 99.79%UNC 58.63%ACCET 100.00%LINC 100.00%
The fair values of the identifiable assets and liabilities acquired and goodwill arising as at the date ofacquisition follows (amounts in thousands):
AssetsCash and cash equivalents P=1,291,500Trade and other receivables 231,421Other current assets 188,222Land 2,038,085Property, plant and equipment 725,681Right-of-use assets 363,029Intellectual property rights 523,103Student relationship 116,009Other noncurrent assets 102,717
P=5,579,767

- 54 -
*SGVFSM009820*
LiabilitiesAccounts and other payables P=319,124Loans payable 260,000Deferred tax liabilities 432,946Leased liabilities 374,622Other liabilities 77,815
1,464,507Total identifiable net assets at fair value 4,115,260Non-controlling interest (537,520)Goodwill 13,472Cost of acquisition P=3,591,212
The non-controlling interests have been measured at the proportionate share of the value of the netidentifiable assets acquired and liabilities assumed.
The goodwill arising from the merger between IPO and AEI on May 2, 2019 amounted toP=13.47 million. No impairment testing was done on the goodwill as the Group assessed it as notmaterial to the consolidated financial statements.
The merger between IPO and AEI resulted to the Group identifying other intangible assets such as theintellectual property rights with infinite life and student relationship with an estimated useful life of5 years to 7 years based on the contractual relationship between the school entities and its students.These assets are attributed from the acquisition of operating schools NTC, APEC and UNC. Thecarrying value and movement of student relationship as of and for the year ended December 31follows (amount in thousands):
2020 2019Cost from business combination P=116,009 P=116,009Accumulated amortization:
Balance at beginning of year (14,874) –Amortization for the year (22,310) (14,874)Balance at end of year (37,184) (14,874)
Balance at end of year (Note 17) P=78,825 P=101,135
The carrying value of intellectual property rights amounted to P=523.10 million as of December 31,2020 and 2019 (Note 17). As of December 31, 2020 and 2019, the Group performed impairmenttesting on intellectual property rights using the income approach. Key assumptions used are asfollows:
Revenue projections and long-term growth rate (3% for 2020 and 2.5% to 3% for 2019). Revenueprojections based on financial budgets approved by management and considers the impact of theK to 12 Basic Education Program effective 2016 and the coronavirus pandemic. The long-termgrowth rate is the expected growth rate in the education industry sector.
Discount rates (13% to 14% for 2020 and 12% to 15% for 2019). The discount rate used for thecomputation of the net present value is the weighted average cost of capital and was determinedby reference to comparable listed companies in the educational sector.
Royalty rates (1% to 6% for 2020 and 1% to 5% for 2019). This is based on the publiclyavailable information on franchising of educational institutions in the Philippines, withconsideration on the operational risk of the involved entity.
In 2020 and 2019, Management assessed that no impairment loss should be recognized.
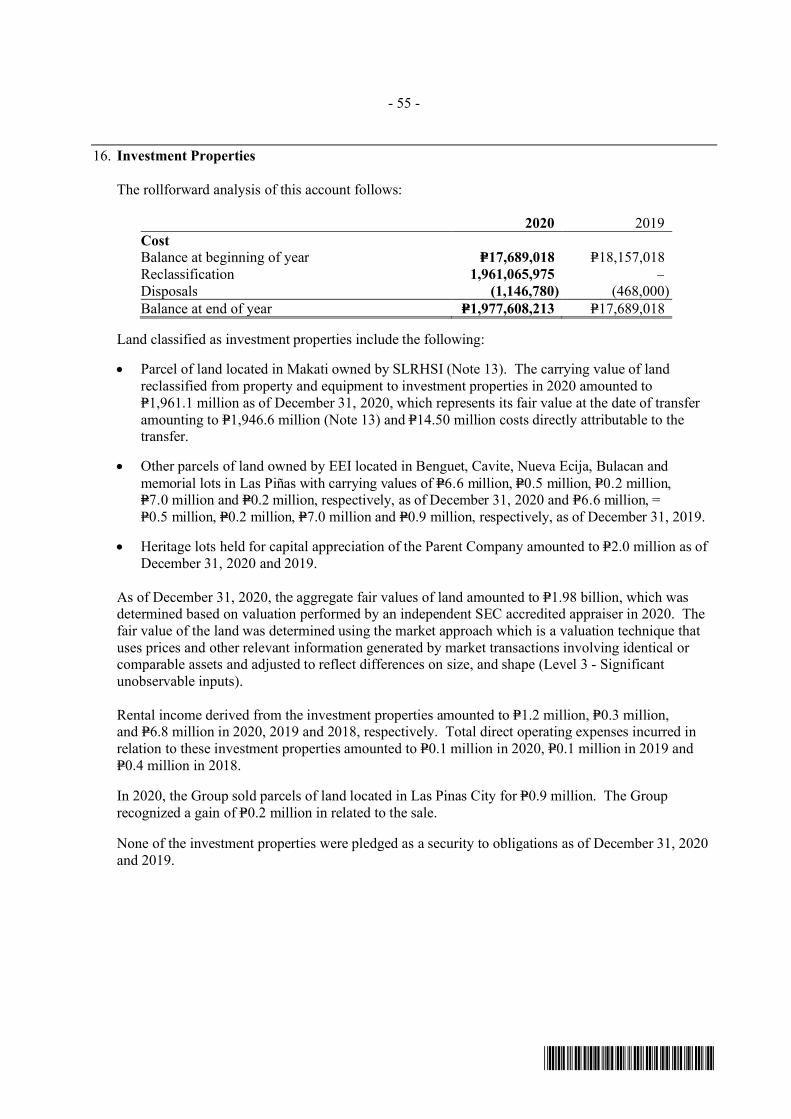
- 55 -
*SGVFSM009820*
16. Investment Properties
The rollforward analysis of this account follows:
2020 2019CostBalance at beginning of year P=17,689,018 P=18,157,018Reclassification 1,961,065,975 –Disposals (1,146,780) (468,000)Balance at end of year P=1,977,608,213 P=17,689,018
Land classified as investment properties include the following:
Parcel of land located in Makati owned by SLRHSI (Note 13). The carrying value of landreclassified from property and equipment to investment properties in 2020 amounted toP=1,961.1 million as of December 31, 2020, which represents its fair value at the date of transferamounting to P=1,946.6 million (Note 13) and P=14.50 million costs directly attributable to thetransfer.
Other parcels of land owned by EEI located in Benguet, Cavite, Nueva Ecija, Bulacan andmemorial lots in Las Piñas with carrying values of =P=6.6 million, =P=0.5 million, P=0.2 million,=P=7.0 million and =P=0.2 million, respectively, as of December 31, 2020 and P=6.6 million, =P=0.5 million, =P=0.2 million, =P=7.0 million and =P=0.9 million, respectively, as of December 31, 2019.
Heritage lots held for capital appreciation of the Parent Company amounted to P=2.0 million as ofDecember 31, 2020 and 2019.
As of December 31, 2020, the aggregate fair values of land amounted to P=1.98 billion, which wasdetermined based on valuation performed by an independent SEC accredited appraiser in 2020. Thefair value of the land was determined using the market approach which is a valuation technique thatuses prices and other relevant information generated by market transactions involving identical orcomparable assets and adjusted to reflect differences on size, and shape (Level 3 - Significantunobservable inputs).
Rental income derived from the investment properties amounted to P=1.2 million, P=0.3 million,and P=6.8 million in 2020, 2019 and 2018, respectively. Total direct operating expenses incurred inrelation to these investment properties amounted to P=0.1 million in 2020, P=0.1 million in 2019 andP=0.4 million in 2018.
In 2020, the Group sold parcels of land located in Las Pinas City for P=0.9 million. The Grouprecognized a gain of P=0.2 million in related to the sale.
None of the investment properties were pledged as a security to obligations as of December 31, 2020and 2019.

- 56 -
*SGVFSM009820*
17. Other Noncurrent Assets
This account consists of:
2020 2019Contract asset- net of noncurrent portion (Note 8) P=978,481,350 P=493,848,199Intellectual property rights (Note 15) 523,103,000 523,103,000Deferred input VAT 150,221,650 181,103,198Student relationship (Note 15) 78,824,857 101,135,343Miscellaneous deposit 29,321,863 27,489,054Computer software 13,234,817 15,872,318Interest-bearing trade receivables - net of current
portion (Note 7) 2,768,265 51,479,840Receivable from EEI-RFI - net of current portion
(Note 7) ‒ 23,000,000Others 86,235,659 88,493,443
P=1,862,191,461 P=1,505,524,395
Intellectual property rights and student relationship are the intangible assets acquired in May 2019through the merger between IPO and AC Education, Inc. (AEI), the wholly owned education arm ofAyala Corporation (Note 15).
Miscellaneous deposits include rental and security deposits.
Rollforward of Computer software follows:
2020 2019CostBalance at beginning of year P=139,735,882 P=131,540,217Additions 4,515,025 8,195,665Reclassification (113,875) −Balance at end of year 144,137,032 139,735,882Accumulated AmortizationBalance at beginning of year 123,863,564 117,241,991Amortization (Note 30) 7,038,651 6,621,573Balance at end of year 130,902,215 123,863,564Net Book Value P=13,234,817 P=15,872,318
As of December 31, 2020, the average remaining useful of the software is two (2) year.
18. Accounts Payable and Other Current Liabilities
This account consists of:
2020 2019Accounts payable P=7,725,459,889 P=7,206,088,780Deferred output taxes 411,024,600 470,071,993Accrued expenses 239,891,188 334,851,087Provisions (Note 35) 159,266,271 154,307,388Withholding taxes and others 89,598,081 82,850,499
(Forward)

- 57 -
*SGVFSM009820*
2020 2019Output tax payable P=47,586,547 P=69,703,441Dividends payable 19,613,877 378,640Subscriptions payable 13,125,000 13,125,000SSS and other contributions 11,840,694 10,937,385Chattel mortgage payable 10,249,382 12,906,807Payable to Land Transportation Office 4,919,430 4,427,438Deferred income 3,707,011 2,348,003Others 41,990,911 50,086,080
P=8,778,272,881 P= 8,412,082,541
Accounts payable pertains to the Group’s obligation to local suppliers. The normal trade credit termsof accounts payable and accrued expenses of the Group are expected to be settled within the nexttwelve (12) months.
Accrued expenses consist of:
2020 2019Accrued salaries and wages P=70,658,629 P=99,784,432Accrued interest 36,148,858 25,193,482Accrued insurance 24,094,116 24,387,237Accrued professional fees 21,514,578 15,210,248Accrued security services 18,711,311 10,673,278Accrued utilities 7,762,397 8,453,023Others 61,001,299 151,149,387
P=239,891,188 P=334,851,087
Other accrued expenses mainly consist of accrual for professional fees, outside services, utilities andother expenses that are expected to be settled within one year.
Provisions were provided for claims by third parties in the ordinary course of business. As allowedby PAS 37, Provisions, Contingent Liabilities and Contingent Assets, only a general description isprovided as the disclosure of additional details beyond the present disclosures may prejudice theGroup’s position and negotiation strategies with respect to these matters.
19. Loans Payable
This account consists of:
2020 2019Unsecured bank loans P=7,607,000,000 P=8,085,000,000Secured bank loans 375,000,000 308,800,000
P=7,982,000,000 P=8,393,800,000
UnsecuredUnsecured bank loans are obtained from local banks and related party financial institutions withannual interest rates ranging from 3.50% to 5.50% and 3.40% to 6.25% in 2020 and 2019,respectively.

- 58 -
*SGVFSM009820*
SecuredIn 2017, the Group, through MCMI, obtained a short-term loan (STL) facility with Bank of PhilippineIsland (BPI), which was earmarked from the long-term loan facility of the Group from same bank, tofinance the construction of MCMI’s school building. Each STL facility may be re-availed/renewed/extended within a period of one year provided that the sum of the terms of re-availements/renewal/extension will not exceed 360 days. The STL facility may be converted into a 10-year term loanfacility which shall be partially secured by the real estate mortgage on the real property of MCMI.The STL facility is secured by the Continuing Suretyship Agreement of MESI. Annual interest ratesrange from 3.00% to 5.50%.
The Group, through MCMI, also obtained short-term loans from Land Bank of the Philippines (LBP)in 2020 and 2019 amounting to P=57.3 million and P=15.0 million, respectively, with annual interestsranging from 4.70% to 6.25%. The loans are secured by the land owned by MCMI (Note 13).
Outstanding balance of short-term loans obtained by MCMI amounted to P=375.0 million andP=308.8 million as at December 31, 2020 and 2019, respectively.
Movements in loans payable during the years ended December 31 follow:
2020 2019Balance at beginning of year P=8,393,800,000 P=10,519,000,000Availments 16,574,230,000 15,760,000,000Payments (16,986,030,000) (17,885,200,000)Balance at end of year P=7,982,000,000 P=8,393,800,000
Interest expense incurred on these loans amounted to P=434.3 million, P=561.6 million andP=309.3 million in 2020, 2019 and 2018, respectively.
20. Long-term Debt
This account consists of:
2020 2019Fixed-rate corporate promissory notes P=5,204,857,924 P=2,446,428,571Fixed-rate term loan 2,215,444,212 2,245,260,555
7,420,302,136 4,691,689,126Less current portion of long-term debt 2,302,998,099 1,385,714,285
P=5,117,304,037 P=3,305,974,841
Parent CompanyOn December 16, 2015, the Parent Company acquired from BPI loan amounting P=500.0 million,payable within five (5) years. The proceeds of the loan were used for general financing requirementsand working capital purposes. In 2020, the loan was fully settled.
EEIIn 2014, the Group through EEI received P=500.0 million proceeds from the issuance of unsecuredfixed-rate corporate promissory notes to a local bank that bear annual interest of 5.20%.Subsequently, the bank reduced the interest rate to 4.80% effective May 26, 2015 until maturity. Thepromissory notes mature within seven (7) years from the date of issuance.

- 59 -
*SGVFSM009820*
On June 15, 2015, the Group received P=1,000 million proceeds from the issuance of an unsecuredfixed-rate corporate promissory note to a local bank that bears annual interest of 4.80%. Thepromissory note matures within seven (7) years from the date of issuance.
On May 23, 2018, the Group received P=2,000 million proceeds from the issuance of an unsecuredfixed-rate corporate promissory note to a local bank that bears annual interest of 4.80%. Thepromissory note matures within five (5) years from the date of issuance.
On November 11, 2019, the Group received P=909 million proceeds from the issuance of an unsecuredfixed-rate corporate promissory note to a local bank that bears annual interest of 3.90%. Thepromissory note matures within three (3) years from the date of issuance. The proceeds from thepromissory notes were used for general corporate and project financing requirements.
On October 15, 2020, the Group received P=3,000.0 million proceeds from the issuance of anunsecured fixed-rate corporate promissory note to a local bank that bears annual interest of 3.5%.The promissory note matures within three (3) years from the date of issuance.
On November 23, 2020, the Group received P=1,000.0 million proceeds from the issuance of anunsecured fixed-rate corporate promissory note to a local bank that bears annual interest of 3.25%.The promissory note matures within three (3) years from the date of issuance.
The proceeds from the promissory notes were used for general corporate and project financingrequirements.
EEI Power CorporationOn August 28, 2015, EEI Power availed an unsecured P=500.0 million long-term loan from a localbank that bears an annual interest of 4.80%. The loan is payable in equal quarterly installments andwill mature on August 27, 2022.
Biotech JPOn August 12, 2016, Biotech JP obtained an unsecured five-year long-term loan from Biotech JapanCorporation that bears an annual interest rate of 0.05%. The loan is payable at maturity date,including accrued interest.
On October 1, 2018, the Biotech JP obtained an unsecured 4.5 year long-term loan from BiotechJapan Corporation that bears an annual interest rate of 0.30%. The loan is payable in five equalannual installments and will mature on March 31, 2021.
In 2019, Biotech JP obtained an unsecured P=47.60 million long-term loan from Biotech JapanCorporation that bears an annual interest of 2.45%.
On April 24, 2020, BiotechJP availed an unsecured P=21.8 million long-term loan from a foreign bankthat bears an annual interest of 0.80%. The loan is payable in 18 equal semi-annual installments andwill mature on September 13, 2030.
On September 25, 2020, BiotechJP availed an unsecured P=92.3 million long-term loan from BiotechJapan Corporation that bears an annual interest of 3.0%. The loan is payable in equal semi-annualinstallments and will mature on March 31, 2030.
Interest expense incurred on these corporate notes amounted to P=9.6 million, P=12.3 million andP=15.7 million in 2020, 2019 and 2018, respectively.

- 60 -
*SGVFSM009820*
IPOIPO, through NTC, entered into a 10-year unsecured term loan facility with a third party local bankfor P=650.0 million to finance its building refurbishment and/or expansion. The principal paymentswill be made in 28 quarterly payments starting May 2022. Total drawdown from the long-term loanfacility amounted to P=380.0 million in 2019, which are subject to annual interest rate of 4.675% withannual repricing based on higher of 5.5% or the prevailing one year benchmark rate or done rate of aliquid/active security, as agreed by the parties, with the same tenor if benchmark rate is not reflectiveof market rate, plus interest spread.
In 2019, the IPO Group, through MCMI, entered into a ten-year secured long-term loan agreementwith a local bank for P=1,500.0 million to refinance the construction of MCMI’s school buildings andfacilities that were initially funded by short-term loans. MCMI made partial drawdowns against thisagreement amounting to P=680.0 million, P=350.0 million and P=470.0 million in January, June andJuly 2019, respectively. The loans were subject to prevailing borrower’s rate, plus a minimum spreadof 0.50% per annum, but in no case lower than 4% per annum, subject to quarterly repricing. MCMIshall repay the loan in 20 equal quarterly installments to start at the end of 21st quarter from theinitial drawdown date. The loans were secured by the land and related improvements owned byMCMI with carrying value of P=2,361.5 million and P=2,376.8 million as of December 31, 2020 and2019, respectively, and suretyship of MESI.
Movements in the account follow:
2020 2019Balance at beginning of year P=4,691,689,126 P=2,795,238,096Availments 4,114,134,660 2,862,403,404Payments (1,387,893,054) (965,952,374)Amortization of transaction costs 2,371,404 ‒Balance at end of year 7,420,302,136 4,691,689,126Less current portion (2,302,998,099) (1,385,714,285)
P=5,117,304,037 P=3,305,974,841
Interest expense incurred on these loans amounted to P=159.4 million, P=124.1 million andP=139.4 million in 2020, 2019 and 2018, respectively.
The aforementioned loans require the Group to maintain certain financial ratios such as debt to equityratio, current ratio and debt service coverage ratio calculated based on stipulation with the lenderbanks. As of December 31, 2020, and 2019, the Group was in compliance with the loan covenants.
21. EEI’s Stock Option Plan
The EEI’s stock option plan, as amended (Amended Plan), had set aside 35 million common sharesfor stock options available to regular employees, officers and directors of the Parent Company and itssubsidiaries.
Under the Amended Plan, the option or subscription price must be equal to the book value of theEEI’s common stock but not less than 80% of the average market price quoted in PSE for five tradingdays immediately preceding the grant, but in no case less than the par value. The option orsubscription price should be paid over a period of five years in 120 equal semi-monthly installments.Shares acquired under the Amended Plan are subject to a holding period of one year.

- 61 -
*SGVFSM009820*
A summary of the plan availments is shown below:
Number ofShares
Shares allocated under the Original Stock Option Plan 19,262,500Shares allocated under the Amended Stock Option Plan 15,737,500
Total shares allocated 35,000,000Shares subscribed under the Original Stock Option Plan 19,365,815Shares subscribed under the Amended Stock Option Plan 10,886,188
Total shares subscribed 30,252,003Shares allocated at end of year 4,747,997
The EEI opted to avail the exemption in PFRS 1, First-time Adoption of Philippine FinancialReporting Standards, from applying PFRS 2 upon adoption on January 1, 2005 as it allows non-adoption of PFRS 2 for equity instruments that were granted on or before November 7, 2002. Since2000, there were no shares under the stock option plan that were granted, forfeited, exercised andexpired.
No benefit expense is recognized relative to the shares issued under the stock option plan. When options are exercised, these are treated as capital stock issuances.
22. Related Party Transactions
Parties are considered to be related if one party has the ability, directly or indirectly, to control theother party or exercise significant influence over the other party in making financial and operatingdecisions. Parties are also considered to be related if they are subject to common control or the partyis an associate or a joint venture. Related parties may be individuals or corporate entities.
Related parties include entities under common control, which pertains to other subsidiaries ofPMMIC, which is the Group’s ultimate parent company.
The year-end balances and transactions with respect to related parties included in the consolidatedfinancial statements are as follows (amounts in thousands):
2020
CategoryAmount/Volume
OutstandingBalance
Receivable(Payable) Terms Conditions
Parent Company - PMMICa. Accounts payable P=3,513 (P=3,284) Noninterest-bearing Unsecured Miscellaneous expenses
incurred 3,513 ‒Associates
c. Dividends earned 152,760 3 Noninterest-bearingUnsecured, no
impairmentd. Receivables from
related parties ‒ 1,702 Noninterest-bearing Unsecured Rendering management
and audit services 1,854 ‒Rendering of services ‒ 33,357
e. Due to related parties 126,417 ‒ Noninterest-bearing Unsecured
(Forward)

- 62 -
*SGVFSM009820*
2020
CategoryAmount/Volume
OutstandingBalance
Receivable(Payable) Terms Conditions
f. Subscriptions payable P=‒ (P=9,375) Noninterest-bearing UnsecuredOther affiliates
g. Sale of property 3,238 38,000Interest-bearing, 5%
per annum UnsecuredLease of property (70,918) ‒ Non-interest bearing Unsecured
Entities under common control
h. Cash and cash equivalents ‒ 2,713,594
Interest-bearing atprevailing bank
deposit rates UnrestrictedInterest earned 18,656 ‒Trust fees 5,670 ‒
i. Accounts receivable - Trade 310,209 64,733 Noninterest-bearingUnsecured, no
impairmentSale of vehicles 77,514 ‒Agency fee income earned 53,330 ‒
j. Dividends earned 306 ‒k. Receivables from related
parties 2,690 51,982 Noninterest-bearingUnsecured, no
impairmentRendering janitorial service 225,921 ‒Other income earned (382) 357Audit fee income earned 2,690 ‒
l. Management fee receivable ‒ 55,290 Noninterest-bearingUnsecured, no
impairmentRendering management
services 104,582 ‒m. Accounts payable and accrued
expenses ‒ 171 Noninterest-bearingUnsecured, no
impairmentRental of office space 6,500 ‒
n. Insurance expense 12,803 ‒Entities with significant influence
o. Management fee receivable 10,530 ‒
Due to related parties ‒ 10,214 Noninterest-bearingUnsecured, no
impairment
2019
CategoryAmount/Volume
OutstandingBalance
Receivable(Payable) Terms Conditions
Parent Company - PMMICa. Accounts payable P=989 (P=357) Noninterest-bearing Unsecured Miscellaneous expenses
incurred 989 ‒b. Dividends declared 27,868 ‒Associates
c. Dividends receivable 30,000 Noninterest-bearingUnsecured, no
impairmentDividends earned 129,100 ‒
d. Receivables fromrelated parties ‒ 305 Noninterest-bearing Unsecured
Rendering managementand audit services 1,755 2,999
Rendering of services ‒ 23,952Extension of advances 797,451 3,402
e. Due to related parties (126,417) (126,417) Noninterest-bearing Unsecuredf. Subscriptions payable ‒ (9,375) Noninterest-bearing Unsecured
(Forward)

- 63 -
*SGVFSM009820*
2019
CategoryAmount/Volume
OutstandingBalance
Receivable(Payable) Terms Conditions
Other affiliatesg. Rendering of construction
services P=7,058 P=76,112Interest-bearing, 5%
per annum Unsecured
Sale of property 5,678 78,000Interest-bearing, 5%
per annum UnsecuredLease of property (67,541) ‒ Non-interest bearing UnsecuredExtension of advances ‒ 68
Entities under common control
h. Cash and cash equivalents ‒ 2,073,885
Interest-bearing atprevailing bank
deposit rates UnrestrictedInterest earned 32,582 ‒
i. Accounts receivable ‒ 108,582 Noninterest-bearingUnsecured, no
impairmentSale of vehicles 161,898 ‒Agency fee income earned 55,584 ‒
j. Dividends earned 29 ‒
k. Commission receivable – 392 Noninterest-bearingUnsecured, no
impairmentCommission earned 133 –
l. Receivables from related parties ‒ 70,930 Noninterest-bearing
Unsecured, noimpairment
Rendering janitorial service 392,037 ‒Other income earned 416 ‒Audit fee income earned 2,858 ‒
m. Management fee receivable ‒ 55,985 Noninterest-bearingUnsecured, no
impairmentRendering management
services 131,559 ‒n. Accounts payable and
accrued expenses ‒ 96 Noninterest-bearing UnsecuredRental of office space 7,312 ‒
o. Insurance expense 12,577 ‒
Parent Company - PMMICa. Accounts payable to PMMIC pertains to unpaid expenses on shared costs such as legal expenses
which are included under “Miscellaneous expense”. Accounts payable to PMMIC as atDecember 31, 2020 and 2019 amounted to P=3.3 million and P0.4 million, respectively.
b. Dividends declared in 2020 and 2019 by the Parent Company amounted to P=0.01 million andP=63.3 million, respectively (Note 40). There were no outstanding dividends payable to PMMICas at December 31, 2020 and 2019.
Associatesc. In 2020 and 2019, dividend income earned from associates amounted to P=152.8 million and
P=129.1 million, respectively. Outstanding dividends receivable from associates as atDecember 31, 2020 and 2019 amounted to P=14.3 million and P=30.0 million, respectively.
d. Receivable from related parties arises from services rendered by the Parent Company and EEI toits associates. These services include management consultancy, internal audit fees and extensionof advances. As at December 31, 2020 and 2019, the Group has an outstanding receivable fromits associates amounting P=35.1 million and P=123.2 million, respectively. Management feeincome charged to associates is fixed per month while audit fee income depends on the auditengagement letter agreed by both parties.
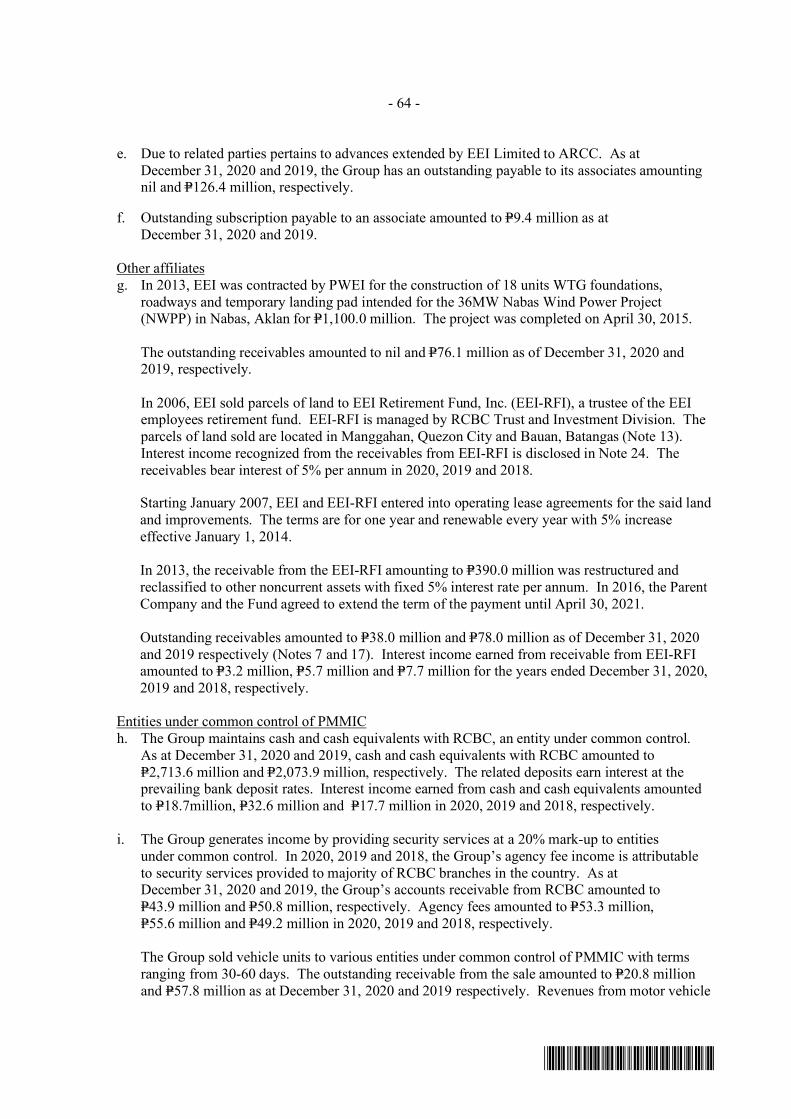
- 64 -
*SGVFSM009820*
e. Due to related parties pertains to advances extended by EEI Limited to ARCC. As atDecember 31, 2020 and 2019, the Group has an outstanding payable to its associates amountingnil and P=126.4 million, respectively.
f. Outstanding subscription payable to an associate amounted to P=9.4 million as atDecember 31, 2020 and 2019.
Other affiliatesg. In 2013, EEI was contracted by PWEI for the construction of 18 units WTG foundations,
roadways and temporary landing pad intended for the 36MW Nabas Wind Power Project(NWPP) in Nabas, Aklan for P=1,100.0 million. The project was completed on April 30, 2015.
The outstanding receivables amounted to nil and P=76.1 million as of December 31, 2020 and2019, respectively.
In 2006, EEI sold parcels of land to EEI Retirement Fund, Inc. (EEI-RFI), a trustee of the EEIemployees retirement fund. EEI-RFI is managed by RCBC Trust and Investment Division. Theparcels of land sold are located in Manggahan, Quezon City and Bauan, Batangas (Note 13).Interest income recognized from the receivables from EEI-RFI is disclosed in Note 24. Thereceivables bear interest of 5% per annum in 2020, 2019 and 2018.
Starting January 2007, EEI and EEI-RFI entered into operating lease agreements for the said landand improvements. The terms are for one year and renewable every year with 5% increaseeffective January 1, 2014.
In 2013, the receivable from the EEI-RFI amounting to P=390.0 million was restructured andreclassified to other noncurrent assets with fixed 5% interest rate per annum. In 2016, the ParentCompany and the Fund agreed to extend the term of the payment until April 30, 2021.
Outstanding receivables amounted to P=38.0 million and P=78.0 million as of December 31, 2020and 2019 respectively (Notes 7 and 17). Interest income earned from receivable from EEI-RFIamounted to P=3.2 million, P=5.7 million and P=7.7 million for the years ended December 31, 2020,2019 and 2018, respectively.
Entities under common control of PMMICh. The Group maintains cash and cash equivalents with RCBC, an entity under common control.
As at December 31, 2020 and 2019, cash and cash equivalents with RCBC amounted toP=2,713.6 million and P=2,073.9 million, respectively. The related deposits earn interest at theprevailing bank deposit rates. Interest income earned from cash and cash equivalents amountedto P=18.7million, P=32.6 million and P=17.7 million in 2020, 2019 and 2018, respectively.
i. The Group generates income by providing security services at a 20% mark-up to entitiesunder common control. In 2020, 2019 and 2018, the Group’s agency fee income is attributableto security services provided to majority of RCBC branches in the country. As atDecember 31, 2020 and 2019, the Group’s accounts receivable from RCBC amounted toP=43.9 million and P=50.8 million, respectively. Agency fees amounted to P=53.3 million,P=55.6 million and P=49.2 million in 2020, 2019 and 2018, respectively.
The Group sold vehicle units to various entities under common control of PMMIC with termsranging from 30-60 days. The outstanding receivable from the sale amounted to P=20.8 millionand P=57.8 million as at December 31, 2020 and 2019 respectively. Revenues from motor vehicle
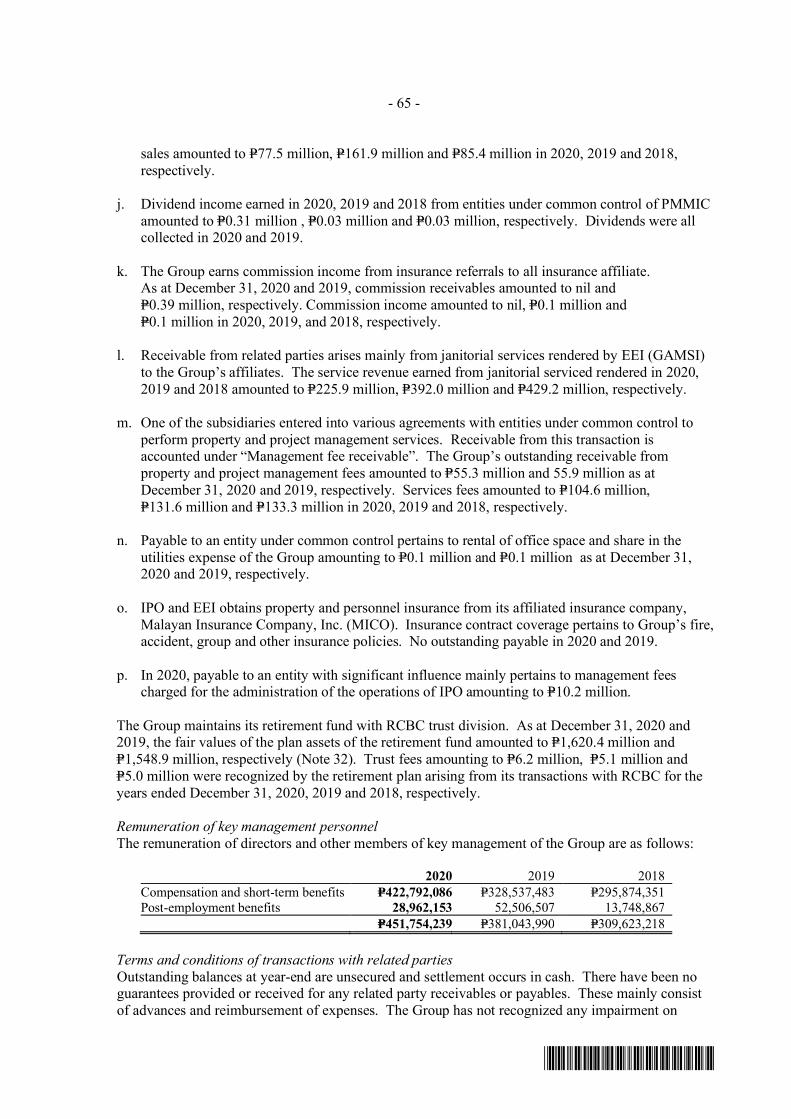
- 65 -
*SGVFSM009820*
sales amounted to P=77.5 million, P=161.9 million and P=85.4 million in 2020, 2019 and 2018,respectively.
j. Dividend income earned in 2020, 2019 and 2018 from entities under common control of PMMICamounted to P=0.31 million , P=0.03 million and P=0.03 million, respectively. Dividends were allcollected in 2020 and 2019.
k. The Group earns commission income from insurance referrals to all insurance affiliate.As at December 31, 2020 and 2019, commission receivables amounted to nil andP=0.39 million, respectively. Commission income amounted to nil, P=0.1 million andP=0.1 million in 2020, 2019, and 2018, respectively.
l. Receivable from related parties arises mainly from janitorial services rendered by EEI (GAMSI)to the Group’s affiliates. The service revenue earned from janitorial serviced rendered in 2020,2019 and 2018 amounted to P=225.9 million, P=392.0 million and P=429.2 million, respectively.
m. One of the subsidiaries entered into various agreements with entities under common control toperform property and project management services. Receivable from this transaction isaccounted under “Management fee receivable”. The Group’s outstanding receivable fromproperty and project management fees amounted to P=55.3 million and 55.9 million as atDecember 31, 2020 and 2019, respectively. Services fees amounted to P=104.6 million,P=131.6 million and P=133.3 million in 2020, 2019 and 2018, respectively.
n. Payable to an entity under common control pertains to rental of office space and share in theutilities expense of the Group amounting to P=0.1 million and P=0.1 million as at December 31,2020 and 2019, respectively.
o. IPO and EEI obtains property and personnel insurance from its affiliated insurance company,Malayan Insurance Company, Inc. (MICO). Insurance contract coverage pertains to Group’s fire,accident, group and other insurance policies. No outstanding payable in 2020 and 2019.
p. In 2020, payable to an entity with significant influence mainly pertains to management feescharged for the administration of the operations of IPO amounting to P=10.2 million.
The Group maintains its retirement fund with RCBC trust division. As at December 31, 2020 and2019, the fair values of the plan assets of the retirement fund amounted to P=1,620.4 million andP=1,548.9 million, respectively (Note 32). Trust fees amounting to P=6.2 million, P=5.1 million andP=5.0 million were recognized by the retirement plan arising from its transactions with RCBC for theyears ended December 31, 2020, 2019 and 2018, respectively.
Remuneration of key management personnelThe remuneration of directors and other members of key management of the Group are as follows:
2020 2019 2018Compensation and short-term benefits P=422,792,086 P=328,537,483 P=295,874,351Post-employment benefits 28,962,153 52,506,507 13,748,867
P=451,754,239 P=381,043,990 P=309,623,218
Terms and conditions of transactions with related partiesOutstanding balances at year-end are unsecured and settlement occurs in cash. There have been noguarantees provided or received for any related party receivables or payables. These mainly consistof advances and reimbursement of expenses. The Group has not recognized any impairment on
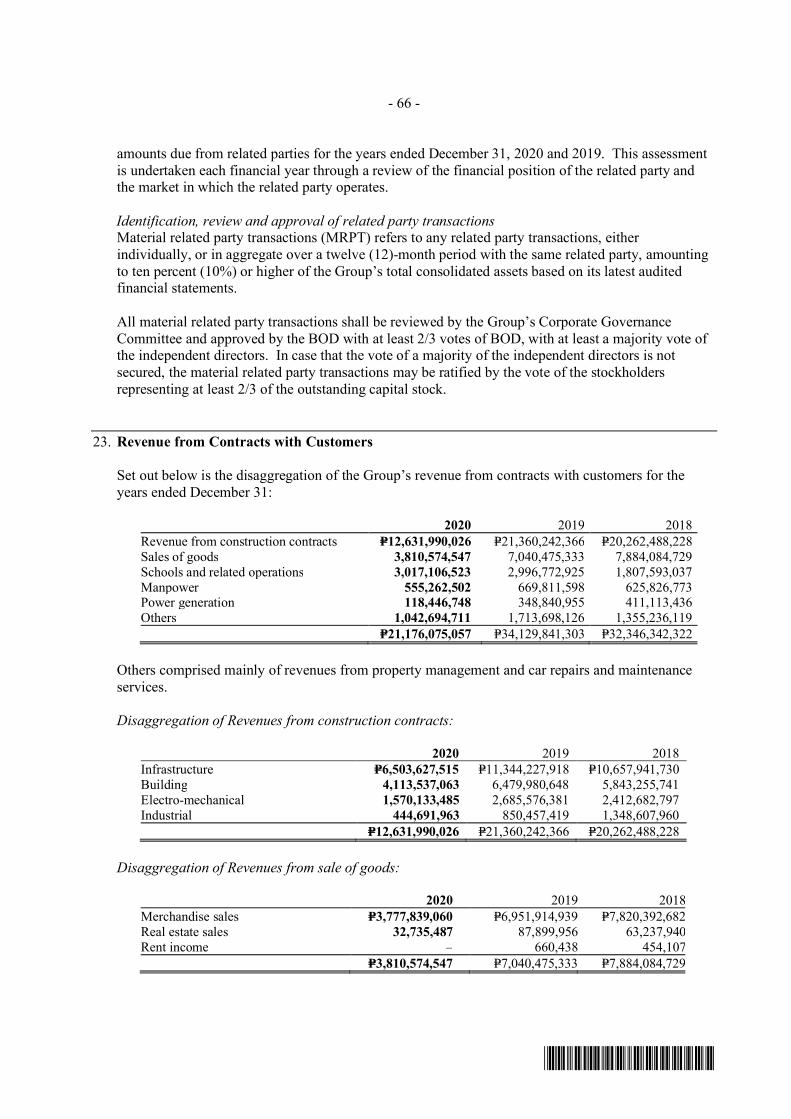
- 66 -
*SGVFSM009820*
amounts due from related parties for the years ended December 31, 2020 and 2019. This assessmentis undertaken each financial year through a review of the financial position of the related party andthe market in which the related party operates.
Identification, review and approval of related party transactionsMaterial related party transactions (MRPT) refers to any related party transactions, eitherindividually, or in aggregate over a twelve (12)-month period with the same related party, amountingto ten percent (10%) or higher of the Group’s total consolidated assets based on its latest auditedfinancial statements.
All material related party transactions shall be reviewed by the Group’s Corporate GovernanceCommittee and approved by the BOD with at least 2/3 votes of BOD, with at least a majority vote ofthe independent directors. In case that the vote of a majority of the independent directors is notsecured, the material related party transactions may be ratified by the vote of the stockholdersrepresenting at least 2/3 of the outstanding capital stock.
23. Revenue from Contracts with Customers
Set out below is the disaggregation of the Group’s revenue from contracts with customers for theyears ended December 31:
2020 2019 2018Revenue from construction contracts P=12,631,990,026 P=21,360,242,366 P=20,262,488,228Sales of goods 3,810,574,547 7,040,475,333 7,884,084,729Schools and related operations 3,017,106,523 2,996,772,925 1,807,593,037Manpower 555,262,502 669,811,598 625,826,773Power generation 118,446,748 348,840,955 411,113,436Others 1,042,694,711 1,713,698,126 1,355,236,119
P=21,176,075,057 P=34,129,841,303 P=32,346,342,322
Others comprised mainly of revenues from property management and car repairs and maintenanceservices.
Disaggregation of Revenues from construction contracts:
2020 2019 2018Infrastructure P=6,503,627,515 P=11,344,227,918 P=10,657,941,730Building 4,113,537,063 6,479,980,648 5,843,255,741Electro-mechanical 1,570,133,485 2,685,576,381 2,412,682,797Industrial 444,691,963 850,457,419 1,348,607,960
P=12,631,990,026 P=21,360,242,366 P=20,262,488,228
Disaggregation of Revenues from sale of goods:
2020 2019 2018Merchandise sales P=3,777,839,060 P=6,951,914,939 P=7,820,392,682Real estate sales 32,735,487 87,899,956 63,237,940Rent income ‒ 660,438 454,107
P=3,810,574,547 P=7,040,475,333 P=7,884,084,729

- 67 -
*SGVFSM009820*
Disaggregation of Revenue from schools and related operations:
2020 2019 2018Tuition and other matriculation fees P=2,950,748,493 P=2,829,934,217 P=1,671,496,122Other student-related income:
Bookstore sales 7,589,123 50,654,978 39,828,321Seminar fee income 4,352,513 16,572,886 14,335,836Others 54,416,394 99,610,844 81,932,758
P=3,017,106,523 P=2,996,772,925 P=1,807,593,037
Performance obligationsThe Group recognized revenue amounting to P=12.2 billion and P=16.5 billion in 2020 and 2019,respectively, from performance obligations partially satisfied in the previous periods.
Information about the Group’s performance obligations are summarized below:
The transaction price allocated to the remaining performance obligations of the Group (unsatisfied orpartially unsatisfied) that have an original expected duration of more than one year as at December 31are as follows:
2020 2019 2018Within one year P=12,653,212,583 P=8,803,236,672 P=4,646,334,288More than one year 30,942,788,536 47,698,616,553 2,379,773
P=43,596,001,119 P=56,501,853,225 P=4,648,714,061
24. Other Income - Net
This account consists of:
2020 2019 2018Dividend income P=37,855,583 P=54,808,659 P=954,613Interest income 36,588,692 60,989,962 59,012,581Gain on sale of assets 15,059,741 101,940,621 24,981,758Space and car rental 8,658,371 ‒ ‒Commission income 7,142,857 ‒ ‒Rental income 6,418,072 25,194,574 42,195,891Income from reversal of impairment 5,237,506 ‒ 40,702Tax refund/discount 249,490 4,804,879 392,721Foreign exchange gain (loss) (49,676,282) (38,607,477) 56,505,871Miscellaneous 61,234,103 16,156,116 35,884,277
P=128,768,133 P=225,287,334 P=219,968,414
Gain on sale of assets arose from the sale of the following assets:
2020 2019 2018Property and equipment (Note 13) P=14,855,241 P=101,530,669 P=17,058,635Investment properties (Note 16) 204,500 409,952 7,923,123
P=15,059,741 P=101,940,621 P=24,981,758

- 68 -
*SGVFSM009820*
Interest income consists of income from:
2020 2019 2018Savings deposit and short-term
investments (Note 6) P=25,104,821 P=37,191,409 P=17,532,694Receivable from EEI-RFI (Notes 7,
17 and 22) 3,237,599 5,677,703 7,671,131Installment contract receivable 2,288,438 10,647,486 19,396,680Others 5,957,834 7,473,364 14,412,076
P=36,588,692 P=60,989,962 P=59,012,581
In 2020, 2019 and 2018, certain payables that were long-outstanding amounting to P=5.24 million, nil,and P=0.04 million, respectively, were written-off and recognized as other income. Based onmanagement’s assessment, the settlement of these payables are remote.
Miscellaneous include income from sale of sludge and used oil and rebate from purchase of fuel,among others.
25. Costs of Sales and Services
This account consists of:
2020 2019 2018Cost of services (Note 27)
Cost of construction contracts P=15,038,354,818 P=18,825,368,263 P=17,774,856,638 Cost of manpower and other
services 1,125,289,917 1,905,955,718 1,716,344,33416,163,644,735 20,731,323,981 19,491,200,972
Cost of goods sold Cost of merchandise sold
(Note 26) 3,624,366,462 6,543,465,005 7,243,611,097Cost of real estate sold (Note 9) 22,465,250 60,914,479 38,321,997
3,646,831,712 6,604,379,484 7,281,933,094Cost of tuition and other fees
(Note 28) 2,015,408,058 2,038,844,353 1,279,402,975P=21,825,884,505 P=29,374,547,818 P=28,052,537,041
26. Cost of Merchandise Sold
This account consists of (Notes 9 and 25):
2020 2019 2018Inventory, beginning P=2,122,740,026 P=2,465,032,904 P=809,783,825Purchases 3,149,623,135 6,185,829,667 8,890,747,762Total goods available for sale 5,272,363,161 8,650,862,571 9,700,531,587Less inventory end 1,657,262,683 2,122,740,026 2,465,032,904Cost of inventories sold 3,615,100,478 6,528,122,545 7,235,498,683Personnel expenses 5,957,078 7,547,944 5,171,961Others 3,308,906 7,794,516 2,940,453
P=3,624,366,462 P=6,543,465,005 P=7,243,611,097

- 69 -
*SGVFSM009820*
27. Cost of Services
2020 2019 2018Cost of construction contracts
(Note 25)Labor P=6,592,720,054 P=5,918,411,505 P=6,725,263,743Materials 4,745,558,101 6,909,445,920 2,669,585,470Equipment costs and others 3,182,242,113 5,449,447,595 7,846,306,554Depreciation and amortization
(Notes 13, 14 and 29) 517,834,550 548,063,243 533,700,87115,038,354,818 18,825,368,263 17,774,856,638
Cost of manpower and other services(Note 25)Personnel expenses 626,705,529 808,871,227 779,402,074Materials 238,395,229 460,667,622 432,461,177Parts and accessories 98,867,614 319,374,007 277,309,550Depreciation and amortization
(Notes 13, 14 and 29) 13,483,485 85,027,698 48,899,227Others 147,838,060 232,015,164 178,272,306
1,125,289,917 1,905,955,718 1,716,344,334P=16,163,644,735 P=20,731,323,981 P=19,491,200,972
28. Cost of Tuition and Other Fees
This amount consists of:
2020 2019 2018Personnel expenses P=1,037,807,796 P=927,213,682 P=608,761,306Depreciation and amortization
(Notes 13, 14, 16 and 17) 372,612,389 336,843,147 187,605,487Management and other professional fees 129,207,556 166,467,504 113,974,424Student-related expenses 100,529,199 216,292,493 110,314,055Periodicals 89,553,547 40,197,909 21,693,225IT expense - software license 76,467,455 45,668,629 36,622,759Utilities 61,547,432 128,761,390 84,042,240Accreditation cost 31,681,806 11,121,935 8,951,062Repairs and maintenance 20,049,447 34,663,605 15,720,212Advertising 18,478,261 19,696,101 19,901,017Tools and library books (Note 13) 17,587,086 33,969,025 26,333,830Research and development fund 10,738,408 16,210,975 8,806,118Insurance 10,600,753 10,100,644 7,350,745Taxes and licenses 7,320,662 2,880,056 1,527,092Seminar 7,266,635 16,769,308 12,667,874Office supplies 6,437,394 16,083,800 7,405,855Laboratory supplies 3,727,810 7,955,109 3,810,433Entertainment, amusement and
recreation 1,209,702 1,375,485 510,375Transportation and travel 917,313 2,162,552 1,844,524Rent 183,544 430,020 205,301Miscellaneous 11,483,863 3,980,984 1,355,041
P=2,015,408,058 P=2,038,844,353 P=1,279,402,975
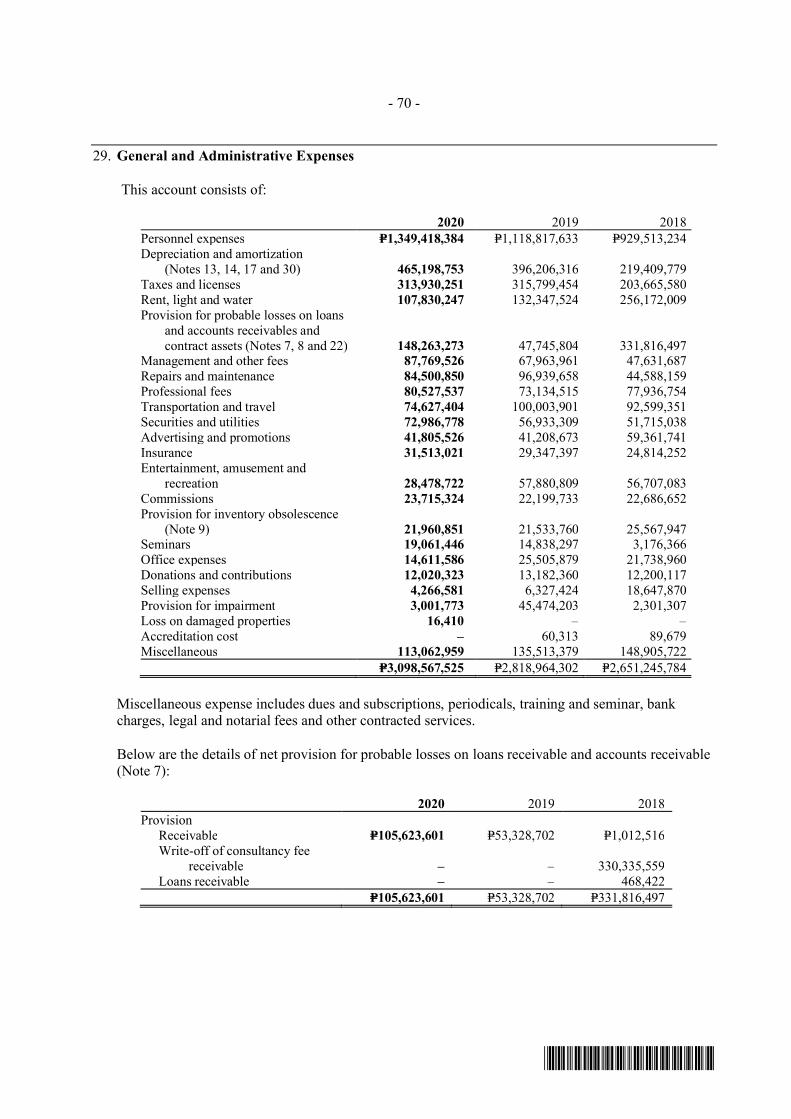
- 70 -
*SGVFSM009820*
29. General and Administrative Expenses
This account consists of:
2020 2019 2018Personnel expenses P=1,349,418,384 P=1,118,817,633 P=929,513,234Depreciation and amortization
(Notes 13, 14, 17 and 30) 465,198,753 396,206,316 219,409,779Taxes and licenses 313,930,251 315,799,454 203,665,580Rent, light and water 107,830,247 132,347,524 256,172,009Provision for probable losses on loans
and accounts receivables andcontract assets (Notes 7, 8 and 22) 148,263,273 47,745,804 331,816,497
Management and other fees 87,769,526 67,963,961 47,631,687Repairs and maintenance 84,500,850 96,939,658 44,588,159Professional fees 80,527,537 73,134,515 77,936,754Transportation and travel 74,627,404 100,003,901 92,599,351Securities and utilities 72,986,778 56,933,309 51,715,038Advertising and promotions 41,805,526 41,208,673 59,361,741Insurance 31,513,021 29,347,397 24,814,252Entertainment, amusement and
recreation 28,478,722 57,880,809 56,707,083Commissions 23,715,324 22,199,733 22,686,652Provision for inventory obsolescence
(Note 9) 21,960,851 21,533,760 25,567,947Seminars 19,061,446 14,838,297 3,176,366Office expenses 14,611,586 25,505,879 21,738,960Donations and contributions 12,020,323 13,182,360 12,200,117Selling expenses 4,266,581 6,327,424 18,647,870Provision for impairment 3,001,773 45,474,203 2,301,307Loss on damaged properties 16,410 ‒ ‒Accreditation cost ‒ 60,313 89,679Miscellaneous 113,062,959 135,513,379 148,905,722
P=3,098,567,525 P=2,818,964,302 P=2,651,245,784
Miscellaneous expense includes dues and subscriptions, periodicals, training and seminar, bankcharges, legal and notarial fees and other contracted services.
Below are the details of net provision for probable losses on loans receivable and accounts receivable(Note 7):
2020 2019 2018Provision
Receivable P=105,623,601 P=53,328,702 P=1,012,516Write-off of consultancy fee
receivable ‒ ‒ 330,335,559Loans receivable ‒ ‒ 468,422
P=105,623,601 P=53,328,702 P=331,816,497

- 71 -
*SGVFSM009820*
30. Depreciation and Amortization
This account consists of depreciation and amortization included in Notes 13, 14 and 17:
2020 2019 2018Cost of sales and services
Construction contracts (Note 27) P=517,834,550 P=548,063,243 P=533,700,871Tuition and other fees (Note 28) 372,612,389 336,843,147 187,605,487Manpower and other services
(Note 27) 13,483,485 85,027,698 48,899,277Capitalized as part of cost of
inventories ‒ ‒ 554,093903,930,424 969,934,088 770,759,728
General and administrative expenses(Note 29) 465,198,753 396,206,316 219,409,779
P=1,369,129,177 P=1,366,140,404 P=990,169,507
Depreciation and amortization for the different assets follow:
2020 2019 2018Property and equipment (Note 13) P=1,141,943,922 P=1,112,635,318 P=982,974,860Right-of-use asset (Note 14) 220,146,604 246,866,013 ‒Computer software (Note 17) 7,038,651 6,621,573 6,848,413Investment property (Note 16) ‒ 17,500 346,234
P=1,369,129,177 P=1,366,140,404 P=990,169,507
31. Interest and Finance Charges
The Group’s interest and finance charges consist of interest on the following:
2020 2019 2018Long-term debt (Note 20) P=159,410,033 P=124,062,908 P=92,904,155Loans payable (short-term) (Note 19) 434,306,860 561,555,227 358,786,552Lease liabilities (Note 14) 107,042,613 79,459,539 ‒Advances to affiliates and other
finance charges (Note 22) 11,811,591 15,532,583 4,060,882P=712,571,097 P=780,610,257 P=455,751,589
32. Retirement Plan
The Group has funded, noncontributory retirement plans (the Plans) for all of its regular employees,in compliance with RA No. 7641, The New Retirement Pay Law. The Plans provide for normal,early retirement, death and disability benefits. The most recent actuarial valuation was made for theGroup’s retirement plans as of December 31, 2020.

- 72 -
*SGVFSM009820*
The following tables summarize the components of the benefit expense recognized in theconsolidated statements of comprehensive income and amounts recognized in the consolidatedstatements of financial position for the retirement plans.
2020 2019Retirement liabilities P=611,599,429 P=457,836,487Retirement assets 4,726,582 18,289,597Net retirement liabilities 606,872,847 439,546,890Net retirement expenses 186,330,471 124,715,271
The net retirement expenses recognized by the Group (included in personnel expense in theconsolidated statements of comprehensive income) are as follows:
2020 2019 2018Current service cost P=180,066,728 P=117,938,111 P=128,964,699Net interest cost 19,356,338 6,777,160 5,152,317Past service cost (7,488,530) ‒ (1,779,531)Actuarial gain on settlement (5,604,065) ‒ ‒
P=186,330,471 P=124,715,271 P=132,337,485
The amounts recognized in the consolidated statements of financial position follow:
Net retirement liabilities 2020 2019Present value of defined benefit obligation P=2,175,645,385 P=1,948,334,688Fair value of plan assets (1,564,045,956) (1,490,498,201)
P=611,599,429 P=457,836,487
Net retirement assets 2020 2019Present value of defined benefit obligation P=51,603,000 P=37,445,007Fair value of plan assets (56,484,000) (57,957,371)Effect of asset ceiling 154,418 2,222,767
(P=4,726,582) (P=18,289,597)
The movements in the net retirement liability follow:
2020 2019Balance at beginning of year P=439,546,890 P=112,957,899Net retirement expense 186,330,471 135,946,303Remeasurement loss 148,660,020 317,906,260Adjustment to defined benefit obligation 17,576,834 23,278,771Derecognition (224,503) ‒Benefit paid (5,630,563) ‒Contributions (179,386,302) (147,248,479)Withdrawal of plan asset ‒ (3,293,864)Balance at end of year P=606,872,847 P=439,546,890

- 73 -
*SGVFSM009820*
The movements in the present value of defined obligation follow:
2020 2019Balance at beginning of year P=1,988,485,244 P=1,399,830,973Current service cost 181,473,856 119,094,029Remeasurement loss 164,004,573 323,703,290Interest cost on obligation 94,231,893 104,910,736Gain on settlement (5,604,065) ‒Past service cost (7,488,530) ‒Reversal of defined benefit obligation (14,785,084) ‒Derecognition (16,690,967) ‒Benefits paid (156,378,535) (137,046,331)New subsidiaries ‒ 174,483,709Transfer from affiliates ‒ 3,508,838Balance at end of year P=2,227,248,385 P=1,988,485,244
The movements in the fair value of plan assets follow:
2020 2019Balance at beginning of year P=1,548,938,354 P=1,286,873,075Contributions 183,270,404 142,695,168Asset return in net interest cost 75,324,201 99,112,880Remeasurement gain 15,344,553 5,797,030Derecognition (16,446,464) ‒Adjustments to plan assets (33,573,288) 117,605Benefits paid (152,482,222) (127,654,322)New subsidiaries ‒ 139,088,080Transfer from affiliates ‒ 3,508,838Withdrawal of plan assets ‒ (600,000)Balance at end of year P=1,620,375,538 P=1,548,938,354
The Group derecognized the present value of defined benefit obligation and fair value of plan asset ofthe closed car dealership branches namely Honda Cars Fairview, Honda Cars Marikina, and HondaCars Kalookan.
The major categories of plan assets and its fair value are as follows:
2020 2019Cash P=473,097,185 P=312,759,829Investment in government securities 727,163,282 785,172,322Investments in shares of stock 327,580,235 311,852,866Investments in other securities and debt instruments 82,941,015 134,693,827Interest receivables and other receivables 14,856,362 13,268,786Accrued trust fees and other payables (5,262,541) (8,809,276)
P=1,620,375,538 P=1,548,938,354
The Group expects to contribute P=181.91 million to its defined benefit retirement plans in 2021.
The Retirement fund (Fund) of the Group is being maintained and managed, in trust, by RCBC Trustand Investment Group (TIG), an affiliate financial institution.

- 74 -
*SGVFSM009820*
Trust fees paid in 2020, 2019 and 2018 amounted to P=6.17 million, P=5.20 million and P=5.00 million,respectively.
The composition of the fair value of the trust fund includes:
Investment in government securities - include investment in Philippine Retail Treasury Bonds (RTBs)and Fixed Rate Treasury Notes (FXTNs).
Cash - include savings and time deposit with affiliated bank and special deposit account with BangkoSentral ng Pilipinas (BSP SDA).
Investment in equity securities - include investment in common and preferred shares traded in thePhilippine Stock Exchange.
Investment in debt and other securities - include investment in long-term debt notes and retail bonds.
Interest and other receivables - pertain to interest and dividends receivable on the investments in thefund.
In 2020, the Fund has investment in equity securities of related parties with fair values andaccumulated loss of P=93.17 million and P=10.1 million, respectively.
In 2019, the Fund has investment in equity securities of related parties with fair values andaccumulated gain of P=99.0 million and P=60.1 million, respectively.
In 2018, the Fund has investment in equity securities of related parties with fair values andaccumulated gain of P=120.2 million and P=60.5 million, respectively.
The voting rights of the above equity securities were assigned to RCBC TIG, being the investmentmanager who manages and administers the investments and reinvestments of the fund.
The principal actuarial assumptions used in determining retirement expense are as follows:
2020 2019Discount rate
Beginning 4.79%-5.54% 7.26%-7.38%End 3.42%-6.00% 4.79%-5.54%
Future salary increasesBeginning 3.00%-6.61% 3.00%-6.50%End 3.00%-6.50% 3.00%-6.61%
The sensitivity analysis that follows has been determined based on reasonably possible changes ofeach significant assumption on the retirement benefit obligation as of the end of financial reportingdate, assuming all other assumptions were held constant.
2020 2019
Increase(decrease)
Effect ondefined benefit
obligationIncrease
(decrease)
Effect ondefined benefit
obligationDiscount rates +50bps to +100bps (P=227,516,665) +50bps to +100bps (P=329,123,394)
-50bps to -100bps 396,070,475 -50bps to -100bps 388,635,316Salary increase rates +50bps to +100bps 415,504,646 +50bps to +100bps 474,793,299
-50bps to -100bps (239,653,997) -50bps to -100bps (386,285,183)

- 75 -
*SGVFSM009820*
33. Income Taxes
The reconciliation between the statutory and effective income tax rates follows:
2020 2019 2018Statutory income tax rate (30.00%) 30.00% 30.00%Add (deduct) reconciling items:
Equity in net loss (earnings) ofassociates and joint venture (13.86) (0.66) 4.62
Movement of deferred incometax assets not recognized (1.01) (1.59) ‒
Others 2.02 (5.97) (4.62)Effective income tax rate (42.85%) 21.78% 30.00%
All companies in the Group are subject to the RCIT rate of 30%, except for MESI, MHSSI MCLI,MCMI, UNC, NTC and APEC which are subject to a lower tax rate of 10%.
The Group’s net deferred tax assets and liabilities consist of the following:
2020 2019Net deferred income tax assets on a per subsidiary
level:NOLCO P=1,305,283,658 P=9,550,041Remeasurement loss on defined benefit plans 155,273,331 129,563,769
Allowance for ECL, inventory,obsolescence and other expenses 79,197,282 36,120,706
Unrealized foreign exchange loss 10,554,361 9,192,817Retirement 6,926,610 3,238,393MCIT 26,234,789 10,440,784Excess of right-of-use-assets over lease liability (15,357,951) (43,623,303)Others 12,284,682 40,537,182
P=1,580,396,762 P=195,020,389
Net deferred income tax liabilities on a per subsidiarylevel:
Revaluation increment on land P=1,055,891,512 P=795,578,682Accrued expenses (15,430,739) 89,474,043Retirement (32,125,335) (18,883,312)Others 39,404,399 157,360,861
P=1,047,739,837 P=1,023,530,274
The reconciliation of the Group’s net deferred tax liabilities (assets) follow:
2020 2019Balance at beginning of year P=828,509,885 P=405,471,104Tax expense (income) recognized in:
Other comprehensive income 35,108,099 452,743,111Profit and loss (1,396,274,909) (29,704,330)
(P=532,656,925) P=828,509,885

- 76 -
*SGVFSM009820*
The Group did not recognize deferred tax assets on the following temporary differences because theGroup believes that it may not be probable that sufficient taxable income will be available in the nearforeseeable future against which the tax benefit can be realized.
2020 2019Allowance for ECL, inventory obsolescence and
other expenses P=169,436,196 P=119,304,699NOLCO 160,333,661 85,601,553MCIT 6,090,550 6,239,920Accrued retirement expense 1,005,000 6,466,559Others 41,000 794,385
On September 30, 2020, the Bureau of Internal Revenue (BIR) issued Revenue Regulations (RR) No.25-2020 implementing Section 4 (bbbb) of “Bayanihan to Recover As One Act” which states that theNOLCO incurred for taxable years 2020 and 2021 can be carried over and claimed as a deductionfrom gross income for the next five (5) consecutive taxable years immediately following the year ofsuch loss.
As of December 31, 2020, the Group has incurred NOLCO in taxable year 2020 which can beclaimed as deduction from the regular taxable income for the next five (5) consecutive taxable yearspursuant to the Bayanihan to Recover As One Act, as follows:
Year incurred Amount Applied/Expired Balance Expiry Year2020 P=4,372,873,806 P=‒ P= 4,372,873,806 2025
As of December 31, 2020, the amount of NOLCO incurred before taxable year 2020 which can beclaimed as deduction from the regular taxable income for the next three (3) consecutive taxable years:
Year incurred Amount Applied/Expired Balance Expiry Year2019 P=30,586,211 P=436,657 P=30,149,554 20222018 46,936,501 22,168 46,914,333 20212017 31,932,649 31,932,649 ‒ 2020
P=109,455,361 P=32,391,474 P=77,063,887
As of December 31, 2020, the amounts of MCIT still allowable as tax credit consist of:
Year incurred Amount Applied/Expired Balance Expiry Year2020 P=15,757,849 P=‒ P=15,757,849 20232019 14,444,622 ‒ 14,444,622 20222018 2,122,868 ‒ 2,122,868 20212017 113,214 113,214 ‒ 2020
P=32,438,553 P=113,214 P=32,325,339
RA No. 11534 otherwise known as the Corporate Recovery and Tax Incentives for Enterprises Act orCREATEPresident Rodrigo Duterte signed into law on March 26, 2021 the Corporate Recovery and TaxIncentives for Enterprises (CREATE) Act to attract more investments and maintain fiscal prudenceand stability in the Philippines. RA No. 11534 or the CREATE Act introduces reforms to thecorporate income tax and incentives systems. It takes effect 15 days after its complete publication inthe Official Gazette or in a newspaper of general circulation or April 11, 2021.

- 77 -
*SGVFSM009820*
The following are the key changes to the Philippine tax law pursuant to the CREATE Act which havean impact on the Group
• Effective July 1, 2020, RCIT rate is reduced from 30% to 25% for domestic and resident foreigncorporations. For domestic corporations with net taxable income not exceeding P=5 million andwith total assets not exceeding P=100 million (excluding land on which the business entity’soffice, plant and equipment are situated) during the taxable year, the RCIT rate is reduced to20%.
• MCIT rate reduced from 2% to 1% of gross income effective July 1, 2020 to June 30, 2023.
• Imposition of improperly accumulated earnings tax is repealed.
As clarified by the Philippine Financial Reporting Standards Council in its Philippine InterpretationsCommittee Q&A No. 2020-07, the CREATE Act was not considered substantively enacted as ofDecember 31, 2020 even though some of the provisions have retroactive effect to July 1, 2020. Thepassage of the CREATE Act into law on March 26, 2021 is considered as a non-adjusting subsequentevent. Accordingly, current and deferred taxes as of and for the year ended December 31, 2020continued to be computed and measured using the applicable income tax rates as of December 31,2020 (i.e., 30% RCIT / 2% MCIT) for financial reporting purposes.
Applying the provisions of the CREATE Act, the Group would have been subjected to lower regularcorporate income tax rate of 25% effective July 1, 2020. This will result in lower provision forcurrent income tax for the year ended December 31, 2020 and lower income tax payable as ofDecember 31, 2020, which will be reflected in the Group’s 2020 annual income tax return but willonly be recognized for financial reporting purposes in its 2021 consolidated financial statements.This will result in lower deferred tax assets and liabilities as of December 31, 2020 and provision fordeferred tax for the year then ended by P=259.25 million. These reductions will be recognized in the2021 consolidated financial statements.
34. Earnings Per Share
Basic and diluted earnings (loss) per share amounts attributable to equity holders of the Group arecomputed as follows:
Basic earnings (loss) per share
2020 2019 2018Net income (loss) (P=824,954,066) P=974,033,430 P=848,267,992Less dividends attributable to
preferred shares 86,529 23,302,357 24,732,938Net income (loss) applicable to
common shares (825,040,595) 950,731,073 823,535,054Divided by the weighted average
number of common shares 776,465,281 776,465,281 615,996,114Basic earnings (loss) per share (P=1.0626) P=1.2244 P=1.3369

- 78 -
*SGVFSM009820*
Diluted earnings (loss) per share
2020 2019 2018Net income (loss) applicable
common share for basic earningsper share (P=825,040,595) P=950,731,073 P=823,535,054
Add dividends attributable topreferred shares ‒ ‒ 24,732,938
Net income (loss) applicable tocommon stockholders for dilutedearnings per share (825,040,595) 950,731,073 848,267,992
Weighted average number of sharesof common stock 776,465,281 776,465,281 615,996,114
Dilutive shares arising fromconvertible preferred stock – ‒ 164,942,770
Weighted average number of sharesof common stock for dilutedearnings per share 776,465,281 780,938,881 780,938,884
Diluted earnings (loss) per share (P=1.0626) P=1.2244 P=1.0862
In 2020 and 2019, the preferred stock conversion to common share has significantly reduced thenumber of potential common stock outstanding as of December 31, 2020 and 2019 making theoptions anti-dilutive, hence, no diluted earnings per share calculated. Thus, basic and diluted EPS arestated at the same amount.
The weighted average number of shares of common stock is computed as follows:
2020 2019 2018Number of shares of common stock
issued 776,765,281 776,765,281 616,296,114Less treasury shares 300,000 300,000 300,000
776,465,281 776,465,281 615,996,114
35. Contingencies and Commitments
Provisions and Contingenciesa. The Group is involved in certain claims arising from the ordinary conduct of business which are
either pending decision by the courts or are being contested, the outcome of which are notpresently determinable. The estimate of the probable costs for the resolution of these claims hasbeen developed in consultation with external counsels handling the defense in these matters and isbased upon an analysis of potential results. The ultimate disposition of these matters cannot bedetermined with certainty. The Group will exhaust all legal remedies available to it in defendingitself in these claims and proceedings.
The disclosure of additional details beyond the present disclosure may prejudice the Group’sposition and negotiation strategies with respect to these matters. Thus, as allowed underparagraph 92 of PAS 37, Provisions, Contingent Liabilities and Contingent Assets, only a generaldescription is provided.

- 79 -
*SGVFSM009820*
b. Prior to 2018, the Group’s provisions include the Group’s recognized payable associated with theFaculty Associations of Mapua Institute of Technology (FAMIT) reranking case. This caseinvolves the faculty ranking and evaluation instrument that was part of the 2001 CollectiveBargaining Agreement negotiations with the FAMIT. The Supreme Court reversed an earlierCourt of Appeals decision in favor of Management. An entry of judgment dated March 13, 2008was made in the Supreme Court Book of Entries of Judgments, making the decision final andexecutory. A Memorandum of Agreement was entered into by management with FAMIT beforethe Voluntary Arbitrators wherein the parties agreed to continue the process of faculty ranking.The evaluation process was completed in December 2008.
On January 22, 2009, MESI and FAMIT entered into a Compromise Agreement regarding thepayment of the amounts due to the permanent faculty members of MESI in relation to the facultyreranking case.
As at December 31, 2018, total accumulated payments to faculty members amounted toP=230.78 million. Management assessed that the liability already prescribed after applying the10-year prescription period which ended in March 2018 (Note 18).

- 80 -
*SGVFSM009820*
36. Non-controlling Interests
The summarized financial information attributable to non-controlling interests for significant subsidiaries as of and for the years ended December 31, 2020,2019 and 2018 are as shown below:
Honda Cars Kalookan, Inc. (HCKI)(a) iPeople, inc. (IPO) and Subsidiaries(b) EEI Corporation (EEI) and Subsidiaries(c) La Funeraria Paz Sucat, Inc. (d)2020 2019 2018 2020 2019 2018 2020 2019 2018 2020 2019
AssetsCurrent assets P=380 P=671 P=777 P=2,662 P=2,316 P=1,007 15,938 P=18,223 P=12,536 P=37 P=29Noncurrent assets 122 235 95 13,050 13,957 8,965 10,955 9,824 9,919 97 127
502 906 872 15,712 16,273 9,972 26,893 28,047 22,455 134 156
Liabilities and EquityCurrent liabilities P=462 P=665 P=739 P=2,298 P=3,464 P=3,310 14,374 P=15,023 P=12,514 P=15 P=29Noncurrent liabilities 58 135 11 2,922 3,076 248 6,111 4,419 2,229 34 37
520 800 750 5,220 6,540 3,558 20,485 19,442 14,743 49 66
Revenue P=1,175 P=2,717 P=2,966 P=3,017 P=2,997 P=1,809 13,881 P=23,581 P=22,148 P=84 P=141
Net income (loss) (P=121) (P=6) P=11 P=242 274 237 (2,072) P=1,155 P=529 P=4 P=14
Total comprehensiveincome (loss) (P=124) (P=8) P=9 P=832 232 581 (2,197) P=1,070 P=1,081 P=4 P=15
Share of NCI in net assets (P=11) P=48 P=55 P=4,336 P=5,044 P=2,095 3,083 P=3,902 P=3,520 P=32 P=35
Share of NCI in net income(loss) (P=54) (P=3) P=5 P=127 P=142 P=77 (914) P=524 P=241 P=2 P=8
Dividends paid P=‒ P=3 P=11 P=38 P=23 P=59 P=‒ P=94 P=‒ P=5 P=5
Operating P=117 P=142 P=109 P=95 P=988 P=556 (2,418) P=991 (P=1,538) P=34 P=31Investing 96 (10) 4 1,220 (1,073) (1,819) 778 (235) (677) (15) (15)Financing (205) (210) (112) (1,152) 651 1,218 1,824 (633) 2,581 (17) (14)(a) Proportion of ownership owned by non-controlling interests as of December 31, 2020 and 2019: 45.00%(b) Proportion of ownership owned by non-controlling interests as of December 31, 2020 and 2019: 51.82%(c) Proportion of ownership owned by non-controlling interests as of December 31, 2020 and 2019: 44.66% and 45.35%, respectively(d) Proportion of ownership owned by non-controlling interests as of December 31, 2020 and 2019: 37.00%

- 81 -
*SGVFSM009820*
Material Partly-Owned SubsidiariesIn February 2020, the Parent Company purchased additional 7,100,000 EEI shares for P=59.97 millionresulting to an increase in ownership interest from 54.65% to 55.34%. The non-controlling interestdecreased from 45.35% to 44.66%.
In May 2019, the Parent Company sold the 281,642 shares of MESI to IPO, which represents 7%ownership in MESI. With this acquisition, MESI became 100% indirectly-owned subsidiary of theParent Company through IPO. Subsequently, IPO issued 295,329,976 common shares from itsunissued capital stock to AC, the parent company of AEI, in exchange for the merger of IPO andAEI, with IPO being the surviving corporation. Upon merger, the Parent Compay’s ownershipinterest over IPO was reduced from 67.34% to 48.18%. The non-controlling interest increased from32.66% to 51.82% or an increase of P=2.52 billion.
In November 2019, the Parent Company purchased additional 3,000,000 EEI shares forP=40.00 million or 10.32 per share resulting to an increase in ownership interest from 54.36% to54.65%. The non-controlling interest decreased from 45.64% to 45.35% or a decrease ofP=40.38 million.
In March 2019, the Parent Company purchased additional 90,000 shares of LFPSI forP=25.00 million resulting to an increase in direct ownership from 37.50% to 50.00%. The ParentCompany’s effective interest including its indirect ownership through MMPC is 63.00% in 2019. Asa result, Parent Company has obtained control over LFPSI and started accounted for the investee as asubsidiary using consolidation method under PFRS 10. The non-controlling interest in 2019 is27.00% or P=38.45 million.
In July 2019, the Parent Company sold its 50% shares in ZIFC to various individuals amounting toP=6.80 million resulting to a loss of ownership interest from 50% to 0%. The non-controlling interestdisposed in 2019 is P=12.10 million.
The Group recognized equity reserve from the changes in ownership amounting to a decrease byP=18.75 million and an increase by P=1,821.7 million in 2020 and 2019, respectively. This wasincluded in “Equity reserve” representing the excess consideration paid for the carrying amount of thenon-controlling interest.
37. Operating Segment Information
For management purposes, the Group’s operating businesses are organized and managed separatelyaccording to the nature of the products and services provided, with each segment representing astrategic business unit that offers different products and serves different markets.
Segment financial information is reported on the basis that it is used internally for evaluating segmentperformance and allocating resources to segments.
The Group derives its revenue from the following reportable segments:
Construction and Infrastructure - mainly consists of revenues from EEI as a general contractor andtrader of construction equipment and parts. The subsidiaries of EEI are mainly involved in theprovision for manpower services, construction, trading of equipment, power generation, steelfabrication, real estate and others.

- 82 -
*SGVFSM009820*
Property management - represents property and project management services of the Group.
Education - primarily consists of revenues from IPO and subsidiaries in education and other relatedsupport services.
Car Dealership - represents automotive dealerships of the Group.
Other Services - represent support services which cannot be directly identified with any of thereportable segments mentioned above. These include sale of pharmaceutical products, trading ofconsumer goods and rendering various services to the consumers.
Segment assets and liabilities exclude deferred income tax assets and liabilities. Inter-segmentincome arise from transactions that were made on terms equivalent to those that prevail in an arms-length transactions.
Management monitors construction revenue and segment net income for the purpose of makingdecisions about resource allocation. Segment performance is evaluated based on net income andconstruction revenue.
Segment reporting is consistent in all periods presented as there are no changes in the structure of theGroup’s internal organization that will cause the composition of its reportable segment to change.
Transfer prices between operating segments are on an arm’s length basis in a manner similar totransactions with third parties.
In 2020, revenues from two (2) customers from the construction and infrastructure segment eachrepresents 10% or more of the Group’s revenue. Following are the revenue contributed by each ofthese customers: P=2,668 million and P=2,384 million.
In 2019, revenues from two (2) customers from the construction and infrastructure segment eachrepresents 10% or more of the Group’s revenue. Following are the revenue contributed by each ofthese customers: P=4,557 million and P=3,144 million.
In 2018, revenues from two (2) customers from the construction and infrastructure segment eachrepresents 10% or more of the Group’s revenue. Following are the revenue contributed by each ofthese customers: P=10,193 million and P=2,667 million.
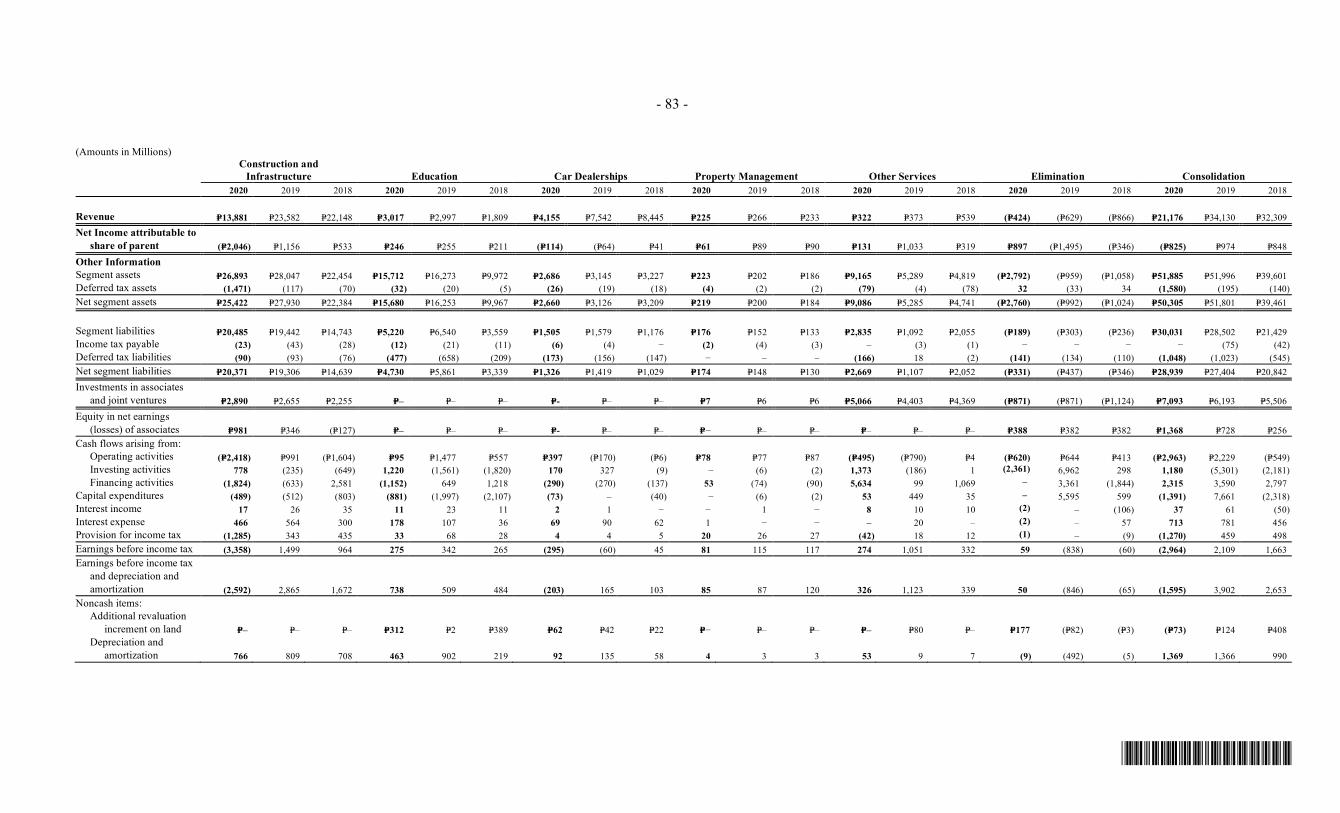
- 83 -
*SGVFSM009820*
(Amounts in Millions)Construction and
Infrastructure Education Car Dealerships Property Management Other Services Elimination Consolidation2020 2019 2018 2020 2019 2018 2020 2019 2018 2020 2019 2018 2020 2019 2018 2020 2019 2018 2020 2019 2018
Revenue P=13,881 P=23,582 P=22,148 P=3,017 P=2,997 P=1,809 P=4,155 P=7,542 P=8,445 P=225 P=266 P=233 P=322 P=373 P=539 (P=424) (P=629) (P=866) P=21,176 P=34,130 P=32,309
Net Income attributable toshare of parent (P=2,046) P=1,156 P=533 P=246 P=255 P=211 (P=114) (P=64) P=41 P=61 P=89 P=90 P=131 P=1,033 P=319 P=897 (P=1,495) (P=346) (P=825) P=974 P=848
Other InformationSegment assets P=26,893 P=28,047 P=22,454 P=15,712 P=16,273 P=9,972 P=2,686 P=3,145 P=3,227 P=223 P=202 P=186 P=9,165 P=5,289 P=4,819 (P=2,792) (P=959) (P=1,058) P=51,885 P=51,996 P=39,601Deferred tax assets (1,471) (117) (70) (32) (20) (5) (26) (19) (18) (4) (2) (2) (79) (4) (78) 32 (33) 34 (1,580) (195) (140)Net segment assets P=25,422 P=27,930 P=22,384 P=15,680 P=16,253 P=9,967 P=2,660 P=3,126 P=3,209 P=219 P=200 P=184 P=9,086 P=5,285 P=4,741 (P=2,760) (P=992) (P=1,024) P=50,305 P=51,801 P=39,461
Segment liabilities P=20,485 P=19,442 P=14,743 P=5,220 P=6,540 P=3,559 P=1,505 P=1,579 P=1,176 P=176 P=152 P=133 P=2,835 P=1,092 P=2,055 (P=189) (P=303) (P=236) P=30,031 P=28,502 P=21,429Income tax payable (23) (43) (28) (12) (21) (11) (6) (4) − (2) (4) (3) ‒ (3) (1) − − − − (75) (42)Deferred tax liabilities (90) (93) (76) (477) (658) (209) (173) (156) (147) − ‒ ‒ (166) 18 (2) (141) (134) (110) (1,048) (1,023) (545)Net segment liabilities P=20,371 P=19,306 P=14,639 P=4,730 P=5,861 P=3,339 P=1,326 P=1,419 P=1,029 P=174 P=148 P=130 P=2,669 P=1,107 P=2,052 (P=331) (P=437) (P=346) P=28,939 P=27,404 P=20,842
Investments in associatesand joint ventures P=2,890 P=2,655 P=2,255 P=‒ P=‒ P=‒ P=- P=‒ P=‒ P=7 P=6 P=6 P=5,066 P=4,403 P=4,369 (P=871) (P=871) (P=1,124) P=7,093 P=6,193 P=5,506
Equity in net earnings(losses) of associates P=981 P=346 (P=127) P=‒ P=‒ P=‒ P=- P=‒ P=‒ P=− P=‒ P=‒ P=‒ P=‒ P=‒ P=388 P=382 P=382 P=1,368 P=728 P=256
Cash flows arising from: Operating activities (P=2,418) P=991 (P=1,604) P=95 P=1,477 P=557 P=397 (P=170) (P=6) P=78 P=77 P=87 (P=495) (P=790) P=4 (P=620) P=644 P=413 (P=2,963) P=2,229 (P=549) Investing activities 778 (235) (649) 1,220 (1,561) (1,820) 170 327 (9) − (6) (2) 1,373 (186) 1 (2,361) 6,962 298 1,180 (5,301) (2,181) Financing activities (1,824) (633) 2,581 (1,152) 649 1,218 (290) (270) (137) 53 (74) (90) 5,634 99 1,069 ‒ 3,361 (1,844) 2,315 3,590 2,797Capital expenditures (489) (512) (803) (881) (1,997) (2,107) (73) ‒ (40) − (6) (2) 53 449 35 ‒ 5,595 599 (1,391) 7,661 (2,318)Interest income 17 26 35 11 23 11 2 1 − − 1 − 8 10 10 (2) ‒ (106) 37 61 (50)Interest expense 466 564 300 178 107 36 69 90 62 1 − − ‒ 20 ‒ (2) ‒ 57 713 781 456Provision for income tax (1,285) 343 435 33 68 28 4 4 5 20 26 27 (42) 18 12 (1) ‒ (9) (1,270) 459 498Earnings before income tax (3,358) 1,499 964 275 342 265 (295) (60) 45 81 115 117 274 1,051 332 59 (838) (60) (2,964) 2,109 1,663Earnings before income tax
and depreciation andamortization (2,592) 2,865 1,672 738 509 484 (203) 165 103 85 87 120 326 1,123 339 50 (846) (65) (1,595) 3,902 2,653
Noncash items: Additional revaluation
increment on land P=‒ P=‒ P=‒ P=312 P=2 P=389 P=62 P=42 P=22 P=− P=‒ P=‒ P=‒ P=80 P=‒ P=177 (P=82) (P=3) (P=73) P=124 P=408 Depreciation and
amortization 766 809 708 463 902 219 92 135 58 4 3 3 53 9 7 (9) (492) (5) 1,369 1,366 990
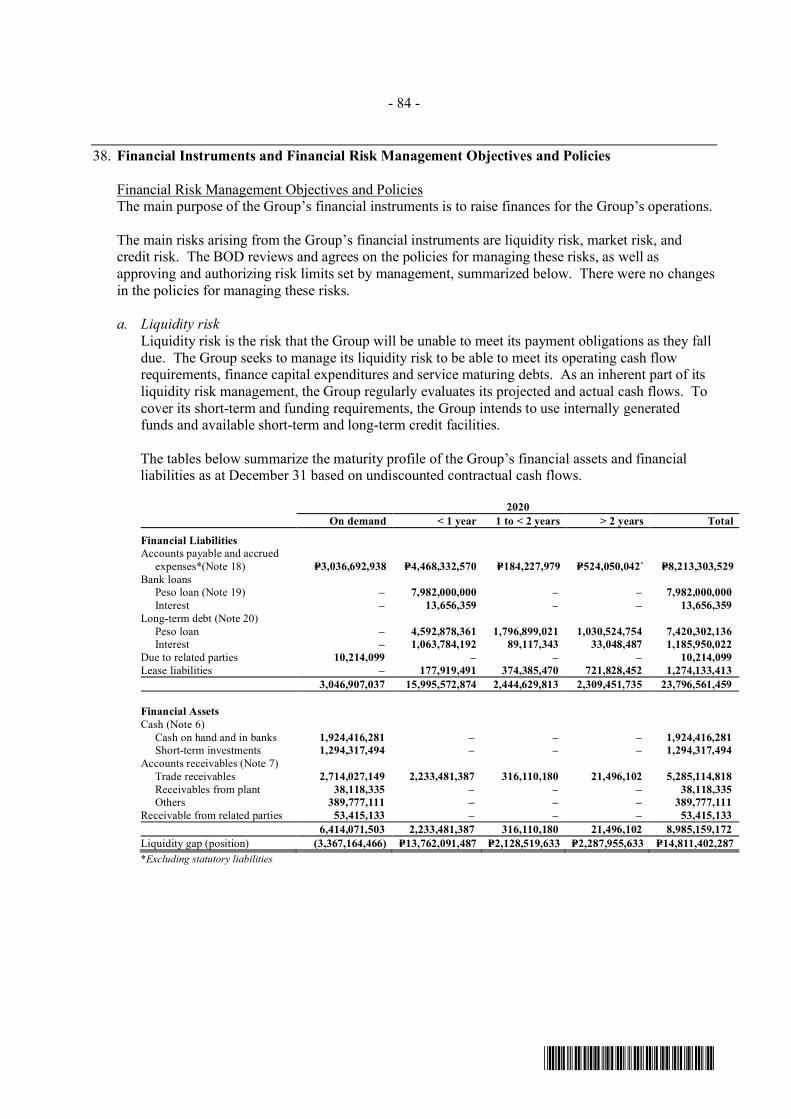
- 84 -
*SGVFSM009820*
38. Financial Instruments and Financial Risk Management Objectives and Policies
Financial Risk Management Objectives and PoliciesThe main purpose of the Group’s financial instruments is to raise finances for the Group’s operations.
The main risks arising from the Group’s financial instruments are liquidity risk, market risk, andcredit risk. The BOD reviews and agrees on the policies for managing these risks, as well asapproving and authorizing risk limits set by management, summarized below. There were no changesin the policies for managing these risks.
a. Liquidity riskLiquidity risk is the risk that the Group will be unable to meet its payment obligations as they falldue. The Group seeks to manage its liquidity risk to be able to meet its operating cash flowrequirements, finance capital expenditures and service maturing debts. As an inherent part of itsliquidity risk management, the Group regularly evaluates its projected and actual cash flows. Tocover its short-term and funding requirements, the Group intends to use internally generatedfunds and available short-term and long-term credit facilities.
The tables below summarize the maturity profile of the Group’s financial assets and financialliabilities as at December 31 based on undiscounted contractual cash flows.
2020On demand < 1 year 1 to < 2 years > 2 years Total
Financial LiabilitiesAccounts payable and accrued
expenses*(Note 18) P=3,036,692,938 P=4,468,332,570 P=184,227,979 P=524,050,042` P=8,213,303,529Bank loans Peso loan (Note 19) ‒ 7,982,000,000 ‒ ‒ 7,982,000,000 Interest ‒ 13,656,359 ‒ ‒ 13,656,359Long-term debt (Note 20) Peso loan ‒ 4,592,878,361 1,796,899,021 1,030,524,754 7,420,302,136 Interest ‒ 1,063,784,192 89,117,343 33,048,487 1,185,950,022Due to related parties 10,214,099 ‒ ‒ ‒ 10,214,099Lease liabilities ‒ 177,919,491 374,385,470 721,828,452 1,274,133,413
3,046,907,037 15,995,572,874 2,444,629,813 2,309,451,735 23,796,561,459
Financial AssetsCash (Note 6) Cash on hand and in banks 1,924,416,281 ‒ ‒ ‒ 1,924,416,281 Short-term investments 1,294,317,494 ‒ ‒ ‒ 1,294,317,494Accounts receivables (Note 7) Trade receivables 2,714,027,149 2,233,481,387 316,110,180 21,496,102 5,285,114,818 Receivables from plant 38,118,335 ‒ ‒ ‒ 38,118,335 Others 389,777,111 ‒ ‒ ‒ 389,777,111Receivable from related parties 53,415,133 ‒ ‒ ‒ 53,415,133
6,414,071,503 2,233,481,387 316,110,180 21,496,102 8,985,159,172Liquidity gap (position) (3,367,164,466) P=13,762,091,487 P=2,128,519,633 P=2,287,955,633 P=14,811,402,287*Excluding statutory liabilities

- 85 -
*SGVFSM009820*
2019On demand < 1 year 1 to < 2 years > 2 years Total
Financial LiabilitiesAccounts payable and accrued
expenses*(Note 18) P=7,215,918,280 P=503,148,490 P=204,393,465 P=498,451,803 P=8,421,912,038Bank loans Peso loan (Note 19) 45,000,000 8,348,800,000 – – 8,393,800,000 Interest – 27,271,246 – – 27,271,246Long-term debt (Note 20) Peso loan ‒ 1,385,714,285 ‒ 3,305,974,841 4,691,689,126 Interest – 106,453,849 62,701,214 15,200,650 184,355,713Due to related parties 126,417,175 – – – 126,417,175Lease liabilities 95,243,839 190,789,312 450,434,491 2,318,570,760 3,055,038,402
7,482,579,294 9,176,462,897 717,529,170 6,138,198,054 23,514,769,415
Financial AssetsCash (Note 6) Cash on hand and in banks 1,676,600,484 – – – 1,676,600,484 Short-term investments 1,010,068,590 – – – 1,010,068,590Accounts receivables (Note 7) Trade receivables 4,132,893,711 1,724,411,909 ‒ ‒ 5,857,305,620 Receivables from plant 56,369,572 – – – 56,369,572 Others 604,245,744 – 13,809,313 ‒ 618,055,057Receivable from related parties 71,235,301 – – – 71,235,301
7,551,413,402 1,724,411,909 13,809,313 ‒ 9,289,634,624Liquidity gap (position) (68,834,108) P=7,452,050,988 P=703,719,857 P=6,138,198,054 P=14,225,134,791*Excluding statutory liabilites
As of December 31, 2020, the Group has available undrawn committed borrowing facilities withlocal banks totaling to P=15.9 billion.
b. Market riskMarket risk is the risk of loss to future earnings, to fair values or to future cash flows that mayresult from changes in the price of a financial instrument. The value of a financial instrumentmay change as a result of changes in equity prices, foreign currency exchange rates and interestrates.
c. Equity price riskThe Group’s equity price risk exposure at year-end relates to financial assets whose values willfluctuate as a result of changes in market prices, principally, equity securities classified asavailable-for-sale securities.
Quoted available-for-sale securities assets are subject to price risk due to changes in marketvalues of instruments arising either from factors specific to individual instruments or their issuersor factors affecting all instruments traded in the market. The Group’s market risk policy requiresit to manage such risks by setting and monitoring objectives and constraints on investments;diversification plan; and limits on investment in each industry or sector.

- 86 -
*SGVFSM009820*
The analysis below is performed for reasonably possible movements in the market index with allother variables held constant, showing the impact on equity.
2020 2019
Market IndexChange in
variableEffect on
equityChange in
variableEffect on
equityPSE 20.76% 4,152,303 7.94% P=1,340,776
(20.76%) (4,152,303) (7.94%) (1,340,776)
Others 33.24% 2,027,396 14.40% 863,858(33.24%) (2,027,396) (14.40%) (863,858)
The percentage of increase and decrease in market price is based on the movement in thePhilippine Stock Exchange Index (PSEI) and other market index pertaining to golf and countryclub shares from beginning to end of the year. The sensitivity analyses shown above are based onthe assumption that the movement in PSE composite index and other quoted equity securities willbe most likely be limited to an upward or downward fluctuation of in 2020, respectively, of 5%and 26% in 2019, respectively.
The impact of sensitivity of equity prices on the Group’s equity already excludes the impact ontransactions affecting the consolidated statements of income.
Foreign currency riskCurrency risk is the risk that the fair value or future cash flows of a financial instrument willfluctuate because of changes in foreign exchange rates. The Group’s currency risk arise mainlyfrom cash and receivables which are denominated in a currency other than the Group’s functionalcurrency or will be denominated in such a currency.
Foreign currency risk is monitored and analyzed systematically and is managed centrally by thecentral finance department. The Group’s policy is to maintain foreign currency exposure withinexisting internal regulations, and within acceptable risk limits as approved by the BOD.
The following table demonstrates the sensitivity to a reasonably possible change in the US dollar(USD, US$), Singaporean dollar (SGD, S$), Euro (EUR, €), Japanese yen (JPY, ¥) and Britishpound (GBP, £) currency rates, with all variables held constant, of the Group’s profit before tax(due to changes in the fair value of monetary assets and liabilities).
2020 2019Percentage
increase/decrease in
foreign currencyEffect on profit
before tax
Percentageincrease/
decrease inforeign currency
Effect on profitbefore tax
USD 3.00% 6,261,228 2.70% 2,383,953SGD 1.50% 9,403 2.00% 13,564EUR 0.50% 1,154 1.50% 73,079JPY 3.70% 60,623 2.10% 1,658,631GBP 4.10% ‒ 0.10% ‒USD -3.00% (6,261,228) -2.70% (2,383,953)SGD -1.50% (9,403) -2.00% (13,564)EUR -0.50% (1,154) -1.50% (73,079)JPY -3.70% (60,623) -2.10% (1,658,631)GBP -4.10% ‒ -0.10% ‒

- 87 -
*SGVFSM009820*
The forecasted movements in percentages used were sourced by management from an affiliatedbank. These are forecasted movements in the next twelve months.
The foreign currency-denominated financial assets and financial liabilities in original currenciesand equivalents to the functional and presentation currency are as follows:
2020
SD1 SGD2 EUR3 JPY4 GBP4Equivalents
in PHPFinancial assets
Cash and cash equivalents US$4,108,867 S$ 17,680 €3,797 ¥ 2,101,739 £ P=199,207,883Receivables 1,191,113 ‒ ‒ ‒ 57,881,225
5,299,980 17,680 3,797 2,101,739 – 257,089,108Financial liabilities
Accounts payable and accruedexpenses ‒ ‒ ‒ ‒ ‒ ‒
US$ 5,299,980 S$ 17,680 €3,797 ¥ 2,101,739 ( £–) P=257,089,1081 Exchange rate used - P=48.02 to US$12 Exchange rate used - P=36.12 to S$13 Exchange rate used - P=58.69 to €14 Exchange rate used - P=0.46 to ¥15 Exchange rate used - P=64.62 to £1
2019
SD1 SGD2 EUR3 JPY4 GBP4Equivalents
in PHPFinancial assets Cash and cash equivalents US$844,322 S$18,222 €19,803 ¥291,383 £– P=15,430,509
Receivables 1,321,728 - 530 1,439,193 – 67,765,8562,166,050 18,222 20,333 1,730,576 – 83,196,365
Financial liabilities Accounts payable and accrued
expenses 419,565 – 106,431 170,508,916 – 106,216,482US$1,746,485 S$18,222 (€86,098) ¥168,778,340 ( £–) (23,020,117)
1 Exchange rate used - P=50.74 to US$12 Exchange rate used - P=37.49 to S$13 Exchange rate used - P=56.35 to €14 Exchange rate used - P=0.46 to ¥15 Exchange rate used - P=65.99 to £1
There are no other effects of the foreign currency sensitivity on the Group’s equity other thanthose already affecting the consolidated statements of income.
Interest rate riskThe Group’s exposure to market risk for changes in interest rates relates primarily to the Group’sshort-term and long-term obligations.
In order to effectively manage its interest rate risk and its financing costs, the Group closelymonitors the movements of interest rates, as well as, economic factors affecting the trends ofthese movements. In certain cases, depending on its assessment of future movements of interestrates, the Group would pre-terminate its debt and obtain a new loan facility which provides foreither floating or fixed interest rates. This is intended to minimize its financing costs.

- 88 -
*SGVFSM009820*
The table below demonstrates the sensitivity to a reasonably possible change in interest rates,with all other variables held constant, of the Group’s profit before tax (through the impact onfloating rate borrowings):
2020 2019Increase/decrease
in basis pointsEffect on profit
before taxIncrease/decrease
in basis pointsEffect on profit
before taxPeso floating rate borrowing +690 (55,442,960) +405 (P=16,905,088)
-690 55,442,960 -405 16,905,088
The forecasted movements in percentages of interest rates used were sourced by managementfrom an affiliated bank. These are forecasted movements in the next twelve months.
There are no other impact on the Group’s equity other than those already affecting theconsolidated statements of income.
d. Credit riskThe Group’s exposure to credit risk on its receivables relates primarily to the inability of thedebtors to pay and fully settle the unpaid balance of receivables owed to the Group. The Groupmanages its credit risk in accordance with its credit risk policies which requires the evaluation ofthe creditworthiness of the debtors. The Group’s exposure to credit risk on its other receivablesfrom debtors and related parties is managed through close account monitoring and setting limits.
For a financial asset that arises from long-term construction contracts, the Group considers theasset to be in default if contractual payments are not settled within 90 days from the completionof the construction project. The Group’s normal credit terms for construction projects is within90 days based on its historical experience. However, in certain cases, the Group may alsoconsider a financial asset to be in default when internal or external information indicates that theGroup is unlikely to receive the outstanding contractual amounts in full. A financial asset iswritten off when there is no reasonable expectation of recovering the contractual cash flows.
Concentrations arise when a number of counterparties are engaged in similar business activities,or activities in the same geographic region, or have similar economic features that would causetheir ability to meet contractual obligations to be similarly affected by changes in economic,political or other conditions.
The Group’s maximum credit risk exposure for its secured loans receivables is equal to itscarrying value amounting nil in 2020 and 2019. The Group holds collateral against these loansreceivables in the form of mortgage interests over property. The fair values of the collateralamounts to nil in 2020 and 2019. This resulted to a nil net exposure as at December 31, 2020 and2019.
With respect to credit risk arising from cash and cash equivalents, unsecured loans receivables,accounts receivable, due from related parties, available-for-sale securities and receivables fromEEI- RFI, the Group’s exposure to credit risk arises from default of the counterparty, with amaximum exposure equal to the carrying amount of these instruments.
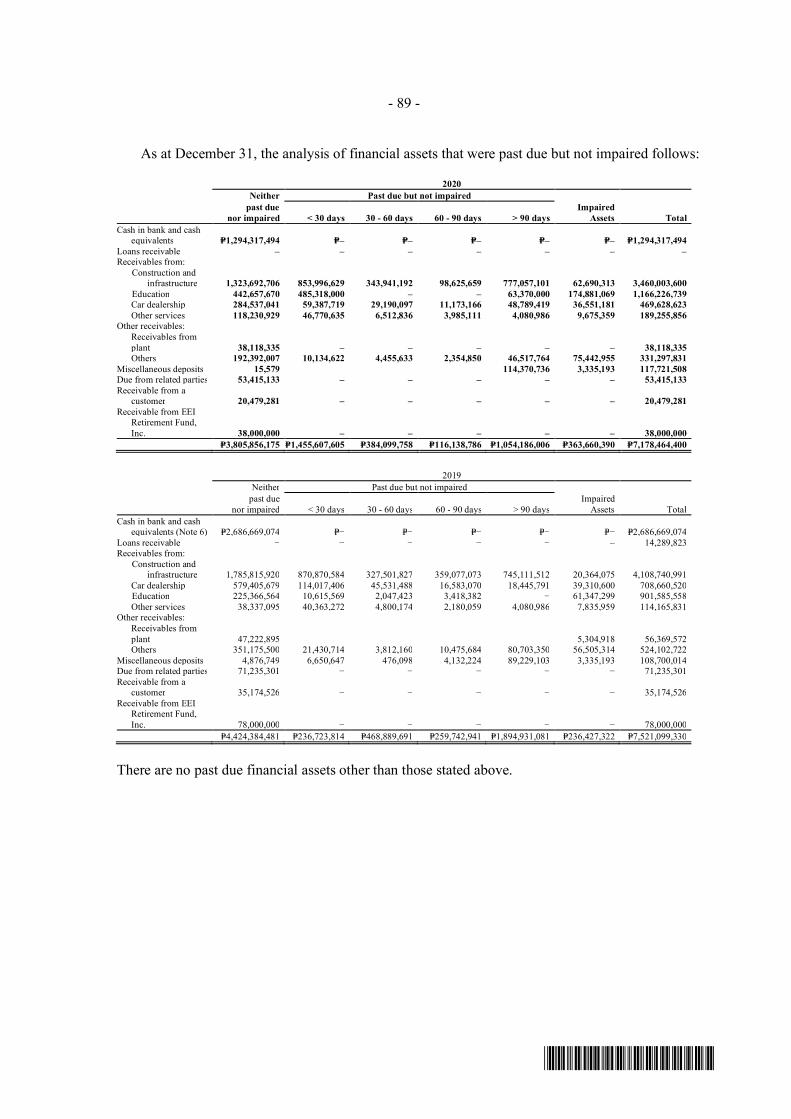
- 89 -
*SGVFSM009820*
As at December 31, the analysis of financial assets that were past due but not impaired follows:
2020Neither Past due but not impaired
past duenor impaired < 30 days 30 - 60 days 60 - 90 days > 90 days
ImpairedAssets Total
Cash in bank and cashequivalents P=1,294,317,494 P=– P=– P=– P=– P=– P=1,294,317,494
Loans receivable – – – – – – –Receivables from: Construction and
infrastructure 1,323,692,706 853,996,629 343,941,192 98,625,659 777,057,101 62,690,313 3,460,003,600Education 442,657,670 485,318,000 ‒ ‒ 63,370,000 174,881,069 1,166,226,739Car dealership 284,537,041 59,387,719 29,190,097 11,173,166 48,789,419 36,551,181 469,628,623Other services 118,230,929 46,770,635 6,512,836 3,985,111 4,080,986 9,675,359 189,255,856
Other receivables: Receivables from
plant 38,118,335 – – – – – 38,118,335Others 192,392,007 10,134,622 4,455,633 2,354,850 46,517,764 75,442,955 331,297,831
Miscellaneous deposits 15,579 114,370,736 3,335,193 117,721,508Due from related parties 53,415,133 – – – – – 53,415,133Receivable from a
customer 20,479,281 – – – – – 20,479,281Receivable from EEI
Retirement Fund,Inc. 38,000,000 – – – – – 38,000,000
P=3,805,856,175 P=1,455,607,605 P=384,099,758 P=116,138,786 P=1,054,186,006 P=363,660,390 P=7,178,464,400
2019Neither Past due but not impaired
past duenor impaired < 30 days 30 - 60 days 60 - 90 days > 90 days
ImpairedAssets Total
Cash in bank and cashequivalents (Note 6) P=2,686,669,074 P=− P=− P=− P=− P=− P=2,686,669,074
Loans receivable − − − − − ‒ 14,289,823Receivables from: Construction and
infrastructure 1,785,815,920 870,870,584 327,501,827 359,077,073 745,111,512 20,364,075 4,108,740,991Car dealership 579,405,679 114,017,406 45,531,488 16,583,070 18,445,791 39,310,600 708,660,520Education 225,366,564 10,615,569 2,047,423 3,418,382 − 61,347,299 901,585,558Other services 38,337,095 40,363,272 4,800,174 2,180,059 4,080,986 7,835,959 114,165,831
Other receivables: Receivables from
plant 47,222,895 5,304,918 56,369,572Others 351,175,500 21,430,714 3,812,160 10,475,684 80,703,350 56,505,314 524,102,722
Miscellaneous deposits 4,876,749 6,650,647 476,098 4,132,224 89,229,103 3,335,193 108,700,014Due from related parties 71,235,301 − − − − − 71,235,301Receivable from a
customer 35,174,526 − − − − − 35,174,526Receivable from EEI
Retirement Fund,Inc. 78,000,000 − − − − − 78,000,000
P=4,424,384,481 P=236,723,814 P=468,889,691 P=259,742,941 P=1,894,931,081 P=236,427,322 P=7,521,099,330
There are no past due financial assets other than those stated above.

- 90 -
*SGVFSM009820*
The following table provides information regarding the credit quality by class of financial assets(amounts gross of allowance for credit losses) based on the Group’s credit rating system.
2020
Neither past due nor impairedPast due or
IndividuallyHigh Grade Standard Impaired Total
Cash in banks and cash equivalents P=1,294,317,494 P=‒ P=‒ P=1,294,317,494Receivables from: Construction and infrastructure 3,385,424,855 11,888,432 62,690,313 3,460,003,600
Education 956,186,073 35,159,597 174,881,069 1,166,226,739Car dealership 433,077,442 ‒ 36,551,181 469,628,623
Other services 179,580,497 ‒ 9,675,359 189,255,856Other receivables:
Rent receivable 111,322 ‒ ‒ 111,322 Others 398,350,317 26,642,336 79,372,795 504,365,448Due from related parties 53,415,133 ‒ ‒ 53,415,133Receivables from EEI-RFI 38,000,000 ‒ ‒ 38,000,000Receivable from sale of investment properties 21,280,648 ‒ ‒ 21,280,648Receivable from a customers 20,479,281 ‒ ‒ 20,479,281Miscellaneous deposits 15,579 ‒ 3,335,193 3,350,772
P=6,780,238,641 P=73,690,365 P=366,505,910 P=7,220,434,916
2019
Neither past due nor impairedPast due or
IndividuallyHigh Grade Standard Impaired Total
Cash in banks and cash equivalents P=2,686,669,074 P=− P=− P=2,686,669,074Receivables from:
Construction and infrastructure 2,504,001,799 600,891,778 52,855,392 3,157,748,969Car dealership 773,983,434 − 39,310,600 813,294,034
Education 206,288,341 35,159,597 61,347,299 302,795,237Other services 47,599,315 42,162,271 7,835,959 97,597,545
Other receivables: Rent receivable 202,463 88,818 430,517 721,798
Others 537,478,609 29,825,901 71,075,404 638,379,914Due from related parties 126,417,175 − − 126,417,175Miscellaneous deposits 83,051,923 571,340 3,572,151 87,195,414Receivables from EEI-RFI 78,000,000 − − 78,000,000Receivable from a customers 35,174,525 − − 35,174,525Receivable from sale of investment properties 22,790,885 ‒ ‒ 22,790,885
P=6,877,808,585 P=708,699,705 P=236,427,322 P=7,822,935,612
Neither past due nor impaired accounts receivables, other receivables are classified into ‘high grade’and ‘standard grade’. Neither past due nor impaired cash and cash equivalents, loans receivable, duefrom related parties, receivable from a customer and receivables from EEI-RFI are normally ‘highgrade’ in nature. The Group sets financial assets as ‘high grade’ based on the Group’s positivecollection experience. On the other hand, ‘standard grade’ are those which have credit history ofdefault in payments.
The Company has the following financial assets that are subject to the expected credit loss modelunder PFRS 9: Cash and cash equivalents; Receivables; Contract assets Advances to officers and employees

- 91 -
*SGVFSM009820*
The ending loss allowances as of December 31, 2020 and 2019 reconcile to the opening lossallowances as follows:
2020 2019Balance at beginning of year P=286,043,524 P=232,855,171Provisions 105,623,601 53,328,702Write off (Note 7) (24,730,698) (140,349)Balance at end of year P=366,936,427 P=286,043,524
Credit QualityThe Group maintains internal credit rating system. Neither past due nor impaired financial assets aregraded as either “A” or “B” based on the following criteria:
Grade A are accounts considered to be of high value. The counterparties have a very remotelikelihood of default and have consistently exhibited good paying habits.
Grade B are active accounts with minimal to regular instances of payment default, due tocollection issues. These accounts are typically not impaired as the counterparties generallyrespond to the Group’s collection efforts and update their payments accordingly.
Cash in banks and cash equivalents are short-term placements and working cash fund placed, investedor deposited in reputable foreign and local banks in the Philippines. These financial assets areclassified as Grade A due to the counterparties’ low probability of insolvency.
Receivables and receivables from related parties are Grade A because they are from related parties,employees and accredited customers who are highly reputable, progressive and consistently pay theiraccounts.
Security and other deposits and construction bond are Grade A since these were paid to creditworthythird parties.
The Group’s financial assets considered as neither past due nor impaired are all graded “A” based onthe Group’s assessment.
A summary of Group exposure to credit risk under general and simplified approach as ofDecember 31, 2020 and 2019 follows:
2020
General Approach SimplifiedApproachStage 1 Stage 2 Stage 3
Amortized costCash and cash equivalents P=3,218,733,775 P=‒ P=‒ P=‒Trade receivables – ‒ ‒ 5,285,114,818Nontrade receivables 427,895,446 ‒ ‒ ‒Contract asset – ‒ ‒ 7,642,055,723
FVOCI 547,076,494 ‒ ‒ ‒Total gross carrying amounts 4,193,705,715 ‒ ‒ 12,927,170,541Less allowance ‒ ‒ ‒ 403,721,730
P=4,193,705,715 P=‒ P=‒ P=12,523,448,811

- 92 -
*SGVFSM009820*
2019
General Approach SimplifiedApproachStage 1 Stage 2 Stage 3
Amortized costCash and cash equivalents P=2,686,669,074 P=− P=− P=−Trade receivables − − − 5,857,305,620Nontrade receivables 675,224,629 − − −Contract asset − − − 9,492,566,375
FVOCI 1,147,773,806 − − −Total gross carrying amounts 4,509,667,509 − − 15,349,871,995Less allowance ‒ − − 295,116,295
P=4,509,667,509 P=− P=− P=15,054,755,700
In 2020 and 2019, there were no movements between stage 1, 2 and 3.
Capital ManagementThe primary objective of the Group’s capital management is to ensure that it maintains a strong creditrating and healthy capital ratios in order to support its business and maximize shareholder value.
The Group which is composed of diversified operations (i.e. construction and infrastructureoperations, education and finance and leasing activities) manages its capital on a per entity basis.Each entity manages its capital structure and makes adjustments to it, in light of changes in economicconditions. To maintain or adjust the capital structure, the Group may adjust the dividend payment toshareholders, return capital to shareholders or issue new shares. No changes were made in theobjectives, policies or processes during the years ended December 31, 2020 and 2019.
As at December 31, 2020 and 2019, the Group is subject to externally imposed capital requirementsfrom its debt covenants including maintaining a maximum debt-to-equity structure ratio of 3:1 onNTC’s unsecured bank loan and debt-to-equity structure ratio of 2.5:1 on the Parent Company’sunsecured bank loan (Note 20). As of December 31, 2020 and 2019, the Group has complied withthe provisions of the debt covenants. The Group considers total equity as its capital.
Parent Company, EEI and IPOThe Parent Company, EEI (construction and infrastructure operations) and IPO (education) monitorcapital using gearing ratio. The Parent Company, EEI and IPO’s policies are to keep the gearing ratioup to a maximum of 2:1, 3:1 and 2:1, respectively.
2020 2019Current liabilities P=19,847,587,457 P=15,026,914,112Noncurrent liabilities 9,570,310,084 4,421,638,989Total liabilities (a) 29,417,897,541 19,448,553,101Equity (b) 22,581,715,462 8,614,509,528Debt to Equity Ratio (a/b) 1.29:1 2.26:1
Fair Value InformationThe Group uses the following hierarchy in determining and disclosing the fair value of financialinstruments by valuation techniques:
Level 1 - Quoted (unadjusted) market prices in active markets for identical assets or liabilities Level 2 - Valuation techniques for which the lowest level input that is significant to the fair value
measurement is directly or indirectly observable

- 93 -
*SGVFSM009820*
Level 3 - Valuation techniques for which the lowest level input that is significant to the fair valuemeasurement is unobservable
The following methods and assumptions were used to estimate the fair value of each class of financialinstrument for which it is practicable to estimate such value:
Cash and cash equivalents, receivables, due from related parties, accounts payable and othercurrent liabilities, short-term loans and due to related partiesCarrying amounts approximate fair values due to the short-term nature of these accounts.
Receivable from EEI RFI (Notes 7 and 17)The fair values of the receivable amounting to P=38.0 million and P=78.0 million as ofDecember 31, 2020 and 2019, respectively, were estimated as the present value of all future cashflows discounted using the applicable rates for similar types of loans (Level 2 - significantobservable inputs). Discount rates used in 2020 and 2019 were 1.41% and 3.74%, respectively.
Interest-bearing trade receivables (Notes 7 and 17)The fair value of interest-bearing trade receivables amounting to P=23.2 million andP=86.7 million as of December 31, 2020 and 2019, respectively, was estimated as the present valueof all future cash flows discounted using the applicable rates for similar types of loans (Level 2 -significant observable inputs). Discount rate used in 2020 and 2019 was 1.41% and 3.74%,respectively.
Receivable from sale of investment properties (Notes 7)The fair value of the receivable from sale of investment property amounting to P=21.3 million andP=22.8 million as of December 31, 2020 and 2019, respectively, was estimated as the present valueof all future cash flows discounted using the applicable rates for similar types of loans (Level 2 -significant observable inputs). Discount rate used in 2020 and 2019 was 1.41% and 3.74%,respectively.
Equity investments at FVOCI (Note 11)Quoted investmentsFair value of investments in equity shares listed with Philippine Stock Exchange amounting toP=91.6 million and P=107.3 million as of December 31, 2020 and 2019, respectively, weredetermined by reference to the quoted price in the stock exchange at the end of the reportingperiod (Level 1 - quoted prices in active market).
Fair values of investments in club/golf shares amounting to P=16.9 million and P=18.5 million as ofDecember 31, 2020 and 2019, respectively, were determined by reference to the price of the mostrecent transaction at the end of the reporting period (Level 2 - significant observable inputs).
Hermosa Ecozone Development CorporationThe fair value of the Group’s investment in HEDC is determined using the adjusted net assetapproach wherein the assets of HEDC consisting mainly of parcels of land are adjusted from costto their fair value. The valuation was performed by an independent SEC-accredited appraiser asof December 31, 2020.

- 94 -
*SGVFSM009820*
The significant unobservable inputs (Level 3) used in the fair value measurement of HEDC are asfollows:
The fair values of the land were determined using the market approach which is a valuationtechnique that uses prices and other relevant information generated by market transactionsinvolving identical or comparable assets and adjusted to reflect differences on size (20%),location (20%) and facilities and utilities (5%). Significant favorable (unfavorable) adjustmentsto the aforementioned factors based on the professional judgment of the independent appraiserswould increase (decrease) the fair value of land. Depending on the status of the development, thevalue of the land per sqm ranges from P=460 to P=5,820 in 2020.
A 5% increase (decrease) in the appraised value of the land per sqm could increase (decrease) theGroup’s investment by P=15.7 million.
Long-term debt (Note 20)The carrying value approximates the fair value using the EIR method because future paymentsare discounted based on interest at market rate.
The fair values of the interest-bearing long-term debt amounting to P=7,420.3 million andP=4,691.7 million as of December 31, 2020 and 2019, respectively, were estimated as the presentvalue of all future cash flows discounted using the applicable rates for similar types of loans(Level 2 -significant observable inputs). Discount rates used in 2020 and 2019 were and 4.31%to 5.11%, respectively.
Long-term retention payableThe fair values of the retention payable which is included in other noncurrent liabilitiesamounting to P=273.6 million and P=210.3 million as of December 31, 2020 and 2019, respectively,were estimated as the present value of all future cash flows discounted using the applicable ratesfor similar types of loans (Level 2 - significant observable inputs). Discount rates used in 2020and 2019 were 1.41% and 3.74%, respectively.
As at December 31, 2020 and 2019, there were no transfers between Level 1 and Level 2 fair valuemeasurements. There are no financial assets and financial liabilities recognized at fair value based onLevel 3 and there are no transfers in and out of Level 3 categories in 2020 and 2019. No financialinstrument fall within Level 3.
There were no transfers between levels of fair value measurements in 2020 and 2019. No transfersbetween any levels of the fair value hierarchy took place in the equivalent comparative period.
39. Capital Stock
The authorized preferred stock is 2,500,000,000 shares at P=0.40 par value. A reconciliation of thenumber of preferred shares outstanding as at December 31, 2020, 2019 and 2018 follows:
2020 2019 2018Amount Shares Amount Shares Amount Shares
Balance at beginning of year P=6,710,402 16,776,001 P=247,414,156 618,535,387 P=253,758,109 634,395,272Redemption of preferred stock (6,710,402) (16,776,001) ‒ ‒ (6,343,953) (15,859,885)Conversion of preferred stock to
common stock ‒ ‒ (240,703,754) (601,759,386) ‒ ‒Balance at end of year P=‒ ‒ P=6,710,402 16,776,001 P=247,414,156 618,535,387

- 95 -
*SGVFSM009820*
The authorized common stock is 1,250,000,000 shares at P=1.50 par value. A reconciliation of thenumber of common shares outstanding as at December 31, 2020, 2019 and 2018 follows:
2020 2019 2018Amount Shares Amount Shares Amount Shares
Balance at beginning of year P=1,165,147,926 776,765,281 P=924,444,172 616,296,114 P=924,444,172 616,296,114Conversion of preferred stock ‒ ‒ 240,703,754 160,469,167 ‒ ‒Balance at end of year 1,165,147,926 776,765,281 1,165,147,926 776,765,281 924,444,172 616,296,114Treasury stock (2,607,600) (300,000) (2,607,600) (300,000) (2,607,600) (300,000)
P=1,162,540,326 776,465,281 P=1,162,540,326 776,465,281 P=921,836,572 615,996,114
On May 24, 2013, the Parent Company repurchased 300,000 shares held as treasury stock atP=8.69 per share for P=2.61 million.
Details of the capital redemption and conversion follow:
Date of Redemption Amount Record Date Payment Date
March 30, 2020 P=6,710,402 P=0.40 April 27, 2020 May 20, 2020
April 6, 2018 P=6,343,953 P=0.40 May 3, 2018 May 30, 2018
March 31, 2017 P=7,020,070 P=0.40 April 28, 2017 May 21, 2017July 21, 2017 6,844,569 0.40 August 18, 2017 September 12, 2017September 29, 2017 6,673,454 0.40 October 27, 2017 November 24, 2017December 8, 2017 6,506,618 0.40 January 4, 2018 January 30, 2018
P=27,044,711
March 31, 2016 P=7,768,247 P=0.40 April 28, 2016 May 24, 2016July 15, 2016 7,574,040 0.40 August 12, 2016 September 8, 2016September 30, 2016 7,384,690 0.40 October 28, 2016 November 24, 2016December 2, 2016 7,200,072 0.40 December 29, 2016 January 23, 2017
P=29,927,049
On March 30, 2020, after the declaration of cash dividends (Note 40), the BOD approved theredemption of 16,766,001 preferred shares at par value with a total amount of P=6.71 million to thestockholders of the Parent Company’s preferred shares on record as of April 27, 2020, payable onMay 20, 2020.
In 2019, the Parent Company issued 160,169,167 common shares at P=1.50 per share for theconversion of 601,759,386 preferred shares at 0.40 per share or P=240,703,754. There was no capitalredemption made during 2019.
In 2019 and prior years, the Parent Company’s preferred shares have the following features:
a) Entitled to dividends at the rate of average 91-day T-Bill plus two percent;b) Fully participating as to distribution of dividends;
- Convertible into common shares at the option of the holders thereof from the date of issue atthe conversion rate of 3 and 3/4 preferred shares to 1 common share for a price of P=1.50 percommon share subject to adjustments;
c) Redeemable at any one time or from time to time, at the option of the BOD of the ParentCompany, subject to availability of funds; and
d) With voting rights and preferences as to assets upon dissolution of the Parent Company overcommon shareholders.

- 96 -
*SGVFSM009820*
Below is the summary of the outstanding number of shares and holders of security as atDecember 31, 2020:
Year
Number ofshares
registered Issue/offer price Date of approval
Number ofholders ofsecurities
Preferred shares:January 31, 2018 634,395,272 48Movement (15,859,885) 0.40 April 6, 2018December 31, 2018 618,535,387 48Movement (601,759,386)December 31, 2019 16,776,001 42Movement (16,776,001)December 31, 2020 –
Common Shares:December 31, 2018 615,996,114 386No Movement –December 31, 2018 615,996,114 394Movement 160,469,167December 31, 2019 776,465,281 384Movement –December 31, 2019 776,465,281 384
SEC approved the registration of the Parent Company’s authorized capital stock before its listing datewith the PSE, which was on July 2, 1962. The actual number of shares initially listed were 584,085at an offer price of P=10.0 per share. Total number of preferred and common shareholders was nil and384 , respectively, as of December 31, 2020 and 42 and 384, respectively, as of December 31, 2019.
40. Retained Earnings
Cash DividendsThe BOD declared cash dividends in 2020, 2019 and 2018 as follows:
Date of BOD Approval Amount
Amount per share
Record Date Payment DatePreferred
SharesCommon
SharesMarch 30, 2020 P=86,529 P=0.00515 P=− April 27, 2020 May 20, 2020
April 5, 2019 P=4,688,498 P=0.00758 P=− May 2, 2019 May 28, 2019July 19, 2019 4,459,640 0.00721 − August 15, 2019 September 10, 2019July 19, 2019 50,758,965 0.01733 0.065 August 15, 2019 September 10, 2019October 4, 2019 3,349,141 0.005415 − October 31,2019 November 20, 2019December 6, 2019 85,860 0.005118 − January 2, 2020 January 28, 2020
P=63,342,104
April 6, 2018 P=2,949,050 P=0.005 P=− May 3, 2018 May 29, 2018July 20, 2018 3,342,256 0.005 − August 16, 2018 September 11, 2018July 20, 2018 50,758,966 0.017 0.065 August 16, 2018 September 11, 2018September 28, 2018 3,273,289 0.005 − October 25, 2018 November 21, 2018December 18, 2018 4,449,125 0.007 − January 11, 2019 February 6, 2019
P=64,772,686
On March 30, 2020, the BOD approved the declaration of cash dividends of P=0.00516 per share witha total amount of P=0.09 million to the stockholders of the Parent Company’s preferred shares onrecord as of April 27, 2020, payable on May 20, 2020.

- 97 -
*SGVFSM009820*
On December 31, 2019, the Company’s BOD approved additional appropriation of retained earningsamounting to P=400 million for planned investments and business expansion that the Parent Companyintends to carry out for 2-3 years.
On December 31, 2018, the Company’s BOD approved additional appropriation of retained earningsamounting to P=2,100 million for planned investments and business expansion that the ParentCompany intends to carry out for 2-3 years.
On June 22, 2018, the BOD of EEI approved the appropriation of retained earnings of P=4.0 billion forpurchase of property and equipment as business expansion and manpower training program for thenext three to five years. On December 4, 2020, the BOD of EEI approved the reversal of the saidappropriation to make funds available for the ongoing projects, particularly in infrastructure.
Retained earnings include P=2,580.1 million and P=2,524.4 million as of December 31, 2020 and 2019,respectively, representing treasury shares, appropriated retained earnings and deferred tax assets thatare not available for dividend declaration. After reconciling items, the retained earnings of the ParentCompany that are available for dividend declaration amounted to P=1,359.3 million andP=1,305.4 million as of December 31, 2020 and 2019, respectively.
Under the Tax Code, publicly-held Corporations are allowed to accumulate retained earnings inexcess of capital stock and are exempt from improperly accumulated earnings tax.
RestrictionsThe Group’s retained earnings include accumulated earnings of subsidiaries, associate and jointventure amounting to P=5,846.8 million and P=6,281.5 million as of December 31, 2020 and 2019,respectively, not declared as dividends to the Group. Accordingly, these are not available fordividend declaration.
41. Other Matters
On March 11, 2020, the World Health Organization has declared COVID-19 outbreak a globalpandemic. In the Philippines, in a move to contain the COVID-19 outbreak, on March 13, 2020, theOffice of the President of the Philippines issued a Memorandum directive to impose stringent socialdistancing measures in the National Capital Region effective March 15, 2020. On March 16, 2020,Presidential Proclamation No. 929 was issued, declaring a State of Calamity throughout thePhilippines for a period of six (6) months and imposed an enhanced community quarantinethroughout the island of Luzon until May 15, 2020. Effective May 16, 2020, some provinces inLuzon was placed under general community quarantine while National Capital Region (NCR) wasplaced under modified enhanced community quarantine. Effective June 1, 2020, NCR wass placedunder general community quarantine (GCQ). On August 4, 2020, the Philippine Government hasplaced NCR back to modified enhanced community quarantine (MECQ) until it was placed to generalcommunity quarantine starting August 19, 2020 until August 31, 2020. On September 1, 2020, theOffice of the President of the Philippines declared GCQ until September 30, 2020. The GCQ overNCR and other risk areas was further extended until January March 29, 2021 while the rest of thecountry was put under MGCQ. From March 29, 2021 to April 4, 2021, following spike in the numberof new COVID-19 cases, the Philippine Government has placed NCR back to ECQ and was laterextended to April 11, 2021. From April 12, 2021 to April 30, 2021, NCR is placed under MECQ.The Government has been easing quarantine measures in key areas in the Philippines. Further, therollout of the national vaccination program starting first quarter of 2021 is expected to furtherimprove market activities in the Philippines.
- 98 -
*SGVFSM009820*
Risks and Impacts of COVID-19The Group, in cooperation with the Yuchengco Group of Companies Business ContinuityManagement - Disaster Recovery Management (“YGC BCM-DRM) Council have taken thenecessary precautionary measures to mitigate the risks that may cause disruptions to its variousbusinesses.
1. Risk to the health and safety of employees, clients, suppliers, and communities. House ofInvestments and its subsidiaries have adopted the Department of Health guidelines and regularlygive advisories on COVID-19 precautionary measures to ensure compliance with the Inter-Agency directives on Community Quarantine. The Group has also adopted its own protocols,including, but not limited to regular and frequent disinfection of buildings and office premises,temperature checks at all entry points and restricting entry of visitors to office premises. Tofurther minimize the risk of person-to-person transmission, the Group has limited the assembly ofpeople by conducting meetings via video- and/or tele-conferencing. The Group also implementeda combination of Four-day Work Week and Work-from-Home arrangements while ensuring thatservice interruptions to its clients are minimized.
2. Disrupted business operations. The Group is compliant with national and local ordinances. Toensure minimal service interruptions and that its operations are not hampered, its variousbusinesses have identified and designated essential and non-essential employees and whereverappropriate, have setup skeletal workforce.
Despite the suspension of classes, disruptions on the academic outcomes of students wereminimized as the Group’s schools utilized alternative means to continue course work, e.g. on-lineclasses, coursework online, and independent projectized learning, among others. All theseblended learning initiatives using multiple e-learning and course monitoring platforms allowedthe students to fulfill their course requirements to comply with CHED or DepEd academicrequirements amid the prolonged suspension of classes.
The Group’s Property Management team enhanced their services being at the forefront of thecrisis management operations. The team is working hand-in-hand with the YGC BCM-BRMCouncil on the Group’s group-wide risk mitigation initiatives.
3. Disrupted supply chain management. The Group is conducting assessments on all resourcesexpected to come in and those expected to be ordered, particularly on the supply of resourcescoming from infected areas while taking into consideration the community quarantine declared inMetro Manila. In coordination with their respective planning groups, each business unit isworking on making adjustments to minimize the impact of such disruption. This includesfocusing on activities that have no issues with the supply of resources and looking for alternativesuppliers from “virus-free” areas.
4. Disruption in Construction Segment. The outbreak of COVID-19 in 2020 disrupted the businessof the Group in 2020. This includes the temporary stoppage of construction activities during theperiod of enhanced community quarantine (ECQ) in adherence to Government’s directive andincurrence of additional construction cost.
At the end of 2020, the construction segment’s unworked portion of existing contracts stood atP=60.4 billion, including ARCC’s backlog of P=17.38 billion. The Group considers this backlog ofprojects as healthy and sustainable. The Group expects an overall strong performance in itsdomestic operations driven by the current buildings, infrastructure, electromechanical, andindustrial projects in its pipeline as production continues to pick-up. Despite the delays inoperations caused by the COVID-19 pandemic, the backlog was preserved and will be realized asconstruction works resume.

*SGVFSM009820*
INDEPENDENT AUDITOR’S REPORTON SUPPLEMENTARY SCHEDULES
The Board of Directors and the StockholdersHouse of Investments, Inc.3rd Floor, Grepalife Building219 Sen. Gil J. Puyat AvenueMakati City, Metro Manila
We have audited in accordance with Philippine Standards on Auditing, the consolidated financialstatements of House of Investments, Inc. and its Subsidiaries (the Group) as at December 31, 2020 and2019 and for each of the three years in the period ended December 31, 2020, included in this Form 17-A,and have issued our report thereon dated April 30, 2021. Our audits were made for the purpose offorming an opinion on the basic financial statements taken as a whole. The schedules listed in the Indexto the Financial Statements and Supplementary Schedules are the responsibility of the Group’smanagement. These schedules are presented for purposes of complying with the Revised SecuritiesRegulation Code Rule 68, and are not part of the basic financial statements. These schedules have beensubjected to the auditing procedures applied in the audit of the basic financial statements and, in ouropinion, fairly state, in all material respects, the financial information required to be set forth therein inrelation to the basic financial statements taken as a whole.
SYCIP GORRES VELAYO & CO.
Narciso T. Torres, Jr.PartnerCPA Certificate No. 84208SEC Accreditation No. 1511-AR-1 (Group A), October 18, 2018, valid until October 17, 2021Tax Identification No. 102-099-147BIR Accreditation No. 08-001998-111-2020, November 27, 2020, valid until November 26, 2023PTR No. 8534374, January 4, 2021, Makati City
April 30, 2021
SyCip Gorres Velayo & Co.6760 Ayala Avenue1226 Makati CityPhilippines
Tel: (632) 8891 0307Fax: (632) 8819 0872ey.com/ph
BOA/PRC Reg. No. 0001, October 4, 2018, valid until August 24, 2021SEC Accreditation No. 0012-FR-5 (Group A),
November 6, 2018, valid until November 5, 2021
A member firm of Ernst & Young Global Limited
*SGVFSM009820*
INDEPENDENT AUDITOR’S REPORT ONCOMPONENTS OF FINANCIAL SOUNDNESS INDICATORS
The Board of Directors and the StockholdersHouse of Investments, Inc.3rd Floor, Grepalife Building219 Sen. Gil J. Puyat AvenueMakati City, Metro Manila
We have audited in accordance with Philippine Standards on Auditing, the consolidated financialstatements of House of Investments, Inc. and its Subsidiaries (the Group) as at December 31, 2020 and2019 and for each of the three years in the period ended December 31, 2020, and have issued our reportthereon dated April 30, 2021. Our audits were made for the purpose of forming an opinion on the basicfinancial statements taken as a whole. The Supplementary Schedule on Financial Soundness Indicators,including their definitions, formulas, calculation, and their appropriateness or usefulness to the intendedusers, are the responsibility of the Group’s management. These financial soundness indicators are notmeasures of operating performance defined by Philippine Financial Reporting Standards (PFRS) and maynot be comparable to similarly titled measures presented by other companies. This schedule is presentedfor the purpose of complying with the Revised Securities Regulation Code Rule 68 issued by theSecurities and Exchange Commission, and is not a required part of the basic financial statements preparedin accordance with PFRS. The components of these financial soundness indicators have been traced tothe Group’s consolidated financial statements as at December 31, 2020 and 2019 and for each of the threeyears in the period ended December 31, 2020 and no material exceptions were noted.
SYCIP GORRES VELAYO & CO.
Narciso T. Torres, Jr.PartnerCPA Certificate No. 84208SEC Accreditation No. 1511-AR-1 (Group A), October 18, 2018, valid until October 17, 2021Tax Identification No. 102-099-147BIR Accreditation No. 08-001998-111-2020, November 27, 2020, valid until November 26, 2023PTR No. 8534374, January 4, 2021, Makati City
April 30, 2021
SyCip Gorres Velayo & Co.6760 Ayala Avenue1226 Makati CityPhilippines
Tel: (632) 8891 0307Fax: (632) 8819 0872ey.com/ph
BOA/PRC Reg. No. 0001, October 4, 2018, valid until August 24, 2021SEC Accreditation No. 0012-FR-5 (Group A),
November 6, 2018, valid until November 5, 2021
A member firm of Ernst & Young Global Limited

HOUSE OF INVESTMENTS, INC. AND SUBSIDIARIESSUPPLEMENTARY INFORMATION AND DISCLOSURES REQUIRED ONREVISED SRC RULE 68DECEMBER 31, 2020
Philippine Securities and Exchange Commission (SEC) issued the Revised Securities Regulation Code(SRC) Rule 68 which consolidates the two separate rules and labeled in the amendment as “Part I” and“Part II”, respectively. It also prescribed the additional information and schedule requirements for issuersof securities to the public.
Below are the additional information and schedules required by Revised SRC Rule 68 that are relevant tothe Group. This information is presented for the purpose of filing with the SEC and is not required part ofthe basic financial statements.
Schedule A. Financial Assets in Equity SecuritiesThe Group is not required to disclose the financial assets in equity securities as the equity investments atfair value through other comprehensive income (FVOCI) amounting P=547.08 million do not constitute5% or more of the total current assets of the Group as at December 31, 2020.
Schedule B. Amounts Receivable from Directors, Officers, Employees, Related Partiesand Principal Stockholders (other than related parties)As at December 31, 2020, the Group has no receivable above P1 million or 1% of the total assets,whichever is lower from directors, officers, employees, and principal stockholders (other than relatedparties).
Schedule C. Amounts Receivable from Related Parties which are eliminated during theConsolidation of Financial Statements
Below is the schedule of receivables with subsidiaries, which are eliminated in the consolidated financialstatements as at December 31, 2020:
Name and designation of debtorBalance at
beginning of year Additions Amounts collectedAmounts written
offBalance at
end of yearLandev CorporationDue from affiliates P=720,065 P=78,042,552 (P=77,493,985) P=− P=1,268,632Dividends receivable 35,000,145 40,000,000 (15,000,000) − 60,000,145
35,720,210 118,042,552 (92,493,985) − 61,268,777Greyhounds Security and Investigation Agency CorporationDue from affiliates 165,206 1,307,542 (1,371,002) − 101,746Investment Managers, Inc.Due from affiliates 441,975 5,159,260 (4,927,535) − 673,700iPeople, inc. and subsidiariesDue from affiliates 7,341,817 210,876,377 (196,611,638) − 21,606,556Dividends receivable ‒ 35,209,553 (35,209,553) − −
7,341,817 246,085,930 (231,821,191) − 21,606,556EEI Corporation and subsidiariesDue from affiliates 400,041 5,448,125 (4,327,205) − 1,520,961La Funeraria Paz Sucat, IncDue from affiliates 2,383,664 8,643,307 (9,472,370) − 1,554,601Zambowood Realty and Development CorpDue from affiliates 1,742 122,874 (120,274) − 4,342Xamdu Motors Inc.Due from affiliates 390 171,953 (168,343) − 4,000Zamboanga Carrier IncDue from affiliates 2,543 142,286 (137,886) − 6,943Honda Cars KalookanDue from affiliates − 734,366 (308,421) − 425,945
P=46,457,588 P=385,858,195 P=273,688,561 P=− P=65,549,730
These receivables are non-interest bearing and are expected to be settled within the next twelve months.
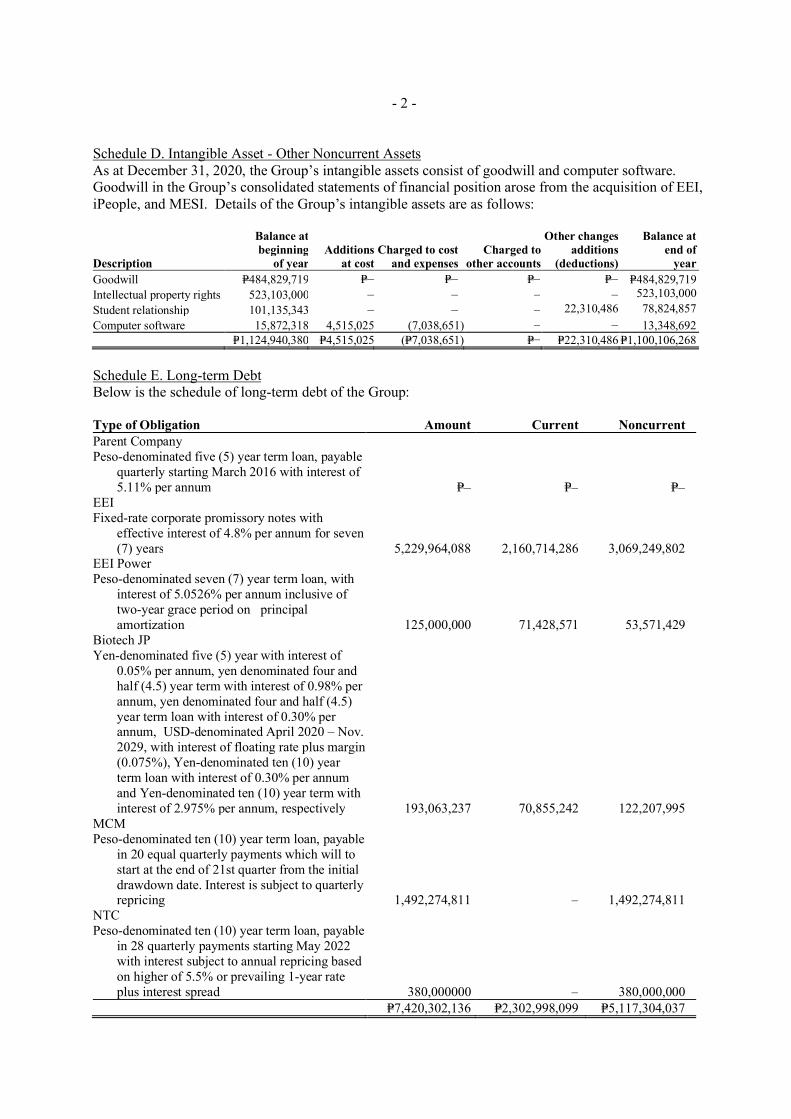
- 2 -
Schedule D. Intangible Asset - Other Noncurrent AssetsAs at December 31, 2020, the Group’s intangible assets consist of goodwill and computer software.Goodwill in the Group’s consolidated statements of financial position arose from the acquisition of EEI,iPeople, and MESI. Details of the Group’s intangible assets are as follows:
Description
Balance atbeginning
of yearAdditions
at costCharged to cost
and expensesCharged to
other accounts
Other changesadditions
(deductions)
Balance atend of
yearGoodwill P=484,829,719 P=‒ P=‒ P=‒ P=‒ P=484,829,719Intellectual property rights 523,103,000 ‒ ‒ ‒ ‒ 523,103,000Student relationship 101,135,343 ‒ ‒ ‒ 22,310,486 78,824,857Computer software 15,872,318 4,515,025 (7,038,651) ‒ ‒ 13,348,692
P=1,124,940,380 P=4,515,025 (P=7,038,651) P=− P=22,310,486 P=1,100,106,268
Schedule E. Long-term DebtBelow is the schedule of long-term debt of the Group:
Type of Obligation Amount Current NoncurrentParent CompanyPeso-denominated five (5) year term loan, payable
quarterly starting March 2016 with interest of5.11% per annum P=‒ P=‒ P=‒
EEIFixed-rate corporate promissory notes with
effective interest of 4.8% per annum for seven(7) years 5,229,964,088 2,160,714,286 3,069,249,802
EEI PowerPeso-denominated seven (7) year term loan, with
interest of 5.0526% per annum inclusive oftwo-year grace period on principalamortization 125,000,000 71,428,571 53,571,429
Biotech JPYen-denominated five (5) year with interest of
0.05% per annum, yen denominated four andhalf (4.5) year term with interest of 0.98% perannum, yen denominated four and half (4.5)year term loan with interest of 0.30% perannum, USD-denominated April 2020 – Nov.2029, with interest of floating rate plus margin(0.075%), Yen-denominated ten (10) yearterm loan with interest of 0.30% per annumand Yen-denominated ten (10) year term withinterest of 2.975% per annum, respectively 193,063,237 70,855,242 122,207,995
MCMPeso-denominated ten (10) year term loan, payable
in 20 equal quarterly payments which will tostart at the end of 21st quarter from the initialdrawdown date. Interest is subject to quarterlyrepricing 1,492,274,811 ‒ 1,492,274,811
NTCPeso-denominated ten (10) year term loan, payable
in 28 quarterly payments starting May 2022with interest subject to annual repricing basedon higher of 5.5% or prevailing 1-year rateplus interest spread 380,000000 ‒ 380,000,000
P=7,420,302,136 P=2,302,998,099 P=5,117,304,037

- 3 -
Schedule F. Indebtedness to Related Parties (Long-term Loans from Related Companies)As at December 31, 2020, the Group has no long-term loans from its related parties.
Schedule G. Guarantees of Securities of Other IssuersThere are no guarantees of securities of other issuing entities by the Group as at December 31, 2020.Schedule H. Capital Stock
Title of issue
Number ofshares
authorized
Number ofshares issued and
outstanding asshown under
related statementof financial
position caption
Number ofshares held byrelated parties
Directors,Officers and
Employees OthersCommon shares 1,250,000,000 776,465,281 487,289,351 2,286,920 286,889,010Preferred shares 2,500,000,000 ‒ ‒ ‒ ‒
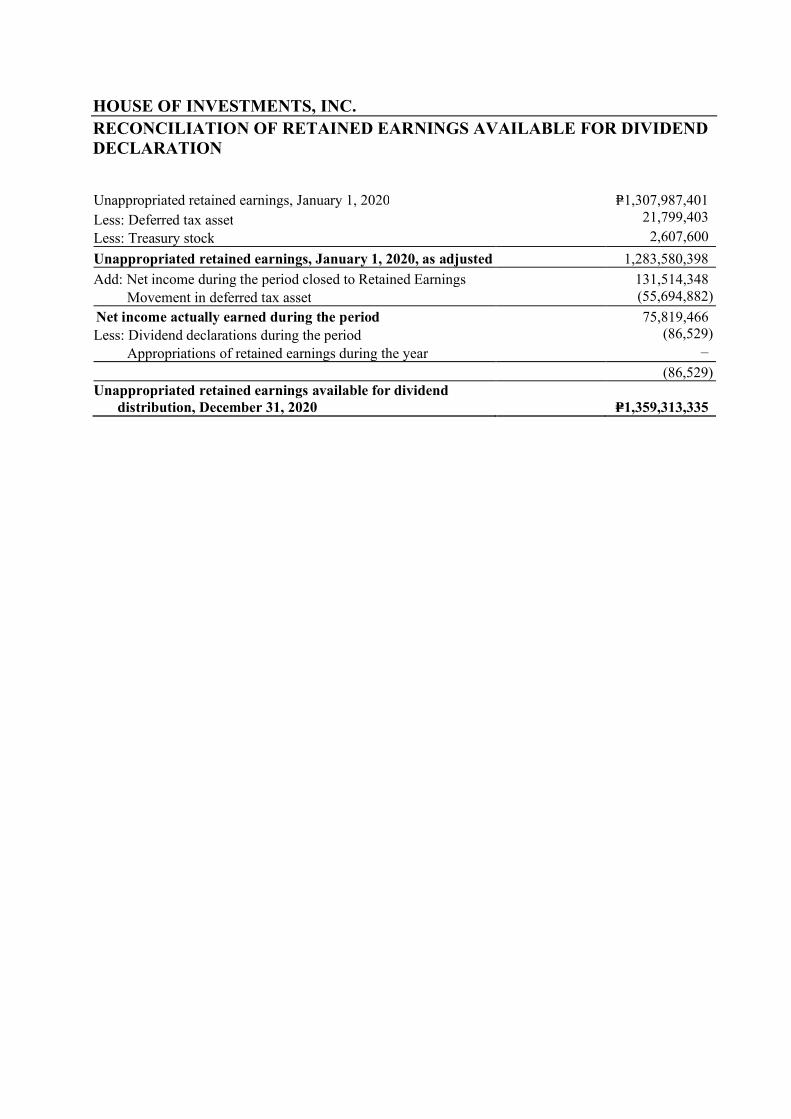
HOUSE OF INVESTMENTS, INC.RECONCILIATION OF RETAINED EARNINGS AVAILABLE FOR DIVIDENDDECLARATION
Unappropriated retained earnings, January 1, 2020 P=1,307,987,401Less: Deferred tax asset 21,799,403Less: Treasury stock 2,607,600Unappropriated retained earnings, January 1, 2020, as adjusted 1,283,580,398Add: Net income during the period closed to Retained Earnings 131,514,348
Movement in deferred tax asset (55,694,882)Net income actually earned during the period 75,819,466Less: Dividend declarations during the period (86,529)
Appropriations of retained earnings during the year ‒(86,529)
Unappropriated retained earnings available for dividenddistribution, December 31, 2020 P=1,359,313,335

HOUSE OF INVESTMENTS, INC. AND SUBSIDIARIESSCHEDULE OF FINANCIAL SOUNDNESS INDICATORS AS OFDECEMBER 31, 2020 AND 2019
Financial Soundness Indicator
Below are the financial ratios that are relevant to the Group for the years ended December 31, 2020 and2019:
Financial ratios 2020 2019Current ratio Current assets 1.02:1 1.12:1
Current liabilities
Solvency ratioNet income plus
depreciation (0.011:1) 0.11:1Total liabilities
Debt to equity ratio Total liabilities 1.37:1 1.21:1Total equity
Asset-to-equity ratio Total assets 2.37:1 2.21:1Total equity
Interest rate coverage EBIT* (3.16:1) 3.70:1Interest expense
Return on assets Net income (3.26%) 3.60%Average total assets
Return on equity Net income (7.47%) 7.92%Average total equity
*Earnings before interest and taxes (EBIT)

HOUSE OF INVESTMENTS, INC. AND SUBSIDIARIESMAP OF RELATIONSHIPS OF THE COMPANIES WITHIN THE GROUP
Group StructureBelow is a map showing the relationship between and among the Group and its ultimate parent company, subsidiaries, and associates as ofDecember 31, 2020:
Pan Malayan Management and Investment Corporation
House of Investments, Inc.(Honda, Isuzu and Geely Branches)
Honda CarsKalookan, Inc.
(55.00%)
iPeople,inc.
(48.18%)
EEICorporation(54.65%)*
Landev Corp.(100.00%)
A
Xamdu Corp.(100%)
ZambowoodRealty and
DevelopmentCorporation
(100.00%)
ZamboangaCarriers,
Inc.(100.00%)
B
La FunerariaPaz Sucat,
Inc.(50.00%)
AssociatesC
InvestmentManagers,
Inc.(100.00%)
San Lorenzo RuizInvestment Holdings
and Services Inc.(100.00%)
HexagonLounge
(100.00%)
GreyhoundsSecurity &
InvestigationAgency
(100.00%)
SeconProfessional
SecurityTraining
Academy Inc.(100.00%)

- 2 -
Malayan EducationSystem, Inc.(100.00%)
People eServeCorp.
(100.00%)
Pan PacificComputer Center,
Inc. (100.00%)
LINC Institute, Inc.(100.00%)
AC CollegeEnterprise and
Technology(100.00%)
Affordable PrivateEducation Center,
Inc. (100.00%)
University of NuevaCaceres(83.62%)
National TeachersCollege (99.79%)
Mapua InformationTechnology Center
(100.00%)
Mapua Techserv,Inc. (100.00%)
Malayan CollegesLaguna, Inc.(100.00%)
Malayan High Schoolof Science, Inc.
(100.00%)
A
Mapua Tech Power,Inc
(75.00%)
Malayan CollegesMindanao, Inc.
(100.00%)

- 3 -
B

- 4 -
* In November 2019, Parent purchased additional 3 million shares resulting to an increased ownership interest from 54.36 to 54.65%.
** On February 21, 2013, significant influence was obtained through piecemeal acquisition. In 2014, the Group purchased additional 6.6 million shares of PERC increasedownership interest from 20.00% to 22.41%. In 2018, the Parent purchased additional 69,285,418 shares amounting to P332.6M from stock rights offering, which increasedownership to 28.36%. In 2019, Parent purchased additional 4.2 million shares resulting to an increased ownership to 29.10%
*** On September 17, 2013, the Group acquired 10.00% ownership in RRC. The Group was able to exercise significant influence since it has the capacity to participate in thefinancial and operating decisions of RRC through common key management and representation to the Board of Directors
****On November 8, 2019, the Parent purchased 2,500,000 shares of Sojitz G Auto Philippines Corporation from Sojitz Corporation amounting to P50,000,000 equivalent to20% ownership equity.
Petroenergy ResourcesCorporation**
(29.10%)
C
Hi-Eisai Pharmaceuticals,Inc.
(50.00%)
Sojits G AutoPhilippines Corporation
(20.00%)****
Manila Memorial ParkCemetery, Inc.
(25.98%)
RCBC RealtyCorporation***
(10.00%)
T’boli Agro-IndustrialDevelopment, Inc.
(28.47%)

ANNEX “E”
HOUSE OF INVESTMENTS, INC. AND SUBSIDIARIES
CONSOLIDATED FINANCIAL STATEMENTS
OF MARCH 31, 2021 AND DECEMBER 31, 2020 AND THREE MONTHS ENDED MARCH 31, 2021, 2020, AND 2019
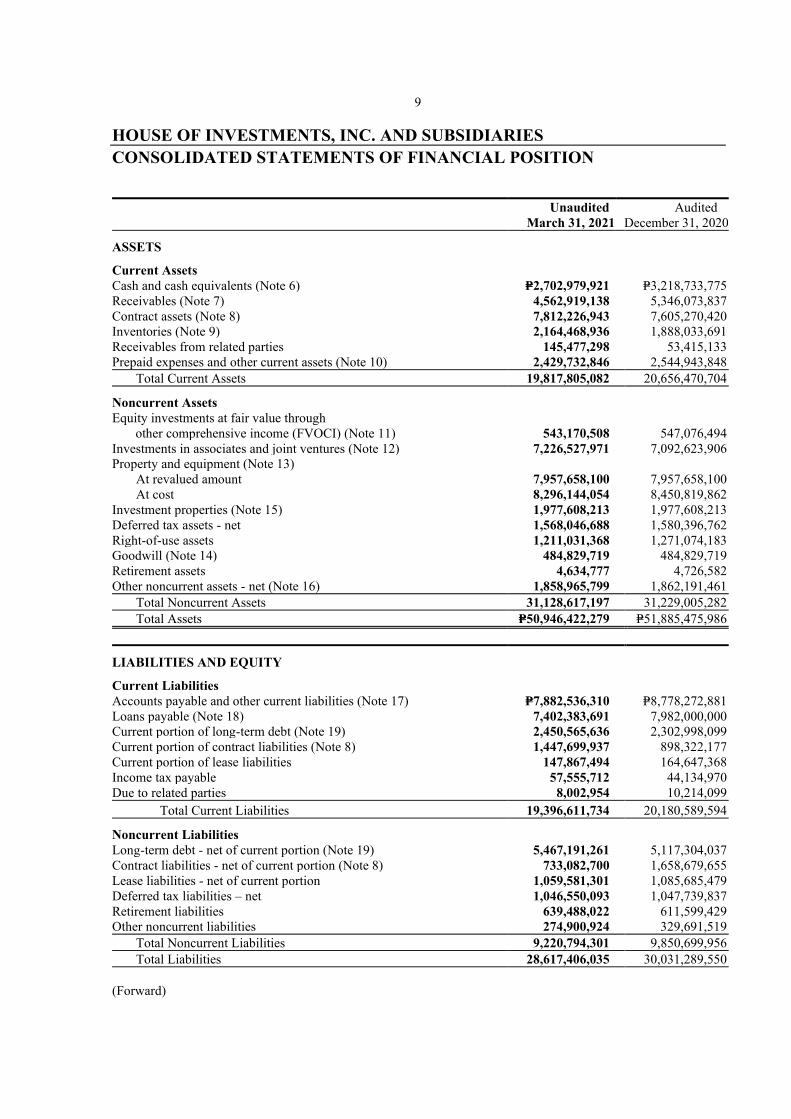
9 HOUSE OF INVESTMENTS, INC. AND SUBSIDIARIES CONSOLIDATED STATEMENTS OF FINANCIAL POSITION
Unaudited
March 31, 2021 Audited
December 31, 2020
ASSETS
Current Assets Cash and cash equivalents (Note 6) P=2,702,979,921 P=3,218,733,775 Receivables (Note 7) 4,562,919,138 5,346,073,837 Contract assets (Note 8) 7,812,226,943 7,605,270,420 Inventories (Note 9) 2,164,468,936 1,888,033,691 Receivables from related parties 145,477,298 53,415,133 Prepaid expenses and other current assets (Note 10) 2,429,732,846 2,544,943,848 Total Current Assets 19,817,805,082 20,656,470,704
Noncurrent Assets Equity investments at fair value through other comprehensive income (FVOCI) (Note 11) 543,170,508 547,076,494 Investments in associates and joint ventures (Note 12) 7,226,527,971 7,092,623,906 Property and equipment (Note 13) At revalued amount 7,957,658,100 7,957,658,100 At cost 8,296,144,054 8,450,819,862 Investment properties (Note 15) 1,977,608,213 1,977,608,213 Deferred tax assets - net 1,568,046,688 1,580,396,762 Right-of-use assets 1,211,031,368 1,271,074,183 Goodwill (Note 14) 484,829,719 484,829,719 Retirement assets 4,634,777 4,726,582 Other noncurrent assets - net (Note 16) 1,858,965,799 1,862,191,461 Total Noncurrent Assets 31,128,617,197 31,229,005,282 Total Assets P=50,946,422,279 P=51,885,475,986
LIABILITIES AND EQUITY
Current Liabilities Accounts payable and other current liabilities (Note 17) P=7,882,536,310 P=8,778,272,881 Loans payable (Note 18) 7,402,383,691 7,982,000,000 Current portion of long-term debt (Note 19) 2,450,565,636 2,302,998,099 Current portion of contract liabilities (Note 8) 1,447,699,937 898,322,177 Current portion of lease liabilities 147,867,494 164,647,368 Income tax payable 57,555,712 44,134,970 Due to related parties 8,002,954 10,214,099 Total Current Liabilities 19,396,611,734 20,180,589,594
Noncurrent Liabilities Long-term debt - net of current portion (Note 19) 5,467,191,261 5,117,304,037 Contract liabilities - net of current portion (Note 8) 733,082,700 1,658,679,655 Lease liabilities - net of current portion 1,059,581,301 1,085,685,479 Deferred tax liabilities – net 1,046,550,093 1,047,739,837 Retirement liabilities 639,488,022 611,599,429 Other noncurrent liabilities 274,900,924 329,691,519 Total Noncurrent Liabilities 9,220,794,301 9,850,699,956 Total Liabilities 28,617,406,035 30,031,289,550 (Forward)

10
Unaudited
March 31, 2021 Audited
December 31, 2020
Equity Attributable to equity holders of the Parent Company Common stock (Note 21) 1,162,540,326 1,162,540,326
Additional paid-in capital 154,578,328 154,578,328 Equity reserve on acquisition of non-controlling interest 1,623,004,873 1,623,004,873 Revaluation increment on land - net 1,293,975,163 1,294,577,413 Cumulative translation adjustments 230,243,643 225,033,109 Fair value reserve of equity investments at FVOCI (Note 11) 174,950,419 175,482,889 Remeasurement loss on retirement (259,995,469) (259,954,684) Retained earnings (Note 20) 10,105,089,356 9,785,834,055
14,484,386,639 14,161,096,309 Non-controlling interests (Note 34) 7,844,629,605 7,693,090,127 Total Equity 22,329,016,244 21,854,186,436 P=50,946,422,279 P=51,885,475,986 See accompanying Notes to Consolidated Financial Statements.
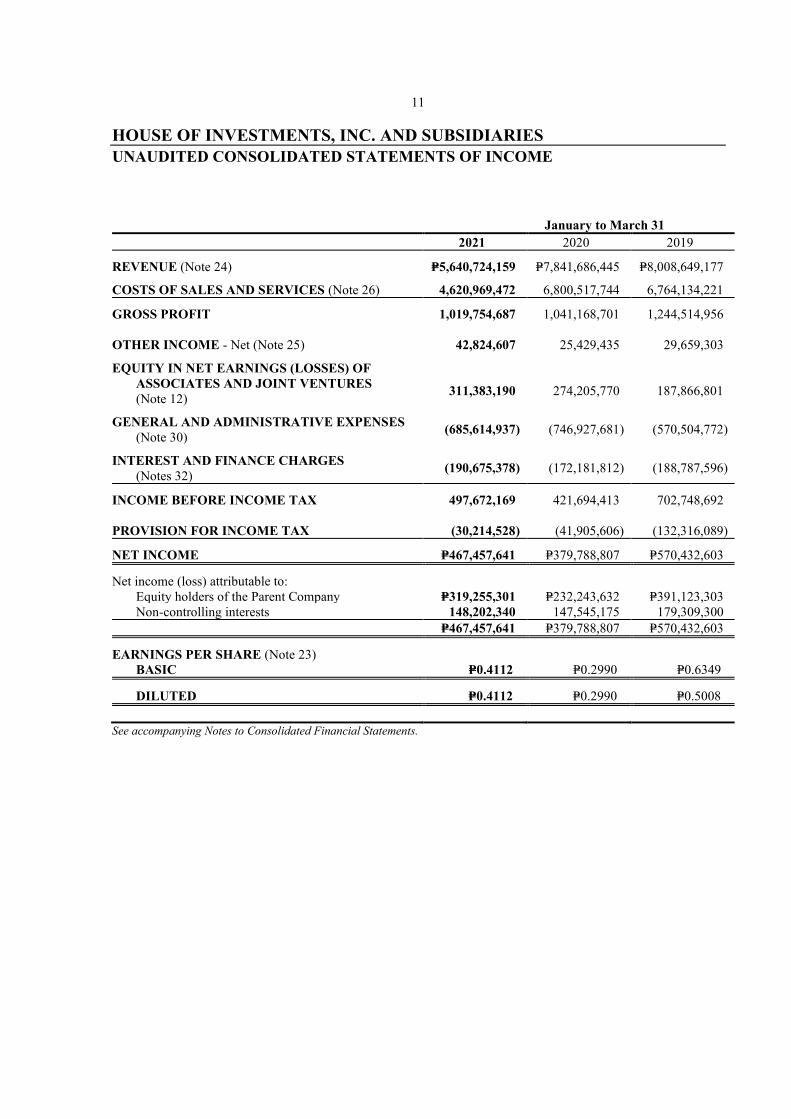
11 HOUSE OF INVESTMENTS, INC. AND SUBSIDIARIES UNAUDITED CONSOLIDATED STATEMENTS OF INCOME January to March 31
2021 2020 2019
REVENUE (Note 24) P=5,640,724,159 P=7,841,686,445 P=8,008,649,177
COSTS OF SALES AND SERVICES (Note 26) 4,620,969,472 6,800,517,744 6,764,134,221
GROSS PROFIT 1,019,754,687 1,041,168,701 1,244,514,956
OTHER INCOME - Net (Note 25)
42,824,607
25,429,435
29,659,303
EQUITY IN NET EARNINGS (LOSSES) OF ASSOCIATES AND JOINT VENTURES (Note 12)
311,383,190
274,205,770
187,866,801
GENERAL AND ADMINISTRATIVE EXPENSES (Note 30)
(685,614,937)
(746,927,681)
(570,504,772)
INTEREST AND FINANCE CHARGES (Notes 32)
(190,675,378)
(172,181,812)
(188,787,596)
INCOME BEFORE INCOME TAX 497,672,169 421,694,413 702,748,692
PROVISION FOR INCOME TAX
(30,214,528)
(41,905,606)
(132,316,089)
NET INCOME P=467,457,641 P=379,788,807 P=570,432,603
Net income (loss) attributable to: Equity holders of the Parent Company P=319,255,301 P=232,243,632 P=391,123,303 Non-controlling interests 148,202,340 147,545,175 179,309,300
P=467,457,641 P=379,788,807 P=570,432,603
EARNINGS PER SHARE (Note 23) BASIC P=0.4112 P=0.2990 P=0.6349
DILUTED P=0.4112 P=0.2990 P=0.5008 See accompanying Notes to Consolidated Financial Statements.
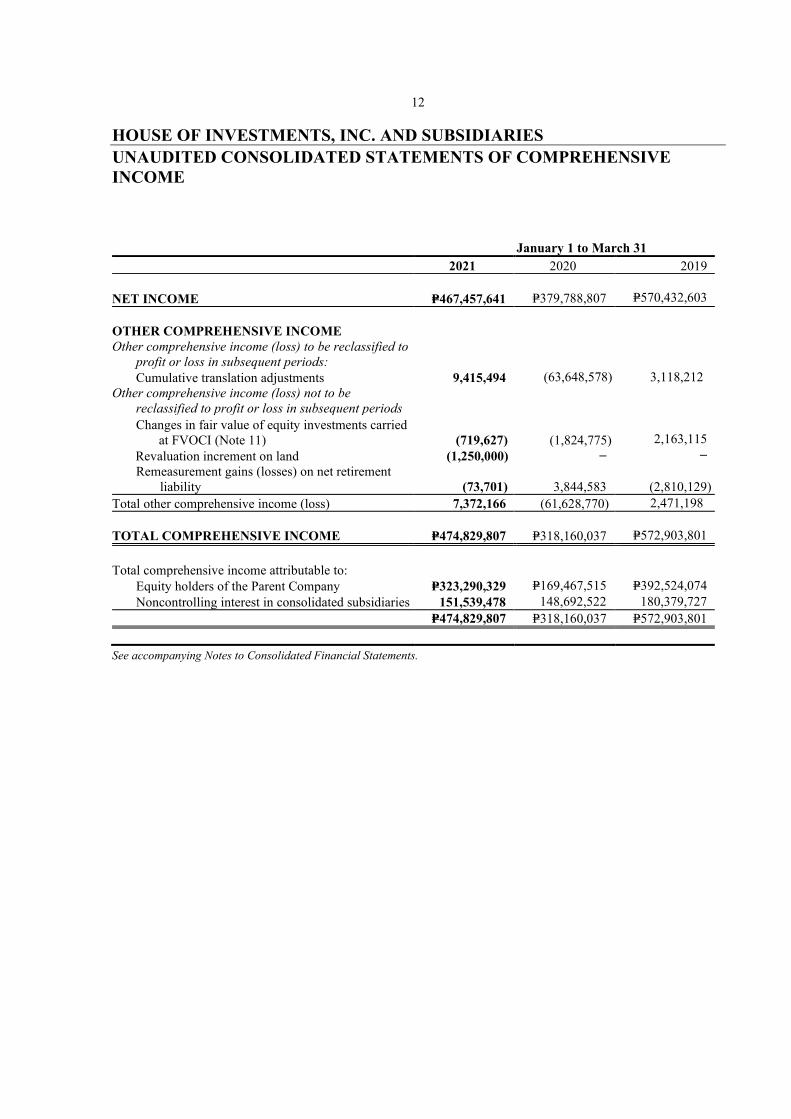
12 HOUSE OF INVESTMENTS, INC. AND SUBSIDIARIES UNAUDITED CONSOLIDATED STATEMENTS OF COMPREHENSIVE INCOME January 1 to March 31 2021 2020 2019
NET INCOME
P=467,457,641
P=379,788,807
P=570,432,603
OTHER COMPREHENSIVE INCOME Other comprehensive income (loss) to be reclassified to
profit or loss in subsequent periods: Cumulative translation adjustments 9,415,494 (63,648,578) 3,118,212 Other comprehensive income (loss) not to be
reclassified to profit or loss in subsequent periods Changes in fair value of equity investments carried at FVOCI (Note 11)
(719,627)
(1,824,775)
2,163,115
Revaluation increment on land (1,250,000) − − Remeasurement gains (losses) on net retirement
liability (73,701)
3,844,583
(2,810,129) Total other comprehensive income (loss) 7,372,166 (61,628,770) 2,471,198
TOTAL COMPREHENSIVE INCOME P=474,829,807 P=318,160,037
P=572,903,801
Total comprehensive income attributable to: Equity holders of the Parent Company P=323,290,329 P=169,467,515 P=392,524,074 Noncontrolling interest in consolidated subsidiaries 151,539,478 148,692,522 180,379,727
P=474,829,807 P=318,160,037 P=572,903,801 See accompanying Notes to Consolidated Financial Statements.

13 HOUSE OF INVESTMENTS, INC. AND SUBSIDIARIES UNAUDITED CONSOLIDATED STATEMENTS OF CHANGES IN EQUITY Attributable to the Group
Preferred Stock
(Note 20)
Common Stock
(Note 20)
Additional Paid-in Capital
Premium on Acquisition of
Noncontrolling Interest
Revaluation Increment
on Land - Net
Cumulative Translation Adjustment
Changes in fair value of
equity investments
carried at FVOCI
Remeasurement losses on Net Retirement
Liability Retained Earnings Total
Attributable to Noncontrolling
Interest Total
For the Period Ended March 31, 2021
Balances as at January 1, 2021 – P=1,162,540,326 P=154,578,328 P=1,623,004,873 P=1,294,577,413 P=225,003,108 P=175,482,289 (P=259,954,683) P=9,785,834,055 P=14,161,096,308 P=7,693,090,171 P=21,854,186,436 Redemption of preferred shares – – – – – – – – – – – –
Acquisition of noncontrolling interest – – – – – – – – – – – –
– 1,162,540,326 154,578,328 1,623,004,873 1,298,881,074 245,958,913 314,796,038 (190,472,642) 10,070,067,278 14,161,096,308 7,693,090,171 21,854,186,436
Net income – – – – – – – – 319,255,301 319,255,301 148,202,340 467,457,641
Other comprehensive income – – – – (602,250) 5,210,535 (532,470) (40,786) – 4,035,028 3,337,139 7,372,167
Total comprehensive income – – – – (602,250) 5,210,535 (532,470) (40,786) 319,255,301 323,290,329 151,539,478 474,829,807
Dividends declared by Parent Company – – – – – – – – – – – –
Dividends declared by subsidiaries – – – – – – – – – – – –
Total dividends declared – – – – – – – – – – – –
Balances as at March 31, 2021 P=– P=1,162,540,326 P=154,578,328 1,623,004,873 P=1,293,975,163 P=230,243,643 P=174,950,419 (P=259,995,469) P=10,105,089,356 P=14,484,386,638 P=7,844,629,605 P=22,329,016,244
For the Period Ended March 31, 2020 Balances as at January 1, 2020 6,710,402 P=1,162,540,326 P=154,578,328 P=1,641,756,492 P=1,298,881,074 P=245,958,913 P=311,094,152 (P=188,329,963) P=10,111,285,659 P=14,744,475,383 P=8,749,236,709 P=23,493,712,092 Impact of PFRS 16 adoption (6,710,402) – – – – – – – – (6,710,402) – (6,710,402) Acquisition of noncontrolling interest – – – (18,751,619) – 2,219,250 3,701,886 (2,142,679) (41,218,381) (56,191,544) (3,778,456) (59,970,000) – 1,162,540,326 154,578,328 1,623,004,873 1,298,881,074 245,958,913 314,796,038 (190,472,642) 10,070,067,278 14,681,573,437 8,745,458,253 23,427,031,690 Net income – – – – – – – – 232,243,632 232,243,632 147,545,175 379,788,807 Other comprehensive income – – – – – (63,529,365) (5,276,368) 6,029,616 – (62,776,117) 1,147,347 (61,628,770) Total comprehensive income – – – – – (63,529,365) (5,276,368) 6,029,616 232,243,632 169,467,515 148,692,522 318,160,037 Dividends declared by Parent Company – – – – – – – – (86,528) (86,528) – (86,528) Dividends declared by subsidiaries – – – – – – – – – – (37,956,997) (37,956,997) Total dividends declared – – – – – – – – (86,528) (86,528) (37,956,997) (38,043,525) Balances as at March 31, 2020 P=– P=1,162,540,326 P=154,578,328 1,623,004,873 P=1,298,881,074 P=184,648,798 P=309,519,670 (P=184,443,026) P=10,302,224,382 P=14,850,954,424 P=8,856,193,778 P=23,707,148,202
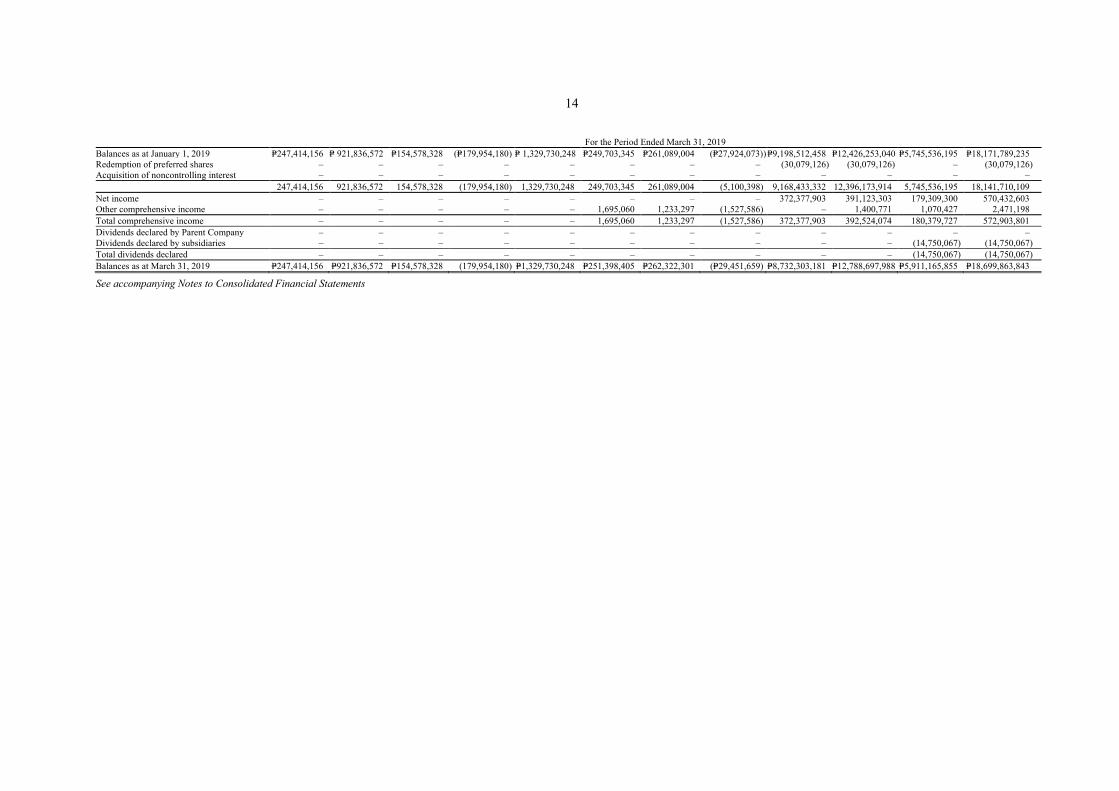
14
For the Period Ended March 31, 2019 Balances as at January 1, 2019 P=247,414,156 P= 921,836,572 P=154,578,328 (P=179,954,180) P= 1,329,730,248 P=249,703,345 P=261,089,004 (P=27,924,073)) P=9,198,512,458 P=12,426,253,040 P=5,745,536,195 P=18,171,789,235 Redemption of preferred shares – – – – – – – – (30,079,126) (30,079,126) – (30,079,126) Acquisition of noncontrolling interest – – – – – – – – – – – – 247,414,156 921,836,572 154,578,328 (179,954,180) 1,329,730,248 249,703,345 261,089,004 (5,100,398) 9,168,433,332 12,396,173,914 5,745,536,195 18,141,710,109 Net income – – – – – – – – 372,377,903 391,123,303 179,309,300 570,432,603 Other comprehensive income – – – – – 1,695,060 1,233,297 (1,527,586) – 1,400,771 1,070,427 2,471,198 Total comprehensive income – – – – – 1,695,060 1,233,297 (1,527,586) 372,377,903 392,524,074 180,379,727 572,903,801 Dividends declared by Parent Company – – – – – – – – – – – – Dividends declared by subsidiaries – – – – – – – – – – (14,750,067) (14,750,067) Total dividends declared – – – – – – – – – – (14,750,067) (14,750,067) Balances as at March 31, 2019 P=247,414,156 P=921,836,572 P=154,578,328 (179,954,180) P=1,329,730,248 P=251,398,405 P=262,322,301 (P=29,451,659) P=8,732,303,181 P=12,788,697,988 P=5,911,165,855 P=18,699,863,843
See accompanying Notes to Consolidated Financial Statements

15
HOUSE OF INVESTMENTS, INC. AND SUBSIDIARIES UNAUDITED CONSOLIDATED STATEMENTS OF CASH FLOWS Periods Ended March 31 2021 2020 2019 CASH FLOWS FROM OPERATING ACTIVITIES Income before income tax 497,672,169 P=421,694,413 P=702,748,692 Adjustments for: Depreciation and amortization 297,768,552 319,063,576 158,773,718 Interest and finance charges 190,675,378 155,005,893 188,787,597 Movement in accrued retirement liability − − − Dividend income (1,882,633) (467,504) (12,234,140) Interest income (4,052,585) (9,618,667) (13,660,191) Impact of PFRS 16 adoption − − (30,079,126) Equity earnings in associates (311,383,190) (274,205,770) (187,866,801) Operating income working capital changes 668,797,691 611,471,941 806,469,749 Changes in operating assets and liabilities: Decrease (increase) in: Accounts receivable 783,154,699 (419,390,423) (787,819,758) Loans receivable − − (11,356,766) Contract assets (206,956,523) (212,581,550) 158,680,385 Inventories (276,435,245) (286,461,214) 10,334,165 Prepaid expenses and other current assets 115,211,002 (354,664,866) (287,676,929) Financial asset at FVPL − − (8,802,631) Increase (decrease) in: Accounts payable and accrued expenses (895,736,571) 601,592,560 59,372,968 Customers’ deposits − − − Billings in excess of costs and estimated earnings
on uncompleted contracts − − − Contract liabilities (376,219,194) (752,939,806) (72,423,446)
Accrued retirement liability 27,847,807 14,065,664 2,767,257 Net cash generated from (used for) operations (160,336,334) (798,907,694) (130,455,006) Interest received 4,052,585 9,618,667 13,660,191 Interest and finance charges paid (190,675,378) (155,005,893) (188,787,597) Income tax paid (60,424,049) 39,050,634 (104,616,806) Net cash flows provided by (used in) operating
activities (407,383,176) (905,244,286) (410,199,218)
CASH FLOWS FROM INVESTING ACTIVITIES Payments received from (advances to) related parties (94,273,311) (145,053,507) 75,058,157 Investments in associates and joint ventures 182,689,658 197,210,771 (5,297,926) Increase (decrease) in other noncurrent assets 63,360,282 106,329,812 (339,974,615) Proceeds from disposals (acquisitions) of available-
for-sale securities 3,373,517 18,507,162 (4,127,672) Property, plant and equipment, net (143,694,995) 377,301,872 (117,140,158) Dividends received 1,882,633 467,504 12,234,140 Net Addition (deduction) to minority interest 3,337,137 (100,558,107) (13,679,641) Net cash flows used in investing activities 16,674,921 454,205,507 (392,927,715)

- 16 -
Periods Ended March 31 2021 2020 2019 CASH FLOWS FROM FINANCING ACTIVITIES Proceeds (payments) from: Loans payable (579,616,308) 1,099,000,000 574,900,000 Long-term debt 497,454,761 (257,441,174) (263,095,239) Other noncurrent liability (42,884,053) (17,877,063) 610,454,054 Redemption of preferred shares − (6,710,402) − Cash dividends paid − (86,529) − Net cash flows provided by (used in) financing
activities (125,045,600) 816,884,832 922,258,815 NET INCREASE (DECREASE) IN CASH AND
CASH EQUIVALENTS (515,753,854) 365,846,053 119,131,882 CASH AND CASH EQUIVALENTS AT
BEGINNING OF YEAR 3,218,733,775 2,686,669,074 2,039,664,825 CASH AND CASH EQUIVALENTS AT
END OF PERIOD P=2,702,979,921 P=3,052,515,127 P=2,158,796,707 See accompanying Notes to Consolidated Financial Statements
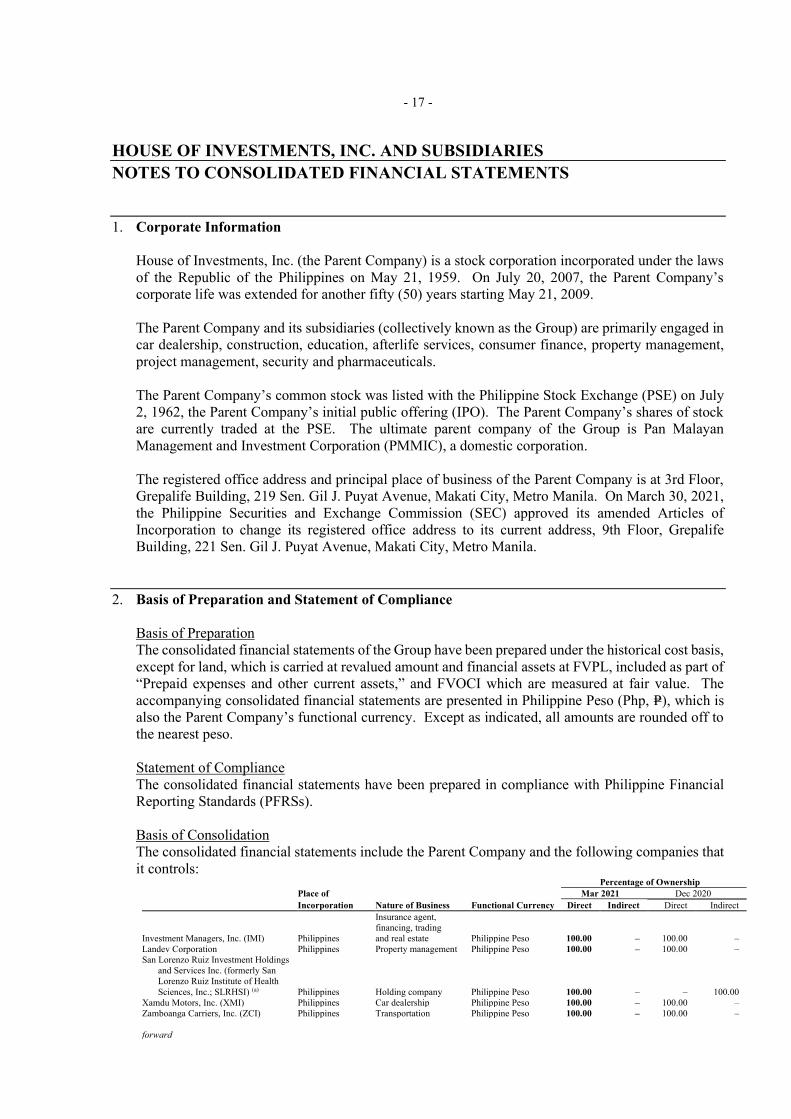
- 17 -
HOUSE OF INVESTMENTS, INC. AND SUBSIDIARIES NOTES TO CONSOLIDATED FINANCIAL STATEMENTS 1. Corporate Information
House of Investments, Inc. (the Parent Company) is a stock corporation incorporated under the laws of the Republic of the Philippines on May 21, 1959. On July 20, 2007, the Parent Company’s corporate life was extended for another fifty (50) years starting May 21, 2009. The Parent Company and its subsidiaries (collectively known as the Group) are primarily engaged in car dealership, construction, education, afterlife services, consumer finance, property management, project management, security and pharmaceuticals. The Parent Company’s common stock was listed with the Philippine Stock Exchange (PSE) on July 2, 1962, the Parent Company’s initial public offering (IPO). The Parent Company’s shares of stock are currently traded at the PSE. The ultimate parent company of the Group is Pan Malayan Management and Investment Corporation (PMMIC), a domestic corporation. The registered office address and principal place of business of the Parent Company is at 3rd Floor, Grepalife Building, 219 Sen. Gil J. Puyat Avenue, Makati City, Metro Manila. On March 30, 2021, the Philippine Securities and Exchange Commission (SEC) approved its amended Articles of Incorporation to change its registered office address to its current address, 9th Floor, Grepalife Building, 221 Sen. Gil J. Puyat Avenue, Makati City, Metro Manila.
2. Basis of Preparation and Statement of Compliance
Basis of Preparation The consolidated financial statements of the Group have been prepared under the historical cost basis, except for land, which is carried at revalued amount and financial assets at FVPL, included as part of “Prepaid expenses and other current assets,” and FVOCI which are measured at fair value. The accompanying consolidated financial statements are presented in Philippine Peso (Php, P=), which is also the Parent Company’s functional currency. Except as indicated, all amounts are rounded off to the nearest peso.
Statement of Compliance The consolidated financial statements have been prepared in compliance with Philippine Financial Reporting Standards (PFRSs). Basis of Consolidation The consolidated financial statements include the Parent Company and the following companies that it controls:
Percentage of Ownership Place of Mar 2021 Dec 2020 Incorporation Nature of Business Functional Currency Direct Indirect Direct Indirect
Investment Managers, Inc. (IMI) Philippines
Insurance agent, financing, trading and real estate Philippine Peso 100.00 – 100.00 –
Landev Corporation Philippines Property management Philippine Peso 100.00 – 100.00 – San Lorenzo Ruiz Investment Holdings and Services Inc. (formerly San Lorenzo Ruiz Institute of Health Sciences, Inc.; SLRHSI) (a) Philippines Holding company Philippine Peso 100.00 – – 100.00 Xamdu Motors, Inc. (XMI) Philippines Car dealership Philippine Peso 100.00 – 100.00 – Zamboanga Carriers, Inc. (ZCI) Philippines Transportation Philippine Peso 100.00 – 100.00 – forward

- 18 -
Percentage of Ownership Place of Mar 2021 Dec 2020 Incorporation Nature of Business Functional Currency Direct Indirect Direct Indirect Zambowood Realty and Development Corporation (ZRDC) Philippines Real estate Philippine Peso 100.00 – 100.00 – Greyhounds Security and Investigation Agency Corp. Philippines Security agency Philippine Peso ‒ 100.00 ‒ 100.00 Hexagon Lounge, Inc. Philippines Restaurant Philippine Peso ‒ 100.00 ‒ 100.00 Secon Professional Security Training
Academy Inc. Philippines Training service provider Philippine Peso ‒ 100.00 ‒ 100.00
Honda Cars Kalookan, Inc. (HCKI) Philippines Car dealership Philippine Peso 55.00 – 55.00 – La Funeraria Paz Sucat, Inc. (LFPSI) Philippines Memorial services Philippine Peso 50.00 13.00 50.00 13.00 EEI Corporation (EEI) (b) Philippines Construction Philippine Peso 55.34 – 55.34 –
EEI Limited British Virgin Islands Holding company US Dollar – 100.00 – 100.00
Clear Jewel Investments, Ltd. British Virgin Islands Holding company US Dollar – 100.00 – 100.00
Nimaridge Investments, Limited British Virgin Islands Holding company US Dollar – 100.00 – 100.00
EEI (PNG), Ltd Papua New Guinea Holding company US Dollar – 100.00 – 100.00
EEI Corporation (Guam), Inc. United States of America Construction US Dollar – 100.00 – 100.00
EEI Construction and Marine, Inc. Philippines Construction Philippine Peso – 100.00 – 100.00 EEI Realty Corporation (EEI Realty) Philippines Real estate Philippine Peso – 100.00 – 100.00 EEI Subic Corporation Philippines Construction Philippine Peso – 100.00 – 100.00 Equipment Engineers, Inc. (EE) Philippines Construction Philippine Peso – 100.00 – 100.00
JP Systems Asia Inc. (JPSAI) Philippines Rental of scaffolding and formworks Philippine Peso – 60.00 – 60.00
BiotechJP Corporation Philippines
Manufacturing food and therapeutic food Philippine Peso – 60.00 – 60.00
Learn JP Corp Philippines
Service for improvement in language proficiency Philippine Peso
– 60.00
– 60.00
EEI Power Corporation (EPC) Philippines Power generation Philippine Peso – 100.00 – 100.00 Gulf Asia International Corporation (GAIC) Philippines Manpower services Philippine Peso – 100.00 – 100.00 GAIC Professional Services, Inc. (GAPSI) Philippines Manpower services Philippine Peso – 100.00 – 100.00 GAIC Manpower Services, Inc. (GAMSI) Philippines Manpower services Philippine Peso – 100.00 – 100.00 Bagumbayan Equipment & Industrial Products, Inc. Philippines Consultancy services Philippine Peso – 100.00 – 100.00 Philmark, Inc. Philippines Construction Philippine Peso – 100.00 – 100.00 Philrock Construction and Services, Inc. Philippines Manpower services Philippine Peso – 100.00 – 100.00 EEI Energy Solutions Corporation (EESC) (c)
Philippines
Retail electricity supplier
Philippine Peso
–
100.00
–
–
iPeople, inc. (IPO) Philippines Education and Information Technology Philippine Peso 48.18 – 48.18 –
Malayan Education System, Inc. (MESI) (Operating Under the Name of Mapua University) Philippines
Education and Information Technology Philippine Peso ‒ 100.00 ‒ 100.00
Malayan Colleges Laguna, Inc., A Mapua School (MCLI) Philippines
Education and Information Technology Philippine Peso – 100.00 – 100.00
Malayan Colleges Mindanao (A Mapua School), Inc. (MCMI) Philippines
Education and Information Technology Philippine Peso – 100.00 – 100.00
Malayan High School of Science, Inc. (MHSSI) Philippines
Education and Information Technology Philippine Peso – 100.00 – 100.00
Mapua Information Technology Center, Inc. (MITC) Philippines
Education and Information Technology Philippine Peso
– 100.00
– 100.00
Mapua Techserv, Inc. (MTI) Philippines Consultancy Philippine Peso
– 100.00
– 100.00
Mapua Techpower Inc. Philippines Consultancy Philippine Peso – 75.00 – 75.00
People eServe Corporation Philippines
Education and Information Technology Philippine Peso – 100.00 – 100.00
Pan Pacific Computer Center, Incorporated (PPCCI) Philippines
Education and Information Technology Philippine Peso – 100.00 – 100.00
Affordable Private Education Center, Inc doing business under the name of
APEC Schools (APEC) Philippines
Education and Information Technology Philippine Peso – 100.00 – 100.00
National Teachers College doing business under the name/s and style/s of The National Teachers College Philippines
Education and Information Technology Philippine Peso – 99.79 – 99.79
forward
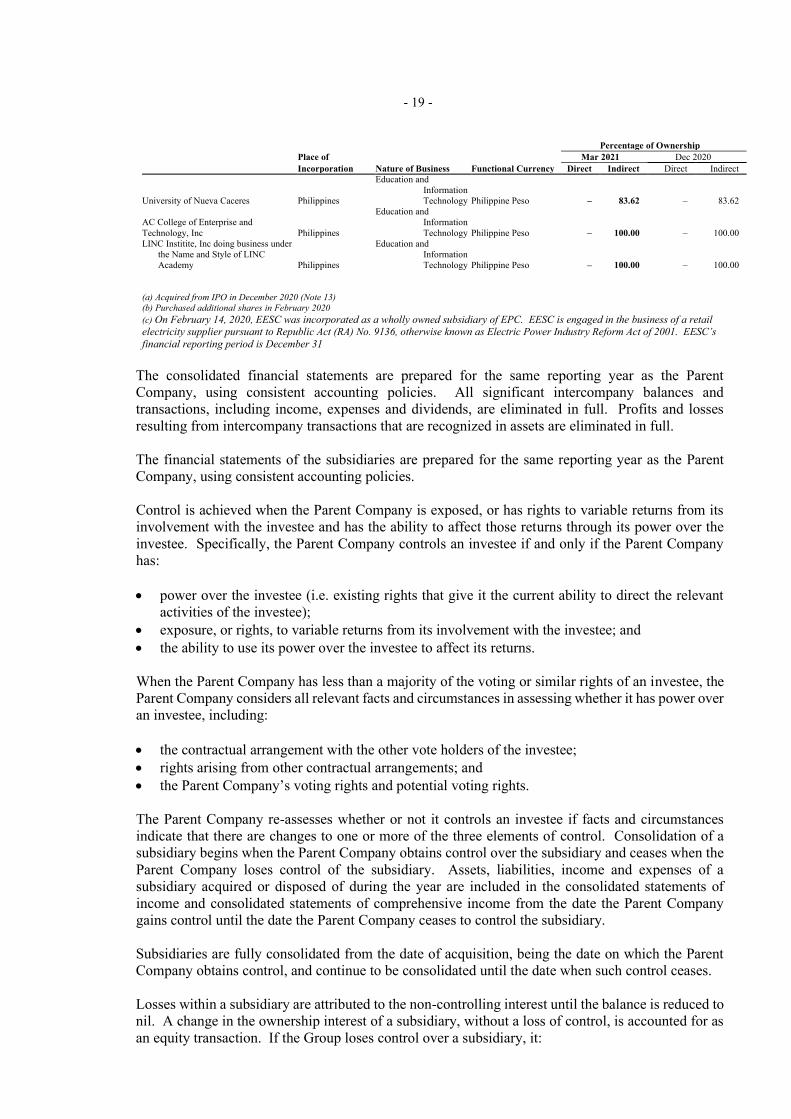
- 19 -
Percentage of Ownership Place of Mar 2021 Dec 2020 Incorporation Nature of Business Functional Currency Direct Indirect Direct Indirect
University of Nueva Caceres Philippines
Education and Information Technology Philippine Peso – 83.62 – 83.62
AC College of Enterprise and Technology, Inc Philippines
Education and Information Technology Philippine Peso – 100.00 – 100.00
LINC Institite, Inc doing business under the Name and Style of LINC Academy Philippines
Education and Information Technology Philippine Peso – 100.00 – 100.00
(a) Acquired from IPO in December 2020 (Note 13) (b) Purchased additional shares in February 2020 (c) On February 14, 2020, EESC was incorporated as a wholly owned subsidiary of EPC. EESC is engaged in the business of a retail electricity supplier pursuant to Republic Act (RA) No. 9136, otherwise known as Electric Power Industry Reform Act of 2001. EESC’s financial reporting period is December 31
The consolidated financial statements are prepared for the same reporting year as the Parent Company, using consistent accounting policies. All significant intercompany balances and transactions, including income, expenses and dividends, are eliminated in full. Profits and losses resulting from intercompany transactions that are recognized in assets are eliminated in full.
The financial statements of the subsidiaries are prepared for the same reporting year as the Parent Company, using consistent accounting policies.
Control is achieved when the Parent Company is exposed, or has rights to variable returns from its involvement with the investee and has the ability to affect those returns through its power over the investee. Specifically, the Parent Company controls an investee if and only if the Parent Company has:
• power over the investee (i.e. existing rights that give it the current ability to direct the relevant
activities of the investee); • exposure, or rights, to variable returns from its involvement with the investee; and • the ability to use its power over the investee to affect its returns.
When the Parent Company has less than a majority of the voting or similar rights of an investee, the Parent Company considers all relevant facts and circumstances in assessing whether it has power over an investee, including:
• the contractual arrangement with the other vote holders of the investee; • rights arising from other contractual arrangements; and • the Parent Company’s voting rights and potential voting rights.
The Parent Company re-assesses whether or not it controls an investee if facts and circumstances indicate that there are changes to one or more of the three elements of control. Consolidation of a subsidiary begins when the Parent Company obtains control over the subsidiary and ceases when the Parent Company loses control of the subsidiary. Assets, liabilities, income and expenses of a subsidiary acquired or disposed of during the year are included in the consolidated statements of income and consolidated statements of comprehensive income from the date the Parent Company gains control until the date the Parent Company ceases to control the subsidiary. Subsidiaries are fully consolidated from the date of acquisition, being the date on which the Parent Company obtains control, and continue to be consolidated until the date when such control ceases.
Losses within a subsidiary are attributed to the non-controlling interest until the balance is reduced to nil. A change in the ownership interest of a subsidiary, without a loss of control, is accounted for as an equity transaction. If the Group loses control over a subsidiary, it:

- 20 -
• Derecognizes the assets (including goodwill) and liabilities of the subsidiary; • Derecognizes the carrying amount of any non-controlling interests; • Recognizes the fair value of the consideration received; • Recognizes the fair value of any investment retained; • Reclassifies to profit or loss, or transfer directly to retained earnings if required by other PFRSs,
the amounts recognized in other comprehensive income in relation to the subsidiary; and recognizes any resulting difference as a gain or loss in profit or loss attributable to the Parent Company
Non-controlling interests (NCI) represent the portion of equity not attributable to the Parent Company. Profit or loss and each component of other comprehensive income (OCI) are attributed to the equity holders of the Parent Company and to the non-controlling interests, even if this results in the non-controlling interests having a deficit balance. Non-controlling interests are presented separately in the consolidated statements of comprehensive income and within the equity section of the consolidated statements of financial position and consolidated statements of changes in equity, separately from the equity attributable to equity holders of the Parent Company.
3. Changes in Accounting Policies
The accounting policies adopted are consistent with those of the previous financial year, except that the Group has adopted the following new accounting pronouncements starting January 1, 2020. Adoption of these pronouncements did not have any significant impact on the Group’s financial statements unless otherwise indicated. The Group did not early adopt any other standard, interpretation or amendment that has been issued but is not yet effective. The adoption of these pronouncements does not have a significant impact on the Group’s consolidated financial statements unless otherwise indicated.
• Amendments to PFRS 3, Business Combinations, Definition of a Business
The amendments to PFRS 3 clarify the minimum requirements to be a business, remove the assessment of a market participant’s ability to replace missing elements, and narrow the definition of outputs. The amendments also add guidance to assess whether an acquired process is substantive and add illustrative examples. An optional fair value concentration test is introduced which permits a simplified assessment of whether an acquired set of activities and assets is not a business.
• Amendments to PFRS 7, Financial Instruments: Disclosures and PFRS 9, Financial Instruments, Interest Rate Benchmark Reform The amendments to PFRS 9 provide a number of reliefs, which apply to all hedging relationships that are directly affected by the interest rate benchmark reform. A hedging relationship is affected if the reform gives rise to uncertainties about the timing and or amount of benchmark-based cash flows of the hedged item or the hedging instrument.
• Amendments to PAS 1, Presentation of Financial Statements, and PAS 8, Accounting Policies, Changes in Accounting Estimates and Errors, Definition of Material The amendments refine the definition of material in PAS 1 and align the definitions used across PFRSs and other pronouncements. They are intended to improve the understanding of the existing requirements rather than to significantly impact an entity’s materiality judgments.

- 21 -
• Conceptual Framework for Financial Reporting issued on March 29, 2018
The Conceptual Framework is not a standard, and none of the concepts contained therein override the concepts or requirements in any standard. The purpose of the Conceptual Framework is to assist the standard-setters in developing standards, to help preparers develop consistent accounting policies where there is no applicable standard in place and to assist all parties to understand and interpret the standards. The revised Conceptual Framework includes new concepts, provides updated definitions and recognition criteria for assets and liabilities and clarifies some important concepts.
• Amendments to PFRS 16, COVID-19-related Rent Concessions
The amendments provide relief to lessees from applying the PFRS 16 requirement on lease modifications to rent concessions arising as a direct consequence of the COVID-19 pandemic. A lessee may elect not to assess whether a rent concession from a lessor is a lease modification if it meets all of the following criteria:
- The rent concession is a direct consequence of COVID-19; - The change in lease payments results in a revised lease consideration that is substantially the
same as, or less than, the lease consideration immediately preceding the change; - Any reduction in lease payments affects only payments originally due on or before
June 30, 2021; and - There is no substantive change to other terms and conditions of the lease.
The amendments were early adopted by the Group beginning July 1, 2020 and properly reflected in the consolidated financial statements as at December 31, 2020. The Group as a lessee accounted for COVID-19 related lease concessions (e.g. rent holidays) as negative variable lease expense in the period when changes in facts and circumstances on which the variable lease payments are based occur. The amendments did not significantly impact the consolidated financial statements as at December 31, 2020.
New Accounting Standards, Interpretations and Amendments Effective Subsequent to December 31, 2020 Pronouncements issued but not yet effective are listed below. The Group intends to adopt the following pronouncements when they become effective. The adoption of these pronouncements is not expected to have a significant impact on the Group’s consolidated financial statements unless otherwise indicated. Effective beginning on or after January 1, 2021 • Amendments to PFRS 9, PFRS 7, PFRS 4 and PFRS 16, Interest Rate Benchmark Reform -
Phase 2
The amendments provide the following temporary reliefs which address the financial reporting effects when an interbank offered rate (IBOR) is replaced with an alternative nearly risk-free interest rate (RFR):
o Practical expedient for changes in the basis for determining the contractual cash flows as a result of IBOR reform
o Relief from discontinuing hedging relationships

- 22 -
o Relief from the separately identifiable requirement when an RFR instrument is designated as a hedge of a risk component
The Group shall also disclose information about: o The nature and extent of risks to which the entity is exposed arising from financial
instruments subject to IBOR reform, and how the entity manages those risks; and o Their progress in completing the transition to alternative benchmark rates, and how the
entity is managing that transition
The amendments are effective for annual reporting periods beginning on or after January 1, 2021 and apply retrospectively; however, the Group is not required to restate prior periods. The Group is still assessing the impact of the amendments to the consolidated financial statements.
Effective beginning on or after January 1, 2022 • Amendments to PFRS 3, Reference to the Conceptual Framework
The amendments are intended to replace a reference to the Framework for the Preparation and Presentation of Financial Statements, issued in 1989, with a reference to the Conceptual Framework for Financial Reporting issued in March 2018 without significantly changing its requirements. The amendments added an exception to the recognition principle of PFRS 3, Business Combinations to avoid the issue of potential ‘day 2’gains or losses arising for liabilities and contingent liabilities that would be within the scope of PAS 37, Provisions, Contingent Liabilities and Contingent Assets or Philippine-IFRIC 21, Levies, if incurred separately.
At the same time, the amendments add a new paragraph to PFRS 3 to clarify that contingent assets do not qualify for recognition at the acquisition date. The amendments are effective for annual reporting periods beginning on or after January 1, 2022 and apply prospectively. The Group is still assessing the impact of the amendments to the consolidated financial statements.
• Amendments to PAS 16 , Plant and Equipment: Proceeds before Intended Use The amendments prohibit entities deducting from the cost of an item of property, plant and equipment, any proceeds from selling items produced while bringing that asset to the location and condition necessary for it to be capable of operating in the manner intended by management. Instead, an entity recognizes the proceeds from selling such items, and the costs of producing those items, in profit or loss. The amendment is effective for annual reporting periods beginning on or after January 1, 2022 and must be applied retrospectively to items of property, plant and equipment made available for use on or after the beginning of the earliest period presented when the entity first applies the amendment. The amendments are not expected to have a material impact on the Group.
• Amendments to PAS 37, Onerous Contracts - Costs of Fulfilling a Contract
The amendments specify which costs an entity needs to include when assessing whether a contract is onerous or loss-making. The amendments apply a “directly related cost approach”. The costs that relate directly to a contract to provide goods or services include both incremental costs and an allocation of costs directly related to contract activities. General and administrative costs do not relate directly to a contract and are excluded unless they are explicitly chargeable to the counterparty under the contract.

- 23 -
The amendments are effective for annual reporting periods beginning on or after January 1, 2022. The Group will apply these amendments to contracts for which it has not yet fulfilled all its obligations at the beginning of the annual reporting period in which it first applies the amendments. The amendments are not expected to have a material impact on the Group.
• Annual Improvements to PFRSs 2018-2020 Cycle
o Amendments to PFRS 1, First-time Adoption of Philippines Financial Reporting Standards,
Subsidiary as a first-time adopter The amendment permits a subsidiary that elects to apply paragraph D16(a) of PFRS 1 to measure cumulative translation differences using the amounts reported by the parent, based on the parent’s date of transition to PFRS. This amendment is also applied to an associate or joint venture that elects to apply paragraph D16(a) of PFRS 1. The amendment is effective for annual reporting periods beginning on or after January 1, 2022 with earlier adoption permitted. The amendments are not expected to have a material impact on the Group.
o Amendments to PFRS 9, Financial Instruments, Fees in the ‘10 per cent’ test for
derecognition of financial liabilities The amendment clarifies the fees that an entity includes when assessing whether the terms of a new or modified financial liability are substantially different from the terms of the original financial liability. These fees include only those paid or received between the borrower and the lender, including fees paid or received by either the borrower or lender on the other’s behalf. An entity applies the amendment to financial liabilities that are modified or exchanged on or after the beginning of the annual reporting period in which the entity first applies the amendment. The amendment is effective for annual reporting periods beginning on or after January 1, 2022 with earlier adoption permitted. The Group will apply the amendments to financial liabilities that are modified or exchanged on or after the beginning of the annual reporting period in which the entity first applies the amendment. The amendments are not expected to have a material impact on the Group. The Group is still assessing the impact of the amendments to the consolidated financial statements. Amendments to PAS 41, Agriculture, Taxation in fair value measurements The amendment removes the requirement in paragraph 22 of PAS 41 that entities exclude cash flows for taxation when measuring the fair value of assets within the scope of PAS 41. An entity applies the amendment prospectively to fair value measurements on or after the beginning of the first annual reporting period beginning on or after January 1, 2022 with earlier adoption permitted. The amendments are not expected to have a material impact on the Group.

- 24 -
Effective beginning on or after January 1, 2023 • Amendments to PAS 1, Classification of Liabilities as Current or Non-current
The amendments clarify paragraphs 69 to 76 of PAS 1, Presentation of Financial Statements, to specify the requirements for classifying liabilities as current or non-current. The amendments clarify:
o What is meant by a right to defer settlement o That a right to defer must exist at the end of the reporting period o That classification is unaffected by the likelihood that an entity will exercise its deferral
right o That only if an embedded derivative in a convertible liability is itself an equity instrument
would the terms of a liability not impact its classification The amendments are effective for annual reporting periods beginning on or after January 1, 2023 and must be applied retrospectively. The Group is currently assessing the impact the amendments will have on current practice and whether existing loan agreements may require renegotiation.
• PFRS 17, Insurance Contracts
PFRS 17 is a comprehensive new accounting standard for insurance contracts covering recognition and measurement, presentation and disclosure. Once effective, PFRS 17 will replace PFRS 4, Insurance Contracts. This new standard on insurance contracts applies to all types of insurance contracts (i.e., life, non-life, direct insurance and re-insurance), regardless of the type of entities that issue them, as well as to certain guarantees and financial instruments with discretionary participation features. A few scope exceptions will apply. The overall objective of PFRS 17 is to provide an accounting model for insurance contracts that is more useful and consistent for insurers. In contrast to the requirements in PFRS 4, which are largely based on grandfathering previous local accounting policies, PFRS 17 provides a comprehensive model for insurance contracts, covering all relevant accounting aspects. The core of PFRS 17 is the general model, supplemented by:
• A specific adaptation for contracts with direct participation features (the variable fee approach)
• A simplified approach (the premium allocation approach) mainly for short-duration contracts
PFRS 17 is effective for reporting periods beginning on or after January 1, 2021, with comparative figures required. Early application is permitted. The amendments are not expected to have a material impact on the Group.
Deferred Effectivity • Amendments to PFRS 10 and PAS 28, Sale or Contribution of Assets between an Investor and
its Associate or Joint Venture The amendments address the conflict between PFRS 10 and PAS 28 in dealing with the loss of control of a subsidiary that is sold or contributed to an associate or joint venture. The amendments clarify that a full gain or loss is recognized when a transfer to an associate or joint venture involves a business as defined in PFRS 3, Business Combinations. Any gain or loss resulting from the sale or contribution of assets that does not constitute a business, however, is recognized only to the extent of unrelated investors’ interests in the associate or joint venture.

- 25 -
On January 13, 2016, the Financial Reporting Standards Council deferred the original effective date of January 1, 2016 of the said amendments until the International Accounting Standards Board completes its broader review of the research project on equity accounting that may result in the simplification of accounting for such transactions and of other aspects of accounting for associates and joint ventures.
4. Summary of Significant Accounting Policies
Leases - Group as a lessee, Effective starting January 1, 2019 The Group assesses at contract inception whether a contract is, or contains, a lease. That is, if the contract conveys the right to control the use of an identified asset for a period of time in exchange for consideration. Group as a lessee The Group applies a single recognition and measurement approach for all leases, except for short-term leases and leases of low-value assets. The Group recognizes lease liabilities to make lease payments and right-of-use assets representing the right to use the underlying assets. Right-of-use assets The Group recognizes right-of-use assets at the commencement date of the lease. Right-of-use assets are measured at cost, less any accumulated depreciation and impairment losses, and adjusted for any remeasurement of lease liabilities. The cost of right-of-use assets includes the amount of lease liabilities recognized, initial direct costs incurred, and lease payments made at or before the commencement date ease incentives received. Right-of-use assets are depreciated on a straight-line basis over the shorter of the lease term and the estimated useful lives (EUL) of the assets, as follows:
Years Land 5 to 66 Building 2 to 10
Right-of-use assets are subject to impairment. Refer to the accounting policies in section impairment of non-financial assets. Lease liabilities At the commencement date of the lease, the Group recognizes lease liabilities measured at the present value of lease payments to be made over the lease term. The lease payments include fixed payments (including in substance fixed payments) less any lease incentives receivable, variable lease payments that depend on an index or a rate, and amounts expected to be paid under residual value guarantees. The lease payments also include the exercise price of a purchase option reasonably certain to be exercised by the Group and payments of penalties for terminating a lease, if the lease term reflects the Group exercising the option to terminate. The variable lease payments that do not depend on an index or a rate are recognized as expense in the period on which the event or condition that triggers the payment occurs. Lease liabilities that are expected to be settled for no more than 12 months after reporting period are classified as current liabilities presented as current portion of lease liabilities. Otherwise, these are classified as noncurrent liabilities.
- 26 -
In calculating the present value of lease payments, the Group uses the incremental borrowing rate at the lease commencement date if the interest rate implicit in the lease is not readily determinable. After the commencement date, the amount of lease liabilities is increased to reflect the accretion of interest and reduced for the lease payments made. In addition, the carrying amount of lease liabilities is remeasured if there is a modification, a change in the lease term, a change in the in-substance fixed lease payments or a change in the assessment to purchase the underlying asset. Short-term leases and leases of low-value assets The Group applies the short-term lease recognition exemption to its short-term leases of machinery and equipment (i.e., those leases that have a lease term of 12 months or less from the commencement date and do not contain a purchase option). It also applies the leases of low-value assets recognition exemption to leases of property and equipment that are considered of low value. Lease payments on short-term leases and leases of low-value assets are recognized as expense on a straight-line basis over the lease term. Leases - Group as a lessor Leases in which the Group does not transfer substantially all the risks and rewards incidental to ownership of an asset are classified as operating leases. Rental income arising is accounted for on a straight-line basis over the lease terms and is included in revenue in the statement of profit or loss due to its operating nature. Initial direct costs incurred in negotiating and arranging an operating lease are added to the carrying amount of the leased asset and recognized over the lease term on the same basis as rental income. Contingent rents are recognized as revenue in the period in which they are earned.
Revenue Recognition Revenue from contracts with customers is recognized when control of the goods or services are transferred to the customer at an amount that reflects the consideration to which the Group expects to be entitled in exchange for those goods or services. The Group has generally concluded that it is the principal in its revenue arrangements, because it typically controls the goods or services before transferring them to the customer. Revenue from construction contracts The Group assessed that there is only one performance obligation for each construction agreement that it has entered and that revenue arising from such agreements qualify for recognition over time because the Group’s performance creates or enhances an asset that the customer controls as the asset is created or enhanced by applying par. 35(b) of PFRS 15. Control of an asset refers to the ability to direct the use of, and obtain substantially all of the remaining benefits from, the asset. The customer, having the ability to specify the design (or any changes thereof) of the asset, controls the asset as it is being constructed. Furthermore, the Group builds the asset on the customer’s land (or property controlled by the customer), hence, the customer generally controls any work in progress arising from the Group’s performance. The Group also recognized as part of its construction revenue, the effects of variable considerations arising from various change orders and claims, to the extent that they reflect the amounts the Group expects to be entitled to and to be received from the customers, provided that it is highly probable that a significant reversal of the revenue recognized in connection with these variable considerations will not occur in the future. For unpriced change orders and claims, the Group uses the “most likely amount” method to predict the amounts the Group expects to be entitled to and to be received from the customers. The Group elected to use the input method to measure the progress of the fulfilment of its performance obligation, which is based on the actual costs incurred to date relative to the total estimated cost to complete the construction projects because there is a direct relationship between the Group’s effort

- 27 -
(i.e., costs incurred) and the transfer of service to the customer. The Group excludes the effect of any costs incurred that do not contribute to the Group’s performance in transferring control of goods or services to the customer (such as unexpected amounts of wasted materials, labor or other resources) and adjusts the input method for any costs incurred that are not proportionate to the Group’s progress in satisfying the performance obligation (such as uninstalled materials). Revenue from sale of goods Revenue from sale of goods is recognized at a point in time when control of the asset is transferred to the customer, generally on delivery and acceptance of the inventory item. Revenue from tuition and other related fees Revenue from tuition fees and other matriculation fees are recognized over time as revenue over the corresponding school term using the output method (i.e., time lapsed over the service period such as semester or school year, depending on the curriculum registered). Upon enrollment, students have the option to pay the tuition and other matriculation fees in full or installment.
Admission, examination and other fees are recognized as income when examination has been granted by the school and related services have been provided to the students (at point in time). Revenue from power generation The Group’s power supply agreement with its customer requires the Group to deliver certain units of electricity (in kWh) to the customer per month. As delivery of electricity constitutes a series of distinct good or services that are substantially the same and have the same pattern of transfer to the customer (i.e., the good or service would be recognized over time using the same measure of progress), this was treated by the Group as a single performance obligation. Because electricity is simultaneously provided and consumed, the Group’s performance obligation to deliver electricity qualifies for revenue recognition over time by applying par. 35(a) of PFRS 15. The Group recognizes revenue from power generation by applying the “right to invoice” practical expedient since the Group’s right to payment is for an amount that corresponds directly with the value to the customer of the Group’s performance to date. Onerous contracts If the Group has a contract that is onerous, the present obligation under the contract is recognized and measured as a provision. However, before a separate provision for an onerous contract is established, the Group recognizes any impairment loss that has occurred on assets dedicated to that contract. An onerous contract is a contract under which the unavoidable costs (i.e., the costs that the Group cannot avoid because it has the contract) of meeting the obligations under the contract exceed the economic benefits expected to be received under it. The unavoidable costs under a contract reflect the least net cost of exiting from the contract, which is the lower of the cost of fulfilling it and any compensation or penalties arising from failure to fulfill it. The cost of fulfilling a contract comprises the costs that relate directly to the contract (i.e., both incremental costs and an allocation of costs directly related to contract activities).
Contract balances arising from revenue with customer contracts Receivables A receivable represents the Group’s right to an amount of consideration that is unconditional (i.e., only the passage of time is required before payment of the consideration is due). Contract assets A contract asset is the right to consideration in exchange for goods or services transferred to the customer. If the Group performs by transferring goods or services to a customer before the customer

- 28 -
pays consideration or before payment is due, a contract asset is recognized for the earned consideration that is conditional. Contract liabilities A contract liability is the obligation to transfer goods or services to a customer for which the Group has received consideration (or an amount of consideration is due) from the customer. If a customer pays consideration before the Group transfers goods or services to the customer, a contract liability is recognized when the payment is made or the payment is due (whichever is earlier). Contract liabilities are recognized as revenue when the Group performs under the contract. The Group presents each contract with customer in the consolidated statement of financial position either as a contract asset or a contract liability.
Expenses Expenses are recognized in the consolidated statement of income when decrease in future economic benefits related to a decrease in an asset or an increase of a liability has arisen that can be measured reliably.
Cost of sales and services Cost of sales is recognized as an expense when the related goods are sold. Cost of services include all direct materials and labor costs and those indirect costs related to contract performance which are recognized as incurred. General and administrative expenses Administrative expenses constitute costs of administering the business and are expensed as incurred. Current versus Non-current Classification The Group presents assets and liabilities in statement of financial position based on current/non-current classification. An asset as current when it is: • Expected to be realized or intended to be sold or consumed in normal operating cycle • Held primarily for the purpose of trading • Expected to be realized within twelve months after the reporting period or • Cash and cash equivalent unless restricted from being exchanged or used to settle a liability for
at least 12 months after the reporting period
All other assets are classified as non-current. A liability is current when: • It is expected to be settled in normal operating cycle • It is held primarily for the purpose of trading • It is due to be settled within twelve months after the reporting period or • There is no unconditional right to defer the settlement of the liability for at least 12 months after
the reporting period
The Group classifies all other liabilities as non-current. Deferred tax assets and deferred tax liabilities are classified as non-current assets and liabilities, respectively.
- 29 -
Cash and Cash Equivalents Cash includes cash on hand and in banks. Cash equivalents are short-term, highly liquid investments that are readily convertible to known amounts of cash with original maturities of three (3) months or less from date of placement and that are subject to an insignificant risk of changes in value.
Fair Value Measurement Fair value is the price that would be received to sell an asset or paid to transfer a liability in an orderly transaction between market participants at the measurement date. The fair value measurement is based on the presumption that the transaction to sell the asset or transfer the liability takes place either:
• In the principal market for the asset or liability, or • In the absence of a principal market, in the most advantageous market for the asset or liability.
The principal or the most advantageous market must be accessible to the Group. The fair value of an asset or a liability is measured using the assumptions that market participants would use when pricing the asset or liability, assuming that market participants act in their economic best interest.
A fair value measurement of a non-financial asset takes into account a market participant's ability to generate economic benefits by using the asset in its highest and best use or by selling it to another market participant that would use the asset in its highest and best use.
The Group uses valuation techniques that are appropriate in the circumstances and for which sufficient data are available to measure fair value, maximizing the use of relevant observable inputs and minimizing the use of unobservable inputs.
All assets and liabilities for which fair value is measured or disclosed in the financial statements are categorized within the fair value hierarchy, described as follows, based on the lowest level input that is significant to the fair value measurement as a whole:
• Level 1 - quoted (unadjusted) market prices in active markets for identical assets or liabilities; • Level 2 - valuation techniques for which the lowest level input that is significant to the fair value
measurement is directly or indirectly observable; and • Level 3 - valuation techniques for which the lowest level input that is significant to the fair value
measurement is unobservable.
For assets and liabilities that are recognized in the consolidated financial statements on a recurring basis, the Group determines whether transfers have occurred between Levels in the hierarchy by re-assessing categorization (based on the lowest level input that is significant to the fair value measurement as a whole) at the end of each reporting period.
For the purpose of fair value disclosures, the Group has determined classes of assets and liabilities on the basis of the nature, characteristics and risks of the asset or liability and the level of the fair value hierarchy as explained above. ‘Day 1’ difference Where the transaction price in a non-active market is different to the fair value from other observable current market transactions in the same instrument or based on a valuation technique whose variables include only data from observable market, the Group recognizes the difference between the transaction price and fair value (a ‘Day 1’ difference) in profit or loss, unless it qualifies for recognition as some other type of asset. In cases where use is made of data which is not observable, the difference between the transaction price and model value is only recognized in profit or loss when the inputs become observable or when the instrument is derecognized. For each transaction, the Group determines the appropriate method of recognizing the ‘Day 1’ difference amount.

- 30 -
Financial Instruments The Group recognizes a financial asset or a financial liability in the consolidated statement of financial position when it becomes a party to the contractual provisions of the instrument. Purchases or sales of financial assets that require delivery of assets within the time frame established by regulation or convention in the marketplace are recognized on the settlement date. The Group follows the settlement date accounting where an asset to be received and liability to be paid are recognized on the settlement date and derecognition of an asset that is sold and the recognition of a receivable from the buyer are recognized on the settlement date. Financial Instruments - Initial Recognition and Subsequent Measurement Effective Initial recognition and measurement Financial assets are classified, at initial recognition, as subsequently measured at amortized cost, fair value through other comprehensive income (OCI), and fair value through profit or loss (FVPL). The classification of financial assets at initial recognition depends on the financial asset’s contractual cash flow characteristics and the Group’s business model for managing them. With the exception of trade receivables that do not contain a significant financing component, the Group initially measures a financial asset at its fair value plus, in the case of a financial asset not at fair value through profit or loss, transaction costs. Trade receivables that do not contain a significant financing component are measured at the transaction price determined under PFRS 15.
In order for a financial asset to be classified and measured at amortized cost or fair value through OCI, it needs to give rise to cash flows that are ‘solely payments of principal and interest (SPPI)’ on the principal amount outstanding. This assessment is referred to as the SPPI test and is performed at an instrument level. The Group’s business model for managing financial assets refers to how it manages its financial assets in order to generate cash flows. The business model determines whether cash flows will result from collecting contractual cash flows, selling the financial assets, or both.
Purchases or sales of financial assets that require delivery of assets within the time frame established by regulation or convention in the marketplace are recognized on the settlement date. Subsequent measurement For purposes of subsequent measurement, financial assets are classified in four categories: • Financial assets at amortized cost (debt instruments) • Financial assets at fair value through OCI with recycling of cumulative gains and losses (debt
instruments) • Financial assets designated at fair value through OCI with no recycling of cumulative gains and
losses upon derecognition (equity instruments) • Financial assets at fair value through profit or loss
Financial assets at amortized cost (debt instruments) The Group measures financial assets at amortized cost if both of the following conditions are met: • The financial asset is held within a business model with the objective to hold financial assets in
order to collect contractual cash flows; and • The contractual terms of the financial asset give rise on specified dates to cash flows that are
solely payments of principal and interest on the principal amount outstanding
- 31 -
Financial assets at amortized cost are subsequently measured using the effective interest (EIR) method and are subject to impairment. Gains and losses are recognized in profit or loss when the asset is derecognized, modified or impaired. The Group’s financial asset at amortized cost includes Cash and cash equivalents, Receivables, and Due from related parties. Financial assets at fair value through profit or loss A financial asset shall be measured at fair value through profit or loss unless it is measured at amortized cost or at fair value through other comprehensive income (OCI). However, an entity may make an irrevocable election at initial recognition for particular investments in equity instruments that would otherwise be measured at fair value through profit or loss to present subsequent changes in fair value in OCI.
The Group may, at initial recognition, irrevocably designate a financial asset as measured at fair value through profit or loss if doing so eliminates or significantly reduces a measurement or recognition inconsistency (sometimes referred to as an ‘accounting mismatch’) that would otherwise arise from measuring assets or liabilities or recognizing the gains and losses on them on different bases. Included in this classification is the peso-denominated investment in UITF in Rizal Commercial Banking Corporation (RCBC) under prepaid expenses and other current assets account.
Financial assets designated at fair value through OCI (equity instruments) Upon initial recognition, the Group can elect to classify irrevocably its equity investments as equity instruments designated at fair value through OCI when they meet the definition of equity under PAS 32, Financial Instruments: Presentation, and are not held for trading. The classification is determined on an instrument-by-instrument basis. Gains and losses on these financial assets are never recycled to profit or loss. Dividends are recognized as other income in the consolidated statement of income when the right of payment has been established, except when the Group benefits from such proceeds as a recovery of part of the cost of the financial asset, in which case, such gains are recorded in OCI. Equity instruments designated at fair value through OCI are not subject to impairment assessment. The Group elected to classify irrevocably all its equity investments under this category. The Group does not have any debt financial assets at fair value through OCI and financial assets at fair value through profit or loss as of March 31, 2021 and December 31, 2020. Impairment of financial assets The Group recognizes an allowance for expected credit losses (ECLs) for all debt instruments not held at fair value through profit or loss. ECLs are based on the difference between the contractual cash flows due in accordance with the contract and all the cash flows that the Group expects to receive, discounted at an approximation of the original effective interest rate. The expected cash flows will include cash flows from the sale of collateral held or other credit enhancements that are integral to the contractual terms. ECLs are recognized in two stages. For credit exposures for which there has not been a significant increase in credit risk since initial recognition, ECLs are provided for credit losses that result from default events that are possible within the next 12-months (a 12-month ECL). For those credit exposures for which there has been a significant increase in credit risk since initial recognition, a loss allowance is required for credit losses expected over the remaining life of the exposure, irrespective of the timing of the default (a lifetime ECL).

- 32 -
For trade receivables and contract assets, the Group applies a simplified approach in calculating ECLs. Therefore, the Group does not track changes in credit risk, but instead recognizes a loss allowance based on lifetime ECLs at each reporting date. The loss allowance was adjusted for forward-looking factors specific to the debtors and the economic environment. For other debt financial assets, the ECL is based on the 12-month ECL. The 12-month ECL is the portion of lifetime ECLs that results from default events on a financial instrument that are possible within 12 months after the reporting date. However, when there has been a significant increase in credit risk since origination, the allowance will be based on the lifetime ECL. The Group generally considers a financial asset in default when contractual payments are 90 days past due. For a financial asset that arises from long-term construction contracts, the Group considers the asset to be in default if contractual payments are not settled within 30 days from the completion of the construction project. However, in certain cases, the Group may also consider a financial asset to be in default when internal or external information indicates that the Group is unlikely to receive the outstanding contractual amounts in full before taking into account any credit enhancements held by the Group. A financial asset is written off when there is no reasonable expectation of recovering the contractual cash flows. Financial Liabilities The accounting for the Group’s financial liabilities remains the same as it was under PAS 39. The Group initially measures a financial liability at its fair value plus, in the case of a financial liability not at fair value through profit or loss, transaction costs. The Group has no financial liabilities at FVPL. Subsequent to initial recognition, the Group’s financial liabilities are carried at amortized cost. Amortized cost is calculated by taking into account any discount or premium on acquisition and fees or costs that are an integral part of the EIR. The EIR amortization is included as finance costs in the consolidated statement of income. Gains and losses are recognized in profit or loss when the liabilities are derecognized as well as through the EIR amortization process. This category generally applies to the Group’ Accounts payable and other current liabilities, Loans payable, Long-term debt, Lease liabilities and Due to related parties. Derecognition of Financial Instruments Financial assets A financial asset (or, where applicable a part of a financial asset or part of a group of similar financial assets) is derecognized when: (a) the rights to receive cash flows from the asset have expired; or (b) the Group has transferred its rights to receive cash flows from the asset or has assumed an obligation to pay them in full without material delay to a third party under a “pass-through” arrangement; and either (i) has transferred substantially all the risks and rewards of the asset, or (ii) has neither transferred nor retained substantially all the risks and rewards of the asset, but has transferred control of the asset. Where the Group has transferred its rights to receive cash flows from an asset and has neither transferred nor retained substantially all the risks and rewards of the asset nor transferred control of the asset, the asset is recognized to the extent of the Group’s continuing involvement in the asset. Continuing involvement that takes the form of a guarantee over the transferred asset is measured at the lower of the original carrying amount of the asset and the maximum amount of consideration that the Group could be required to repay.

- 33 -
Financial liabilities A financial liability is derecognized when the obligation under the liability is discharged or cancelled or has expired. Where an existing financial liability is replaced by another from the same lender on substantially different terms, or the terms of an existing liability are substantially modified, such an exchange or modification is treated as a derecognition of the original liability and the recognition of a new liability, and the difference in the respective carrying amounts is recognized in the consolidated statement of income.
Offsetting Financial Instruments Financial assets and financial liabilities are offset and the net amount reported in the consolidated statement of financial position only if there is a currently enforceable legal right to offset the recognized amounts and there is an intention to settle on a net basis, or to realize the asset and settle the liability simultaneously. The Group assesses that it has a currently enforceable right of offset if the right is not contingent on a future event, and is legally enforceable in the normal course of business, event of default, and event of insolvency or bankruptcy of the Group and all of the counterparties.
Inventories Inventories are valued at the lower of cost and net realizable value (NRV). NRV is the selling price in the ordinary course of business, less the estimated costs of completion of inventories and the estimated costs necessary to sell.
Cost includes purchase price and other costs directly attributable to its acquisition such as non-refundable taxes, handling and transportation cost.
The cost of real estate inventories includes (a) land cost; (b) freehold and leasehold rights for land; (c) amounts paid to contractors for construction; (d) borrowing costs, planning and design cost, cost of site preparation, professional fees, property taxes, construction overheads and other related costs. Cost of inventories is generally determined primarily using the moving-average method, except for automotive units of the car dealerships and real estate inventories of EEI Realty, which are accounted for using the specific identification method. NRV is the estimated selling price in the ordinary course of the business less the estimated costs necessary to make the sale. Prepaid Expenses Prepaid expenses are carried at cost less the amortized portion. These typically comprise prepayments of insurance premiums, rents and others. It is included as part of other current assets in the consolidated statement of financial position. Advances to Suppliers and Subcontractors Advances to suppliers and subcontractors represent advance payment for the purchase of various construction materials and machineries and equipment and down payment to subcontractors for the contract work to be performed. Value-Added Tax (VAT) Revenues, expenses, and assets are recognized net of the amount of VAT, if applicable. When VAT from sales of goods and/or services (output VAT) exceed VAT passed on from purchases of goods or services (input VAT), the excess is recognized as payable in the consolidated statement of financial position. When VAT passed on from purchases of goods or services (input VAT) exceeds VAT from sales of goods and/or services (output VAT), the excess is recognized as an asset in the consolidated statement of financial position up to the extent of the recoverable amount.

- 34 -
Other Current Assets Other current assets pertain to other resources controlled by the Group as a result of past events and from which future economic benefits are expected to flow to the Group within the reporting period.
Investments in Associates and Joint Venture An associate is an entity in which the Group has significant influence. A joint venture is a joint arrangement whereby the parties that have joint control of the arrangement have rights to the net assets of the arrangement. Investments in associates and joint venture are accounted for using the equity method of accounting. Under this method, the investment amount is increased or decreased to recognize the Group’s share in the profit or loss of the investee after the date of acquisition. Dividends received from the investee reduces the carrying amount of the investment. Adjustments to the carrying amount may also be necessary for changes in the Group’s proportionate interest in the investee arising from changes in the investee’s other comprehensive income. Gains and losses resulting from ‘upstream’ and ‘downstream’ transactions between the Group and its associate or joint venture are recognized in the consolidated financial statements only to the extent of unrelated investors’ interests in the associate or joint venture. The reporting dates and the accounting policies of the associates and joint venture conform to those used by the Group for like transactions and events in similar circumstances. The Group discontinues applying the equity method when their investment in investee company is reduced to zero. Accordingly, additional losses are not recognized unless the Group has guaranteed certain obligations of the investee company. When the investee company subsequently reports net income, the Group will resume applying the equity method but only after its share of that net income equals the share of net losses not recognized during the period the equity method was suspended. The reporting dates of the investee company and the Group are identical and the investee companies’ accounting policies conform to those used by the Group for like transactions and events in similar circumstances.
After application of the equity method, the Group determines whether it is necessary to recognize an additional impairment loss on the Group’s investment in its associates and joint venture. The Group determines at each reporting date whether there is any objective evidence that the investment in the associates and joint venture is impaired. If this is the case the Group calculates the amount of impairment as the difference between the recoverable amount of the associate and its carrying value and recognizes the impairment loss in the consolidated statement of income.
Upon loss of significant influence over the associate, the Group measures and recognizes any retaining investment at its fair value. Any difference between the carrying amount of the associates or joint venture upon loss of significant influence and the fair value of the retaining investment and proceeds from disposal is recognized in the consolidated statement of income.
- 35 -
The Group’s associates and joint venture accounted for using the equity method as of March 31 follows:
Place of Functional Percentage of Ownership Incorporation Nature of Business Currency Mar 2021 Dec 2020 Associates: Hi-Eisai Pharmaceutical, Inc. (HEPI) Philippines Pharmaceutical Philippine peso 50.00 50.00 Petroenergy Resources Corporation (PERC) (a) Philippines Renewable energy Philippine peso 29.10 29.10 T’boli Agro-Industrial Development, Inc. Philippines Agriculture Philippine peso 28.47 28.47 Manila Memorial Park Cemetery, Inc. (MMPC) Philippines Funeral service Philippine peso 25.98 25.98
Sojitz G Auto Philippines Corporation (SGAPC) Philippines
Automotive distributor Philippine peso 20.00 20.00
RCBC Realty Corporation (RRC) Philippines Realty Philippine peso 10.00 10.00 Al-Rushaid Construction Company Limited (ARCC) Saudi Arabia Construction Saudi riyal 49.00 49.00 PetroSolar Corporation (PSOC) Philippines Renewable energy Philippine peso 44.00 44.00 Joint venture: PetroWind Energy, Inc. (PWEI) Philippines Renewable energy Philippine peso 20.00 20.00
Shinbayanihan Heavy Equipment Corporation (SHEC) Philippines Equipment rental Philippine peso 40.00 40.00
BEO Distribution and Marketing Corporation (BEO DMC) (b) Philippines
Distribution and marketing Philippine peso 30.00 30.00
Shimizu-Fujita-Takenaka-EEI Joint Venture (SFTE) (b)
Philippines Construction Philippine peso 5.00 5.00
Acciona-EEI Joint Venture (AE) (b) Philippines Construction Philippine peso 30.00 30.00
(a) Effective ownership in PERC is 32.24% after considering the Group’s 10% indirect investment in PetroGreen Energy Corporation (PGEC), a 90% owned subsidiary of PERC (Note 12) (b) Entered into in 2020
Property and Equipment Property and equipment are stated at cost, less accumulated depreciation, amortization and impairment loss, if any, except for land which is carried at revalued amount based on the latest appraisal conducted by independent appraisers. The appraisal increment resulting from the revaluation is treated as a separate component in the Group’s equity.
The initial cost of property and equipment consists of its purchase price, including import duties, taxes and any directly attributable costs of bringing the asset to its working condition and location for its intended use. Expenditures incurred after the assets have been put into operation, such as repairs and maintenance, are normally charged to operations in the period in which the costs are incurred. In situations where it can be clearly demonstrated that the expenditures have resulted in an increase in the future economic benefits expected to be obtained from the use of an item of property and equipment beyond its originally assessed standard of performance, the expenditures are capitalized as an additional cost of property and equipment. When assets are retired or otherwise disposed of, the cost and the related accumulated depreciation are removed from the accounts and any resulting gain or loss is reflected as part of current operations.
Depreciation is computed using the straight-line method over the following average EUL:
Years Buildings and improvements 5 to 40 Machinery, tools and construction equipment 2 to 20 Transportation and service equipment 5 Furniture, fixtures and office equipment 3 to 10

- 36 -
Amortization of improvements is computed over the EUL of the improvement or term of the lease, whichever is shorter. The useful lives and depreciation method are reviewed periodically to ensure that the period and method of depreciation are consistent with the expected pattern of economic benefits from items of property and equipment.
Minor repairs and maintenance costs are charged to consolidated statement of income as incurred; significant renewals and betterments are capitalized. When assets are retired or otherwise disposed of, the cost or revalued amount, appraisal increase and related accumulated depreciation and amortization are removed from the accounts and any resulting gains or losses are reflected in the consolidated statement of income.
Construction in progress represents property and equipment under construction and is stated at cost. This includes cost of construction, plant and equipment and other direct costs. Construction in progress is not depreciated until such time that the relevant assets are completed and put into operational use. An item of property and equipment is derecognized upon disposal or when no future economic benefits are expected from its use or disposal. Any gain or loss arising on derecognition of the asset (calculated as the difference between the net disposal proceeds and the carrying amount of the asset) is included in the consolidated statement of income in the year the asset is derecognized.
Land is carried at its revalued amount. The appraised values used for revaluation were determined by an independent firm of appraisers.
The initial cost of land consists of its purchase price and directly attributable costs of bringing the asset to its working condition and location for its intended use.
The appraisal increment (net of deferred tax) resulting from the revaluation is credited to OCI and accumulated in equity under “revaluation increment on land - net” account. Decrease in valuation is charged to profit or loss, except to the extent that it reverses the existing accumulated revaluation increment on the same asset and therefore such decrease is recognized in OCI. The decrease recognized in OCI reduces the revaluation increment on land - net account in equity. In case a subsequent revaluation increase of an asset reverses a revaluation decrease previously recognized in profit or loss, such increase is credited to income in profit or loss. The same rules apply to impairment losses. An impairment loss on a revalued asset is first used to reduce the revaluation increment for that asset. Only when the impairment loss exceeds the amount in the revaluation increment for that same asset is any further impairment loss recognized in profit or loss. Upon disposal of land, any revaluation reserve relating to the particular asset being sold is transferred to retained earnings.
The asset’s residual values, useful lives and methods of depreciation and amortization are reviewed, and adjusted if appropriate, at each financial year-end. Investment Properties Investment properties are measured at cost less accumulated depreciation and impairment loss, if any, including transaction costs. The carrying amount includes the cost of replacing part of an existing investment property at the time that cost is incurred if the recognition criteria are met. Investment properties are depreciated on a straight-line basis over its estimated useful life of fifteen (15) to twenty

- 37 -
years (20). Subsequent to initial recognition, investment properties are stated at cost less accumulated depreciation and any impairment in value.
Investment properties are derecognized when they either have been disposed of or when the investment property is permanently withdrawn from use and no future economic benefit is expected from its disposal. Any gains or losses on the retirement or disposal of an investment property are recognized in the consolidated statement of income in the year of retirement or disposal.
Transfers are made to investment property when there is a change in use, evidenced by ending of owner-occupation, commencement of an operating lease to another party or ending of construction or development. Transfers are made from investment property when there is a change in use, evidenced by commencement of owner-occupation or commencement of development with a view to sale.
Transfers between investment property, owner-occupied property and inventories do not change the carrying amount of the property transferred and they do not change the cost of that property for measurement or disclosure purposes.
Software Costs Software costs are stated at cost less accumulated amortization and any impairment in value. Costs related to software purchased by the Group for use in the operations are amortized on a straight-line basis over a period of three (3) years.
Costs associated with developing and maintaining computer software programs are recognized as an expense when incurred. Costs that are directly associated with identifiable and unique software controlled by the Group and will generate economic benefits exceeding costs beyond one year, are recognized as intangible assets to be measured at cost less accumulated amortization and provision for impairment losses, if any.
Impairment of Nonfinancial Assets For investments in Associate and joint venture, Property and equipment, Right-of-use asset, Investment properties and Computer software costs, the Group assesses at each reporting date whether there is an indication that an asset may be impaired. If any such indication exists, or when annual impairment testing for an asset is required, the Group makes an estimate of the asset’s recoverable amount. An assets’ recoverable amount is the higher of an asset’s or cash-generating unit’s fair value less costs to sell and its value in use and is determined for an individual asset, unless the asset does not generate cash inflows that are largely independent of those from other assets or groups of assets. Where the carrying amount of an asset exceeds its recoverable amount, the asset is considered impaired and is written down to its recoverable amount. In assessing value in use, the estimated future cash flows are discounted to their present value using pre-tax discount rate that reflects current market assessment of the time value of money and the risks specific to the asset. An assessment is made at each reporting date as to whether there is any indication that previously recognized impairment losses may no longer exist or may have decreased. If such indication exists, the recoverable amount is estimated. A previously recognized impairment loss is reversed only if there has been a change in the estimates used to determine the asset’s recoverable amount since the last impairment loss was recognized. If that is the case, the carrying amount of the asset is increased to its recoverable amount. That increased amount cannot exceed the carrying amount that would have been determined, net of depreciation, had no impairment loss been recognized for the asset in prior years. Such reversal is recognized in the consolidated statement of income.
Impairment losses are recognized in the consolidated statement of income in those expense categories consistent with the function of the impaired asset, except for property previously revalued where the

- 38 -
revaluation was taken to equity. In this case, the impairment is also recognized in equity up to the amount of any previous revaluation. Business Combination and Goodwill Business combinations are accounted for using the acquisition method. The cost of an acquisition is measured as the aggregate of the consideration transferred, measured at acquisition date fair value and the amount of any non-controlling interest in the acquiree. For each business combination, the acquirer measures the non-controlling interest in the acquiree either at fair value or at the proportionate share of the acquiree’s identifiable net assets.
When the Group acquires a business, it assesses the financial assets and liabilities assumed for appropriate classification and designation in accordance with the contractual terms, economic circumstances and pertinent conditions as at the acquisition date. This includes the separation of embedded derivatives in host contracts by the acquiree.
Any contingent consideration to be transferred by the acquirer will be recognized at fair value at the acquisition date. Subsequent changes to the fair value of the contingent consideration which is deemed to be an asset or liability will be recognized in accordance with PAS 39 either in profit or loss or as a change to OCI. If the contingent consideration is classified as equity, it should not be remeasured until it is finally settled within equity.
PFRS 3 provides that if the initial accounting for a business combination can be determined only provisionally by the end of the period in which the combination is effected because either the fair values to be assigned to the acquiree’s identifiable assets, liabilities or contingent liabilities or the cost of the combination can be determined only provisionally, the acquirer shall account for the combination using those provisional values. The acquirer shall recognize any adjustments to those provisional values as a result of completing the initial accounting within twelve months of the acquisition date as follows: (i) the carrying amount of the identifiable asset, liability or contingent liability that is recognized or adjusted as a result of completing the initial accounting shall be calculated as if its fair value at the acquisition date had been recognized from that date; (ii) goodwill or any gain recognized shall be adjusted by an amount equal to the adjustment to the fair value at the acquisition date of the identifiable asset, liability or contingent liability being recognized or adjusted; and (iii) comparative information presented for the periods before the initial accounting for the combination is complete shall be presented as if the initial accounting has been completed from the acquisition date.
Goodwill is initially measured at cost being the excess of the aggregate of the consideration transferred and the amount recognized for non-controlling interest over the net identifiable assets acquired and liabilities assumed. If this consideration is lower than the fair value of the net assets of the subsidiary acquired, the difference is recognized in profit or loss. Before recognizing a gain on a bargain purchase, the Group assesses whether it has correctly identified all of the assets acquired an all of the liabilities assumed, and recognize any additional assets or liabilities that are identified in that review.
Following initial recognition, goodwill is measured at cost less any accumulated impairment loss. Goodwill is reviewed for impairment, annually or more frequently if events or changes in circumstances indicate that the carrying value may be impaired. For purposes of impairment testing, goodwill acquired in a business combination is, from the acquisition date, allocated to each of the Group’s CGUs, or groups of CGUs, that are expected to benefit from the synergies of the combination, irrespective of whether other assets or liabilities of the Group are assigned to those units or groups of units. Each unit or group of units to which the goodwill is allocated should:

- 39 -
• represent the lowest level within the Group at which the goodwill is monitored for internal
management purposes; and • not be larger than an operating segment determined in accordance with PFRS 8, Operating
Segments
Impairment is determined by assessing the recoverable amount of the CGU (or group of CGUs), to which the goodwill relates. Where the recoverable amount of the CGU (or group of CGUs) is less than the carrying amount, an impairment loss is recognized. Where goodwill forms part of a CGU (or group of CGUs) and part of the operation within that unit is disposed of, the goodwill associated with the operation disposed of is included in the carrying amount of the operation when determining the gain or loss on disposal of the operation. Goodwill disposed of in these circumstances is measured based on the relative values of the operation disposed of and the portion of the CGU retained. If the acquirer’s interest in the net fair value of the identifiable assets, liabilities and contingent liabilities exceeds the cost of the business combination, the acquirer shall recognize immediately in the consolidated statement of income any excess remaining after reassessment.
Foreign Currency-denominated Transaction and Translation The consolidated financial statements are presented in Philippine Peso. Each entity in the Group determines its own functional currency and items included in the consolidated financial statements of each entity are measured using that functional currency.
Transactions in foreign currencies are initially recorded in the functional currency rate at the date of the transaction. Monetary assets and liabilities denominated in foreign currencies are retranslated at the functional currency closing rate at the reporting date. All differences are taken to consolidated statement of income. Non-monetary items that are measured in terms of historical cost in foreign currency are translated using the exchange rates as at the dates of initial transactions. Non-monetary items measured at fair value in a foreign currency are translated using the exchange rates at the date when the fair value was determined.
As at reporting date, the assets and liabilities of subsidiaries whose functional currency is not the Philippines Peso are translated into the presentation currency of the Parent Company (the Philippine Peso) at the closing rate as at the reporting date, and the consolidated statement of income accounts are translated at monthly weighted average exchange rate. Likewise, the financials of the Group’s associate whose functional currency is not the Philippine Peso that is accounted for under equity method are translated to the presentation currency of the Parent Company in a similar manner. The exchange differences arising on the translation are taken directly to a separate component of equity under “Cumulative translation adjustments” account. Upon disposal of a foreign subsidiary, the deferred cumulative amount recognized in other comprehensive income relating to that particular foreign operation is recognized in the consolidated statement of income.
Retirement Cost Defined benefit plan The defined benefit liability or asset is the aggregate of the present value of the defined benefit obligation at the end of the reporting period reduced by the fair value of plan assets, if any, adjusted for any effect of limiting a net defined benefit asset to the asset ceiling. The asset ceiling is the present value of any economic benefits available in the form or refunds from the plan or reduction in the future contributions to the plan.
Defined benefit costs on the Group’s defined benefit retirement plan are actuarially computed using the projected unit credit (PUC) valuation method. Under this method, the current service cost is the

- 40 -
present value of retirement benefits payable in the future with respect to the services rendered in the current period.
Defined benefit costs comprise the following: (a) service cost; (b) net interest on the net defined benefit liability or asset; and (c) remeasurements of net defined benefit liability or asset.
Service costs which include current service costs, past service costs and gains or losses on non-routine settlements are recognized as expense in profit or loss. Past service costs are recognized when plan amendment or curtailment occurs.
Net interest on the net defined benefit liability or asset is the change during the period in the net defined benefit liability or asset that arises from the passage of time which is determined by applying the discount rate based on government bonds to the net defined benefit liability or asset. Net interest on the net defined benefit liability or asset is recognized as expense or income in profit or loss.
Remeasurements comprising actuarial gains and losses, return on plan assets and any change in the effect of the asset ceiling (excluding net interest on defined benefit liability) are recognized immediately in OCI in the period in which they arise. Remeasurements are not reclassified to profit or loss in subsequent periods.
Plan assets are assets that are held by a long-term employee benefit fund or qualifying insurance policies. Plan assets are not available to the creditors of the Group, nor can they be paid directly to the Group. Fair value of plan assets is based on market price information. When no market price is available, the fair value of plan assets is estimated by discounting expected future cash flows using a discount rate that reflects both the risk associated with the plan assets and the maturity or expected disposal date of those assets (or, if they have no maturity, the expected period until the settlement of the related obligations).
The Group’s right to be reimbursed of some or all of the expenditure required to settle a defined benefit obligation is recognized as a separate asset at fair value when and only when reimbursement is virtually certain.
Income Tax Current tax Current tax assets and liabilities for the current and prior periods are measured at the amount expected to be recovered from or paid to the taxation authorities. The tax rates and the tax laws used to compute the amount are those that are enacted or substantially enacted by the end of the financial reporting date.
Deferred tax Deferred tax is provided using the liability method on temporary differences at the reporting date between the tax bases of assets and liabilities and their carrying amounts for financial reporting purposes. Deferred tax liabilities are recognized for all taxable temporary differences, including asset revaluations. Deferred income tax assets are recognized for all deductible temporary differences, carryforward of unused tax credits from excess minimum corporate income tax (MCIT) over regular corporate income tax (RCIT), net operating loss carryover (NOLCO), to the extent that it is probable that taxable profit will be available against which the deductible temporary differences and carryforward of unused MCIT and NOLCO can be utilized.

- 41 -
Deferred tax liabilities are not provided on non-taxable temporary differences associated with investments in domestic subsidiaries, associate and interest in joint venture. With respect to investments in foreign subsidiaries, associate and interest in joint venture, deferred tax liabilities are recognized except where the timing of the reversal of the temporary differences can be controlled and it is probable that the temporary differences will not reverse in the foreseeable future.
The carrying amount of deferred tax assets is reviewed by the end of each financial reporting date and reduced to the extent that it is no longer probable that sufficient taxable profit will be available to allow all or part of the deferred tax asset to be used. Unrecognized deferred tax assets are reassessed at the end of each financial reporting date and are recognized to the extent that it has become probable that future taxable profit will be available to allow the deferred tax assets to be recovered.
Deferred tax assets and liabilities are measured at the tax rates that are expected to apply in the year when the asset is realized or the liability is settled, based on tax rates (and tax laws) that have been enacted or substantially enacted by the end of the financial reporting date.
Deferred tax relating to items recognized outside profit or loss are recognized in correlation to the underlying transactions either in other comprehensive income or directly in equity.
Deferred tax assets and deferred tax liabilities are offset, if a legally enforceable right exists to set off current income tax assets against current income tax liabilities and deferred income taxes relate to the same entity and the same taxation authority.
Basic and Diluted Earnings Per Share (EPS) Basic EPS is computed by dividing net income for the year attributable to equity holders of the Group adjusted for the after-tax amounts of dividends on preferred stock by the weighted average number of common stock outstanding during the year, after giving retroactive effect for any stock dividends, stock splits or reverse stock splits.
Diluted EPS is computed by adjusting the net income for the year attributable to equity holders of the Group and the weighted average number of common stock outstanding during the year after giving retroactive effect for any stock dividends, stock splits or reverse stock splits and adjusted for the effects of all dilutive potential common stock. Provisions Provisions are recognized when: (a) the Group has a present obligation (legal or constructive) as a result of a past event; (b) it is probable that an outflow of resources embodying economic benefits will be required to settle the obligation; and (c) a reliable estimate can be made of the amount of the obligation. If the effect of the time value of money is material, provisions are discounted using a current pre-tax rate that reflects, where appropriate, the risks specific to the liability. Where discounting is used, the increase in the provision due to the passage of time is recognized as a finance cost.
Contingencies Contingent liabilities are not recognized in the consolidated financial statements. They are disclosed unless the possibility of an outflow of resources embodying economic benefits is remote. Contingent assets are not recognized in the consolidated financial statements but disclosed when an inflow of economic benefits is probable.

- 42 -
Stock Option Plan No benefit expense is recognized relative to the shares issued under the stock options plan. When the shares related to the stock option plans are subscribed, these are treated as capital stock issuances. The stock option plan is exempt from PFRS 2, Share-based Payment.
Segment Reporting The Group’s operating business are organized and managed separately according to the nature of services provided, with each segment representing a strategic business unit that offers different products and serves different markets. Financial information on business segments is presented in Note 35.
Capital Stock The Group records common stocks at par value and additional paid-in capital in excess of the total contributions received over the aggregate par values of the equity shares. Incremental costs incurred directly attributable to the issuance of new shares are shown in equity as a deduction from proceeds, net of tax. When the Group purchases the Group’s capital stock (treasury shares), the consideration paid, including any attributable incremental costs, is deducted from equity attributable to the Group’s equity holders until the shares are cancelled, reissued or disposed of. Where such shares are subsequently sold or reissued, any consideration received, net of any directly attributable incremental transaction costs and the related tax effects is included in equity (Note 21).
Equity Reserve Equity reserve consist of equity transactions other than capital contributions, such as equity transactions arising from transactions with NCI and combination or entities under common control.
Retained Earnings Retained earnings represent accumulated earnings of the Group and any adjustment arising from application of new accounting standards, policies or corrections of errors applied retroactively less dividends declared. It includes the accumulated equity in undistributed earnings of consolidated subsidiaries which are not available for dividends until declared by subsidiaries. Appropriated retained earnings are those that are restricted for planned investments and business expansion. Unappropriated retained earnings are those that can be allocated for specific purposes and can be distributed as dividend. Retained earnings are further restricted for the payment of dividends to the extent of the cost of treasury shares (Note 20).
Events After the Financial Reporting Date Post year-end events that provide additional information about the Group’s position at the end of the financial reporting date (adjusting events) are reflected in the consolidated financial statements. Post year-end events that are not adjusting events are disclosed in the notes to consolidated financial statements when material.
5. Significant Accounting Judgments and Estimates
The preparation of the consolidated financial statements in compliance with PFRSs requires the Group to make judgments, estimates and assumptions that affect the reported amounts of assets, liabilities, income and expenses and disclosure of contingent assets and contingent liabilities. Future events may occur which can cause the assumptions used in arriving at those estimates to change. The effects of any changes in estimates will be reflected in the consolidated financial statements as they become reasonably determinable.
- 43 -
Judgments and estimates are continually evaluated and are based on historical experience and other factors, including expectations of future events that are believed to be reasonable under the circumstances. Actual results could differ for such estimates. Judgment Determining control over an entity in which Parent Company holds less than majority of voting rights The Parent Company has determined that it is the largest stockholder of IPO with 48.18% equity interest and also has control over IPO by virtue of the Parent Company’s power to nominate majority of the members of the BOD of IPO and for the Parent Company to exercise control and supervision on IPO’s operations as well as financial policy. Accordingly, the Parent Company assessed that it controls IPO even though it owns less than 50% equity interest over IPO and accounts for its equity interest over IPO as investment in subsidiary. Determination of functional currency PAS 21, The Effects of Changes in Foreign Exchange Rates, requires management to use its judgment to determine the entity’s functional currency such that it most faithfully represents the economic effects of the underlying transactions, events and conditions that are relevant to the entity. In making this judgment, the following were considered:
• The currency that mainly influences sales prices for financial instruments and services (this will often be the currency in which sales prices for its financial instruments and services are denominated and settled);
• The currency in which funds from financing activities are generated; and • The currency in which receipts from operating activities are usually retained.
The functional currency is Philippine peso as disclosed in Note 2. Determination of lease term of contracts with renewal and termination options – Group as a lessee The Group has several lease contracts that include extension and termination options. The Group applies judgement in evaluating whether it is reasonably certain whether or not to exercise the option to renew or terminate the lease. That is, it considers all relevant factors that create an economic incentive for it to exercise either the renewal or termination. After the commencement date, the Group reassesses the lease term if there is a significant event or change in circumstances that is within its control and affects its ability to exercise or not to exercise the option to renew or to terminate (e.g., construction of significant leasehold improvements or significant customization to the leased asset). The Group included the renewal period as part of the lease term for leases with shorter non-cancellable period (i.e., three to ten years). The Group typically exercises its option to renew for these leases because there will be a significant negative effect on production if a replacement asset is not readily available. The renewal periods for leases of land and office spaces with longer non-cancellable periods are not included as part of the lease term as these are not reasonably certain to be exercised.
Recognition of revenue from construction contracts Under PFRS 15, the Group assessed that there is only one performance obligation for each construction agreement that it has entered and that revenue arising from such agreements qualify for recognition over time. The Group elected to use the input method to measure the progress of the fulfilment of its performance obligation, which is based on the actual costs incurred to date relative to the total estimated cost to complete the construction projects. The Group believes that this method faithfully depicts the Group’s performance towards satisfaction of its performance obligation because there is a direct relationship between the Group’s effort (i.e., costs incurred) and the transfer of service to the customer.

- 44 -
Recognition of tuition and other matriculation fees over time The Group determined that tuition and other matriculation fees are to be recognized over time using the output method on the basis of time lapsed over the service period since it provides a faithful depiction of the Group’s performance in transferring control of the services to the students. The fact that another entity would not need to re-perform the service that the Group has provided to date demonstrates that the customer or the student simultaneously receives and consumes the benefits of the Group’s performance as it performs. Determination of significant influence on investment in an associate if ownership is less than 20% Holding of less than 20% of voting rights is presumed not to give rise to significant influence unless it can be clearly demonstrated that there is in fact significant influence. The Parent Company is able to exercise significant influence for ownership less than 20% because it has an active participation in the policy-making process including operating decisions of the investee.
As of March 31, 2021, and December 31, 2020, the Parent Company holds 10% of interest in RRC. The Parent Company exercises significant influence in RRC since the Parent Company’s President is the concurrent president of RRC. The president is also a member of the BOD. As such, the president of the Parent Company effectively has a participation in the policy-making process of RRC. Hence, the Parent Company is able to exercise significant influence even if ownership is less than 20%. Assessment of joint control Judgment is required to determine when the Group has joint control over an arrangement, which requires an assessment of the relevant activities and when the decisions in relation to those activities require unanimous consent. The Group assesses their rights and obligations arising from the arrangement and specifically considers: • the structure of the joint arrangement - whether it is structured through a separate vehicle • when the arrangement is structured through a separate vehicle, the Group also considers the rights
and obligations arising from: • the legal form of the separate vehicle • the terms of the contractual arrangement other facts and circumstances, considered on a case by
case basis
Refer to Note 12 for details of the Group’s investment in joint venture.
Estimates The key assumptions concerning the future and other key sources of estimation uncertainty at the end of the reporting date, that have a significant risk of causing a material adjustment to the carrying amounts of assets and liabilities within the next financial year are discussed below. The Group based its assumptions and estimates on parameters available when the financial statements were prepared. Existing circumstances and assumptions about future developments, however, may change due to market changes or circumstances arising that are beyond the control of the Group. Such changes are reflected in the assumptions when they occur. Leases - Estimating the incremental borrowing rate The Group cannot readily determine the interest rate implicit in the lease, therefore, it uses its incremental borrowing rate (IBR) to measure lease liabilities. The IBR is the rate of interest that the Group would have to pay to borrow over a similar term, and with a similar security, the funds necessary to obtain an asset of a similar value to the right-of-use asset in a similar economic environment. The IBR therefore reflects what the Group ‘would have to pay’, which requires estimation when no observable rates are available or when they need to be adjusted to reflect the terms and conditions of the lease. The Group estimates the IBR using observable inputs (such as market interest rates) when available and is required to make certain entity-specific estimates (such as the subsidiary’s stand-alone credit rating).
- 45 -
The Group’s lease liabilities amounted to P=1.21 billion P=1.25 billion as of March 31, 2021 and December 31, 2020, respectively. Estimating variable considerations arising from change orders and claims The Group frequently agrees to change orders that modify the scope of its work previously agreed with customers and regularly submits claims to customers when unanticipated additional costs are incurred because of delays or changes in scope caused by the customers. PFRS 15 requires the Group to recognize, as part of its revenue from construction contracts, the estimated amounts the Group expects to be entitled to and to be received from customers due to these change orders and claims (otherwise known as variable considerations), provided that it is highly probable that a significant reversal of the revenue recognized in connection with these variable considerations will not occur in the future. For these unpriced change orders and claims, the Group uses the “most likely amount” method to predict the amount to which it will be entitled and expected to be received from the customers. The Group also updates its estimate of the transaction price to reflect any changes in circumstances that would result to changes in amount of variable considerations and corresponding increase or decrease in the contract assets. The aggregate carrying values of receivables and contract assets arising from construction contracts amounted to P=12.38 billion and P=12.95 billion as of March 31, 2021 and December 31, 2020, respectively (Notes 7 and 8). Fair value measurement of unquoted equity investments at FVOCI The Group uses valuation techniques such as adjusted net asset method to estimate the fair value of investment in Hermosa Ecozone Development Corporation (HEDC). These valuation techniques require significant unobservable inputs to calculate the fair value of the Group’s unquoted equity investments at FVOCI. These inputs include appraised value of real properties, among others. Changes in assumptions relating to these factors could affect the reported fair value of these unquoted equity financial instruments. The estimate of fair value of unquoted equity investments at FVOCI considered the effects of COVID-19 in the selling price of comparable listings of real estate properties related to investment in HEDC and were not accounted for separately. The fair value of unquoted equity investments amounted to P=0.46 billion as of March 31, 2021 and December 31, 2020, respectively (Note 11). Provision for expected credit losses of trade receivables and contract assets The Group uses the simplified approach in calculating the ECL of its trade receivables and contract assets wherein the Group does not track changes in credit risk, but instead recognizes a loss allowance based on lifetime ECLs at each reporting date. The model is based on the Group’s historical observed default rates and adjusted to include forward looking information. At every reporting date, the historical observed default rates are updated and changes in the forward-looking estimates are analyzed. The assessment of the correlation between historical observed default rates, forecast economic conditions and ECLs is a significant estimate. The amount of ECLs is sensitive to changes in circumstances and of forecast economic conditions. The Group’s historical credit loss experience and forecast of economic conditions may also not be representative of customer’s actual default in the future. As of March 31, 2021, and December 31, 2020, the aggregate carrying values of receivables and contract assets are disclosed in Notes 7 and 8 to the consolidated financial statements.

- 46 -
Purchase price allocation in business combinations and goodwill The Group’s consolidated financial statements reflect the acquired entities (AEI and its subsidiaries prior to the merger) after the completion of the merger between IPO and AEI which is effective May 2, 2019. The Group accounts for the acquired business using the acquisition method, which requires extensive use of accounting judgments and estimates to allocate the purchase price to the fair market values of the acquiree’s identifiable assets and liabilities and contingent liabilities, if any, at the acquisition date. Any excess in the purchase price over the fair market values of the net assets acquired is recorded as goodwill in the consolidated statement of financial position. Thus, the numerous judgments made in estimating the fair value to be assigned to the acquiree’s assets and liabilities can materially affect the Group’s financial position and performance.
The merger resulted in the recognition of student relationship, intellectual property rights and goodwill from the excess of the acquisition cost over the fair value of net assets acquired (Notes 14 and 16).
Valuation of land under revaluation basis The Group’s parcels of land are carried at revalued amounts. The valuations of these parcels of land were performed by SEC accredited independent appraisers and were determined using the market approach. Significant adjustments to inputs used in determining the fair value of land such as location and utility could affect the appraised value of the assets. Land carried under revaluation basis amounted to P=7.96 billion as of March 31, 2021 and December 31, 2020, respectively. Impairment of nonfinancial assets The Group assesses impairment on its property and equipment, intangible assets (other than goodwill and intellectual property rights) and noncurrent assets whenever events or changes in circumstances indicate that the carrying amount of these assets may not be recoverable. The factors that the Group considers important which could trigger an impairment review include significant underperformance relative to expected historical or projected future operating results, significant changes in the manner of use of the acquired assets or the strategy for overall business, and significant negative industry or economic trends. An impairment loss is recognized whenever the carrying amount of an asset exceeds its recoverable amount. The recoverable amount is the higher of an asset’s fair value less cost to sell and value in use. The fair value is the amount obtainable from the sale of an asset in an arm’s length transaction while value in use is the present value of estimated future cash flows expected to arise from continuing use of an asset and from its disposal at the end of its useful life. Recoverable amounts are estimated for individual assets or, if it is not possible, for the cash-generating unit to which the asset belongs. Impairment of goodwill and intellectual property rights are assessed at least on an annual basis. In assessing the impairment, the Group determines the recoverable amount using value in use with detailed disclosures made in Note 14. There is no impairment loss recognized on these assets in 2021, 2020 and 2019. As at March 31, 2021 and December 31, 2020, the carrying value of goodwill amounted to P=484.83 million, respectively (Note 14).
Estimation of retirement benefits The determination of the obligation and cost of retirement benefits is dependent on the selection of certain assumptions used by actuaries in calculating such amounts. While the Group believes that the assumptions are reasonable and appropriate, significant differences in the actual experience or significant changes in the assumptions may materially affect the pension and other retirement obligations.

- 47 -
Retirement assets amounted to P=4.63 million and P=4.73 million as of March 31, 2021 and December 31, 2020, respectively whereas retirement liabilities amounted to P=639.5 million and P=611.6 million as of March 31, 2021 and December 31, 2020, respectively.
Realizability of deferred tax assets The Group reviews the carrying amounts of deferred income taxes at each reporting date and reduces deferred tax assets to the extent that it is no longer probable that sufficient taxable profit will be available to allow all or part of the deferred tax assets to be utilized. Where there is no absolute assurance that each legal entity in the Group will generate sufficient taxable profit to allow all or part of its deferred tax assets to be utilized, deferred tax assets are not recognized.
Provisions and contingencies The Group is currently involved in various proceedings. The estimate of the probable costs for the resolution of these claims has been developed in consultation with outside counsel handling the Group’s defense in these matters and is based upon an analysis of potential results. The Management does not believe that these proceedings will have a material adverse effect on the Group’s financial statement because management and its legal counsels believe that the Group has substantial legal and factual bases for its position. It is possible, however, that future results of operations could be materially affected by changes in the estimates or in the effectiveness of the strategies relating to these proceedings (Note 33). Estimation of impact of coronavirus pandemic The impact of coronavirus pandemic to the Group’s business operations relates to any potential interruptions or disruptions. The Group ensures that the impact of COVID-19 pandemic is appropriately reflected in its consolidated financial statements, and currently assessed the impact on its assets and liabilities as follows: • Collectability of accounts with customers continues to be closely monitored. A material change
in the provision for impairment of trade receivables has not been identified. • There were no onerous contracts or additional provisions that have been recognized resulting
from the direct impact of coronavirus pandemic. • Additional costs incurred by the Group due to COVID-19 pandemic that do not represent
satisfaction of performance obligation are excluded in the measurement of progress on the Group’s contracts with customers.
• The Group has also considered the increased uncertainty in determining key assumptions within the assessment of future taxable income of the Group upon which recognition of deferred tax assets is assessed, including forecast of revenue and expenses, among others.
The Group continues to monitor the risks and the ongoing impacts of COVID-19 pandemic on its business.
6. Cash and Cash Equivalents This account consists of:
Unaudited
March 2021 Audited
December 2020 Cash on hand and in banks P=1,842,528,632 P=1,924,416,281 Short-term investments 860,451,289 1,294,317,494 P=2,702,979,921 P=3,218,733,775

- 48 -
Cash in banks earn interest at the respective bank deposit rates. Short-term investments are made for varying periods of up to three (3) months depending on the immediate cash requirements of the Group and earn annual interest at the respective short-term investment rates.
Interest income from cash in banks and short-term investments amounted to P=3.03 million, P=5.56 million and P=8.22 million for the periods ended March 31, 2021, 2020 and 2019, respectively (Note 25).
7. Receivables This account consists of:
Unaudited
March 2021 Audited
December 2020 Trade Construction and infrastructure P=2,700,802,089 P=3,460,003,600 Education 1,180,500,377 1,166,226,739 Car dealership 413,498,641 469,628,623 Other services 116,441,611 189,255,856 Other receivables Advances to officers and employees 45,534,365 29,425,653
Receivables from plant 30,757,470 38,118,335 Receivable from EEI RFI 23,000,000 38,000,000 Receivable from sale of investment properties 20,922,181 21,280,648 Accrued referral incentives 17,817,943 17,817,943
Receivable from customers 11,031,804 20,479,281 Dividends receivable 10,794,316 3,236,665 Rent receivable 111,322 111,322 Others 368,272,547 259,425,599 4,939,484,666 5,713,010,264 Less allowance for impairment 376,565,528 366,936,427 P=4,562,919,138 P=5,346,073,837
Trade receivables The trade receivables are noninterest-bearing and collectible within one (1) year which consists of the following:
Receivable from construction and infrastructure Receivables from construction and infrastructure mainly represent amounts arising from domestic construction contracts which are generally on a 30-day credit term. Receivables from education Receivables from education represent amounts arising from tuition and other matriculation fees which are normally collected at end of every school term before the students can proceed to the next term. This also includes receivable from Department of Education amounting to P=130.3 million and P=138.8 million as at March 31, 2021 and December 31, 2020, respectively, arising from the Senior High School (SHS) Voucher Program wherein qualified SHS students are given assistance on tuition fees. These receivables are noninterest-bearing and are generally collectible within one year.
Receivables from car dealership Receivables from car dealership represent amounts arising from the sale of car, parts and accessories and services collectible within 30 days.
- 49 -
Receivables from other services Receivables from other services represent amounts arising from management and consultancy services provided by the Group generally collectible within 30 days. No trade receivables were used as collaterals to secure obligations as of March 31, 2021 and December 31, 2020. Other receivables Receivables from plant pertain to noninterest-bearing receivables from Honda Cars Philippines, Inc. and Isuzu Philippines Corporation, for promotional subsidy and fleet discounts. Receivables from plant are collectible within a year in the normal course of Group’s business.
Receivable from EEI RFI pertains to the Group’s sale of land to EEI RFI, a trustee of the Group’s employee retirement fund in previous years. Both parties agreed the selling price will be repaid in installments and bear annual interest rate of 5%. In 2016, the Group and the Fund agreed to extend the term of the payment until April 30, 2021. Advances to officers and employees are interest-bearing and repaid on a monthly basis through salary deductions. Receivable from sale of investment properties On December 11, 2017, the Group through EEI, sold a parcel of land located in Batangas for P=466.7 million. Both parties agreed the selling price will be settled in eight (8) semi-annual installments and shall bear annual interest rate of 2%. Receivable from customers In 2017, certain trade receivables were reclassified as interest-bearing trade receivables after the Group and the customers agreed to extend the credit terms. These receivables bear interest of 5% per annum and will be repaid in five (5) years’ time. As of March 31, 2021 and December 31, 2020, the current portion of receivable amounted to P=11.0 million and P=20.5 million, respectively, while the noncurrent portion of receivable as of March 31, 2021 and December 31, 2020 amounted to P=2.8 million, respectively (Note 16).
Accrued referral incentives pertain to income from accredited bank institutions earned by the car dealership branches through referrals made to customers who obtained bank financing in the acquisition of vehicles. Receivables classified as “Others” consist of interest, commission, insurance and various receivables.
8. Contract Assets and Liabilities
Contract Assets The Group presents contract receivable and retentions withheld by customer as contract assets as the Group’s right for consideration is conditioned on the lapse of the defect and liability period and the receipt of customer certification that there are no defects on the constructed asset. These are reclassified as receivables upon the lapse of the defect and liability period and final customer acceptance.
The Group’s contract assets amounted to P=8.8 billion and P=8.6 billion as of March 31, 2021 and December 31, 2020, respectively.
Details of the Group’s contract assets as of March 31, 2021 and December 31, 2020 are shown below (Note 16).

- 50 -
March 31, 2021
Current Noncurrent
(Note 16) Total
Contract asset P=7,812,226,943 P= 1,003,488,853 P=8,815,715,796 December 31, 2020
Current Noncurrent
(Note 16) Total
Contract asset P=7,605,270,420 P=978,481,350 P=8,583,751,770
Contract Liabilities
Details of the Group’s contract liabilities as of March 31, 2021 are shown below.
Unaudited
March 2021 Audited
December 2020 Total contract liabilities P=2,180,782637 P=2,557,001,832 Less current portion 1,447,699,937 898,322,177 P=733,082,700 P=1,658,679,655
Contract liabilities from construction and infrastructure segment consist of down payments received in relation to construction contracts that will be recognized as revenue in the future as the Group satisfies its performance obligations while contract liabilities from education segment represent the unearned tuition fees and accounts payable to students and will be recognized as revenue when the related educational services are rendered. Contract liabilities related to the remaining performance obligations of the education segment are generally recognizable within one (1) year.
9. Inventories
This account consists of:
Unaudited
March 2021 Audited
December 2020 Construction materials P=1,170,986,027 P=1,042,419,432 Merchandise 736,015,653 624,248,970 Real estate: Land and land development 151,152,545 151,725,740 Raw lands 42,584,391 42,584,391 Subdivision lots and contracted units for sale 37,856,898 36,460,877 231,593,834 230,771,008 Spare parts and supplies 108,008,625 72,729,484 2,246,604,139 1,970,168,894 Less: Allowance for inventory obsolescence 82,135,203 82,135,203 P=2,164,468,936 P=1,888,033,691
Merchandise includes automotive units, parts and accessories, food and beverages, among others.

- 51 -
The summary of the movement in real estate inventories is set out below:
Unaudited
March 2021 Audited
December 2020 Balances at beginning of year P=230,771,008 P=239,537,439 Construction/development costs incurred 2,451,294 13,698,819 Cost of real estate sales (1,628,468) (22,465,250) Balances at end of year P=231,593,834 P=230,771,008
The total cost of goods sold recognized in the Group’s statements of comprehensive income amounted to P=0.95 million, P=1.30 million and P=1.57 million in 2021, 2020 and 2019 respectively (Notes 26).
The Group recognizes inventory write-down whenever the NRV of the existing inventories is lower than its cost.
The roll-forward of allowance for inventory obsolescence is as follows:
Unaudited
March 2021 Audited
December 2020 Balance at beginning of year P=82,135,203 P=107,595,425 Provisions (Note 29) ‒ 21,960,851 Write-off ‒ (47,421,073) Balances at end of year P=82,135,203 P=82,135,203
No inventories were pledged as security to obligations as of March 31, 2021 and December 31, 2020.
10. Prepaid Expenses and Other Current Assets
This account consists of:
Unaudited
March 2021 Audited
December 2020 Creditable withholding taxes P=978,408,967 P=929,043,644 Advances to suppliers and contractors 733,821,772 1,004,942,386 Prepaid expenses 236,802,909 190,085,167 Miscellaneous deposits 120,392,908 120,704,511 Input value added tax (VAT) 55,779,839 55,371,913 Restricted funds 46,568,297 30,960,042 Advances to officers and employees 42,253,707 58,475,817 Restricted cash investment 27,748,059 27,747,232 Others 204,415,056 144,071,804 2,446,191,514 2,561,402,516 Less allowance for impairment 16,458,668 16,458,668 P=2,429,732,846 P=2,544,943,848
CWTs pertain to unutilized creditable withholding tax which will be used as tax credit against income taxes due. The Group determines that taxes withheld can be recovered in future periods.

- 52 -
Advances to suppliers and contractors represent down payment to subcontractors for the contract work to be performed and advance payment for the purchase of various construction materials and machineries and equipment items.
Prepaid expenses mainly include prepayments for membership fees, subscriptions, rentals and insurance, among others. Miscellaneous deposits mainly represent the Group’s refundable rental, utilities and guarantee deposits on various machinery and equipment items. Others include payments made on certain claims that are under protest (Note 33), financial assets at FVPL, various deposits, other supplies, among others.
11. Equity Investments at Fair value through Other Comprehensive Income (FVOCI)
This account consists of:
Unaudited March 2021
Audited December 2020
Quoted equity investments P=87,697,181 P=91,603,168 Unquoted equity investments 455,473,327 455,473,326 P=543,170,508 P=547,076,494
Roll-forward analysis of the account follows:
Unaudited
March 2021 Audited
December 2020 Balance at beginning of year P=547,076,494 P=1,147,773,806 Disposals ‒ (26,632,056) Fair value changes recognized in OCI ‒ (149,929,174) Reclassification (Note 12) ‒ (424,136,082) Net unrealized gain (loss) recognized in OCI (3,905,986) ‒ Balance at end of year P=543,170,508 P=547,076,494
In 2020, the Group’s equity investment in PGEC, a 90%-owned subsidiary of PERC, amounting to P=560.68 million was reclassified to investments in associate considering the significant influence exercised by the Group on PERC. PERC is the parent company of PGEC.
Movements in the fair value reserve recognized in other comprehensive income are as follows:
Unaudited
March 2021 Audited
December 2020 Attributable to equity holders of the parent: Balance at beginning of year P=175,482,889 P=311,094,152 Income (loss) recognized in OCI (532,470) (135,611,263) Balance at end of year 174,950,419 175,482,889 Non-controlling interests: Balance at beginning of year 232,495,478 240,945,407 Income (loss) recognized in OCI (187,157) (8,449,929) Balance at end of year 232,308,322 232,495,478 P=407,258,740 P=407,978,367

- 53 -
The Group elected to present the fair value changes of all its equity investments in other comprehensive income because it does not intend to hold these investments for trading.
The fair value of the Group’s unquoted equity investments in HEDC is determined using the adjusted net asset approach wherein the assets of investee are adjusted from cost to their fair value. The valuation was performed by an independent SEC-accredited appraiser as of December 31, 2020. Dividends earned from equity investments at FVOCI amounted to P=1.88 and P=0.47 million as of March 31, 2021 and December 31, 2020, respectively (Note 25).
No equity investments at fair value through other comprehensive income (FVOCI) were pledged as security to obligations as of March 31, 2021 and December 31, 2020.
12. Investments in Associates and Joint Venture
The rollforward analysis of this account follows:
Unaudited
March 2021 Audited
December 2020 Acquisition cost:
Balances at beginning of year P=4,690,263,520 P=4,841,636,714 Additions ‒ 450,000 Return of Investment in ARCC (190,453,883) (575,959,276) Reclassification (Note 11) ‒ 424,136,082 Balance at end of year 4,499,809,637 4,690,263,520
Accumulated impairment loss 74,536,609 74,536,609 Accumulated equity in net earnings:
Balance at beginning of year 2,459,727,726 1,262,916,499 Equity in net earnings 311,383,190 1,368,427,558 Dividends received ‒ (171,616,331) Balance at end of year 2,771,110,916 2,459,727,726
Subtotal 7,196,383,944 7,075,454,637 Share in other comprehensive income (loss) of an associate (54,061,922) (46,303,277) Cumulative translation adjustment 84,205,949 63,472,546 P=7,226,527,971 P=7,092,623,906
As of March 31, 2021 and December 31, 2020, no investments in associates were pledged as security to obligations.

- 54 -
13. Property and Equipment Property and equipment at revalued amount Movements in the revalued land are as follows:
Unaudited
March 2021 Audited
December 2020 Balance at beginning of year P=7,957,658,100 P=9,185,924,384 Additions (deductions): Reversal of impairment ‒ 5,237,506 Appraisal increase ‒ (72,695,173) Reclassification to investment properties - net ‒ (1,160,808,617) Balance at end of period P=7,957,658,100 P=7,957,658,100
Land at revalued amounts consists of owner-occupied property wherein the car dealership showroom, school buildings, and other facilities are located. The Parent Company owns a parcel of 7,304 sqm land located in Quezon Avenue, Quezon City wherein the car dealership showroom was erected. In December 2020, MESI (a wholly-owned subsidiary of IPO), sold its investment in SLRHSI, its subsidiary, to the Parent Company for P=1,946.6 million. The only asset of SLRHSI is the parcel of land in Makati. The selling price represents the fair value of the land classified as owner-occupied property and equipment which was accounted for using the revaluation model. The sale is eliminated in the consolidated financial statements. Upon transfer to the Parent Company, the land was reclassified to investment property which is accounted for using the cost model. Accordingly, the corresponding revaluation increment in IPO, amounting to P=785.8 million, was transferred to retained earnings.
Property and equipment at cost The rollforward analysis of this account follows:
Unaudited
March 2021 Audited
December 2020 At Cost
Land, Buildings and Improvements P=6,198,688,235 P=6,217,750,751 Machinery, Tools and Construction Equipment 5,558,221,890 5,412,856,675 Furniture, Fixtures and Office Equipment 1,323,516,150 1,429,509,005 Transportation and Service Equipment 3,096,863,098 3,081,479,036
16,177,289,373 16,141,595,467 Less: Accumulated Depreciation (9,369,412,907) (9,149,272,275) 6,807,876,466 6,992,323,192
Construction in Progress 1,488,267,588 1,458,496,670 Net book value at Cost P=8,296,144,054 P=8,450,819,862
Construction in progress mainly includes the general cost of construction of the Group’s school building in Makati City and other direct cost.

- 55 -
14. Goodwill
The carrying amount of goodwill allocated to each of the CGUs follows:
Unaudited
March 2021 Audited
December 2020 EEI Corporation and Subsidiaries P=300,859,305 P=300,859,305 MESI 137,853,346 137,853,346 IPO 32,644,808 32,644,808 Business combination of IPO and AEI 13,472,260 13,472,260 P=484,829,719 P=484,829,719
Assets acquired from AEI include investments in the following subsidiaries:
Subsidiaries Ownership Interest Affordable Private Education Center, Inc. doing business under the name of APEC Schools (APEC) 100.00% National Teachers College doing business under the name/s and style/s of The National Teachers College (NTC) 99.79% University of Nueva Caceres (UNC) 58.63% AC College of Enterprise and Technology, Inc. (ACCET) 100.00% LINC Institute, Inc. Doing Business under the Name and Style of LINC Academy (LINC) 100.00%
The goodwill arising from the merger between IPO and AEI on May 2, 2019 amounted to P=13.47 million. No impairment testing was done on the goodwill as the Group assessed it as not material to the consolidated financial statements.
15. Investment Properties
The rollforward analysis of this account follows:
Unaudited
March 2021 Audited
December 2020 Cost Balance at beginning of year P=1,977,608,213 P=17,689,018 Reclassification ‒ 1,961,065,975 Disposals ‒ (1,146,780) Balance at end of year P=1,977,608,213 P=1,977,608,213
Land classified as investment properties include the following:
• Parcel of land located in Makati owned by SLRHSI (Note 13). The carrying value of land reclassified from property and equipment to investment properties in 2020 amounted to P=1,961.1 million as of December 31, 2020, which represents its fair value at the date of transfer amounting to P=1,946.6 million (Note 13) and P=14.50 million costs directly attributable to the transfer.
• Other parcels of land owned by EEI located in Benguet, Cavite, Nueva Ecija, Bulacan and memorial lots in Las Piñas with carrying values of =P=6.6 million, =P=0.5 million, P=0.2 million, =P=7.0 million and =P=0.2 million, respectively, as of March 31, 2021 and December 31, 2020, respectively.

- 56 -
• Heritage lots held for capital appreciation of the Parent Company amounted to P=2.0 million as of March 31, 2021 and December 31, 2020.
As of December 31, 2020, the aggregate fair values of land amounted to P=1.98 billion, which was determined based on valuation performed by an independent SEC accredited appraiser in 2020. The fair value of the land was determined using the market approach which is a valuation technique that uses prices and other relevant information generated by market transactions involving identical or comparable assets and adjusted to reflect differences on size, and shape (Level 3 - Significant unobservable inputs).
In 2020, the Group sold parcels of land located in Las Pinas City for P=0.9 million. The Group recognized a gain of P=0.2 million related to the sale. None of the investment properties were pledged as a security to obligations as of March 31, 2021 and December 31, 2020.
16. Other Noncurrent Assets
This account consists of:
Unaudited
March 2021 Audited
December 2020 Contract asset- net of nocurrent portion (Note 8) P=1,003,488,853 P=978,481,350 Intellectual property rights 523,103,000 523,103,000 Deferred input VAT 126,402,275 150,221,650 Student relationship 73,247,236 78,824,857 Miscellaneous deposit 28,842,092 29,321,863 Computer software 14,049,951 13,234,817 Interest-bearing trade receivables- net of current portion
(Note 7) 2,768,265 2,768,265 Others 87,064,127 86,235,659 P=1,858,965,799 P=1,862,191,461
Intellectual property rights and student relationship are the intangible assets acquired in May 2019 through the merger between IPO and AC Education, Inc. (AEI), the wholly owned education arm of Ayala Corporation. Miscellaneous deposits include rental and security deposits.
Rollforward of computer software follows:
Unaudited
March 2021 Audited
December 2020 Cost Balance at the beginning of the year P=144,137,032 P=139,735,882 Additions 6,100,712 4,515,025 Reclassification (113,875) Balance at the end of the year 150,237,745 144,137,032 Accumulated Amortization Balance at the beginning of the year 130,902,215 123,863,564 Amortization 5,285,579 7,038,651 Balance at the end of the year 136,187,794 130,902,215 Net Book Value P=14,049,951 P=13,234,817

- 57 -
17. Accounts Payable and Other Current Liabilities This account consists of:
Unaudited
March 2021 Audited
December 2020 Accounts payable P=6,835,787,981 P=7,725,459,889 Deferred output taxes 340,827,182 411,024,600 Accrued expenses 335,863,514 239,891,188 Provisions 159,257,895 159,266,271 Withholding taxes and others 67,336,043 89,598,081 Output tax payable 43,616,362 47,586,547 Dividends payable 19,605,877 19,613,877 Subscriptions payable 13,125,000 13,125,000 SSS and other contributions 15,482,563 11,840,694 Chattel mortgage payable 10,303,398 10,249,382 Payable to Land Transportation Office 3,176,300 4,919,430 Deferred income 3,773,905 3,707,011 Others 34,380,290 41,990,911 P=7,882,536,310 P=8,778,272,881
Accounts payable pertains to the Group’s obligation to local suppliers. The normal trade credit terms of accounts payable and accrued expenses of the Group are expected to be settled within the next twelve (12) months.
Accrued expenses consist of:
Unaudited
March 2021 Audited
December 2020 Accrued salaries and wages P=76,491,395 P=70,658,629 Accrued interest 43,255,191 36,148,858 Accrued insurance 29,662,340 24,094,116 Accrued professional fees 19,027,535 21,514,578 Accrued security services 34,783,769 18,711,311 Accrued utilities 6,859,543 7,762,397 Others 125,783,741 61,001,299 P=335,863,514 P=239,891,188
Other accrued expenses mainly consist of accrual for professional fees, outside services, utilities and other expenses that are expected to be settled within one year. Provisions were provided for claims by third parties in the ordinary course of business. As allowed by PAS 37, Provisions, Contingent Liabilities and Contingent Assets, only a general description is provided as the disclosure of additional details beyond the present disclosures may prejudice the Group’s position and negotiation strategies with respect to these matters.
- 58 -
18. Loans Payable
This account consists of:
Unaudited
March 2021 Audited
December 2020 Unsecured bank loans P=7,276,250,000 P=7,607,000,000 Secured bank loans 126,133,692 375,000,000 P=7,402,383,692 P=7,982,000,000
Unsecured Unsecured bank loans are obtained from local banks and related party financial institutions with annual interest rates ranging from 3.00% to 3.90% and 3.50% to 5.50% in March 31, 2021 and December 31, 2020, respectively. Secured In 2017, the Group, through MCMI, obtained a short-term loan (STL) facility with Bank of Philippine Island (BPI), which was earmarked from the long-term loan facility of the Group from same bank, to finance the construction of MCMI’s school building. Each STL facility may be re-availed/renewed/ extended within a period of one year provided that the sum of the terms of re-availements/renewal/ extension will not exceed 360 days. The STL facility may be converted into a 10-year term loan facility which shall be partially secured by the real estate mortgage on the real property of MCMI. The STL facility is secured by the Continuing Suretyship Agreement of MESI. Annual interest rates range from 3.00% to 5.50%. The Group, through MCMI, also obtained short-term loans from Land Bank of the Philippines (LBP) in 2020 and 2019 amounting to P=57.3 million and P=15.0 million, respectively, with annual interests ranging from 4.70% to 6.25%. The loans are secured by the land owned by MCMI. Outstanding balance of short-term loans obtained by MCMI amounted to P=126 million and P=375 million as at March 31, 2021 and December 31, 2020, respectively.
19. Long-term Debt
This account consists of:
Unaudited March 2021
Audited December 2020
Fixed-rate corporate promissory notes P=5,727,204,764 P=5,204,857,924 Fixed-rate term loan 2,190,552,133 2,215,444,212 7,917,756,897 7,420,302,136 Less current portion of long-term debt 2,450,565,636 2,302,998,099 5,467,191,261 5,117,304,037
Parent Company On December 16, 2015, the Parent Company acquired from BPI loan amounting P=500.0 million, payable within five (5) years. The proceeds of the loan were used for general financing requirements and working capital purposes. In 2020, the loan was fully settled. EEI In 2014, the Group through EEI received P=500.0 million proceeds from the issuance of unsecured fixed-rate corporate promissory notes to a local bank that bear annual interest of 5.20%.
- 59 -
Subsequently, the bank reduced the interest rate to 4.80% effective May 26, 2015 until maturity. The promissory notes mature within seven (7) years from the date of issuance. On June 15, 2015, the Group received P=1,000 million proceeds from the issuance of an unsecured fixed-rate corporate promissory note to a local bank that bears annual interest of 4.80%. The promissory note matures within seven (7) years from the date of issuance. On May 23, 2018, the Group received P=2,000 million proceeds from the issuance of an unsecured fixed-rate corporate promissory note to a local bank that bears annual interest of 4.80%. The promissory note matures within five (5) years from the date of issuance. On November 11, 2019, the Group received P=909 million proceeds from the issuance of an unsecured fixed-rate corporate promissory note to a local bank that bears annual interest of 3.90%. The promissory note matures within three (3) years from the date of issuance. The proceeds from the promissory notes were used for general corporate and project financing requirements. On October 15, 2020, the Group received P=3,000.0 million proceeds from the issuance of an unsecured fixed-rate corporate promissory note to a local bank that bears annual interest of 3.5%. The promissory note matures within three (3) years from the date of issuance. On November 23, 2020, the Group received P=1,000.0 million proceeds from the issuance of an unsecured fixed-rate corporate promissory note to a local bank that bears annual interest of 3.25%. The promissory note matures within three (3) years from the date of issuance. The proceeds from the promissory notes were used for general corporate and project financing requirements. EEI Power Corporation On August 28, 2015, EEI Power availed an unsecured P=500.0 million long-term loan from a local bank that bears an annual interest of 4.80%. The loan is payable in equal quarterly installments and will mature on August 27, 2022. Biotech JP On August 12, 2016, Biotech JP obtained an unsecured five-year long-term loan from Biotech Japan Corporation that bears an annual interest rate of 0.05%. The loan is payable at maturity date, including accrued interest. On October 1, 2018, the Biotech JP obtained an unsecured 4.5 year long-term loan from Biotech Japan Corporation that bears an annual interest rate of 0.30%. The loan is payable in five equal annual installments and will mature on March 31, 2021. In 2019, Biotech JP obtained an unsecured P=47.60 million long-term loan from Biotech Japan Corporation that bears an annual interest of 2.45%. On April 24, 2020, BiotechJP availed an unsecured P=21.8 million long-term loan from a foreign bank that bears an annual interest of 0.80%. The loan is payable in 18 equal semi-annual installments and will mature on September 13, 2030. On September 25, 2020, BiotechJP availed an unsecured P=92.3 million long-term loan from Biotech Japan Corporation that bears an annual interest of 3.0%. The loan is payable in equal semi-annual installments and will mature on March 31, 2030.

- 60 -
IPO IPO, through NTC, entered into a 10-year unsecured term loan facility with a third party local bank for P=650.0 million to finance its building refurbishment and/or expansion. The principal payments will be made in 28 quarterly payments starting May 2022. Total drawdown from the long-term loan facility amounted to P=380.0 million in 2019, which are subject to annual interest rate of 4.675% with annual repricing based on higher of 5.5% or the prevailing one year benchmark rate or done rate of a liquid/active security, as agreed by the parties, with the same tenor if benchmark rate is not reflective of market rate, plus interest spread. The loan is subject to certain covenants including maintaining a maximum debt-to-equity structure ratio of 3:1. As of March 31, 2021 and December 31, 2020, NTC has complied with its covenant obligations, including maintaining the required debt-to-equity ratio. For 2021 and 2020, interest expense recognized in profit or loss amounted to P=5.4 million and P=5.8 million, respectively
In 2019, the IPO Group, through MCMI, entered into a ten-year secured long-term loan agreement with a local bank for P=1,500.0 million to refinance the construction of MCMI’s school buildings and facilities that were initially funded by short-term loans. MCMI made partial drawdowns against this agreement amounting to P=680.0 million, P=350.0 million and P=470.0 million in January, June and July 2019, respectively. The loans were subject to prevailing borrower’s rate, plus a minimum spread of 0.50% per annum, but in no case lower than 4% per annum, subject to quarterly repricing. MCMI shall repay the loan in 20 equal quarterly installments to start at the end of 21st quarter from the initial drawdown date. The loans were secured by the land and related improvements owned by MCMI with carrying value of 2,361.5 million and P=2,376.8 million as of December 31, 2020 and 2019, respectively, and suretyship of MESI. The loans were subject to certain positive and negative covenants such as the requirement for MESI to maintain its debt service cover ratio of atleast 1.0 at all times and its debt-to-equity ratio of at least 75:25 starting on the third year of the loan reckoned from initial drawdown date or January 2022. The aforementioned loans require the Group to maintain certain financial ratios such as debt to equity ratio, current ratio and debt service coverage ratio. As of March 31, 2021 and December 31, 2020, the Group was in compliance with the loan covenants.
20. Retained Earnings
On December 31, 2019, the Company’s BOD approved additional appropriation of retained earnings amounting to P=400 million for planned investments and business expansion that the Parent Company intends to carry out for 2-3 years. On December 31, 2018, the Company’s BOD approved additional appropriation of retained earnings amounting to P=2,100 million for planned investments and business expansion that the Parent Company intends to carry out for 2-3 years. On June 22, 2018, the BOD of EEI approved the appropriation of retained earnings of P=4.0 billion for purchase of property and equipment as business expansion and manpower training program for the next three to five years. On December 4, 2020, the BOD of EEI approved the reversal of the said appropriation to make funds available for the ongoing projects, particularly in infrastructure. Retained earnings include P=2,580.1 million as of March 31, 2021 and December 31, 2020, respectively, representing treasury shares, appropriated retained earnings and deferred tax assets that are not available for dividend declaration. After reconciling items, the retained earnings of the Parent Company that are available for dividend declaration amounted to P=1,379.0 million and P=1,359.3 million as of March 31, 2021 and December 31, 2020, respectively.
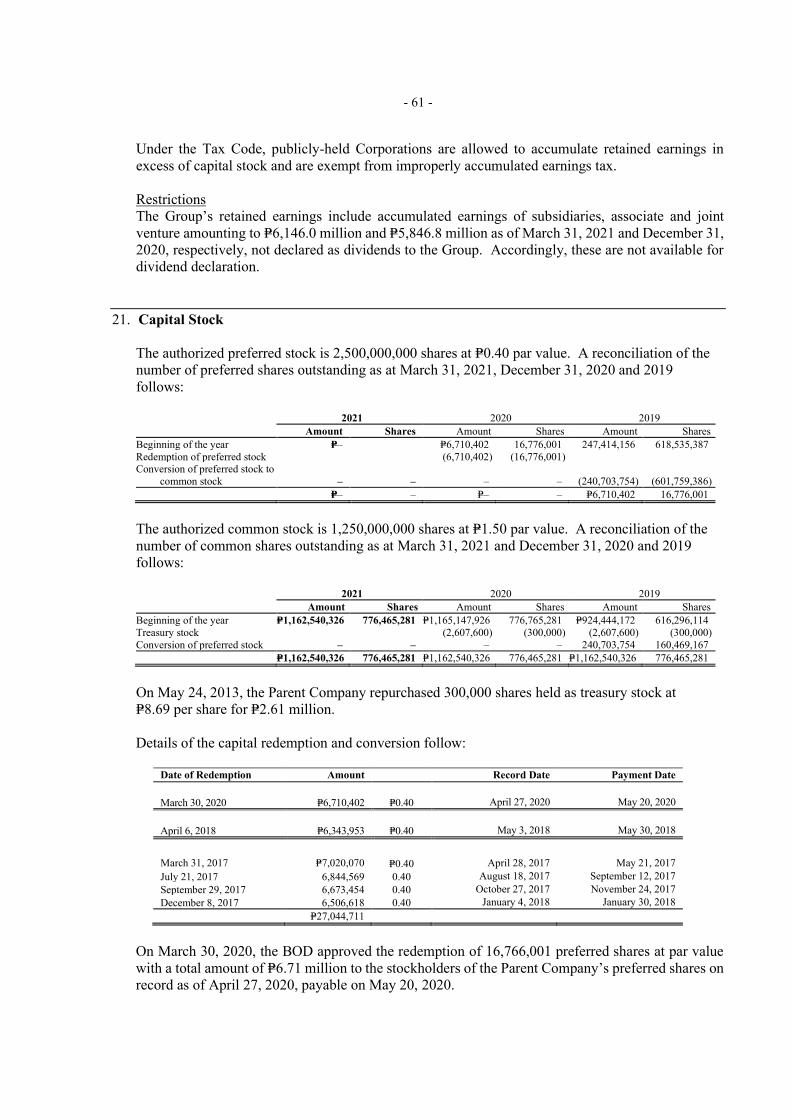
- 61 -
Under the Tax Code, publicly-held Corporations are allowed to accumulate retained earnings in excess of capital stock and are exempt from improperly accumulated earnings tax. Restrictions The Group’s retained earnings include accumulated earnings of subsidiaries, associate and joint venture amounting to P=6,146.0 million and P=5,846.8 million as of March 31, 2021 and December 31, 2020, respectively, not declared as dividends to the Group. Accordingly, these are not available for dividend declaration.
21. Capital Stock
The authorized preferred stock is 2,500,000,000 shares at P=0.40 par value. A reconciliation of the number of preferred shares outstanding as at March 31, 2021, December 31, 2020 and 2019 follows: 2021 2020 2019 Amount Shares Amount Shares Amount Shares Beginning of the year P=‒ P=6,710,402 16,776,001 247,414,156 618,535,387 Redemption of preferred stock (6,710,402) (16,776,001) Conversion of preferred stock to
common stock ‒ ‒ ‒ ‒ (240,703,754) (601,759,386) P=‒ ‒ P=‒ ‒ P=6,710,402 16,776,001
The authorized common stock is 1,250,000,000 shares at P=1.50 par value. A reconciliation of the number of common shares outstanding as at March 31, 2021 and December 31, 2020 and 2019 follows:
2021 2020 2019 Amount Shares Amount Shares Amount Shares Beginning of the year P=1,162,540,326 776,465,281 P=1,165,147,926 776,765,281 P=924,444,172 616,296,114 Treasury stock (2,607,600) (300,000) (2,607,600) (300,000) Conversion of preferred stock ‒ ‒ ‒ ‒ 240,703,754 160,469,167 P=1,162,540,326 776,465,281 P=1,162,540,326 776,465,281 P=1,162,540,326 776,465,281
On May 24, 2013, the Parent Company repurchased 300,000 shares held as treasury stock at P=8.69 per share for P=2.61 million.
Details of the capital redemption and conversion follow:
Date of Redemption Amount Record Date Payment Date March 30, 2020 P=6,710,402 P=0.40 April 27, 2020 May 20, 2020 April 6, 2018 P=6,343,953 P=0.40 May 3, 2018 May 30, 2018 March 31, 2017 P=7,020,070 P=0.40 April 28, 2017 May 21, 2017 July 21, 2017 6,844,569 0.40 August 18, 2017 September 12, 2017 September 29, 2017 6,673,454 0.40 October 27, 2017 November 24, 2017 December 8, 2017 6,506,618 0.40 January 4, 2018 January 30, 2018 P=27,044,711
On March 30, 2020, the BOD approved the redemption of 16,766,001 preferred shares at par value with a total amount of P=6.71 million to the stockholders of the Parent Company’s preferred shares on record as of April 27, 2020, payable on May 20, 2020.

- 62 -
In 2019, the Parent Company issued 160,169,167 common shares at 1.50 per share for the conversion of 601,759,386 preferred shares at 0.40 per share or P=240,703,754. There was no capital redemption made during 2019.
In 2019 and prior, the Parent Company’s preferred shares have the following features:
a) Entitled to dividends at the rate of average 91-day T-Bill plus two percent; b) Fully participating as to distribution of dividends;
- Convertible into common shares at the option of the holders thereof from the date of issue at the conversion rate of 3 and ¾ preferred shares to 1 common share for a price of P=1.50 per common share subject to adjustments;
c) Redeemable at any one time or from time to time, at the option of the BOD of the Parent Company, subject to availability of funds; and
d) With voting rights and preferences as to assets upon dissolution of the Parent Company over common shareholders.
Below is the summary of the outstanding number of shares and holders of security as at March 31, 2021:
Year
Number of shares
registered Issue/offer price Date of approval
Number of holders of securities
Preferred shares: January 31, 2019 634,395,272 48 Movement (15,859,885) 0.40 April 6, 2018 December 31, 2019 618,535,387 48 Movement (601,759,386) January 1, 2020 16,776,001 42 Movement (16,776,001) December 31, 2020 – Movement – March 31, 2021 –
Common Shares: January 31, 2018 615,996,114 394 No Movement – ‒ December 31, 2018 615,996,114 386 Movement 160,469,167 December 31, 2019 776,465,281 384 Movement – December 31, 2020 776,465,281 384 Movement – March 31, 2021 776,465,281 385
SEC approved the registration of the Parent Company’s authorized capital stock before its listing date with the PSE, which was on July 2, 1962. The actual number of shares initially listed was 584,085 at an offer price of P=10.0 per share. Total number of common shareholders was 385 and 384, as of March 31, 2021 and December 31, 2020, respectively.
22. Cash Dividends Cash Dividends The BOD declared cash dividends in 2020, 2019 and 2018 as follows; and none as of March 2021.

- 63 -
Date of BOD Approval Amount
Amount per share
Record Date Payment Date Preferred
Shares Common
Shares March 30, 2020 P=86,529 P=0.00515 P=− April 27, 2020 May 20, 2020 April 5, 2019 P=4,688,498 P=0.00758 P=− May 2, 2019 May 28, 2019 July 19, 2019 4,459,640 0.00721 − August 15, 2019 September 10, 2019 July 19, 2019 50,758,965 0.01733 0.065 August 15, 2019 September 10, 2019 October 4, 2019 3,349,141 0.005415 − October 31,2019 November 20, 2019 December 6, 2019 85,860 0.005118 − January 2, 2020 January 28, 2020 P=63,342,105 April 6, 2018 P=2,949,050 P=0.005 P=− May 3, 2018 May 29, 2018 July 20, 2018 3,342,256 0.005 − August 16, 2018 September 11, 2018 July 20, 2018 50,758,966 0.017 0.065 August 16, 2018 September 11, 2018 September 28, 2018 3,273,289 0.005 − October 25, 2018 November 21, 2018 December 18, 2018 4,449,125 0.007 − January 11, 2019 February 6, 2019 P=64,772,686
23. Earnings Per Share
Basic and diluted earnings (loss) per share amounts attributable to equity holders of the Group are computed as follows:
Unaudited basic earnings per share
January to March 31 2021 2020 2019 Net income attributable to equity
holders of parent company P=319,255,301 P=232,243,632 P=391,123,303 Less dividends attributable to
preferred shares (Note 21) − 86,529 − Net income applicable to common
shares 319,255,301 232,157,103 391,123,303 Divided by the weighted average
number of common shares 776,465,281 776,465,281 615,996,114 Basic earnings per share P=0.4112 P=0.2990 P=0.6349
Unaudited diluted basic earnings per share
January to March 31 2021 2020 2019 Net income applicable to common
shares P=319,255,301 P=232,157,103 P=391,123,303 Add dividends attributable to
preferred shares − 86,529 − Net income applicable to common
shares for diluted earnings per share 319,255,301 232,243,632 391,123,303
Weighted average number of common shares 776,465,281 776,465,281 615,996,114
Dilutive shares arising from convertible preference shares
−
−
164,942,770 Weighted average number of
common shares for diluted earnings per share 776,465,281 776,465,281 780,938,884
Diluted earnings per share P=0.4112 P=0.2990 P=0.5008

- 64 -
24. Revenue from Contracts with Customers Set out below is the disaggregation of the Group’s revenue from contracts with customers for the quarter ended March 31, 2021, 2020 and 2019:
January to March 31 2021 2020 2019 Revenue from construction contracts P=3,349,474,327 P=4,892,631,019 P=5,112,609,172 Sales of goods 1,014,226,036 1,378,558,299 1,714,044,684 Sales of services 474,018,326 613,147,183 643,242,429 Schools and related operations 803,005,470 957,349,943 538,752,892 P=5,640,724,159 P=7,841,686,444 P=8,008,649,177
25. Other Income
This account consists of:
January to March 31 2021 2020 2019 Foreign exchange gain (loss) P=19,527,939 P=1,135,708 (P=14,673,008) Interest income 4,052,585 9,618,667 16,267,731 Gain on sale from property and
equipment 2,824,744 1,698,979 1,393,556 Rental income 2,206,365 5,188,289 7,291,505 Dividend income 1,882,633 467,504 12,234,140 Tax refund/discount 666,954 ‒ 631,436 Miscellaneous 11,663,387 7,320,287 6,513,943 P=42,824,607 P=25,429,434 P=29,659,303
Interest income consists of income from:
January to March 31 2021 2020 2019 Cash in banks and short-term
investments P=3,026,397 P=5,564,859 P=8,215,695 Receivable from EEI-RFI 542,106 1,224,726 1,484,375 Interest on loans receivable 256,696 ‒ 2,607,540 Receivable from related parties ‒ 2,712,311 ‒ Installment contract receivable ‒ ‒ 2,127,296 Others 227,386 116,771 1,832,826 P=4,052,585 P=9,618,667 P=16,267,732
Miscellaneous include income from sale of sludge and used oil and rebate from purchase of fuel, among others.

- 65 -
26. Costs of Sales and Services
This account consists of: January to March 31 2021 2020 2019 Cost of services (Note 28) Cost of construction contracts P=2,932,474,497 P=4,518,477,564 P=4,436,843,370 Cost of manpower and other
services
291,625,618
402,508,369
428,244,064 3,224,100,115 4,920,985,933 4,865,087,434 Cost of goods sold Cost of merchandise sold (Note 27)
948,923,905
1,298,891,505
1,563,018,859
Cost of real estate sold (Note 9) 1,628,468 1,716,396 4,700,143 950,552,373 1,300,607,901 1,567,719,002 Cost of school and related operations
(Note 28)
446,316,984
578,923,910
331,327,785 P=4,620,969,472 P=6,800,517,744 P=6,764,134,221
27. Costs of Merchandise Sold This account consists of:
January to March 31 2021 2020 2019 Inventory, beginning P=2,407,832,777 P=2,450,443,330 938,860,359 Purchases 464,700,246 1,253,702,171 3,066,489,416 Total goods available for sale 2,872,533,023 3,704,145,501 4,005,349,775 Less inventory end 1,932,875,102 2,407,832,777 2,450,443,330 Cost of inventories sold 939,657,921 1,296,312,724 1,554,906,445 Personnel expenses 5,957,078 1,653,985 5,171,961 Others 3,308,906 924,796 2,940,453 P=948,923,905 P=1,298,891,505 P=1,563,018,859
28. Costs of Services This account consists of:
January to March 31 2021 2020 2019 Cost of construction contracts
Labor P= 942,977,761 P=1,407,010,574 P=2,105,250,535 Materials 1,045,227,558 1,674,056,989 1,233,878,467 Equipment costs and others 824,759,616 1,325,270,785 1,006,059,635 Depreciation and amortization 119,509,563 112,139,216 91,654,733
2,932,474,497 4,518,477,564 4,436,843,370 Cost of manpower and other services
Personnel expenses 171,869,687 181,888,247 188,728,273 Parts and accessories 59,792,175 91,393,564 82,238,310 Materials 24,357,882 74,184,070 113,707,206 Depreciation and amortization 1,913,236 2,220,265 120,654 Others 33,692,637 52,822,223 43,449,621 291,625,618 402,508,369 428,244,064 P=3,224,100,115 P=4,920,985,933 P=4,865,087,434

- 66 -
29. Tuition and other fees This amount consists of:
January to March 31 2021 2020 2019 Personnel expenses 239,159,289 291,266,105 P=158,489,666 Depreciation and amortization 84,439,966 92,852,600 50,477,676 Management and other professional fees 20,760,384 47,842,414 30,476,210 Student-related expenses 14,739,679 35,781,051 23,149,118 Utilities 11,261,816 28,402,526 21,672,563 Periodicals 23,518,645 17,455,310 5,856,365 IT expense - software license 19,358,232 12,266,724 9,839,390 Rent 8,258,114 (159,481) 54,850 Repairs and maintenance 5,371,605 7,130,565 4,115,537 Research and development fund 5,371,427 2,560,844 4,448,674 Taxes and licenses 3,939,816 5,804,183 774,326 Insurance 1,919,587 2,261,647 2,064,906 Advertising 1,782,479 2,111,645 3,579,378 Seminar 1,674,827 1,605,479 2,010,153 Tools and library books 1,504,494 10,825,123 9,196,018 Office supplies 799,311 3,121,300 1,880,308 Accreditation cost 571,322 3,037,095 1,327,049 Laboratory supplies 315,597 3,021,445 861,915 Entertainment, amusement and
recreation 277,182
481,288
320,097 Transportation and travel 187,717 570,190 335,715 Miscellaneous 1,105,495 10,685,857 397,871 P=446,316,984 P=578,923,910 P=331,327,785
30. General and Administrative Expenses
This account consists of: January to March 31 2021 2020 2019 Personnel expenses P=308,186,874 P=328,438,776 P=250,361,744 Depreciation and amortization 91,905,788 111,851,495 66,998,331 Taxes and licenses 29,087,371 39,310,017 56,717,486 Advertising and promotions 16,310,052 40,905,657 29,175,159 Rent, light and water 26,149,514 30,954,563 42,354,898 Transportation and travel 17,042,346 25,223,787 20,634,714 Repairs and maintenance 25,299,025 17,859,357 12,788,009 Securities and utilities 17,301,214 16,849,549 13,764,236 Professional fees 8,054,533 16,821,051 14,728,008 Seminars 3,658,507 15,478,250 3,827,366 Entertainment, amusement and
recreation 3,716,941
13,372,386
11,533,516 Provision for probable losses 7,769,475 12,660,205 (19,685,606) Management and other fees 34,108,140 12,216,742 9,203,404 Insurance 7,392,558 6,846,785 5,464,935 Office expenses 4,451,513 5,425,060 4,747,857 Commissions 8,418,975 5,378,515 4,811,667 Direct expenses 6,084,647 4,937,911 9,172,793 Donations and contributions 18,009 30,000 – Miscellaneous 70,659,455 42,367,575 33,906,255 P=685,614,937 P=746,927,681 P=570,504,772

- 67 -
Miscellaneous expense includes dues and subscriptions, periodicals, training and seminar, bank charges, legal and notarial fees and other contracted services.
31. Depreciation and amortization This account consists of:
January to March 31 2021 2020 2019 Cost of construction contracts
(Note 26) P=119,509,563 P=112,139,216 P=91,654,733 General and administrative expenses
(Note 30) 91,905,788 111,851,495 66,998,331 Cost of school and related operations
(Note 26) 84,439,966 92,852,600 50,477,676 Cost of manpower and other services
(Note 26) 1,913,236 2,220,265 120,654 P=297,768,553 P=319,063,576 P=209,251,394
32. Interest and Finance Charges
This account consists of:
January to March 31 2021 2020 2019 Loans payable P=118,374,231 P=101,072,068 P=162,657,610 Long-term debt 55,465,527 50,212,669 13,889,550 Interest on lease liabilities 14,026,026 16,949,254 11,125,746 Advances to affiliates and other
finance charges 2,809,594 3,947,821 1,114,690 P=190,675,378 P=172,181,812 P=188,787,596
33. Contingencies and commitments Provisions and Contingencies a. The Group is involved in certain claims arising from the ordinary conduct of business which are
either pending decision by the courts or are being contested, the outcome of which are not presently determinable. The estimate of the probable costs for the resolution of these claims has been developed in consultation with external counsels handling the defense in these matters and is based upon an analysis of potential results. The ultimate disposition of these matters cannot be determined with certainty. The Group will exhaust all legal remedies available to it in defending itself in these claims and proceedings. The disclosure of additional details beyond the present disclosure may prejudice the Group’s position and negotiation strategies with respect to these matters. Thus, as allowed under paragraph 92 of PAS 37, Provisions, Contingent Liabilities and Contingent Assets, only a general description is provided.
b. Prior to 2018, the Group’s provisions include the Group’s recognized payable associated with the Faculty Associations of Mapua Institute of Technology (FAMIT) reranking case. This case involves the faculty ranking and evaluation instrument that was part of the 2001 Collective Bargaining Agreement negotiations with the FAMIT. The Supreme Court reversed an earlier Court of Appeals decision in favor of management. An entry of judgment dated March 13, 2008 was

- 68 -
made in the Supreme Court Book of Entries of Judgments, making the decision final and executory. A Memorandum of Agreement was entered into by management with FAMIT before the Voluntary Arbitrators wherein the parties agreed to continue the process of faculty ranking. The evaluation process was completed in December 2008. On January 22, 2009, MESI and FAMIT entered into a Compromise Agreement regarding the payment of the amounts due to the permanent faculty members of MESI in relation to the faculty reranking case. As at December 31, 2018, total accumulated payments to faculty members amounted to P=230.78 million. Management assessed that the liability already prescribed after applying the 10-year prescription period which ended in March 2018 (Note 18).
34. Non-controlling Interest
Non-controlling interest in consolidated subsidiaries represents shareholdings in subsidiaries not held by the Group.
Dividends paid to non-controlling interest in consolidated subsidiaries amounted to nil, P=37.96 million and P=14.75 million as at March 31, 2021, 2020 and 2019, respectively. Material Partly-Owned Subsidiaries In February 2020, the Parent Company purchased additional 7,100,000 EEI shares for P=59.97 million resulting to an increase in ownership interest from 54.65% to 55.34%. The non-controlling interest decreased from 45.35% to 44.66%. In May 2019, the Parent Company sold the 281,642 shares of Malayan Education Systems, Inc. (MESI) to IPO, which represents 7% ownership in MESI. With this acquisition, MESI became 100% indirectly-owned subsidiary of the Parent Company through IPO. Subsequently, IPO issued 295,329,976 common shares from its unissued capital stock to AC, the parent company of AEI, in exchange for the merger of IPO and AEI, with IPO being the surviving corporation. Upon merger, the Parent Company’s ownership interest over IPO was reduced from 67.34% to 48.18%. The non-controlling interest increased from 32.66% to 51.82% or an increase of P=2.52 billion. In November 2019, the Parent Company purchased additional 3,000,000 EEI shares for P=40.0 million or 10.32 per share resulting to an increase in ownership interest from 54.36% to 54.65%. The non-controlling interest decreased from 45.64% to 45.35% or a decrease of P=40.38 million. In March 2019, the Parent Company purchased additional 90,000 shares of LFPSI for P=25.0 million resulting to an increase in direct ownership from 37.50% to 50.00%. The Parent Company’s effective interest including its indirect ownership through MMPC is 63.00% in 2019. As a result, Parent Company has obtained control over LFPSI and started accounted for the investee as a subsidiary using consolidation method under PFRS 10. The non-controlling interest in 2019 is 27.00% or P=38.45 million. In July 2019, the Parent Company sold its 50% shares in ZIFC to various individuals amounting to P=6.8 million resulting to a loss of ownership interest from 50% to 0%. The non-controlling interest disposed in 2019 is P=12.10 million. The Group recognized equity reserve from the changes in ownership without loss of control amounting to P=1,821.7 million. This was included in “Equity reserve” representing the excess consideration paid for the carrying amount of the non-controlling interest.

- 69 -
35. Operating Segment Operation For management purposes, the Group’s operating businesses are organized and managed separately according to the nature of the products and services provided, with each segment representing a strategic business unit that offers different products and serves different markets. Segment financial information is reported on the basis that it is used internally for evaluating segment performance and allocating resources to segments. The Group derives its revenue from the following reportable segments: Construction and Infrastructure - mainly consists of revenues from EEI as a general contractor and trader of construction equipment and parts. The subsidiaries of EEI are mainly involved in the provision for manpower services, construction, trading of equipment, power generation, steel fabrication, real estate and others. Property management - represents property and project management services of the Group. Education - primarily consists of revenues from IPO and subsidiaries in education and other related support services. Car Dealership - represents automotive dealerships of the Group. Other Services - represent support services which cannot be directly identified with any of the reportable segments mentioned above. These include sale of pharmaceutical products, trading of consumer goods and rendering various services to the consumers. Segment assets and liabilities exclude deferred income tax assets and liabilities. Inter-segment income arise from transactions that were made on terms equivalent to those that prevail in an arms-length transactions. Management monitors construction revenue and segment net income for the purpose of making decisions about resource allocation. Segment performance is evaluated based on net income and construction revenue. Segment reporting is consistent in all periods presented as there are no changes in the structure of the Group’s internal organization that will cause the composition of its reportable segment to change. Transfer prices between operating segments are on an arm’s length basis in a manner similar to transactions with third parties.
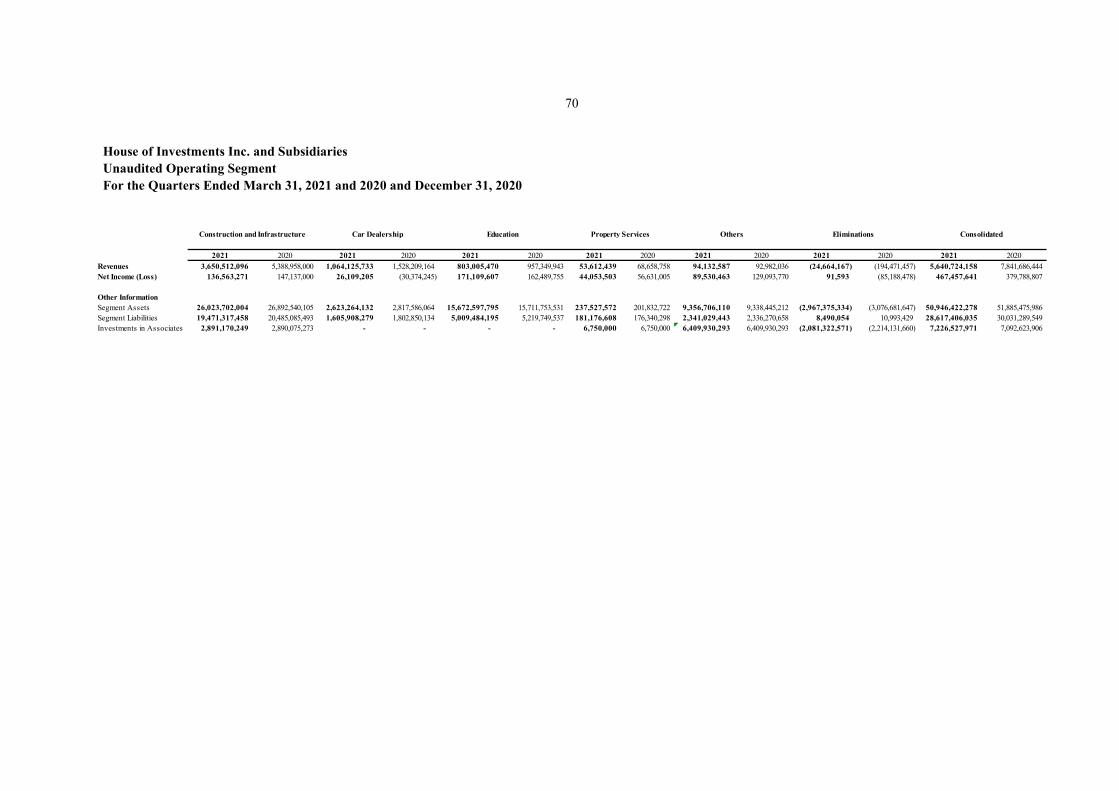
70
House of Investments Inc. and Subsidiaries Unaudited Operating Segment For the Quarters Ended March 31, 2021 and 2020 and December 31, 2020
2021 2020 2021 2020 2021 2020 2021 2020 2021 2020 2021 2020 2021 2020Revenues 3,650,512,096 5,388,958,000 1,064,125,733 1,528,209,164 803,005,470 957,349,943 53,612,439 68,658,758 94,132,587 92,982,036 (24,664,167) (194,471,457) 5,640,724,158 7,841,686,444 Net Income (Loss) 136,563,271 147,137,000 26,109,205 (30,374,245) 171,109,607 162,489,755 44,053,503 56,631,005 89,530,463 129,093,770 91,593 (85,188,478) 467,457,641 379,788,807
Other InformationSegment Assets 26,023,702,004 26,892,540,105 2,623,264,132 2,817,586,064 15,672,597,795 15,711,753,531 237,527,572 201,832,722 9,356,706,110 9,338,445,212 (2,967,375,334) (3,076,681,647) 50,946,422,278 51,885,475,986 Segment Liabilities 19,471,317,458 20,485,085,493 1,605,908,279 1,802,850,134 5,009,484,195 5,219,749,537 181,176,608 176,340,298 2,341,029,443 2,336,270,658 8,490,054 10,993,429 28,617,406,035 30,031,289,549 Investments in Associates 2,891,170,249 2,890,075,273 - - - - 6,750,000 6,750,000 6,409,930,293 6,409,930,293 (2,081,322,571) (2,214,131,660) 7,226,527,971 7,092,623,906
Eliminations ConsolidatedEducation OthersConstruction and Infrastructure Car Dealership Property Services

- 71 -
HOUSE OF INVESTMENTS, INC. AND SUBSIDIARIES SUPPLEMENTARY INFORMATION AND DISCLOSURES REQUIRED ON SRC RULE 68 AS AMENDED March 31, 2021 Philippine Securities and Exchange Commission (SEC) issued the Revised Securities Regulation Code (SRC) Rule 68 which consolidates the two separate rules and labeled in the amendment as “Part I” and “Part II”, respectively. It also prescribed the additional information and schedule requirements for issuers of securities to the public. Below are the additional information and schedules required by Revised SRC Rule 68 that are relevant to the Group. This information is presented for the purpose of filing with the SEC and is not required part of the basic financial statements. Schedule A. Financial Assets in Equity Securities The Group is not required to disclose the financial assets in equity securities as the equity investments at fair value through other comprehensive income (FVOCI) amounting P=543.17 million do not constitute 5% or more of the total current assets of the Group as at March 31, 2021. Schedule B. Amounts Receivable from Directors, Officers, Employees, Related Parties and Principal Stockholders (other than related parties) As of March 31, 2021, the Group has no receivable above P1 million or 1% of the total assets, whichever is lower from directors, officers, employees, and principal stockholders (other than related parties). Schedule C. Amounts Receivable from/Payable to Related Parties which are eliminated during the Consolidation of Financial Statements Below is the schedule of receivables with subsidiaries, which are eliminated in the consolidated financial statements as at March 31, 2021:
Name and designation of debtor
Balance at beginning of
period Additions Amounts collected Amounts
written off Balance at end of
period Landev Corporation Due from affiliates P=1,268,632 P=626,558 (P=90,581) P=− P= 1,804,608 Dividends receivable 60,000,145 − (5,000,000) − 55,000,145
61,268,777 626,558 (5,090,581) − 56,804,753 Greyhounds Security and Investigation Agency Corporation
Due from affiliates 101,746 97,479 (112,328) − 86,897 Investment Managers, Inc. Due from affiliates 673,700 4,016,625 (37,031) − 4,653,294 iPeople, inc. and subsidiaries Due from affiliates 21,606,556 26,535,750 (30,015,397) − 18,126,909 Dividends receivable − − − − −

- 72 -
Name and designation of debtor
Balance at beginning of
period Additions Amounts collected Amounts
written off Balance at end of
period 21,606,556 26,535,750 (30,015,397) − 18,126,909
EEI Corporation and subsidiaries Due from affiliates 1,520,961 2,753,216 (2,832,256) − 1,441,920 La Funeraria Paz Sucat, Inc
Due from affiliates 1,554,611 2,554,212 (2,554,212) − 1,554,611 Zambowood Realty and Development Corp Due from affiliates 4,342 3,465 − − 7,807 Xamdu Motors, Inc. Due from affiliates 4,000 3,867 − − 7,867 Zamboanga Carrier Inc Due from affiliates 6,943 3,487 − − 10,431 Honda Cars Kalookan
Due from affiliates 425,945 − − − 425,945 P=87,167,580 36,594,658 (40,641,805) − P=83,120,433
These receivables are non-interest bearing and are expected to be settled within the next twelve months. Schedule D. Intangible Asset - Other Noncurrent Assets As at March 31, 2021, the Group’s intangible assets consist of goodwill and computer software. Goodwill in the Group’s consolidated statements of financial position arose from the acquisition of EEI, iPeople, and MESI. Details of the Group’s intangible assets are as follows:
Description Beginning
balance Additions
at cost Charged to cost
and expenses Charged to
other accounts
Other changes additions
(deductions) Ending balance
Goodwill P=484,829,719 P=‒ P=‒ P=‒ P=‒ P=484,829,719 Intellectual property rights 523,103,000
‒ ‒
‒
‒
523,103,000
Student relationship 78,824,857 ‒ ‒ ‒ ‒ 78,824,857 Computer software 13,234,817 6,100,712 (5,285,579) ‒ ‒ 14,049,951 P=1,099,992,393 P=6,100,712 (P=5,285,579) P=− P=− P=1,100,807,527
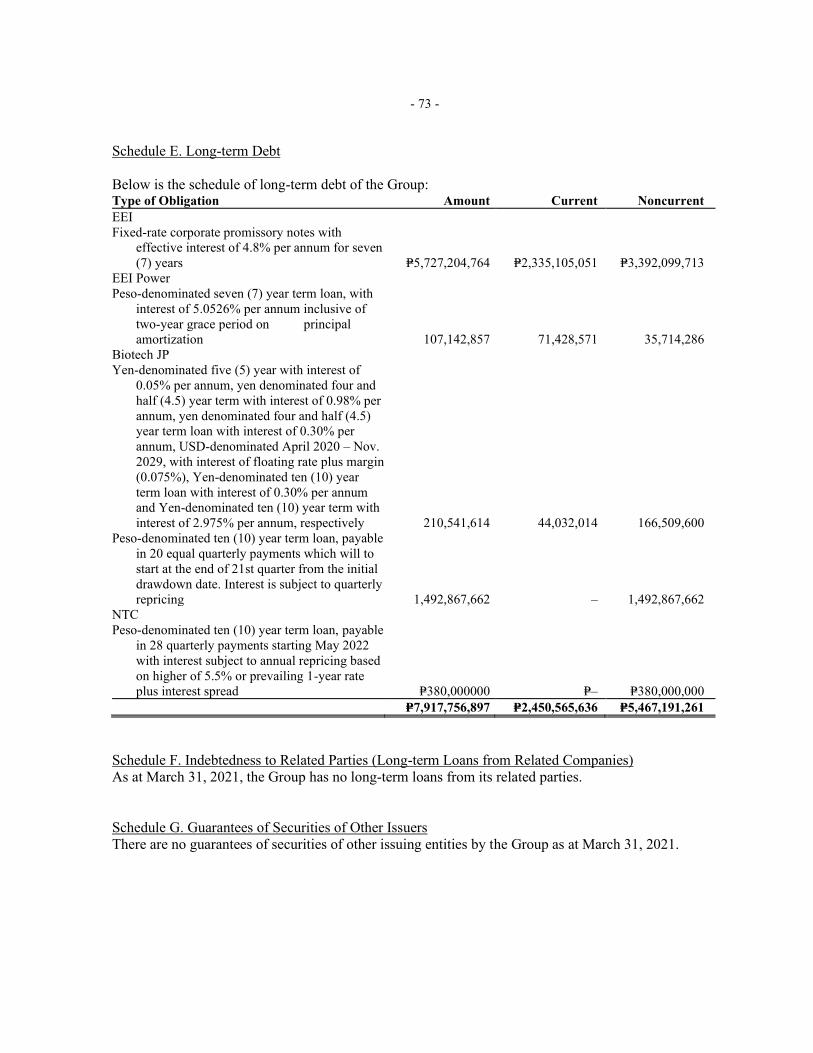
- 73 -
Schedule E. Long-term Debt Below is the schedule of long-term debt of the Group: Type of Obligation Amount Current Noncurrent EEI Fixed-rate corporate promissory notes with
effective interest of 4.8% per annum for seven (7) years P=5,727,204,764 P=2,335,105,051 P=3,392,099,713
EEI Power Peso-denominated seven (7) year term loan, with
interest of 5.0526% per annum inclusive of two-year grace period on principal amortization 107,142,857 71,428,571 35,714,286
Biotech JP Yen-denominated five (5) year with interest of
0.05% per annum, yen denominated four and half (4.5) year term with interest of 0.98% per annum, yen denominated four and half (4.5) year term loan with interest of 0.30% per annum, USD-denominated April 2020 – Nov. 2029, with interest of floating rate plus margin (0.075%), Yen-denominated ten (10) year term loan with interest of 0.30% per annum and Yen-denominated ten (10) year term with interest of 2.975% per annum, respectively 210,541,614 44,032,014 166,509,600
Peso-denominated ten (10) year term loan, payable in 20 equal quarterly payments which will to start at the end of 21st quarter from the initial drawdown date. Interest is subject to quarterly repricing 1,492,867,662 ‒ 1,492,867,662
NTC Peso-denominated ten (10) year term loan, payable
in 28 quarterly payments starting May 2022 with interest subject to annual repricing based on higher of 5.5% or prevailing 1-year rate plus interest spread P=380,000000 P=‒ P=380,000,000
P=7,917,756,897 P=2,450,565,636 P=5,467,191,261 Schedule F. Indebtedness to Related Parties (Long-term Loans from Related Companies) As at March 31, 2021, the Group has no long-term loans from its related parties. Schedule G. Guarantees of Securities of Other Issuers There are no guarantees of securities of other issuing entities by the Group as at March 31, 2021.

- 74 -
Schedule H. Capital Stock
Title of issue
Number of shares
authorized
Number of shares issued and
outstanding as shown under
related statement of financial
position caption
Number of shares held by related parties
Directors, Officers and
Employees Others Common shares 1,250,000,000 776,465,281 570,155,552 2,752,400 203,557,329 Preferred shares 2,500,000,000 ‒ ‒ ‒ ‒
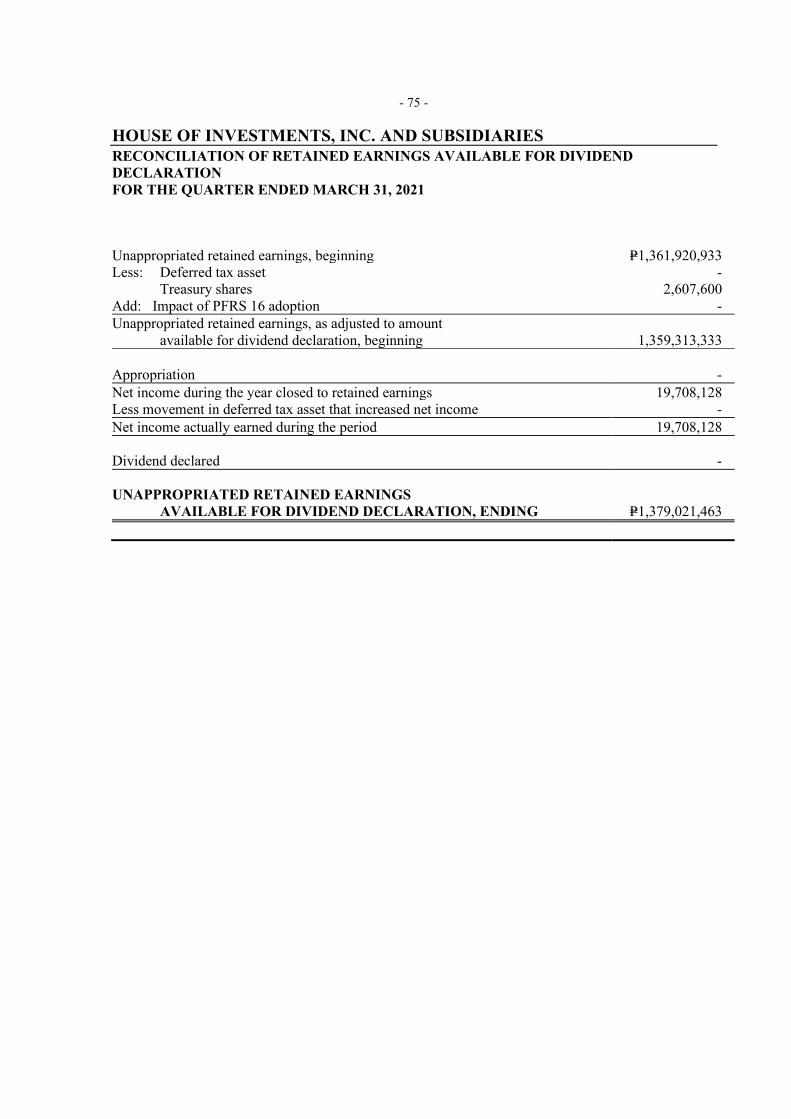
- 75 - HOUSE OF INVESTMENTS, INC. AND SUBSIDIARIES RECONCILIATION OF RETAINED EARNINGS AVAILABLE FOR DIVIDEND DECLARATION FOR THE QUARTER ENDED MARCH 31, 2021 Unappropriated retained earnings, beginning P=1,361,920,933 Less: Deferred tax asset - Treasury shares 2,607,600 Add: Impact of PFRS 16 adoption - Unappropriated retained earnings, as adjusted to amount available for dividend declaration, beginning 1,359,313,333 Appropriation - Net income during the year closed to retained earnings 19,708,128 Less movement in deferred tax asset that increased net income - Net income actually earned during the period 19,708,128
Dividend declared -
UNAPPROPRIATED RETAINED EARNINGS AVAILABLE FOR DIVIDEND DECLARATION, ENDING P=1,379,021,463

- 76 - HOUSE OF INVESTMENTS, INC. AND SUBSIDIARIES MAP OF RELATIONSHIPS OF THE COMPANIES WITHIN THE GROUP Group Structure Below is a map showing the relationship between and among the Group and its ultimate parent company, subsidiaries, and associates as of March 31, 2021:
San Lorenzo Ruiz Investment Holdings
and Services Inc. (100.00%)

- 77 -
Malayan Education System, Inc. (100.00%)
People eServe Corp.
(100.00%)
Pan Pacific Computer Center,
Inc. (100.00%)
LINC Institute, Inc. (100.00%)
AC College Enterprise and
Technology (100.00%)
Affordable Private Education Center,
Inc. (100.00%)
University of Nueva Caceres (83.62%)
National Teachers College (99.79%)
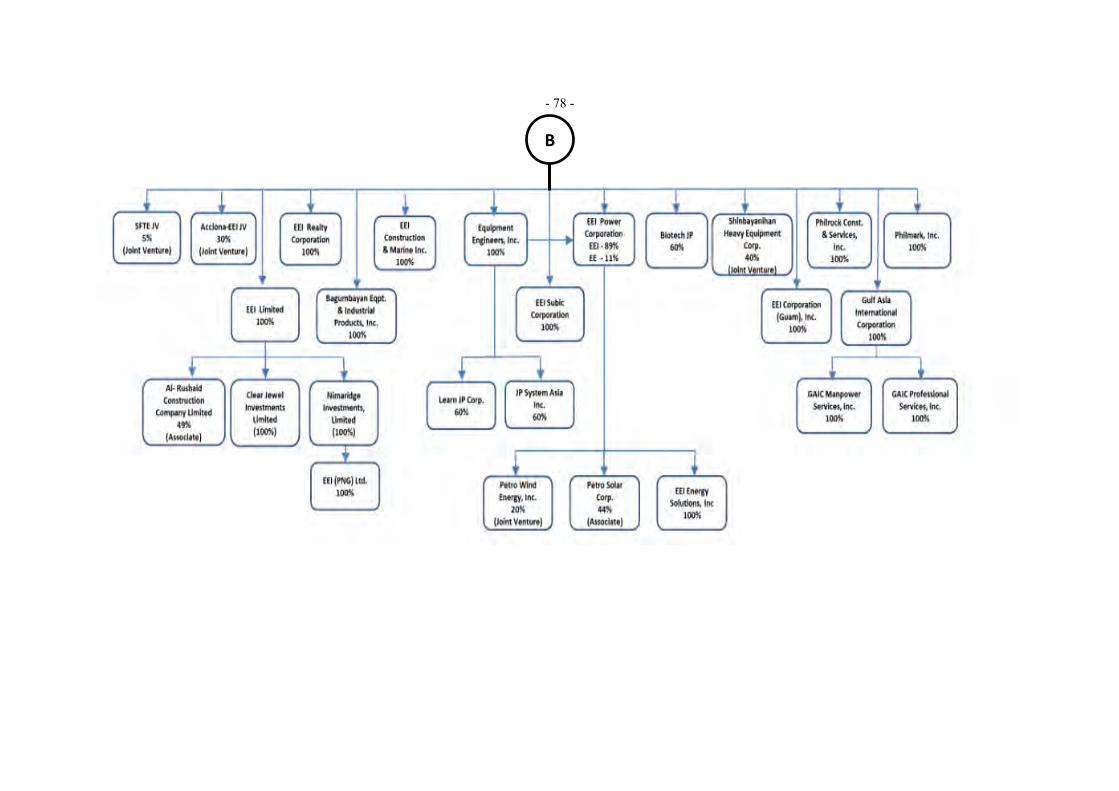
- 78 -
B

- 79 -
* In November 2019, Parent purchased additional 3 million shares resulting to an increased ownership interest from 54.36 to 54.65%. ** On February 21, 2013, significant influence was obtained through piecemeal acquisition. In 2014, the Group purchased additional 6.6 million shares of PERC increased ownership interest from 20.00% to 22.41%. In 2018, the Parent purchased additional 69,285,418 shares amounting to P332.6M from stock rights offering, which increased ownership to 28.36%. In 2019, Parent purchased additional 4.2 million shares resulting to an increased ownership to 29.10%
*** On September 17, 2013, the Group acquired 10.00% ownership in RRC. The Group was able to exercise significant influence since it has the capacity to participate in the financial and operating decisions of RRC through common key management and representation to the Board of Directors
****On November 8, 2019, the Parent purchased 2,500,000 shares of Sojitz G Auto Philippines Corporation from Sojitz Corporation amounting to P50,000,000 equivalent to 20% ownership equity.
Sojits G Auto Philippines Corporation
(20.00%)
(20.00%)****
Manila Memorial Park Cemetery, Inc.
(29.98%)
RCBC Realty Corporation***
(10.00%)
T’boli Agro-Industrial Development, Inc.
(28.47%)
Petroenergy Green Energy Resources Corp.
(10.00%)
C
Petroenergy Resources Corporation**
(29.10%)
Hi-Eisai Pharmaceuticals, Inc.
(50.00%)
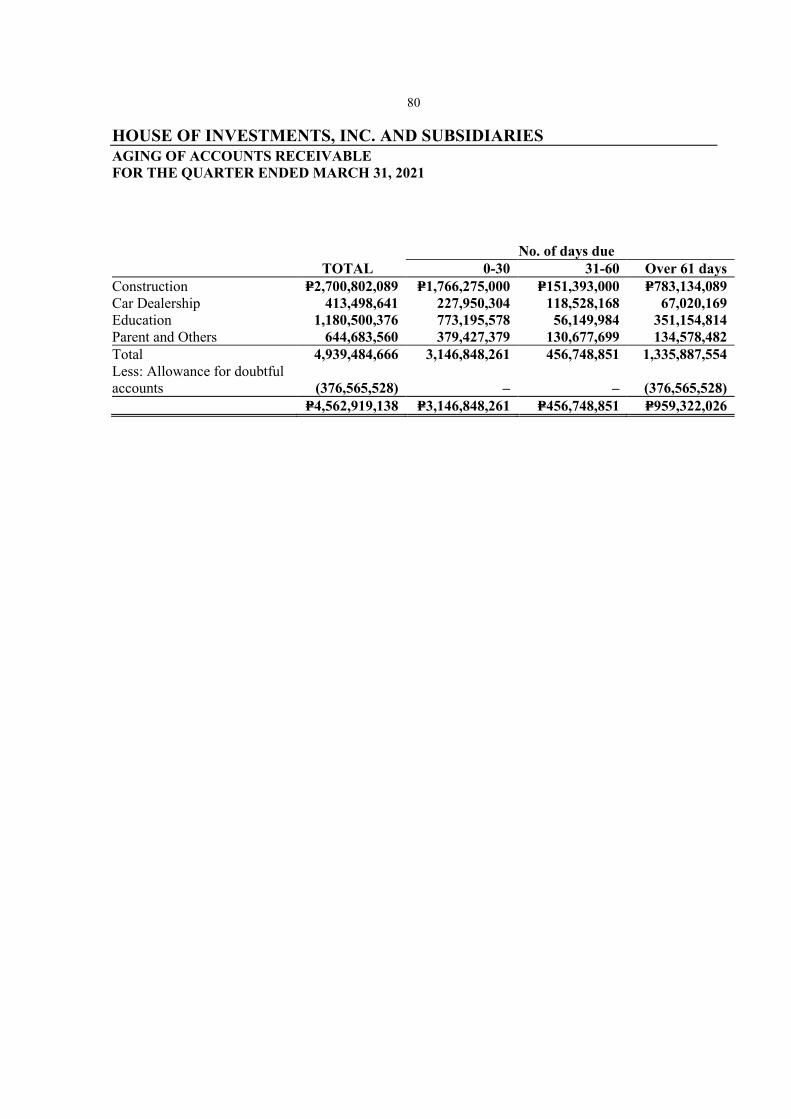
80 HOUSE OF INVESTMENTS, INC. AND SUBSIDIARIES AGING OF ACCOUNTS RECEIVABLE FOR THE QUARTER ENDED MARCH 31, 2021
No. of days due TOTAL 0-30 31-60 Over 61 days Construction P=2,700,802,089 P=1,766,275,000 P=151,393,000 P=783,134,089 Car Dealership 413,498,641 227,950,304 118,528,168 67,020,169 Education 1,180,500,376 773,195,578 56,149,984 351,154,814 Parent and Others 644,683,560 379,427,379 130,677,699 134,578,482 Total 4,939,484,666 3,146,848,261 456,748,851 1,335,887,554 Less: Allowance for doubtful accounts
(376,565,528) – –
(376,565,528)
P=4,562,919,138 P=3,146,848,261 P=456,748,851 P=959,322,026

81