hgh protein diets, weight loss and renal disease in type 2 ... · the main study was a 12 month...
TRANSCRIPT

High protein diets, weight loss,
glycaemic control and renal function in
type 2 diabetes mellitus A thesis submitted for the degree of doctor of philosophy by
Eva Pedersen
November 2011
Department of Medicine
Faculty of Health Sciences
School of Medicine
University of Adelaide

i
Table of content
Chapter 1: Literature review ............................................................................ 1
1.1 Introduction ................................................................................................ 1
1.2 Diagnosing diabetes .................................................................................. 1
1.3 Causes of type 2 diabetes ......................................................................... 3
1.4 Diabetes complications .............................................................................. 7
1.5 Renal physiology and pathology and role of dietary protein .................... 14
1.6 Weight loss diets...................................................................................... 34
1.7 Beneficial changes in body composition of high protein, weight loss diets
...................................................................................................................... 43
1.8 Effect of high dietary protein on serum lipids and glycaemic control ....... 45
1.9 Adverse effect of high dietary protein ...................................................... 49
1.10 Gastric emptying .................................................................................... 50
1.11 Conclusion on dietary intervention ......................................................... 51
1.12 Scope of this thesis ................................................................................ 52
Chapter 2: Method ......................................................................................... 53
2.1 Method ..................................................................................................... 55
2.2 Method for the Main study and CGMS sub-study .................................... 55
2.3 Continuous blood glucose measurements (CGMS) ................................. 72
2.4 Statistics .................................................................................................. 76
Chapter 3: Renal function .............................................................................. 79
3.1 Main study ............................................................................................... 81
3.2 Aim and hypothesis ................................................................................. 81
3.3 Main outcome .......................................................................................... 81
3.4 Results ..................................................................................................... 82
3.5 Renal Function......................................................................................... 88
3.6 Medication ............................................................................................... 92
3.7 Discussion ............................................................................................... 95
Chapter 4: Change in weight and body composition ..................................... 99
4.1 Weight loss and body composition ........................................................ 101
4.2 Results ................................................................................................... 101
4.3 Discussion ............................................................................................. 111

ii
Chapter 5: Changes in glycaemic control, serum lipids and blood pressure 113
5.1 Glycaemic control .................................................................................. 115
5.2 Lipids ..................................................................................................... 116
5.3 Blood pressure ...................................................................................... 120
5.4 Intention-to-treat analysis ...................................................................... 122
5.5 Discussion ............................................................................................. 124
Chapter 6: Changes in glycaemic control using CGMS (Sub-study) ........... 129
6.1 Subjects and method ............................................................................. 131
6.2 Results................................................................................................... 132
6.3 Glycaemic control: ................................................................................. 134
6.4 Correlations with change in microalbuminuria ....................................... 135
6.5 Discussion ............................................................................................. 140
Chapter 7: Study 3 ...................................................................................... 143
7.1 Study protocol ........................................................................................ 146
7.2 Results................................................................................................... 153
7.3 Pre-prandial blood glucose .................................................................... 161
7.4 Discussion ............................................................................................. 162
7.5 Conclusion ............................................................................................. 165
Chapter 8: General discussion and conclusion ........................................... 167
References ................................................................................................... 179
Appendices ................................................................................................... 197

iii
Table of tables
Table 1: Criteria for diagnosing impaired glucose metabolism and diabetes ...... 1
Table 2: Food choice template: ......................................................................... 59
Table 3: Nutrient composition ........................................................................... 60
Table 4 Variation DXA ...................................................................................... 63
Table 5 Predicted bias of eGFR compared to iGFR. ......................................... 70
Table 6 Baseline characteristics ....................................................................... 83
Table 7: Nutrient intake measured by 3 day diet record .................................... 86
Table 8: Nutrient intake expressed in percentage of total energy ..................... 87
Table 9: Changes in renal function markers between baseline and 12 month .. 94
Table 10: Weights at baseline, 4 and 12 months ............................................ 102
Table 11: Changes in body weight and body composition .............................. 106
Table 12: Changes in central, peripheral fat mass and lean body mass ......... 108
Table 13: Changes in body composition divided by sex ................................. 110
Table 14: Blood glucose changes over time ................................................... 116
Table 15: Lipids ............................................................................................... 119
Table 16: Blood pressure changes over time (mmHg) .................................... 120
Table 17: Baseline characteristics of the completers and the discontinued
participants...................................................................................................... 122
Table 18 Baseline characteristics of the 29 participants completing the CGMS
study. .............................................................................................................. 133
Table 19: AER Correlations ............................................................................ 136
Table 20: Changes in glycaemic control ......................................................... 138
Table 21: Nutrient composition of the two diets over 24 hours ....................... 151
Table 22: Breakfast meals: ............................................................................. 152
Table 23: Baseline charactaristics of the 28 completers ................................. 153
Table 24: Blood glucose excursions ............................................................... 155
Table 25: Total AUC for the 5h post meal period ............................................ 156
Table 26: Gastric emptying ............................................................................. 160
Table 27: Pre-prandial BG divided into treatment and DM_Control groups. ... 161

iv
Table of figures
Figure 1: Autoregulation of GFR ......................................................................... 9
Figure 2 Correlation between increased BMI and the relative risk of ESRD ..... 11
Figure 3: The enrolment of eligible subjects. .................................................... 57
Figure 4: Fat distribution ................................................................................... 64
Figure 5: GFR regression scatter plot ............................................................... 71
Figure 6 CGMS monitor and position of the sensor. ......................................... 73
Figure 7: Typical curve for gastric emptying in this study.................................. 74
Figure 8 Typical example of a double peaked gastric emptying curve .............. 75
Figure 9: Protein intake measured by urinary urea excretion. ........................... 85
Figure 10: Changes in Cystatin C and Serum Creatinine over time. ................. 89
Figure 11: iGFR measured by 99mTc-DTPA and estimated using the
abbreviated MDRD formula at baseline and at the end of the study. ................ 90
Figure 12: Microalbuminuria ............................................................................. 92
Figure 13: Weight change over the 12 months diet intervention. .................... 102
Figure 14: Changes in body composition as a % of total body mass .............. 105
Figure 15: Changes in serum lipids (mmol/L) ................................................. 118
Figure 16: Blood pressure change .................................................................. 121
Figure 17 Example of the AMOS analysis of missing data. ............................ 123
Figure 18: The total AUC ................................................................................ 137
Figure 19: Changes in mean BG in the HPD at baseline, 4 Mo and 12 Mo .... 139
Figure 20: Changes in mean BG in the SPD at baseline, 4 Mo and 12 Mo .... 139
Figure 21: Total area under the blood glucose curve. ..................................... 157
Figure 22: Cumulative blood glucose excursions ............................................ 158
Figure 23: Mean BG for the entire 24h period divided by DM control groups . 159
Figure 24: Blood glucose excursions after identical meals eaten at different
times of the day. ............................................................................................. 161

v
Declaration of originality
I, Eva Pedersen certify that this work contains no material which has been
submitted or accepted for the award of any other degree or diploma in any
university or other tertiary institution and to the best of my knowledge and belief,
contains no material previously published or written by another person, except
where due reference has been made in the text.
I give consent to this copy of my thesis, when deposited in the University
Library, being made available for loan and photocopying, subject to the
provisions of the Copyright Act 1968.
I also give permission for the digital version of my thesis to be made available
on the web, via University’s digital research repository, the Library catalogue
and also through web search engines, unless permission has been granted by
the University to restrict access for a period of time.
Signed............................................ Date.................................

vi
Acknowledgements
I would like to sincerely thank my supervisor Professor Peter Clifton for giving
me the chance to pursue this challenging but rewarding project. Thank you for
always being there and for your encouragement, motivation and patience.
Thank you to my supervisors Professors Manny Noakes and Gary Wittert for
your support throughout my candidature.
I would also like to thank Ass Prof Jennifer Keogh for your friendship and fruitful
conversations.
This thesis would not have been possible without the help of the volunteers,
clinic staff: Julia Weaver, Lindy Lawson, Rosemary McArthur, Pennie Taylor,
Xenia Cleanthous and David Jesudason for their assistance with project
management, taking blood samples and assisting with dietary counselling, and
for your friendship, I am deeply grateful. Thank you to Kylie Lange for patiently
guiding me through the statistical challenge. I also thank Vanessa Russell for
analysis of samples and with helping me understand the analysis methods.
Thank you to Kathryn Bastiaans for teaching me how to manage the huge
amount of data in a rational way. A special thanks to Karma Pearce for sharing
your knowledge of CGMS with me and for your support.
I am indebted to Dr Erin Symonds for guiding me through and helping me make
sense of the gastric emptying study, your help was patiently and selflessly
given. Thank you to the Centre for Paediatric and Adolescent Gastroenterology,
Women and Children’s hospital for analyzing the GE breath-tests.
Thank you to my fellow students Carly Moores, Razinah Sharif, Penelope Main,
Kacie Dickinson and to Dr Sasja Beestra-Hill for your support and for listening
to me when I needed it.
Thank you to friends and family who patiently supported me and most of all
thank you to Kim, Mette and Marc for being interested and for your ongoing
support.
Most importantly, thank you Steen for believing in me and pushing me forward
even when it meant putting “life” on hold. Thank you for showing such pride in
me, that means a lot.
I acknowledge the scholarship from The Centre of Clinical Research Excellence
for funding my tuition and the acute study.

vii
Abbreviations
ACCORD The Action to Control Cardiovascular Risk in Diabetes
ACE Angiotensin Converting Enzyme
ACEi Angiotensin Converting Enzyme inhibitor
AER Albumin Excretion Rate
AFM Abdominal Fat Mass
Alb/cr Albumin to creatinine ratio
ANCOVA ANalysis Of COVAriance between groups
ANOVA ANalysis Of VAriance between groups
ARB ATII Receptor Blocker
ATII Angiotensin II
ATP Adenosine Triphosphate
AUC Area Under the Curve
BF Body Fat
BG Blood Glucose
BMI Body Mass Index
BMR Basal Metabolic Rate
BP Blood Pressure
BW Body Weight
CCK CholeCystoKinin
CHO Carbohydrate
CKD Chronic Kidney Disease
Cr Creatinine
CrCl Creatinine Clearance
CRF Chronic Renal Failure
Da Qing The Da Qing IGT and Diabetes Study

viii
DBP Diastolic Blood Pressure
DCCT The Diabetes Control and Complication Trial
DECODE
Diabetes Epidemiology: COllaborative analysis of
Diagnostic criteria in Europe
DXA Dual-Energy X-ray Absorptiometry
DITE Diet Induced Thermic Effect
DOB Date of birth
eGFR estimated GFR
ESRD End Stage Renal Disease
FBG Fasting Blood Glucose
FFM Fat Free Mass
FFQ Food Frequency Questionnaire
GE Gastric Emptying
GFR Glomerular Filtration Rate
GI Glycaemic index
GLP1 Glucagon Like Peptide 1
Gmax Peak BG
HbA1c Glycated haemoglobin A1c
HCLF High Carbohydrate, Low fat diets
HDL High Density Lipoprotein
HPD High Protein Diet
HR Hazard Ratio
IBW Ideal Body Weight
IDF International Diabetes Federation
IGF Impaired Fasting blood Glucose
iGFR isotope tracer GFR

ix
IGT Impaired Glucose Tolerance
IHD Ischemic Heart Disease
KD Kidney Disease
KDOQI Kidney Disease Outcomes Quality Initiative
kJ kilo Joule
LBM Lean Body Mass
LDL Low Density Lipoproteins
Look AHEAD The Action for HEAlth and Diabetes
LPD Low Protein Diet
LPh Low Phosphorus
MAP Mean Arterial Pressure
MDRD Modification of Diet in renal disease
MI Myocardial Infarction
Mo Month
MUFA Monounsaturated Fatty Acids
NHANES The National Health and Nutrition Examination Survey
NOCHO No Carbohydrate
OGTT Oral Glucose Tolerance Test
OR Odds Ratio
PA Physical Activity
PPG PostPrandial blood Glucose
PREVEND The Prevention iof Renal and Vascular End Stage Disease
PUFA Polyunsaturated Fatty Acids
RAAS Renin-Angiotensin Aldosterone System
RCT Randomized Controlled Trials
REE Resting Energy Expenditure

x
RENAAL Reduction of Endpoints in NIDDM with the AII Antagonist
Losartan
RMR Resting Metabolic Rate
RR Relative Risk
SAFA Saturated Fatty Acids
SBP Systolic Blood Pressure
sLPD supplemented (with keto acids) LPD
SNGFR Single Nephron Glomerular Filtration Rate
SPD Standard Protein Diet
sVLPD supplemented Very Low Protein Diet
T>10 Time spent with a BG above 10 mmol/L
T1DM Type 1 Diabetes Mellitus
T2DM Type 2 Diabetes Mellitus
T-Chol Total Cholesterol
TE Total Energy
TEE Total Energy Expenditure
TG TriGlycerides
Tx Time
UKPDS United Kingdom Prospective Diabetes Study
UPD Usual Protein Diet
USRDS The United States Renal Data System Coordinating Centre
UUE Urinary Urea Excretion
VAS Visual Analogue Scale
VLPD Very Low Protein Diets
WHO World Health Organization
xi
Abstract
The evidence for the efficacy of weight loss diets with a higher protein to
carbohydrate (CHO) ratio has increased. However, the long-term effect of
higher protein diets (HPD) on renal function in individuals with type 2 diabetes is
lacking.
The studies in this thesis focus on the effect of altering the macronutrient
composition towards a higher protein to carbohydrate ratio on renal function,
HbA1c and lipids in individuals with type 2 diabetes mellitus (T2DM) and
microalbuminuria.
The main study was a 12 month randomized weight loss study in 56 volunteers.
A 6 MJ high protein diet (HPD: protein 30% total energy (TE) equal to 90-
120g/d, carbohydrate [CHO] 40%TE, fat 30%TE) was contrasted with a 6 MJ
standard protein diet (SPD: protein 20%TE equal to 55-70g/d, CHO 50%TE, fat
30%TE).
This study showed a significant decrease in weight (-10.5kg HPD and -7.5kg
SPD), fat mass (-9% HPD and -8% SPD) and increased fat free mass (+6% in
both groups) with no significant difference between diets.
Renal function, measured as isotope GFR, calculated GFR and serum cystatin
C, was unaffected by either diet. Microalbuminuria was reduced in HPD (AER: -
12.0±9.1 µg/min and + 1.0±17.0 µg/min in SPD) with a borderline significant
treatment effect after adjustment for baseline values (p=0.059). Glycaemic
control (HbA1c -0.9 HPD and -0.5 SPD), high density lipoprotein cholesterol (+
0.1 mmol/L in both groups), and triglycerides (HPD -0.8 and SPD -0.5mmol/L),
improved similarly in both groups. There was a decreased diastolic BP in the
HPD group (-2.5 mmHg) and an increase in SPD ( +5.2 mmHg; p=0.03).
The major contributor to diabetes nephropathy is hyperglycaemia. In study 2 (a
sub-study to the main study) and study 3, a short term meal intervention study,
we investigated the effect of changing macronutrient composition and CHO
timing on glycaemic control using a continuous glucose monitoring system.
These studies showed a significant decrease in time spent with blood glucose
(BG) above 10 mmol/L, maximal BG level and area under the BG curve
indicating an overall beneficial effect of altering the CHO to protein ratio on

xii
glycaemic control. Changing the CHO content of breakfast had no effect on
lunch glucose levels.
In conclusion:
This study is the first to examine the long-term efficacy and safety of higher
protein diets in individuals with T2DM and microalbuminuria. Both diets had
positive effects on cardiovascular risk factors with no changes in renal function.

Chapter 1: Literature review


1
1.1 Introduction
1.1.1 Diabetes types
There are two main types of diabetes, Type 1 diabetes (T1DM) which is
characterized by a lack of insulin production resulting in an absolute
requirement for treatment with exogenous administered insulin. Of the total
diabetes population T1DM accounts for 10-15% [1].
Type 2 diabetes (T2DM) which is characterized by an insulin resistance and
insulin insufficiency is related to obesity and sedentary lifestyle with a strong
genetic factor. T2DM accounts for 85-90 % of all cases of diabetes [1].
The focus of this thesis will be type 2 diabetes mellitus.
1.2 Diagnosing diabetes
The current criteria for diagnosing impaired glucose metabolism and frank
diabetes was published in a report of the WHO and IDF consultation in 2006. In
this report both fasting blood glucose (FBG) and two hours venous plasma
glucose (PPG), after an oral glucose tolerance test (OGTT), using a 75g oral
glucose load, was used. In the impaired fasting blood glucose (IFG) category,
the 2h OGTT is important as diabetes cannot be excluded if only fasting blood
glucose (FBG) is known [2].
Table 1: Criteria for diagnosing impaired glucose metabolism and diabetes
Fasting glucose
2h postprandial glucose
Impaired fasting glucose (IFG) 6.1–6.9 mmol/L And < 7.8 mmol/L Impaired glucose tolerance
(IGT) < 7.0 mmol/L And ≥7.8 and <11.0 mmol/L
Diabetes (DM) ≥ 7.0 mmol/L Or ≥ 11.1 mmol/L

2
The basis of these cut-off criteria are the increased risk of microvascular
complications seen beyond these values. Macrovascular disease is increased
to the same degree in IFG and IGT as in frank diabetes.
1.2.1Prevalence
Diabetes is now considered one of the main causes of morbidity and mortality
worldwide. Currently an estimated 347 million (314-382) are diagnosed with
diabetes. This result was published recently in a report using data from health
examiners surveys and epidemiologic studies published between 1980 and
2008. This survey included data from 2.7 million participants over the age of 25
years from 199 countries [3]. It was reported that the highest increase in FBG
over the 28 year period was seen in Oceania, where a rise of 0.2-0.3 mmol/L
per decade was observed. This trend was attributed to the increase in BMI as a
correlation between changes in BMI and increases in FBG was 0.71 for women
and 0.57 for men [3]. In Australia >700,000 (3.6%) were diagnosed with
diabetes in 2004-05. Newer data from the National health surveys and the
national diabetes service scheme (surveys conducted in 2007-08) report the
diagnosed number of diabetics to be 818,200 and 945,746 respectively [4, 5]. It
was estimated that 1.23 million people in Australia had diabetes in 2010 [6].
Untreated or uncontrolled T2DM can lead to serious complications i.e.
cardiovascular disease, neuropathy, retinopathy and nephropathy [7].
In 2003 diabetes and diabetes related complications were responsible for 8% of
the total burden of disease in Australia. In 2005 diabetes was directly
responsible for 3% of all deaths in Australia and contributed together with the
aforementioned complications to 6% of all deaths [8].
1.2.2 Economic implications
The direct cost of diabetes was estimated at $116 billion in the United states in
2007 [9]. In Australia the annual direct cost of T2DM was estimated at $2.2
billion in 2003 [10].

3
1.3 Causes of type 2 diabetes
1.3.1 Non modifiable causes
The genetic predisposition together with age (where people aged above 60
years had the highest prevalence of diabetes (15.1%)) and ethnicity are the
main non-modifiable causes of diabetes.
There are strong familial links in T2DM [11]. The National Health and Nutrition
examination survey (NHANES) 1999-2002 showed that subjects with a family
history of T2DM, defined as having an affected first degree relative (parent or
sibling), had an increased prevalence of diabetes of 14.3% compared to
subjects with no family history (3.2%). An increased risk was found with an
increasing number of relatives with diabetes. In the model adjusted for sex, age,
race, income and BMI, the odds ratio (OR) for type 2 DM with one parent
affected by diabetes was 3.0. If both parents were affected the OR was 7.0.
Likewise with siblings; if one sibling had diabetes the OR was 3.5. Having three
or more relatives affected by diabetes increases the OR to 14.8 [11].
The prevalence of diabetes increases with age. The highest prevalence is found
in people between the age of 60 and 80 years old, with a prevalence of 15.1%
in subjects >60 years compared with people between 20 and 59 years old [11,
12].
1.3.2 Modifiable causes
Obesity is the single most powerful predictive factor for the development of
diabetes. It is estimated that approximately 80 % of all T2DM patients are
overweight or obese [12]. The risk of developing T2DM has been found to
increase by 20% for each 1 kg/m2 increase in BMI, in persons with a BMI above
27 kg/m2, compared to those with normal weight (i.e. BMI of 25 or less). A BMI
above 27 but below 29 kg/m2 is associated with an increased risk of diabetes of
100% and a BMI above 29 kg/m2 increases the risk by 300% [13].
Numerous intervention studies have shown that intensive intervention with diet
high in dietary fibre and low in saturated fat (SAFA) and increased exercise can
decrease the risk of diabetes by as much as 58% in high risk groups (subjects
with impaired glucose tolerance (IGT)) [14-17]. In the Nurses Health Study it

4
was concluded that approximately 50% of women with a BMI in the normal to
overweight range (BMI 25 -29.9), could have prevented diabetes from occurring
by adhering to healthy lifestyle advice (weight loss, increased dietary fibre,
SAFA, regular exercise and abstaining from smoking) and it appears that weight
reduction exerts the greatest benefit [18].
In the baseline evaluation of food intake in the Action for Health in Diabetes
(Look AHEAD) study, the food intake of 2757 T2DM patients was assessed
using food frequency questionnaires (FFQ). This survey showed that 93% had a
fat intake greater than recommended, 85% had too much SAFA and 92%
exceeded the recommendation for sodium. The recommended servings for fruit,
vegetables, wholegrain and milk products were met by only 50% of the
participants [19]. These data in T2DM is in line with nutrient consumption in the
general population where >90% of the studied population (16338 individuals
aged 2 years and above) in the NHANES (2001-2004) were found to consume
too much solid fat, sugar and alcohol, compared with the estimated maximum
energy allowance [20].
These lifestyle choices were shown to increase the risk of chronic kidney
disease in a cohort of more than 9000 adults in the NHANES II study. Alcohol
consumption did not seem to be associated with CKD in this survey [21]
A modest reduction in salt consumption has been linked to a decrease in blood
pressure and a decreased albumin excretion. He et al found a significant 11%
reduction in albumin excretion between added salt tablets and placebo in a
cross over study in mild hypertensive. Additionally, the albumin to creatinine
ratio decreased significantly (0.81 to 0.66 mg/mmol, p=0.001) [22].
Sedentary lifestyle, now common in industrialized countries, is a contributing
factor to the increasing prevalence of obesity and T2DM.
In the Da Qing IGT and diabetes study (Da Qing) 577 men and women with IGT
were randomized to one of four groups and followed for 6 years. The main
outcome was the incidence of T2DM. Participants were divided into the
following groups:
1. Diet alone: Dietary recommendations where energy intake was aimed at
achieving or maintaining a BMI <25 kg/m2. The recommendations for the dietary

5
intake was 105-126 kJ/kg if within normal BMI range, for the overweight and
obese kJ were reduced to produce a weight loss of 0.5-1.0 kg/week until a BMI
of 23 kg/m2 was reached. The nutrient composition was: carbohydrate 55-65 %
total energy (TE), protein 10-15 %TE and fat 25-30 %TE. Lifestyle advice was
given at regular follow up visits.
2. Exercise alone: Recommendations for the exercise group was at least one
unit per day added to the usual leisure activities if aged more than 50 years and
2 units if aged below 50 years. One unit of added exercise was 30 minutes of
mild exercise (like slow walking, taking the bus, shopping or housekeeping); 20
minutes of moderate exercise (faster walking, walking down stairs, cycling, slow
ballroom dancing); 10 minutes of strenuous exercise (jogging, climbing stairs,
faster dancing, playing volleyball or tennis) or 5 minutes of very strenuous
exercise (jumping rope, playing basketball or swimming). Lifestyle advice was
given at regular follow up visits.
3. Diet and exercise: The combined group was recommended both the diet and
exercise interventions with regular follow up visits.
4. Control: The control group had general lifestyle recommendations explained
and were handed a brochure, but no individual counselling as in the three other
groups was given.
At the end of the six year follow up period ≈ 68% in the control group had
developed T2DM. The group with combined diet and exercise advice had an
incidence of T2DM of ≈ 46%. In the diet alone group ≈44% had developed
T2DM. The incidence of diabetes was lower in the exercise alone group (41%).
Comparing the intervention groups to the control group there was a significantly
lower incidence of T2DM with a 33% reduction in the diet alone group p=0.03;
38 % reduction in the diet and exercise group p<0.01 and 47% reduction in the
exercise alone group p<0.01, however, comparing the three intervention groups
to each other there was no significant difference. [23]. The exercise
requirements were very moderate: participants were asked to perform one to
two units of exercise per day depending of age. The number of exercise units
performed in the exercise alone group was significantly higher than in the
control group (4.0±3.0 vs. 2.5±1.9 units; p<0.05). Units of exercise performed in
the diet alone group was 1.7±1.9 units, this was not significantly different from

6
control or baseline. At the end of six years follow up exercise units in the
combined diet and exercise group had increased significantly compared to
baseline (3.9±2.3 units; p<0.05). This study show even very moderate changes
in lifestyle have a great effect on the prevention of the progression from IGT to
T2DM [17].
Physical exercise have also been linked to a lowering of albumin excretion in
non-diabetic women [24] and in patients with hypertension [25]. In the NHANES
ll survey it was reported that sedentary lifestyle increased the risk of chronic
kidney disease ( CKD ) by 2.2 and a more moderate exercise habit increased
the risk by only 1.2 compared to persons with high level of physical exercise
[21].
Smoking has been shown to increase the risk of T2DM [26]. The pooled data
from a meta-analysis conducted in 1.2 million non diabetic participants from 25
prospective studies, a total of 45,844 persons were diagnosed with diabetes
during follow up ranging from 6-30 years. The risk of developing T2DM
increases in a dose dependent manner. In the total sample (pooled data) the
relative risk was 1.44 (1.31-1.58). The risk of developing T2DM was highest in
persons smoking more the 20 cigarettes per day = 1.61 (1.43-1.80) and lower in
people smoking less than 20/day = 1.29 (1.13-1.48). The relative risk of
diabetes decreases with smoking cessation to 1.23 (1.14-1.33), however, it was
shown in a study investigating the association between smoking and diabetes
risk in 10,892 middle aged adults [27] that the relative risk of T2DM rose to 1.73
(1.19-2.53) in the initial period after cessation, the authors attribute this
increased risk to the weight gain often seen in “new quitters” [27].
Smoking increases the risk of myocardial infarction (MI) and stroke by 2-5 times
compared to non-smokers in both diabetic and non diabetic people [28].
In data from the second national health and nutrition examination survey
(NHANES ll) where 9082 individuals were followed for 12-16 years smoking
was found to increase the relative risk of chronic kidney disease by 1.2 in
persons smoking less than 20 cigarettes per day and by 2.3 in smokers who
smoked more than 20 cigarettes per day. This is in agreement with the
increased risk of CKD in T2DM smoking more than 20 cigarettes /day (RR= 1.4
(0.3-7.4)) [21].

7
1.4 Diabetes complications
1.4.1 Macrovascular complications
Both micro- and macrovascular complications have been attributed to
hyperglycaemia associated with diabetes. In the United Kingdom prospective
diabetes study (UKPDS 35) cardiovascular and cerebrovascular complications
accounted for 50 to 60% all deaths in this group [29]. In a cross sectional
observation analysis the risk of myocardial infarction decreased by 14%, the
risk of stroke decreased by 12% and the risk of heart failure decrease by 16%
for every 1% lower HbA1c. Furthermore, the decrease in microvascular
complications was 37% for every 1% lower HbA1c and finally the risk of
amputation is also decreased by 43% with 1% lower HbA1c [29].
1.4.2 Retinopathy
Early retinopathy is caused by an altered autoregulation of the capillary blood
pressure, resulting in increased pressure and thereby increased perfusion [30].
The earliest signs are saccular out pouching of the capillary wall. Macular
oedema results in thickening of the macula leading to blurred vision. Abnormal
formation of new blood vessels poses an increased risk of haemorrhage,
scarring, retinal detachment and severely impaired vision [31].
The main causes of diabetic retinopathy are hyperglycaemia, hyperlipidaemia
and hypertension, where hyperglycaemia is the major contributor [31]. The
progression of diabetic retinopathy depends on diabetes duration. In T2DM
approximately 23% have retinopathy after 11-13 years of diabetes and after 16
years the prevalence is 41% [31].
In the action to control cardiovascular risk in diabetes (ACCORD) eye sub-study
2856 participants with retinopathy were followed for four years. The aim of the
ACCORD study was to determine the effect of intensive treatment strategies for
lowering blood glucose (HbA1c <6% in the treatment group and between 7 to
7.9% in the control group), blood lipids (simvastatin plus fenofibrate vs.
simvastatin and placebo in the treatment and control groups respectively) and
blood pressure (systolic blood pressure <120 mmHg in treatment group and
<140 mmHg in control) in T2DM with cardiovascular risk factors. After four
years of intensive treatment, retinopathy progressed by 7.3% in the intensive

8
glucose treatment group and by 10.4% in the control group. In the group treated
with the addition of fenofibrate for lipid reduction the progression was 6.5% vs.
10.2% in control. However, the ACCORD eye study did not find a beneficial
effect of lowering systolic blood pressure (progression in treatment group was
8.8% vs. control group of 10.4%). These results show that intensive treatment
of hyperglycaemia and hyperlipidaemia reduce the progression of diabetic
retinopathy while intensive control of systolic blood pressure does not [32].
1.4.3 Neuropathy
Hyperglycaemia can cause neural damage if it persists. Unlike muscle tissue
the neurons are dependent on extracellular glucose level and are independent
of insulin action. Neurons are sensitive to the glucose level and depend on a
relative stable interstitial glucose. Persistently high glucose levels are
neurotoxic and result in the loss of protective fine touch, temperature and pain
sensation initially in the feet which can contribute to foot ulcers [33]. The most
common types of neuropathy in diabetes are peripheral, autonomic and focal
neuropathy. Autonomic neuropathy affects nerves to the internal organs
affecting the heart, digestive system, bladder, sexual function and sweat
production. Focal neuropathy affects the eyes, limb and facial muscles and
hearing [34]. The main treatment for diabetic neuropathy is tight control of blood
glucose.
1.4.4 Nephropathy
1.4.4.1 Normal haemodynamic autoregulation of glomerular filtration rate
(GFR)
Normal auto-regulation of the renal vascular system is a protective measure
whereby the kidney can maintain a stable function in the face of altered blood
pressure. Blood flow to the kidney and GFR will be kept relatively stable, by
vasoconstriction of the afferent arteriola, when arterial blood pressure is varying
between 75 and 180 mmHg [35-37]. The threshold for auto-regulation to fail is
not well known in humans and will depend on the suddenness and speed of the
BP change [36, 37]

9
Figure 1: Autoregulation of GFR
The normal autoregulation of GFR under increasing BP. It is shown that GFR
remains stable within the range of 80 to 160mmHg, as the upper threshold is
reached GFR increases rapidly.
In the kidney hydrostatic pressure is kept within a narrow range. This is
regulated by myogenic reflexes on the afferent arteriola and the
tubuloglomerular feedback. In the case of increased hydrostatic blood pressure,
the afferent arteriola constricts within seconds to limit increased pressure in the
glomerular capillaries. As the hydrostatic pressure falls the afferent arteriola
relaxes, thus restoring flow through the glomerulus [36].
In the case of decreased hydrostatic blood pressure renin activity increases,
and increases sodium reabsorption via the renin-angiotensin aldosterone
system (RAAS). Renin is an enzyme excreted from the juxtaglomerular cells at
the afferent arteriole. Renin acts on angiotensin to form angiotensin l (Al) a
virtually inactive protein which is then deaminated by angiotensin converting
enzyme (ACE) produced in the endothelium to form angiotensin ll (All).
Angiotensin ll acts as a vasoconstrictor supporting the myogenic reflex [36].
1.4.4.2 Major risk factors for nephropathy
1.4.4.2.1 Obesity and renal function
Obesity is an increasing problem affecting millions of people worldwide. Obesity
is defined as a body mass index (BMI) >30 kg/m2, overweight is defined as a
Mean arterial pressure (mmHg) 75 120 180
GFR
(m
l/min
)
Renal autoregulation

10
BMI between 25 and 29.99 kg/m2 and the normal weight range is defined as a
BMI between 18.8 and 24.99 kg/m2 [38]. Obesity is now recognised as an
independent risk factor for kidney disease (KD) independently of other risk
factors such as age, sex, ethnicity, smoking, alcohol, diabetes mellitus,
dyslipidemia and hypertension [39]. In industrialized countries an estimated
13.8% of obese men and 24.9% of obese women, have obesity related kidney
disease [39]. Moreover, obesity exacerbates KD from other causes compared to
normal weight controls [40].
Additionally obesity is a driving force in the increasing incidence of hypertension
and T2DM [39] and significantly increases morbidity and mortality [41]. In a
review assessing the epidemiologic literature on the relationship between
obesity and KD, Wang et al found a strong association between BMI and KD.
Furthermore, they reported a “dose-response” association where a BMI ≥ 25
kg/m2 was associated with an increased risk of KD of 40 %, whereas a BMI
above 30 kg/m2 predicted an 80 % increased risk of KD [39].
Similarly Hsu et al investigating 320,252 adults who participated in a health
check between 1964 and 1985, reported a seven fold increase in relative risk of
end stage renal disease (ESRD) between BMI ≤25 and ≥40.Baseline BMI
remained an independent risk factor even after adjusting for the occurrence of
hypertension and diabetes [42].
The same association was found between microalbuminuria and BMI in T2DM
in the Look AHEAD (action for health in diabetes) study [43]. An increase in BMI
has been shown to increase filtration rate even in participants with normal BMI
[44].

11
Figure 2 Correlation between increased BMI and the relative risk of ESRD
Hsu, C.Y., et al., Body mass index and risk for end-stage renal disease. Ann Intern Med, 2006.
144(1): p. 21-8. [42]
1.4.4.2.2 Fat mass distribution
Obesity is related to albuminuria in humans and an abdominal fat distribution
has been shown to increase the risk [40, 43]. Some studies have shown that
there is a difference in the fat distribution and risk of KD between men and
women. For men it seems that the hip circumference is an important predictor
and in women the general obesity is the important factor [39, 44].
In a sub-analysis of the prevention of renal and vascular end stage disease
(PREVEND) study, investigating 8050 subjects from the general population,
where 24h urine was collected for analysis of albumin excretion rate (AER), it
was reported that 6.6% of the subjects in the “healthy” population without
diabetes or hypertension had microalbuminuria. Subjects were divided into BMI
groups. Microalbuminuria was present in 9.5% of men and 6.6% of women in
the normal weight group, 18.3% of men and 9.2% of women in the overweight
group and 29.3% of men and 16.0% of women in the obese group [45]. An
interaction between BMI and sex was shown so that men had a steeper rise in
AER with increasing BMI compared to women indicating an increased risk of
KD in abdominal obesity characteristic for men[46].

12
1.4.5 Prevention and treatment of diabetes related complications
Large prospective intervention studies have shown that intensive blood glucose
treatment and continued diabetes education have a beneficial effect on diabetes
related complications. In the Diabetes Control and Complication Trial (DCCT),
1441 T1DM patients were randomly assigned to two groups. One group
received intensive insulin therapy with multiple daily injections or continuous
insulin pump treatment. The second group acted as a control group, continuing
on the conventional therapy (once or twice a day insulin injections). Patients in
the intensive treatment group had additional monthly visits at the clinic for
education in lifestyle changes. There was a long follow-up period of 6.5 years.
The aim of the intervention was to achieve tight overall glycaemic control, with
pre-prandial blood glucose between 4 and 7mmol/L and postprandial blood
glucose no higher than 10mmol/L. The results of the intensive treatment were
convincingly strong and the overall risk of diabetes related complications
decreased by between 35% and 70%. The risk of microalbuminuria and
albuminuria associated with renal disease was reduced by 54% and 39%
respectively [47].
The United Kingdom Prospective Diabetes Study (UKPDS) recruited 3867
newly diagnosed type 2 diabetic patients and investigated the effect of intensive
nutritional and medical (tablet or insulin) treatment on the risk of developing
diabetes related complications. As in the DCCT, patients were randomly
assigned to a treatment group or control group. The treatment aim in the
intensively treated group was a pre-prandial blood glucose ≤6 mmol/L.
Furthermore, the intensive treated group received additional life style education
during monthly visits to the clinic. The control group remained on the
conventional treatment (diet and oral agents), together with the usual life style
education. The aim for blood glucose control in this group was fasting plasma
glucose (FBG) <15 mmol/L. In the control group, FBG and HbA1c increased
during the course of the study. In the intensively treated group FBG and HbA1c
decreased slightly in the first year of treatment, but increased similarly to the
control group thereafter. A mean difference in HbA1c remained over the 10
years of follow-up, with an HbA1c of 7.0mmol/l vs. 7.9mmol/L in the intensively
treated group and the control group respectively. After 10 years of follow-up, a
significant (12%) reduction in the risk of any diabetes related complication and a

13
substantial (25%) reduction in urinary albumin excretion was seen in the
intensively treated group compared to the control group [48].
3277 participants from the study were followed for an additional 10 years post
trial. The first five years the participants visited the UKPDS study clinics, where
standard outcome measures were collected the same way as during the study.
Participants who were unable to attend the clinic visits, and all surviving
participants from the sixth to the tenth year post trial, were asked to fill out a
questionnaire. After one year post trial the differences in HbA1c achieved during
the study were lost, but the benefits persisted ten years after cessation of the
study. The reduction of microvascular complications of 25% seen in the
sulfonylurea-Insulin intensively treated group was sustained through the post
study follow up period. During the post trial period a significant reduction in
myocardial infarction (MI) of 15% was seen (p=0.01) and the risk of death from
all causes was reduced by 13% post trial (p=0.007). These outcome measures
did not reach statistical significance during the study [49]. In the group of obese
participants assigned to treatment with metformin there was a significant
reduction in the risk of MI (39%, p=0.01) and for all cause deaths (36%, p=0.01)
during the study. This effect was sustained throughout the post study period
[49]
It is therefore clear that lowering FBG and HbA1c in diabetic patients is
beneficial in lowering the risk of diabetes related complications such as diabetic
nephropathy.
Population-based studies have shown a relation between postprandial glucose
(PPG) and the incidence of myocardial infarction (MI) and all cause mortality in
type 2 diabetic patients [50, 51]. Surprisingly, it was shown that the higher risk
of MI in poorly controlled diabetic patients was associated solely with the PPG
and had no association with fasting blood glucose (FBG) [50]. Hence, it seems
that PPG is a better predictor of the risk of morbidity and all cause mortality in
type 2 diabetes patients, independent of the fasting state.
FBG and HbA1c are currently used to diagnose diabetes and to monitor blood
glucose control in diabetes.
In patients with HbA1c <7%, PPG is contributed to a greater extent than FBG,
whereas FBG is the major contributor with increasing HbA1c [52]. Bonora et al

14
[53] investigated the relationship of blood glucose levels throughout the day and
HbA1c in type 2 diabetic patients. It was shown that subjects in good glycaemic
control according to HbA1c (<7%) and FBG <6.6 mmol/L still had high blood
glucose excursions (>2.2 mmol/L) and a high PPG (>8.9 mmol/L). These results
indicate that monitoring treatment efficacy should not be restricted to FBG and
HbA1c alone [53].
1.5 Renal physiology and pathology and role of dietary protein
Diabetic nephropathy is linked to hyperglycaemia, hyperinsulinaemia and
hypertension and the earliest sign of renal involvement is microalbuminuria [54].
Diabetes is the leading cause of ESRD worldwide [55]. In a recent report from
the United States Renal Data System Coordinating Centre (USRDS) it was
shown diabetes accounted for approximately 70% of all cases requiring renal
replacement treatment in America in 2004 [56].
The pathophysiological changes seen in early diabetic kidney disease are
thickening of the glomerular basement membrane, glomerular hypertrophy and
increased permeability, resulting in hyperfiltration and microalbuminuria [41, 57].
Hyperglycaemia is the major factor in diabetic nephropathy. In animal models
tubuloglomerular feedback is altered due to increased Na+/glucose transport
and increased sodium reabsorption. This leads to decreased electrolyte
concentration in the macula densa. The decreased electrolyte concentration
stimulates afferent vasodilatation and efferent vasoconstriction, increasing the
intra-glomerular pressure resulting in glomerulosclerosis.
Blocking the afferent vasodilatation or the RAAS mediated efferent
vasoconstriction reduces the risk of albuminuria in animal models and the same
effect is believed to occur in human [36, 58].
Abnormalities in diurnal blood pressure seen as a high night to daytime blood
pressure (non-dipping), where the nocturnal blood pressure decrease is less
than 10% is often seen in DM, and has also been reported to increase
hyperfiltration and subsequently lead to renal injury [58].
Sustained hyperfiltration from increased renal blood flow leads to increased
GFR and to microalbuminuria progressing to frank proteinuria and eventually to

15
advanced renal failure. The progression of microalbuminuria to manifest
proteinuria is associated with a fall in GFR [39, 59]. Hyperfiltration in obesity is
probably due to increased tubular sodium reabsorption resulting from increased
post glomerular oncotic pressure and increased systemic arterial pressure [60].
In addition to the obesity related hyperfiltration a cluster of metabolic and
hormonal dysfunctions are present, including insulin resistance, endothelial
dysfunction, dyslipidemia, oxidative stress, inflammation and sleep apnoea.
Lasta et al [61] reviewed the literature on the effect of the cluster of
abnormalities associated with obesity and kidney disease. They found that both
hyperinsulinaemia and insulin resistance can be found in obese subjects with
CKD who do not have diabetes. Likewise, dyslipidemia in the form of increased
triglyceride and apolipoprotein lV, in combination with decreased high density
lipoprotein (HDL) was found in patients with progressive CKD. Microalbuminuria
is a marker of endothelial dysfunction and is associated with low grade
inflammation and increased oxidative stress [61]. Adiponectin is active in
preventing albuminuria and obesity associated focal segmental
glomerulosclerosis. The low adiponectin present in obesity is associated with
glomerular oxidative stress and increased microalbuminuria [44, 62].
1.5.1 Dietary protein in diabetic nephropathy
There is evidence that high protein diets have a deleterious effect on renal
function in persons with manifest renal disease [63]. Therefore restricting
dietary protein to 0.6 g/kg or less per day has been recommended in an effort to
slow progression of diabetic renal disease. However, this recommendation is
controversial and there is no consensus about specific dietary goals for patients
with different degrees of renal Impairment. More recently there has been a shift
towards controlling protein intake to 0.75 to 1.0 g/kg per day [64].
1.5.2 How much protein do we need
Protein needs can be measured in various ways e.g. g/kg body weight, g/kg
ideal body weight, g/day or percentage of total energy intake (%TE). Most
organizations recommend a wide range of %TE as protein e.g. 10- 35 %TE [65-
67]. Likewise, the recommended protein intake for diabetics is between 15 and
20 %TE [65, 68].

16
However, this latter recommendation does not consider an individual’s body
weight or the risk of not meeting the needs in an energy restricted diet. Looking
at the dietary intake in Americans aged 1 year and older, the National Health
and Nutrition Examination Survey 2003-2004 (NHANES) found the average
protein intake to be 16.0 %TE and the highest protein intake to be 20.8 %TE,
corresponding to a median intake of 1.1 - 1.3 g/kg ideal body weight/day (g/kg
IBW/d) in adults [67].
Protein needs are dependent on lean body mass, rather than energy intake.
Hence in order to keep the protein intake constant around the recommendation
of an average of 56 g/day in energy restriction for a female, protein allowance
needs to increase by around 1 %TE when energy is decreased by 500 kJ below
8000 kJ/day (e.g. 56 g protein equals 15% TE of a 8000kJ diet, whereas in an
energy restricted diet of 5000 kJ, 56 g protein equals 19%TE) [69].
A more accurate way of calculating protein needs might be to use g/kg body
weight/day (g/kg/d). According to the National Health and Medical Research
Council (2006) the minimum requirement for protein intake is 0.84 g/kg/d in
adult men and 0.75 g/kg/d in adult women. Intake at or above this level will
minimize the risk of inadequacy [70]. In obese persons with higher lean body
mass, an adjusted body weight is sometimes used in order to avoid
overestimating the protein needs, e.g. the protein needs are calculated from an
average body mass index (BMI) of 24.9 kg/m2 [67]. There is not enough
evidence to recommend an upper level for protein intake [66]. However, obese
people may well need a higher absolute amount of protein to maintain their
increased lean body mass and an amount based on an ideal BMI of 25 may
cause loss of lean mass [71, 72].
1.5.2.1 How can we define a low and a high protein diet?
In healthy persons the average protein need seems to be 0.8 g/kg/d [63, 70]
and this does not seem to change with age [73]. Low protein diets can therefore
be described as diets containing less than 0.8 g /kg IBW/d. As the evidence for
maximum safe protein intake is lacking, no firm level for a high protein diet can
be defined. [70]. In energy restriction the aim is to maintain the same protein
intake as in energy balance thereby increasing the energy to protein percentage
to >20%TE [74].

17
1.5.3 Dietary protein and renal function
1.5.3.1 Animal studies
Brenner and his group have clearly shown that the adaptive hemodynamic
response to renal loss is detrimental to the remaining normal nephrons, with
glomerular sclerosis occurring as a result of the functional overload in the
normal glomeruli. They convincingly showed that dietary protein was directly
associated with the degree of renal injury in rat models with 80% reduction in
renal mass [75].
In the study by Hostetter (1981) three groups of rats were investigated: group I
had sham surgery and were fed the standard chow containing 24% total energy
(TE) protein, group II had their right kidney removed and 5/6 of the left kidney
injured by infarction and were fed the standard chow. Group III had the same
surgery and kidney damage as group II, but this group was fed a protein
restricted chow of 6 %TE protein. In group II single nephron glomerular filtration
rate (SNGFR) was increased compared to group I due to increases in
glomerular transcapillary hydraulic pressure and glomerular plasma flow rate. In
group III however no changes in hemodynamics compared to group I were
seen, indicating that low protein diets (LPD) ameliorate the effect of renal injury
[76]. However, 6% protein is a protein deficient diet and is not sustainable long-
term in rats or humans.
1.5.3.2 Human Studies
1.5.3.2.1 The effect of protein restriction on renal function in subjects without
diabetes
The effect of dietary protein restriction on renal function has been extensively
researched in type 1 diabetics and non-diabetic subjects [77]. Results from
these intervention studies have been inconsistent and no firm conclusions about
the effect of protein restriction on renal disease have been made.
In the earlier prospective randomized controlled studies investigating the effect
of protein restriction in patients with non-diabetic renal disease over the last
three decades, there is very little uniformity in reporting dietary protein intake,
renal function measures and trial endpoints.

18
In 1984 Rosman et al conducted the first long-term single centre prospective
randomized controlled trial (RCT) with results from 149 patients with varying
degrees of renal disease. Patients were stratified according to sex, age and
renal function measured by creatinine clearance (CrCl). Two intervention
groups (B + C) and two control groups (A1 + A2) were formed. Intervention
group B and control group A1 commenced with a baseline CrCl of 31-60
ml/min/1.73m². Intervention group C and control group A2 commenced with a
baseline CrCl of 10-30 ml/min/1.73m². Patients in group B were prescribed a
diet containing 0.6 g/kg/d of protein. In group C the dietary protein prescription
was 0.4 g/kg/d. Control groups A1 and A2 were asked to continue with their
usual protein intake, with no specific protein level stated. The participants in the
protein restricted groups had follow-up visits with a dietitian every 3 months.
Controls saw the dietitian only as required. All participants were followed for a
minimum of 18 months. The main outcome measure was the reciprocal of
serum creatinine with time (1/Cr/Mo) and renal survival using 5 – 100 %
increase in serum creatinine as criteria. A trend towards a faster progression of
renal disease in the younger group was noted. In the severely protein restricted
group (C) 24h creatinine excretion decreased significantly compared to baseline
(p<0.01) reflecting lower meat intake, whereas groups A1, A2 and B showed no
significant difference with time. Using a regression equation looking at the
reciprocal of serum creatinine with time (1/Cr/Mo) the LPD (B) decreased the
progression of renal insufficiency by a factor of 5 and the severe LPD (C)
decreased progression 3 fold compared to their respective control groups (A1,
A2), but unfortunately the difference between groups was not tested statistically.
Looking at the increase in serum creatinine using a 10-30% increase as a renal
“non-survival” criteria there was a small but significant difference between
intervention and control groups, more pronounced in group C compared to
group B [78]. The benefits of the LPD were only seen in the patients with
primary glomerulonephritis who had reduced renal mass and not in the study
population as a whole. Compliance to the diet was measured by urinary urea
excretion and the patients scored the diet as being of “fair” to “bad”
acceptability.

19
In a follow-up of the 1984 study Rosman et al (15) looked at patients with a low
or high protein excretion rates (proteinuria >1 or < 1 g/24h). It was shown that
only LPD participants with proteinuria less than 1 g/24h had a significant
improvement in the slope of CrCl (-0.19 to 0.01, p<0.005 over time); whereas
participants in the free diet and those with proteinuria greater than 1 g/24h
stowed no significant difference. The same was seen in participants with
primary glomerulonephritis and proteinuria less than 1 g/24h where the slope in
CrCl changed (-0.26 to 0.10, p<0.01 over time)[79]. In addition they reported
that 25 participants in the control group and 14 participants in the LPD group
had reached ESRD [80]. Unfortunately the authors fail to report if this difference
was statistically significant.
Another single centre study investigated 128 patients stratified according to the
underlying kidney disease, without taking the degree of renal function before
randomization into account. Participants were randomized to a LPD of 0.6 g/kg
IBW/d or to a control diet (UPD) of 1.0 g/kg IBW/d. Patients were followed for
27.1±21.8 months. The authors used a halving of creatinine clearance as the
primary endpoint. This endpoint was reached by 40% of the UPD group and
28% in the LPD group (p=0.038)[81]. The limitations in this study were, firstly,
the use of creatinine clearance as a marker of renal function. Secondly,
compliance to the LPD diet was poor and the achieved decrease in dietary
protein was 0.25 g/kg/d not 0.4 g/kg/d as planned which cast doubt on whether
the changes seen were actually due to these small differences in protein intake.
In a multi-centre study from Locatelli et al [82] 311 participants were randomly
assigned to either a UPD of 1.0 or LPD of 0.6 g/kg IBW/d. In this study
participants were followed for 2 years or until the primary endpoint was reached
(a doubling of serum creatinine from baseline). Contrary to other studies from
this period, the participants were not stratified according to the underlying
kidney disease [78, 81] rather they were stratified according to baseline plasma
creatinine concentration.
In the UPD group 42 participants reached the endpoint compared to 27 in the
LPD group, but this was only borderline significant (p=0.06). Only the LPD
group with a baseline serum creatinine between 222-442 µmol/L had a
significantly better renal survival (i.e. need for dialysis) where 10 in the LPD

20
group vs. 21 in the UPD group reached the endpoint (p=0.02) [82]. Adherence
to diet was poor in the intervention group and there was a protein
overconsumption of 39.8% as measured by 24h urea excretion. This resulted in
a difference between the two groups of 0.16 g/kg/d instead of the prescribed 0.4
g/kg/d.
In a smaller study by Ihle et al [83] 64 participants with chronic renal disease
with an entry serum creatinine of 350-1000 µmol/l were randomized to a UPD
containing at least 0.75 g/kg/d or a LPD of 0.4 g/kg/d and they were followed for
at least 18 months. In this study GFR was measured by a gold standard
method, 51Cr-EDTA clearance. GFR decreased significantly in the UPD group
by 60% (0.25±0.03 to 0.10±0.05 ml/sec) compared to a non-significant
decrease in the LPD group (0.23±0.04 to 0.20±0.05 ml/sec, p=0.01 for
difference between diets). Serum creatinine increased significantly in the UPD
group compared to the LPD group (52% vs. 16% respectively, p<0.02) so the
authors concluded that a LPD has a beneficial effect in the slowing of
progression of renal failure [83]. The limitations in this study were the lack of
blinding of the treatments as all participants were treated by the principal
investigator. There was a significant decrease in weight, lymphocyte count and
serum transferrin level in the LPD group indicating malnutrition. Participants that
were not compliant to the protein restriction were discontinued hence the
authors did not use intention-to-treat analysis which introduces bias in the
results and does not reflect the clinical reality of varying compliance.
In a two centre study of 95 patients with chronic renal failure (CRF), patients
were divided into three groups (group A= LPD + low phosphorus (LPh), Group
B= LPh, and group C= UPD). The LPD group was prescribed a 0.6 g/kg/d
together with a phosphorus restriction of 800 mg/d. The LPh group was asked
to restrict phosphorus to 1000 mg/d and protein was not restricted. Protein
intake in group C was aimed to be ≥0.8 g/kg/d. For all three diet groups the aim
for total energy intake was at least 30 Kcal/kg/d. The patients were followed for
6 months prior to randomization and 19 months follow up after randomization.
Compliance to diet, as measured by urinary urea excretion (UUE) was good
and the protein intake was 0.69±0.02, 1.02±0.05 and 1.14±0.05 g/kg/d for the
LPD, LPh and UPD groups respectively. The progression of renal failure was

21
assessed by the rate of fall in CrCl (ml/min/1.73m²/month), change in the
reciprocal of plasma creatinine over time (1/mmol/year) and dialysis or death.
The authors found no significant differences in any of the endpoints. [84].
Limitations to this study, was the use of CrCl as measure of GFR with the well
known risk of error. Furthermore, participants that were not compliant to diet
were excluded and intention-to-treat analysis was not performed.
In 1994 the largest randomized controlled intervention trial to date, the
modification of diet in renal disease study (MDRD) [85], was published. This trial
included a total of 840 patients with different degrees of renal disease and
hypertension. Patients were randomized according to the degree of renal
disease.
The study consisted of two parts; study A included 585 patients with moderate
renal impairment (GFR 25-55 ml/min/1.73m2) stratified to either a usual protein
diet 1.3 g/kg/d or a low protein diet of 0.58 g/kg/d. Study B included 255 patients
with more severe renal disease (GFR 13-24 ml/min/1.73m2), where patients
were randomized to a LPD (0.58 g/kg/d) or a very low protein diet (0.28 g/kg/d)
supplemented by 0.28 g/kg/d keto acids and essential amino acids (sVLPD).
The two dietary groups contained the same amount of nitrogen but the nitrogen
contained in the keto acids was subtracted from the urinary urea. The mean
follow-up of both studies was 2.2 years (range 18-44 months).
In study A the decline in GFR initially increased rapidly during the first four
months of the LPD compared to the UPD. After four months the GFR was 28%
lower in the LPD group compared to the UPD. As this decline was correlated
with the degree of compliance to the LPD, this was attributed to the
hemodynamic effect of the dietary changes rather than a progression in the
renal disease [86]. At the end of 3 years there was no significant difference in
GFR between LPD and UPD, although the mean decline was 1.2 ml/min/year
less in the LPD group compared to UPD (p=0.30).
In 2006 Levey et al [87] published a follow-up to the study group A looking at
the risk of renal failure or death. During the first 6 years after randomization
there was a beneficial effect of LPD compared to UPD (hazard ratio (HR) for
renal failure or death was 0.68 (95% CI, 0.51 – 0.93) and 0.66 (95% CI, 0.50-
0.87) respectively. However, when follow-up was extended beyond 6 years the

22
HR increased to 1.27 (95% CI, 0.90 – 1.80) and 1.29 (95% CI, 0.94-1.78)
respectively. The difference between diet group and follow-up time did not
reach statistical significance (p=0.11).
Cianciaruso et al conducted an 18 months intervention study including 400
patients with basal GFR <30 ml/min/1.73m2. Patients were randomized to either
a LPD (0.55 g/kg) or a UPD (0.75 g/kg) and followed for 18 months. The main
outcomes were metabolic control, need for drugs and nutritional status. In this
study analysis per protocol rather than intention-to-treat was used due to very
poor compliance. In the compliant participants metabolic control was improved
resulting in a decrease in drug use (4.13±1.56 - 3.76±1.40 tablets in the LPD vs.
4.97±1.72 – 4.62±1.32 tablets in the UPD). Overall malnutrition was not evident,
but more participants in the LPD group lost more than 5% body weight [88].
This study could not show superiority of the LPD at 18 months and a long-term
follow up study was commenced. In this long-term follow up study the patients
were followed for an additional 30 months. The main outcomes were serum
urea nitrogen (SUN), death, time to dialysis and composite measures of both.
No difference was found in death rate or time to dialysis or composite measures
or change in eGFR. However, the increase in SUN seen in both groups was
significantly lower in the LPD compared to UPD (7.2±2.0 mg/dl, p<0.05) [89].
This would be expected given the lower protein intake and says nothing about
renal function.
In patients already on peritoneal dialysis Jiang et al found a beneficial effect on
proteinuria and residual renal function of a keto acid supplemented LPD (sLPD,
0.6-0.8 g/kg from foods + 0.12 g/kg keto acid) in 60 patients compared to either
a high protein diet (1.0-1.2 g/kg) or a non-supplemented LPD (0.6-0.8 g/kg) diet.
However, the dietary protein intake was self-reported data (3 day record) and
the prescribed protein intake was very similar in all three groups, therefore
protein intake may not be responsible for the difference [90].
Conclusion: non-diabetic renal disease
The overall outcome of these prospective RCTs in a non-diabetic population
with varying degrees and causes of renal impairment is not clear. Some authors
finding a beneficial effect of LPD on some aspect of renal function [78, 81, 83,
90], whereas others found no significant difference [82, 84, 85] and one follow-

23
up study found a possible deleterious effect [87]. The studies were
heterogeneous in design, with some authors using CrCl and serum creatinine
as endpoints. Only 2 studies used a direct measure of GFR but the results from
these studies were also conflicting [83, 85]. Using CrCl as the endpoint
measure has different problems: the use of serum creatinine is problematic as it
assumes a steady state, where excretion rate equals production. Serum
creatinine is dependent on muscle mass and also some tubular secretion exists
and the measurement of serum creatinine is very imprecise. Furthermore the
collection of the complete 24h urine sample is paramount to the result [91, 92].
In most of the studies discussed above, weight loss was a factor in the LPD
group and would have induced a lower muscle mass and lower serum
creatinine; additionally, a vegetarian LPD may lead to an overestimation of GFR
[92]. Only the MDRD study has looked at long-term follow-up (≥6 years) and no
significant difference between allocated diet group and time of follow-up was
seen [87]. Outcome of early prospective LPD studies in non-diabetic patients
can be seen in appendix 1, table 1.
1.5.4 Comparing the effect of LPD to very low protein diets (VLPD)
A number of studies have reported on the effect of a LPD compared to a VLPD
in severe renal impairment (CrCl ≤ 25 ml/min/1.73 m2).These studies use
protein derived from foods in the LPD group and from foods supplemented by
keto acids in the VLPD (sVLPD). The most frequently used protein prescription
is 0.6 g/kg/d vs. 0.3 g/kg/d (+ supplement) respectively. In the first published
results of the MDRD study group 2 (255 participants with severe renal failure;
mean baseline GFR 18.5±3.4 ml/min/1.73 m2) using an intention-to-treat
approach, no significant difference was seen in the decline of GFR between
LPD (0.58 g/kg) and sVLPD (0.28 g/kg+ supplement) at the end of three years;
the decline in GFR was 0.8 ml/min/year lower in the sVLPD group compared to
the LPD group (4.4 vs. 3.6, p=0.07) [85]. In 1996 Levey et al published a
secondary analysis of MDRD study group 2: the objective was to determine the
effect of achieved protein intake and prescribed protein intake on the
progression of advanced renal failure. Although the protein prescription was
very strict at 0.56 g/kg/d (0.28 g/kg/d from foods supplemented with 0.28 g/kg/d
keto acids) in the sVLPD and 0.58 g/kg/d in LPD, the achieved protein

24
restriction was more moderate at 0.66 g/kg/d in the sVLPD and 0.76 g/kg/d in
the LPD group. The authors looked at the effect on GFR decline dividing
participants into groups according to achieved protein intake rather than
allocated groups. They found that a 0.2 g/kg/d decrease in protein intake from
foods was associated with a risk ratio of 0.52 (95% CI 0.35, 0.78) for renal
failure or death at a given follow-up time, likewise for protein from foods and
supplements the risk ratio was 0.50 (95% CI 0.34, 0.76) indicating no difference
between foods alone or foods and supplements. GFR was slowed by 1.15
ml/min/y with a decrease in protein intake of 0.2 g/kg/d and a prolonged time to
renal failure by 49% [93]. In a more recent follow up study of this patient group,
Menon et al [94] assessed the long-term (1993-2000) outcome on kidney
failure, all cause mortality and a composite outcome of both. They found no
significant difference between diets on kidney failure or composite outcome.
However, there was a 2 fold higher risk of death in the sVLPD group following
the onset of renal failure compared the LPD group (p=0.01). From these results
it does not seem feasible to prescribe a sVLPD which is difficult to adhere to in
the long-term. Indeed participants in this study showed no difference in protein
intake nine months after the end of the intervention [94]. The limitations of
secondary analysis from the MDRD study are the lack of dietary information;
protein intake was assessed nine months after the end of study and has not
been assessed since. However, sVLPD showed a deleterious long-term effect
on survival even though current protein intake was not known.
In an early RCT Junkers et al [95] reported results from 14 volunteers with a
mean GFR of 8.1±0.9 ml/min/1.73 m2. The LPD protein prescription was 0.6
g/kg/d vs. 0.4 g/kg/d (food and supplement combined) in the sVLPD. Follow-up
ranged between 2 and 18 months. The assessed endpoints were 1/Cr/Mo and
renal survival (measured as time to dialysis). Time to dialysis was on average
7.9 months (range: 4-18) in the LPD (n=7, one participant was excluded due to
continued diet treatment) group vs. 12.5 months average (range: 8-18) in the
sVLPD group (n=7) indicating a possible benefit of the sVLPD. The 1/Cr/Mo
decreased more in the LPD group although not statistically significant between
groups. The limitations of the study are the small number of patients treated for
more than 12 months (n=5: two in LPD and three in sVLPD). One patient (LPD
group) was still continuing treatment at the time of analysis and was therefore

25
excluded from the survival study; this may explain some of the difference in
survival rate between the two groups [95]. In a similar study using the same
protein restriction 50 patients with a baseline CrCl <19 ml/min/1.73 m2 were
randomised to LPD (0.6 g/kg/d) or sVLPD (0.3 g/kg/d + 0.17 supplement); no
significant difference in renal survival (renal failure defined as GFR
<5ml/min/1.73m2) was seen after a follow up period of 40 months. However a
significant weight loss (p<0.01) was seen in the sVLPD group indicating
malnutrition, which led to the conclusion that an sVLPD is not justified in this
patient group [96]. Contrary to these findings Di Iorio et al found significantly
better renal survival, measured by time to dialysis, in a 2 year follow-up study
investigating 20 patients with CrCl ≤25 ml/min/1.73m2 randomized to either
continue their usual LPD (prescribed protein intake 0.6 g/kg/d, actual intake 0.8
g/kg/d) or an sVLPD (prescribed protein intake 0.3 g/kg/d + supplement, actual
protein intake 0.5 g/kg/d). The mean time to dialysis was 23.2±1.9 months vs.
19.6±4.0 months in sVLPD and LPD respectively (p<0.02) [97]. These findings
are supported by a 48 week study in 45 patients with overt renal disease where
one participant in the sVLPD group and seven in the LPD group (4% vs. 27%)
commenced dialysis after 21 and 26 weeks respectively [98]. However, in a
slightly different design comparing a LPD supplemented with keto acids (0.6
g/kg + 100 mg/kg) to a LPD (0.6 g/kg) supplemented with placebo in a
randomized, double blind study design. A positive effect was seen on CrCl,
inulin clearance and proteinuria with the addition of keto acids but it is difficult to
relate these results to LPD to VLPD studies [99].
Conclusion: LPD vs. sVLPD
The results of these studies are inconclusive, with some studies showing a
beneficial effect of the sVLPD on renal survival [90, 95, 97, 98] whereas others
did not [85, 87, 94, 96, 99] and one study with long-term follow-up found a
deleterious effect of sVLPD [94]. Most studies intervening with a sVLPD have a
study population of severely renal impaired patients. Either the patients are
stage 4 (GFR 15-29 ml/min/1.73m2) [94] or they have passed the usual point of
initiating renal replacement treatment (dialysis or transplantation) according to
the KDOQI/guidelines of < 15 ml/min/1.73m2 [100]. In some studies malnutrition
on the sVLPD was evident, represented by weight loss [96]. The benefits

26
reported in these studies are small but the possible adverse effects are
substantial. A VLPD is a major challenge in the patients everyday life and
compliance is rarely achieved, therefore it seems questionable to recommend
this severe diet to delay dialysis for 3-6 months.
1.5.5 The effect of protein restriction on renal function in patients with type 1 diabetes mellitus (T1DM)
Eight long-term studies (follow-up ≥12 months) looking at protein restriction in
T1DM patients were found. Four studies were before and after intervention
studies with no control groups, where the participants were followed for a period
of up to 29 months on their usual protein diet and then changed to a LPD
containing 0.25 – 0.67 g/kg/d and followed for up to 44 months [101-104]. Four
randomized controlled trials were also identified; here participants were
randomly assigned to either continue their usual diet or a LPD diet. The follow-
up period ranged from 12 months to 11 years [105-108]. A total of 162
participants with type 1 diabetes mellitus were included in the randomized trials
and an additional 67 participants took part in the uncontrolled trials. The
intervention diet consisted of a mix of animal and vegetable protein, except for
the two studies by Barsotti et al [103, 104] where the diet was changed from
animal protein to vegetable protein. Compliance to diet was assessed by diet
recall only in the study by Evanoff et al [102] and by both dietary record and
urinary urea nitrogen excretion in the remaining studies [101, 103-108].
Renal function was assessed by CrCl (ml/min) [63, 102-104], 51Cr-EDTA
clearance [101, 107], inulin clearance [105], or iothalamate clearance [106,
108].
The dietary protein in the LPD was 0.25 to 0.67 g/kg/d. Two groups used 40 g
protein per day in the LPD [101, 102] corresponding to 0.6 g/kg/d. One group
calculated the protein restriction as g/kg IBW/d [108]. In two studies animal
protein was excluded and all foods were vegetarian [103, 104]. The control diet
in all studies was the participant’s usual diet [101-108].
In a very small non-randomized study by Evanoff et al [26] retrospective data 12
months before dietary protein restriction and prospective data after 12 months
follow up was used to assess renal function in 8 patients with T1DM. The UPD

27
contained 80 g protein/d and was changed to a LPD containing 40 g protein/d.
CrCl and proteinuria was used as endpoints. No significant change in GFR
measured by CrCl was found after 12 months whereas proteinuria decreased
significantly from 2105±1355 to 142±164 mg/d (p<0.001). Furthermore there
was a marked decrease in blood pressure from 158/92±21/10 to 130/80±14/18
(p<0.01, mean (SEM)) [102].
Barsotti et al conducted another small non-randomized study investigating 8
patients with T1DM with severe renal failure (CrCl 19.2 ±13.4 ml/min). Patient
data was available for at least 1 year prior to inclusion in the study during which
period protein was unrestricted. Patients were switched to a LPD supplemented
by essential amino acids and keto acid analogs but restricted in phosphorus.
Animal foods were excluded from the diet in order to maintain either a protein
intake of 0.25-0.35 g/kg/d (n=4) or 0.5-0.6 g/kg/d (n=4). Compliance to diet was
measured by urinary urea nitrogen. CrCl and proteinuria was used as major
endpoints. At the end of the 17.4±5.8 months follow-up, proteinuria had
decreased significantly with the LPD from 5.7±1.9 to 3.1±0.6 g/24h (p<0.001);
the fall in CrCl decreased from 1.38±0.27 to 0.03±0.37 ml/min/month (p<0.001)
[104].
More recently Barsotti et al [103] conducted a non-randomized study
investigating 32 diabetics (22 T1DM and 10 T2DM) looking at the effect of LPD
containing (A) 0.3 g vegetable protein/kg/d or (B) 0.7 g vegetable protein/kg/d.
The rate of decline in the pre-study period was 0.9±0.62 ml/min/month and
significantly less (0.22±0.21 ml/min/month) after 3.7 years of follow-up
(p=0.001). Results with all participants combined, regardless of type of diabetes
or allocated protein restriction.
In the last non-randomized study, Walker et al [101] investigated 19 patients
with T1DM with moderate renal impairment (GFR 23-125 ml/min/1.73m2
measured by 51Cr-EDTA). They were observed for a pre-intervention period of
12-39 months on their UPD, after which they were switched to a LPD of 0.67
g/kg/d equally divided between vegetable and animal protein. The rate of
decline of GFR was -0.61±0.14 ml/mi/1.73m2 during the UPD vs. -0.14±0.08
ml/mi/1.73m2 (P=0.001) while on the LPD; but the effects were highly variable
ranging from a reduction in 8 patients to an accelerated decline in 1 patient.

28
Four patients started angiotensin converting enzyme inhibitor (ACE) while on
the LPD, which is also known to positively affect renal function [109].
In three relatively small randomized, controlled trials with a follow up period of at
least 12 months (range 12-37.1 months), using more precise methods to
estimate GFR, variable results have been reported. Brouhard and LaGrove
undertook a RCT looking at the 12 month effect of a LPD (n=8) on GFR
measured by inulin clearance and comparing that to the UPD (n=7). The GFR
decreased in both groups but more so in the UPD group (0.68±0.4 in the UPD
vs. 0.28±0.15 in the LPD group; p=0.005) [105]. Similarly Zeller et al found a
decrease in Iothalamate clearance in both study groups but the decrease was
less in the LPD (n=20) group compared to the UPD (n=15) group (-0.0042
ml/sec/m vs. -0.0177 ml/sec/m; p=0.03) [108]. The third study by Dullaard et al
included 30 patients with T1DM and found GFR decreased in both groups. The
decrease in GFR in the LPD (n=14) group was significant compared to baseline
(131±34 vs. 113±24 p=0.03); in comparison the decrease in UPD (n=16) was
only borderline significant (122±26 vs. 112±21; p=0.05) but the two arms were
not different statistically [106].
In a more recent, larger (n=82) RCT with a mean follow up of 4 years, Hansen
et al likewise found no significant difference in decline in GFR between the two
groups (-3.9 ml/min/year UPD vs. -3.8ml/min/year LPD). However, the main
endpoints of ESRD or death occurred in 27% of patients in the UPD group
compared to 10% in the LPD group (p=0.042).
Conclusion: type 1 diabetes
Compliance to the diet was poor in most studies. The total number of
participants in the 8 studies combined was only 229 patients. There was a
beneficial effect of LPD in three out of the four non-randomized trials but the
studies varied widely in design and the total number of participants was only 67.
In the RCT trials two studies [101, 108] show a significant decrease in the fall in
GFR with a LPD but the remaining larger studies showed no significant effect of
the LPD.
Outcome of non-randomized and randomized trials including type 1 diabetic
patients are shown in appendix 1, table 2.

29
1.5.6 RCT trials in type 2 diabetes
Pijls et al conducted a 12 months study of 121 patients with T2DM and
microalbuminuria. Patients were randomly assigned to a LPD (0.8 g/kg/d) or to
continue on UPD (1.2 g/kg/d). Albuminuria in the LPD group decreased by 12 %
compared to control in the intention-to-treat analysis [110]. In 2002 Pijls et al
published a second study. Patients were followed for 28 ± 7 months. In this
study the endpoints were albuminuria and GFR. To avoid the hemodynamic
changes where GFR initially decreases on a LPD [111], the first 6 months of
intervention were omitted from this analysis and data are presented from 6
months onwards.
Achieved protein intake after the first 6 months was 1.1 g/kg body weight/day
vs. 1.19 g/kg body weight/day in the control group. At 12 months this difference
had decreased to 1.1 g/kg body weight/day vs. 1.14 g/ kg body weight/day
respectively. Both intention-to-treat and best-case analysis (where the result is
analysed based on actual protein intake regardless of allocated diet) were used.
Both analyses failed to show significant beneficial effect of protein restriction on
renal damage. The researchers concluded that protein restriction was
ineffective in preventing the progression of diabetic nephropathy in T2DM;
however a significant difference between diets was never achieved.
Similar effects were seen in a further three studies comparing LPD to UPD in
type 1 and type 2 diabetes patients [112-114]. The effect of a LPD (0.6-0.8
g/kg/d) compared to a control group receiving an UPD (1.2 g/kg/d) was
investigated in two studies by Meloni et al and one study by Dussoll et al.
Follow-up was 12-24 months. No significant changes were seen in proteinuria,
microalbuminuria or isotope GFR. Compliance was either poor or absent. In the
study by Meloni [113] there was a decrease in serum pre-albumin and serum
albumin indicating a tendency towards malnutrition in the LPD group. Energy
intake decreased by approximately 600 Kcal within the first 3 months of
intervention and stayed low throughout the study duration in this group and the
patients lost weight. In contrast, energy intake in the UPD stayed constant
throughout the study. Recently the effect of a LPD (0.8 g/kg) compared to an
UPD (1.2 g/kg) was investigated in a multicentre study including 112 Japanese
T2DM patients. Follow-up was 5 years and main outcome was mean annual

30
change in estimated GFR, CrCl and a doubling of serum creatinine. No
significant difference was detected in any of the outcome measures.
Compliance was low, in fact at the end of five years there was no difference in
protein intake (p=0.16) [115]. Using another approach, in 170 T2DM patients
with normal to moderate renal impairment (GFR 15-75 ml/min) Facchini and
Saylor [116] compared an iron modified, HPD (25-30% of energy from protein
where red meat was exchanged with white meat, dairy, egg and fish, CHO was
reduced to 50% of energy, tea and wine was controlled and polyphenol
enriched olive oil was used) to the “standard care LPD” of 10 % TE from protein
(0.8 g/kg). Serum creatinine doubled in significantly more patients on the LPD
compared to the iron modified diet (31 vs. 19, p<0.01), Renal replacement
treatment and death occurred more often in the LPD group (31 vs. 18, p<0.01).
The major limitation of this study is the lack of dietary information, compliance to
the dietary regimes was not measured and the only measure of diet was serum
ferritin which decreased in the iron modified diet. However the study suggests
protein restriction per se is not required to obtain a benefit and that other dietary
strategies may be useful.
Conclusions for studies including both type 1 and type 2 diabetes patients:
Seven RCTs which included 664 T2DM and 66 T1DM participants found no
significant difference after up to five years follow-up. One study found that
protein restriction may promote malnutrition [113]. One study differed in design
where an iron modified HPD was used as intervention compared to the LPD. In
this study a beneficial effect on renal survival was seen in the iron modified
HPD [116]. Outcome of RCT studies including type 2 diabetic patients can be
seen in appendix 1, table 3.
1.5.7 Major reviews of low protein diets
After publication of the MDRD study, Pedrini et al published a meta-analysis of
randomized controlled trials (RCT) from the period between 1966-1994 on LPD
and renal disease. These included 5 studies in T1DM patients (n=108) and 5
studies in non-diabetics (n=1413) including the MDRD study. The endpoints
were ESRD or death and GFR, albumin excretion rate and creatinine clearance.
The prescribed protein intake in the non-diabetic studies was 0.4-0.6 g/kg/d in
the LPD group and in diabetes the prescribed protein intake ranged between

31
0.25-0.6 g/kg/d. The results of these studies on GFR in the non-diabetic studies
were inconsistent: 2 studies showed a positive effect of protein restriction, 2
studies showed no effect and the MDRD study did not show a beneficial effect
of LPD in the 585 participants with moderate renal impairment. In the 255
participants with advanced renal disease treated with LPD and strict BP control
a beneficial effect was seen in the secondary analysis.
Contrary to the results in the non-diabetic individuals a beneficial effect was
seen in the T1DM patients. The prescribed protein restriction was generally not
adhered to. The achieved protein intake was 0.7-0.8 g/kg/d. However, the
pooled results of these studies showed a decreased risk of ESRD or death of
0.67 in non-diabetics and 0.56 in diabetic patients. The authors found there was
a decreased relative risk, 0.67 [CI, 0.50 to 0.89]; p=0.007 of renal failure or
death. This was used as evidence to recommend a low protein diet containing
0.6 g/kg/d to delay the need for dialysis [77].
Kasiske et al found in their selective meta-analysis which included 13 RCT
(n=1919, in which 102 were patients with diabetes) a small 0.53 ml/min/y (95%
CI, 0.08 to 0.98 ml/min/Y, p<0.05) reduction in the decline of renal function
[117] with LPD. However, in a recent Cochrane review by Robertson et al based
on 9 RCT and 3 before and after studies (n=585, 322 T1DM and 236 T2DM
patients) a small but insignificant (p=0.18) benefit of LPD of 0.1 ml/min/month
was found [118]. In 8 RCTs Pan et al found a small but not statistically
significant beneficial effect of LPD in diabetic nephropathy in both T1DM and
T2DM patients [119].
The latest systematic review was published from the Cochrane library by
Fouque and Laville in 2009; in this review they updated earlier reviews by
Fouquet et al 1992 and Pedrini et al [120]. Ten RCT comparing UPD to a LPD,
excluding diabetics and children were included. A total of 2000 participants
(range 19 to 585) with moderate to severe renal disease participated. The
outcome was renal death (ie need for dialysis) during follow-up. In the UPD
group 168 participants died or commenced dialysis vs. 113 in the LPD group. A
reduction of the relative risk in the LPD of 32% was reported (p=0.0002).The
number of patients who needed to be treated in order to prevent one case of
renal death during one year of intervention ranged between 2 and 56, with the
32
larger studies showing less effect of protein restriction. It is not clear how the
analysis was performed as one of the studies in the meta analysis from Malvy et
al [96] showed that 100% of patients were on dialysis after 36 months with only
1 month difference in reaching this end point between the 2 groups. The meta
analysis claims that in this study only 8 patients would need to be treated to
avoid one “renal death” -this is true only at 12 months.
Conclusion from major reviews
A major problem with the published studies so far is the lack of homogeneity in
study designs. Endpoints range from ESRD to death, or changes in renal
function like GRF, CrCl and proteinuria. The dietary prescription for LPD is very
often not adhered to, the prescribed protein restriction range from 0.25-0.8
g/kg/d, whereas achieved protein intake range from 0.7-1.1 g/kg/d. When
comparing the achieved protein intake in the LPD groups, to the protein intake
in the UPD groups (0.8 – 1.4 g/kg/d) there is no significant difference. However,
Fouque and Laville reported a highly significant reduction in the relative risk of
renal death of 32%, with the smaller studies showing the strongest effect; but as
noted above this conclusion is suspect. Delaying the need for dialysis does not
have any long-term benefit on mortality and use of a LPD may be harmful under
some circumstances.
1.5.8 Epidemiologic studies
The effect of different levels of protein intake in humans with normal or
moderately impaired renal function has been assessed in a number of
epidemiologic studies. Knight et al [121] in a subgroup of women from The
Nurses Health Study assessed the changes in renal function in1624 women
with normal (GFR ≥ 80 ml/min /1.73 m2) or impaired renal function (GFR ≥ 55
but ≤80 ml/min /1.73 m2) over an 11 year period based on serum creatinine
only. After adjusting for measurement error they demonstrated a fall in CrCl of
7.72 ml/min /1.73 m2 per 10 g protein over the 11 year period in the subgroup
with impaired renal function with borderline statistical significance (95% CI, -
15.52 to -0.08 ml/min /1.73 m2). In the subgroup of women with normal renal
function there was a non-significant decrease in GFR of 1.14 ml/min /1.73 m2
per 10 g (CI, -3.63 to 5.92 ml/min /1.73 m2) [121]. The third national health and
nutrition examination survey (NHANES III) found no association between
33
protein intake and microalbuminuria in participants without renal impairment,
hypertension or diabetes. However, in participants with both hypertension and
diabetes a high intake of protein was associated with an increased prevalence
of microalbuminuria [122]. In the more recent PREVEND study investigating the
effect of protein intake (which ranged between 0.3 – 3.33 g/kg/d, as assessed
by urinary urea excretion) on renal function in 8461 participants who did not
have renal disease, no significant difference was seen in the change in GFR
over a follow up period of 7.2 years [123]. In participants with renal impairment
there seems to be a u-shaped association between protein intake and the
deterioration of GFR. A low protein intake (<90% of recommended intake
(K/DQOI 0.6-0.75 g/kg)) and a high protein intake (≥110% recommended
intake) was associated with deterioration whereas intake in the recommended
range had no deleterious effect. The same effect was seen in participants with
low energy intake [124].
1.5.9 Conclusion
The evidence of a beneficial effect of LPD in delaying the progression of renal
disease is still lacking. In the studies focusing on renal function in rodents with
extensive renal mass loss there is a significantly better outcome when low
protein diets are used. However, this is not so clear in humans. The relatively
few long-term, RCT published so far are inconclusive. Some meta-analyses
show beneficial effect of LPD and VLPD on uremic symptoms, resulting in a
delayed time to renal replacement therapy which may be of benefit to some
patients [77, 120]. It is however a concern that the long-term effect of these
diets may result in increased mortality as seen in the secondary analysis of the
MDRD study [94]. The cause of renal disease in people with type 2 diabetes is
multi factorial and hypertension, hyperglycaemia, obesity, and cigarette
smoking all play major roles. Long-term RCT investigating the effect of protein
intake on renal function in T2DM patients who are matched for these
confounding factors are needed.

34
1.6 Weight loss diets
1.6.1 Weight loss and renal function
It is well established that proteinuria increases with obesity [42, 125]. In the
Prevention of Renal and Vascular End stage Disease (PREVEND) study, a
population based longitudinal study, 6894 participants were followed for 4.2
years to determine the effect of weight loss on albuminuria. The participants
were divided into three groups according to weight change; 1) significant weight
gain (≥10 kg from baseline), 2) significant weight loss (≥10 kg from baseline)
and 3) stable weight (<10 kg weight gain or loss from baseline). There were
significant changes in albuminuria in the two groups with significant weight
change compared to the weight stable group. Among the participants who lost
weight, 27% had a halving of albuminuria compared to 10% in the weight stable
group (p<0.01). Among the participants who gained weight, 14% doubled
albumin excretion compared to 12% in the weight stable group (p<0.01) [126].
Adapted from:
Bello et al, Impact of weight
change on albuminuria in
the general population.
Nephrol Dial Transplant,
2007. 22 (6): p. 1619-1627
Similar effects of weight loss on urinary protein excretion in obese participants
were reported in a systematic review by Afshinnia et al. The review included five
controlled trials and eight uncontrolled trials including 522 participants. Urinary
protein excretion was assessed both before and after weight loss. The meta
regression in these studies revealed that for every 1 kg body weight lost, a
reduction in proteinuria of 110 mg and in albuminuria of 1.1 mg was seen [125].

35
1.6.2 The traditional high carbohydrate, low fat, energy restricted diet
The traditional high carbohydrate diet was used in many of the studies
investigating the effect of weight loss on albumin excretion [127-129]. This diet
has been recommended for many years to the general population [130] and to
people with T2DM [65, 68].
In energy restricted diets kJ intake is usually decreased by 30% or 2500 to 4200
kJ compared to estimated energy need for the individual. The aim is to produce
a weight loss of 5 to 10% of total body weight [65]. The recommended nutrient
composition of a weight loss diet widely used during the past decades is CHO
50-60% TE (≤10%TE sugar, 3.5 g dietary fibre/100kJ), fat ≤30%TE (<10%TE
SAFA, ≥10%TE PUFA, ≥10%TE MUFA) and protein 15-20%TE. These
recommendations have been indorsed by, among others, the American
Diabetes Association (ADA) and the European Diabetes Nutrition Study Group
(DNSG) [65, 68].
High carbohydrate, low fat diets have been found to be effective in reducing
weight by 3-4 kg in ad libitum energy intake diets [131]. For a spontaneous
decrease in energy intake an ad libitum low fat, high complex CHO diet is
recommended [132], However, for weight loss, an energy restricted low fat diet
is recommended [133]. Calorie restricted diets may result in a 6-7 kg weight
loss over 4 years, depending on participant compliance [134]. Furthermore, a
high fibre (cereal, vegetable and fruit), low saturated fat (SAFA less than
10%TE) and low trans-fatty acid, weight loss diet in combination with increased
exercise have been shown to reduce the risk of advancing from IGT to T2DM in
two large intervention studies with long-term follow up (the Finnish diabetes
prevention study and the Diabetes Prevention program) [135, 136].
1.6.3 High protein, weight loss diets
Diets with an increased ratio of protein to carbohydrate have become popular.
Research has shown high-protein diets sometimes promote favourable changes
in body composition compared with high carbohydrate diets in healthy obese
participants [137], in women with increased triglyceride level >1.5 mmol/L [138]
and in T2DM [139].

36
Total weight-loss was increased in healthy [137, 138], insulin resistant
participants [140] and in women with type 2 diabetes [139]. Furthermore,
improved satiety and decreased overall hunger have been reported [74, 137].
1.6.3.1 Definition of a high protein weight loss diet
Most studies have used a low fat (20 to 30 %TE), moderate to high protein (20
to 43 %TE) and moderate to low CHO (20 to 40 %TE) nutrient composition
[137-139, 141-146]. Protein in g/kg/day ranged between 0.5-0.8 in the
low/standard protein groups and 1.1-1.8 g/kg/day in the high protein groups.
Total protein intake ranged between of 55 to 80 g in the low protein group and
in the high protein group the reported intake was 87 to 202 g protein /day.
Some researchers have looked at ad libitum energy intake in HPD [137, 144].
Most studies have looked at the effect of high protein diets with energy
restriction (decreased by 30% of total energy need) [138, 139, 141-143, 145-
147]
1.6.3.2 Energy expenditure and high-protein diets
Diet induced thermic effect (DITE) is one component of total daily energy
expenditure (TEE), accounting for approximately 10% of TEE for persons in
energy balance [148]. Additional components of TEE are resting metabolic rate
(RMR), usually measured in the morning after an overnight fast, which accounts
for 60-70% and physical activity (PA) which makes up the remaining 15-30%
TEE. [149]pp23
The increases in energy expenditure after a meal varies with the macronutrient
composition, where dietary fat increases basal metabolic rate (BMR) by 0-3%,
CHO increase BMR by 5-10% and protein increase BMR by 20-30% [150].
Alcohol produces a similar thermic effect to protein (10-30%); but is usually
ingested as an additive source of kJ [148].
The energy cost of protein oxidation is dependent of the number of amino
groups that are converted to urea. This can range between 99 kJ/mol of
Adenosine Triphosphate (ATP) for glutamate to 153 kJ/mol of ATP for cysteine
compared to 91 kJ/mol of ATP and 96 kJ/mol of ATP for CHO and fat
respectively [150].

37
Protein oxidation measured by indirect calorimetry has been shown to almost
triple after a protein rich compared to a fat rich meal in both lean and obese
women (p<0.01). Diet induced thermic effect of the protein rich meal was 13.4%
compared to 4.3% in the fat rich meal. If sustained this difference translates into
2 kg weight loss over one year. Importantly, no difference in DITE was seen
between lean or obese women [151].
The higher thermic effect of protein might be responsible for the increased
satiety shown in multiple intervention studies as summarized in a review by
Halton and Frank 2004. They looked at 15 randomized controlled trials (RCT),
reporting the effect of high-protein vs. lower protein diets on thermogenesis.
This effect is seen in both lean and obese persons [152].
The decrease in energy expenditure with energy restriction and weight loss may
be less pronounced in HPD compared to conventional diet. Baba et al found
resting energy expenditure (REE) decreased less in the high-protein group
(protein 45%TE) compared to the conventional diet group (protein 12%TE)
when adjusted for weight loss differences (-22.09±2.16 kcal/kg weight loss in
HPD vs. -58.79±5.21 kcal/kg weight loss SPD; p<0.05) [140].
Protein intake has an increased thermal effect mainly due to
glucogeneogenesis and oxidation as amino acids are not stored in the body but
have to be metabolized or synthesized immediately [152].
1.6.3.3 Dietary protein induced satiety
In a comprehensive review by Westerterp-Plantenga et al of the literature
reporting data on high protein diets in energy balance, energy deficiency and
weight maintenance, it was shown that in energy balance a high protein diet
(25-30 %TE) given for one to several days produced sustained higher satiety
compared to a normal protein diet (15-30%TE) [150]. High protein diets result in
reduced appetite and increased satiety in ad libitum energy intake [153, 154].
Moreover, a hierarchy has been observed where protein is the most satiating
nutrient, then carbohydrate and least satiating was fat [150].
Skov et al found energy intake in the HPD group to be 2 MJ lower than in the
high CHO group under ad libitum energy intake. This is probably explained by
the higher satiety experienced with the HPD [137]. In energy restriction the total

38
amount of protein should be kept constant in order to avoid negative nitrogen
balance and this usually means that the total energy percentage (%TE) from
protein is between 25 and 30 %TE [150]. High protein energy restricted diets
have been reported to produce weight loss equal to high CHO diets; but the
high protein diet group reported less hunger and more satiety in the first four
weeks of a six week weight loss intervention [150]. The increased satiety of the
HPD may result in sustained weight loss or less weight regain in the follow-up
after weight reduction [150].
1.6.3.3.1 Acute protein induced satiety
In studies looking at different changes in single meal protein intake and the
effect on satiety, using visual analogue scale (VAS), results have consistently
shown a significantly higher satiety score when other macronutrients are
exchanged for protein.
In preload studies an increased concentration of anorexigenic hormones
glucagon-like peptide 1 (GLP1), cholesystokinin (CCK), insulin response and
slowing of gastric emptying associated with subsequent energy intake reduction
have been reported [155-160].
Ghrelin a gastric hormone which has been shown to increase appetite in
rodents and humans [161], was decreased equally by different macronutrient
preloads. However, the decrease after protein preloads was prolonged
compared to glucose and fat preloads [155, 162]. Subsequent ad libitum energy
intake was lower after high protein breakfasts (25%TE from protein) compared
to lower protein (10%TE) and CHO preloads [155-160] and after high protein
lunch preloads [163]. Although Blom et al found postprandial ghrelin to
decrease, cholecystokinin (CCK) and glucagon-like peptide 1 (GLP1) to
increase, causing slower gastric emptying, they found no significant difference
in satiety scores comparing a high protein breakfast to a high carbohydrate
breakfast in young men and there was no significant difference in energy intake
at a subsequent ad libitum lunch [164].
The research in this area is heterogeneous in design, choice of pre-load and
study population. High protein diets are more satiating as shown in pre-load

39
studies with subsequent ad libitum feedings and short term high protein diets,
but this may not be the case for long-term consumption.
1.6.4 Diets with decreased carbohydrate content
Low CHO diets, where CHO has been exchanged with protein and fat, have a
beneficial effect on the rate of body fat (BF) loss, body weight (BW) loss and
retention of fat free mass (FFM) compared to high CHO, low fat diets [165].
Krieger et al [165] performed a meta regression of 87 studies, where dietary
intake was measured by self-reported data, either verified by biological
measures (urinary nitrogen excretion, blood urea nitrogen, urinary or plasma
ketones or plasma fatty acids) or In the case of no biological markers of
compliance, the subjects had to be supplied with at least 60% of their daily
energy needs for the study to be included in the meta analysis.
A total of 325 studies where the investigators reported poor compliance were
excluded. Krieger et al found diets in the lowest quartile of CHO intake
(≤35%TE, defined as the first quartile below the median) were associated with a
1.6-1.7 kg greater BW loss compared to the high CHO diets (the highest three
quartiles above the median) in studies of < 12 weeks duration. In studies of
more than 12 weeks duration (n=7), the low CHO diet produced a 6.56 kg
greater BW loss compared to high CHO diets (>35%TE).
There was a trend towards a greater %BF loss with low CHO diets, so that a
diet containing >1.05 g protein/kg increased %BF loss by 0.96% (however this
was not statistically significant, p=0.21). In studies of >12 weeks duration this
difference in %BF rose to 3.55% (p=0.27). This corresponds to an increased fat
mass change of 5.57 kg in the low CHO diets.
There was a tendency of a higher retention of lean body mass (LBM) in the two
highest quartiles of protein intake (>1.05g protein/kg body weight) compared to
the low quartile of protein intake (0.7g/kg) and the effect was greater with
increased length of intervention [165] .
Increasing the ratio of high quality dietary protein to CHO intake in low fat,
energy restricted diets has shown a tendency to spare lean body mass under
conditions of weight loss. This effect is usually achieved by unchanged or minor
decreases in LBM in the HPD compared to a larger decrease in LBM in the

40
SPD diet groups [166-168]. The effect of HPD on body composition will be
discussed in the section 1.7
1.6.5 Very low carbohydrate diets
1.6.5.1 Ketogenic diets
The very low carbohydrate (ketogenic) diet usually contains 20 g CHO (often
increasing over time to approximately 50g), with no restriction in energy, fat or
protein intake [169-173]. These ketogenic diets are often compared to a low fat,
energy restricted diet ( a deficit of 2100-4200 kJ, ≤30%TE from fat, 55-60%TE
from CHO and 15%TE from protein).
Studies investigating the effect of weight loss using a ketogenic diet have found
an increased weight loss, increased loss of fat mass and abdominal fat mass
(AFM). A meta-analysis of five trials including 447 participants (222 in the
ketogenic diet and 225 in the low fat diet) found a beneficial effect on TG and
HDL cholesterol; but an adverse effect on total cholesterol and LDL cholesterol
in the ketogenic diet. It was concluded that the ketogenic diet was as effective
as the low fat diet in reducing weight; but cautions the unfavourable changes in
LDL and total cholesterol may outweigh the favourable changes in TG and HDL
cholesterol [174].
The effect of the low CHO diet is usually seen within the first 2 to 4 months of
intervention after which the effect seemed to level off and be the same as the
higher CHO diet after 12 months [173, 174]. Very few studies report longer term
effect (52 weeks) [171, 175-177].
In 307 obese participants Foster et al [176] found no significant treatment effect
on weight loss after 6 months intervention and 24 months follow up. The diets
were designed to give either 20g/day CHO (increasing after 6 months by 5g/day
until desired weight was stabilized ≈BMI 23 kg/m2) in an ad libitum energy
intake diet or a low fat, energy restricted diet (energy reduction of 1.2 to 1.8 MJ
and fat intake ≤30%TE). After 12 months there was a mean weight loss of 11%
in both groups and this decreased to 7% at 24 months.
In a study looking at 322 obese participants, with 24 months follow up, three
different diet allocations were investigated: a low fat, energy restricted diet; a
Mediterranean (high fibre and high MUFA intake), energy restricted diet; and

41
the low CHO, ad libitum energy intake diet. Weight loss occurred within the first
six months and a maintenance phase was initiated from seven months to the
end of 24 months. A significantly greater weight loss was observed after 24
months in the Mediterranean and the low CHO diets (-4.4±6.0 and -4.7±6.5 kg
in the two groups respectively, compared to -2.9±4.2 kg in the low fat group;
p<0.01 for the treatment*time interaction) [177].
In summary, the ketogenic diet has a beneficial effect on weight loss in the short
term; but this effect is usually not sustained long-term. Triglyceride is decreased
and HDL cholesterol is increased in the ketogenic diet. However, LDL
cholesterol and total cholesterol are increased, and this increase may counter
the positive effect seen on TG and HDL.
1.6.6 High-protein, ad libitum energy intake, weight loss diets
Halton et al [152] reviewed five studies of long duration (≥6 months) and 10
studies of shorter duration (7 days to 16 weeks) and concluded that there was a
slight trend towards a beneficial effect of HPD on total weight loss, when the
diets used ad libitum energy consumption. No difference was seen in isocaloric
HPD when compared to the conventional high-carbohydrate, low fat, weight
reduction diet (HCLF) [152].
In ad libitum energy intake weight loss diets comparing HPD to HCLF, Skov et
al found weight loss at 6 months to be greater in the HPD (8.9 kg vs. 5.1 kg
respectively). Furthermore they found that more people in the HPD group (19 of
23 =79%) lost in excess of 5 kg compared to the HCLF group (12 of 23 = 52%;
p<0.05) during the first 3 months and at 6 months more people in the HPD
group (8 of 23 =35%) had lost in excess of 10 kg (2 of 23 = 9% HCLF; p=0.02)
[137]. Fat mass had decreased by 7.6 kg in the HPD group compared to 4.3 kg
in the HCLF group, a highly significant difference of 3.3 kg body fat mass lost
(p<0.0001). Of the loss in fat mass, intra-abdominal fat mass measured by DXA
scan had decreased 2 fold in the HPD group when compared to HCLF (33 cm2
vs. 16.8 cm2; p<0.0001) [137]. A follow up study was conducted looking at
attrition rate, body weight, body composition and metabolic markers after
another 6 and 12 months [178]. At twelve months 7 of 23 (28%) had dropped
out of the HCLF group compared to 2 of 23 (8%) in HPD (p<0.07). At 24 months
follow up attrition rate was high; 19 of 23 had dropped out of the HCLF group

42
and 14 of 23 in the HPD group (76% and 56% respectively; p>0.05). At 12
months weight loss was no longer significantly different between the two
intervention groups (6.2 vs. 4.3 kg in the HPD and HCLF groups respectively;
p>0.05) and at 24 months the weight had remained stable in both groups (6.4
vs. 3.2 in HPD and HCLF respectively). Weight loss of more than 5 kg was
equal in the two groups at 24 months (6/11 HPD and 3/6 HCLF; p>0.05).
Weight loss of more than 10 kg was achieved by 2 subjects in the HPD (18%)
and none in the HCLF group. The increased loss of abdominal fat mass seen in
the HPD group after six months intervention remained significant at 12 and 24
months (p<0.05) [178].
More recent studies investigating the effect of a moderately higher protein
intake compared to the traditional diet have also reported greater weight loss
and decreased waist circumference under ad libitum energy intake [175, 179]
1.6.7 High protein, low fat, energy restricted diets
The energy restriction in these diets is usually around 30% compared to
estimated or measured energy needs. The recommended fat intake is usually
≤30 %TE, with saturated fatty acids limited to ≤10%TE. The main difference in
the high protein, energy restricted diet is the ratio between CHO and protein.
Protein allocation in these studies usually range from 25 – 35%TE,
carbohydrate level is usually in the range of 40-45 %TE.
In a recent short term (8 weeks) weight loss intervention study where energy
intake was reduced by 30% of estimated energy needs measured by indirect
calorimetry Abete et al [141] was able to show that weight loss was significantly
higher in the HPD group (-8.3±1.2% vs. -5.5±2.5%, p=0.01). Similarly waist
circumference decreased more in the HPD indicating a greater loss of visceral
fat mass (-9.8±2.4% vs. -6.1±2.9%, p=0.03) [141]. Protein intake in the HPD
was planned to be 30%TE (30 %TE from fat and 40%TE from CHO) compared
to 15 %TE (55%TE CHO and 30 %TE from fat) in the control diet.
This confirms the findings from Due et al, who found a decrease in waist
circumference of 5.7 cm (p<0.001) in the HPD compared to the HCLF [144].
However, a part of the weight lost in the study by Abete et al was due to
decrease in body water which was significantly higher in the HPD compared to

43
the HCLF (-2.1±0.2% vs. -1.3±0.6%, p=0.008) [141]. In a study looking at HPD
in type 2 diabetic volunteers, a weak sex by diet interaction has been shown
such that men lost more weight on a HCLF and women lost more weight on a
HPD. The same trend was seen in the rate of fat mass loss and abdominal fat
[139]. This trend was also reported in the follow up study by Due et al, where
men tended to lose more abdominal fat mass compared to women. However,
due to the low number of men remaining in the study at 24 months, this did not
reach statistical significance [178].
Noakes et al investigated 100 women for 12 weeks. They were randomly
allocated to one of two 5.6 MJ diets (HPD 34 %TE protein 97.8 g protein, or 1.2
g/kg/day 20 %TE fat and 46 %TE CHO and the HCLF 17 %TE protein 54.6 g
protein or 0.6 g/kg/day, 20 %TE fat and 64 %TE CHO); the mean weight loss in
the HPD group was 7.6±0.4 kg and 6.2±kg in the HCLF group (p=0.29).
Interestingly they found a 25% higher weight loss with high protein in the group
of women with increased triacylglycerol level (TG >1.5 mmol/L) compared to
women with low TG levels (p=0.005) and in this group total weight loss was
6.4±0.7 kg vs. 3.4±0.7 kg in the HCLF group, p=0.035 [138]. In a long-term
follow up of this study the achieved weight loss for the two groups was similar
(4.6±5.5 vs. 4.4±6.1) but diet was not adhered to [143]. However, when the
researchers analyzed diet data based on reported protein intake, verified by
urinary urea, weight loss was greater in the participants who reported a high
protein intake compared to reported lower protein intake (6.3±7.9 vs. 3.6±4.2
kg, p=0.05) [143].
In insulin resistant and T2DM participants, the weight loss achieved from
following a high protein, weight loss diet is equally effective as a HCLF diet
[139, 180-183].
1.7 Beneficial changes in body composition of high protein, weight loss diets
1.7.1 Lean body mass / fat mass
A number of studies have found significant benefit of HPD on body weight, body
fat, and abdominal fat mass compared with HCLF under both ad libitum and

44
isocaloric conditions [137, 139, 141, 175, 179]. Retention of lean body mass
was found in some studies [145, 167].
Most studies reviewed by Halton and Hu found an increased loss of fat mass
with the high protein diet, but in most cases the difference was not significant
[152].
Retention of FFM was found to be dependent on the protein intake: in the
review by Krieger et al an additional retention of 0.78 kg FFM was seen in the
group who consumed > 1.05 ≤ 1.2 g protein/kg compared to the group
consuming the recommended 0.8 g protein/kg/d. In the highest protein intake
group (>1.2 g protein/kg) an additional retention of 0.96 kg was seen, however,
this was only significant in studies of more than 12 weeks duration [165]. Other
studies have reported no significant difference in the loss or retention of FFM in
energy restricted, high protein diets when measured by DXA or bioelectrical
impedance [139, 179, 180, 182, 184, 185].
Adding resistance training to the diet regime was studied over 16 weeks in 83
volunteers with T2DM, randomly assigned to either an energy restricted, HPD
(33%TE protein, 43%TE CHO, 22%TE fat ) or a conventional high CHO, low fat
diet (19%TE protein, 53%TE CHO, 26%TE fat), with both diets restricted to 6 –
7 MJ. In addition to the diets, volunteers in both groups were randomly assigned
to resistance training or no resistance training (creating four intervention
groups). An overall decrease in weight, FFM (measured by DXA) and waist
circumference was reported with a significant group effect favoring the HPD +
resistance training group [186].
1.7.2 Long-term maintenance of weight loss
In a large multicentre, randomized, controlled trial investigating the maintenance
of weight loss (11.0 kg) achieved with a VLCD in 773 participants from eight
European countries, Larsen et al reported greater success in the high-protein,
low-glycaemic diet group compared to the low-protein, high-glycaemic diet
groups and controls. Weight regain was 1.62 kg in the low-protein group
compared to 0.69 kg in the high-protein group (intention-to-treat analysis).
Although the participants did not reach the planned target for difference
between the protein intake (5% increase achieved with the target set as 12%)

45
and the target for difference in glycaemic index (GI; 4.7 U increase achieved
with a target of 15 U) the study show that even small increases in protein
contend and a small decrease in GI resulted in less weight regain during the
follow-up period after weight loss [187].
1.8 Effect of high dietary protein on serum lipids and glycaemic control
1.8.1 Serum lipids
Clifton et al found an ongoing benefit with decreased blood glucose, C-reactive
protein (CRP), total and LDL cholesterol and increased HDL cholesterol,
regardless of diet allocation, with sustained weight loss [143]. Similarly, Due et
al found no beneficial effect of the high protein diet on inflammation markers in
a 6 months weight loss study.[144]. Likewise no significant difference in the
change in cholesterol, LDL, HDL or triacylglycerol was detected in the study by
Abete et al [141].
In a HPD weight loss study, triglycerides (TG) decreased by 23% at 16 weeks
compared to 10% in SPD diet in hyperinsulinaemic overweight subjects [166]. A
similar effect was also seen in a 10 week intervention study in obese women
[145]. Other studies have shown a significant decrease in TG with no treatment
effect [137, 140, 180, 188].
High density lipoproteins (HDL) increase more in the HPD compared to SPD in
some studies under conditions of weight loss [167, 189, 190]. Other studies
have reported decreases in HDL cholesterol following a HPD compared with a
SPD [140, 191]. Some studies have reported decreased HDL with no
differences between diets [137, 138, 180]. However, numerous studies have
reported an increase in HDL after weight loss regardless of diet allocation [139,
143, 145, 166, 188, 192, 193].
In energy restricted high protein diets, a significant decrease in LDL has been
reported in T2DM (5.7 vs. 2.7%, p<0.001) [139]. Many studies show a decrease
in LDL from baseline, with no difference between groups [143, 145, 171],
however others report increased LDL in both groups, with no difference
between groups [173, 194]. In one study using the very low CHO diet LDL
increased in the HPD by 1.6 mg/dl and decreased in the high CHO diet by 7.4

46
mg/dl (p>0.2). This low CHO diet was also high in fat, predominately animal fat
[173]. The second study reported an initial decrease in LDL by 6 months, but
this was not sustained to 12 months and the authors attribute this to a greater
than recommended intake of saturated fatty acids in the HPD and high fat
groups [194].
In very low CHO diets (ketogenic diets) mixed effects on serum lipids have been
seen with a significant decrease in TG and a significant increase in HDL
cholesterol. However, in most studies a significant increase in LDL cholesterol
have also been observed [169, 171, 173, 175].
The effect of low CHO/high protein diets on serum lipids are inconclusive and
most studies have shown similar effects with decreased total cholesterol, TG
and LDL cholesterol and increased HDL cholesterol under conditions of weight
loss regardless of nutrient composition. However, in the very low CHO diet an
increased LDL cholesterol level has been reported. Caution should therefore be
taken to monitor cardiovascular risk factors when low CHO diets are chosen for
weight loss.
1.8.2 Glycaemic control
For participants with impaired glucose metabolism, the HPD have shown
beneficial decreases in FBG and PPG. In a five week weight maintenance
study, investigating eight male T2DM patients, a doubling of protein intake, from
15 % to 30 %TE, reduced the 24h mean glucose concentration by 36%
(p<0.001) and mean 24h insulin concentration decreased by 25%. These
changes resulted in a decrease in HbA1c of 22% [195]. After five weeks
consuming a HPD, mean peak blood glucose was lower compared to a SPD
after every meal, the mean 24h glucose response decreased significantly from
baseline in the HPD (p<0.02). [196]. This study, however, was a highly
controlled feeding study where all foods were prepared and eaten at the
research clinic on the day of the collection of samples. Other studies have
shown diverse results for the changes in glycaemic control.
Layman et al found fasting blood glucose to be lower in the SPD group after 10
weeks intervention with either a SPD (68g protein/day) or a HPD (125 g
protein/day) in 24 overweight women consuming isocaloric diets. This difference

47
was attributed to an increased serum insulin 2h post meal test in the SPD
compared to the HPD [145].
In a recent study, including 49 volunteers with obesity and T2DM, the effect of a
very low CHO diet (20 g CHO) vs. a low fat low GI energy restricted diet (energy
deficit 2.1 MJ) on HbA1c was tested over 24 weeks [197]. HbA1c decreased
significantly more in the low CHO diet compared to the low fat diet (1.5% and
0.5% respectively, p=0.03). However, when the change in HbA1c was adjusted
for baseline values the difference was only borderline significant (p=0.06). More
volunteers in the low CHO diet group were able to reduce anti diabetic
medication (95.2% in the low CHO diet vs. 62.1% in the low fat low GI diet). In
this study no association between the changes in weight and HbA1c was found
[197].
Numerous studies have looked at the effect of HPD compared to SPD on FBG
and most studies have found a significant decrease with weight loss regardless
of macronutrient composition [138, 139, 143, 144, 166, 179, 188-190].
However, these studies did not include T2DM volunteers.
In a recent study including 99 T2DM volunteers, two diets were given for 12
months. The diets were designed to give ≤30%TE from fat in both diets with
HPD (30%TE from protein) and SPD (55%TE from CHO). The intervention was
a randomized parallel study. The primary endpoint was changes in HbA1c over
12 Mo [188]. There was a significant decrease in HbA1c in both groups with
time (HPD -0.23% and SPD – 0.28%; p<0.001); but there was no treatment
effect. The change in HbA1c was associated with the decrease in energy intake
(r=0.31; p=0.01) and to waist circumference (r=0.34; p=0.008). There was a
clear association between the perception of self-management of the diet and
the changes in HbA1c. Participants with the highest score for self-management
had a decrease in HbA1c of 0.87% compared to 0.03% in participants with the
lowest self-monitoring scores [188].
In contrast to the highly controlled weight maintenance study by Gannon et al,
where a clear benefit on glycaemic control in the HPD was seen, this is not
repeated long-term under weight loss conditions in “free living volunteers”. Most
studies report similar effect on glycaemic control when comparing a HPD to a
SPD with concurrent weight loss.

48
1.8.2.1 Postprandial blood glucose
Acute increases in blood glucose are harmful and there does not seem to be a
lower threshold under which diabetes complications will not occur [198].
Restoring blood glucose to normal range is the aim of diabetes treatment. In
both the DCCT and the UKPDS trials it was shown that achieving HbA1c in the
lower range (≤6.5% and ≤7% respectively) substantially decreased the
morbidity rate [48, 199]. However, decreasing acute surges in postprandial
blood glucose (PPG), which are present even in patients with good glycaemic
control with HbA1c levels ≤7% [53], may further reduce the risk of micro- and
macro vascular complications. In studies designed to target FBG and HbA1c
the benefit on CVD risk was minimal; however in studies also targeting PPG
CVD events were reduced, indicating a strong independent effect of PPG
(reviewed by Bonora [200]). In these reviewed studies, the two hour BG after an
oral glucose tolerance test was used (OGTT). The OGTT, a surrogate measure
for PPG may not be able to be directly extrapolated to post meal conditions.
However, in an eleven year follow up study by Hanefeld et al, the 1h PPG after
the patient’s normal breakfast was used. This study showed that patients who
died from myocardial infarct had higher PPG but similar FBG to the group
without events [50]. Cavalot et al studied 529 T2DM in whom blood glucose
profiles were available (blood profile was FBG, 2h post breakfast, 2h post lunch
and before dinner) and they found blood glucose after lunch to predict the
incidence of CVD more strongly than FBG [201].
Distributing CHO evenly across the day has been recommended for people with
diabetes, in order to maintain a stable BG throughout the day and thereby
minimizing postprandial peaks [202]. However, there are only very few studies
investigating the effect of CHO timing [203]. The CGMS was used to determine
glycaemic response in 23 adults with T2DM, when comparing four different
meal patterns. The meal sequences were equal in total CHO, but with CHO
loaded at different meals. Even distribution with equal amount of CHO and
glycaemic load at all three meals of the day was compared to meals with CHO
loaded at breakfast, lunch or dinner and at the same time minimizing CHO at
the two other meals of the day. This study showed that minimizing CHO at
breakfast and dinner, and shifting it to lunch time provided lower 24h blood
glucose excursions measured as AUC, peak BG and time spent with a BG

49
above 12 mmol/L [203]. Contrary to this a study looking at equal nutrient
composition at breakfast and lunch meals using CGMS, found no significant
difference in AUC and peak BG [204]
1.9 Adverse effect of high dietary protein
To date there is no evidence that high protein diets adversely affects kidney
function in healthy persons [205]. Dietary protein has been linked to adverse
effects on renal function, and a protein intake above the recommended level
has been discouraged [206]. However, evidence in this field is lacking. Martin et
al reviewed the literature reporting the role of dietary protein in chronic kidney
disease, normal kidney function and kidney stone formation. They found that
protein restriction may be warranted in patients with existing kidney disease, but
there was no evidence to suggest that high protein diets have a detrimental
effect in healthy persons [205]. It has been assumed that the HPD will have a
deleterious effect on renal function in the diseased kidney in humans as has
been shown in animal studies investigating the effect of high protein diets in
rodents with 80% renal ablation [207].
High protein intake result in increased renal plasma flow and increased GFR,
but this may be a normal autoregulation designed to enable the kidney to
excrete nitrogenous waste products at a higher rate [208]. In the study by Skov
et al increased renal size and volume was reported. However, no deleterious
effect on albuminuria was found after 6 months intervention with high protein
diet in 65 obese participants [137]. The same results were reached in the study
by Preis et al looking at protein intake in ≈ 44,000 healthy men. IHD was
reported in 2959 men over a period of 18 years. The relative risk in the fully
adjusted highest quartile of protein intake was 1.08 (95% CI: 0.95, 1.23) [209].
The fear that high protein diets may increase the risk of coronary heart disease
(CHD) has recently been the focus of a 26 year follow up study from the Nurses
Health Study [210]. In the 26 year follow up analysis, more than 84,000 women
were surveyed. 2210 cases of CHD and 952 cases of death from CHD were
reported. The study looked at the association of different sources of protein (red
meat, poultry, fish, dairy and nuts) on the relative risk of CHD (data was
analyzed using the fully adjusted model including age, BMI, total energy intake,
cereal fibre intake, alcohol, trans fat, multivitamin supplementation,

50
supplements of E vitamin, cigarette smoking, menopausal status, aspirin use,
physical exercise, and follow up period). An increased risk of CHD was found in
the group consuming most red meat, processed meat and high fat dairy,
whereas consuming fish, poultry, low-fat dairy and nuts exchanged serving by
serving for red meat was associated with lower risk of CHD. It was therefore
cautioned that high red meat consumers might substantially decrease their risk
of CHD by shifting to other protein sources [210]
In a recent population study, including half a million participants from the
National Institutes of Health (AARP) diet and health study, an elevated risk of
CHD (HR= 1.17 for men and 1.50 for women) was found in the highest quintile
(68.1g/1000 Kcal) of red meat intake compared to the lowest quintile (9.3
g/1000Kcal). Consumption of processed meat increased the relative risk of
CHD by 1.09 in men and 1.26 in women. It was concluded that high intake of
red meat and processed meat was associated with a moderate higher risk of
death from all causes, death from cancer and death from CHD [211].
Recently the association between the consumption of unprocessed and
processed red meat and the incidence of T2DM has been examined. In a study
looking at results from the Health Professional Follow-up Study, the Nurses
Health Study1 and the Nurses Health Study ll a HR of 1.12 was found per
serving of unprocessed red meat, 1.32 for processed meat and 1.14 for total red
meat consumption was found. These results were confirmed by an updated
meta analysis of studies looking at the risk of T2DM when consuming red meat
[212].
1.10 Gastric emptying
Meal composition has a direct impact on gastric emptying (GE) in T2DM
patients [213]. In preload studies dietary fat and protein have been shown to
slow gastric emptying in T2DM [214, 215]. Hyperglycaemia and hypoglycaemia
has also been shown to modulate GE [213], so that a high BG results in
delayed and a low BG results in increased GE in order to regulate BG towards
normal. Gastric emptying lag time (the initial gastric emptying speed, 5% GE) is
longer in poorly controlled T2DM patients compared with patients with good
glycaemic control [213].

51
1.11 Conclusion on dietary intervention
A diet that is deficient in energy will result in weight loss as has been reported in
multiple intervention studies [216]. High protein diets are as successful in
producing weight loss as high CHO diets, under some circumstances more
successful. Ad libitum high protein diets have shown good short term effects but
this is not sustained long-term. Energy restricted high protein diets have a
beneficial effect on weight loss and loss of fat mass [137]. The assumed sparing
of lean body mass has not been consistently shown. No adverse effect has
been documented for high protein diets on renal function in T2DM. However, in
very low CHO diets a significant increase in total and LDL cholesterol have
been shown and this may cancel out the beneficial decrease in TG and
increase in HDL cholesterol also reported from these studies [170]. In HPD with
a high proportion of the meat consumed as red meat or processed meat an
increased risk of T2DM, mortality of all cause and of CHD in particular have
been reported [210, 211].

52
1.12 Scope of this thesis
Main study:
Because of the doubt about the effect of HPD on renal function in T2DM, there
is a need to show that high protein diets are safe when accompanied with
weight loss. The primary aim of the main study was to explore whether a
weight-loss diet with a high protein to carbohydrate ratio has a beneficial effect
on renal function in subjects with type 2 diabetes and with microalbuminuria
and/or renal impairment.
We hypothesize that a high-protein weight-loss diet will be as effective as a
standard protein weight loss diet in achieving weight loss without negatively
affecting renal function measured by GFR and cystatin C.
Sub study:
Diverse effects on blood glucose have been shown when comparing a HPD to a
SPD. The relationships between BG and microvascular complications are well
established. We wanted to investigate, using CGMS, differences in postprandial
glucose excursions in patients on two diets: a high-protein weight-loss diet and
a high-carbohydrate weight-loss diet.
We hypothesize that a high-protein weight-loss diet will result in a reduced
glycaemic response compared to a high-carbohydrate weight-loss diet in both
fasting and postprandial conditions.
Study 3:
Currently an even distribution of CHO over all meals is recommended in the
diabetes diet. However there are very few studies showing this pattern to be
optimal in preventing hyperglycaemia. As the purpose of this thesis is to
improve renal function, we explored other ways of improving renal function by
reducing hyperglycemia without weight loss. The aim of study 3 was to explore
the effect of withholding carbohydrates at the first meal after an overnight fast
on the impact of glucose excursions at lunch time and overall 24 hr glycaemia.
We hypothesize that withholding CHO at breakfast will result in higher blood
glucose excursions at lunch time, but with lower overall glycaemia.

53
Chapter 2: Method


55
2.1 Method
2.2 Method for the Main study and CGMS sub-study
2.2.1 Study design
“Weight Loss, Protein and Renal Health” was a randomized, parallel group,
dietary intervention study. Two weight loss diet groups studied for a minimum of
12 months, after a three month run in period.
2.2.2 Recruitment
Participants were recruited by advertisement in local papers, radio and
television. They were included if they met the following inclusion criteria:
� Male or female aged between 18 and 75 years,
� BMI >27 kg/m2
� Type 2 diabetes verified by a FBG >7.0 mmol/L and/or a two hour BG
>11.1 mmol/L or if they were on treatment for diabetes,
� Had microalbuminuria (30-300 mg/24h) or an albumin to creatinine ratio
of 3.0-30.0 mg/mmol, with or without moderately impaired renal function
(e-GFR 40-60 ml/min/1.73m2).
Participants were excluded if they met any of the following exclusion criteria:
� BMI less than 27.0 kg/m2
� a history of malignancy, or a history of metabolic disease such as liver
unstable cardiovascular, respiratory or gastrointestinal disease
� pregnant or breastfeeding
� impaired kidney function due to unrelated disease e.g. glomerulonephritis
(this was verified by medical history and urine samples measured for
blood at the screening visit)
� uncontrolled hypertension (resting recumbent BP>160/100 mmHg)
� a history of alcohol abuse (>5 standard drinks /day)
� known hypoglycaemia unawareness

56
� unwilling to be randomized to either diet group
Three hundred fifteen volunteers with type 2 diabetes were screened for
eligibility and of these 241 were ineligible for the study, mainly through absence
of persistent microalbuminuria. Eleven refused to participate and 7 withdrew
consent prior to randomization. Fifty-six participants were included in the study
and of these eight withdrew consent before commencing the dietary
intervention. Twelve participants (7 HPD, 5 SPD) discontinued during the study
due to unrelated illness, social/financial problems with the study regime or
because they were not satisfied with achieved weight loss. Thirty six
participants (27 men and 9 women) completed the one year dietary intervention
(19 HPD and 18 SPD).
2.2.2.1 Run in period and safety measures
As this population is considered at a higher risk for macrovascular disease, a
run in period was added to secure optimal diabetes and blood pressure control
prior to the study start. All potential volunteers underwent a physical
examination conducted by an endocrinologist. The endocrinologist monitored
the volunteer’s diabetes and blood pressure control throughout the study and
adjusted medication accordingly. The endocrinologist was blinded to the diet
allocation. The target BP was a systolic BP of 120 and a diastolic BP of 80
mmHg. The aim for HbA1c was <7% as suggested by the current guidelines
[217]. Insulin was initiated if HbA1c was consistently above 8% despite
maximum oral hypoglycaemic treatment (two consecutive visits).
Participants were withdrawn from the study if there was a 10% or greater
decline in renal function at any time confirmed on two consecutive occasions or
a 20% decline in renal function at any time (no volunteer was excluded due to
deterioration of renal function). There were no restrictions on medication used
(including insulin) but doses were reduced to avoid hypoglycaemic episodes
with weight loss and energy restriction.
All potential volunteers (n=56) were approached to take part in study 2. Eight
volunteers declined participation. A total of thirty nine volunteers (21HPD and
18 SPD) agreed to participate.

57
Figure 3: The enrolment of eligible subjects.
Enrolment of eligible subjects
Assessed for eligibility (n= 315)
Enrolment
Excluded (n=259)
Not meeting inclusion criteria of microalbuminuria (n=241)
Refused to participate (n= 11)
Withdrew consent prior to randomization (n=7)
Randomized (n=56)
Allocated to HPD (n= 28)
Withdrew consent (n=2)
Received allocated intervention (n= 26)
Allocation
Allocated to SPD (n= 28)
Withdrew consent (n=6)
Received allocated intervention (n= 22)
Discontinued intervention (n= 7)
Unrelated illness (n=3)
Social/financial problems with diet (n=3)
Failure to comply with treatment regime (n=1)
Follow-Up
Discontinued intervention (n= 5)
Unrelated illness (n=1)
Social/financial problems with diet (n=2)
Not satisfied with weight loss (n=2)
Analysed
ITT (n=26)
Completers (n=19)
Analysis
Analysed
ITT (n=22)
Completers (n=17)

58
2.2.3 Randomization:
Volunteers were randomized into 2 diet groups blocks matched on Sex, BMI
and HbA1c. Due to the long inclusion period (2008-2010) the randomization
was done using the minimization method assigning participants to the two
groups while attempting to minimize imbalances between treatment groups. If
for example average BMI was substantially higher in group A compared to
group B, the next participant with a lower BMI would be allocated group A. The
randomization was performed by a trial manager not directly involved in the
intervention.
2.2.4 Dietary intervention
A high protein diet (HPD) was compared to a standard protein diet (SPD). The
aim for the nutrient composition was for protein to fat to carbohydrate was
30:30:40 %TE for the HPD and 20:30:50 %TE for the SPD. The planned range
of protein intake was 90-120 g/day in the HPD vs. 55-70g/day in the SPD.
Saturated fat was planned to be similar in both diets around 10%TE. Alcohol
was limited to 2 standard drinks per week (4g or 2%TE). Fibre intake was high
in both diet plans (31g/day in HPD and 36g/day in SPD). As both diet regimes
aimed at reducing body weight, the kJ content was 6000 kJ subject to change
according to body size (energy intake ranging from 6000-7000 kJ was used and
%TE for protein changed accordingly).
The two diets differed only in the proportion of protein and carbohydrate; total
fat and saturated fat (SAFA) was the same in both diets.
A breakdown of the food choice template is presented in table 2.
An example of the diet allocation can be found in appendix 2
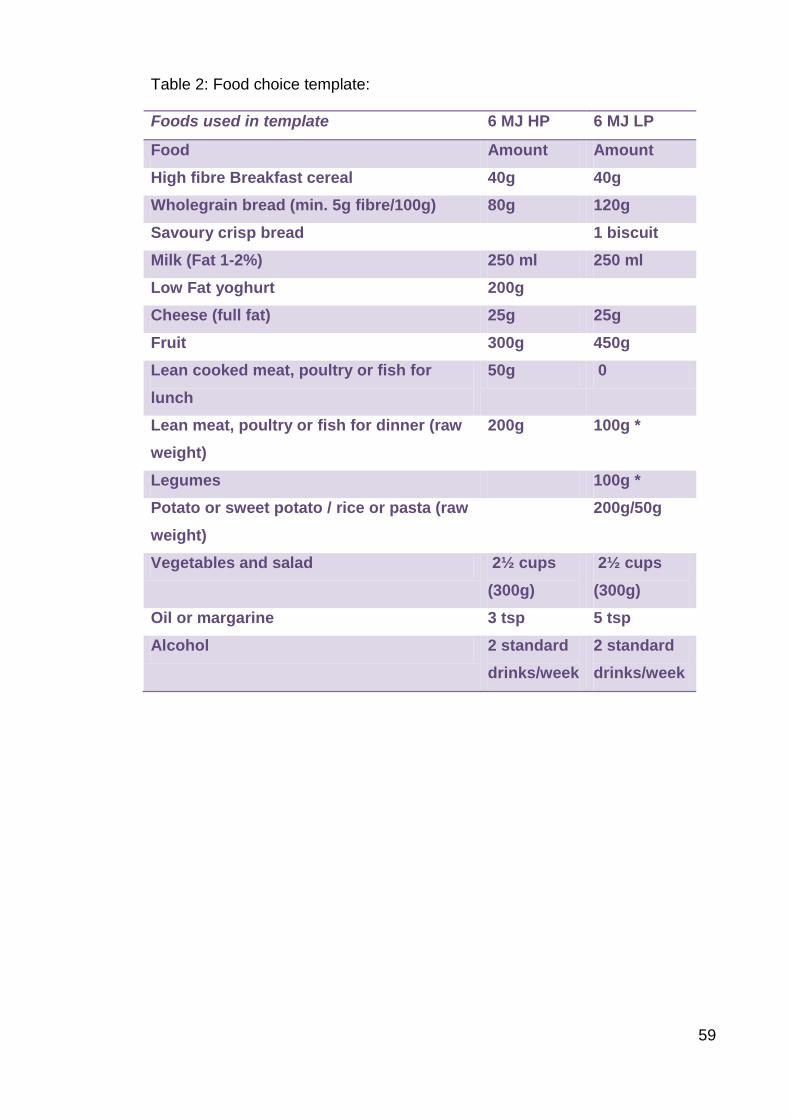
59
Table 2: Food choice template:
Foods used in template 6 MJ HP 6 MJ LP
Food Amount Amount High fibre Breakfast cereal 40g 40g Wholegrain bread (min. 5g fibre/100g) 80g 120g Savoury crisp bread 1 biscuit Milk (Fat 1-2%) 250 ml 250 ml Low Fat yoghurt 200g Cheese (full fat) 25g 25g Fruit 300g 450g Lean cooked meat, poultry or fish for lunch
50g 0
Lean meat, poultry or fish for dinner (raw weight)
200g 100g *
Legumes 100g * Potato or sweet potato / rice or pasta (raw weight)
200g/50g
Vegetables and salad 2½ cups (300g)
2½ cups (300g)
Oil or margarine 3 tsp 5 tsp Alcohol 2 standard
drinks/week 2 standard drinks/week

60
Table 3: Nutrient composition
Comparing the HP to the LP diets. 6 MJ HP 6 MJ LP Nutrients Amount Amount Energy (DF) kJ 5785 5915 Protein (g) 100 68 Fat (g) 45 44 SAFA (g) 16 14 Carbohydrate (g) 121 161 Sugar (g) 72 61 Starch (g) 44 99 Alcohol (g) 4 4 Dietary Fibre (g) 31 36
Protein %TE 29 19 Fat %TE 29 28 SAFA %TE 11 9 Carbohydrate(+DF) %TE 36(+4) 46(+5) Alcohol %TE 2 2
In the upper panel, the food choice template is outlined with total amount of the
individual foods needed. In the lower panel nutrients in the template are given in
g/day and %TE/day. * meat, poultry and fish are allowed as 100g six times per
week in addition a vegetarian meal containing 100g of legumes was
recommended for the seventh day.
2.2.5 Compliance measures
Participants were asked to weigh all foods eaten for the duration of the
intervention (twelve months). If weighing the foods was not possible (e.g. when
eating out) participants were asked to estimate portion size using household
measurements (e.g. teaspoon, tablespoon, cup, etc.).
Digital kitchen scales with precision down to 1g were provided.
2.2.5.1 Diet information booklets:
Diet information booklets specifying the foods needed for the two diets, a food
selection guide for the different energy levels and general advice in how to

61
comply with the diet regime were handed out. A sample daily meal plan and a
selection of diet specific recipes were also included (appendix 2).
2.2.5.2 Checklists:
For the duration of the study, starting at day one of the diet treatment,
participants completed daily weighed records of all foods and liquids consumed.
A pre-printed checklist was provided (an example of the checklist for the two
diets is given in appendix 3).
2.2.5.3 Food frequency questionnaire
Dietary intake was measured by the food frequency questionnaire (FFQ)
developed by the Cancer Council Victoria specifically for use in Australian
adults [218] and validated by Hodges et al [219]. The questionnaire is a 74 item
four page questionnaire, with questions linked for cross referencing intake for
completeness. As an example the first questions asks about the amount of fruits
eaten per day, with answers ranging from none to four or more. This question is
linked with a question on page three where the respondent is asked to specify
the type of fruits eaten and the frequency in the range of never to 3 or more
times per day. From these responses portion sizes are calculated. To calculate
nutrient composition the NUTTAB95 [220] database was used. The output
includes total kJ, protein, CHO (total, starch, sugars, dextrin, and dietary fibre),
fat (total, saturated, polyunsaturated, monounsaturated and cholesterol),
alcohol, some vitamins and minerals.
The questionnaire was administered at baseline on the day of randomization
and was filled in before the volunteer was informed of the diet allocation.
Participants were instructed in the importance of filling in all the questions and
only record one response per line unless otherwise instructed. Questionnaires
were completed using a pencil so that errors could be erased completely. The
FFQ was repeated at four months where the volunteers were asked to report
dietary intake during the last four months from randomization. Capturing the
dietary changes during the entire intervention period of 12 months the FFQ was
repeated at the last visit.

62
2.2.5.4 Three day diet diary
Additionally a three day diet diary was completed before randomization (before
instruction of the diet had commenced), four months and at the end of the study
in conjunction with the continuous blood glucose measuring study. The diaries
were open ended with a column for time, a column for food/ drink taken, a
column for preparation method and a column for amount in weight or household
measures. The diary book contained pages for registering daily exercise
performed and a page for tracking blood glucose. An example of a diet diary is
provided in appendix 4.
Dietary intake was reported using the three day diet records at four and eight
months and at the end of the study. The three day diet record was chosen
because of better correlation between reported and measured protein intake
(FFQ and daily checklists were also assessed; but the reported protein intake
correlated less with measured intake).
2.2.6 Height and weight
Body height was measured at baseline (day of randomization), with the
volunteers not wearing shoes, using a stadiometer to the nearest 0.1 cm
(SECA, Hamburg, Germany).
Volunteers were weighed at all visits to the clinic, wearing light clothing without
shoes, using calibrated electronic digital scales to the nearest 0.05 kg (Weight
range 0-220kg with a deviation at 220 kg = 0.06; Mercury, AMZ 14, Tokyo,
Japan).
2.2.7 Blood pressure
The volunteers were resting in a seated position for at least five minutes before
measurement. The cuff was placed on the bare arm so that the bladder of the
cuff was applied over the brachial artery of the upper arm. The arm was
supported on the arm rest of the clinical chair, which ensures that the arm was
always at the level with the heart. The same arm was used for each visit. An
average of three measurements taken at least two minutes apart, was used.
The measurements needed to be consistent so that systolic blood pressure was
within the range of 10 mmHg and diastolic blood pressure was within the range
of 5 mmHg and more measurements were taken if there was inconsistency. The

63
very first measurement was discarded. When possible, the clinic visits were
arranged at similar times of the day for consistency.
(Philips SureSigns VS3 Patient Monitor, with Philips cuffs small, medium, &
large).
2.2.8 Body composition
Body composition was assessed at the Endocrine and Metabolic unit at the
Royal Adelaide hospital by dual-energy X-ray absorptiometry (DXA), (Norland
DXA bone densitometer medical systems).The DXA machine sends a thin,
invisible beam of low-dose x-rays with two distinct energy peaks through the
body. One peak is absorbed mainly by soft tissue and the other by bone. The
accuracy of the whole body scan was within 2% for total soft tissue.
For the whole body scan a 6.5x13mm resolution was used together with a scan
speed of 260mm/sec. in the table below the coefficient of variation based on 3
scans of the same 14 subjects are outlined (manufacturer data).
Table 4 Variation DXA
The coefficient of variation as given by the manufacturer (Norland DXA,
operators guide 434D142 rev.F)
Total
body C.V.
Head
C.V.
Trunk
C.V.
Abdomen
C.V.
Arms
C.V.
Legs
C.V.
Soft tissue mass 0.1% 1.4% 0.81% 2.3% 1.8% 0.57%
Lean body mass 0.93% 1.4% 1.6% 2.6% 2.3% 1.5%
Fat mass 1.4% 1.9% 1.9% 3.7% 4.8% 2.1%
Percent Fat 1.4% 0.91
%
1.7% 2.2% 3.5% 2.0%
Volunteers were placed on the table in a supine position. They were wearing
hospital gowns to avoid any metal clasps or zippers. Arms and legs were
strapped to the side to minimize movement during the scan. The operator

64
stayed in close proximity of the DXA machine to insure that there was minimal
subject movement.
Figure 4: Fat distribution
In order to determine the distribution of fat mass as visceral or peripheral fat two
indexes were computed.
The central fat mass:
This area includes the chest
and midriff.
Peripheral Fat mass:
This area includes the arms
and legs
The pelvis area was not
included because it contains
part abdominal fat and part
gluteal fat mass, these areas
of fat mass has been shown
to have opposite effect on
insulin resistance and
arterial stiffness leading to
increased risk of diabetes
and CVD [221, 222].
2.2.9 Biochemical measurements
The following urine and blood samples were sent to the Institute of Medical and
Veterinary Science (IMVS), a certified commercial laboratory, for processing.
The Olympus system analyzer was used to analyze creatinine, albumin, urea,
lipids, FBG
Chest
Midriff
Arms
Legs
Central distribution
Peripheral region
Pelvis

65
2.2.9.1 24h Urine Save
Urine was collected 24-hour prior to clinic visit. Urine was kept cold in a cooler
bag with ice bricks until it could be processed– no preservative was added. The
urine samples were processed in the Clinic; participants were asked if the
sample was complete. Weight and volume was recorded. Date & times of
commencement & completion as reported by volunteer were entered into
24hour urine record book. The urine sample was thoroughly mixed. Two 8 ml
(10 ml tube) aliquots of urine were taken for analysis of creatinine, albumin,
urea, protein, Na, K, phosphate. One aliquot was sent to the IMVS for analysis.
The other aliquot was stored at -20°C at the CSIRO as a back-up sample.
2.2.9.2 Spot urine sample
A fresh urine sample was collected at the Clinic at screening, baseline, four
weeks, four months and at the end of the study for the analysis of the albumin
to creatinine ratio. Two aliquots were saved. One was sent to the IMVS for
analysis of albumin level and albumin to creatinine ratio.
2.2.9.3 Urinary creatinine
24h Urine was collected without the use of preservatives. The sample was
analyzed using the kinetic colour test (Jaffé). In an alkaline medium, creatinine
forms a yellow/orange compound when combined with picric acid. At
520/800nm the change in absorbance is proportional to creatinine
concentration. (Olympus analyzer, Biorad liquicheck urine chemistry controls
cat. No. 397 or 398)
2.2.9.4 Urinary albumin
Urinary albumin was collected in a 24h urine collection without preservatives.
Anti-human albumin antibodies were added to yield an insoluble aggregate.
Albumin concentration is directly proportional with the absorbance of this
aggregate. (Olympus System Reagent Microalbumin OSR6167)
2.2.10 Blood samples
2.2.10.1 HbA1c
Whole blood samples were collected in vacuum collection tubes containing
EDTA. Analysis of HbA1c was done by ion-exchange high-performance liquid

66
chromatography in a hydrolyzed whole blood sample (Bio-Rad variant II
haemoglobin A1c pack)
2.2.10.2 FBG
Fasting samples were collected in sodium fluoride/EDTA tubes, and stored on
ice. “Glucose was phosphorylated by hexokinase (HK) in the presence of
adenosine triphosphate (ATP) and magnesium ions to produce glucose-6-
Phosphate and adenosine diphosphate (ADP). Glucose-6-phosphate
dehydrogenase (G6P-DH) specifically oxidises glucose-6-phosphate to
gluconate-6-phosphate with the concurrent reduction of NAD+ to NADH. The
increase in absorbance at 340nm is proportional to the glucose
concentration in the sample”. (Olympus System Reagent Glucose OSR 6121
and OSR 6221).
2.2.10.3 Total cholesterol
Cholesterol esters are hydrolyzed by cholesterol esterase. The free cholesterol
is then oxidized with cholesterol oxidase to form cholesterol-3-one and
hydrogen peroxide. This couples with 4-aminoantipyrine and phenol in the
presence of peroxidase to form a chromophore. The red dye formed
(quinoneimine) is measured spectrophotometrically as increased absorbance at
540/600 nm. (Olympus analyzer, Cholesterol reagent OSR6516).
2.2.10.4 Low Density Lipoproteins
LDL cholesterol was calculated for each person in fasting samples free of
chylomicrons using the Friedewald formula: C- LDL = C-plasma - C-HDL -TG*0.45
2.2.10.5 High Density Lipoproteins
HDL cholesterol was measured using an enzymatic colour test in human serum.
R1 which is an anti human-β-lipoprotein antibody that binds to lipoproteins other
than HDL (LDL, VLDL and chylomicrons) is added to the sample. R2 is added
(PEG-modified enzymes/4-amino-antipyrine/buffer) which forms a purple-blue-
dye. The colour intensity of the dye is directly proportional to the HDL
concentration and is measured photometrically at 600/700 nm wavelength
(HDL-Cholesterol reagent OSR6587 for use on the AU2700 and AU5400
systems only).

67
2.2.10.6 Triglycerides
Triglycerides (TG) are hydrolyzed using microbial lipase to form glycerol and
fatty acids. Glycerol is phosphorylated by adenosine triphosphate to give
glycerol-3-phosphate. Glycerol-3-phosphate is then oxidized by glycerol-3-
phosphate oxidase to dihydroxyacteone phosphate and hydrogen peroxide to
produce a chromophore which is read at 660/800 nm. The increase in
absorbance at 600/800 nm is proportional to the triglyceride content of the
sample (Olympus Triglyceride Test System is an in vitro diagnostic reagent).
2.2.10.7 Serum Creatinine
Blood was collected in tubes containing a serum clot activator. The sample was
analyzed using the kinetic colour test (Jaffé) where in an alkaline medium;
creatinine forms a yellow/orange compound when combined with picric acid. At
520/800nm the change in absorbance is proportional to creatinine concentration
(Olympus analyzer, control no. ODC0003 or ODC0004).
2.2.11 Glomerular Filtration Rate (GFR)
GFR was measured directly by 99mTc-diethylenetriamine-pentraacetic acid
(99mTc-DTPA) at baseline and at the end of the study. Upon admission to the
Department of Nuclear Medicine at the RAH a dose of 50 - 60 MBq 99mTc-DTPA
was injected. Blood samples were taken exactly one and three hours after the
radiopharmaceutical injection. 5-10 ml whole blood was collected in tubes
containing anti-coagulant and centrifuged at 3000 rpm. 200µl plasma and 200 µl
of the standard together with 4 ml water was added into a labelled tube and
counted in a multi sample counter. The rate of clearance of 99mTc-DTPA
corresponds with GFR.
This method of measuring renal function is considered the gold standard.
However, it is not practicable in the everyday clinic because it is time
consuming, more expensive, invasive and requires radioactive tracer. Therefore
numerous equations for estimating GFR (eGFR) have been developed.
Today the most widely used equations are the Cockroft and Gault (CG) with
and without adjusting for body surface area (BSA), the modification of diet in
renal disease (MDRD) and the chronic kidney disease- epidemiology
collaboration (CKD-EPI). Numerous studies have looked at the bias between

68
the different equations and the isotope measured GFR, and no clear consensus
has been reached regarding the equation best suited for estimating GFR
(eGFR) [223]. As participant’s renal safety was paramount, GFR was estimated
at regular intervals using an eGFR based on the MDRD equation during the diet
intervention period.
At the end of the study the four most popular equations were assessed to
establish which equation performed better in this study population. To assess
the agreement between methods a linear regression was performed with each
estimated GFR method and the isotope GFR. The tables show the results of the
linear regressions and estimated group mean using each eGFR method. The
bias of an eGFR method is the difference between the isotope mean and the
eGFR mean. The significance and R2 value of each regression is shown. The
group-level precision of each eGFR method is indicated by the 95% confidence
interval for the predicted mean. The precision of a eGFR method to estimate
individual level values is shown by the prediction intervals in the figures,
showing the range of isotope GFR values that may be observed for a specific
eGFR value with 95% confidence. Prediction intervals are non-linear, being
narrower at values around the eGFR mean and wider at outer edges of the
eGFR range.
The abbreviated MDRD equation was better at predicting the change in GFR
compared to the other three equations. The CG equations, both the adjusted
and the unadjusted for BSA versions, overestimated and the CKD-EPI equation
underestimated true GFR in this sample.

69
The following equations were tested against iGFR to determine the equation
with the least bias. The test showed the MDRD4 equation to predict GFR with
least bias. Abbreviated MDRD equation 4 variables (MDRD4):
GFR= 186*(S-Cr)-1.154*(age) -0.203*(0.742 if female)*(1.212 if black).
The Cockroft and Gault equation unadjusted (CG):
Ccr= (140-age(y))*(wt (kg))/72*S-Cr (mg/dl)
The CG adjusted for body surface area (CG-BSA):
Ccr= (140-age(y))*(wt (kg)) / (72*S-Cr (mg/dl))*(1.73/BSA)
(BSA calculated as: BSA (m2) =0.0235*kg*0.51456*cm*0.42246)
The CKD-EPI equation:
eGFR = 141 x min(Scr/k, 1)a x max(Scr/k, 1)-1.209 x 0.993Age x 1.018 [if
female]

70
Table 5 Predicted bias of eGFR compared to iGFR.
Actual mean for the group
r2
t
p
Predicted Mean for the group
95% CI for the group
95% CI for the individual
99mTc-DTPA
99.2±35.4
CG 139.8±59.7 0.46 6.2 <0.01 99 92 107 49 150
CG-BSA 109.0±37.6 0.51 6.9 <0.01 98 91 106 51 147
MDRD 4 93.3±27.5 0.57 7.5 <0.01 98 92 105 53 144
CKD-EPI 86.9±19.8 0.56 7.5 <0.01 99 92 106 53 145
Predicted bias of eGFR compared to iGFR was assessed at baseline
Table 6 b: Level of bias between iGFR and eGFR
Actual mean for the group
r2
t
p
Predicted Mean for the group
95% CI for the group
95% CI for the individual
99mTc-DTPA
99.0±32.0
CG 141.6±55.9 0.50 6.0 <0.01 100 93 108 54 147
CG-BSA 115.4±39.3 0.50 6.0 <0.01 99 92 107 53 146
MDRD 4 94.9±24.8 0.58 7.2 <0.01 99 92 106 57 141
CKD-EPI 88.4±18.6 0.57 6.9 <0.01 98 91 105 55 141
Predicted bias of eGFR compared to iGFR was assessed again at the end of
the study.

71
Figure 5: GFR regression scatter plot
The MDRD equation still remained the formula with the least bias compared to
iGFR at the end of the study.
The mean difference between measured and estimated GFR using the MDRD
equation was 5.9±22.7 (-36.0, 54.5). As can be seen the mean absolute
difference is small but the variation is large.
The abbreviated MDRD equation was used to estimate GFR in this study.
2.2.12 The following samples were analyzed at the CSIRO
2.2.12.1 CRP
An antigen/antibody complex is formed by coupling anti-CRP antibodies to latex
micro particles which reacts with antigen in the sample. This complex is
measured turbidimetrically. (Particle enhanced immunoturbidimetric assay,
Roche diagnostics, Hitachi 902, wavelengths - main 546nm/secondary 800nm).
2.2.12.2 Cystatin C
Cystatin C is determined turbidimetrically at 546nm with a particle enhanced
assay from Randox. Human cystatin C agglutinates with latex particles coated
with antibodies against cystatin C (Randox kit, Hitachi 902).

72
2.3 Continuous blood glucose measurements (CGMS)
(CGMS sub-study and study 3) The Continuous Glucose Monitoring System (CGMS) Medtronic MiniMed, Gold
standard system (Northridge, CA) was used in both the sub study and in study
3. CGMS is a well-recognized tool currently used to gain a complete picture of
the diurnal blood glucose profiles in diabetic patients. This system has been
validated in studies including T1DM patients and is now also used in T2DM
patients and in research. The CGMS provides a complete picture of the diurnal
BG with minimal inconvenience to the patient [224].
A glucose oxidase–based sensor is inserted into the skin of the abdomen or
upper buttock subcutaneous tissue, using a spring loaded insertion device.
Insertion is quick and virtually painless. After insertion, the sensor is secured in
place with tape and attached via a cable to a pocket size monitor, which is worn
on a belt or placed in a pocket, like a pager, while the volunteer continues with
normal everyday activities for up to 72 hours.
Extracellular glucose is measured every 10 seconds and averaged every five
minutes. The measurements are stored in the monitor yielding 288
measurements / 24 hours.
The CGMS monitor was calibrated against corresponding blood glucose levels
determined by using finger prick measurements. The participants were blinded
to the actual blood glucose measurements which was first revealed when data
was downloaded via the Minimed computer program (MEDTRONIC MINIMED
software 3.0C program). For calibration purposes and to prevent unsuspected
sustained periods of hyper or hypo-glycaemia at least four self-measured blood
glucose (SMBG; Medisense, Optimum; Abbott Laboratories, Abbott Park, IL)
measurements were used every day starting at initiation of the system and then
before breakfast, lunch and dinner and bedtime. Participants were encouraged
to use more SMGB measurements if the BG was low or high or if symptoms
arose.
The accuracy of measurements using either SMBG or the glucose oxidized
sensor have been assessed using time difference between interstitial glucose
and SMBG measured blood glucose in 24 sets of data. Results showed a lag

73
time between the two glucose measurements of 4-10 minutes. In all instances
the interstitial glucose lagged behind the measured blood glucose. Therefore
significant differences between interstitial and blood glucose may occur in rapid
increases or decreases of BG [225].
Figure 6 CGMS monitor and position of the sensor.
CGMS monitor (Medtronic 2005) http://www.minimed.com/professionals/products(cgms/
Sensor insert beneath the skin of
the abdomen.
2.3.1 Gastric emptying breath test (study 3)
Gastric emptying time was measured using 13C-Octanoic acid. For testing solid
meals 13C-Octanoic Acid is used, the advantage is that 13C-Octanoic acid is
retained in a solid meal while passing through the stomach, followed by a rapid
absorption of the 13C-Octanoic acid and subsequent oxidation to 13CO2 and
elimination through the lungs [226]. The limiting factor for the rate of 13CO2 in
the breath is gastric emptying [227].
For estimating gastric emptying time two mathematical formulas are fitted [228].
The first formula calculate the excretion of the percentage of the dose given
y=atbc -ct
Where y represent the % cumulative excretion of 13CO2 /hour; a, b and c are
constants and t is the time in hours.

74
The second formula is derived from the fact that the breath test curve of the
cumulative dose eliminated over time is inversely analogous to the curve
produced by the radioscintigraphy method.
y = mkβe-kt (1-e-kt)β-1
A nonlinear regression is applied to estimate the constants m, k and β using the
least square method. The nonlinear regression analysis is performed using the
solver program in excel (Microsoft Corp., Redmond, WA) is then used to allow
three variables of gastric emptying [226].
From this analysis three variables are derived T½, Tlag and Tmax
Where T½ is the time elapsed for one half of the meal to be emptied from the
stomach, Tlag is the time for 5% of the meal emptying and Tmax is the gastric
peak time which is the maximum percentage 13C-Octanoic Acid dose recovered
per hour, it is measured at the point of inflection on the recovery curve. All
variables are expressed in minutes.
Figure 7: Typical curve for gastric emptying in this study
Typical GE curve, the ■ represent the theoretical GE curve. The ♦ show the
actual GE time when 100 mg 13C-Octanoic Acid is given in a solid meal.
0
2
4
6
8
10
12
0 1 2 3 4 5 6 7
Time (h)
%do
se/h

75
For correcting the analysis of abnormal gastric emptying with a double peaked
emptying curve a mathematical fitting formula has been developed to classify
the type of curve and calculate the gastric emptying variables [229].
This formula includes fitting two curves, using the point of the first curve and the
starting point of the second curve as nadir. One single curve and one double
curve was applied, the correlation between the two curves were compared
using the measured data and the fitted line. Correlation had to be >95% for the
model to be accepted.
Figure 8 Typical example of a double peaked gastric emptying curve
Typical example of a double peaked GE curve, the ■ represent the theoretical
GE curve. The ♦ show the actual GE time when 100 mg 13C-Octanoic Acid is
given in a solid meal.
The rate of gastric emptying was assessed using 100 mg of 13C-Octanoic Acid
mixed into a one egg “omelette” and included as a part of the sandwich meal
given at lunch time.
The breath test continued for 6 hours after the lunch meal on the first day of the
test in both weeks. The breath tests were collected in non-sterile 13ml Exetainer
tubes (Labco limited, High Wycombe, England) by exhaling through a straw, the
tubes were immediately closed tight.
0
1
2
3
4
5
6
7
8
0 1 2 3 4 5 6 7
Time (h)
%do
se/h

76
Test schedule: T0 (immediately before the meal for baseline value), T15, T30,
T45, T60, T75, T90, T105, T120, T150, T180, T210, T240, T270, T300, T330
and T360
Volunteers were asked to consume the meal within 20 minutes. All foods
allocated for the meal were be consumed together, with no snacks or drink
other than coffee, tea, water and diet soft drinks were allowed between meals.
All tubes were labelled with subject number, breakfast meal code and date.
Volunteers were asked to write the actual time of the test on the tubes. Each
breath test was taken in duplicate at every time point.
One breath test tube was sent to the Women’s and Children’s Hospital,
Adelaide, for analysis. The other test tube was stored at CSIRO for back up.
2.4 Statistics
All data was tested for normal distribution using the residuals for the model
used in the specific analysis (Residual Q-Q plots, histogram, scatter plot)
Descriptive statistics (means, crosstabs and graphs)
Independent samples T-test was used to test for differences between
treatments at baseline.
Paired sample T-Test was used to test for changes over time.
A one-tailed, non-inferiority approach (ie HPD was not inferior to a SPD weight
loss diet) was used to analyse the main outcome of renal function (iGFR, eGFR,
cystatin C and S-creatinine). Results are given as baseline adjusted values.
To answer the question “Are there differences between groups at the end of the
study, controlling for baseline pre-test values?” and “did the groups change
differently?” an analysis of covariance (ANCOVA) was used. The post test
results were used as the dependent variable. The pre-test scores obtained
before the treatment started were used as covariates. Group used as a between
subject variable. The ANCOVA using pretest as covariate is more powerful than
the ANOVA using pretest as a linear component to the dependent variable.
When participants have been randomized and a pretest have been collected
prior to treatment, the ANCOVA will have higher statistical power [230]

77
Logarithmic transformation (log10) was used when data was not normally
distributed. In the case of log transformation, the descriptive data was given in
the non-logged form but all analysis was done in the logged form.
Pearson’s product moment was used to determine correlations and multiple
linear regression was used to assess associations.
All data are given as means with standard error (mean (SEM)) unless otherwise
stated.
For the analysis of the completer’s data SPSS 18 for windows, IBM, was used.
For the intention-to-treat (ITT) analysis a full information maximum likelihood
(FIML) model was used. The software SPSS AMOS, student version, was used.
All randomized volunteers who completed the baseline visit and had all
measurements at this visit done were included in the analysis. This method of
analysing missing data has been reported to be superior to the standard
statistical method using either list-wise exclusion (where all records with missing
data at any point are excluded) or pair-wise exclusion (where all reports with
missing pairs of variables (one or both variables) are excluded from the
analysis) [231].
This is a modified ITT analysis because the volunteers who dropped out of the
study were not contacted at the end of the 12 Mo intervention.
Significant level was set at p<0.05.
For study 3 differences in between and within groups were analyzed using
repeated measures ANOVA. Differences between meals were assessed using
paired sample T-Tests. Treatment was used as a within subject factor (CHO =
breakfast containing carbohydrate and NoCHO = breakfast without
carbohydrate). The groups were divided by glycaemic control according to
baseline HbA1c into good control (HbA1c ≤7%) and poorly controlled (HbA1c
≥8%).
2.4.1 Power calculation
The power of the study was based on the paper by Knight et al 2003 who
assessed women with impaired renal function over an 11 year period based on
serum creatinine only. Essentially they demonstrated a fall in creatinine
clearance of 7.72 ml/min /1.73 m2 per 10g protein over the 11 year period. The

78
diets were planned to give a difference of approximately 50g protein between
the diet groups. Therefore after one year, a difference between diets in the
change in GFR of about 5% may be expected. Using a non-inferiority approach
and using the standard deviation of 13.4 ml/min from this paper we would have
80% power (p<0.05) to see this change at one year with 89 people in 2 groups
completing the study. An additional 25% were planned to be recruited to
account for dropouts. A difference in GFR between treatments of 0-5% will not
be considered clinically significant.
Based on other similar weight loss studies [143, 188], a drop-out rate was 25%
was expected. That meant that 120 participants would have to be included in
each group.
2.4.2 Ethics
All experimental procedures were approved by Human Ethics Committees of
the Commonwealth Scientific Industrial Research Organization (CSIRO) and
the University of Adelaide. Participants were instructed in all study procedures
in both oral and written form and all participants provided written informed
consent.
ANZCTR Registration number:
ACTRN 12608000045314 for the main study,
ACTRN 12609000331235 for the carbohydrate timing study (study 3)

79
Chapter 3: Renal function


81
3.1 Main study
Weight loss is one of the cornerstones in the treatment and prevention of Type
2 diabetes (T2DM) and a weight loss of 5 – 10 % of total body weight has been
reported to result in improved glycaemic control, improved insulin sensitivity and
improvement in micro and macrovascular risk markers [232]
Long-term randomized intervention studies looking at the effect of high protein
weight loss diets in T2DM are scarce. Long-term randomized intervention
studies designed to analyse the effect of high protein weight loss diets
compared to the standard diabetes diet in T2DM participants with impaired
renal function, are lacking.
In this study, we evaluated the effect of two energy restricted diets, a high
protein diet (≈30%TE) vs. a standard protein diet (≈20%TE), on renal function in
type 2 diabetes participants with microalbuminuria. This was a randomized,
parallel, controlled study with participants stratified according to HbA1c, BMI
and sex before randomization.
3.2 Aim and hypothesis
The aim of this study was to explore whether a weight-loss diet, high in protein
in place of carbohydrate, has a beneficial effect on renal function, measured by
GFR, in subjects with T2DM and with microalbuminuria. We hypothesized that a
high-protein weight-loss diet, by virtue of the weight loss, would have a
beneficial effect on markers of renal function in type 2 diabetes subjects with
microalbuminuria and/or renal impairment
3.3 Main outcome � Renal function measured by:
� Isotope glomerular filtration rate (iGFR)
� Estimated GFR (eGFR)
� serum cystatin C
� Serum creatinine (S-Cr)
� Microalbuminuria (AER)
� Albumin to creatinine ratio (alb/cr)

82
3.3.1 Secondary outcome
� Weight loss (WL)
� Blood pressure (BP)
� Serum lipids
� Glycaemic control
3.4 Results
Forty eight volunteers were randomized for this study; twelve volunteers
discontinued after randomization. Four discontinued due to unrelated illness (3
HPD and 1 SPD), and five due to social or economic problems with diet (3 HPD
and 2 SPD). One did not comply with treatment regime (did not attend clinic
visits, HPD) and two were unsatisfied with weight loss results (SPD). Thirty six
volunteers completed the twelve months intervention and are included in the
analysis.
Each group has been stratified according to sex, HbA1c and BMI before being
randomly assigned to either the HPD or the SPD diet.
There were no significant differences between randomized groups at baseline.

83
Table 6 Baseline characteristics
HPD SPD p value
Sex (M / F) 14 / 5 13 / 4
age at study start 59.5±2.4 61.4±1.7 0.53
Diabetes duration (years) 12.8±2.7 8.5±1.1 0.17
Height (m) 1.7±0.0 1.7±0.0 0.84
Weight (kg) 106.9±5.4 107.6±4.9 0.92
BMI (kg/m2) 36.4±1.6 36.3±1.1 0.95
FBG (mmol/L) 8.0±0.4 8.1±0.5 0.94
HBA1C (%) 7.4±0.2 7.1±0.2 0.32
IGFR 108.3±9.2 89.1±6.5 0.10
eGFR 93.9±6.1 92.7±7.1 0.89
S-Cr (µmol/l) 77.4±4.3 80.6±6.4 0.68
Cystatin C (mg/L) 0.9±0.04 0.9±0.05 0.67
AER (µg/min) 41.8±10.6 71.8±13.9 0.09
Alb/cr 5.9±1.6 8.4±1.9 0.33
SBP 126.3±3.0 125.1±2.9 0.78
DBP 74.2±1.6 69.0±2.3 0.06
HPD is the high protein diet and SPD is the standard protein diet. Data are
given as means (SEM). Differences in baseline values were tested using
independent samples t-test. Significance is set at p<0.05.

84
3.4.1 Diet
At baseline the self-reported energy intake did not differ significantly between
groups. Participants consumed similar amounts of protein at baseline, but there
was a significant difference in protein intake at the end of the study (p<0.01).
There was no significant difference in percentage protein to energy ingested at
baseline (p=0.42). At the end of the study the percentage protein to energy
ingested was significantly higher in the HPD (p<0.01).
Carbohydrate intake did not differ between groups in the self-reported data
when expressed as gram of CHO. However, when the data was expressed as
%TE there was a significant difference between diets at four and 12 months
(p<0.01) but no difference at baseline (p=0.80).
There were no significant differences in the fat, alcohol or fibre intake at any
point.
For nutrient breakdown refer to table 7 and 8.
3.4.1.1 Measured protein intake calculated from urinary urea excretion.
Compliance with protein prescription was measured by 24h urine urea excretion
(UUE). At baseline UUE did not differ between groups (486.3±33.3 and
528.2±38. 3 mmol/24h in HPD and SPD respectively; p=0.41). There was a
significant treatment effect at four months (estimated marginal means adjusted
for baseline: 480.1± 22.2, 95% CI 435.6, 528.9 for the HPD and 368.8 ± 23.5,
95% CI 321.1, 416.5; p=0.002). At 12 Mo the adjusted difference in UUE was
still significant (estimated marginal means adjusted for baseline: 507.8± 24.1,
95% CI 458.8, 556.8 for the HPD and 427.6 ± 25.5, 95% CI 375.7, 479.7;
p=0.029).
Conversion from UUE to protein intake in gram per day using the equation:
Protein intake = ((UUE * 0.034) * 6.25)) [233]
Converted to grams of protein ingested per day the UUE values are equal to
103.3±7.1 and 112.3±8.1 g dietary protein/ day at baseline in the HPD and SPD
groups respectively (p=0.41). At the end of the study the protein intake in the

85
HPD group was 105.1±8.2 and in the SPD 94.0±5.7 g protein/day. This
difference in protein intakes at 12 months did not reach statistical significance.
However, because of the different protein intakes at baseline (SPD had a higher
intake), there was a significant difference in protein intake adjusted for baseline
value between treatment groups at 12 Mo (p=0.03).
Figure 9: Protein intake measured by urinary urea excretion.
Data represented as mean (SEM).
3.4.1.2 Nutrient composition
The 3 day diet record was used to assess changes in nutrient intake between
baseline, four months and 12 months. There was a significant decrease in
energy intake over time (p<0.001) with no significant difference between
treatments at 12 Mo. Protein intake changed significantly with time (p=0.04)
with a significant treatment effect (p<0.001). Fat intake decreased with time
(p<0.001) with no significant treatment effect. CHO decreased significantly with
time (p=0.001) with no treatment effect. Alcohol and dietary fibre did not change
significantly with time .The saturated fatty acids (SAFA) decreased significantly
with time with no difference between treatments (table 7).
80
90
100
110
120
130
Baseline 12 Mo
g/da
y
Measured protein intake
HPD SPD

86 Tabl
e 7:
Nut
rient
inta
ke m
easu
red
by 3
day
die
t rec
ord
Base
line
to 4
Mo
Base
line
to 1
2 M
o
Trea
t Ba
selin
e 4M
o 12
Mo
Time
Trea
t Tim
e Tr
eat
kJ
HPD
88
60±4
77
7214
±430
72
38±3
76
<0.00
1 0.1
7 <0
.001
0.31
SP
D
8800
±570
64
48±3
84
6553
±561
Pr
otein
(g)
HPD
11
0±9
111±
8 11
3±6
0.005
<0
.001
0.035
<0
.001
SP
D
102±
5 75
±6
71±6
Fa
t (g)
HP
D
80±6
59
±4
60±4
<0
.001
0.09
<0.00
1 0.5
0
SPD
81
±4
48±4
55
±7
SAFA
(g)
HPD
32
±3
23±2
24
±2
<0.00
1 0.2
3 0.0
01
0.66
·
SPD
31
±3
19±2
22
±3
CHO
(g)
HPD
21
0±13
17
6±12
16
1±13
0.0
11
0.71
<0.00
1 0.4
8
SPD
21
9±16
18
5±12
17
7±14
Al
coho
l (g)
HPD
11
±5
0.2±0
.2 7±
3 0.0
07
0.11
0.434
0.5
9
SPD
5±
3 1.2
±0.5
6±3
Fibre
(g)
HPD
26
±2
27±2
24
±2
0.251
0.4
7 0.3
36
0.49
SP
D
28±2
30
±3
27±2
Th
e da
ta in
the
tabl
e re
pres
ents
the
self-
repo
rted
nutri
ent i
ntak
e at
bas
elin
e, fo
ur a
nd 1
2 m
onth
s, u
sing
the
3 da
y di
et re
cord
. Tre
at is
treat
men
t, H
PD
is th
e hi
gh p
rote
in d
iet a
nd S
PD
is th
e st
anda
rd p
rote
in d
iet.
SA
FA is
sat
urat
ed fa
tty a
cids
. The
re w
ere
sign
ifica
nt
chan
ges
over
tim
e in
all
nutri
ents
exc
ept f
ibre
at 4
Mo
and
all n
utrie
nts
exce
pt a
lcoh
ol a
nd fi
bre
at 1
2Mo
com
pare
d to
bas
elin
e. A
djus
ted
for b
asel
ine
prot
ein
and
fat w
as s
igni
fican
tly d
iffer
ent b
etw
een
treat
men
ts a
t 4 M
o. A
t 12M
o on
ly p
rote
in d
iffer
ed s
igni
fican
tly w
hen
adju
stin
g fo
r bas
elin
e.

87
Nutrient composition measured as percentage of energy intake changed
significantly with time. Protein %TE increased in the HPD and remained stable
in the SPD. %TE for fat decreased significantly with time, with no significant
difference between groups. %TE for CHO increased in the SPD and remained
stable in the HPD, indicating that the change in energy intake was due to
decreased fat. Alcohol decreased in both groups with time with no significant
treatment effect. There was a significant change in g fibre/MJ over time and
between diets, however the actual difference was only 1g/MJ (table 8).
Table 8: Nutrient intake expressed in percentage of total energy
Baseline to 4Mo Baseline to 12Mo Time Treat Time Treat
Protein (%TE) HPD 22 26 27 0.08 <0.001 0.049 0.003
SPD 20 20 19
Fat(%TE) HPD 33 30 30 <0.001 0.196 0.001 0.71
SPD 34 27 30
CHO(%TE) HPD 41 41 38 0.008 0.001 0.799 0.001
SPD 42 49 46
Alcohol (%TE) HPD 3 0.1 3 0.006 0.115 0.008 0.701
SPD 1 0.5 2
Fibre(g/MJ) HPD 3 4 3 <0.001 0.026 0.003 0.011
SPD 3 5 4
Nutrients expressed in %TE, fibre is expressed as g/MJ (all numbers rounded to
the nearest whole number).

88
3.5 Renal Function
The aim of this study was to determine if weight loss had a beneficial effect on
markers of renal function. There was a significant weight loss in both groups
over time (HPD -10.5 kg and SPD -7.5 kg) with no significant difference
between groups (weight change and body composition will be discussed in
chapter 4).
Renal function was measured by iGFR, eGFR, S-Cr, serum creatinine to lean
body mass ratio (S-Cr/LBM), AER and alb/cr.
3.5.1 Glomerular filtration rate
3.5.1.1 Isotope glomerular filtration rate (iGFR, ml/min/1.73 m2)
iGFR showed no significant difference between groups at baseline 108.3±9.2
and 88.9±6.5 ml/min/1.73 m2 in the HPD and SPD groups respectively (p=0.10).
At the end of the 12 months intervention iGFR had decreased in the HPD to
101.8±8.1 ml/min/1.73 m2 and the SPD had increased to 95.9±6.9 ml/min/1.73
m2 (p=0.94 for time). Adjusting for baseline values there was no significant
difference between groups (p=0.095).
The change in iGFR was significantly negatively correlated with diabetes
duration (r= -.39, p=0.04) and the change in mean arterial blood pressure (r= -
.40, p=0.02). There were borderline negative correlations between the change
in SBP, DBP and the change in iGFR (r= -.32 and r= -.32, p=0.06 respectively).
Using multiple linear regression with change in iGFR as the dependent variable
and change in protein intake, weight loss and change in SBP as independent
variables revealed no significant associations to the change in protein intake r2
= 0.04, p=0.84 or weight loss r2 = 0.13, p=0.49 but there was a borderline
significant positive association to SBP r2 = 0.33, p=0.06.
3.5.2 Serum creatinine (µmol/L)
Serum creatinine (S-Cr) as a marker of renal function is the simplest measure
available. In steady state production and excretion of creatinine will be identical.
There was no significant difference in S-Cr at baseline (p=0.68). During the
intervention there was a non-significant decrease (p=0.21).

89
Adjusting for baseline values, there was a non-significant difference in S-Cr
between randomized groups at twelve months (0.34).
Figure 10: Changes in Cystatin C and Serum Creatinine over time.
0.700.750.800.850.900.95
Baseline 12 Mo
Cystatin C
HPD (n=19) SPD (n=17)
mg
/ L
60
70
80
90
Baseline 12 Mo
Serum Creatinine
HPD SPD
umol
/L
HPD (blue solid line) and SPD (green broken line). The bars represent mean
(SEM). There were no significant differences between treatments at twelve
months.
3.5.2.1 Estimated GFR by MDRD4 equation (eGFR, ml/min/1.73 m2)
At baseline the eGFR was similar between the two groups and did not change
significantly over time. Adjusting for baseline values, there was no significant
difference between groups.
The change in eGFR was negatively correlated with the change in Cystatin C
(r=- 0.33; p=0.047), no significant correlations were found between the change
in eGFR and sex, protein intake, glycaemic control, BP or AER.

90
Figure 11: iGFR measured by 99mTc-DTPA and estimated using the abbreviated
MDRD formula at baseline and at the end of the study.
GFR
708090
100110120130
Baseline 12 MoHPD (n=19) SPD (n=17)
ml/m
in/1.
73m
2
iGFR ( 99m Tc-EDTA )
80859095
100105
Baseline 12 Mo
ml/m
in/1
.73
m2
eGFR ( MDRD 4 )
HPD (n=19) SPD (n=17)
HPD (blue solid line) and SPD (green broken line). The bars represent mean
(SEM). There were no significant differences in either iGFR or eGFR over time
or between groups.
3.5.3 Cystatin C (ml/L)
At baseline there were no significant differences in cystatin C between the
randomized groups (p=0.85). There was no significant change in Cystatin C
over time (p=0.26). No significant treatment effect was found at twelve months
(p=0.14).
All measures of renal function were highly significantly correlated with iGFR at
baseline, with the eGFR showing the strongest correlation (r= 0.77; p<0.01);
both Cystatin C (r= -0.69) and S-Cr (r = -0.58) were strongly negatively
correlated with iGFR (p<0.01). At twelve months the correlation was still strong
eGFR (r = 0.75); Cystatin C (r = -0.68) and S-Cr (r = -0.52) p<0.01.
Furthermore there was a strong correlation between S-Cr and Cystatin C at
both baseline and twelve months (r = 0.75, p<0.01 and r=0.73, p<0.01
respectively).

91
3.5.4 Serum creatinine to lean body mass ratio
The S-Cr/LBM (µmol/L/kg) did not differ between groups at baseline (p=0.83)
and there were no significant changes with time (Change in the HPD=
0.03±0.04 and SPD 0.0003±0.05 respectively, p=0.64) or between groups at the
end of the study.
3.5.5 Microalbuminuria
Albumin excretion rate (AER) was tested for normal distribution using the
residuals of the outcome model, a violation was found and the AER was log10
transformed. Descriptive data are presented using the un-logged data, all
analysis are done using the logged data.
3.5.6 Albumin excretion rate (µg/min)
AER measured in a 24h urine collection, was significantly different at baseline
(41.7±10.6 vs. 71.8±13.9 µg/min in HPD (n=19) and SPD (n=17) respectively;
p=0.01). There was a non-significant change with time (to 29.8±9.0 vs.
72.8±16.4 µg/min in HPD and SPD, p=0.20).
Adjusting for baseline values there was a borderline significant difference
between groups at the end of the study (p=0.06), where the HPD had
decreased and the SPD had increased slightly. Adding WL, change in SBP and
average protein intake at 12Mo to the model did not have a major effect on the
outcome (p=0.066).
3.5.7 Albumin to creatinine ratio (alb/cr) Alb/cr did not differ between randomized groups at baseline (HPD = 5.9±1.6
and SPD 8.4±1.9; p=0.70). There was no significant change with time. The HPD
decreased by 1.2 and the SPD increased by 0.4. Adjusting for baseline values
there was a borderline significant difference between groups at twelve months
(p=0.06). Adding WL, change in SBP and protein intake to the model as
covariates did not change the outcome (p=0.061)
Using multiple regression with the change in AER as dependent variable and
the known major contributors to increased AER (HbA1c and SBP) and weight
loss as independent variables revealed a significant model (r2= 0.28, p=0.02). In
this model WL showed the strongest association with the change (r2= 0.48,

92
p=0.01). SBP was borderline significantly negatively associated (r2= -0.34,
p=0.06), there was no significant association with HbA1c (r2= 0.22, p=0.28).
Using the same model with alb/cr change as dependent variable showed a
strong negative association with SBP (r2= -0.56, p=0.003).but no significant
association with HbA1c or WL. (Changes in BP are described in chapter 5).
Figure 12: Microalbuminuria
0
20
40
60
80
100
Baseline 12 Mo
µg/m
in
AER
HPD (n=19) SPD (n=17)
0
5
10
15
Baseline 12 Mo
Alb/Cr
HPD (n=19) SPD (n=17)
Microalbuminuria measured as Albumin excretion rate and albumin to creatinine
ratio. The bars represent mean (SEM). HPD (blue solid line) and SPD (green
broken line). There were borderline significant differences in AER (p=0.059) and
alb/cr (p=0.055) at the end of the study.
3.6 Medication
Of the 36 subjects who completed the study, three managed their diabetes with
diet alone, 33 were treated with metformin, 11 with sulfonylurea, seven with
glitazones and six were treated with insulin.
Metformin in mono therapy was given to 15 volunteers, nine were treated with a
combination of metformin and sulfonylurea, one with metformin and glitazones,
three with metformin, sulfonylurea and glitazones and four were treated with a

93
combination of metformin and insulin glargine and two volunteers were treated
with metformin, sulfonylurea and insulin Novomix and mixtard.
During the study there were some medication changes, where three participants
in HPD stopped medication, two increased medication dose and four changed
to other medication vs. three volunteers increasing and two changed to other
medication in the SPD group.
Blood pressure was treated with ACE inhibitors (n=16), beta blockers (n=6),
angiotensin II receptor blocker (n=9), calcium channel blockers (n=9), diuretics
(n=10) and an alpha blockers (n=1). Eight volunteers used no BP medication,
13 were on mono-therapy, eight were on dual treatment, six were on triple
therapy and one volunteer received four different BP medications.
Other medication included lipid lowering medication and antidepressants.
Medication was optimized as indicated by an endocrinologist or the participant’s
general practitioner before the start of the study and monitored throughout the
study. All participants reported a moderate to low physical exercise level and
they were asked to maintain this level throughout the study.

94 Tabl
e 9:
Cha
nges
in re
nal f
unct
ion
mar
kers
bet
wee
n ba
selin
e an
d 12
mon
th
Tr
eatm
ent
base
line
12 M
o C
hang
e
P= T
ime
P ad
just
ed fo
r ba
selin
e
Wei
ght (
kg)
HP
D
n=19
10
6.9±
5.4
96.4
±5.1
"-
10.5
±3.2
<0
.01
0.41
SP
D
n=17
10
7.6±
4.9
100.
1±4.
8 "-
7.5±
1.9
iGFR
(ml/m
in/1
.73
m2)
H
PD
n=
19
108.
3±9.
2 10
1.8±
8.1
"-6.
6±4.
9 0.
94
0.09
5
SP
D
n=17
88
.9±6
.5
95.9
±6.9
"+
6.8±
4.7
eGFR
(ml/m
in/1
.73
m2)
H
PD
n=
19
93.9
±6.1
95
.5±4
.9
"+1.
5±3.
2 0.
49
0.49
SP
D
n=17
92
.7±7
.1
94.3
±7.3
"+
1.7±
3.4
Cys
tatin
C (m
l/L)
HP
D
n=19
0.
85±0
.04
0.83
±0.0
3 "-
0.02
±0.0
1 0.
26
0.14
SP
D
n=17
0.
88±0
.05
0.88
±0.0
5 ""
0.0±
0.0
S-C
reat
inin
e (µ
mol
/L)
HP
D
n=19
77
.4±4
.3
75.0
±3.5
"-
2.5±
2.2
0.21
0.
34
S
PD
n=
17
80.6
±6.4
78
.5±5
.4
"-2.
1±2.
9
AER
(µg/
min
) H
PD
n=
19
41.7
±10.
6 29
.8±9
.3
"-12
.0±9
.1
0.20
0.
059
S
PD
n=
17
71.8
±10.
6 72
.8±1
6.4
"+1.
0±17
.0
Alb
/cr
HP
D
n=19
5.
9±1.
6 4.
7±1.
6 "-
1.2±
1.9
0.24
0.
055
S
PD
n=
17
8.4±
1.9
8.8±
2.0
"+0.
4±2.
4
Dat
a ar
e gi
ven
as m
ean
(SE
M) f
or m
arke
rs o
f ren
al fu
nctio
n, iG
FR, e
GFR
, Cys
tatin
C a
nd S
-Cre
atin
ine,
the
non-
infe
riorit
y ap
proa
ch w
as
used
and
a o
ne ta
iled
test
use
d. F
or w
eigh
t, A
ER
and
Alb
/cr t
he a
djus
ted
AN
CO
VA
with
a tw
o si
de p
val
ue w
as u
sed.

95
3.7 Discussion
The main finding of this study was that a high protein weight loss diet did not
exert a negative effect on renal function in type 2 diabetes participants with
microalbuminuria or renal impairment, compared to a standard protein, weight
loss diet. Although the number of people randomised was a lot lower than
planned in the statistical analysis, the fact that there was no correlation at all
between protein intake and change in renal function provides confidence that
the negative result was not a result of inadequate power. Changes in eGFR and
cystatin C clearly show no differences between diets.
Renal function was measured by a number of different methods requiring blood
and urine collection:
1. Serum creatinine (S-Cr) is used as a simple and easy measure of renal
function, this measure was used as one of the primary outcomes in many of the
early studies looking at the effect of decreasing dietary protein intake on renal
function [78, 83, 84]. The benefit of using S-Cr is the relative ease of obtaining
the measure and interpretation can be done quickly at bedside. However, there
are major limitations in the use S-Cr as diagnostic measure of renal dysfunction,
S-Cr is dependent on muscle mass and if the volunteer is not in steady state,
i.e. in conditions of weight loss, S-Cr will decrease. The major determinants of
the total creatinine pool are age and sex [234]. It has been shown that an
estimated 50% decrease in GFR is evident by the time S-Cr moves outside the
normal range [91]. The Jaffé colour reaction assay lacks precision in
determining S-Cr within the normal range which makes interpretation of any
change difficult [234]. Therefore S-Cr should not be used alone as the measure
of renal function in early renal disease [235]. No cut-off point has been
established which will effectively determine renal disease. The reference values
used in this study were between 72-127 µmol/L for male and 58-96 µmol/L for
female volunteers, the level of S-Cr where patients are often misdiagnosed as
having normal kidney function is within the normal range of 80-120 µmol/L
[235]. In the present study there was a non-significant decrease of S-Cr in both
groups indicating loss of muscle mass due to weight loss. When S-Cr was
measured per kg LBM the change was equal in the two randomized groups
indicating no difference in renal function.

96
2. Serum cystatin C is a more reliable predictor of early kidney disease
compared to S-Cr [236]. Cystatin C is a low molecular amino acid which is
produced at a constant rate in all nucleated cells and is unaffected by age, sex,
or muscle mass. Cystatin C is freely filtered and metabolized by the tubules
[237]. Testing the predictive value of cystatin C compared to S-Cr and
estimated GFR using the MDRD formula with measured GFR using 51CrEDTA
clearance in 164 participants with mildly impaired renal function (GFR 30-80
ml/min/1.73m2) as reference, showed cystatin C to have higher accuracy in
diagnosing renal impairment than both S-Cr and eGFR (MDRD) [236]. The
same results were reported in 125 participants with T1DM and 163 participants
with T2DM with impaired renal function (GFR 4-222 ml/min/1.73m2), in this
population iohexol clearance, S-Cr and MDRD estimated GFR were compared.
Cystatin C correlated better with iohexol clearance (r = 0.86) compared to S-Cr
(r = 0.77) and eGFR (MDRD, r = 0.81) p<0.01 [237].
We found no significant change in Cystatin C over time or between groups,
indicating no harmful effect of the higher protein intake during the 12 months
study in the randomized group.
3. To obtain a more precise measure, renal function was measured using the
gold standard isotope method (99mTc-DTPA) which has been shown to be a
precise measure of GFR [238]. The 99mTc-diethylenetriamine-pentraacetic acid
(99mTc-DTPA ) isotope tracer clearance has been shown to correlate well with
inulin clearance and is one of the most commonly used methods for directly
assessing GFR [239]. The dual blood sampling technique has shown the
closest correlation with the multiple blood sampling Inulin clearance technique
previously used as the gold standard [238]. iGFR was measured by 99mTc-
DTPA at baseline and at the end of the study using the dual blood sampling
technique (blood sample taken at one and four hours post injection) There were
no significant differences in iGFR with time and adjusting for baseline there was
no significant treatment effect (p=0.095).
In the clinical setting an estimated GFR is used as a non-invasive estimate of
renal function. In this study GFR was estimated using the MDRD abbreviated
equation (using serum creatinine adjusting for age, sex and race). Testing for
bias the MDRD equation was more accurate in predicting eGFR compared to
CG and CKD-EPI equations (method pp. 67-71) however the MDRD

97
underestimated GFR compared to iGFR. In this study there was no significant
change in eGFR over time or adjusted for baseline values between groups.
4. Microalbuminuria assessed as increased AER and increased albumin to
creatinine ratio are the earliest signs of renal involvement and a powerful
independent risk factor for the development of diabetic nephropathy [55].
Obesity is associated with increased renal plasma flow, hyperfiltration and
increased albumin excretion [240, 241]. Ribstein et al found GFR and effective
renal plasma flow to be increased in obese, compared to lean, participants
regardless of hypertensive status. They found an increased albumin excretion
(40%) in the obese, compared to the lean, participants (19%). Albumin
excretion was positively correlated with BP and mean arterial pressure, with the
regression line steeper in the overweight group (0<0.5) [240]. Obese
hypertensive subjects had increased renal plasma flow, greater blood flow and
increased cardiac output together with decreased peripheral and renovascular
resistance compared with lean hypertensive subjects. This suggests that lean
and obese subjects have different haemodynamic characteristics and the effect
on target organs may differ [241]. AER decreases after weight loss; Chagnac et
al found a highly significant decrease in AER from 16 µg/min (4-152 µg/min) to
5 µg/min (3-37 µg/min) in 17 severely obese subjects after substantial weight
loss [242]. Similar results have been reported in several weight loss studies. A
52% reduction in AER from baseline has been reported in a meta analysis of
both surgical and non surgical weight loss, with surgical weight loss showing the
greatest benefit [243]
In this study microalbuminuria was measured at four monthly intervals to
monitor renal function. AER did not change significantly with time and adjusted
for baseline values there was no significant treatment effect. Adding WL,
change in SBP and averaged protein intake did not change the significance.
The same trend was seen for alb/cr rate where no significant change was seen
with time and adjusted for baseline values no significant treatment effect was
observed.
In this study AER decreased in the HPD group between baseline and twelve
months; but remained relatively stable in the SPD group and this difference
showed a trend toward significance (p=0.06) This can probably be ascribed to
the slightly higher (NS) weight loss in the HPD group. There are no

98
physiological reasons why a high protein diet should be more effective in
reducing microalbuminuria. Although not statistically significant this may be of
some clinical importance.
Weight loss plays a major role in the decrease in microalbuminuria it has been
shown that weight loss per se will reduce microalbuminuria regardless of dietary
treatment [125]. In this study absolute weight loss in kg was higher in the HPD
group (although not significantly) compared to the SPD group indicating that
weight loss may play a role in the changes in microalbuminuria.
Weight loss has a beneficial effect on AER with some participants returning to
normoalbuminuria after a relatively modest weight loss [125]. A meta regression
of 522 participants in 13 intervention studies (five controlled and eight
uncontrolled studies) showed that for every 1 kg weight loss achieved was
associated with a 1.1 mg decrease in microalbuminuria (95% CI= 0.5, 2.4;
p=0.01) [125].
In a secondary analysis of the PREVEND study, investigating the association
between BMI and albumin excretion rate in 8050 participants from the general
population, it was found that BMI was associated with microalbuminuria. The
prevalence of microalbuminuria in men was 9.5% in those with a BMI <25 kg/m2
increasing to 18.5% in the overweight (BMI 25-29.9) and to 29.3% in the obese
(BMI >30kg/m2) group. The same trend was seen in women with 6.6% in the
normal weight, 9.2% in the overweight and 16.0% in the obese group [45].
This study had a low number of participants (19 HPD and 17 SPD). In the initial
power calculation we expected a change GFR of 5 ml/min (5%) with a
difference in protein intake of 50g/day. Using the non-inferiority approach and
using the change in the variable at 12 months this study was estimated to be
powered with 80% confidence (p<0.05) to detect a significant difference
between groups of 15.9 ml/min for iGFR, 11.8 ml/min for eGFR, 0.04 mg/L for
cystatin C, 9.3 µmol/L for serum creatinine, 49.4 µg/l for AER and 7.8 for alb/cr.
We conclude that under conditions of weight loss and good glycaemic control, a
HPD does not exert a deleterious effect on renal function in T2DM participants
with microalbuminuria or mild renal dysfunction.
Caution should be taken in interpreting these results as the sample size was
small and follow-up duration was short, but the results are relatively clear.

99
Chapter 4: Change in weight and body composition


101
4.1 Weight loss and body composition
High protein, weight loss diets have been shown to produce a greater weight
and fat mass loss in settings of ad libitum energy intake, compared to a lower
protein diet [137, 152]. Skov et al found fat mass to be 3.3 kg lower in the HPD
compared to the SPD after a six months intervention. Total weight loss was
higher in the HPD compared to SPD after six months (35% of the participants in
the HPD lost more than 10kg body weight compared to 9% in the SPD) [137]. In
a quantitative review of 50 studies, looking at the effect of a HPD compared to a
low protein diet on weight loss, Halton and Hu concluded HPDs have a short
term beneficial effect on weight loss. However, the studies were small and
short-term [152]. In energy restricted, isocaloric diets the difference in weight
loss between the two groups is not so clear [139, 244]. HPD have been shown
to decrease waist circumference and produce a greater loss of visceral fat mass
in men [141]. Retention of lean body mass has also been reported using a HPD
compared to a SPD, often in the form of a greater decrease in LBM in the SPD
group and minor decreases in the HPD if any.
For this study the aim was to have a similar weight loss in both the HPD and the
SPD groups. The planned reduction in energy intake was equal (6 MJ) in both
groups. I wanted to investigate the effect of a HPD and a SPD, under
standardized conditions, on weight loss and body composition using DXA data.
It was hypothesized that an HPD would result in increased loss of visceral fat
mass with minimal to no loss of LBM compared to the SPD under conditions of
equal total weight loss.
4.2 Results
4.2.1 Weight loss
Of the 48 participants who started the diet intervention, 36 completed the study
(HPD 14 men & 5 women and SPD 13 men & 4 women). At baseline weight in
the two groups were similar. There was a significant decrease in weight in both
groups over time (p<0.01). At 4 months weight loss was 8.9±1.6 kg and 8.3±1.5
kg in the HPD and SPD respectively. By the end of the study the HPD group
had lost 10.5±3.2 kg and was still losing weight (weight loss between four

102
months and the end of the study was 1.6±1.8 kg), whereas the SPD group had
lost 7.5±1.9 kg but had a slight weight regain of +0.7±0.9 kg between four
months and the end of the study (ns). Although the HPD group was still losing
weight at the end of the study and the SPD group had regained some weight,
there was no significant difference between the groups adjusted for baseline
values at 12 months.
Table 10: Weights at baseline, 4 and 12 months
Treatment Baseline 4 months 12 months
HPD (n=19) 106.8±5.5 98.0±5.0 96.4±5.1
SPD (n=17) 107.6±4.9 99.3±4.3 100.1±4.8
The mean weights at baseline, four months and at the end of the study for the 36
volunteers who completed the study (Completers only, no missing data). Results
are shown as means (SEM).
Figure 13: Weight change over the 12 months diet intervention.
The lines describe the mean weight change over time, the bars represent the mean
(SEM). The blue solid line is the HPD and the green broken line is the SPD.
85
90
95
100
105
110
Baseline 4 Mo 12 Mo
Kg
Weight change
HPD (n=19) SPD (n=17)

103
4.2.2 Body mass index
Body mass index was 36.4±1.6 kg/m2 in the HPD group and 36.3±1.1 kg/m2 in
the SPD group at baseline. There was a significant decrease in BMI at four
months to 33.4±1.6 kg/m2 and 33.6±1.1 kg/m2 in the HPD and SPD groups
respectively (p<0.01 for time effect). At the end of the study the BMI in the two
groups had not changed significantly from the four months values (32.9±1.6
kg/m2 and 33.8±1.3 kg/m2 respectively) and adjusting for baseline values there
was no treatment effect at either four or 12 months.
4.2.3 Percentage body weight lost
The average percentage body weight lost at 12 Mo was 9% in the HPD and 7%
in the SPD (ns). At four months 26 participants had lost more than 5% body
weight (16 HPD and 10 SPD) and by the end of the study a total of 21
participants lost more the 5% body weight (11 HPD and 10 SPD).
At four months a 10% weight loss was seen in 13 volunteers (8 HPD and 5
SPD) and by the end of the study 14 volunteers had lost more than 10% body
weight (8 HPD and 6 SPD).
In absolute amounts, men lost more weight than women (10.5±2.4 and 4.7±2.2
kg) at 12 months; however adjusting for baseline weights this difference was not
statistically significant.
At four months men had lost 9.9±2.0 and 9.6±1.7 kg on the HPD and SPD
respectively and at 12 months the weight loss was 12.1±4.1 kg on the HPD and
8.9±2.1 kg on the SPD (ns).
Women achieved all their weight loss during the first four months of the diet
intervention. Weight loss in the HPD group was 5.8±2.0 kg and in the SPD
group weight loss was 4.0±2.2 kg at four months. The total weight loss at 12
months was 5.8±3.1 kg in the HPD and 3.3±3.7 in the SPD. There were no
significant differences in weight lost between groups.
At 12 months’ nine men in each treatment group had lost more than 5% body
weight and of these men six in HPD and five in SPD had lost more than 10%
total body weight. For the women two in the HPD and one in SPD had lost more
than 5% in fact all three had lost more than 10% of total body weight.

104
The relationships between treatment, age, sex and weight loss were analyzed
using Pearson product-moment correlations. There was no correlation between
weight loss and treatment at 12 months (r= -0.13, n=36, p=0.45) or between sex
and weight loss (r= -0.23, n=36, p=0.18). There was a small negative
correlation between age and change in body weight at the end of the study (r=
-0.35, n=36, p=0.04). The average age was 60 years, the younger group (age
<60 years) lost more weight (13.6 kg or 10.9% vs. 6.2 kg or 6.4% in the older
group (≥60 years) (p=0.05).
4.2.4 Body composition
Body composition was assessed at the endocrine and metabolic unit at the
Royal Adelaide Hospital by dual-energy X-ray absorptiometry (DXA), [Norland
medical systems] at baseline and at 12 months.
Of the 36 volunteers who completed the study 32 (23 men (12 HPD and 11
SPD) and 9 women (5 HPD and 4 SPD)) had DXA measurements at baseline.
Four volunteers (all men) exceeded the weight limit of 140 kg allowed by the
manufacturer and were not scanned.
At baseline the mean weight for this sub-group (n=32) was 100.6±3.6 kg and
102.2±3.7 kg for the HPD (n=17) and SPD (n=15) groups respectively with no
difference between groups.
4.2.5 Fat mass change
Total fat mass decreased significantly with time (p<0.01) with no significant
difference between groups when adjusting for baseline values.
At baseline the percentage body fat mass (%FM) was similar in the two groups,
41.0±1.7 in the HPD and 43.2±2.5 in the SPD. At the end of the study %FM had
decreased significantly in both groups (p<0.01 for time). There was no
significant treatment effect at 12 months.
4.2.6 Lean body mass
There was a significant decrease in lean body mass over time (p<0.01). The
HPD (n=17) lost 2.5±0.7 kg and the SPD (n=15) lost 1.2±0.7kg, however there
was no significant treatment effect. The %LBM increased in both groups with
time (p<0.01) with no significant treatment effect at 12.

105
%FM
Change in %FM over time
HPD SPD
%LB
M
Change in % LBM over time
HPD SPD
Figure 14: Changes in body composition as a % of total body mass
Changes in %FM between baseline and 12 months (Left) and the change in
%LBM between baseline and 12 months (right).
The data are given as mean (SEM). HPD is the blue solid line and SPD is the
green broken line. There were no differences at baseline. The change over time
was equal in both groups, with no significant difference between groups when
adjusting for baseline values.

106
Table 11: Changes in body weight and body composition
Baseline 12 Mo Change
Difference at
baseline. Difference over time
ANCOVA group
effect at 12 Mo
Body weight (kg)
HPD (n=17) 100.7±3.7 91.2±3.8 "-9.5±2.6
p=0.92 p<0.01 p=0.41 SPD (n=15) 102.2±3.7 95.1±3.8 "-7.1±1.9
FM (kg)
HPD (n=17) 41.2±2.4 34.3±2.9 "-6.9±2.1
p=0.47 p<0.01 p=0.20 SPD (n=15) 43.6±2.3 37.8±2.8 "-5.8±1.4
FM (%)
HPD (n=17) 40.9±1.7 37.3±2.3 "-9.4±3.3
p=0.45 p=0.01 p=0.95 SPD (n=15) 43.2±2.5 39.9±2.7 "-8.3±1.7
LBM (kg)
HPD (n=17) 59.4±2.6 56.8±2.7 "-2.6±0.7
p=0.83 p<0.01 p=0.65 SPD (n=15) 58.5±3.6 57.3±3.4 "-1.2±0.7
LBM (%)
HPD (n=17) 59.1±1.7 62.7±2.3 "+6.0±2.2
p=0.45 p=0.01 p=0.95 SPD (n=15) 56.8±2.5 60.2±2.7 "+5.8±1.4
Data are presented as means (SEM). Significance was reached with p<0.05.

107
4.2.7 Fat distribution
Fat distribution was estimated using two areas: the central area including chest
and midriff fat mass and the peripheral fat mass including fat from arms and
legs.
At baseline the central body fat mass was equal in both groups. There was a
significant decrease in central fat mass with time (p<0.001) with no difference
between treatments at 12 months.
Likewise peripheral fat mass was similar at baseline. There was a significant
decrease in peripheral FM with time (p<0.001). There was no significant
difference between treatments at 12.
The same two areas were used to assess the distribution of lean body mass.
Central LBM including chest and midriff, was similar at baseline. There was no
significant change in central LBM over time and there was no treatment effect
between groups at 12 Mo.
Peripheral LBM including arms and legs was similar at baseline. There was a
significant decrease with time (p<0.01) with no significant difference between
treatments at the end of the study.

108 Tabl
e 12
: Cha
nges
in c
entra
l, pe
riphe
ral f
at m
ass
and
lean
bod
y m
ass
Bas
elin
e 12
Mo
Cha
nge
D
iffer
ence
at
base
line.
D
iffer
ence
ov
er ti
me
AN
CO
VA g
roup
ef
fect
at 1
2 M
o
Cen
tral
FM
(kg)
H
PD
(n=1
7)
16.9
±0.7
13
.9±1
.1
3.0±
1.0
p=0.
42
p<0.
01
p=0.
80
S
PD
(n=1
5)
17.9
±0.9
15
.0±1
.6
2.8±
0.5
Perip
hera
l FM
(kg)
H
PD
(n=1
7)
15.9
±1.3
13
.4±1
.3
2.5±
0.8
p=0.
53
p<0.
01
p=0.
61
S
PD
(n=1
5)
17.1
±1.5
15
.0±1
.6
2.1±
0.6
Cen
tral
LB
M (k
g)
HP
D (n
=17)
18
.9±1
.0
18.6
±1.0
0.
2±0.
3 p=
0.91
p=
0.12
p=
0.82
SP
D (n
=15)
18
.7±1
.5
18.5
±1.3
0.
1±0.
3
Perip
hera
l LB
M
(kg)
H
PD
(n=1
7)
28.0
±1.3
26
.0±1
.3
1.8±
0.8
p=0.
84
p<0.
01
p=0.
29
S
PD
(n=1
5)
27.6
±1.7
26
.4±1
.7
1.0±
0.4
Dat
a ar
e gi
ven
as m
ean
(SE
M),
sign
ifica
nce
was
set
at p
<0.0
5.
As
show
n ab
ove
ther
e w
as a
pos
itive
effe
ct o
f wei
ght l
oss
on b
ody
com
posi
tion
with
a s
igni
fican
t dec
reas
e in
bod
y fa
t in
both
cen
tral a
nd
perip
hera
l fat
dis
tribu
tion
with
tim
e. L
ean
body
mas
s de
crea
sed
over
tim
e in
the
limbs
but
rem
aine
d st
able
in th
e ce
ntra
l bod
y di
strib
utio
n.
Ther
e w
as n
o be
twee
n tre
atm
ent e
ffect
whe
n ad
just
ing
for b
asel
ine.

109
An opposite effect on disease risk of fat mass situated on the lower abdomen
and the buttocks have been reported. Where fat situated on the buttocks has
shown a beneficial effect on insulin sensitivity and markers of CVD risk,
whereas fat situated on the lower abdomen have a deleterious effect increasing
the risk of T2DM and CVD [245-247]. Because it is not possible to distinguish
between these two fat mass areas using the DXA scan, the pelvis area was
omitted from the analysis; thus creating the difference between total mass and
the combined central and peripheral mass.
There was no significant difference between groups in pelvis area for LBM or
FM at baseline. LBM did not differ over time and there was no treatment effect.
FM decreased significantly with time (by 1.1±0.4 and 0.7±0.3 kg in the HPD and
SPD groups respectively; p<0.01) with no significant difference between
treatments.
4.2.8 Central to peripheral fat distribution ratio
In order to determine the total fat distribution as central or peripheral, a ratio
was calculated dividing central fat mass by peripheral fat mass
(Central/peripheral) [211]. A ratio of central to peripheral FM above 1.0 signifies
abdominal fat distribution and a value less than 1.0 signifies a peripheral fat
distribution.
At baseline the ratio was 1.12±0.06 in the HPD and 1.12±0.07 in the SPD
indicating a central fat distribution at baseline. The ratio decreased with time in
both groups to 1.07±0.05 and 1.08±0.07 (HPD and SPD respectively; p=0.047
for difference with time). There was no significant difference between
treatments.
4.2.8.1 Fat mass distribution divided by sex
At baseline the males had a central to peripheral fat mass ratio of 1.25
indicating central obesity. This ratio decreased to 1.17 (p=0.01) by the end of
the study. The males carried their excess weight around the abdominal area at
baseline and even though they lost a significant amount of weight during the
study, the distribution did remain predominantly abdominal.
The women had a central to peripheral fat mass ratio of 0.80 the ratio
increasing to 0.83 by the end of the study (p=0.19). The women had their fat
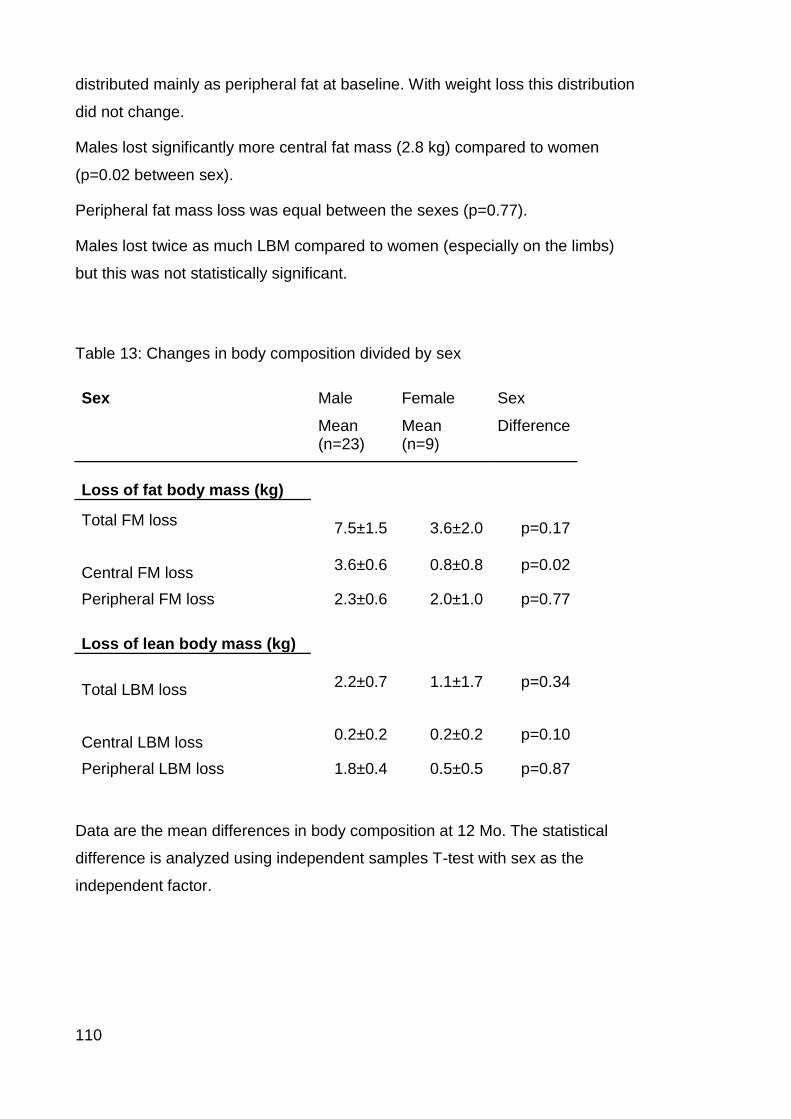
110
distributed mainly as peripheral fat at baseline. With weight loss this distribution
did not change.
Males lost significantly more central fat mass (2.8 kg) compared to women
(p=0.02 between sex).
Peripheral fat mass loss was equal between the sexes (p=0.77).
Males lost twice as much LBM compared to women (especially on the limbs)
but this was not statistically significant.
Table 13: Changes in body composition divided by sex
Sex Male Female Sex
Mean (n=23)
Mean (n=9)
Difference
Loss of fat body mass (kg)
Total FM loss 7.5±1.5
3.6±2.0
p=0.17
Central FM loss
3.6±0.6
0.8±0.8
p=0.02
Peripheral FM loss 2.3±0.6 2.0±1.0 p=0.77 Loss of lean body mass (kg) Total LBM loss
2.2±0.7
1.1±1.7
p=0.34
Central LBM loss
0.2±0.2
0.2±0.2
p=0.10
Peripheral LBM loss 1.8±0.4 0.5±0.5 p=0.87
Data are the mean differences in body composition at 12 Mo. The statistical
difference is analyzed using independent samples T-test with sex as the
independent factor.

111
4.3 Discussion
There was a significant decrease in weight and BMI between baseline and 12
months with no significant difference between treatments. At 12 months 58%
(21) of the volunteers had lost more than 5% body weight and of these
participants 66% (14) had lost more than 10% body weight.
In studies of shorter duration (≤6 months) an increased weight loss has been
reported in the HPD compared to a SPD [137, 169, 171-173, 179]. However,
during follow up the weight regain is greater in the HPD, abolishing the initial
benefit of the HPD compared to the SPD [144, 171]. These studies used ad
libitum energy intake exchanging CHO for protein and it has been speculated
that the satiating effect of protein is the cause of decreased energy intake in the
HPD. However, adherence to diet is usually not sustained long-term, resulting in
increased weight regained in the HPD group [144].
In energy restriction, comparable weight loss is most often reported when
comparing weight loss diets with increased protein to CHO ratio. In the present
study there was a trend of a greater weight loss in the HPD group; but this did
not reach statistical significance. With the observed SD`s in this study (13.9 and
7.7 for the HPD and SPD respectively) and the sample of 19 in the HPD and 17
in the SPD group, this study was estimated to be powered to detect a difference
of 10.2 kg between groups.
However, greater weight loss have been shown using HPD in different groups.
Parker et al showed a sex difference where women lost more weight and
abdominal fat mass on the HPD compared to women randomized to the SPD;
whereas this was not the case in male participants [139]. In the study by
Noakes et al women with increased TG lost more weight on the HPD compared
to women without elevated TG.
In the present study men lost more weight compared to women (ns), however
the sample size for women was very small which may have influenced the
outcome. For males the loss of abdominal fat mass was highly significant over
time (3.6 kg; p<0.001). Men lost significantly more abdominal fat mass
compared to women (3.6 vs. 0.8 kg; p=0.002).
This difference has previously been shown. In a study looking at body
composition, glycaemic and lipid control in hyperinsulinaemic men and women

112
after a 16 week intervention with a HPD (27%TE) compared to a SPD (16%TE),
men lost more abdominal fat compared to women. As in our study, there was no
effect of diet allocation [166].
In a meta-regression assessing the effect of 102 treatment groups in 51 studies
looking at low CHO diets a greater retention of FFM was found in the highest
quartiles of protein intake (protein intake >1.05 g/kg) compared to the lowest
quartile (protein intake <1.05 g/kg) [165]. The protein intake at 12 Mo in our
study was 1.1 g/kg in the HPD vs. 0.9 g/kg in the SPD group (p=0.03). Although
this difference was significant, the actual difference was not sufficient to
produce a LBM sparing effect in one group compared to the other.
In low CHO diets greater loss of FFM due to greater loss of body water has
been documented with a CHO intake below 100g (ketogenic diets) [248]. In our
study there was a significant decrease in LBM in both groups with no significant
treatment effect. The lack of effect on retention of LBM using the HPD may be
explained by the CHO content of the diets, where the average intake was
161±13 g in the HPD group and 168±9 in the SPD group reported by three day
diet record (ns).
We conclude that a HPD is equally effective in producing weight loss and loss
of fat mass compared to a SPD. There was no retention of fat free mass in
either diet group.
The limitations to this study include the problems with precision of the DXA as
some of the participants were too large to fit the scanner bed and others were
too heavy to have the examination at baseline. This meant that the sample size
for the body composition changes was small and may not be sufficient to show
significant differences.

113
Chapter 5: Changes in glycaemic control, serum lipids and blood pressure


115
5.1 Glycaemic control
Glycaemic control has been shown to improve significantly with HPD. In a
weight maintenance study investigating the effect of a doubling of protein from
15%TE to 30%TE in T2DM patients a 36% decrease in 24h BG was reported.
This resulted in a decreased HbA1c from 8.1 to 7.3% after five weeks
consumption of the HPD [195]. Weight loss per se has a beneficial effect on
glycaemic control in T2DM [181]. A 58% decrease in the incidence of T2DM has
been demonstrated in a group of men and women with increased risk of T2DM
(IGT). The weight loss achieved during the first year, of a 3.2 year follow up
study, was 4.5 kg in the intervention (energy restricted diet and exercise) group
compared to 0.8 kg in the control group. The significant difference in weight lost
remained through the follow up period [249].
In the present study, glycaemic control was measured at four monthly intervals
with FBG and HbA1c.
At baseline the two measures were similar in the two randomized groups (FBG
= 8.0±0.4 and 8.1±0.5 in the HPD and SPD respectively and HbA1c = 7.4±0.2
and 7.1±0.2 in the HPD and SPD respectively (n=36)).
There was a significant decrease in FBG at four months in both groups by 1.3
and 1.6 mmol/L in HPD and SPD respectively (p=0.001). By the end of the
study the difference in FBG compared to baseline was no longer significant.
There was no significant treatment effect in the change in FBG at the end of the
study.
Similarly, HbA1c decreased significantly between baseline and four months in
both groups by 0.9 and 0.5 % in the HPD and SPD groups respectively
(p<0.01). At the end of the study HbA1c was not different compared to baseline
values (p=0.46). There was no treatment effect in the difference at four months
or at the end of the study when adjusting for baseline values.

116
Table 14: Blood glucose changes over time
FBG (mmol/L) Baseline 4 Mo 12 Mo Treatment (12 Mo)
HPD (n=19) 8.0±0.4 6.7±0.3 7.0±0.4 p=0.41
SPD (n=17) 8.1±0.5 6.5±0.4 6.6±0.4
HBA1C (%) Baseline 4 Mo 12 Mo Treatment (12 Mo)
HPD (n=19) 7.4±0.2 6.4±0.2 7.0±0.3 p=0.46
SPD (n=17) 7.1±0.2 6.6±0.2 7.0±0.3
Data are given as mean (SEM). There was a significant change in both
variables over time p<0.01.
When adjusting for medication changes there was still no significant difference
in HbA1c at 12 Mo.
The multiple regression showed a significant association between HbA1c and
weight loss (r =0.38; p=0.03). There was no significant association between
HbA1c and FBG (r =0.21; p=0.22).
5.2 Lipids
Differential effects of a HPD on changes in serum lipids have been reported.
We aimed to investigate the effect of a high protein, weight loss diet on serum
lipid. We hypothesize a HPD will be as effective in reducing lipids as a SPD.
At baseline all volunteers were well treated for dyslipidaemia. Total cholesterol
(Tot-chol), LDL, HDL and TG were all in the recommended range (Tot-chol
<5.5, TG <2.0, LDL < 3.7 and HDL >0.9; all measured as mmol/L). There were
no significant differences in serum lipids at baseline (Table 1)
There was a non-significant decrease in Tot-chol over time in both groups with
no significant difference between randomized treatments at 12 Mo.

117
TG decreased significantly with time (p<0.01); There was no significant effect of
treatment at 12 months when adjusting for baseline.
HDL increased with time in both groups (p<0.01). There was no significant
treatment effect at 12 months when adjusting for baseline values.
There were no significant changes in LDL over time. Adjusting for baseline
values, there was a borderline significant difference of 0.4 mmol/L in LDL
cholesterol between the randomized groups (estimated marginal means for
HPD = 1.9 and estimated marginal means for SPD = 1.6; p=0.052.
(For detailed changes in serum lipids refer to Table 15).

118
Figure 15: Changes in serum lipids (mmol/L)
3.03.23.43.63.84.04.2
Baseline 12 Mo
Total cholesterol
HPD (n=19) SPD (n=17)
ns
0.00.51.01.52.02.53.0
Baseline 12 Mo
TG
HPD (n=19) SPD (n=17)
P<0.01 (Time)
1.21.41.61.82.02.22.4
Baseline 12 Mo
LDL cholesterol
HPD (n=19) SPD (n=17)
p=0.052 (Treat)
#
0.5
1.0
1.5
Baseline 12 Mo
HDL
HPD (n=19) SPD (n=17)
P<0.01 (Time)
There were no significant treatment effect at 12 months in total cholesterol, TG
or HDL, there was a trend towards a treatment effect in LDL with HPD
increasing by 0.1 mmol/L and SPD decreasing by 0.03 mmol/L between
baseline and 12 months (p=0.052).

119
Table 15: Lipids
Baseline 12 Mo Change Baseline Time Group
Chol. HPD 3.9±0.2 3.8±0.2 "-0.1±0.2 p=0.06 p=0.45 p=0.12
SPD 3.5±0.1 3.4±0.1 "-0.1±0.1
TG HPD 2.3±0.3 1.5±0.1 "-0.8±0.3 p=0.52 p<0.01 p=0.54
SPD 2.0±0.3 1.5±0.2 "-0.5±0.3
HDL HPD 1.0±0.0 1.2±0.0 "+0.1±0.0 p=0.61 p<0.01 p=0.84
SPD 1.1±0.1 1.2±0.1 "+0.1±0.1
LDL HPD 1.9±0.2 2.0±0.1 "+0.1±0.2 p=0.19 p=0.79 p=0.052
SPD 1.6±0.2 1.5±0.1 "-0.03±0.1
Data are given as means (SEM), Significance level was set at p<0.05. Number
of participants in each group: HPD (n=19), SPD (n=17), All variables are
measured in mmol/L.
5.2.1 Lipid lowering medication All participants except for two were on statin treatment at baseline (34 on mono
therapy and 5 on treatment with both statin and ezetimibe), one took ezetimibe
on mono therapy and one participant did not take any lipid lowering medication.
Statin dose was decreased in one (HPD) and increased in three participants (1
HPD and 2 SPD), stopped in four (2 HPD and 2 SPD) and changed to other
medication in three (2 HPD and 1 SPD) participants. Given changes in statin
dose in both treatment groups it is likely that about a 0.1 mmol/L difference
between the groups could be explained.

120
5.3 Blood pressure
Hypertension is an independent risk factor renal disease. Reduction in blood
pressure to ≈130/80 has been recommended in T2DM [250]
5.3.1 SBP
There was a significant 5.7 mmHg decrease in SBP between baseline and four
months (p<0.01). The change in SBP between baseline and twelve months was
not significant (-2.3 mmHg; p=0.29). Adjusting for baseline values the difference
between treatments was insignificant at both four months (p=0.09) and twelve
months (p=0.21).
5.3.2 DBP
Diastolic blood pressure decreased between baseline and four months (-2.3
mmHg; but the decrease was not statistically significant. Between baseline and
twelve months there was no change in DBP (p=0.47).
When adjusting for baseline values there was a significant difference between
treatments at four months (EMM = 66.8±1.7 (63.4, 70.2) in the HPD and
72.4±1.8 (68.7, 76.0) in the SPD; p=0.03) and at twelve months (EMM =
69.8±1.9 (65.9, 73.6) in the HPD and 76.3±2.0 (72.2, 80.4) in the SPD; p=0.03).
Adding weight loss as covariate did not change the significance (p=0.03);
adding sex and age to the model did not change the significance between
groups (p=0.046).
Table 16: Blood pressure changes over time (mmHg)
Treatment SBP
Baseline
SBP
4 Mo
SBP
12 Mo
DBP
Baseline
DBP
4 Mo
DBP
12 Mo
HPD (19) 126.3±3.0 117.9±3.3 121.4±3.3 74.2±1.6 68.6±2.1 71.7±2.2
SPD (17) 125.1±2.9 122.4±3.1 125.8±3.6 69.0±2.3 70.3±2.3 74.2±2.6
Data are presented as mean (SEM).

121
Figure 16: Blood pressure change
112
114
116
118
120
122
124
126
128
130
132
Baseline 4 Mo 12 Mo
mm
Hg
Systolic blood pressure
HPD SPD
65
67
69
71
73
75
77
79
Baseline 4 Mo 12 Mo
mm
Hg
Diastolic blood pressure
HPD SPD
*
*
Data are given as mean (SEM) for completers only (n=36). * =p<0.05 for
treatment effect.

122
5.4 Intention-to-treat analysis
Forty eight volunteers started the randomized treatment and had at least
baseline data. Twelve volunteers discontinued (7 in the HPD and 5 in the SPD). There were no significant differences between the completers and the non-
completers at baseline.
Table 17: Baseline characteristics of the completers and the discontinued
participants
Completers
(n=36)
Discontinued
(n=12) Difference
age 60.4±1.5 56.4±2.9 p=0.20
Diabetes duration (years) 10.8±1.6 8.9±1.7 p=0.51
Height 1.7±0.02 1.7±0.02 p=0.11
BMI 36.3±1.0 35.7±1.2 p=0.74
Weight 107.2±3.6 99.4±5.3 p=0.26
FBG (mmol/L) 8.1±0.3 7.0±0.4 p=0.09
HBA1C (%) 7.2±0.1 7.3±0.3 p=0.91
AER (µg/min) 55.9±8.9 80.1±25.6 p=0.26
Alb/cr ratio 7.1±1.2 5.7±1.3 p=0.53
SBP (mmHg) 125.8±2.1 127.4±3.8 p=0.69
DBP (mmHg) 71.8±1.4 72.5±2.8 p=0.81
Data are given as mean (SEM).
A modified intention-to-treat analysis (volunteers who dropped out were not re-
examined at the end of the study) was done to evaluate the outcomes for the
complete population randomized to this study. The software SPSS AMOS (a
structural equation modelling program that includes full information maximum
likelihood estimation, student version 16) was used to perform the ANCOVA
model in the full dataset, including only volunteers who had all measurements
done at baseline (n=48).
This model will estimate the outcome of the variable using trends from all data
obtained in the data set. Data are adjusted for baseline values.

123
Figure 17 Example of the AMOS analysis of missing data.
This analysis contains information on all 48 volunteers who had measurements
taken at baseline ( 26 in HPD and 22 in SPD). Of interest was the outcome on
renal function. Measures of: iGFR, eGFR, Cystatin C, AER and alb/cr were
tested. We wanted to test if, using all randomized volunteers, renal function
differed between treatments after 12 Mo intervention.
For the measures of GFR there was no significant treatment effect in the ITT
analysis at twelve months (p=0.16 for IGFR and p=0.98 for eGFR) Or for
Cystatin C (p=0.29).
However, when the AER was analyzed, there was a significant difference
between treatments at 12 Mo, indicating that AER for the SPD would be 60%
higher compared to HPD. Alb/cr would be 56% higher in SPD compared to HPD
p=0.039 and for alb/cr p=0.036 (adjusted for baseline).
A more conventional method of analysing missing data is “Last Obtained Value
Carried Forward” (LOVCF). To assess the effect of weight loss on renal function
this method was also utilised. The same trend of no significant difference in
analysing iGFR, eGFR and Cystatin C was found when LOVCF was used and
adjusted for baseline values (p=0.13, p=0.43, p=0.54 respectively). Log
transformed AER and Alb/cr did not differ significantly between treatments when
the LOVCF was used (p=0.10 and p=0.19 respectively).

124
5.5 Discussion
In this chapter, measures of metabolic control were assessed. As expected,
glycaemic control measured as FBG and HbA1c improved significantly with
weight loss in the short term. However, with slowing of weight loss and
decreasing compliance with diet, the effect was no longer evident at 12 months.
Diastolic BG decreased significantly in the HPD group, and increased in the
SPD group. Adjusted for baseline this difference was significant. Although not
significant, the decrease in TG and the increase in HDL cholesterol remained at
the end of the study. Systolic BG remained decreased in the HPD and
unchanged in the SPD at 12 months. The intention-to-treat analysis showed the
same trend as the main analysis, with no significant difference in renal function
measured as GFR and cystatin C (true for both full-information missing data
and LOVCF). For AER and alb/cr the ITT analysis showed significant benefit in
the HPD when the full-information missing data method was used; but this was
not found in the LOVCF analysis.
Numerous studies have found a similar decrease in FBG when comparing a
HPD to a SPD. However, these studies did not include T2DM participants. In
our study we found a significant decrease in FBG over time by 16% in the HPD
and 21% in the SPD at four months and at 12 Mo by 12 and 21% (HPD and
SPD respectively; ns for treatment). This is in agreement with multiple studies
looking at overweight to obese men and women, where a significant decrease
in FBG was found in both diet groups regardless of treatment allocation [138,
139, 143, 144], and in T2DM [179].
Glycaemic control measured as HbA1c was optimized and recommended levels
[217] were reached at four months (6.4% in the HPD and 6.6% in the SPD
groups respectively), with no significant difference between treatments.
By 12 Mo HbA1c had increased in both groups and were no longer significantly
different from baseline. This was also reported in a study looking at 99
overweight to obese T2DM participants after 12 Mo on al low fat HPD (30%TE
protein) or a high CHO (55%TE CHO) diet. The drop in HbA1c was seen in the
initial weight loss period of three months, then it increased to just below
baseline. Like in the present study, the authors in this intervention study report

125
decreases in anti-diabetic medication in the HPD, however when adjusting for
baseline values the change was not significantly different between groups [188]
In studies with a protein intake ranging between 100-130g protein/day (CHO
≤140g/day and fat ≤30%TE) a reduction of TG of 20-55% has been reported
(reviewed by Layman in [251]). The magnitude of the decrease depends on
subject compliance; but seems to be maintained at a lower level, long-term.
In a similar study to the present looking at a high CHO (58%TE CHO, 30%TE
fat and 12%TE protein) compared to a HPD (25%TE protein and 30%TE fat and
45%TE CHO) with ad libitum energy intake, Skov et al also reported a
significant treatment effect in TG after 3 months with a decrease in HPD and an
increase in the high CHO diet. This difference was not sustained long-term (12
Mo) [137]
Total and LDL cholesterol have been reported to improve in high CHO, low fat
diets compared to HP low fat diets, whereas HDL and TG improved more in the
HP low fat diet. Usually these changes occur during the first 6 months of the
weight loss period, levels out and the significant treatment effect is lost. This
trend has been reported in reviews reporting on low CHO diets [174, 252]
In the present study TG decreased significantly between baseline and four
months. At 12 Mo TG had increased slightly; but was still significantly lower
compared to baseline. There was no significant effect of treatment in the
change in TG.
In this study a significant decreases in TG and increases in HDL over time with
no treatment effect at 12 months was found. There was a non-significant
change in total cholesterol over time with no difference between groups. LDL
did not change significantly with time; however a borderline group difference
was seen at 12 Mo. This difference is probably due to medication changes
during the study.
Although TG and HDL are related in the metabolic syndrome to
microalbuminuria the mechanism is likely to be obesity and insulin resistance
rather than lipids. The changes in lipids in this study were relatively small and
were unrelated to changes in microalbuminuria. This was tested using Persons
correlation in the full participant set (n=36) and in volunteers with persistent
microalbuminuria at 12 months (n=22).

126
The serum lipids were already very well controlled at study start and only minor
changes were seen over the 12 months period.
In this study there was a significant decrease in DBP in the HPD compared to
the SPD. Similar results were found in a study by Sargrad et al, they found both
SBP and DBP to decrease significantly more in the HPD (Protein: CHO: fat =
30:40:30%TE) compared to the SPD (15:55:30) after 8 weeks intervention.
In a study looking at the effect of two low fat diets differing in protein content, 66
obese T2DM participants were followed for eight weeks in energy restriction,
followed by four weeks energy balance. This study showed a significant
decrease in both SBP and DBP after the 12 weeks intervention. Participants
were asked to return to the research clinic for a follow-up visit after another 12
Mo on the intervention diet. At 12 Mo follow-up BP had increased in both
groups; but the increase was significantly higher in the low protein group [185].
In the present study only the adjusted DBP differed significantly between groups
at 12 months. As stated before it has previously been shown that a HPD
decreases BP. Usually both SBP and DBP decrease simultaneously, it is
therefore surprising that only DBP differed significantly between groups. In a
study assessing the effect of protein intake on BP in 10020 men and women in
the INTERSALT study [253], it was reported that a protein intake 30% above
the mean, resulted in a decrease of SBP of 3.0 mmHg and 2.5 mmHg for DBP:
These changes are in line with the present study, where SBP decreased ~5
mmHg and DPB ~2.5 mmHg. There was a wide variation in the measures with
SD of 14.5 in HPD and 14.9 in SPD. It is possible that a larger sample showing
the differences in both SBD and DBD would have reached statistical
significance.
Limitations of this study include a small sample size. This study was powered to
detect a difference in GFR and thereby not designed to detect differences in
glycaemic control, serum lipids or BP. The power to detect a significant
difference of the individual variables reported, using the two sided approach and
aiming for 80% confidence (p<0.005) with 19 participants in HPD and 17
participants in SPD was calculated. This revealed that the study was powered
to detect a difference in glycaemic control of 1.2 mmol/L for FBG and 1.2 and in
HbA1c of 0.8%. For serum lipids the study was powered to see a difference of
1.0 mmol/L for total cholesterol, 1.1 mmol/L for TG, 0.2 mmol/L for HDL, 0.6

127
mmol/L for LDL cholesterol. For changes in blood pressure this study was
powerd to detect a difference between groups of 12.1mmHg for SBP and 8.1
mmHg for DBP.
There were conflicting results in the ITT analysis depending on the method
used. The full-information analysis predicted a significant decrease in AER in
the HPD group compared to the SPD group, whereas the LOVCF showed no
significant difference in this variable.The problem with the LOVCF test is that it
assumes no further benefit occurs after a participant discontinues. It thereby
underestimates the possible benefit, had the person continued the treatment but
also disregards the possible deteriation when treatment is ceased. The full-
information missing data analysis on the other hand predicts the outcome using
baseline values and the effect seen in comparable participants.
It has previously been shown that weight loss and improved metabolic control
decreases AER, therefore the slightly higher weight loss in the HPD, although
not significant, may explain the difference in AER and alb/cr seen in the
completers and the full-information missing data analysis (AMOS). Additionally,
there was a trend towards a decrease in GFR, due to decreased hyperfiltration
with weight loss, which would also account for the decreased AER in this group
[243].
The strengths of this study include the use of CGMS which obtains a
comprehensive and dynamic measurement of the 24h fluctuations in BG. This
would not be possible using self monitoring finger pricks.
Concusion
Both diets were effective in improving metabolic control measured as FBG,
HbA1c, serum lipids and BP. There was borderline significant difference in LDL
cholesterol between groups at 12 months, which may be explained by changes
in lipid lowering medication in the HPD group. Diastolic BP showed a significant
treatment effect at 12 months adjusted for baseline, whereas differences in SPD
were not significant. This is unexpected as improvements in both SBP and DBP
is most commonly reported. The study was not powered to show significant
differences in these variables and it is possible that a larger sample size would
show a significant trend in these measures


129
Chapter 6: Changes in glycaemic control using CGMS (Sub-study)


131
In this study we wanted to investigate the effect on microalbuminuria of BG
excursions. Diabetes nephropathy is caused by a combination of
hyperglycaemia and hypertension [254]. It is well known that hyperglycaemia
increases the risk of microvascular complications in both type 1 and type 2
diabetes patients [48, 199]. Fasting blood glucose (FBG) and HbA1c are
currently used to assess diabetes control [2]. However, the increased mortality
risk reported in the ACCORD study which targeted strict control of FBG and
HBA1c may warrant the use of postprandial BG as a better predictor of
glycaemic control.
We hypothesise that a protein rich, weight loss diet will result in reduced fasting,
postprandial and total 24h glycaemic response, compared to the standard
protein weight-loss diet when weight loss is equal in the two groups and will
exert a beneficial effect on the progression of microalbuminuria.
6.1 Subjects and method
All volunteers recruited for the main study were approached for this additional
sub-study investigating the glucose excursion for a period of 24 hours on 3
separate occasions (baseline, four and twelve months).
As an additional “arm” to the main study, volunteers were asked to wear a
Continuous Glucose Measuring System (CGMS), MiniMed from Medtronic, for
at least 48 hours at the 3 sample points.
Additional exclusion criteria were added for the CGMS sub-study. (1)Not willing
to measure finger prick blood glucose, at least four times per day for a period of
72 hour period during the CGMS data collection (at baseline, four and twelve
months). (2) They had to be willing to refrain from submersing into water
(bathtub, swimming pool or spa) and (3) they were excluded if they were
deemed not able to comply with the regime (assessed by the investigator).
Of the 48 participants who started the diet intervention in the main study
(described previously), 39 agreed to participate in the sub-study. Participants
were examined at baseline, before the start of the diet intervention, at four
months after intervention start and at the end of the intervention (12 months). A
total of 39 participants completed baseline (21 HPD and 18 SPD), 32 completed

132
four months CGMS (16 in each group) and 29 volunteers completed all three
time points (15 HPD and 14 SPD).
6.1.1 Main outcome
Blood glucose measured by CGMS analyzed as peak blood glucose (Gmax),
percentage time spent with a BG above 10 mmol/L (%T>10) and area under the
blood glucose curve (AUC) computed as mmol/L per min over a 24 hour period
((mmol/L)/min).
6.1.2 Secondary outcome
Fasting blood glucose, HbA1c and microalbuminuria measured as albumin
excretion (µg/min) derived from a 24 hour urine collection and albumin to
creatinine ratio based on separate spot urine (Described in chapter 3 “Renal
function”).
6.2 Results
6.2.1 Subjects
A total of 39 volunteers (26 male and 13 female) were recruited to this study.
Participants with only baseline CGMS data are not included in the analysis
because there are no data to compare at other time points.
Baseline characteristics for all participants who completed both baseline and
12Mo CGMS measurements are shown in table 1.

133
Table 18 Baseline characteristics of the 29 participants completing the CGMS
study.
Baseline Randomized groups
Completed . 12 Mo HPD (n=15) SPD (n=14) T-Test (p=)
Sex (M/F) 11 / 4 11 / 3 0.75
Age (years) 61.5±2.7 62.4±1.9 0.79
Height (m) 1.72±0.0 1.73±0.0 0.62
Weight (kg) 101.9±3.8 108.9±5.9 0.51
BMI (kg/m2) 34.7±1.5 36.0±1.2 0.32
FBG (mmol/L) 8.1±0.5 7.8±0.5 0.72
HbA1c (%) 7.4±0.2 7.1±0.2 0.32
AER (ug/min) 48.0±13.0 75.2±16.5 0.20
Alb/cr 7.0±1.9 8.6±2.3 0.60
SBP (mmHg) 128.0±3.2 125.2±3.3 p=0.55
DBP (mmHg) 74.0±1.6 68.8±2.8 p=0.11
Data are given as means (SEM). Significance level is set at p<0.05.
This sub-group of volunteers did not differ significantly from the main group.

134
6.3 Glycaemic control:
6.3.1 FBG
Adjusting for baseline values, there was no significant effect of treatment at 4 or
at 12 months. At baseline mean FBG was similar in both groups 8.1±0.5 and
7.7±0.5 mmol/L respectively (ns). FBG decreased to 6.9±0.3 in HPD and to
6.2±0.4 mmol/l in the SPD by four months (p<0.01 compared to baseline).
Between four and twelve months mean FBG increased slightly in both groups
(7.1±0.4 and 6.3±0.5 mmol/L in HPD and SPD respectively (p<0.05 compared
to baseline).
6.3.2 HbA1c
When adjusting for baseline values there was no significant effect of treatment
on HbA1c at four months (p=0.07) or at twelve months (p=0.34). HbA1c
decreased significantly with time (p<0.01). At four months HbA1c had
decreased in the HPD group by 0.98% and in the SPD group by 0.43% (p<0.05
compared to baseline). At the end of the study there was a mean decrease of
0.2 % (p>0.05 compared to baseline) in the SPD and 0.4% (p=0.02 compared
to baseline) in the HPD groups respectively.
HbA1c at four months was significantly negatively correlated with weight loss (r
= -0.49, p<0.01), and positively correlated with FBG (r = 0.62, p<0.01), AUC (r =
.58, p<0.01), %T>10 (r = 0.58, p<0.01) and Gmax (r = 0.50, p<0.01).
At twelve months HbA1c was strongly correlated with %T>10 (r = 0.70, p<0.01)
and AUC (r = 0.69, p<0.01). There was a significant correlation with Gmax (r =
0.57, p<0.01), FBG (r = 0.44, p=0.02), and BMI (r = 0.42, p=0.02). The negative
correlation with WL was still significant (r = -0.54, p<0.01).
Using multiple regression with change in HbA1c at 4 Mo as the dependent
factor and change in FBG, change in %T>10 and change in AUC as
independent variables revealed a highly significant total model (adjusted
r2=0.31, p=0.007); the strongest association was the change in %T>10
(adjusted r2 = -0.48, p=0.008) and AUC (adjusted r2= 0.29, p=0.077). Change in
FBG (adjusted r2= 0.20; p=0.23) was not significantly associated with change in
HbA1c at this time point
This model was not significant at 12 months.

135
6.3.3 24h blood glucose
The 24h BG decreased significantly with time (by 1.7 vs. 0.7 mmol/L in HPD
and SPD respectively; p<0.01). The difference at 4 months was borderline
significant for treatment effect (p=0.050).
By the end of the 12 months intervention period the decrease in 24h BG in the
HPD had diminished to 0.9 mmol/L and the SPD had increased above baseline
by 0.1 mmol/L, but there was no significant treatment effect.
6.3.4 T>10
When adjusting for baseline values there was a non-significant treatment effect
in %T>10 at four months (p=0.12) and at twelve months (p=0.29).
There was a significant decrease in %T>10 over time (p<0.01).
6.3.5 Gmax
At four months Gmax had decreased in the HPD group by 2.1 mmol/L (p=0.05
compared to baseline) and in the SPD by 1.1 mmol/L (p=0.31 compared to
baseline). Adjusting for baseline values a significant effect of treatment was
found at four months (p=0.02). There was no significant differences in overall
mean Gmax at the end of the study (p=0.10).
6.3.6 AUC
Adjusting for baseline values there was no significant effect of treatment at any
time point (p=0.06 at four months and p=0.19 at twelve months). AUC
decreased significantly with time (p<0.01) with a decrease in the HPD group at
four months of ≈2200 (mmol/L)/min and a decrease in the SPD group of ≈1000
(mmol/L)/min. There was an increase in both groups by twelve months.
6.4 Correlations with change in microalbuminuria
At four months there was only small non-significant correlations between AER
change and changes in weight, FBG, HbA1c, AUC, T>10, Gmax, 24hBG or
SBP.
At 12 Mo using the same model with 12Mo results the only significant
correlations was total weight loss. There was a small non-significant correlation

136
with AUC, T>10; Gmax, 24h mean BG and SBP. There was no correlation with
HbA1c or FBG.
Table 19: AER Correlations
Change in AER at 12 Mo Pearson
Correlation
Sig. (2-tailed)
Total weight loss 0.439 0.017
HbA1C 0.066 0.733
FBG 0.066 0.735
AUC 0.196 0.308
T>10 0.165 0.391
Gmax 0.329 0.082
BG24h 0.168 0.384
SBP 0.256 0.179
* Correlation is significant at the 0.05 level (2-tailed). Using multiple regression with the change in AER at 12 Mo as the dependent
variable and WL, change in SBP and change in Gmax as independent variables
showed a highly significant model (adjusted r2=0.43; p=0.002). The strongest
associations were total WL (adjusted r2=0.51; p=0.003) and change in Gmax
(adjusted r2= -0.44; =0.008). There was a borderline significant association
between change in AER and change in SBP (adjusted r2= -0.26; p=0.099). No
significant association between the change in AER and the change in AUC, 24h
BG, HbA1c, FBG or DBP was seen.
The change in alb/cr showed no significant correlation with markers of
glycaemic control (AUC, Gmax, T>10, FBG or HbA1c). There was a significant
correlation with weight loss (r= -0.48; p=0.008), SBP (r= 0.45; p=0.014), DBP
(r= 0.47; p=0.010) and borderline correlation with HbA1c (r= 0.35; p=0.065) at 4
Mo:
At 12 Mo only alb/cr was positively correlated with total weight loss (r= 0.44;
p=0.018) and DBP (r= 0.47; p=0.011).
Using the regression model as above, looking at the change in alb/cr ratio
revealed borderline significant associations with total weight loss (adjusted r2= -

137
0,41; p=0.053) when using alb/cr change at 12 Mo as dependent variable and
SBP and AUC as independent variables.
Figure 18: The total AUC (24 hour blood glucose; mmol/L/24h)
Data are given as mean (SEM). At four months there was a significant decrease
in AUC with time (p<0.01). There was no significant difference between groups
at any time point.
Total AUC
6000
7000
8000
9000
10000
11000
12000
13000
Total AUC (B) Total AUC (4 Mo) Total AUC (12 Mo)
Treatment HPD Treatment SPD

138 Tabl
e 20
: Cha
nges
in g
lyca
emic
con
trol
Si
gnifi
canc
e
Gro
up
Bas
elin
e (n
=29)
4
Mo
(n=2
9)
12 M
o (n
=29)
Ti
me
Gro
up
Gro
up
4 M
o 12
Mo
HbA
1c
(%)
HP
D
7.4±
0.2
6.4±
0.3
7.0±
0.3
<0.0
1 0.
73
0.34
SP
D
7.1±
0.2
6.6±
0.3
6.9±
0.3
FB
G
(mm
ol/L
) H
PD
8.
1±0.
5 6.
8±0.
3
7.1±
0.4
<0
.01
0.23
0.
29
S
PD
7.
8±0.
5 6.
2±0.
3 6.
3±0.
5 M
ean
24h
BG
(m
mol
/l)
HP
D
8.2±
0.6
6.4±
0.3
7.2±
0.6
<0
.01
0.05
0.
12
S
PD
7.
7±0.
4 7.
1±0.
4 7.
9±0.
5 G
max
(m
mol
/l)
HP
D
13.5
±0.8
11
.1±0
.8
11.5
±1.0
0.
06
0.52
0.
10
S
PD
12
.6±0
.8
11.6
±0.8
13
.5±0
.8
T>1
0
(%)
HP
D
22.1
±5.1
6.
2±1.
9
16.0
±7.0
<0
.01
0.12
0.
29
S
PD
16
.1±4
.7
10.3
±4.0
19
.9±5
.8
AU
C
(mm
ol/L
)/24h
) H
PD
11
165±
792.
6 89
58±4
39.3
10
308±
818.
6 <0
.01
0.06
0.
19
S
PD
11
046±
593.
4 10
206±
517.
7 11
356±
749.
3
This
tabl
e de
scrib
es th
e ch
ange
s in
gly
caem
ic c
ontro
l for
the
29 c
ompl
eter
s. D
ata
are
give
n as
mea
ns (S
EM
). Si
gnifi
canc
e le
vel i
s se
t at
0<0.
05. (
HP
D n
= 15
, SP
D n
=14.

139
Figure 19: Changes in mean BG in the HPD at baseline, 4 Mo and 12 Mo
Figure 20: Changes in mean BG in the SPD at baseline, 4 Mo and 12 Mo
Mean 24h blood glucose for the SPD and HPD. Mean 24h BG decreased
significantly in HPD and non-significantly In SPD at four months. At twelve
months mean 24h BG was lower in the HPD group; but the difference was not
statistically significant.
4.0
5.0
6.0
7.0
8.0
9.0
10.0
11.0
12.0
FBG Breakf.
Lunch Dinner
HPD
Baseline 4 Mo 12Mo
4.0
5.0
6.0
7.0
8.0
9.0
10.0
11.0
12.0
FBG Breakf. Lunch Dinner
SPD
Baseline 4 Mo 12Mo

140
6.5 Discussion
Early detection and treatment of microalbuminuria is important as the presence
of microalbuminuria predict the progression to proteinuria and the increased risk
of micro- and macrovascular complications [54, 255]. The main risk factors for
microalbuminuria are hyperglycaemia and hypertension [54].
In this study BG measured as Gmax (p=0.06), %T>10 and AUC (p<0.01)
decreased in both groups by four months but reverted back to slightly above
baseline in the SPD group by the end of the study. The decreased Gmax at four
months was maintained in the HPD group but did not reach the recommended
levels of PPG <8 mmol/L [217]. In the HPD group time spend with a BG above
10 mmol/L was reduced by 6%. As in the main study group, HbA1c and FBG
changed significantly with time (p<0.01) with no significant treatment effect.
Results from the UKPDS clearly showed a beneficial effect of decreasing
overall blood glucose. It was shown cross-sectionally that a 1% lower HbA1c
was related to a 21% decrease in any endpoint or death related to diabetes or
all cause mortality [29]. No threshold for HbA1c was observed under which the
complication risk did not decrease or above which the complication risk no
longer increased. The greatest benefit was seen in persons with HbA1c near to
or in the normal range (≤6%) [29]. However, results from the ACCORD study
suggests that aggressive lowering of HbA1c may result in increased mortality
and the study was discontinued early after 3.5 years. The findings from the
ACCORD study showed that the intensively treated “arm”, where the aim was a
normalization of HbA1c to <6%, resulted in an increased mortality risk of 1.41%
compared to the conventionally treated group (HbA1c 7-7.9%) of 1.14%; or 257
vs. 203 deaths respectively [256]. More recently an investigation studied the
effect of a lower HbA1c on mortality risk in 21155 participants with diabetes and
renal impairment (GFR 15-59.9 ml/min/1.73kg2). They found a U-shaped
association between HbA1c and mortality, such that an HbA1c higher than 9%
and lower than 6.5% resulted in excess mortality in participants with non-
haemodialysis-dependent CKD. This excess risk was more pronounced in
people with better kidney function. The study did not distinguish between T1DM
and T2DM and no data on postprandial glycaemic control was obtained [257].
141
In the DECODE study, which investigated the ability of FBG vs. 2h post
challenge BG to predict all cause mortality in newly diagnosed T2DM, it was
found that the 2h post load BG was an independent predictor of an increased
risk of death, whereas FBG did not independently predict the risk of death [51].
Postprandial blood glucose has been shown to predict cardiovascular risk in line
with known risk factors such as hypertension, hyperlipidaemia and smoking
[200, 258]. As many as 80% of T2DM patients have been shown to have
postprandial BG above 8.9 mmol/L in spite of an HbA1c<7% [53]. It is therefore
reasonable to target postprandial BG in the aim of decreasing the risk of
diabetes related complications.
There was a non-significant decrease in AER over time with a trend towards a
significant treatment effect at 12 months. The change in AER was associated
with a combination of weight loss, change in SBP and postprandial blood
glucose spikes (Gmax). It is well known that obesity results in increased AER
and GFR [60, 240]. Weight loss has been shown to decrease both
hyperfiltration and albumin excretion [243]. The albumin to creatinine ratio
improved by four months in both groups; but the improvement was only
maintained in the HPD group at twelve months. Using the same model in
multiple regression showed changes in SBP to be strongly associated with the
change in alb/cr.
Glycaemic control and especially postprandial BG control is essential in
preventing and decreasing albuminuria in T2DM [51]. In the present study
postprandial blood glucose was improved in both groups with borderline
significant decrease in mean 24h BG at four months; however with time BG
control reverted back to near baseline values. The same trend was seen in
AER, with a mean decrease of 18µg/min at 4 months but only 5µg/min at 12
months. The lack of effect on AER long-term may be explained by baseline BG
control. HbA1c was close to 7% at baseline, with a significant improvement at
four months, and a subsequent return to close to 7% at the end of the study;
meaning the participants were relatively well controlled according to the
recommended levels of HbA1c at baseline [217], Major improvements would
demand high level of compliance to diet which in most studies reported, and in
this study was not maintained.

142
A major limitation of this study was the low number of participants (15 HPD and
14 SPD). Using the SD`s from the change in the individual variables, this study
was powered with 80% confidence (p<0.05) to show a difference between
groups of 0.8% for HbA1c, 1.5 mmol/L for FBG, 1.6 mmol/L for mean 24h BG,
3.9 mmol/L for Gmax, 18% for time spend with a BG >10% and 2263
((mmol/L)/24h). None of these differences were reached in this study and a
larger sample size is needed to show significance.
Participants in this study lost weight which may help explain changes in GFR
and AER. This study was based on a subset of participants from the main
study, and therefore not specifically powered for changes in glycaemic control.

143
Chapter 7: Study 3


145
Effect of carbohydrate timing and previous meal on glycaemic control in type 2 diabetics
During the course of T2DM the insulin response to a CHO load is compromised,
with a loss of first phase insulin response and impaired second phase insulin
response, leading to hyperglycaemia [259, 260].
Population-based studies have shown a relationship between postprandial
glucose (PPG) and the incidence of myocardial infarction (MI) and all cause
mortality in patients with type 2 diabetes [50, 51].
Currently an even distribution of CHO over all meals is recommended in the
diabetes diet. However there are very few studies showing this pattern to be
optimal in preventing hyperglycaemia.
Gannon and Nuttal in 2004 reported large changes in HbA1c with an absolute
fall of 2.2% over 5 weeks with a reduction in carbohydrate (CHO) from 388g to
142g. [195]. Data on the effect of carbohydrate distribution on glucose control is
limited. In order to determine the daily occurrence of glucose spikes, 24 hour
continuous glucose monitoring (CGMS) is a useful tool that has been little used
in type 2 diabetes [261]. Using CGMS our lab have recently shown that CHO at
breakfast leads to higher glucose spikes than CHO in meals at other times and
the best overall profile was achieved by CHO loaded at lunchtime [203].
Interpretation of this study was complicated by the fact that meals at each time
point had slightly different composition and glycemic index (GI) and that lunch
and evening meals were preceded by some CHO at both breakfast and lunch. It
is not clear if the augmented response to CHO at breakfast occurs because it
comes after a 12 hour fast, or because there is no prior exposure to CHO during
this time. Thus it is possible that the lunchtime CHO-rich meal could lead to
large spikes in glucose if CHO is not eaten at breakfast. Alternatively calorie
exposure from any source may be all that is required to mute the glycemic
response at the second and third meal. Trovati et al (2002) found that although
pre-prandial blood glucose is dependent on FBG, they also showed that FBG is
higher than both pre-lunch and pre-dinner blood glucose. Furthermore, the fall
in pre-lunch blood glucose compared to FBG, is greater than the fall in pre-

146
dinner blood glucose compared to pre-lunch glucose. This effect is greater with
increasing FBG levels [262].
A sustained decrease in the risk of microvascular disease has been reported
with tighter glycaemic control in T2DM [49, 263] Thus strategies that minimize
postprandial spikes and overall glycaemia are important to prevent diabetic
complications and in particular diabetic nephropathy.
This study examined the BG surges following lunch time CHO ingestion, after
withholding CHO at the first meal after an overnight fast. It was hypothesized
that withholding CHO at breakfast would result in higher blood glucose
excursions at lunch time, but in lower overall 24 h glycaemia.
7.1 Study protocol
57 participants with type 2 diabetes, aged between 35 and 75 years, were
recruited to the study. Participants were included if they had been weight stable
(within ± 2kg) and on stable medication during the last three months.
Participants were excluded if they had type 1 diabetes, had any malignancy, or
a history of metabolic disease such as liver, kidney, or gastrointestinal disease.
Twelve participants did not meet the inclusion criteria (HbA1c between 7 and
8%) and seven participants withdrew consent prior to study start.
Volunteers were divided into two groups matched on blood glucose control
before randomization. One group had an HbA1c of ≤7% and the other group
had an HbA1c of ≥8%. Randomization was done by block random number,
sequence was predetermined and volunteers were allocated treatment
sequence as they were recruited.
Of the 38 participants randomized to the study, 20 were in good glycaemic
control and 18 were poorly controlled (HbA1c ≤7% or ≥8% respectively). Of
these 31 completed both weeks of diet intervention. Three participants, who had
stated they had T2DM on the screening questionnaire, showed normal glucose
levels when assessing the peak and fasting blood glucose values despite the
participants not taking any hypoglycaemic drugs. Consequently they were
excluded from the analysis. The remaining 28 participants (18 male and 10
female) were included in the analysis. The Good control group consisted of 10

147
men and 4 women and the poorly controlled group consisted of 8 men and 6
women.
Of the 28 participants included in the analysis, six were treated by diet alone,
fourteen were treated with metformin alone, five were treated with metformin
and glimepiride or arcabose or rosiglitazone (dual treatment), one with
metformin, glimepiride and pioglitazone, (triple therapy) two with metformin,
glimepiride or gliclazide and insulin glargine (triple therapy with insulin). Other
medication included anti hypertensives, lipid lowering agents and
antidepressants. Participants were asked to maintain medication dose and
timing unchanged throughout the study period.
All participants reported low physical activity and they were asked to maintain
this level.
Randomization into dietary sequence was done by block random number.
Blood glucose excursions were measured using the Continuous Glucose
Monitoring System (CGMS) Medtronic MiniMed, Gold standard system
(Northridge, CA) (method pp 72-73).
Rate of gastric emptying (GE) was measured using 13C-Octanoic acid mixed
into the lunch meal. GE was measured for a 6 hour period between lunch and
dinner (method pp 73-76).
Baseline characteristics are shown in table 23.

148
Assessed for eligibility (n= 57)
Not meeting inclusion criteria (n=12) (HbA1c <7% > 8%)
Withdrew consent prior to randomization (n=7)
Randomized (n=38)
Allocation
Analyzed Completers (n=14)
Analyzed Completers (n=14)
Follow-Up
Analysis
Enrolment of eligible subjects
Good control (HbA1c ≤7%, n=20)Withdrew consent (n=2)Received allocated intervention (n=18)
Poor control (HbA1c ≥8%, n=18)Withdrew consent (n=3)Received allocated intervention (n=15)
Discontinued intervention due to elective surgery (n=1)Non-diabetic (n=3)
Discontinued intervention Sensor failure (n=1)

149
Diet protocol:
The meal tests provided 8000 kJ for men and 7000 kJ for women. These
energy levels were chosen to enable the volunteers to eat all the foods
provided. Due to the short term nature of the study weight change was not
expected to occur.
Participants were divided into two groups according to HbA1c.
Group 1: good control HbA1c ≤ 7.0 mmol/L (n=14, ten men and four women)
Group 2: poorly controlled HbA1c ≥8.0 mmol/L (n=14, eight men and six
women).
They were asked to consume their usual diet until dinner the night before the
meal test, where a standardised dinner meal was provided. Participants were
asked to fast for twelve hours prior to the meal test comencement. A
randomized two day treatment model with a cross over design was used.
Participants were asked to eat only the foods provided and to eat all foods
provided. The food was pre-weighed and individually wrapped meal by meal.
Participants were asked to space the three meals six hours apart; accordingly
they were encouraged to start the breakfast meal early (6:00 am) in order to
obtain a twelve hour fast before the second meal test.
Participants acted as their own control and were randomly allocated to the two
meal tests.
Treatment A: carbohydrate (CHO): Three identical meals (even distribution).
Treatment B: no carbohydrate (NoCHO): Breakfast without carbohydrates,
lunch and dinner identical to CHO meals.
These treatments were repeated on two separate study weeks with different
orders of treatment, to rule out the effect of meal sequence.
The evening prior to diet intervention participants were instructed to eat a
standard dinner consisting of 3000 kJ (Carbohydrate 44 %TE, Protein 33 %TE,
fat 23 %TE). The only difference between the two test days were the breakfast
meals. The remaining two daily meals (lunch and dinner) were identical on both
occasions and were identical to breakfast in the even distribution meal test day.

150
All foods for the intervention were provided. The individual meals were packed
in bags clearly marked with meal time and date. All foods were weighed and
individually wrapped. The three pre-weighed individually wrapped meals were
then packed into bags marked with meal sequence and date. A diet information
booklet was issued showing the individual meals detailing the amount of food
and giving suggested recipes. The participants were instructed to eat all foods
provided in the sequence described. If the volunteer did not eat all foods or
added foods, they were asked to note the discrepancies in the diet information
booklet. Kitchen scales were provided (DZC 5000A; Procon Technology,
Brisbane, Australia). All experimental procedures were done on an outpatient
basis.

151
Table 21: Nutrient composition of the two diets over 24 hours
Nutrient distribution CHO NoCHO
kJ 7887 7827
Protein (g) 96 118
Fat (g) 59 82
SAFA (g) 15 26
PUFA (g) 11 12
MUFA (g) 25 35
Cholesterol (mg) 657 1271
Carbohydrate (g) 229 155
sugars (g) 117 80
starch (g) 112 75
dietary-fibre (g) 35 25
Alcohol (g) 0 0
The nutrient distribution as a percentage of total energy:
% total energy (%TE) CHO NoCHO
Protein %TE 21 26
Total fat %TE 28 40
Carbohydrate %TE 51 34
Alcohol %TE 0 0
The only difference between the two meal test days was breakfast meal.
Lunch and dinner were identical at all occasions and were identical to breakfast
in the CHO meal test.

152
Table 22: Breakfast meals:
Nutrient distribution CHO NoCHO
kJ 2629 2569
Protein (g) 32 54
Fat (g) 20 43
SAFA (g) 5 16
PUFA (g) 4 4
MUFA (g) 8 18
Cholesterol (mg) 219 832
Carbohydrate (g) 76 2
sugars (g) 39 2
starch (g) 37 0
dietary-fibre (g) 12 2
Alcohol (g) 0 0
Percentage of total energy CHO NoCHO
Protein %TE 21 36
Total fat %TE 28 63
Carbohydrate %TE 51 1
Alcohol %TE 0 0

153
7.2 Results
7.2.1 Baseline characteristics
The participants were stratified by diabetes control prior to randomization.
Table 23: Baseline charactaristics of the 28 completers
Good control Poorly controlled T-Test
Sex (M/F) 10/4 8/6
Age (years) 63.07±2.1 64.71±2.2 p=0.51
Height (m) 1.7±0.0 1.7±0.0 p=0.85
Weight (kg) 86.81±2.4 102.2±4.6 p=0.007
BMI 30.6±1.3 35.5±1.2 p<0.001
Waist circumference 101.8±2.0 114.0±2.7 p=0.001
HbA1c 6.3±0.2 8.8±0.3 p<0.001
Data are given as means (SEM). There were significant differences in weight,
BMI, waist circumference and HbA1c at baseline.
7.2.2 Test meals
The volunteers were instructed to consume their three daily meals six hours
apart. However, the minimum time between two meals was five hours; therefore
the blood glucose traces were divided into five hour time periods, starting at the
time of meal initiation for breakfast, lunch and dinner.
One volunteer disliked corn and omitted this ingredient at all meals. All other
participants reported no discrepancies between planned food intake and food
consumed.

154
7.2.3 Blood glucose excursions
7.2.3.1 Peak blood glucose
There was a significant treatment effect for the Gmax over the 24h period
(Estimated marginal mean for CHO was 12.1 mmol/L and for NoCHO 11.0
mmol/L). The difference between the two treatments in 24h peak blood glucose
of 1.1 mmol/L was independent of diabetes control (p=0.004).
There was a significant effect of treatment on breakfast Gmax (estimated
marginal means were 12.2 mmol/L and 9.3mmol/L for CHO and NoCHO groups
respectively). The Gmax was 2.95 higher after the CHO meal compared to the
NoCHO meal (p<0.001). The differences in Gmax at lunch and dinner were not
significant. There were no significant correlations between mean Gmax and
sex, age, BMI and weight at baseline.
There was a significant difference in Gmax between the two diabetes control
groups. For 24h Gmax the difference was 1.8 mmol/L higher in the poorly
controlled group compared to the good control group with estimated marginal
means of 12.4 mmol/L vs. 10.7 mmol/L respectively (p=0.02). At breakfast,
lunch and dinner the difference between diabetes control groups was not
significant (p=0.06 for breakfast, p=0.16 for lunch and p=0.35 for dinner)
suggesting the Gmax occurred with different meals in different subjects.
7.2.3.2 Blood glucose above 10 mmol/L
Time spent with a blood glucose above 10 mmol/L (T>10) was assessed by
averaging the two days on each diet treatment. There was a non-significant
treatment effect in minutes of T>10 (min T>10) for the total 24h period
estimated marginal means for CHO was 180.7 min and for NoCHO 144.3 min.
Withholding CHO (NoCHO) in the first meal of the day resulted in 36 minutes
less spent with a BG above 10 mmol/L compared to the CHO group (p=0.16).
The treatment by diabetes control interaction was not significant; p=0.93).
There was a significant difference in min T>10 between diabetes control groups
of 133.6 min between the good and poorly controlled volunteers in 24h T>10;
p=0.03. With estimated marginal means for HbA1C<7% group of 95.7 min and
229.3 min for the HbA1c ≥8% group.

155
After the breakfast meal there was a significant treatment effect, where the
CHO meal resulted in longer time spent with BG above 10 mmol/L, estimated
marginal means 76.4 min compared to 32.9 min in the NoCHO treatment, a
difference of 25 minutes or 15% (p=0.001).
Min T>10 for lunch and dinner was not significantly different by treatment
(p=0.82 for lunch and 0.64 for dinner).
Table 24: Blood glucose excursions
CHO NoCHO CHO NoCHO
HbA1c<7% HbA1c>8%
24h Gmax * # 11.2±0.6 10.2±0.4 13.0±0.5 11.8±0.6 Gmax Breakfast * 10.9±0.6 8.0±0.5 12.3±0.5 10.8±0.6 Gmax Lunch 9.4±0.5 9.4±0.4 10.5±0.5 10.8±0.6 Gmax Dinner 9.2±0.5 10.0±0.4 10.7±0.6 10.5±0.5
24h T>10 average min)# 118.0±37.7 56.4±19.6 223.8±35.9 184.6±43.5 min. T>10 Breakfast*# 55.5±16.0 11.4±7.3 97.3±20.2 54.3±18.9 min. T>10 Lunch 29.6±11.6 20. 9±9.8 58.8±13.0 63.6±18.3 min. T>10 Dinner 32.0±14.4 23.0±7.2 65.0±15.1 66.1±15. 6
Data are given as mean (SEM). * Significantly different treatment effect p<0.05,
# Significant difference between DM_control groups p<0.05
7.2.3.3 Total area under the blood glucose curve (AUC in mmol/L*5h)
There was a significant treatment effect for AUC after breakfast. Estimated
marginal means 2800 and 2215 for CHO and NoCHO respectively, with a lower
AUC in the NoCHO group of 586 mmol/L*5h (p<0.001).
There was a non-significant treatment by DM_Control effect in AUC.
AUC for lunch and dinner was not significantly different for treatment effect or
for treatment by DM_Control interaction.

156
For all time points the AUC was significantly higher in the poorly controlled
group, regardless of treatment (p=0.006, p=0.003 and p=0.015 for breakfast,
lunch and dinner respectively).
Table 25: Total AUC for the 5h post meal period
Good control Poor control
Post breakfast 2268±140.3 2733±128.4ab
CHO Post lunch 2093±114.1 2490±80.4a
Post dinner 2177±108.5 2538±99.8a
Post breakfast 1955±108.5 2474±121.8ab
NoCHO Post lunch 2093±103.0 2557±110.2a
Post dinner 2197±85.8 2486±99.3a
The data is analyzed as the mean of two test days with either CHO or NoCHO
meals, two volunteers had missing sensor data for one of the meal tests. All
volunteers had data for at least one 24h period of the individual test meals. Data
is presented as mean (SEM). a AUC was significantly higher in the poorly
controlled volunteers compared to good control p<0.05. b AUC was significantly
lower in the NoCHO breakfast compared to the CHO breakfast p<0.001
independently of DM_Control group.

157
Figure 21: Total area under the blood glucose curve.
AUC was calculated for the individual meals using the trapezoid method. The
time periods are presented with time zero as baseline and lasting for 300
minutes (5h), within this timeframe all volunteers had at least one complete day
of meal test. Data from the two weeks were averaged meal by meal the error
bars illustrate standard error of the mean AUC.
*AUC was significantly lower after NoCHO breakfast compared to CHO
breakfast regardless of diabetes control group<0.05.
0
500
1000
1500
2000
2500
3000
Post breakfast Post lunch Post dinner
AUC
HbA1c ≤7% CHO HbA1c ≤7% NOCHO HbA1c ≥8% CHO HbA1c ≥8% NOCHO
*
* m
mol
/L x
5h

158
Figure 22: Cumulative blood glucose excursions
Mean BG (20h All volunteers)
4.0
5.0
6.0
7.0
8.0
9.0
10.0
11.0
12.0 CHO (good)
NOCHO (good)
CHO (poor)
NOCHO (poor)
BG
(m
mol
/L)
This figure represents the differences in meal composition and diabetes control.
As expected the major differences were seen in the breakfast meals, where
NOCHO diet in good control patients (red line) experienced the lowest blood
glucose excursions compared to CHO good control (blue line), CHO poor
control (green line) and NoCHO poor control (purple line) (p<0.001 for treatment
effect). Lunch and dinner excursions were not significantly different between
treatments. There was an overall difference between good and poor control
(p<0.05).

159
Figure 23: Mean BG for the entire 24h period divided by DM control groups
Mean BG (20h divided by DM control)
4.0
5.0
6.0
7.0
8.0
9.0
10.0
11.0
12.0
CHO (good) NOCHO (good)
4.0
5.0
6.0
7.0
8.0
9.0
10.0
11.0
12.0
CHO (poor) NOCHO (poor)
Good control Poor controlBG
(mm
ol/L
)
This figure depicts the two control groups separately. It is shown that the main
difference is in the breakfast meal, with lunch and dinner similar in both groups.

160
7.2.4 Gastric emptying at lunch time
In the test meals the macronutrients differed in the breakfast meal, resulting in
higher fat and protein content and decreased CHO content in the NoCHO meal
(table 3 gives the nutrient composition).
Three measures were compared: the time elapsed for one half of the meal to be
emptied from the stomach (T½), the time for 5% of the meal emptying (Tlag)
and gastric peak time which is the maximum percentage 13C-Octanoic Acid
dose recovered per hour, it is measured at the point of inflection on the recovery
curve (Tmax), all variables are expressed in minutes.
There were no significant differences in the gastric emptying rate between
treatments or between groups after the standard lunch (p>0.05).
Table 26: Gastric emptying
Gastric emptying times
T½ Tlag Tmax
Good control (n=13) CHO
190.8±34.5 74.6±12.1 180.5±26.5
Poor control (n=14) 187.4±30.4 70.1±9.8 173.2±22.6
Good control (n=13) NoCHO
162.0±17.6 73.7±5.5 171.3±11.4
Poor control (n=14) 151.3±18.7 63.5±5.6 153.3±12.4

161
7.3 Pre-prandial blood glucose
The FBG in all treatment and diabetes control groups was significantly higher
than pre-lunch and pre dinner BG (*p<0.05 and #p<0.01). Pre-lunch BG was
higher than pre-dinner BG, except in the good control group when consuming
NoCHO treatment, however, the difference was not significant.
Table 27: Pre-prandial BG divided into treatment and DM_Control groups.
FBG Pre-Lunch Pre-Dinner
CHO (Good) 7.5±0.5 6.1±0.4* 5.9±0.3#
CHO (Poor) 8.0±0.5 6.9±0.3# 6.3±0.2#
NoCHO (Good) 6.8±0.4 6.0±0.3# 6.2±0.8#
NoCHO (Poor) 8.6±0.4 7.0±0.4# 6.8±0.3#
Data are mean (SEM) *p<0.05 compared to baseline. # p<0.01 compared to
baseline.
Figure 24: Blood glucose excursions after identical meals eaten at different
times of the day.
The three meals were identical in the CHO treatment “arm” however the BG
fluctuations differed with different time of day. Overall the mean BG differed
between breakfast and lunch (p<0.01), there were no significant differences
between lunch and dinner mean BG (p=0.39).
0
2
4
6
8
10
CHO (Good) CHO (Poor) NoCHO (Good) NoCHO (Poor)
mm
ol/L
Pre-prandial blood glucose
FBG Pre-Lunch Pre-Dinner
* # # #
162
7.4 Discussion
The main findings of this study were that withholding CHO in the breakfast meal
and only consuming fat and protein did not alter the response to CHO at the
lunch time meal and as expected resulted in a significantly decreased blood
glucose excursions in the 5h post meal period, where Gmax, T>10mmol/L, and
AUC were significantly lower in the NoCHO compared to the CHO group
(p<0.05). Surprisingly there was still a considerable rise in glucose after
breakfast especially in the poor control group. There was as expected a
significant difference in blood glucose excursions between diabetes control
groups, such that the poorly controlled diabetics had consistently higher Gmax,
T>10 and AUC values compared to the good control volunteers; but there was
no interaction with treatment.
Data on the effect of carbohydrate distribution on glucose control is limited.
Pearce et al investigated the effect of CHO distribution, when CHO was loaded
at different meals. They found that CHO loaded at lunch resulted in the lowest
BG excurtion, measured as Gmax, T>12, and AUC20h; compared to CHO
loaded at breakfast or dinner and also when compared to the recommended
even CHO distribution. In this study AUC adjusted for FBG was significantly
lower when CHO was loaded at lunch compared to all other distributions tested
(p=0.006). Peak BG (Gmax) was significantly lower after the CHO loaded lunch
(p=0.003) with CHO loaded at breakfast showing the highest Gmax [203] .
Post meal peaks in glucose probably contribute more to the complications of
diabetes than high steady levels even though under both circumstances HbA1c
may be equally high [264].
Population-based studies have shown a relationship between postprandial
glucose (PPG) and the incidence of myocardial infarction (MI) and all cause
mortality in patients with type 2 diabetic [50, 51]. Restoring blood glucose to
normal range is the aim of diabetes treatment. In both the DCCT and the
UKPDS trials it was shown that achieving HbA1c in the lower range (≤6.5% and
≤7% respectively) substantially decreased the morbidity rate [48, 199].

163
7.4.1.1 Second meal effect
Looking at blood glucose excursions at lunch time Jovancovic et al found a 95%
higher rise in BG following the lunch meal if no breakfast had been given
compared to a lunch following a standard breakfast and a 40% lower rise in BG
if intravenous arginine was given prior to the lunch meal [265]. Also when using
a protein preload two hours prior to the breakfast meal, a reduction of 40% in
AUC was seen after the subsequent breakfast [266].
In acute meal tests comparing a breakfast with a high glycaemic index (GI) to a
breakfast with added psyllium fibre resulting in a lower GI, lower postprandial
BG and AUC was observed in the low GI group in T2DM. More relevant to this
study BG excursions at the subsequent lunch meal were decreased. AUC was
decreased at both breakfast and lunch after a low GI breakfast meal [267].
Nilsson et al found significantly decreased incremental AUC after breakfast and
lunch, when a barley kernel breakfast (low GI) was given compared to a whole
wheat meal (high GI) [268]. An overnight second meal effect has been shown in
healthy volunteers when a low GI evening meal was consumed. The altered
substrate oxidation (higher fat oxidation and lower CHO oxidation) was noted up
to but not beyond the second meal [269, 270]. A decrease in AUC of 14% in the
good controlled and 9% in the poorly controlled participants after NoCHO
breakfast and a substantial decrease in T>10 in the period between breakfast
and lunch (80% and 44% in good and poorly controlled participants
respectively) was found. Likewise Gmax decreased significantly after a NoCHO
breakfast by 27% and 17% in the good control and poorly controlled diabetes
respectively. Our results are similar to those of Clark et al they investigated the
effect of a high GI breakfast compared to a low GI breakfast, on glucose
excursion in the period between breakfast and lunch. They showed significantly
lower AUC following a low GI breakfast; but no second meal effect at the lunch
meal was seen. The marked improvement in AUC after the breakfast meal can
probably be attributed to improvement in insulin action and pancreatic function
[267].
7.4.1.2 Circadian rhythm or dawn phenomenon
Abnormal high fasting blood glucose has been repeatedly shown in T2DM [271,
272]. Glucose tolerance increases progressively during the daytime in T2DM,

164
this effect is opposite to healthy subjects, where insulin sensitivity is higher in
the morning [273]. In glucose tolerance tests (50 g liquid glucose tested over
120 min) performed at different times of the day (09.00, 15.00 and 20.00 in
random order) the morning BG was found to be lower whereas afternoon and
evening BG were higher, but not different from each other in healthy volunteers
[274]. Using hyperglycaemic insulinaemic clamp technique Boden et al showed
that there is an increased insulin sensitivity in the early morning peaking in the
early afternoon and declining throughout the evening and night in healthy
volunteers [275].
It has been shown that BG increases after the breakfast meal and remains
elevated for the extended period between breakfast and lunch, whereas there is
a progressive improvement in insulin sensitivity during the afternoon and
evening period, resulting in a suppression of endogenous glucose production in
T2DM with lower BG and AUC [268, 276]. In comparison, healthy persons have
insulin excursions defined with an early morning increase with a peak at midday
and declining at night time [272].
This was shown by Trovati et al (2002). In 337 T2DM participants they found
that although pre-prandial blood glucose is dependent on FBG, they also
showed that FBG is higher than both pre-lunch and pre-dinner blood glucose.
Furthermore, the fall in pre-lunch blood glucose compared to FBG, is greater
than the fall in pre-dinner blood glucose compared to pre-lunch glucose. This
effect is greater with increasing FBG levels [262].
Our study confirms these latter findings where pre-prandial BG decrease over
the course of the day, with FBG being higher than pre-lunch BG and pre-dinner
BG was lower than pre-lunch BG, Interestingly, even with the exact same
nutrients served at different times of the day (CHO treatment) this effect was
still evident indicating improved insulin sensitivity as the day progresses.
Limitations of this study are the lack of control implicit in free living conditions.
Medication was very diverse ranging from no medical treatment to multiple
medications including insulin. The aimed recruitment was 20 volunteers in each
group. This recruitment was not met and a number of volunteers were excluded

165
or dropped out of the study. Using the original values of the SDs that were
estimated for the design of the study (2.5-3.5), sample sizes of 14 in each group
meant that the study was estimated to be powered at between 51%-79% for the
2 mmol/L change in 24 hour Gmax over time.
Strengths of this study include the use of CGMS to obtain comprehensive and
dynamic fluctuations in BG which would not have been possible with SMBG in
free living volunteers. The meals in the study were identical except for the
breakfast meal tested which rule out changes due to slightly different nutrient
composition. Gastric emptying rate was measured after lunch to rule out effects
on the GE of different breakfasts. This was a cross over design where the
volunteers acted as their own control with no changes in medical treatment and
physical exercise during the study period.
7.5 Conclusion
Withholding CHO in the first meal results in significantly decreased blood
glucose excursions after this meal, with lower Gmax, T>10 and AUC. There was
no residual effect beyond this meal.
The substantial decrease in T>10 may lead to a decreased risk of
complications, especially in the poorly controlled T2DM already on multiple anti-
diabetic medication.


167
Chapter 8: General discussion and conclusion


169
High protein diets have become increasingly popular with the aim of reducing
body weight in the general population and in type 2 diabetes patients. However,
the safety of utilizing this dietary pattern in type 2 diabetes patients with renal
impairment has been questioned [65].
An increasing body of evidence reporting added benefit on cardiovascular risk
markers such as decreased triglyceride [137, 139, 145, 175, 244], increased
high density lipoproteins [167], retention of lean body mass [189], increased
satiety [155], increased weight loss [175] and increased loss of abdominal fat
mass [175] of the HPD makes this pattern attractive in a group of patients with
increased risk of CVD.
The main aim of this thesis was to investigate the effect of an energy restricted
diet with a high protein to carbohydrate ratio, compared to the standard protein
weight loss diet, currently recommended for T2DM patients, on renal function,
HbA1c and lipids in T2DM participants with microalbuminuria [65].
Renal function
The main finding was that renal function was unaffected by allocation to a high
protein weight loss diet, although the dietary intake goals were not achieved
and the numbers fell short of the planned size. There were no significant
changes in GFR measured as iGFR or as estimated by the MDRD equation or
serum cystatin C and changes in GFR were unrelated to protein intake.
The earliest measure of renal dysfunction in T2DM is AER and spot urine alb/cr
ratio. There was a significant decrease in AER between baseline and 4 Mo
(p=0.018); but the change between baseline and 12 Mo was not significant.
AER decreased in the HPD whereas it remained stable in the SPD group and
this difference was borderline significant at the end of the study, when adjusting
for baseline differences (p=0.06). The same results were seen for alb/cr.
In a study looking at the effect of 6 months HPD compared to a SPD weight loss
study; in 65 healthy overweight to obese participants a similar effect was seen
regarding changes in AER. In this study the SPD group decreased protein
intake by 21g and the HPD increased protein intake by 16g while there were no
restrictions in energy intake. Although adaptive changes in kidney volume and
GFR occurred, no change in AER was seen. Baseline AER in this study was in

170
the normal range except for one volunteer in each group who had
microalbuminuria. Excluding these volunteers from the analysis did not change
the outcome; both became normoalbuminuric during the intervention [277].
In a more recent study, 99 T2DM participants with microalbuminuria were
randomized to a HPD (30%TE protein) or a SPD (15%TE protein) 3 months
energy restricted, weight loss dietary intervention, followed by nine months
energy balance. The difference in protein intake between the two groups was
comparable to our study, with a difference between groups of ≈25 g (ns at 12
Mo). In this study no difference was found for AER or GFR between groups at
either 3 or 12 months. No association between renal outcome and protein
intake was reported [188]. In our study protein intake changes only marginally
(+2g/d) in the HPD but decreased by 18g in the SPD. It seems protein intake is
unrelated to the change in AER and other factors may play a role.
Weight loss
Weight loss of 5-10% of total body weight is recommended for most T2DM
patients [66]. This level of weight loss has been reported to improve measures
of renal function (predominately albuminuria) [278-280]. In the weight loss study
conducted in for this thesis, mean weight loss was 9% in the HPD group and
7% in the SPD group (ns).
The effect of weight loss on BP and AER was tested in 19 obese subjects who
followed either an energy restricted diet (1000-1400 Kcal; ad libitum protein
intake) or were given an ACEi inhibitor (captopril 78±36 mg/d). This showed
weight loss to be as effective as treatment with ACEi in reducing proteinuria.
After 12 Mo the decrease in proteinuria was 83% after treatment with the
energy restricted diet and 80% in the ACEi treated group, while GFR remained
stable in both groups [279].
Proteinuria has also been shown to be associated with change in BMI. Fifty six
volunteers with biopsy proven obesity related glomerulopathy, who completed a
six month weight loss (low fat, energy restricted diet) and exercise intervention
(60 min moderate exercise three times a week), were divided into three groups
according to changes in BMI: group 1. BMI decreased more than 3% (n=27),
group 2: weight stable (n=21) and group3: BMI increased (n=8). A decrease in

171
BMI of 8% resulted in a ≈ 35% lower proteinuria after six months. When BMI
increased, a 29% increase in proteinuria followed. In 27 volunteers who still had
a decreased BMI after 24 months of follow up, the beneficial effect of weight
loss was maintained. In this group the decrease in BMI was 9% and the
decrease in proteinuria was 51% at 24 Mo [278].
In a meta regression by Afshinnia et al [125] it was shown that weight loss is
associated with a decrease in AER of 1.1 mg/24h for every 1 kg lost. This effect
was seen regardless of intervention type. The studies in this meta-regression
were highly heterogeneous ranging from short term dietary intervention to
bariatric surgery. This led the authors to speculate that the effect on AER was
due to weight loss but the evidence was moderate. In this meta-regression a
mean of 14mg/24h decrease in AER was reported as a result of weight loss.
Decreased AER have been reported in participants with proteinuria (AER
>200µg/min) as a result of weight loss. This, however, is not so clear in
volunteers who are normoalbuminuric [277] or microalbuminuric [188]. In these
studies no significant change in renal function and AER, at the end of 6 and 12
months, has been reported, indicating that weight loss per se may not result in
improvements in AER and other factors such as blood pressure and glycaemic
control also play a role.
In this study a decrease in AER of 16.8mg/24h in the HPD group (1.6 mg/kg
WL) and an increase of 1.4 mg/24h in the SPD group was found. The decrease
in the HPD group is comparable to the overall decrease in AER found in the
meta-regression discussed above. However, the lack of change in the SPD
group is puzzling. Using the results reported by Afshinna, given the total weight
loss of 7.5 kg a decrease in AER by around 8 mg/24h in the SPD group could
be expected. However, between eight and twelve months of intervention SBP
and DBP increased, with both variables exceeding baseline values in the SPD
at the end. The change in AER was significantly associated with the change in
BP (SBP: r= .54; p=0.001, DBP: r= .49; p=0.003).
Blood Pressure
Systolic blood pressure decreased significantly between baseline and four
months in both groups, but at 12 months the decrease was not statistically

172
significant and the SPD had returned to baseline values. Between eight and 12
Mo BP increased in SPD (+3.8 SBP and 4.0 DBP) and decreased (-2.9 SBP
and +1.0 DBP) in the HPD. The decrease in BP over the entire 12 Mo period
was -4.9/-2.5 in the HPD and +0.7/+5.2 mmHg in the SPD for SBP/DBP
respectively; this difference was significant only for DBP.
These results are similar to findings in a 12 Mo follow up study of 66 T2DM
volunteers. The participants were randomly assigned to a HPD (30%TE) or a
SPD (15%TE) energy restricted diet, for eight weeks. Both groups lost weight
with no significant difference between groups. In this study a decrease in SBP
of 6 mmHg was seen in both groups after the weight loss period (8 weeks).
After 12 Mo follow up the SBP was still 4 mmHg lower than baseline in the HPD
and 2 mmHg higher than baseline in the SPD. The change in DBP showed the
same trend with an increase in SPD against a decrease in HPD [185]. A similar
effect of changing CHO for protein was also seen in a study including 60
healthy volunteers. It was shown that increasing the usual diet with 35-40 g
protein in place of CHO resulted in lower BP in the HPD [281].
Diastolic blood pressure decreased over time in the HPD group and increased
in the SPD group and there was a significant treatment effect at both four and
12 months. Delbridge et al [282] investigated the effect of two weight
maintenance diets, a HPD vs. a high CHO diet after 12 months following a
weight loss of 16.5 kg obtained using a VLCD for three months. Participants
maintained a weight loss of 14 kg with no significant difference between
treatments. Both SBP and DBP decreased significantly during the first phase
(VLCD). At the end of phase 2 the return toward baseline values for both SBP
and DBP were significantly higher in the high CHO group compared to the HPD
group. The sample size in this study was higher compared to the present study;
but the trend is comparable.
This decrease in DBP with a high protein diet has been reported previously. In a
recent study 83 overweight and obese women were randomized to either a
HPD (protein 30%TE and CHO 40%TE) or a high CHO, high dietary fibre diet
(CHO 50%TE, fibre 35g and protein 20%TE). Both diets were energy restricted
by 2 to 4 MJ. After eight weeks intervention DBP had decreased more in the
HPD (-3.7 mmHg; p = 0.005) compared to the high CHO diet. The change in

173
SBP was not significantly different between groups [283]. Other weight stable
studies have shown an effect of high protein diets on both SBP and DBP [183,
185].
Glycaemic control
High protein diets may result in greater benefit in glycaemic control compared to
SPD. In very short term studies a low carbohydrate isocaloric diet have shown
greater benefit in improving glycaemic control compared to a high CHO, low fat
diet [195, 284]. A decrease in 24h AUC was seen after 5 weeks on the HPD
and HbA1c was decreased by 0.8% compared to 0.3% in the SPD [196, 285].
However, in energy restricted diets, equal effects on glycaemic control,
regardless of macronutrient intake, have been most frequently reported [139,
286].
We found significant decreases in FBG and HbA1c in the randomized
completers group at 12 months, with no significant difference between groups.
In the CGMS sub study, significant changes were seen in AUC, %T>10 and
Gmax over time, with no significant difference between treatment groups.
Although not statistically significant (p=0.26) there was a 6% decrease in the
time spent with a BG above 10 mmol/L in the HPD, which may translate into
health benefits over time. The HPD had an absolute weight loss ≈3kg more than
the SPD (ns) and this may explain the difference in %T>10. This would indicate
that weight loss, and probably the loss of abdominal fat mass is responsible for
the glycaemic benefits achieved.
Withholding CHO in the breakfast meal after an overnight fast resulted in a
decreased glucose excursion at that meal, with no carryover effect at the
subsequent lunch meal. Overall 24h blood glucose, T>10 and Gmax were lower
in the NOCHO diet allocation as a consequence of the lower CHO intake in the
breakfast meal. Further studies are needed to investigate the effect of
withholding CHO in the first meal translate into long-term benefit if sustained for
a longer period.
Serum lipids
A decrease in TG has been reported in HPD compared to SPD in high protein
diets [138, 145, 196], usually attributed to the decrease in carbohydrate intake.

174
Increases in HDL have also been reported but usually only in the ketogenic low
CHO diets, where fat intake is higher [134].
The main finding of this study was a significant decrease in TG and a significant
increase in HDL over time in both groups with no difference between
treatments. There were no significant differences in total cholesterol and LDL
over time.
LDL increased in the HPD by 0.1mmol/l and decreased by 0.03 mmol/L in the
SPD, resulting in a net difference between groups of 0.4mmol/L (p=0.052).
However, the increase in LDL in the HPD group may be explained by the
termination of lipid lowering drugs in two volunteers from this group.
Dietary fat
Other dietary factors may affect the outcome of this study. One study (265)
looked at the effect of a diet high in MUFA compared to a diet high in SAFA on
blood pressure in 162 healthy volunteers. The volunteers were randomly
assigned to isocaloric diets containing 37 %TE total fat; the SAFA diet consisted
of 17%TE SAFA, 14%TE MUFA and 6%TE polyunsaturated fatty acids (PUFA)
and the MUFA diet consisted of 8%TE SAFA, 23%TE MUFA and 6%TE PUFA.
A significant decrease in BP was found in the MUFA diet with no significant
difference in the SAFA diet. The decrease in SBP in the MUFA diet was -2.2%
whereas the decrease in DBP was -3.8% compared to the SAFA diet (p<0.01).
Diastolic blood pressure was significantly lower in the MUFA diet compared to
the SAFA diet, but this effect was only evident in the volunteers who consumed
less than 37%TE from total fat [287].
We found a significantly higher MUFA intake in the HPD at four months
(35g/day vs. 24g/day in the HPD and SPD respectively (p=0.01)) and higher but
not significantly higher MUFA intake at the end of the study (29g/day vs.
22g/day, (p=0.07)). Total fat intake at 12 Mo was 30%TE in both groups
(reported in 3 day diet diary). These differences in MUFA as well as the
differences in protein and weight loss may explain the differences in DBP at the
end of the study (the MUFA intake did not differ between groups at baseline;
37g/day vs. 31 g/day, p=0.23).

175
Limitations / strengths
The power calculation was based on the study by Knight et al [121] who
demonstrated a fall in creatinine clearance of 7.7 ml/min/1.73 m2 per 10 g
protein over a period of 11 years (SD 13.4 ml/min). We updated the power
calculation using the actual SD (14.1ml/min) from the first 12 volunteers. Using
these calculations with the current sample size of 19 volunteers in HPD and 17
volunteers in SPD meant that this study was estimated to be powered to detect
a difference of 13.6 ml/min between groups in the eGFR change scores which
is a very large effect and much greater than that observed by Knight over 11
years.
However, in this study the SD for the eGFR were large, at baseline SD was
26.4 and 29.5 in the HPD and SPD respectively and at the end of the study 21.2
and 29.0 for the HPD and SPD respectively (for the iGFR the SD’s were larger,
at baseline were 40.3 and 26.8 for the HPD and SPD respectively and 35.3 and
28.4 at the end of the study). We based our power calculation on much lower
SD’s (14.1), meaning this study was under powered to detect even a large
difference of 13.6 ml/min/1.73m2. However changes in eGFR and cystatin C
were exactly the same in both groups and protein intake was unrelated to
changes in renal function.
The duration of the study (12 Mo) might not be sufficient to see major changes
in renal function in patients with mild renal impairment. The 2-3 year
intervention in the MDRD study was inconclusive after 10 years of follow up and
the authors recommend longer intervention and follow up time [87]
Dietary intake was based on self-reported data. It is well known that
underreporting of energy intake is common and misreporting of protein intake is
also frequent [288]. It has been shown that obese people tend to underreport
energy intake to a larger extent than non-obese people. There is a tendency to
over report protein intake and underreport fat and CHO intake in obese people,
indicating differential reporting of different food groups [289]. Protein intake was
overestimated in the FFQ, more so in the HPD. The HPD reported an increase
of 16 g protein/d but the measured increase based on urinary urea was 1.8 g/d.
In the SPD the reported decrease in protein intake was 18g/d and the measured
decrease was 20 g/day. In comparison, the reported protein increase in the

176
HPD using 3 day diet record was 3g and the reported decrease in the SPD
group was 30g, accordingly, more in line with measured protein intake (+2g/d in
HPD and – 18g/d in SPD).
Compliance to diet was achieved in the randomized sample although the
difference in protein intake was at the lowest planned level of 20g (achieved
difference between diets at 12 Mo was 20g/d) and this may be a significant
limitation of the study. However, this difference is comparable to ad libitum HPD
weight loss studies [277] and energy restricted HPD weight loss diets [188]
reported.
There are major strengths in this study. The use of an isotope tracer to measure
GFR is considered the gold standard measurement technique [239]. This
measure was used together with measurement of Cystatin C, AER and Alb/cr
ratio, yielding a very comprehensive assessment of renal function during the
study.
For assessment of glycaemic control CGMS was used. This method yields a
very comprehensive glycaemic profile with 288 blood glucose measurements
over 24 h.
Conclusion In conclusion both diets were effective in producing weight loss, with 58%
volunteers losing more than 5% and 39 % volunteers losing more than 10% of
their body weight. Renal function was unaffected by treatment. Serum lipids
were already very well controlled at study start and only minor changes were
seen in the 12 months period. Glycaemic control was significantly improved at 4
months but returned to near baseline values by 12 months in both groups. BP
decreased in the HPD but only DBP was significantly different.
Differences in composition of the weight loss diet, although relatively small at
the end, did not adversely affect any outcome. It is therefore possible to
recommend a dietary treatment suited to the individual’s preference, either high
protein, low fat or high complex CHO, low fat diets, to maintain long-term
compliance.

177
There was a possible increase in microalbuminuria in the SPD secondary
analysis (ITT), but caution should be taken in interpreting this given baseline
differences in diabetes control.
These results should be viewed with caution. Because of the low number of
participants and consequent low power to see a small change, further longer
term (2-3 years) studies are recommended.
This study is the first to examine the long-term efficacy and safety of higher
protein diets in T2DM renal impaired individuals. Both diets had positive effects
on cardiovascular risk factors with no changes in renal function.


179
References 1. AIHW, Diabetes Diabetes series no. 8. Cat. no. CVD 40. Canberra: AIHW.,
2008. 2. IDF, W.a., Definition and diagnosis of diabetes mellitus and intermediate
hyperglycemia. 2006. 3. Danaei, G., et al., National, regional, and global trends in fasting plasma
glucose and diabetes prevalence since 1980: systematic analysis of health examination surveys and epidemiological studies with 370 country-years and 2.7 million participants. Lancet, 2011.
4. NDSS (2009) Australian diabetes map. 5. statistics, A.b.o. (2009) National health survey: Summary of results. 6. Dunstan D, Z.P., Welborn T, Sicree R, Armstrong T, Atkins R, Cameron A,
Shaw J, Chadban S, on behalf of the and A.S. Committee (2001) Diabesity & Associated Disorders in Australia - 2000. http://www.diabetes.com.au/pdf/AusDiab_Report.pdf.
7. Bulletin26 (2005) Cost of diabetes in Australia, 2000-01. 8. (2009) Diabetes prevalence in Australia.
http://www.aihw.gov.au/publications/cvd/cvd-46-10639/cvd-46-10639.pdf. 9. Economic costs of diabetes in the U.S. In 2007. Diabetes Care, 2008. 31(3): p.
596-615. 10. Colagiuri S, C.R., Conway B, Grainger D, Davey P. (2003) DiabCo$t Australia:
Assessing the burden of Type 2 Diabetes in Australia. Diabetes Australia. 11. Annis, A.M., et al., Family history, diabetes, and other demographic and risk
factors among participants of the National Health and Nutrition Examination Survey 1999-2002. Prev Chronic Dis, 2005. 2(2): p. A19.
12. Paulweber, B., et al., A European evidence-based guideline for the prevention of type 2 diabetes. Horm Metab Res, 2010. 42 Suppl 1: p. S3-36.
13. Lenz, M., T. Richter, and I. Muhlhauser, The morbidity and mortality associated with overweight and obesity in adulthood: a systematic review. Dtsch Arztebl Int, 2009. 106(40): p. 641-8.
14. Eriksson, K.F. and F. Lindgarde, Poor physical fitness, and impaired early insulin response but late hyperinsulinaemia, as predictors of NIDDM in middle-aged Swedish men. Diabetologia, 1996. 39(5): p. 573-9.
15. Knowler, W.C., et al., Reduction in the incidence of type 2 diabetes with lifestyle intervention or metformin. N Engl J Med, 2002. 346(6): p. 393-403.
16. Lindstrom, J., et al., Sustained reduction in the incidence of type 2 diabetes by lifestyle intervention: follow-up of the Finnish Diabetes Prevention Study. Lancet, 2006. 368(9548): p. 1673-9.
17. Li, G., et al., The long-term effect of lifestyle interventions to prevent diabetes in the China Da Qing Diabetes Prevention Study: a 20-year follow-up study. Lancet, 2008. 371(9626): p. 1783-9.
18. Hu, F.B., et al., Diet, lifestyle, and the risk of type 2 diabetes mellitus in women. N Engl J Med, 2001. 345(11): p. 790-7.
19. Vitolins, M.Z., et al., Action for Health in Diabetes (Look AHEAD) trial: baseline evaluation of selected nutrients and food group intake. J Am Diet Assoc, 2009. 109(8): p. 1367-75.
20. Krebs-Smith, S.M., et al., Americans do not meet federal dietary recommendations. The Journal of nutrition, 2010. 140(10): p. 1832-8.

180
21. Stengel, B., et al., Lifestyle factors, obesity and the risk of chronic kidney disease. Epidemiology, 2003. 14(4): p. 479-87.
22. He, F.J., et al., Effect of modest salt reduction on blood pressure, urinary albumin, and pulse wave velocity in white, black, and Asian mild hypertensives. Hypertension, 2009. 54(3): p. 482-8.
23. Pan, X.R., et al., Effects of diet and exercise in preventing NIDDM in people with impaired glucose tolerance. The Da Qing IGT and Diabetes Study. Diabetes Care, 1997. 20(4): p. 537-44.
24. Robinson, E.S., et al., Physical activity and albuminuria. Am J Epidemiol, 2010. 171(5): p. 515-21.
25. Bohm, M., et al., Association of heart rate with microalbuminuria in cardiovascular risk patients: data from I-SEARCH. J Hypertens, 2008. 26(1): p. 18-25.
26. Willi, C., et al., Active smoking and the risk of type 2 diabetes: a systematic review and meta-analysis. JAMA : the journal of the American Medical Association, 2007. 298(22): p. 2654-64.
27. Yeh, H.C., et al., Smoking, smoking cessation, and risk for type 2 diabetes mellitus: a cohort study. Ann Intern Med, 2010. 152(1): p. 10-7.
28. Guide to management of hypertension 2008. http://www.heartfoundation.org.au/SiteCollectionDocuments/A-TC-TobaccoPolicy.pdf, 2008.
29. Stratton, I.M., et al., Association of glycaemia with macrovascular and microvascular complications of type 2 diabetes (UKPDS 35): prospective observational study. BMJ, 2000. 321(7258): p. 405-12.
30. Frederiksen, C.A., et al., The blood pressure-induced diameter response of retinal arterioles decreases with increasing diabetic maculopathy. Graefes Arch Clin Exp Ophthalmol, 2006. 244(10): p. 1255-61.
31. Crawford, T.N., et al., Diabetic retinopathy and angiogenesis. Curr Diabetes Rev, 2009. 5(1): p. 8-13.
32. Chew, E.Y., et al., Effects of medical therapies on retinopathy progression in type 2 diabetes. N Engl J Med, 2010. 363(3): p. 233-44.
33. Tomlinson, D.R. and N.J. Gardiner, Glucose neurotoxicity. Nat Rev Neurosci, 2008. 9(1): p. 36-45.
34. Clearinghouse, N.D.I., Diabetic Neuropathies: The Nerve Damage of Diabetes. http://diabetes.niddk.nih.gov/dm/pubs/neuropathies/, 2009.
35. Thurau, K., Renal Hemodynamics. Am J Med, 1964. 36: p. 698-719. 36. Palmer, B.F., Impaired renal autoregulation: implications for the genesis of
hypertension and hypertension-induced renal injury. Am J Med Sci, 2001. 321(6): p. 388-400.
37. Christensen, P.K., Renal structure and function in type 2 diabetic patients with or without diabetic nephropathy. Dan Med Bull, 2004. 51(1): p. 82-103.
38. WHO, The International Classification of adult underweight, overweight and obesity according to BMI 2004.
39. Wang, Y., et al., Association between obesity and kidney disease: a systematic review and meta-analysis. Kidney Int, 2008. 73(1): p. 19-33.
40. Iglesias, P. and J.J. Diez, Adipose tissue in renal disease: clinical significance and prognostic implications. Nephrol Dial Transplant, 2010. 25(7): p. 2066-77.
41. Ross, W.R. and J.B. McGill, Epidemiology of obesity and chronic kidney disease. Adv Chronic Kidney Dis, 2006. 13(4): p. 325-35.

181
42. Hsu, C.Y., et al., Body mass index and risk for end-stage renal disease. Ann Intern Med, 2006. 144(1): p. 21-8.
43. Kramer, H., et al., Obesity and albuminuria among adults with type 2 diabetes: the Look AHEAD (Action for Health in Diabetes) Study. Diabetes Care, 2009. 32(5): p. 851-3.
44. Ritz, E., T. Kolgeganova, and G. Piecha, Is there an obesity-metabolic syndrome related glomerulopathy? Curr Opin Nephrol Hypertens, 2010.
45. de Jong, P.E., et al., Obesity and target organ damage: the kidney. Int J Obes Relat Metab Disord, 2002. 26 Suppl 4: p. S21-4.
46. Yajnik, C.S., et al., Urinary albumin excretion rate (AER) in newly-diagnosed type 2 Indian diabetic patients is associated with central obesity and hyperglycaemia. Diabetes Res Clin Pract, 1992. 17(1): p. 55-60.
47. Effect of intensive diabetes treatment on the development and progression of long-term complications in adolescents with insulin-dependent diabetes mellitus: Diabetes Control and Complications Trial. Diabetes Control and Complications Trial Research Group. J Pediatr, 1994. 125(2): p. 177-88.
48. UKPDS, Intensive blood-glucose control with sulphonylureas or insulin compared with conventional treatment and risk of complications in patients with type 2 diabetes (UKPDS 33). UK Prospective Diabetes Study (UKPDS) Group. Lancet, 1998. 352(9131): p. 837-53.
49. Holman, R.R., et al., 10-year follow-up of intensive glucose control in type 2 diabetes. The New England journal of medicine, 2008. 359(15): p. 1577-89.
50. Hanefeld, M., et al., Risk factors for myocardial infarction and death in newly detected NIDDM: the Diabetes Intervention Study, 11-year follow-up. Diabetologia, 1996. 39(12): p. 1577-83.
51. Glucose tolerance and cardiovascular mortality: comparison of fasting and 2-hour diagnostic criteria. Arch Intern Med, 2001. 161(3): p. 397-405.
52. Monnier, L. and C. Colette, Contributions of fasting and postprandial glucose to hemoglobin A1c. Endocr Pract, 2006. 12 Suppl 1: p. 42-6.
53. Bonora, E., et al., Plasma glucose levels throughout the day and HbA(1c) interrelationships in type 2 diabetes: implications for treatment and monitoring of metabolic control. Diabetes Care, 2001. 24(12): p. 2023-9.
54. Mogensen, C.E., Microalbuminuria and hypertension with focus on type 1 and type 2 diabetes. Journal of Internal Medicine, 2003. 254(1): p. 45-66.
55. Rossing, P., Diabetic nephropathy: worldwide epidemic and effects of current treatment on natural history. Curr Diab Rep, 2006. 6(6): p. 479-83.
56. Foley, R.N. and A.J. Collins, End-stage renal disease in the United States: an update from the United States Renal Data System. J Am Soc Nephrol, 2007. 18(10): p. 2644-8.
57. Foggensteiner, L., S. Mulroy, and J. Firth, Management of diabetic nephropathy. J R Soc Med, 2001. 94(5): p. 210-7.
58. Cherney, D.Z., J.W. Scholey, and J.A. Miller, Insights into the regulation of renal hemodynamic function in diabetic mellitus. Curr Diabetes Rev, 2008. 4(4): p. 280-90.
59. Praga, M., Obesity--a neglected culprit in renal disease. Nephrol Dial Transplant, 2002. 17(7): p. 1157-9.
60. Chagnac, A., et al., Obesity-induced glomerular hyperfiltration: its involvement in the pathogenesis of tubular sodium reabsorption. Nephrol Dial Transplant, 2008. 23(12): p. 3946-52.

182
61. Lastra, G., C. Manrique, and J.R. Sowers, Obesity, cardiometabolic syndrome, and chronic kidney disease: the weight of the evidence. Adv Chronic Kidney Dis, 2006. 13(4): p. 365-73.
62. Sharma, K., The link between obesity and albuminuria: adiponectin and podocyte dysfunction. Kidney Int, 2009. 76(2): p. 145-8.
63. WHO, Protein and amino acid requirements in human nutrition. World Health Organ Tech Rep Ser, 2007(935): p. 1-265, back cover.
64. To evaluate the available clinical evidence pertaining to the effect of protein-restricted diets on the progression of chronic kidney disease (CKD). [The National Guideline Clearinghouse™ (NGC), sponsored by the Agency for Healthcare Research and Quality (AHRQ), U.S. Department of Health and Human Services, provides the following expert resources to NGC. ] 2007.; Available from: http://www.guidelines.gov/summary/summary.aspx?ss=15&doc_id=11110&nbr=5861#s23.
65. Bantle, J.P., et al., Nutrition recommendations and interventions for diabetes: a position statement of the American Diabetes Association. Diabetes Care, 2008. 31 Suppl 1: p. S61-78.
66. Mann, J.I., Evidence-based nutrition recommendations for the treatment and prevention of type 2 diabetes and the metabolic syndrome. Food Nutr Bull, 2006. 27(2): p. 161-6.
67. Fulgoni, V.L., 3rd, Current protein intake in America: analysis of the National Health and Nutrition Examination Survey, 2003-2004. Am J Clin Nutr, 2008. 87(5): p. 1554S-1557S.
68. Mann, J.I., et al., Evidence-based nutritional approaches to the treatment and prevention of diabetes mellitus. Nutr Metab Cardiovasc Dis, 2004. 14(6): p. 373-94.
69. Layman, D.K., Dietary guidelines should reflect new understandings about adult protein needs. Nutr Metab (Lond), 2009. 6(1): p. 12.
70. National Health and Medical Research Council, D.o.H.a.A., Nutrient Reference Values for Australia and New Zealand Including Recommended Dietary Intakes http://www.nhmrc.gov.au/publications/synopses/_files/n35.pdf, 2006.
71. Morse, W.I. and J.S. Soeldner, The Non-Adipose Body Mass of Obese Women: Evidence of Increased Muscularity. Can Med Assoc J, 1964. 90: p. 723-5.
72. Wells, J.C., et al., Body composition in normal weight, overweight and obese children: matched case-control analyses of total and regional tissue masses, and body composition trends in relation to relative weight. Int J Obes (Lond), 2006. 30(10): p. 1506-13.
73. Campbell, W.W., et al., Dietary protein requirements of younger and older adults. Am J Clin Nutr, 2008. 88(5): p. 1322-9.
74. Westerterp-Plantenga MS, L.-M.N., Lejune M, Diepven K, Nieuwenhuizen A, Engelen M, Deutz N, Azzout-Maniche D, Tome D, Westerterp KR, Dietary protein, metabolism, and body-weight regulation: Dose--response effects. Int J Obes (Lond), 2006. 30: p. S16-23.
75. Brenner, B.M., Nephron adaptation to renal injury or ablation. Am J Physiol, 1985. 249(3 Pt 2): p. F324-37.
76. Hostetter, T.H., et al., Hyperfiltration in remnant nephrons: a potentially adverse response to renal ablation. Am J Physiol, 1981. 241(1): p. F85-93.

183
77. Pedrini, M.T., et al., The effect of dietary protein restriction on the progression of diabetic and nondiabetic renal diseases: a meta-analysis. Ann Intern Med, 1996. 124(7): p. 627-32.
78. Rosman, J.B., et al., Prospective randomised trial of early dietary protein restriction in chronic renal failure. Lancet, 1984. 2(8415): p. 1291-6.
79. Rosman, J.B. and P.M. ter Wee, Relationship between proteinuria and response to low protein diets early in chronic renal failure. Blood Purif, 1989. 7(1): p. 52-7.
80. Rosman, J.B., Dietary protein restriction in chronic renal failure: an update. Klin Wochenschr, 1989. 67(17): p. 882-8.
81. D'Amico, G., et al., Effect of dietary protein restriction on the progression of renal failure: a prospective randomized trial. Nephrol Dial Transplant, 1994. 9(11): p. 1590-4.
82. Locatelli, F., et al., Prospective, randomised, multicentre trial of effect of protein restriction on progression of chronic renal insufficiency. Northern Italian Cooperative Study Group. Lancet, 1991. 337(8753): p. 1299-304.
83. Ihle, B.U., et al., The effect of protein restriction on the progression of renal insufficiency. N Engl J Med, 1989. 321(26): p. 1773-7.
84. Williams, P.S., et al., Failure of dietary protein and phosphate restriction to retard the rate of progression of chronic renal failure: a prospective, randomized, controlled trial. Q J Med, 1991. 81(294): p. 837-55.
85. Klahr, S., et al., The effects of dietary protein restriction and blood-pressure control on the progression of chronic renal disease. Modification of Diet in Renal Disease Study Group. N Engl J Med, 1994. 330(13): p. 877-84.
86. King, A.J. and A.S. Levey, Dietary protein and renal function. J Am Soc Nephrol, 1993. 3(11): p. 1723-37.
87. Levey, A.S., et al., Effect of dietary protein restriction on the progression of kidney disease: long-term follow-up of the Modification of Diet in Renal Disease (MDRD) Study. Am J Kidney Dis, 2006. 48(6): p. 879-88.
88. Cianciaruso, B., et al., Metabolic effects of two low protein diets in chronic kidney disease stage 4-5--a randomized controlled trial. Nephrol Dial Transplant, 2008. 23(2): p. 636-44.
89. Cianciaruso, B., et al., Effect of a low- versus moderate-protein diet on progression of CKD: follow-up of a randomized controlled trial. Am J Kidney Dis, 2009. 54(6): p. 1052-61.
90. Jiang, N., et al., Better preservation of residual renal function in peritoneal dialysis patients treated with a low-protein diet supplemented with keto acids: a prospective, randomized trial. Nephrol Dial Transplant, 2009. 24(8): p. 2551-8.
91. Shemesh, O., et al., Limitations of creatinine as a filtration marker in glomerulopathic patients. Kidney Int, 1985. 28(5): p. 830-8.
92. Perrone, R.D., N.E. Madias, and A.S. Levey, Serum creatinine as an index of renal function: new insights into old concepts. Clin Chem, 1992. 38(10): p. 1933-53.
93. Levey, A.S., et al., Effects of dietary protein restriction on the progression of advanced renal disease in the Modification of Diet in Renal Disease Study. Am J Kidney Dis, 1996. 27(5): p. 652-63.
94. Menon, V., et al., Effect of a very low-protein diet on outcomes: long-term follow-up of the Modification of Diet in Renal Disease (MDRD) Study. Am J Kidney Dis, 2009. 53(2): p. 208-17.

184
95. Jungers, P., et al., Comparison of ketoacids and low protein diet on advanced chronic renal failure progression. Kidney Int Suppl, 1987. 22: p. S67-71.
96. Malvy, D., et al., Effects of severe protein restriction with ketoanalogues in advanced renal failure. J Am Coll Nutr, 1999. 18(5): p. 481-6.
97. Di Iorio, B.R., et al., Supplemented very low protein diet ameliorates responsiveness to erythropoietin in chronic renal failure. Kidney Int, 2003. 64(5): p. 1822-8.
98. Mircescu, G., et al., Effects of a supplemented hypoproteic diet in chronic kidney disease. J Ren Nutr, 2007. 17(3): p. 179-88.
99. Teplan, V., et al., Reduction of plasma asymmetric dimethylarginine in obese patients with chronic kidney disease after three years of a low-protein diet supplemented with keto-amino acids: a randomized controlled trial. Wien Klin Wochenschr, 2008. 120(15-16): p. 478-85.
100. KDOQI, Clinical Practice Guidelines for Chronic Kidney Disease: Evaluation, Classification, and Stratification http://www.kidney.org/professionals/KDOQI/guidelines_ckd/toc.htm, 2000.
101. Walker, J.D., et al., Restriction of dietary protein and progression of renal failure in diabetic nephropathy. Lancet, 1989. 2(8677): p. 1411-5.
102. Evanoff, G.V., et al., The effect of dietary protein restriction on the progression of diabetic nephropathy. A 12-month follow-up. Arch Intern Med, 1987. 147(3): p. 492-5.
103. Barsotti, G., et al., Dietary treatment of diabetic nephropathy with chronic renal failure. Nephrol Dial Transplant, 1998. 13 Suppl 8: p. 49-52.
104. Barsotti, G., et al., Nutritional treatment of renal failure in type 1 diabetic nephropathy. Clin Nephrol, 1988. 29(6): p. 280-7.
105. Brouhard, B.H. and L. LaGrone, Effect of dietary protein restriction on functional renal reserve in diabetic nephropathy. Am J Med, 1990. 89(4): p. 427-31.
106. Dullaart, R.P., et al., Long-term effects of protein-restricted diet on albuminuria and renal function in IDDM patients without clinical nephropathy and hypertension. Diabetes Care, 1993. 16(2): p. 483-92.
107. Hansen, H.P., et al., Effect of dietary protein restriction on prognosis in patients with diabetic nephropathy. Kidney Int, 2002. 62(1): p. 220-8.
108. Zeller, K., et al., Effect of restricting dietary protein on the progression of renal failure in patients with insulin-dependent diabetes mellitus. N Engl J Med, 1991. 324(2): p. 78-84.
109. Mogensen, C.E., Diabetic nephropathy: evidence for renoprotection and practice. Heart, 2000. 84 Suppl 1: p. i26-8:discussion i50.
110. Pijls, L.T.J., et al., The effect of protein restriction on albuminuria in patients with type 2 diabetes mellitus: A randomized trial. Nephrology Dialysis Transplantation, 1999. 14(6): p. 1445-1453.
111. Pijls, L.T., et al., Protein restriction, glomerular filtration rate and albuminuria in patients with type 2 diabetes mellitus: a randomized trial. Eur J Clin Nutr, 2002. 56(12): p. 1200-7.
112. Meloni, C., et al., Adequate protein dietary restriction in diabetic and nondiabetic patients with chronic renal failure. J Ren Nutr, 2004. 14(4): p. 208-13.
113. Meloni, C., et al., Severe dietary protein restriction in overt diabetic nephropathy: benefits or risks? J Ren Nutr, 2002. 12(2): p. 96-101.

185
114. Dussol, B., et al., A randomized trial of low-protein diet in type 1 and in type 2 diabetes mellitus patients with incipient and overt nephropathy. J Ren Nutr, 2005. 15(4): p. 398-406.
115. Koya, D., et al., Long-term effect of modification of dietary protein intake on the progression of diabetic nephropathy: a randomised controlled trial. Diabetologia, 2009. 52(10): p. 2037-45.
116. Facchini, F.S. and K.L. Saylor, A low-iron-available, polyphenol-enriched, carbohydrate-restricted diet to slow progression of diabetic nephropathy. Diabetes, 2003. 52(5): p. 1204-9.
117. Kasiske, B.L., et al., A meta-analysis of the effects of dietary protein restriction on the rate of decline in renal function. Am J Kidney Dis, 1998. 31(6): p. 954-61.
118. Robertson, L., N. Waugh, and A. Robertson, Protein restriction for diabetic renal disease. Cochrane Database Syst Rev, 2007(4): p. CD002181.
119. Pan, Y., L.L. Guo, and H.M. Jin, Low-protein diet for diabetic nephropathy: a meta-analysis of randomized controlled trials. Am J Clin Nutr, 2008. 88(3): p. 660-6.
120. Fouque, D. and M. Laville, Low protein diets for chronic kidney disease in non diabetic adults. Cochrane Database Syst Rev, 2009(3): p. CD001892.
121. Knight, E.L., et al., The impact of protein intake on renal function decline in women with normal renal function or mild renal insufficiency. Ann Intern Med, 2003. 138(6): p. 460-7.
122. Wrone, E.M., et al., Association of dietary protein intake and microalbuminuria in healthy adults: Third National Health and Nutrition Examination Survey. Am J Kidney Dis, 2003. 41(3): p. 580-7.
123. Halbesma, N., et al., High protein intake associates with cardiovascular events but not with loss of renal function. J Am Soc Nephrol, 2009. 20(8): p. 1797-804.
124. Huang, M.C., et al., Inadequate energy and excess protein intakes may be associated with worsening renal function in chronic kidney disease. J Ren Nutr, 2008. 18(2): p. 187-94.
125. Afshinnia, F., et al., Weight loss and proteinuria: systematic review of clinical trials and comparative cohorts. Nephrol Dial Transplant, 2010. 25(4): p. 1173-83.
126. Bello, A.K., et al., Impact of weight change on albuminuria in the general population. Nephrol Dial Transplant, 2007. 22(6): p. 1619-27.
127. Morales, E., et al., Beneficial effects of weight loss in overweight patients with chronic proteinuric nephropathies. Am J Kidney Dis, 2003. 41(2): p. 319-27.
128. Vasquez, B., et al., Sustained reduction of proteinuria in type 2 (non-insulin-dependent) diabetes following diet-induced reduction of hyperglycaemia. Diabetologia, 1984. 26(2): p. 127-33.
129. Solerte, S.B., et al., Effects of diet-therapy on urinary protein excretion albuminuria and renal haemodynamic function in obese diabetic patients with overt nephropathy. Int J Obes, 1989. 13(2): p. 203-11.
130. The Australian guide to healthy eating. 1998 [cited 2012 02-03-2012]; Available from: http://www.health.gov.au/internet/main/publishing.nsf/content/E384CFA588B74377CA256F190004059B/$File/fd-cons.pdf.
131. Astrup, A., et al., Low-fat diets and energy balance: how does the evidence stand in 2002? Proc Nutr Soc, 2002. 61(2): p. 299-309.
186
132. Raben, A., et al., [The CARMEN trial: increased intake of carbohydrates--simple or complex--and unchanged blood lipids in overweight subjects]. Ugeskr Laeger, 2002. 164(5): p. 627-31.
133. Astrup, A., Dietary approaches to reducing body weight. Baillieres Best Pract Res Clin Endocrinol Metab, 1999. 13(1): p. 109-20.
134. Clifton, P.M., Dietary treatment for obesity. Nat Clin Pract Gastroenterol Hepatol, 2008. 5(12): p. 672-81.
135. Lindstrom, J., et al., High-fibre, low-fat diet predicts long-term weight loss and decreased type 2 diabetes risk: the Finnish Diabetes Prevention Study. Diabetologia, 2006. 49(5): p. 912-20.
136. Knowler, W.C., et al., 10-year follow-up of diabetes incidence and weight loss in the Diabetes Prevention Program Outcomes Study. Lancet, 2009. 374(9702): p. 1677-86.
137. Skov, A.R., et al., Randomized trial on protein vs carbohydrate in ad libitum fat reduced diet for the treatment of obesity. Int J Obes Relat Metab Disord, 1999. 23(5): p. 528-36.
138. Noakes, M., et al., Effect of an energy-restricted, high-protein, low-fat diet relative to a conventional high-carbohydrate, low-fat diet on weight loss, body composition, nutritional status, and markers of cardiovascular health in obese women. Am J Clin Nutr, 2005. 81(6): p. 1298-306.
139. Parker, B., et al., Effect of a high-protein, high-monounsaturated fat weight loss diet on glycemic control and lipid levels in type 2 diabetes. Diabetes Care, 2002. 25(3): p. 425-30.
140. Baba, N.H., et al., High protein vs high carbohydrate hypoenergetic diet for the treatment of obese hyperinsulinemic subjects. Int J Obes Relat Metab Disord, 1999. 23(11): p. 1202-6.
141. Abete, I., et al., Effects of two energy-restricted diets differing in the carbohydrate/protein ratio on weight loss and oxidative changes of obese men. Int J Food Sci Nutr, 2009. 60 Suppl 3: p. 1-13.
142. Brinkworth, G.D., et al., Long-term effects of a very low-carbohydrate diet and a low-fat diet on mood and cognitive function. Arch Intern Med, 2009. 169(20): p. 1873-80.
143. Clifton, P.M., J.B. Keogh, and M. Noakes, Long-term effects of a high-protein weight-loss diet. Am J Clin Nutr, 2008. 87(1): p. 23-9.
144. Due, A., et al., The effect of diets high in protein or carbohydrate on inflammatory markers in overweight subjects. Diabetes Obes Metab, 2005. 7(3): p. 223-9.
145. Layman, D.K., et al., A reduced ratio of dietary carbohydrate to protein improves body composition and blood lipid profiles during weight loss in adult women. J Nutr, 2003. 133(2): p. 411-7.
146. Keogh, J.B., et al., Effects of weight loss from a very-low-carbohydrate diet on endothelial function and markers of cardiovascular disease risk in subjects with abdominal obesity. Am J Clin Nutr, 2008. 87(3): p. 567-76.
147. Luscombe-Marsh, N.D., et al., Carbohydrate-restricted diets high in either monounsaturated fat or protein are equally effective at promoting fat loss and improving blood lipids. Am J Clin Nutr, 2005. 81(4): p. 762-72.
148. Westerterp, K.R., Diet induced thermogenesis. Nutr Metab (Lond), 2004. 1(1): p. 5.
149. Krause's, ed. Food, nutrition, and diet therapy. 11 ed., ed. Y. Alexopoulos. 2004, Sounders, Elsevier: Philidelphia, USA.

187
150. Westerterp-Plantenga, M.S., et al., Dietary protein, weight loss, and weight maintenance. Annu Rev Nutr, 2009. 29: p. 21-41.
151. Tentolouris, N., et al., Diet-induced thermogenesis and substrate oxidation are not different between lean and obese women after two different isocaloric meals, one rich in protein and one rich in fat. Metabolism: clinical and experimental, 2008. 57(3): p. 313-20.
152. Halton, T.L. and F.B. Hu, The effects of high protein diets on thermogenesis, satiety and weight loss: a critical review. J Am Coll Nutr, 2004. 23(5): p. 373-85.
153. Weigle, D.S., et al., A high-protein diet induces sustained reductions in appetite, ad libitum caloric intake, and body weight despite compensatory changes in diurnal plasma leptin and ghrelin concentrations. Am J Clin Nutr, 2005. 82(1): p. 41-8.
154. Westerterp-Plantenga, M.S., Protein intake and energy balance. Regul Pept, 2008. 149(1-3): p. 67-9.
155. Bowen, J., M. Noakes, and P.M. Clifton, Appetite regulatory hormone responses to various dietary proteins differ by body mass index status despite similar reductions in ad libitum energy intake. J Clin Endocrinol Metab, 2006. 91(8): p. 2913-9.
156. Bowen, J., et al., Energy intake, ghrelin, and cholecystokinin after different carbohydrate and protein preloads in overweight men. J Clin Endocrinol Metab, 2006. 91(4): p. 1477-83.
157. Nieuwenhuizen, A.G., et al., Acute effects of breakfasts containing alpha-lactalbumin, or gelatin with or without added tryptophan, on hunger, 'satiety' hormones and amino acid profiles. Br J Nutr, 2009. 101(12): p. 1859-66.
158. Veldhorst, M.A., et al., A breakfast with alpha-lactalbumin, gelatin, or gelatin + TRP lowers energy intake at lunch compared with a breakfast with casein, soy, whey, or whey-GMP. Clin Nutr, 2009. 28(2): p. 147-55.
159. Veldhorst, M.A., et al., Effects of high and normal soyprotein breakfasts on satiety and subsequent energy intake, including amino acid and 'satiety' hormone responses. Eur J Nutr, 2009. 48(2): p. 92-100.
160. Veldhorst, M.A., et al., Comparison of the effects of a high- and normal-casein breakfast on satiety, 'satiety' hormones, plasma amino acids and subsequent energy intake. Br J Nutr, 2009. 101(2): p. 295-303.
161. Wren, A.M., et al., Ghrelin enhances appetite and increases food intake in humans. J Clin Endocrinol Metab, 2001. 86(12): p. 5992.
162. Tannous dit El Khoury, D., et al., Variations in postprandial ghrelin status following ingestion of high-carbohydrate, high-fat, and high-protein meals in males. Ann Nutr Metab, 2006. 50(3): p. 260-9.
163. Smeets, A.J., et al., Energy expenditure, satiety, and plasma ghrelin, glucagon-like peptide 1, and peptide tyrosine-tyrosine concentrations following a single high-protein lunch. J Nutr, 2008. 138(4): p. 698-702.
164. Blom, W.A., et al., Effect of a high-protein breakfast on the postprandial ghrelin response. Am J Clin Nutr, 2006. 83(2): p. 211-20.
165. Krieger, J.W., et al., Effects of variation in protein and carbohydrate intake on body mass and composition during energy restriction: a meta-regression 1. Am J Clin Nutr, 2006. 83(2): p. 260-74.
166. Farnsworth, E., et al., Effect of a high-protein, energy-restricted diet on body composition, glycemic control, and lipid concentrations in overweight and obese hyperinsulinemic men and women. Am J Clin Nutr, 2003. 78(1): p. 31-9.

188
167. Layman, D.K., et al., A moderate-protein diet produces sustained weight loss and long-term changes in body composition and blood lipids in obese adults. J Nutr, 2009. 139(3): p. 514-21.
168. Piatti, P.M., et al., Hypocaloric high-protein diet improves glucose oxidation and spares lean body mass: comparison to hypocaloric high-carbohydrate diet. Metabolism, 1994. 43(12): p. 1481-7.
169. Brehm, B.J., et al., A randomized trial comparing a very low carbohydrate diet and a calorie-restricted low fat diet on body weight and cardiovascular risk factors in healthy women. J Clin Endocrinol Metab, 2003. 88(4): p. 1617-23.
170. Dansinger, M.L., et al., Comparison of the Atkins, Ornish, Weight Watchers, and Zone diets for weight loss and heart disease risk reduction: a randomized trial. JAMA : the journal of the American Medical Association, 2005. 293(1): p. 43-53.
171. Foster, G.D., et al., A randomized trial of a low-carbohydrate diet for obesity. N Engl J Med, 2003. 348(21): p. 2082-90.
172. Samaha, F.F., et al., A low-carbohydrate as compared with a low-fat diet in severe obesity. N Engl J Med, 2003. 348(21): p. 2074-81.
173. Yancy, W.S., Jr., et al., A low-carbohydrate, ketogenic diet versus a low-fat diet to treat obesity and hyperlipidemia: a randomized, controlled trial. Ann Intern Med, 2004. 140(10): p. 769-77.
174. Nordmann, A.J., et al., Effects of low-carbohydrate vs low-fat diets on weight loss and cardiovascular risk factors: a meta-analysis of randomized controlled trials. Arch Intern Med, 2006. 166(3): p. 285-93.
175. McAuley, K.A., et al., Comparison of high-fat and high-protein diets with a high-carbohydrate diet in insulin-resistant obese women. Diabetologia, 2005. 48(1): p. 8-16.
176. Foster, G.D., et al., Weight and metabolic outcomes after 2 years on a low-carbohydrate versus low-fat diet: a randomized trial. Ann Intern Med, 2010. 153(3): p. 147-57.
177. Shai, I., et al., Weight loss with a low-carbohydrate, Mediterranean, or low-fat diet. The New England journal of medicine, 2008. 359(3): p. 229-41.
178. Due, A., et al., Effect of normal-fat diets, either medium or high in protein, on body weight in overweight subjects: a randomised 1-year trial. Int J Obes Relat Metab Disord, 2004. 28(10): p. 1283-90.
179. Morenga, L.T., et al., Effect of a relatively high-protein, high-fiber diet on body composition and metabolic risk factors in overweight women. Eur J Clin Nutr, 2010. 64(11): p. 1323-31.
180. Brinkworth, G.D., et al., Long-term effects of a high-protein, low-carbohydrate diet on weight control and cardiovascular risk markers in obese hyperinsulinemic subjects. Int J Obes Relat Metab Disord, 2004. 28(5): p. 661-70.
181. Heilbronn, L.K., M. Noakes, and P.M. Clifton, Effect of energy restriction, weight loss, and diet composition on plasma lipids and glucose in patients with type 2 diabetes. Diabetes Care, 1999. 22(6): p. 889-95.
182. Luscombe, N.D., et al., Effects of energy-restricted diets containing increased protein on weight loss, resting energy expenditure, and the thermic effect of feeding in type 2 diabetes. Diabetes Care, 2002. 25(4): p. 652-7.
183. Sargrad, K.R., et al., Effect of high protein vs high carbohydrate intake on insulin sensitivity, body weight, hemoglobin A1c, and blood pressure in patients with type 2 diabetes mellitus. J Am Diet Assoc, 2005. 105(4): p. 573-80.

189
184. Pearce, K.L., P.M. Clifton, and M. Noakes, Egg consumption as part of an energy-restricted high-protein diet improves blood lipid and blood glucose profiles in individuals with type 2 diabetes. Br J Nutr, 2010: p. 1-8.
185. Brinkworth, G.D., et al., Long-term effects of advice to consume a high-protein, low-fat diet, rather than a conventional weight-loss diet, in obese adults with type 2 diabetes: one-year follow-up of a randomised trial. Diabetologia, 2004. 47(10): p. 1677-86.
186. Wycherley, T.P., et al., A High Protein Diet With Resistance Exercise Training Improves Weight Loss And Body Composition In Overweight And Obese Patients With Type 2 Diabetes. Diabetes Care, 2010.
187. Larsen, T.M., et al., Diets with high or low protein content and glycemic index for weight-loss maintenance. N Engl J Med, 2010. 363(22): p. 2102-13.
188. Larsen, R.N., et al., The effect of high-protein, low-carbohydrate diets in the treatment of type 2 diabetes: a 12 month randomised controlled trial. Diabetologia, 2011. 54(4): p. 731-40.
189. Lasker, D.A., E.M. Evans, and D.K. Layman, Moderate carbohydrate, moderate protein weight loss diet reduces cardiovascular disease risk compared to high carbohydrate, low protein diet in obese adults: A randomized clinical trial. Nutr Metab (Lond), 2008. 5: p. 30.
190. Meckling, K.A., C. O'Sullivan, and D. Saari, Comparison of a low-fat diet to a low-carbohydrate diet on weight loss, body composition, and risk factors for diabetes and cardiovascular disease in free-living, overweight men and women. J Clin Endocrinol Metab, 2004. 89(6): p. 2717-23.
191. Appel, L.J., et al., Effects of protein, monounsaturated fat, and carbohydrate intake on blood pressure and serum lipids: results of the OmniHeart randomized trial. JAMA : the journal of the American Medical Association, 2005. 294(19): p. 2455-64.
192. Jenkins, D.J., et al., High-protein diets in hyperlipidemia: effect of wheat gluten on serum lipids, uric acid, and renal function. Am J Clin Nutr, 2001. 74(1): p. 57-63.
193. Jenkins, D.J., et al., The effect of a plant-based low-carbohydrate ("Eco-Atkins") diet on body weight and blood lipid concentrations in hyperlipidemic subjects. Archives of internal medicine, 2009. 169(11): p. 1046-54.
194. McAuley, K.A., et al., Long-term effects of popular dietary approaches on weight loss and features of insulin resistance. Int J Obes (Lond), 2006. 30(2): p. 342-9.
195. Gannon, M.C. and F.Q. Nuttall, Effect of a high-protein, low-carbohydrate diet on blood glucose control in people with type 2 diabetes. Diabetes, 2004. 53(9): p. 2375-82.
196. Gannon, M.C., et al., An increase in dietary protein improves the blood glucose response in persons with type 2 diabetes. Am J Clin Nutr, 2003. 78(4): p. 734-41.
197. Westman, E.C., et al., The effect of a low-carbohydrate, ketogenic diet versus a low-glycemic index diet on glycemic control in type 2 diabetes mellitus. Nutr Metab (Lond), 2008. 5: p. 36.
198. Ceriello, A., The emerging role of post-prandial hyperglycaemic spikes in the pathogenesis of diabetic complications. Diabet Med, 1998. 15(3): p. 188-93.
199. The effect of intensive treatment of diabetes on the development and progression of long-term complications in insulin-dependent diabetes mellitus. The Diabetes

190
Control and Complications Trial Research Group. N Engl J Med, 1993. 329(14): p. 977-86.
200. Bonora, E., Postprandial peaks as a risk factor for cardiovascular disease: epidemiological perspectives. Int J Clin Pract Suppl, 2002(129): p. 5-11.
201. Cavalot, F., et al., Postprandial blood glucose is a stronger predictor of cardiovascular events than fasting blood glucose in type 2 diabetes mellitus, particularly in women: lessons from the San Luigi Gonzaga Diabetes Study. J Clin Endocrinol Metab, 2006. 91(3): p. 813-9.
202. Gillen, L., Tapsell. L., Development of food groupings to guide dietary advice for people with diabetes. Nutr Diet 2006. 3: p. 36-47.
203. Pearce, K.L., et al., Effect of carbohydrate distribution on postprandial glucose peaks with the use of continuous glucose monitoring in type 2 diabetes. Am J Clin Nutr, 2008. 87(3): p. 638-44.
204. Powers, M.A., et al., Continuous glucose monitoring reveals different glycemic responses of moderate- vs high-carbohydrate lunch meals in people with type 2 diabetes. J Am Diet Assoc, 2010. 110(12): p. 1912-5.
205. Martin, W.F., L.E. Armstrong, and N.R. Rodriguez, Dietary protein intake and renal function. Nutr Metab (Lond), 2005. 2: p. 25.
206. Metges, C.C. and C.A. Barth, Metabolic consequences of a high dietary-protein intake in adulthood: assessment of the available evidence. J Nutr, 2000. 130(4): p. 886-9.
207. Brenner, B.M., T.W. Meyer, and T.H. Hostetter, Dietary protein intake and the progressive nature of kidney disease: the role of hemodynamically mediated glomerular injury in the pathogenesis of progressive glomerular sclerosis in aging, renal ablation, and intrinsic renal disease. N Engl J Med, 1982. 307(11): p. 652-9.
208. Friedman, A.N., High-protein diets: potential effects on the kidney in renal health and disease. Am J Kidney Dis, 2004. 44(6): p. 950-62.
209. Preis, S.R., et al., Dietary protein and risk of ischemic heart disease in middle-aged men. Am J Clin Nutr, 2010. 92(5): p. 1265-72.
210. Bernstein, A.M., et al., Major dietary protein sources and risk of coronary heart disease in women. Circulation, 2010. 122(9): p. 876-83.
211. Clark, M.K., et al., Weight, fat mass, and central distribution of fat increase when women use depot-medroxyprogesterone acetate for contraception. Int J Obes (Lond), 2005. 29(10): p. 1252-8.
212. Pan, A., et al., Red meat consumption and risk of type 2 diabetes: 3 cohorts of US adults and an updated meta-analysis. Am J Clin Nutr, 2011.
213. Samsom, M., et al., Diabetes mellitus and gastric emptying: questions and issues in clinical practice. Diabetes Metab Res Rev, 2009. 25(6): p. 502-14.
214. Gentilcore, D., et al., Effects of fat on gastric emptying of and the glycemic, insulin, and incretin responses to a carbohydrate meal in type 2 diabetes. J Clin Endocrinol Metab, 2006. 91(6): p. 2062-7.
215. Ma, J., et al., Effects of a protein preload on gastric emptying, glycemia, and gut hormones after a carbohydrate meal in diet-controlled type 2 diabetes. Diabetes Care, 2009. 32(9): p. 1600-2.
216. Astrup, A., Dietary management of obesity. JPEN J Parenter Enteral Nutr, 2008. 32(5): p. 575-7.
217. the Clinical Guidelines Task Force, I. (2005) Global Guideline for Type 2 Diabetes. http://www.idf.org/guidelines/type-2-diabetes.

191
218. Giles GG, I.P., Dietary Questionnaire for Epidemiological Studies (Version 2), Melbourne: The Cancer Council Victoria. 1996.
219. Hodge, A., et al., The Anti Cancer Council of Victoria FFQ: relative validity of nutrient intakes compared with weighed food records in young to middle-aged women in a study of iron supplementation. Aust N Z J Public Health, 2000. 24(6): p. 576-83.
220. Lewis J, M.G., and Hunt A., NUTTAB95 Nutrient data table for use in Australia, Canberra, Editor. 1995, Australian government publishing service.
221. Ferreira, I., et al., Central fat mass versus peripheral fat and lean mass: opposite (adverse versus favorable) associations with arterial stiffness? The Amsterdam Growth and Health Longitudinal Study. J Clin Endocrinol Metab, 2004. 89(6): p. 2632-9.
222. Snijder, M.B., et al., Trunk fat and leg fat have independent and opposite associations with fasting and postload glucose levels: the Hoorn study. Diabetes Care, 2004. 27(2): p. 372-7.
223. CARI, G., Use of estimated glomerular filtration rate to assess level of kidney function. http://www.cari.org.au/CKD_evaluation_function_list_published/Use_of_estimated_glomerular_filtration_rate_to_assess.pdf, 2005.
224. Harman-Boehm, I., Continuous glucose monitoring in type 2 diabetes. Diabetes Res Clin Pract, 2008. 82 Suppl 2: p. S118-21.
225. Boyne, M.S., et al., Timing of changes in interstitial and venous blood glucose measured with a continuous subcutaneous glucose sensor. Diabetes, 2003. 52(11): p. 2790-4.
226. Perri, F., M.R. Pastore, and V. Annese, 13C-octanoic acid breath test for measuring gastric emptying of solids. Eur Rev Med Pharmacol Sci, 2005. 9(5 Suppl 1): p. 3-8.
227. Lee, J.S., et al., Toward office-based measurement of gastric emptying in symptomatic diabetics using [13C]octanoic acid breath test. Am J Gastroenterol, 2000. 95(10): p. 2751-61.
228. Ghoos, Y.F., et al., Measurement of gastric emptying rate of solids by means of a carbon-labeled octanoic acid breath test. Gastroenterology, 1993. 104(6): p. 1640-7.
229. Symonds, E., Non-invasive assessment of gastrointestinal function using breath test technology : investigations in health and disease., in Dept. of Physiology. 2002, University of Adelaide: Adelaide. p. 182.
230. Rausch, J.R., S.E. Maxwell, and K. Kelley, Analytic methods for questions pertaining to a randomized pretest, posttest, follow-up design. J Clin Child Adolesc Psychol, 2003. 32(3): p. 467-86.
231. Wothke, W.A., JL. Full-information missing data analysis with Amos. 1996 [cited 2012 25-02-2012]; Available from: http://www.hearne.com.au/attachments/Full-information%20missing%20data%20analysis%20with%20Amos.pdf.
232. Mann, J.I., Nutrition recommendations for the treatment and prevention of type 2 diabetes and the metabolic syndrome: an evidenced-based review. Nutr Rev, 2006. 64(9): p. 422-7.
233. Hessov, I., Hvordan undersøges og kontrolleres næringsindtagelsen, in Klinisk Ernæring, I. Hessov, Editor. 2006, Munksgaard: Copenhagen. p. 59.
234. Levey, A.S., R.D. Perrone, and N.E. Madias, Serum creatinine and renal function. Annual review of medicine, 1988. 39: p. 465-90.

192
235. Johnson, D., The CARI guidelines. Evaluation of renal function. Nephrology (Carlton), 2005. 10 Suppl 4: p. S133-76.
236. Hojs, R., et al., Serum cystatin C as an endogenous marker of renal function in patients with mild to moderate impairment of kidney function. Nephrol Dial Transplant, 2006. 21(7): p. 1855-62.
237. Pucci, L., et al., Cystatin C and estimates of renal function: searching for a better measure of kidney function in diabetic patients. Clin Chem, 2007. 53(3): p. 480-8.
238. Waller, D.G., et al., Measurement of glomerular filtration rate with technetium-99m DTPA: comparison of plasma clearance techniques. J Nucl Med, 1987. 28(3): p. 372-7.
239. Gunasekera, R.D., D.J. Allison, and A.M. Peters, Glomerular filtration rate in relation to extracellular fluid volume: similarity between 99mTc-DTPA and inulin. Eur J Nucl Med, 1996. 23(1): p. 49-54.
240. Ribstein, J., G. du Cailar, and A. Mimran, Combined renal effects of overweight and hypertension. Hypertension, 1995. 26(4): p. 610-5.
241. Reisin, E., et al., Renal haemodynamic studies in obesity hypertension. J Hypertens, 1987. 5(4): p. 397-400.
242. Chagnac, A., et al., The effects of weight loss on renal function in patients with severe obesity. J Am Soc Nephrol, 2003. 14(6): p. 1480-6.
243. Ibrahim, H.N. and M.L. Weber, Weight loss: a neglected intervention in the management of chronic kidney disease. Curr Opin Nephrol Hypertens, 2010. 19(6): p. 534-8.
244. Clifton, P.M., K. Bastiaans, and J.B. Keogh, High protein diets decrease total and abdominal fat and improve CVD risk profile in overweight and obese men and women with elevated triacylglycerol. Nutr Metab Cardiovasc Dis, 2009. 19(8): p. 548-54.
245. Azuma, K., et al., Adipose tissue distribution in relation to insulin resistance in type 2 diabetes mellitus. Am J Physiol Endocrinol Metab, 2007. 293(1): p. E435-42.
246. Snijder, M.B., et al., Larger thigh and hip circumferences are associated with better glucose tolerance: the Hoorn study. Obes Res, 2003. 11(1): p. 104-11.
247. Bigaard, J., et al., Waist and hip circumferences and all-cause mortality: usefulness of the waist-to-hip ratio? Int J Obes Relat Metab Disord, 2004. 28(6): p. 741-7.
248. FNB, Dietary Reference Intakes for Energy, Carbohydrate, Fiber, Fat, Fatty Acids, Cholesterol, Protein, and Amino Acids (Macronutrients). 2005, National Academy of Sciences: Washington, D.C. 20001.
249. Tuomilehto, J., et al., Prevention of type 2 diabetes mellitus by changes in lifestyle among subjects with impaired glucose tolerance. N Engl J Med, 2001. 344(18): p. 1343-50.
250. KDOQI™Guidelines and Commentaries 2010; Available from:
http://www.kidney.org/professionals/kdoqi/guidelines_commentaries.cfm#guidelines.
251. Layman, D.K., et al., Protein in optimal health: heart disease and type 2 diabetes. Am J Clin Nutr, 2008. 87(5): p. 1571S-1575S.
252. Hession, M., et al., Systematic review of randomized controlled trials of low-carbohydrate vs. low-fat/low-calorie diets in the management of obesity and its comorbidities. Obes Rev, 2009. 10(1): p. 36-50.

193
253. Stamler, J., et al., Inverse relation of dietary protein markers with blood pressure. Findings for 10,020 men and women in the INTERSALT Study. INTERSALT Cooperative Research Group. INTERnational study of SALT and blood pressure. Circulation, 1996. 94(7): p. 1629-34.
254. Vithian, K. and S. Hurel, Microvascular complications: pathophysiology and management. Clin Med, 2010. 10(5): p. 505-9.
255. de Zeeuw, D., et al., Albuminuria, a therapeutic target for cardiovascular protection in type 2 diabetic patients with nephropathy. Circulation, 2004. 110(8): p. 921-7.
256. Gerstein, H.C., et al., Effects of intensive glucose lowering in type 2 diabetes. N Engl J Med, 2008. 358(24): p. 2545-59.
257. Shurraw, S., et al., Association Between Glycemic Control and Adverse Outcomes in People With Diabetes Mellitus and Chronic Kidney Disease: A Population-Based Cohort Study. Arch Intern Med, 2011. 171(21): p. 1920-1927.
258. Gerich, J.E., Postprandial hyperglycemia and cardiovascular disease. Endocr Pract, 2006. 12 Suppl 1: p. 47-51.
259. Fonseca, V., Clinical significance of targeting postprandial and fasting hyperglycemia in managing type 2 diabetes mellitus. Curr Med Res Opin, 2003. 19(7): p. 635-41.
260. Bell, D.S., Importance of postprandial glucose control. South Med J, 2001. 94(8): p. 804-9.
261. Zavalkoff, S.R. and C. Polychronakos, Evaluation of conventional blood glucose monitoring as an indicator of integrated glucose values using a continuous subcutaneous sensor. Diabetes Care, 2002. 25(9): p. 1603-6.
262. Trovati, M., et al., Blood glucose pre-prandial baseline decreases from morning to evening in type 2 diabetes: role of fasting blood glucose and influence on post-prandial excursions. Eur J Clin Invest, 2002. 32(3): p. 179-86.
263. Poulter, N.R., Blood pressure and glucose control in subjects with diabetes: new analyses from ADVANCE. J Hypertens Suppl, 2009. 27(1): p. S3-8.
264. O'Keefe, J.H. and D.S. Bell, Postprandial hyperglycemia/hyperlipidemia (postprandial dysmetabolism) is a cardiovascular risk factor. Am J Cardiol, 2007. 100(5): p. 899-904.
265. Jovanovic, A., J. Gerrard, and R. Taylor, The second-meal phenomenon in type 2 diabetes. Diabetes Care, 2009. 32(7): p. 1199-201.
266. Chen, M.J., A. Jovanovic, and R. Taylor, Utilizing the second-meal effect in type 2 diabetes: practical use of a soya-yogurt snack. Diabetes Care, 2010. 33(12): p. 2552-4.
267. Clark, C.A., et al., Effects of breakfast meal composition on second meal metabolic responses in adults with Type 2 diabetes mellitus. Eur J Clin Nutr, 2006. 60(9): p. 1122-9.
268. Nilsson, A.C., et al., Effect of cereal test breakfasts differing in glycemic index and content of indigestible carbohydrates on daylong glucose tolerance in healthy subjects. Am J Clin Nutr, 2008. 87(3): p. 645-54.
269. Stevenson, E., et al., The effect of the glycemic index of an evening meal on the metabolic responses to a standard high glycemic index breakfast and subsequent exercise in men. Int J Sport Nutr Exerc Metab, 2005. 15(3): p. 308-22.
270. Stevenson, E., et al., Influence of the glycaemic index of an evening meal on substrate oxidation following breakfast and during exercise the next day in healthy women. Eur J Clin Nutr, 2008. 62(5): p. 608-16.

194
271. Boden, G., X. Chen, and J.L. Urbain, Evidence for a circadian rhythm of insulin sensitivity in patients with NIDDM caused by cyclic changes in hepatic glucose production. Diabetes, 1996. 45(8): p. 1044-50.
272. Carroll, M.F. and D.S. Schade, The dawn phenomenon revisited: implications for diabetes therapy. Endocr Pract, 2005. 11(1): p. 55-64.
273. Scheen, A.J. and E. Van Cauter, The roles of time of day and sleep quality in modulating glucose regulation: clinical implications. Horm Res, 1998. 49(3-4): p. 191-201.
274. Jauslin, P.M., N. Frey, and M.O. Karlsson, Modeling of 24-hour glucose and insulin profiles of patients with type 2 diabetes. J Clin Pharmacol, 2011. 51(2): p. 153-64.
275. Boden, G., et al., Evidence for a circadian rhythm of insulin secretion. Am J Physiol, 1996. 271(2 Pt 1): p. E246-52.
276. Bavenholm, P.N., et al., Insulin sensitivity of suppression of endogenous glucose production is the single most important determinant of glucose tolerance. Diabetes, 2001. 50(6): p. 1449-54.
277. Skov, A.R., et al., Changes in renal function during weight loss induced by high vs low-protein low-fat diets in overweight subjects. Int J Obes Relat Metab Disord, 1999. 23(11): p. 1170-7.
278. Shen, W.W., et al., Obesity-related glomerulopathy: body mass index and proteinuria. Clinical journal of the American Society of Nephrology : CJASN, 2010. 5(8): p. 1401-9.
279. Praga, M., et al., Effects of body-weight loss and captopril treatment on proteinuria associated with obesity. Nephron Clin Pract, 1995. 70(1): p. 35-41.
280. Straznicky, N.E., et al., Exercise augments weight loss induced improvement in renal function in obese metabolic syndrome individuals. Journal of hypertension, 2011. 29(3): p. 553-64.
281. Hodgson, J.M., et al., Partial substitution of carbohydrate intake with protein intake from lean red meat lowers blood pressure in hypertensive persons. The American journal of clinical nutrition, 2006. 83(4): p. 780-7.
282. Delbridge, E.A., et al., One-year weight maintenance after significant weight loss in healthy overweight and obese subjects: does diet composition matter? Am J Clin Nutr, 2009. 90(5): p. 1203-14.
283. Te Morenga, L.A., et al., Comparison of high protein and high fiber weight-loss diets in women with risk factors for the metabolic syndrome: a randomized trial. Nutrition journal, 2011. 10: p. 40.
284. Layman, D.K., et al., Increased dietary protein modifies glucose and insulin homeostasis in adult women during weight loss. J Nutr, 2003. 133(2): p. 405-10.
285. Nuttall, F.Q., M.C. Gannon, and K. Jordan, The metabolic response to ingestion of proline with and without glucose. Metabolism, 2004. 53(2): p. 241-6.
286. Clifton, P.M. and J. Keogh, Metabolic effects of high-protein diets. Curr Atheroscler Rep, 2007. 9(6): p. 472-8.
287. Rasmussen, B.M., et al., Effects of dietary saturated, monounsaturated, and n-3 fatty acids on blood pressure in healthy subjects. The American journal of clinical nutrition, 2006. 83(2): p. 221-6.
288. Neuhouser, M.L., et al., Use of recovery biomarkers to calibrate nutrient consumption self-reports in the Women's Health Initiative. Am J Epidemiol, 2008. 167(10): p. 1247-59.
289. Heitmann, B.L. and L. Lissner, Dietary underreporting by obese individuals--is it specific or non-specific? BMJ, 1995. 311(7011): p. 986-9.

195
290. Brownbill, R.A. and J.Z. Ilich, Measuring body composition in overweight individuals by dual energy x-ray absorptiometry. BMC Med Imaging, 2005. 5(1): p. 1.


197
Appendices


199 A
ppen
dix
1: T
able
s of
low
pro
tein
die
ts
Tabl
e 1;
Out
com
e of
pro
spec
tive
LPD
stu
dies
in n
on-d
iabe
tic p
atie
nts
Stud
y (y
ear)
M
o1 Su
bjec
t (n
o) 2
Bas
elin
e G
FR3
ml/m
in/1
.73
m2
Bas
elin
e S -
Cr 8
(µm
ol/L
)
Con
trol
die
t (U
PD)4
(ach
ieve
d in
take
g/
kg/d
ay)
Prot
ein
rest
rictio
n (L
PD)5
(ach
ieve
d in
take
g/
kg/d
ay)
Endp
oint
Con
trol
Fo
llow
-up
befo
re
Con
trol
Fo
llow
-up
afte
r
LPD
Fo
llow
-up
Bef
ore
LPD
Fo
llow
-up
afte
r
Com
men
t
Ros
man
et
al (1
984)
R
CT
18
149
(228
) C
rCl7
ml/m
in/1
.73
m²
31-6
0 (B
) 10
-30
(C)
N
A
(Com
plia
nce
mea
sure
d by
U
rine
urea
)
0.6
0,
4
seru
m
crea
tinin
e (1
/Cr/M
o)
Ren
al s
urvi
val
Pro
gres
sion
re
nal
insu
ffici
ency
de
crea
sed
by
a fa
ctor
5 in
B
and
a fa
ctor
3
in A
com
pare
d to
con
trol
Non
-sur
viva
l =
pers
iste
nt 1
0%
incr
ease
in
seru
m
crea
tinin
e
P n
ot
test
ed
P=0
.01
Ihle
et a
l (1
989)
R
CT
18
64 (7
2)
51C
r-E
DTA
-C
l LP
D
0,23
±0.0
4 U
PD
0,
25±0
.03
350 -
1000
≥0.7
5 (C
ompl
ianc
e m
easu
red
by
Urin
e ur
ea)
0.4
51C
r-ED
TA-C
l (m
l/sec
) S
- Cr (
µmol
/L)
ES
RD
0,25
±0.0
3
610±
180
0,10
±0.0
5 (P
<0.0
1)
930±
250
(+52
%)
27%
0.23
±0.0
4
680±
270
0.20
±0.0
5 (N
S)
79
0±21
0 (+
16%
) 6%
mea
n (S
EM
) P
<0.0
2
P=0
.05

200 Out
com
e of
pro
spec
tive
LPD
stu
dies
in n
on-d
iabe
tic p
atie
nts
cont
inue
d
Stud
y (y
ear)
M
o1 Su
bjec
t (n
o) 2
Bas
elin
e G
FR3
ml/m
in/1
.73
m2
Bas
elin
e S-
Cr 8
(µm
ol/L
)
Con
trol
die
t (U
PD)4
(ach
ieve
d in
take
g/
kg/d
ay)
Prot
ein
rest
rictio
n (L
PD)5
(ach
ieve
d in
take
g/
kg/d
ay)
Endp
oint
Con
trol
Fo
llow
-up
befo
re
Con
trol
Fo
llow
-up
afte
r
LPD
Fo
llow
-up
Bef
ore
LPD
Fo
llow
-up
afte
r
Com
men
t
MD
RD
(1
994)
R
CT
2,2
Y
Stu
dy 1
n=
585
S
tudy
2
n=25
5
125 I-
ioth
alam
ate
Cle
aran
ce
ml/m
in/1
.73
m²
25-5
5
13-2
4
ml/m
in/1
.73
m²
(C
ompl
ianc
e m
easu
red
by
Urin
e ur
ea)
1.3
0.
58
0.58
0.
28
Dec
line
in
GFR
0-4
mon
ths
ml/m
in/4
m
onth
s -1
.8 (1
.1-2
.6)
4 -12
mon
ths
ml/m
in/y
ear
-3.9
(3.3
-4.4
) 12
-36
mon
ths
ml/m
in/3
ye
ars
-12.
1
(10.
5-13
.8)
0-
4 m
onth
s m
l/min
/4
mon
ths
-3.4
(2.7
-4.2
)
4 -12
mon
ths
ml/m
in/y
ear
-2.8
(2.2
-3.4
) 12
-36
mon
ths
ml/m
in/3
yea
rs
-10.
9
(9.2
-12.
5)
Initi
al ra
pid
decl
ine
in
LPD
the
first
4
mon
ths
From
4-1
2 m
onth
s th
e de
clin
e in
G
FR w
as
slow
er in
LP
D (N
S)
At t
he e
nd
of fo
llow
up
the
diffe
renc
e in
GFR
be
twee
n gr
oups
w
as N
S.
1 Mo=
mon
ths,
2 no=t
otal
num
ber o
f sub
ject
s el
igib
le, 3
GFR
= gl
omer
ular
filtr
atio
n ra
te, 4 U
PD=
usua
l pro
tein
die
t, 5 LP
D =
Low
pro
tein
die
t, 6 LP
h=Lo
w P
hosp
horo
us d
iet,
7 CrC
l= C
reat
inin
e C
lear
ance
, 8 S-C
r = S
erum
Cre
atin
ine.

201 Ta
ble
2; N
on ra
ndom
ized
and
rand
omiz
ed tr
ials
incl
udin
g ty
pe 1
dia
betic
pat
ient
s
Stud
y (y
ear)
D
urat
ion
(Mo)
1 Su
bjec
t (no
) 2 M
ean
GFR
3 B
asel
ine
UA
ER3 o
r U
PER
4 B
asel
ine
Con
trol
die
t (U
PD)5
(ach
ieve
d in
take
g/
kg/d
ay)
Prot
ein
rest
rictio
n (L
PD)6
(ach
ieve
d in
take
g/
kg/d
ay)
Endp
oint
Con
trol
Fo
llow
-up
be
fore
Con
trol
Fo
llow
-up
afte
r
LPD
Fo
llow
-up
befo
re
LPD
Fo
llow
-up
afte
r
Com
men
ts
Eva
loff
et a
l (1
987)
U
PD
fo
llow
ed b
y LP
D
Non
ra
ndom
ized
in
terv
entio
n
12
8 C
rCl
(ml/m
in)
55±2
7
UP
ER
21
05±1
355
mg/
24h
80 g
/d
40 g
/d (0
.6
g/kg
/d)
(Com
plia
nce
mea
sure
d by
di
et re
call)
CrC
l U
PE
R
55±2
7 m
l/min
21
05±1
355
mg/
d
56±2
6 m
l/min
14
7±16
4 m
g/d
(NS
) M
ean
(SE
M)
(p<0
.001
)
Bar
sotti
et a
l (1
988)
U
PD
fo
llow
ed b
y LP
D
Non
ra
ndom
ized
in
terv
entio
n
15.9
U
PD
17
.4
LPD
8
CrC
l (m
l/min
) 19
.2 ±
13.4
UP
ER
57
00±1
.9
mg/
24h
1.2-
1.4
0.25
-0.3
5 b
0.5 -
0.6
b +
whe
at fl
our
(Com
plia
nce
mea
sure
d by
U
rine
urea
)
UP
ER
m
g/24
h R
ate
of
decl
ine
GFR
m
l/min
/Mo
-1
.38±
0.27
5.7±
1.9
3.07
±0.6
-0
.03±
0.37
Mea
n±S
D
(P=0
.001
) M
ean±
SD
(P
=0.0
01)
Wal
ker e
t al
(198
9)
UP
D
follo
wed
by
LPD
N
on-
rand
omiz
ed
inte
rven
tion
29 U
PD
33
LP
D
19
51C
r-E
DTA
C
l m
l/min
/1.7
3m2
23-1
25
UA
ER
≥
300
m
g/24
h
1.13
40
g/d
(0.6
7 g/
kg/d
) (C
ompl
ianc
e m
easu
red
by
Urin
e ur
ea)
UA
ER
m
g/24
h R
ate
of
decl
ine
51C
r-E
DTA
G
FR
ml/m
in/1
.73m
2
-0
.61±
0.14
467
(2
34-8
95)
340
(1
38-7
19)
-0.1
4±0.
08
95%
CI
(P=0
.01)
M
ean
(SE
M)
(P
=0.0
01)

202 Non
rand
omiz
ed a
nd ra
ndom
ized
tria
ls in
clud
ing
type
1 d
iabe
tic p
atie
nts
cont
inue
d
Stud
y (y
ear)
D
urat
ion
(Mo)
1 Su
bjec
t (no
) 2 M
ean
GFR
3 B
asel
ine
UA
ER3 o
r U
PER
4 B
asel
ine
Con
trol
die
t (U
PD)5
(ach
ieve
d in
take
g/
kg/d
ay)
Prot
ein
rest
rictio
n (L
PD)6
(ach
ieve
d in
take
g/
kg/d
ay)
Endp
oint
Con
tro
l Follo
w-
up
befo
re
Con
trol
Fo
llow
-up
afte
r
LPD
Fo
llow
-up
befo
re
LPD
Fo
llow
-up
afte
r
Com
men
ts
Bar
sotti
et a
l (1
998)
N
on-
rand
omiz
ed
3.7
y 32
(2
2 T1
DM
+10
T2
DM
)
1.
5-9
g/24
h Fr
ee d
iet
A 0
.3 b
B 0
.7 b
CrC
l (m
l/min
)
-0.9
±0.6
(m
l/min
/Mo
)
-0
.22±
0.21
(m
l/min
/Mo
)
P=0
.001
D
iffer
ence
be
twee
n di
ets
Bro
uhar
d et
al
(199
0)
RC
T
12
15
Inul
in C
l m
l/min
/1.7
3m2
UP
D 8
9 ±2
4 LP
D 7
2 ±4
0
UA
ER
≥3
0 μg
/min
1.
0
0.6
(Com
plia
nce
mea
sure
d by
U
rine
urea
)
Rat
e of
de
clin
e G
FR
Inul
in C
l m
l/min
/1.7
3m
2/M
o
-0
.68±
0.4
-0
.28±
0.15
M
ean±
SD
(P
<0.0
5)
Zelle
r et a
l (1
991)
R
CT
35
Ioth
alam
ate
Cl.
ml/s
ec/1
.73m
2 U
PD
0.
813±
0.11
8
LPD
0.
772±
0.08
UP
ER
m
g/24
h U
PD
42
66±7
15
LPD
31
44±4
17
≥1.0
(1
.08±
0.10
) (Id
eal b
ody
wei
ght)
0.6
(0.7
2±0.
06)
(Idea
l bod
y w
eigh
t) Lo
w
phos
phor
ous
(Com
plia
nce
mea
sure
d by
U
rine
urea
)
UP
ER
m
g/24
h R
ate
of
decl
ine
GFR
Io
thal
amat
e C
l. m
l/sec
/1.7
3m
2
+1
024
- 0.01
77±0
.005
3
-1
96
- 0.00
42±0
.001
5
No
men
tioni
ng
of
sign
ifica
nce
M
ean
(SE
M)
(P<0
.03)

203 N
on ra
ndom
ized
and
rand
omiz
ed tr
ials
incl
udin
g ty
pe 1
dia
betic
pat
ient
s co
ntin
ued
Stud
y (y
ear)
D
urat
ion
(Mo)
1 Su
bjec
t (no
) 2 M
ean
GFR
3 B
asel
ine
UA
ER3 o
r U
PER
4 B
asel
ine
Con
trol
die
t (U
PD)5
(ach
ieve
d in
take
g/
kg/d
ay)
Prot
ein
rest
rictio
n (L
PD)6
(ach
ieve
d in
take
g/
kg/d
ay)
Endp
oint
Con
trol
Fo
llow
-up
be
fore
Con
trol
Fo
llow
-up
afte
r
LPD
Fo
llow
-up
befo
re
LPD
Fo
llow
-up
afte
r
Com
men
ts
Dul
laar
t et a
l (1
993)
R
CT
24
30
Ioth
alam
ate
Cl.
ml/m
in/1
.73m
2 ≥9
0
UA
ER
10
-200
g/
min
UP
D
(1.0
9±0.
21)
0.6
(0.7
9±0.
16)
(Com
plia
nce
mea
sure
d by
U
rine
urea
)
UA
ER
µg
/min
G
FR
ml/m
in/1
.73m
2 E
RP
F8
122±
26
520±
149
-5%
11
2±21
* p=
0.05
49
6±13
2
131±
34
537±
150
-26%
11
3±24
# p=
0.00
1
482±
95
Δ g
roup
(p
=0.0
5)
mea
n±S
D
(NS
)
Han
sen
et a
l (2
002)
R
CT
4 Y
(1
-11)
82
51
Cr-
ED
TA
Cl
ml/m
in/1
.73m
2
UP
D 6
7 ±3
2 LP
D 6
9 ±3
0
UA
ER
m
g/24
h U
PD
737
±1
.2
LPD
681
±1
.2
UP
D (1
.02)
0.
6 (0
.89)
(C
ompl
ianc
e m
easu
red
by
Urin
e ur
ea)
Rat
e of
de
clin
e G
FR
ml/m
in/1
.73m
2 A
lbum
inur
ia E
SR
D/d
eat
h
737±
1.2
-3.9
(2
.7-5
.2)
614
(389
-969
) -2
7%
681±
1.2
-3.8
(2
.8-4
.8)
542
(382
-769
) -1
0%
(NS
) (N
S)
Log
rank
test
(P
=0.0
42)
1 Mo=
mon
ths,
2 no=t
otal
num
ber o
f sub
ject
s, 3G
FR=
glom
erul
ar fi
ltrat
ion
rate
, 4 UA
ER
= ur
ine
albu
min
exc
retio
n ra
te, 5 U
PE
R=
Urin
ary
prot
ein
excr
etio
n ra
te, C
rCl=
Cre
atin
ine
Cle
aran
ce. 6 U
PD
= us
ual p
rote
in d
iet,
7 LPD
= L
ow p
rote
in d
iet,
b All
vege
taria
n fo
od, 8 E
RP
F= E
stim
ated
rena
l
plas
ma
flow

204 Tabl
e 3;
Stu
dies
repo
rting
on
LPD
in T
2DM
St
udy
(yea
r)
Dur
atio
n (M
o)1
Subj
ect (
no) 2
Mea
n 3 G
FR
(ml/m
in/1
.73
m2 )
Alb
umin
uria
(m
g/24
h)
Con
trol
die
t (U
PD)4
(ach
ieve
d in
take
g/
kg/d
ay)
Prot
ein
rest
rictio
n (L
PD)5
(ach
ieve
d in
take
g/
kg/d
ay)
Endp
oint
Con
trol
Fo
llow
-up
chan
ge
LPD
Fo
llow
-up
chan
ge
Com
men
ts
Pijl
s et
al
(199
9)
RC
T
12
T 2
= 12
1 83
20
-300
U
PD
(1.1
5±0.
30)
0.
8 (1
.12±
0.23
) 6 U
AE
R (m
g/24
h)
7 CrC
l (m
l/min
/1.7
3m2 )
+ 4
(-23
,44)
-1
.5±1
4
-8
(-35
,19)
-2
.8±1
6
(NS
) (N
S)
Pijl
s et
al
(200
2)
RC
T
28
T 2
= 13
1 8
3 20
-300
U
PD
(1.1
4±0.
18)
0.
8 (1
.10±
0.24
) U
AE
R (m
g/24
h)
CrC
l (m
l/min
/1.7
3m2 )
+0.1
(-
2.5,
6.1)
-6
.4 ±
14
+1.2
(-
0.8,
10.8
) -4
.8±1
2
(NS
) (N
S)
Mel
oni e
t al
(200
2)
RC
T
12
T 1
= 32
T
2 =
37
45.0
±5.1
>40
Hyp
erte
nsio
n
UP
D =
Fre
e di
et
(1.3
9)
0.6
(0.6
8)
Pro
tein
uria
(g
/24h
) Is
otop
e G
FR
-0.2
-6
.26±
1.84
-1.1
-6
.15±
1.61
(NS
) re
gard
less
of
diab
etes
type
(N
S)
Mel
oni e
t al
(200
4)
RC
T
12
T 1
= 24
T
2 =
56
46.8
±5.8
>3
0 H
yper
tens
ion
UP
D =
Fre
e di
et
(1.3
9)
LPD
0.8
(0.8
6)
Isot
ope
GFR
-6.0
3±1.
3 -5
.78±
1.5
(NS
)
Dus
sol e
t al
(200
5)
RC
T
24
T 1
= 10
T
2 =
37
>80
>30
>300
1.
2 (1
.03±
0.15
)
0.8
(1.1
0±0.
02)
M
icro
- al
bum
inur
ia
Isot
ope
GFR
+156
±486
-7
±11
+114
±364
-5
±15
(NS
) (N
S)
1 M=m
onth
s, 2 no
=tot
al n
umbe
r of s
ubje
cts,
3G
FR=
glom
erul
ar fi
ltrat
ion
rate
, 4 UP
D=
usua
l pro
tein
die
t, 5 LP
D =
Low
pro
tein
die
t, a a
naly
zed
excl
udin
g th
e fir
st 6
mon
ths,
b All
vege
taria
n fo
od, 6 U
AE
R=
urin
e al
bum
in e
xcre
tion
rate
, 7 CrC
L= C
reat
inin
e C
lear
ance
.

205 Ta
ble
4; S
tudi
es re
porti
ng a
pos
itive
effe
ct o
f HP
D o
n w
eigh
t los
s an
d bo
dy c
ompo
sitio
n
Auth
or
Type
of d
iet
Mea
sure
men
ts
Hig
her p
rote
in
Hig
her C
HO
P
Skov
et a
l 199
9 [1
37]
RC
T
65 o
verw
eigh
t to
obes
e
HC
H (C
HO
58%
TE)
HP
D (P
25%
TE)
Ad li
bitu
m e
nerg
y in
take
6 M
o in
terv
entio
n
BW (k
g)
FM (k
g)
AFM
(cm
2 ) W
L>10
kg
FFA
(µm
ol/l)
T-
chol
, MEA
N (S
EM
), H
DL
HPD
-8
.7
-7.6
-3
3.0
35%
-3
0%
HC
D/L
FD
-5.0
-4
.3
-16.
8 9%
-
P<0
.01
P<0
.01
P<0
.01
P<0
.05
P<0
.05
ns
Due
et a
l 200
4 [1
78]
RC
T
50 O
verw
eigh
t to
obes
e
Follo
w u
p st
udy
of th
e 6
Mo
inte
rven
tion
stud
y [1
37].
At 1
2 M
o an
d 24
Mo
HC
H (C
HO
58%
TE)
HP
D (P
25%
TE)
Ad li
bitu
m e
nerg
y in
take
12 a
nd 2
4 M
o
6 M
o fo
llow
up
BW
(kg)
FM
(kg)
B
MI (
kg/m
2 ) A
FM (c
m2 )
WC
ir (c
m)
W/H
12
Mo
follo
w u
p
BW (k
g)
FM (k
g)
BM
I (kg
/m2 )
AFM
(cm
2 ) W
Cir
(cm
) W
/H
Infla
mm
ator
y m
arke
rs &
lipi
ds
HPD
-9
.4
-7.6
-3
.3
-34.
9 -9
.9
-0.0
4 -6
.2
-4.6
-2
.2
-22.
0 -8
.4
-0.0
4
HC
D/L
FD
-5.9
-4
.3
-2.1
-1
8.3
-4.2
-0
.0
-4.3
-3
.1
-1.2
-1
0.5
-1.8
+0
.01
P<0
.01
P<0
.01
P<0
.01
P<0
.01
P<0
.01
P<0
.01
ns
ns
ns
ns
p<0.
01
p<0.
01
ns

206 Tabl
e of
stu
dies
repo
rting
a p
ositi
ve e
ffect
of H
PD
on
wei
ght l
oss
and
body
com
posi
tion
(con
tinue
d).
Auth
or
Type
of d
iet
Mea
sure
men
ts
Hig
her p
rote
in
Hig
her C
HO
P
Fost
er e
t al 2
003
[171
] R
CT
63 O
bese
R
esul
ts in
inte
nsio
n to
trea
t an
alys
is
LCD
(CH
O 2
0 g
) (At
kins
) R
CD
/HC
D/L
FD (6
0,15
,25
%TE
) In
clud
ing
T2D
M
Ener
gy re
stric
ted:
5-
7 M
J 1
year
Lo
w d
rop-
out r
ate
BW (k
g)
3M
o 6M
o 12
Mo
T-C
hol (
mg/
dl)
3Mo
6Mo
12M
o
TAG
(mg/
dl)
3Mo
6Mo
12M
o
LDL
(mg/
dl)
3Mo
6Mo
12M
o
HD
L (m
g/dl
) 3M
o 6M
o 12
Mo
LCD
/HP
D/H
FD
-6.8
±5.0
-7
.0±6
.5
-4.4
±6.7
+1
.7±1
5.0
2.
4±9.
3
0.1±
9.8
-1
8.7±
25.7
15
.0±2
9.4
-1
7.0±
23.0
5.
4±19
.2
2.7±
12.8
0.
31±1
6.6
9.
6±19
.1
14.7
±20.
5
HC
D/L
FD
-2.7
±3.7
-3
.2±5
.6
-2.5
±6.3
-5
.4±1
0.1
-2
.4±9
.5
-2.9
±8.0
1.
1±34
.6
-7.6
±19.
3
0.7±
37.7
-7
.4±1
6.6
-1
.5±1
5.8
-1
.6±1
1.1
1.
4±16
.1
2.5±
12.0
P<0
.01
P=0
.02
ns
P=0
.03
P=0
.06
P=0
.27
P=0
.01
P=0
.13
P<0
.04
P<0
.01
P=0
.34
P=0
.04
P=0
.04
P<0
.01

207 Ta
ble
of s
tudi
es re
porti
ng a
pos
itive
effe
ct o
f HP
D o
n w
eigh
t los
s an
d bo
dy c
ompo
sitio
n (c
ontin
ued)
. Au
thor
Ty
pe o
f die
t M
easu
rem
ents
H
ighe
r pro
tein
H
ighe
r CH
O
P Fo
ster
et a
l 201
0 [1
76]
RC
T 30
7 ob
ese
Low
CH
O
(20g
/d fo
r 6 M
o th
en in
crea
sing
by
5g/d
) Lo
w fa
t En
ergy
rest
ricte
d (5
-7 M
J)
6 M
O in
terv
entio
n an
d 2
year
s fo
llow
up
12 M
o
BW, F
M, L
BM
(kg)
M
EA
N (S
EM
) (m
g/dl
) V
LDL
(mg/
dl)
LDL
(mg/
dl)
HD
L(m
g/dl
) T-
Cho
l (m
g/dl
) 24
Mo
BW
, FM
, LB
M (k
g)
ME
AN
(SE
M) (
mg/
dl)
VLD
L (m
g/dl
) LD
L (m
g/dl
) H
DL(
mg/
dl)
T-C
hol (
mg/
dl)
Low
CH
O
-17.
9 -3
.6
-8.7
+3
.9
-0.6
-1
4.6
-2.2
-8
.0
+4.6
-0
.6
HC
D/L
FD
-31.
5 -8
.2
-8.6
+8
.0
-0.9
-1
2-2
-2.2
-4
.8
+7.8
-0
.7
ns
P=0
.04
P<0
.01
ns
P<0
.01
P<0
.02
ns
ns
ns
ns
p<0.
01
ns
Sam
aha
et a
l 200
3 [1
72]
RC
T 64
sev
erel
y ob
ese
68 s
ever
ely
obes
e 39
% T
2DM
43
% M
etS
LCD
(C
HO
<30
g/d)
(A
tkin
s)
RC
D/L
FD
Ener
gy re
stric
ted:
(-50
0Kca
l/d)
(F ≤
30%
TE)
26 w
eeks
BW (k
g)
WL≥
10%
(%)
TAG
(%)
T-ch
ol
HD
L LD
L FB
G (%
) In
sulin
sen
sitiv
ity (%
) BP
H
igh
drop
out r
ate
LCD
-5
.8±8
.6
14
-20±
43
-9±1
9 6±
9
HC
D/L
FD
-1.9
±4.2
3 -4
±31
-2±1
7 -3
±8
Mea
n±SD
P
<0.0
1 P
=0.0
2 P
<0.0
1 ns
ns
ns
p=
0.02
(T
2DM
) p=
0.01
(T
2DM
)

208 Tabl
e of
stu
dies
repo
rting
a p
ositi
ve e
ffect
of H
PD
on
wei
ght l
oss
and
body
com
posi
tion
(con
tinue
d).
Auth
or
Type
of d
iet
Mea
sure
men
ts
Hig
her p
rote
in
Hig
her C
HO
P
Bre
hm e
t al 2
003
[169
]
RC
T
53 o
bese
wom
en
LCD
(Atk
ins)
Ad li
bitu
m
(CH
O ≤
20g/
d)
RC
D/L
FD
Ene
rgy
rest
ricte
d: (-
450K
cal/d
)
(F ≤
30%
TE)
26 w
eeks
BW (k
g)
3Mo
6Mo
Lipi
ds, B
P,B
G, I
nsul
in
Low
dro
p -ou
t rat
e
LCD
/HP
D/H
FD
-7.6
±0.7
-8.5
±1.0
HC
D/L
FD
-4.2
±0.8
-3.9
±1.0
Mea
n±SD
P<0
.01
P<0
.01
ns
Yanc
y et
al 2
004
[173
]
RC
T
120
over
wei
ght
LCK
D (C
HO
<20
g/d)
(Atk
ins,
ad
libitu
m)
LFD
(F <
30%
TE, <
300m
g ch
oles
tero
l)
Ener
gy re
stric
ted:
- 500
-100
0 K
cal/d
24 w
eeks
(Hig
h dr
op- o
ut ra
te)
BW (%
)
FM (k
g)
TAG
(mm
ol/l)
HD
L(m
mol
/l)
LDL(
mm
ol/l)
LCD
-12.
9
-9.4
-0.8
4
+0.1
4
+0.0
4
HC
D/L
FD
-6.7
-4.8
-0.3
1
- 0.0
4
-0.1
9
P<0
.01
ns
P<0
.01
P<0
.01
P=0
.2

209 Ta
ble
of s
tudi
es re
porti
ng a
pos
itive
effe
ct o
f HP
D o
n w
eigh
t los
s an
d bo
dy c
ompo
sitio
n (c
ontin
ued)
.
Auth
or
Type
of d
iet
Mea
sure
men
ts
Hig
her p
rote
in
Hig
her C
HO
P
McA
uley
et a
l 200
5 [1
94]
RC
T 93
Insu
lin re
sist
ant
wom
en
(76
follo
w u
p)
HC
D (C
HO
55%
TE)
LPD
(CH
O 2
0g
50g)
H
PD (P
30%
TE)
8 W
L 8
WB
36 F
ollo
w-u
p
Cha
nge
6 to
12
Mo
BW
(%)
BM
I (kg
/m2)
W
Cir
(cm
) FM
(kg)
FF
M (k
g)
T-ch
ol (m
mol
/l)
TAG
(mm
ol/l)
H
DL(
mm
ol/l)
LD
L(m
mol
/l)
Insu
lin (p
mol
/l)
FBG
(mm
ol/l)
2g
Glu
cose
(mm
ol/L
)
HPD
1.
5 a
0.6
a
1.
3
0.9a
0.
6a
0.06
-0
.07
0.04
0.
06
5.47
-0
.04
-0.0
1
HC
D
H
FD
1.1
2.9a
,b
0.4
1.1a
,b
3.0a
4
.4a,
b,c
0.5
2.3a
,b,c
0.
8a
0.8
a 0.
21
0.1
3 0.
09
0.2
8a
0.02
-0
.02
0.14
0
.02
5.73
6
.81
0.20
a
0
.14
0.09
0
.70a
a di
ffere
nce
from
ba
selin
e P
<0.0
5 b
diffe
renc
e be
twee
n H
CD
&H
FD
P<0
.05
c di
ffere
nce
betw
een
HPD
& H
FD
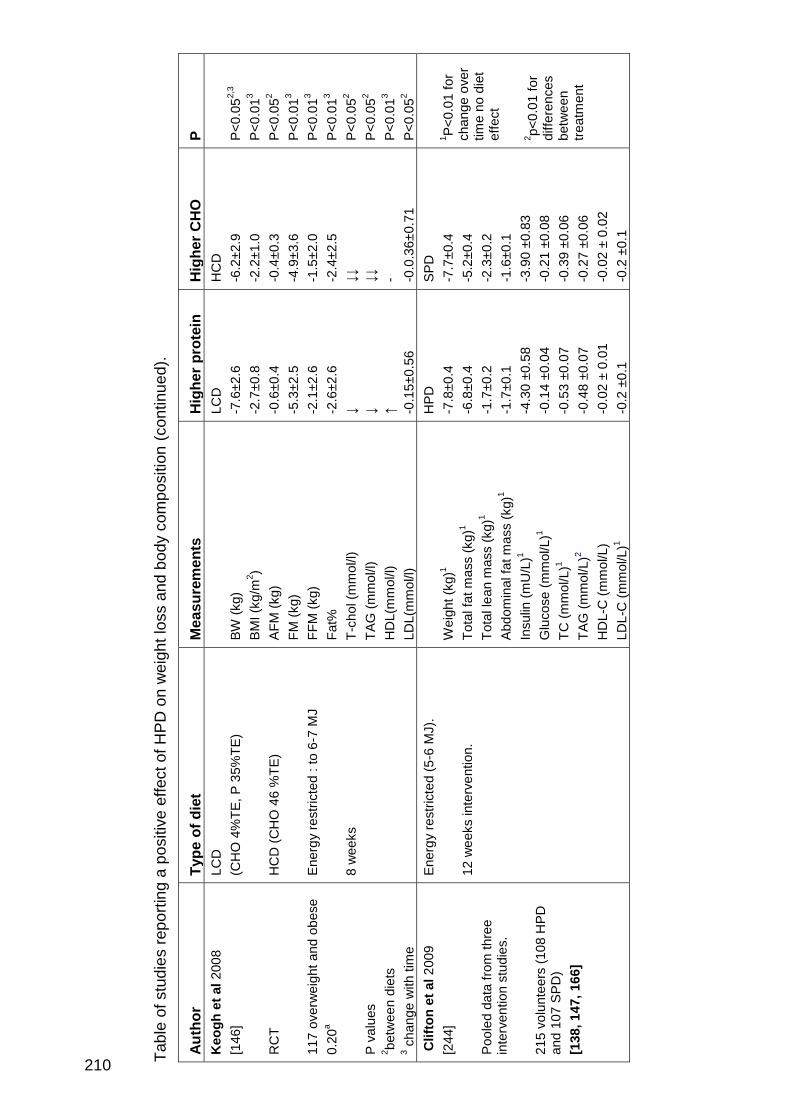
210 Tabl
e of
stu
dies
repo
rting
a p
ositi
ve e
ffect
of H
PD
on
wei
ght l
oss
and
body
com
posi
tion
(con
tinue
d).
Auth
or
Type
of d
iet
Mea
sure
men
ts
Hig
her p
rote
in
Hig
her C
HO
P
Keo
gh e
t al 2
008
[146
] R
CT
117
over
wei
ght a
nd o
bese
0.
20a
P va
lues
2 be
twee
n di
ets
3 cha
nge
with
tim
e
LCD
(C
HO
4%
TE, P
35%
TE)
HC
D (C
HO
46
%TE
) E
nerg
y re
stric
ted
: to
6-7
MJ
8 w
eeks
BW (k
g)
BM
I (kg
/m2 )
AFM
(kg)
FM
(kg)
FF
M (k
g)
Fat%
T-
chol
(mm
ol/l)
TA
G (m
mol
/l)
HD
L(m
mol
/l)
LDL(
mm
ol/l)
LCD
-7
.6±2
.6
-2.7
±0.8
-0
.6±0
.4
-5.3
±2.5
-2
.1±2
.6
-2.6
±2.6
↓ ↓ ↑ -0
.15±
0.56
HC
D
-6.2
±2.9
-2.2
±1.0
-0
.4±0
.3
-4.9
±3.6
-1
.5±2
.0
-2.4
±2.5
↓↓
↓↓
- -0
.0.3
6±0.
71
P<0
.052,
3
P<0
.013
P<0
.052
P<0
.013
P<0
.013
P<0
.013
P<0
.052
P<0
.052
P<0
.013
P<0
.052
Clif
ton
et a
l 200
9
[244
] P
oole
d da
ta fr
om th
ree
inte
rven
tion
stud
ies.
21
5 vo
lunt
eers
(108
HPD
an
d 10
7 S
PD)
[138
, 147
, 166
]
Ener
gy re
stric
ted
(5-6
MJ)
. 12
wee
ks in
terv
entio
n.
Wei
ght (
kg)1
Tota
l fat
mas
s (k
g)1
Tota
l lea
n m
ass
(kg)
1
Abd
omin
al fa
t mas
s (k
g)1
Insu
lin (m
U/L
)1
Glu
cose
(mm
ol/L
)1
TC (m
mol
/L)1
TAG
(mm
ol/L
)2 H
DL-
C (m
mol
/L)
LDL-
C (m
mol
/L)1
HPD
-7
.8±0
.4
-6.8
±0.4
-1
.7±0
.2
-1.7
±0.1
-4
.30
±0.5
8 -0
.14
±0.0
4 -0
.53
±0.0
7 -0
.48
±0.0
7 -0
.02
± 0.
01
-0.2
±0.
1
SPD
-7
.7±0
.4
-5.2
±0.4
-2
.3±0
.2
-1.6
±0.1
-3
.90
±0.8
3 -0
.21
±0.0
8 -0
.39
±0.0
6 -0
.27
±0.0
6 -0
.02
± 0.
02
-0.2
±0.
1
1 P<0
.01
for
chan
ge o
ver
time
no d
iet
effe
ct
2 p<0.
01 fo
r di
ffere
nces
be
twee
n tre
atm
ent

211 Ta
ble
of s
tudi
es re
porti
ng a
pos
itive
effe
ct o
f HP
D o
n w
eigh
t los
s an
d bo
dy c
ompo
sitio
n (c
ontin
ued)
.
Auth
or
Type
of d
iet
Mea
sure
men
ts
Hig
her p
rote
in
Hig
her C
HO
P
Park
er e
t al 2
002
[139
] 66
T2D
M
MC
D/H
PD
(P
28%
TE)
LPD
(p
=16%
TE)
6.5
MJ
8 W
L 4
WB
BW (k
g)
Men
W
omen
FM
(kg)
M
en
Wom
en
AFM
(kg)
M
en
Wom
en
Lipi
ds, B
P, F
BG
, Ins
ulin
MC
D/H
PD
-4
.7
-6.0
-3
.8
-5.3
-1
.4
-1.3
LPD
-5
.8
-4.2
-5
.1
-2.8
-1
.7
-0.7
Mea
n (S
EM
) P
=0.0
4 P
=0.0
1 P
=0.0
2 ns
Sh
ai e
t al 2
008
[177
] 32
2 ob
ese
(36
T2D
M)
Low
CH
O
(20
g C
HO
gra
dual
ly in
crea
sing
to
120
g, a
d lib
itum
ene
rgy)
Lo
w fa
t (co
ntro
l) (3
0%TE
fat,
<10%
TE S
AFA
, ene
rgy
rest
ricte
d 6.
7 M
J)
24 M
o
BW (k
g)
ME
AN
(SE
M) (
mg/
dl)
LDL
(mg/
dl)
HD
L(m
g/dl
)
LCH
O
-4.7
±6.5
-2
3.7
+8.4
Con
trol
-2.9
±4.2
-0
-3
+6.3
P<0
.01
P
=0.0
3 ns
P
<0.0
1

212 Tabl
e of
stu
dies
repo
rting
a p
ositi
ve e
ffect
of H
PD
on
wei
ght l
oss
and
body
com
posi
tion
(con
tinue
d).
Auth
or
Type
of d
iet
Mea
sure
men
ts
Hig
her p
rote
in
Hig
her C
HO
P
Abe
te e
t al 2
009
[141
] N
o da
ta o
n st
ratif
icat
ion
19 o
bese
men
* s
tatis
tical
ly d
iffer
ent
from
bas
elin
e
MC
D/H
PD
(P
30%
E)
RC
D/L
FD
(F ≤
30%
TE)
Ener
gy in
take
– 3
0%
8 w
eeks
BM
I (kg
/m2)
FM
(kg)
* W
Cir
(cm
) BP
(mm
Hg)
T-
chol
, TG
, LD
L (m
g/dl
) H
DL(
mg/
dl)*
G
luco
se(m
g/dl
) In
sulin
(µIU
/ml)*
R
EE
(Kca
l/d)*
LCD
/HP
D
-9.3
±1.6
-1
8.4±
3.4
-9.8
±2.4
-3
7.3±
24.7
HC
D/L
FD
-4.9
±3.0
-1
2.7±
7.2
-6.1
±2.9
-1
1.3±
70.5
Mea
n±SD
P
=0.0
01
P=0
.08
P=0
.03
ns
ns
ns
ns
p=0.
05
ns
LCK
D=L
ow c
arbo
hydr
ate
keto
geni
c di
et, T
-cho
l=to
tal c
hole
ster
ol, T
AG
=tria
cylg
lyce
rol,
LFD
=Low
fat d
iet,
HD
L=hi
gh d
ensi
ty li
popr
otei
n
chol
este
rol,
LCD
=Low
car
bohy
drat
e di
et, H
PD=
high
pro
tein
die
t, H
FD=h
igh
fat d
iet,
HC
D=h
igh
carb
ohyd
rate
die
t, R
CD
=red
uced
cal
orie
die
t,
BP
=blo
od p
ress
ure,
BG
=blo
od g
luco
se, T
2DM
=typ
e 2
diab
etes
mel
litus
, Met
S=M
etab
olic
syn
drom
e, F
BG
=fas
ting
bloo
d gl
ucos
e, E
E=e
nerg
y
expe
nditu
re, B
MI=
body
mas
s in
dex,
WC
ir=w
aist
circ
umfe
renc
e, R
EE=r
estin
g en
ergy
exp
endi
ture
, MC
D=m
oder
ate
carb
ohyd
rate
die
t,
WL=
wei
ght l
oss,
WB=
wei
ght b
alan
ce,
AFM
=abd
omin
al fa
t mas
s, W
/H=w
aist
hip
ratio
, P=p
rote
in, F
=fat
, CH
O=c
arbo
hydr
ate

213
Appendix 2: Diet allocation template
DAILY FOOD SELECTION GUIDE
(Food’s that you will need to eat each day 6000kJ High protein diet)
Cereal: 40g High-fibre cereal
eg All Bran, Weet-bix
Bread: 2 slices wholegrain bread
eg Vogel’s, Bürgen
Dairy: 3 serves
1 serve = 250ml skim milk,
or 200g diet yoghurt (eg Yoplait No Fat & Nestle Diet yoghurt),
or 25g full-fat cheese (eg Mainland Tasty or Bega tasty),
or 50g reduced fat cheese (eg Bega so light & tasty or Kraft light)
Fruit: 2 serves
1 serve = 150g fresh or tinned, unsweetened fruit,
or 150 ml unsweetened fruit juice,
or 30g dried fruit.
Protein foods: Lunch: 50 g. cooked meat, poultry or fish.
eg Ham, tuna, chicken, turkey
Dinner: 200 g. lean meat, poultry or fish (raw weight)
Red meat 4 times per week (eg Beef, lamb & veal)
White meat 1 time per week (eg pork & poultry)
Fish 2 times per week.
Vegetables: 2½ cups - see free list (not including potato/sweet potato)
½ cup salad greens
and
2 cups mixed vegetables
Fats & oils: 15g (3 tsp) poly- or mono-unsaturated oil or spread
eg olive, canola, sunflower

214
DAILY FOOD SELECTION GUIDE
(foods that you will need to eat each day 6000kJ Standard protein diet)
Cereal: 40g High-fibre cereal
eg All Bran, Weet-bix
Bread: 3 slices wholegrain bread
eg Vogel’s, Bürgen
1 serve high-fibre crispbread
eg 1 Ryvita multigrain or 2 Cruskits rye or 2 Vita-wheats 9-grain.
Dairy: 250ml skim milk or 200g diet yoghurt
eg Yoplait No Fat & Nestle Diet yoghurt
and
25g full-fat cheese
eg Mainland Tasty or Bega Tasty
Fruit: 2 serves
1 serve = 150g fresh or tinned, unsweetened fruit,
or 150 ml unsweetened fruit juice,
or 30g dried fruit.
Protein foods: 100g lean (raw) meat, poultry, fish 6 times a week
100g legumes once a week, eg chickpeas, 4-bean mix
Carbohydrate foods: 200g potato/sweet potato or
50g rice/pasta (raw weight)
Vegetables: 2½ cups - see free list (not including potato/sweet potato)
½ cup salad greens and
2 cups mixed vegetables
Fats & oils: 25g (5 tsp) poly- or mono-unsaturated oil or spread
eg olive, canola, sunflower

215 A
ppen
dix
3: E
xam
ples
of c
heck
lists
Exam
ple
of a c
om
ple
ted c
hecklis
t fo
r 7
da
ys S
PD
Exam
ple
of a c
om
ple
ted c
hecklis
t fo
r 7
da
ys H
PD

216
FOO
D C
HE
CK
LIS
T H
PD
60
00kJ
WE
EK
:
DA
TE:
Hig
h fib
re C
ere
al (
40g)
B
read
, who
legr
ain
(2 s
lices
)
Dai
ry 1
eg
250m
l ski
m m
ilk, 2
5g fu
ll-fa
t che
ese
, 200
g lo
w fa
t yog
hurt
Dai
ry 2
Dai
ry 3
Frui
t 1 (
150g
)Fr
uit 2
(15
0g)
Sal
ad v
eg (1
/ 2 cu
p)Lu
nch
prot
ein
(50
g)eg
. tun
a, h
am, p
oul
try
Lean
pro
tein
(20
0g r
aw w
eigh
t)
eg. m
eat,
poul
try, f
ish
Veg
1 (½
cup
) (7
5g)
Veg
2 (½
cup
) (7
5g)
Veg
3 (
½ c
up)
(75
g)Ve
g 4
(½ c
up)
(75g
)O
il/m
arga
rine,
3 ts
p (1
5g)
Alco
hol (
2 S
TD d
rink
s/w
k) O
PTI
ON
ALO
THE
R –
list
DAY
1DA
Y 2
DAY
3DA
Y 4
DAY
5DA
Y 6
FO
OD
CH
EC
KL
IST
S
PD
6
000
kJW
EE
K:
DA
TE
:H
igh
fibre
Cer
eal
(40
g)
Bre
ad, w
hole
grai
n (3
slic
es)
C
risp
bre
ad (
1 cr
isp
bre
ad)
Milk
, ski
m (
250m
l)C
hee
se, c
hedd
ar (
25g
full
fat)
Fru
it 1
(15
0g)
Fru
it 2
(15
0g)
Sal
ad v
eg (1
/2 c
up)
Le
an m
eat
, pou
ltry,
fis
h (1
00g
raw
wei
ght
) 6
tim
es a
wee
k L
egu
me
s (1
00g
cook
ed) o
nc
e a
wee
k X
X X
X
X
Car
bohy
dra
te fo
od
(50
g ra
w r
ice/
pas
ta O
R 2
00g
coo
ked
po
tato
/sw
eet
pot
ato)
Ve
g 1
(½ c
up)
(75
g)V
eg
2 (½
cup
) (7
5g)
Ve
g 3
(½ c
up)
(7
5g)
Ve
g 4
(½ c
up)
(75
g)O
il/m
arga
rine
, 5 ts
p (2
5g)
Alc
oho
l (2
ST
D d
rinks
/wk)
OP
TIO
NA
L
X
DAY
1DA
Y 2
DAY
3D
AY
4D
AY
5D
AY
6
Ex
ampl
e of
SP
D c
hec
klis
t
Ex
ampl
e o
f H
PD
ch
eckl
ist

217
Appendix 4: Three day diet diary
Example of the information and diary page for the three day diet diary, used in the
CGMS sub study.
Record food and liquid
Record all the food and liquid you consume during the monitoring period using the SWAT method.
• S - BE SPECIFIC – eg note type of bread, type of cheese, type of oil, brand of cereal, meat fatty or lean etc
• W- WEIGH FOODS – use scales for best accuracy. You can use metric cups, spoons for some items like fluids or sugar, oil.
• A - ALL FOODS EATEN – record as you go, not forgetting snacks, fluids, alcoholic drinks. Have a note pad with you to record on the go.
• T - TYPICAL – do not change your eating pattern or eat less just because you are recording!
• **Please start a new food/drink item on a new line and use a new page for each day.
Time Food consumed Brand name Weight/volume cooking
Diet diary Date:__________

218
Appendix 5: Position of the volunteers on the DXA bed
All volunteers were obese with a mean BMI of 35 kg/m2. There are two problems
to consider when an obese person is placed on the table:
1) The arms can fall outside the scan area due to extended abdominal area and/or
2) Because the arms have to be strapped tightly to the body to fit the scan area,
overlap of body areas is possible making distinction between the arms and the
trunk difficult [290].
In this study a number of participants seemed to gain lean body mass even with a
total weight loss after 12 months. Because the participants had to be strapped in
to keep the body still during the scan, it cannot be excluded that an overlap of lean
mass from the arms or the legs contributed to the problem.
Scan 1. Baseline Scan 2. 12 months
An example of a DXA scan with inconsistent weight loss to change in LBM
measure. This male participant lost a total of 2.4 kg over the 12 months but was
analyzed as having a gain in LBM of 2.59 kg. As can be seen in the two pictures,
the midriff area is slightly different due to the different colour density in the bone
scan representing the rib cage and the legs are not tied together as tight in the
second scan thereby avoiding the thigh overlap seen in scan 1. Additionally the
arms were outside the scan area on scan 1 but inside the area on scan 2.